Preprint
Article

Preparation of Biochar Composite Microspheres and Their Removal Ability for Oil Agents in Dyeing Wastewater

Altmetrics

Downloads

102

Views

30

Comments

0

A peer-reviewed article of this preprint also exists.

Submitted:

15 August 2023

Posted:

16 August 2023

You are already at the latest version

Alerts
Abstract
Oil agents produced from degreasing treatment of synthetic fibers are typical pollutants in printing and dyeing wastewater, which may cause large-scale environmental pollution without proper treatment. How to purify oily dye wastewater with low cost is a key problem at present. In this study, the biochar microspheres with oil removal ability were prepared deriving from waste bamboo chips using hydrothermal method. The structure of biochar microsphere was regulated by the activation and modification processes. The biochar microspheres were characterized and their adsorption behaviors for oily dye wastewater were explored. The results showed that the adsorption efficiency of biochar microspheres for oily dye wastewater (DTY) was improved significantly after the secondary pyrolysis and lauric acid grafting reaction. The maximum COD removal quantity of biochar microspheres for DTY was 889 mg/g with removal rate of 86.06% in 30 min. Besides, the kinetics showed that the chemisorption was the main adsorption manner. The application of biochar microspheres can decrease the costs of oily wastewater treatment and avoid environmental pollution.
Keywords: 
Subject: Chemistry and Materials Science  -   Organic Chemistry

1. Introduction

With the continuous development of social economy and industry, freshwater resources are becoming increasingly scarce with extremely low per capita water availability, uneven spatial distribution and serious water pollution, which have become the main factors restricting the sustainable development [1,2]. With the increasing awareness of environmental protection, the national requirements for the discharge of wastewater from textile printing and dyeing industry are also getting higher. How to efficiently and cost-effectively treat printing and dyeing wastewater is a difficult problem faced by current textile printing and dyeing enterprises, among which oil dispersants are one of the typical pollutants in printing and dyeing wastewater [3]. The highest allowable discharge concentration of oily wastewater in China is only 1mg/L, and due to its complex composition, difficulty in demulsification, and easy introduction of new pollutants by demulsifies, it is difficult and costly to treat [4]. Biochar materials, due to their large surface area, high porosity, rich surface functional groups, and strong adsorption and removal ability for organic pollutants, have been widely used in the field of wastewater treatment [5]. In addition, biochar materials have a wide range of raw material sources and low cost, and their application in the treatment of printing and dyeing wastewater can effectively reduce the cost of wastewater treatment and realize the resource utilization of biomass [6].
Synthetic fibers are hydrophobic polymer materials that must use oil dispersants as smoothing agents, antistatic agents, emulsifiers, etc. in spinning and textile processing [7]. Before the dyeing processes, the oil dispersant needs to be removed in order to carry out normal dyeing, which results in a large amount of oil dispersant in printing and dyeing wastewater. Because the oil dispersants in synthetic fibers are rarely composed of a single chemical structure material, but rather require various substrates (surfactants, mineral oils, advanced alcohols, fatty acid esters, etc.) to be combined according to their respective characteristics and purposes, resulting in high COD value, strong biological toxicity, difficulty in demulsification, difficulty and cost of treatment, and easily causing large-scale environmental pollution [8]. However, the common degreasing methods were hard to break emulsion with the addition of surfactants. The high cost and low efficiency were the main problems during the oily wastewater treatment process [9,10]. Therefore, how to prepare a cheap oil removal adsorbent is a meaningful thing.
Herein, the biochar microspheres deriving from waste bamboo were prepared using hydrothermal method. After activation and modification, the magnetic lipophilic biochar microspheres (Fe3O4@L-ABM500) with high degree of graphitization were obtained. The (Fe3O4@L-ABM500) displayed excellent removal ability for DTY oil in dyeing and finishing wastewater. The high removal efficiency and low preparing cost of biochar microspheres may promote the large-scale utilization of waste biomass, and decrease the treatment cost of oily wastewater.

2. Experiments

2.1. Materials and Chemicals

Phloroglucinol (C6H6O3, AR grade), Iron sulfate heptahydrate (FeSO4•7H2O, AR grade) and Ferric chloride hexahydrate (FeCl3•6H2O, AR grade) were purchased from National Drug Group Chemical Reagent Co., Ltd. (Shanghai, China). Lauric acid (C12H24O2, AR grade) was purchased from Tianjin Kemiou Chemical Reagent Co., Ltd. (Tianjin, China). Ammonium hydroxide (NH3•H2O, 28%) was purchased from Macklin Biochemical Co., Ltd. (Shanghai, China). Polyester oil (DTY, Commercial grade) was purchased from Huiya Environmental Protection Technology Co., Ltd. (Hangzhou, China).
Simulated oily dyeing wastewater: 0.1 mL oil agent, 0.05 g disperse red dye and 0.05 g sodium dodecyl sulfate were added into 100 mL deionized water, and then stirred for 30 min. The simulated oily printing and dyeing wastewater with COD concentration of 3150 mg/L used in this study was obtained.

2.2. Preparation of Biochar Composite Microspheres

Firstly, 3.2g bamboo flakes and 0.8g phloroglucinol were added into 120 mL distilled water and stirred at 60℃ for 2 h. Then, the mixture was put into a hydrothermal reactor and pyrolyzed at 200℃ for 24 h with heating rate of 1.5 ℃/min in the muffle furnace. The mixture was ultrasonic treated for 30 min at 500 W to remove carbonized bamboo pieces and large particle aggregates through a 240-mesh screen. After centrifugation at 4000 r/min for 10 min, the biochar microsphere (BM) was obtained.
0.2g biochar microsphere (BM) was added into the KOH solution with mass fraction of 10%, and stirred for 10 min at 500 rpm. After dried at 60℃, the BM was pyrolyzed at different temperatures (300℃, 500℃ and 700℃) in the tube furnace with N2 atmosphere for two hours, respectively. The activated biochar microspheres (ABM300, ABM500, ABM700) were obtained after washing with distilled water for three times. Then, the prepared ABM300, ABM500 and ABM700 (0.2 g) were mixed with lauric acid (0.1 g), and pyrolyzed with above conditions. The hydrophobic modified biochars (L-ABM300, L-ABM500, L-ABM700) were obtained.
Finally, 0.2 g L-ABM300, L-ABM500 and L-ABM700 were dispersed into 80 mL iron ion solution (50℃) with 0.24 g FeSO4•7H2O and 0.19 g FeCl3•6H2O, respectively. The pH of the iron ion solution was adjusted to 8.5 with ammonium hydroxide, and cured for 5min. The magnetic biochar microspheres (Fe3O4@L-ABM300, Fe3O4@L-ABM500, Fe3O4@L-ABM700) were prepared after washing with distilled water for 3 times.

2.3. Adsorption Tests

0.03 g of Fe3O4@L-ABM300, Fe3O4@L-ABM500, Fe3O4@L-ABM700 were added into the simulated oily dyeing wastewater (10 mL), and stirred for 30 min, respectively. Then, the mixture was centrifuged at 4000 rpm for 10 min to remove the biochar microsphere. The COD concentration of residual solution was tested, and the removal rate and adsorption quantity were calculated.
Then, 0.01 g, 0.02 g, 0.03 g, 0.04 g and 0.05 g of Fe3O4@L-ABM500 were added into 10 mL oily dyeing wastewater, and stirred for 30 min. Based on above results, the effects of different times (10 min, 20 min, 30 min, 40 min and 50 min) and initial pH values (5-9.5) on the adsorption capability of biochar microspheres under the same condition were also investigated. The COD concentration of residual solution was tested as aforementioned.

2.4. Adsorption Kinetics

The adsorption kinetics were fitted by the Pseudo-first-order and Pseudo-second-order models as follow [11,12]:
Pseudo - first - order   model :   ln Q e Q t = l n Q e K 1 t
Pseudo - sec ond - order   model :   t Q t = 1 K 2 Q e 2 + t Q e
In Eq. (1-2), Qt (mg/g) is the adsorbance at t (min), Qe (mg/g) is the saturated adsorption quantity, K1 (min-1) and K2 (min-1) are the equation constants, respectively. The t (min) is the adsorption time.

2.5. Analytical Methods

Scanning electron microscopies (SEM) of biochar microspheres were performed using the SEM (SU8010, Hitachi, Japan). Fourier transform infrared (FTIR) spectra were characterized by a FTIR apparatus (Nicolet iS50, Thermo, USA). XPS was performed on a photoelectron spectrometer (ESCALAB 250XI, Thermo, USA) with a monochromated Al- Kα source at a residual gas pressure of less than 10−8 Pa. All the binding energies were referenced to the C 1 s peak at 284.6 eV of the surface adventitious carbon. The X-Ray Diffractions (XRD) of the bio-char materials were conducted by an x-ray diffractometer (D8, Brook AXS Co., Ltd., Germany) in range of 15o-80o at the rate of 0.1o/min). The residual COD concentration was measured using potassium dichromate method (Hach, USA). All of the other parameters were measured following standard methods [13,14].

3. Results and Discussion

3.1. Characterizations

The morphologies of BM, ABM500 and Fe3O4@L-ABM500 were characterized by SEM images (Figure 1).
As shown in Figure 1 (a), the spherical biochar (BM) with the size of 0.5-2 μm was successfully prepared by hydrothermal carbonization method from bamboo slices, which had smooth surface. The biochar microsphere (ABM500) activated by KOH was shown in Figure 1 (b). It can be seen that a large number of structural defects are generated on the surface of biochar microsphere. The structural defects will increase the specific surface area of the microsphere, and improve its contact area for oil agent [15,16]. The high surface area can promote the grafting reaction with lauric acid, and improve its adsorption capacity. The SEM image of Fe3O4@L-ABM500 was displayed in Figure 1 (c). More defects occurred and many nanoparticles were loaded on the microspheres. The nanoparticles around microspheres can be attributed to the Fe3O4 components.
Raman analyses for Fe3O4@L-ABM300, Fe3O4@L-ABM500 and Fe3O4@L-ABM700 were conducted to explore the influences of pyrolysis temperature on the biochar microspheres (Figure 2). In Figure 2, all of the Fe3O4@L-ABM300, Fe3O4@L-ABM500 and Fe3O4@L-ABM700 showed characteristic peaks at around 1350 cm-1 and 1580 cm-1, corresponding to the D band and G band, respectively. Herein, the D band represent the disordered graphite carbons, and the G band reflect the sp2 hybrid carbon-carbon bond resonance of graphite crystalline. The higher intensity ratio of characteristic peaks (ID/IG) indicate the more crystal defects and disordered carbon components in the carbon material. In Figure 2 (a-c), the ID/IG values of Fe3O4@L-ABM300, Fe3O4@L-ABM500 and Fe3O4@L-ABM700 were 1.31, 0.88 and 0.85, respectively. The significant decrease of ID/IG values indicated that the higher pyrolysis temperature improved the graphitization degree of biochar microspheres. The higher degree of graphitization, the biochar microspheres may have stronger affinity for oil agent [17,18].
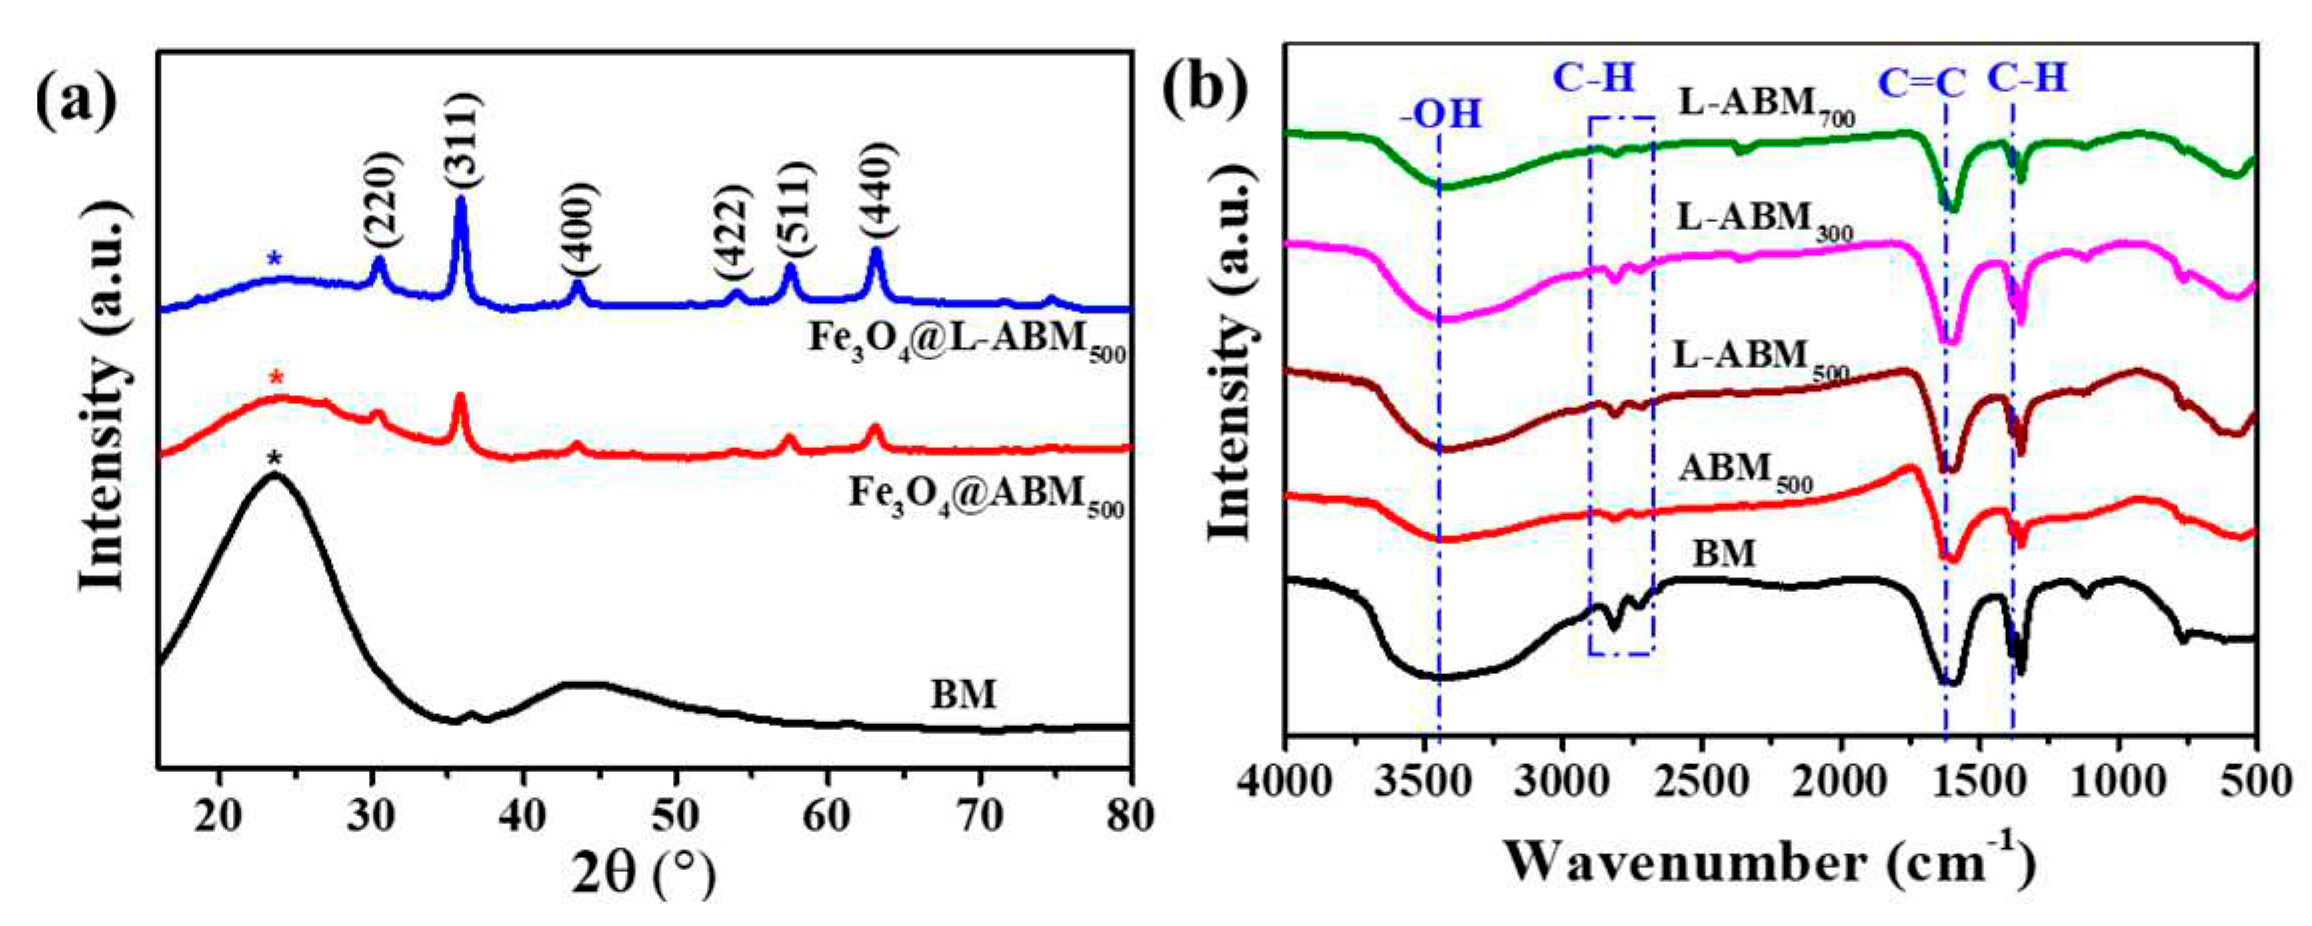
To explore the crystal structures and functional groups of biochar microspheres prepared at different conditions, the X-ray diffractions and FTIR spectra analyses were conducted in Figure 3. In Figure 3 (a), all of the BM, Fe3O4@ABM500 and Fe3O4@L-ABM500 displayed obvious gentle peaks at 23.1°, which can be ascribed to the amorphous carbon in biochar microspheres. After the pyrolysis at 500℃, the peak intensity (23.1°) of Fe3O4@ABM500 and Fe3O4@L-ABM500 were weaker than that of BM, indicating that the pyrolysis process improved the graphitization degree of biochar. The result was consistent with above Raman analysis. Compared with BM, the Fe3O4@ABM500 and Fe3O4@L-ABM500 appeared new characteristic peaks at 30.1°, 35.5°, 43.1°,53.4°,57.0° and 62.6°, which can be attributed to the (220), (311), (400), (422), (511) and (440) planes of Fe3O4 (JCPDS No.79-0419), respectively [19]. These indicated that the Fe3O4 was successfully loaded on the activated biochar microspheres. The biochar composite materials with Fe3O4 in-situ loaded can be separated rapidly from the clean water in the presence of magnetic field, which may improve the adsorption efficiency.
The FTIR spectra of BM, ABM500, L-ABM300, L-ABM500 and L-ABM700 were listed in Figure 3 (b). The peaks at 3411cm-1 can be ascribed to the stretching vibration (υO-H) of hydroxyl group (O-H), and the two peaks occurred in range of 2900 cm-1-2670 cm-1 correspond to the stretching vibration (υC-H) of methyl group (-CH3). The peaks at 1628 cm-1 and 1383 cm-1 indicated the presence of stretching vibration (υC=C) of C=C and in-plane bending vibration (δC-H) of C-H, respectively [20]. The biochar microspheres showed similar functional groups before and after modification. Because the carboxylic groups and alkane structures involved in lauric acid also exist in the biochar microsphere. However, the intensity of the characteristic peaks was different. Compared with BM, the intensity of υC-H and δC-H in ABM500 decreased significantly, indicating the reduction of -CH3 and -CH2 contents after pyrolysis. These also indicated that the pyrolysis process improved the graphitization degree of biochar microsphere. Besides, the intensity of υC-H and δC-H in L-ABM500 was stronger than that of ABM500, which can be attributed to the introduced alkane structures from lauric acid. These may evidence that the grafting reaction between lauric acid and biochar microsphere was successful.
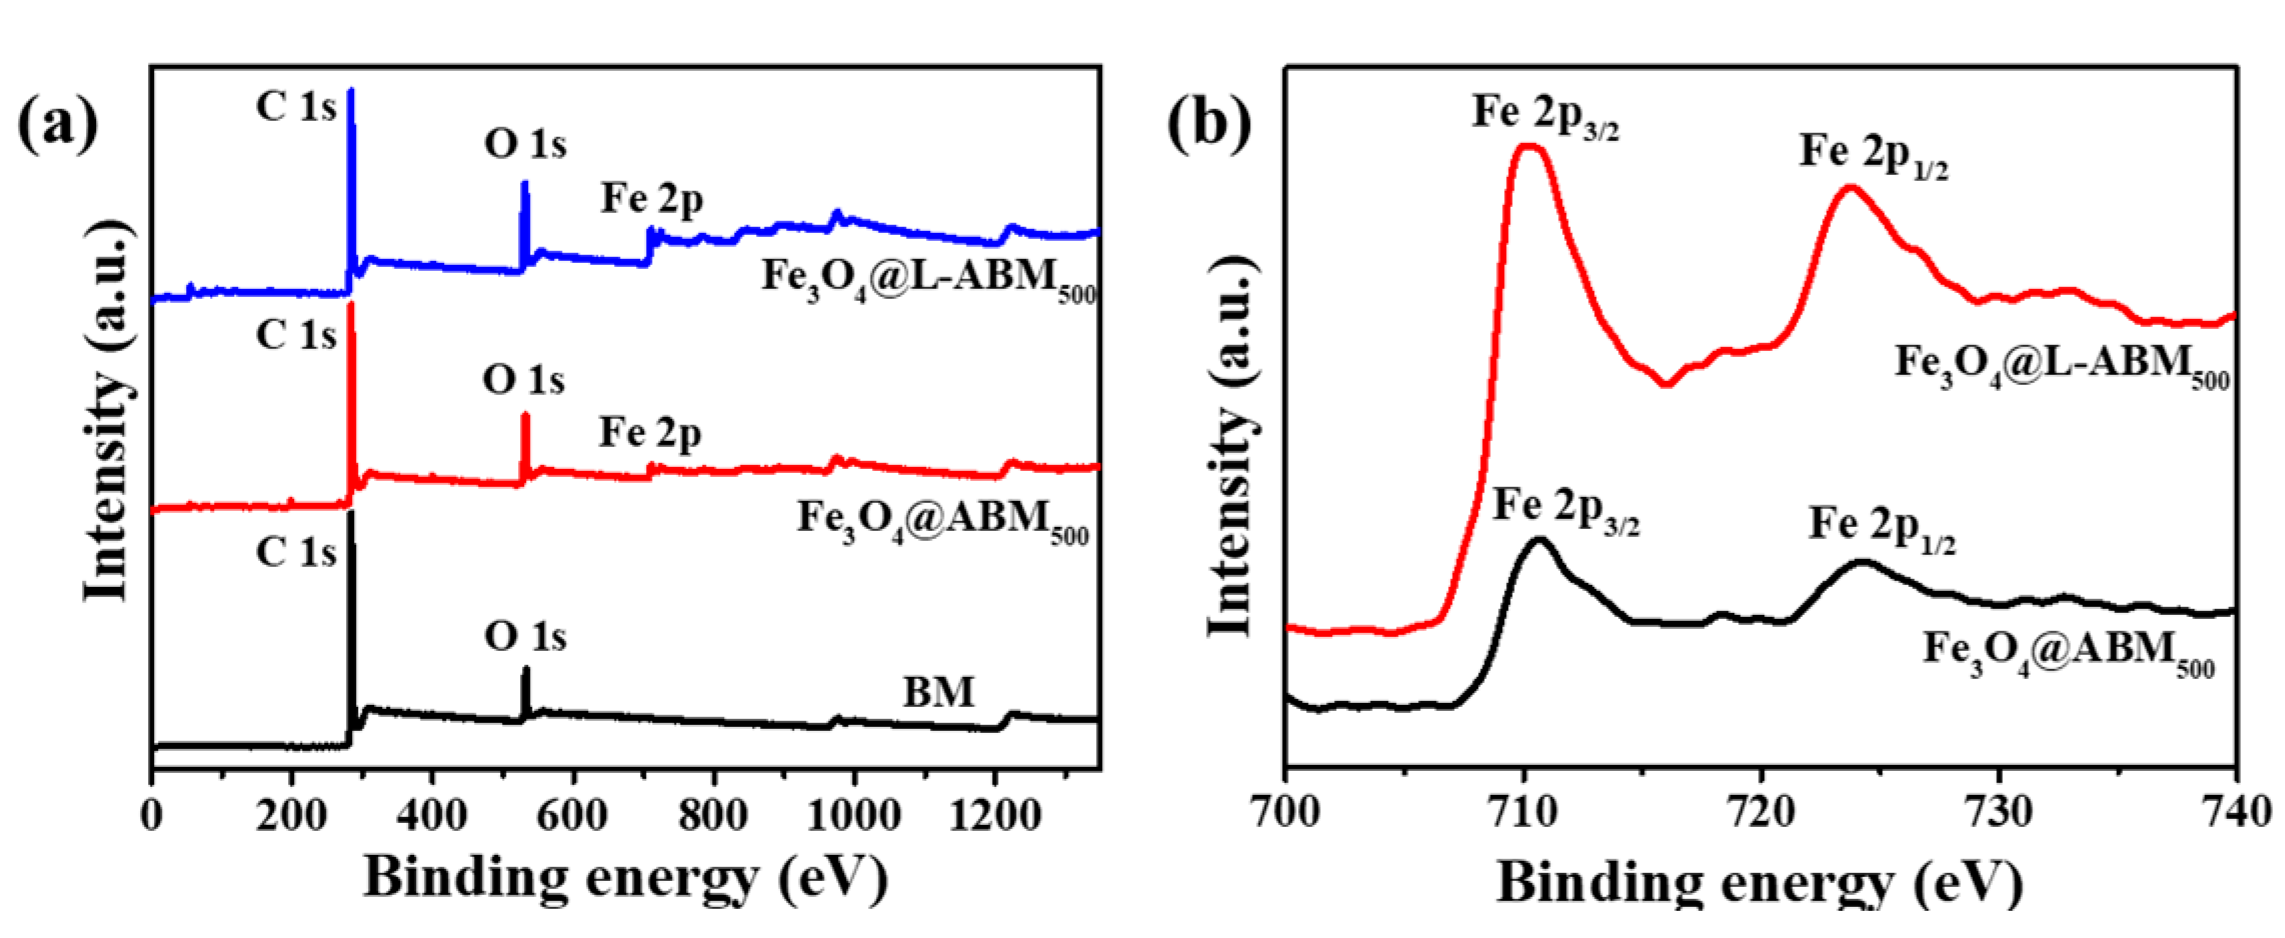
To obtain the chemical composition of as-prepared biochar microspheres, the XPS spectra were performed as Figure 4. In Figure 4 (a), all of the three biochar microspheres (BM, Fe3O4@ABM500 and Fe3O4@L-ABM500) had characteristic peaks at 286.3 eV and 531.9 eV, corresponding to the binding energies of C1s and O1s, respectively [21]. These mean that the biochar microspheres had oxygen-containing functional groups expect the graphite structure. Considering the FTIR spectra analysis (Figure 3 (b)), the oxygen-containing functional groups involve hydroxyl group (O-H), carboxyl group (-COOH) and so on.
Compared with BM, the Fe3O4@ABM500 and Fe3O4@L-ABM500 show a new characteristic peak at about 712.3 eV, which corresponds to the binding energy of Fe 2p in loaded Fe3O4.
Besides, the high-resolution spectra of Fe 2p in Fe3O4@ABM500 and Fe3O4@L-ABM500 were also conducted (Figure 4 (b)). In Figure 4 (b), the characteristic peaks appear at 710.2eV and 723.5eV, corresponding to the binding energies of Fe 2p3/2 and Fe 2p1/2 in Fe3O4, respectively [22]. These indicated that the Fe3O4 has been successfully loaded onto the biochar microspheres. The result was consistent with the XRD analysis results.

3.2. Adsorption Process Analysis

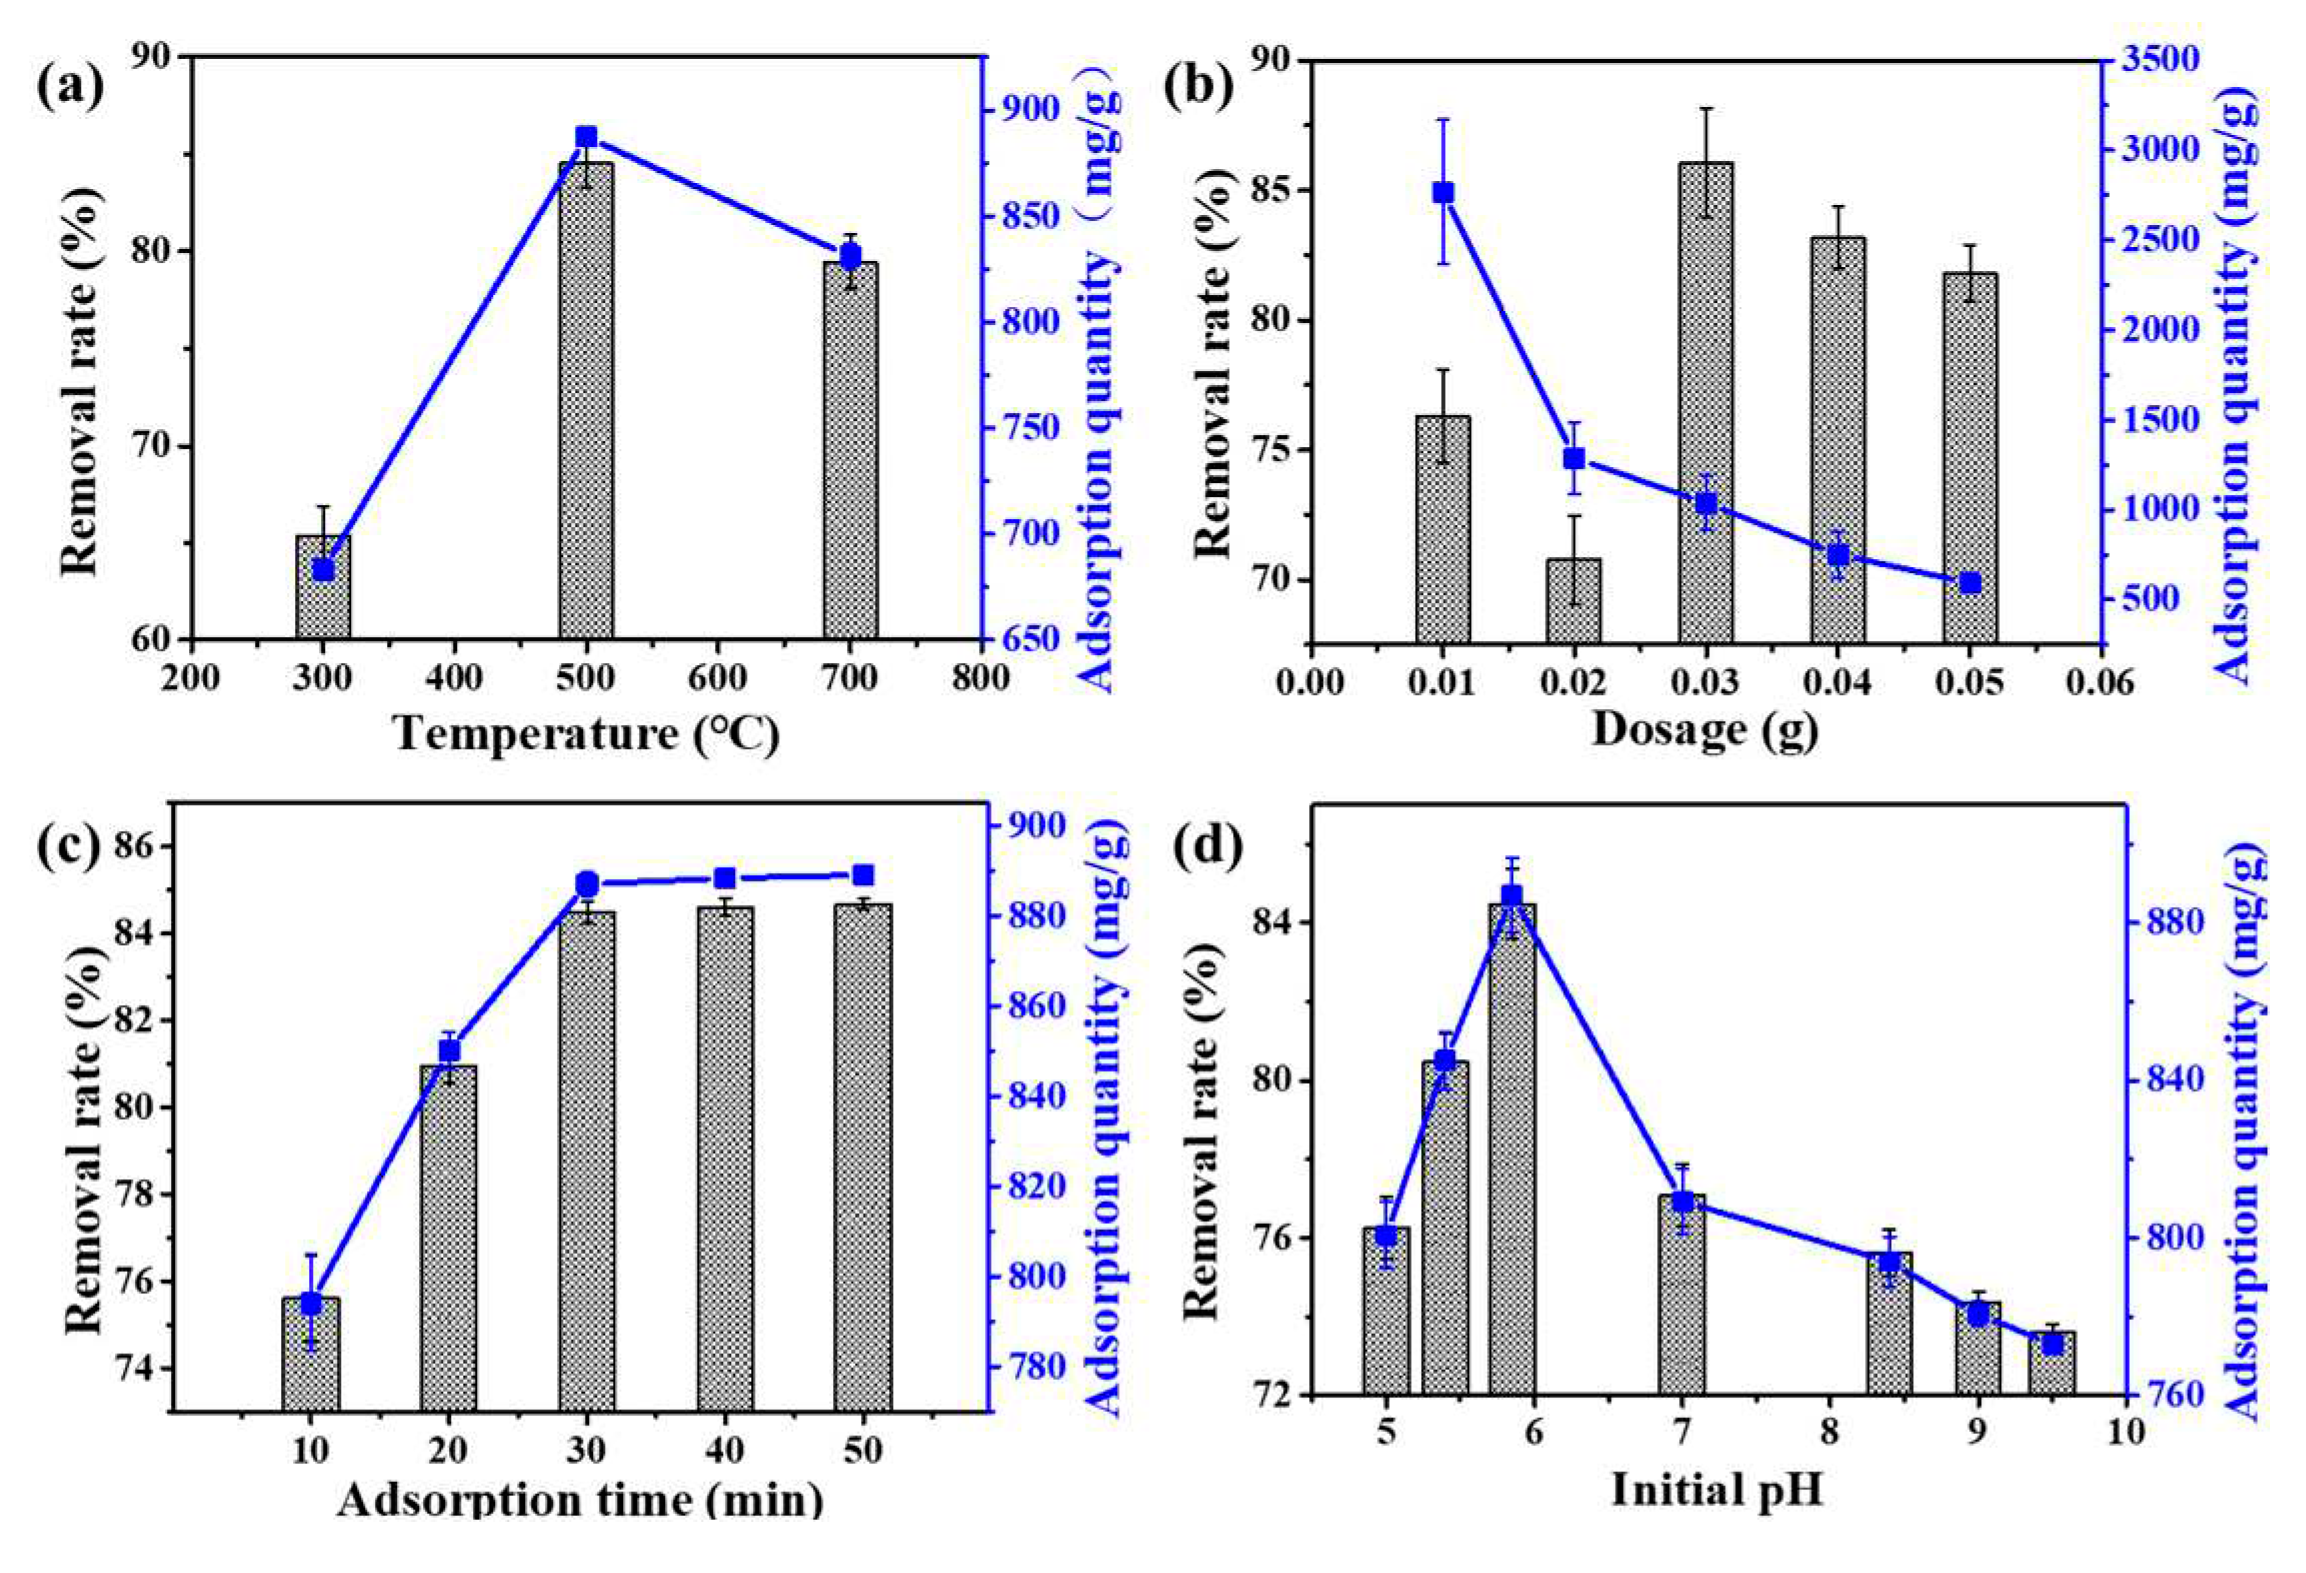
The influences of pyrolysis time, biochar dosage, adsorption time and initial pH on the adsorption processes were shown as Figure 5. In Figure 5 (a), it can be seen that maximal COD removal rate of Fe3O4@L-ABM500 for oily wastewater reached 85.5% with the adsorption quantity of 887.3 mg/g. The Fe3O4@L-ABM500 pyrolyzed at 500℃ had higher COD removal rate than the Fe3O4@L-ABM300 and Fe3O4@L-ABM700 pyrolyzed at 300℃ and 700℃ respectively. This phenomenon can be ascribed to the graphitization degree and functional group content of biochar microspheres. Because the Fe3O4@L-ABM300 was pyrolyzed at a relatively low temperature (300℃). The Fe3O4@L-ABM300 has low graphitization degree, resulting in the poor lipophilicity and weak adsorption ability for oily wastewater. With the increase of pyrolysis temperature, the graphitization degree of biochar microspheres improved, which can contribute to the adsorption ability for oily wastewater. However, the higher pyrolysis temperature, the less functional groups reserved in the biochar microspheres. The high pyrolysis temperature (700℃) of Fe3O4@L-ABM700 adverse to the grafting reaction of lauric acid onto biochar microspheres. Hence, the Fe3O4@L-ABM700 had lower adsorption ability than Fe3O4@L-ABM700.
The adsorption ability of Fe3O4@L-ABM500 for oily wastewater with different dosage was displayed in Figure 5 (b). It can be seen that the COD removal rate increased with the increase of biochar dosage. When the dosage of Fe3O4@L-ABM500 was 0.03 g, the COD removal rate reached 86.06% with the adsorption quantity of 1037.2 mg/g. However, the COD removal rate decreased with the dosage continuous increased from 0.03 g to 0.05 g. This may be ascribed that the ash and unreacted lauric acid on biochar microspheres dissolved into solution, resulting in the increase of COD concentrations.
Besides, the effects of adsorption time and initial pH on the adsorption abilities were also explored in Figure 5 (c-d). In Figure 5 c, the COD removal rate increased with the increase of adsorption time, and reached the adsorption equilibrium (84.6%) gradually at 30 min with the adsorption quantity of 889 mg/g. The results indicated that 30 min is the suitable adsorption time, and the Fe3O4@L-ABM500 had great adsorption efficiency for oily wastewater. In Figure 5d, it can be seen that the initial pH can affect the adsorption ability significantly. When the initial pH was 5.8, the Fe3O4@L-ABM500 showed the highest adsorption capacity for oily wastewater, in which the COD removal rate was 84.5% (887 mg/g). However, the COD removal rate decreased significantly with the increase of pH value. When the pH was 9.5, the COD removal rate decreased to 73%. Because the carboxyl groups (-COOH) were converted into -COO- under alkaline conditions, which can promote its water solubility. Hence, the affinity of Fe3O4@L-ABM500 for oil decreased.

3.3. Adsorption Kinetics

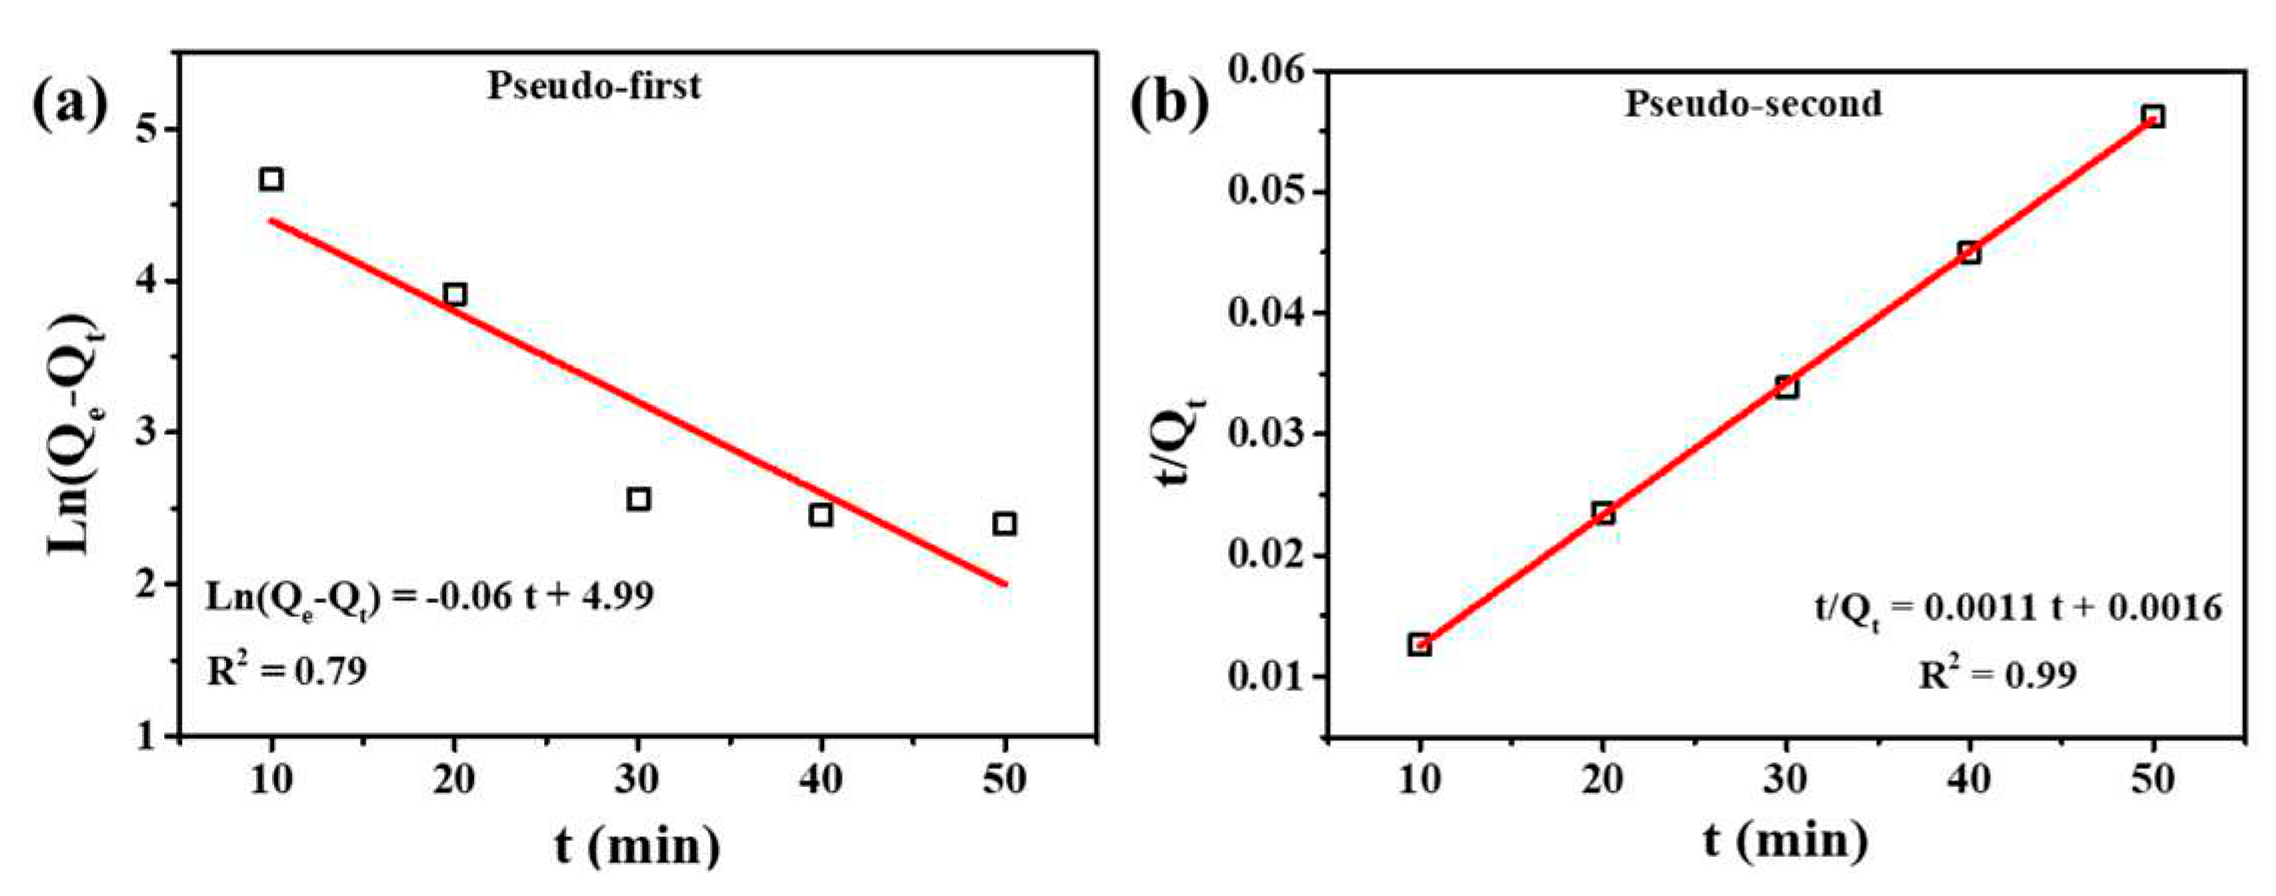
The adsorption kinetic behavious of Fe3O4@L-ABM500 for oily wastewater were explored as Figure 6, and the relative parameters were displayed in Table 1. It can be seen that the linear correlation coefficients (R2) of Pseudo-first order equation and Pseudo-second order equation were 0.79 and 0.99, respectively. The great linear relationship between t/Qt value and adsorption time (t) indicate that the adsorption process was more suitable for the Pseudo-second order equation.
Moreover, the equilibrium absorption quantity (Qe) of Pseudo-second order equation in Table 1 was also close to the experimental value. Because the Pseudo-second order equation is based on the assumption that the adsorption rate is linearly related to the concentration of the two reactants, reflecting the chemisorption process [23,24]. Hence, the chemisorption was the main adsorption manner of Fe3O4@L-ABM500 for oily wastewater.
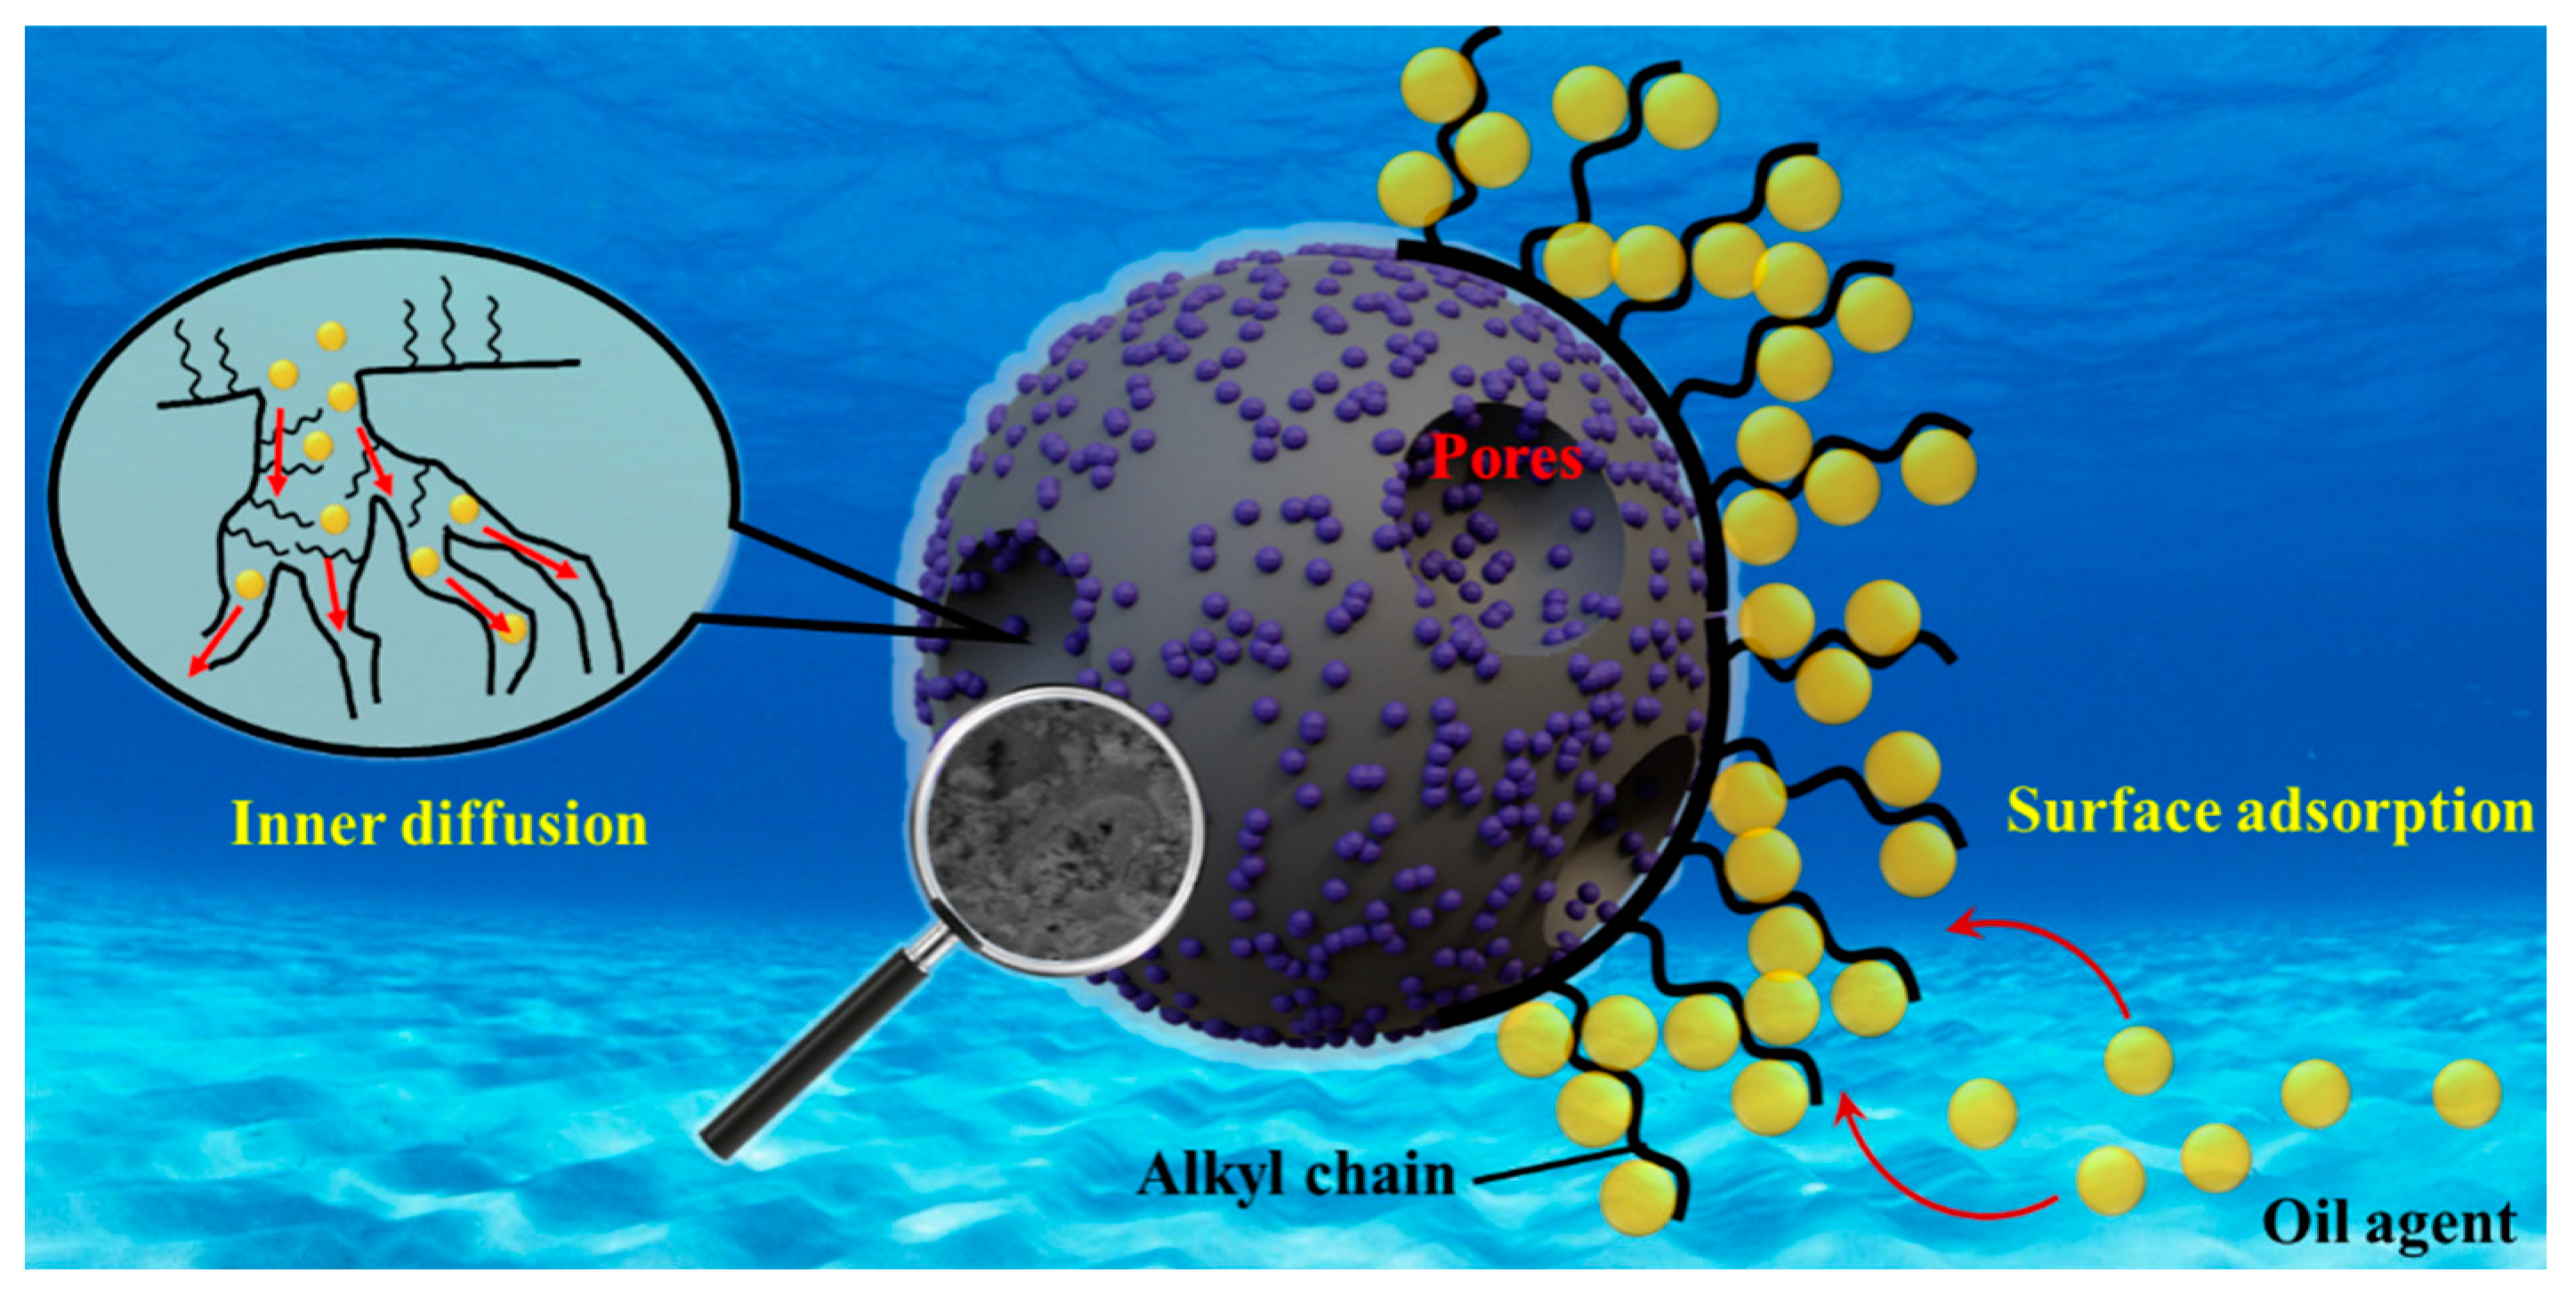
Based on the above discussion and analysis, the possible adsorption mechanism of oil agent onto biochar microsphere was shown in Figure 7. The adsorption process is divided into three steps, including surface adsorption, inner diffusion and adsorption binding onto the biochar. Firstly, the oil agent can be transferred easily from the solution to outer surface of biochar due to the alkyl chain on the surface of biochar (surface adsorption). Then, the oil agent can furtherly diffuse into the micropore of biochar microsphere from the outer surface to the inner surface (inner diffusion). Thus, the oil agent was adsorbed into biochar microspheres efficiently (adsorption binding onto biochar). In this process, the introduced alkyl chains from lauric acid, pore structures and high degree of graphitization can improve its adsorption efficiency [25].

4. Conclusion

In this study, the biochar microspheres were prepared from waste bamboo by hydrothermal reaction, KOH activation and lauric acid grafting modification. The prepared biochar microsphere (Fe3O4@L-ABM500) had high adsorption efficiency for oily wastewater, and the maximum COD removal rate reaches 86.06%. Moreover, the biochar microspheres (Fe3O4@L-ABM500) can be quickly separated from solution under the magnetic field. The structural etching, graphitization degree and lauric acid grafting played an important role in the adsorption process. Based on the adsorption kinetics analysis, chemisorption was the main adsorption manner. The high removal efficiency and low preparing cost of biochar microsphere (Fe3O4@L-ABM500) may promote the large-scale utilization of waste biomass, and decrease the treatment cost of oily wastewater.

Conflicts of Interest

There are no conflicts to declare.

Acknowledgments

This research was supported by Scientific Research Foundation of Zhejiang Sci-Tech University [22202008-Y]; Zhejiang Sci-Tech University Excellent Doctoral Program [11150131721905]; Zhejiang Modern Textile Technology Innovation Center Orientation Project [CXZX2022011HD]; Zhejiang Provincial Key Research and Development Program [2022C01174]; National Key Research and Development Program of China [2021YFB3801502].

References

  1. Jue, H. , Pan D., Chuanyu G.; et al. Emulsified oily wastewater treatment via fertilizer drawn forward osmosis using a corrugated thin film composite membrane. Journal of Membrane Science 2023, 685, 121926. [Google Scholar]
  2. Hong, C.; Anqi, Z.; Yifan, Z.; et al. Carbonaceous nanofibrous membranes with enhanced superhydrophilicity and underwater superoleophobicity for effective purification of emulsified oily wastewater. Chemical Engineering Journal 2023, 468, 143602. [Google Scholar]
  3. Mahsa, K.H.; Lei, L.; Parisa, K.H.; et al. ; et al. Performance evaluation of a pilot-scale membrane filtration system for oily wastewater treatment: CFD modeling and scale-up design. Journal of Water Process Engineering 2023, 52, 103570. [Google Scholar]
  4. Crini, G. Non-conventional low-cost adsorbents for dye removal: a review. Bioresource technology 2006, 97, 1061–1085. [Google Scholar] [CrossRef] [PubMed]
  5. Jechan, L.; Seonho, L.; Young-Kwon, P. Reduction of odor-causing compounds in wastewater using biochar: A review. Bioresource Technology 2023, 385, 129419. [Google Scholar]
  6. Jamiu OEniola Banu, S.; et al. Fabrication of engineered biochar-iron oxide from date palm frond for the effective removal of cationic dye from wastewater. Journal of Water Process Engineering 2023, 54, 104046. [Google Scholar]
  7. Haichuan, J.; Yanping, S.; Ping, G.; et al. Effect of synthetic fibers on the mechanical performance of asphalt mixture: A review. Journal of Traffic and Transportation Engineering (English Edition), 3: (3).
  8. Anderson FV, S.; Jonas, S.; Renata, V.; et al. Recent advances in surface modification using polydopamine for the development of photocatalytic membranes for oily wastewater treatment. Journal of Water Process Engineering 2023, 53, 103743. [Google Scholar]
  9. Juan, M.; Weiwei, C.; Junjie, Q.; et al. Co-pressing and co-sintering preparation of cost-effective and high-performance asymmetric ceramic membrane for oily wastewater treatment. Separation and Purification Technology 2023, 323, 124373. [Google Scholar]
  10. Muhammad, A.J.; Forat, Y.A.; Ali, D.S.; et al. Studying the effect of reactor design on the electrocoagulation treatment performance of oily wastewater. Heliyon 2023, 9, e17794. [Google Scholar]
  11. Zhai, S.; Li, M.; Wang, D.; et al. Cyano and acylamino group modification for tannery sludge bio-char: Enhancement of adsorption universality for dye pollutants. Journal of Environmental Chemical Engineering 2021, 1, 9. [Google Scholar] [CrossRef]
  12. Zhai, S.; Li, M.; Peng, H.; et al. Cost-effective resource utilization for waste biomass: A simple preparation method of photo-thermal biochar cakes (BCs) toward dye wastewater treatment with solar energy. Environmental Research 2021, 194, 110720. [Google Scholar] [CrossRef] [PubMed]
  13. Mcmulan, G.; Meehan, C.; Conneely, A.; et al. Microbial decolourisation and degradation of textile dyes. Applied microbiology and biotechnology 2001, 56, 81–87. [Google Scholar] [CrossRef] [PubMed]
  14. Donkadokul, N.Y.; Kol, A.K.; Naz, I.; et al. A review on advanced physico-chemical and biological textile dye wastewater treatment techniques. Reviews in environmental science and bio/technology 2020, 19, 543–560. [Google Scholar] [CrossRef]
  15. Turesky, R.J.; Gross, G.A.; Stillwell, W.G.; et al. Species differences in metabolism of heterocyclic aromatic amines, human exposure, and biomonitoring. Environmental health perspectives 1994, 102 (Suppl. 6), 47–51. [Google Scholar] [PubMed]
  16. Liang, J.; Bing, C.; Baiyu, Z.; Xudong, Y. Modeling marine oily wastewater treatment by a probabilistic agent-based approach. Marine Pollution Bulletin 2018, 127, 217–224. [Google Scholar]
  17. Navarrathn, C.M.; Bombuwala, D.N.; Keeton, C.; et al. Biochar adsorbents with enhanced hydrophobicity for oil spill removal. ACS applied materials & interfaces 2020, 12, 9248–9260. [Google Scholar]
  18. Wen, Q.; Chen, Y.; Rao, X.; et al. Preparation of magnesium Ferrite-Doped magnetic biochar using potassium ferrate and seawater mineral at low temperature for removal of cationic pollutants. Bioresource Technology 2022, 350, 126860. [Google Scholar] [CrossRef]
  19. Meng, Z.; Huang, S.; Xu, T.; et al. Competitive adsorption, immobilization, and desorption risks of Cd, Ni, and Cu in saturated-unsaturated soils by biochar under combined aging. J Hazard Mater 2022, 434, 128903. [Google Scholar] [CrossRef]
  20. Ferreira, C.I.A.; Calisto, V.; Otero, M.; et al. Comparative adsorption evaluation of biochars from paper mill sludge with commercial activated carbon for the removal of fish anaesthetics from water in Recirculating Aquaculture Systems. Aquacultural Engineering 2016, 74, 76–83. [Google Scholar] [CrossRef]
  21. Zhu, H.; Li, L.; Chen, W.; et al. Controllable synthesis of coral-like hierarchical porous magnesium hydroxide with various surface area and pore volume for lead and cadmium ion adsorption. J Hazard Mater 2021, 416, 125922. [Google Scholar] [CrossRef]
  22. Xiao, C.; Song, Q.; Shen, Q.; et al. Understanding on interlaminar nano-reinforcement induced mechanical performance improvement of carbon/carbon composites after silicon infiltration. Composites Part B: Engineering 2022, 239, 109946. [Google Scholar] [CrossRef]
  23. Alberto, E. Regazzoni. Adsorption kinetics at solid/aqueous solution interfaces: On the boundaries of the pseudo-second order rate equation. Colloids and Surfaces A: Physicochemical and Engineering Aspects 2020, 585, 124093. [Google Scholar]
  24. Rohollah, E. Derivation of Pseudo-First-Order, Pseudo-Second-Order and Modified Pseudo-First-Order rate equations from Langmuir and Freundlich isotherms for adsorption. Chemical Engineering Journal 2020, 392, 123705. [Google Scholar]
  25. Seongbin, G.; Nahyeon, A.; Chonghyo, J.; et al. pyAPEP: An all-in-one software package for the automated preparation of adsorption process simulations. Computer Physics Communications 2023, 291, 108830. [Google Scholar]
Figure 1. SEM images of BM (a), ABM500 (b) and Fe3O4@L-ABM500 (c).
Preprints 82473 g001
Figure 2. Raman analyses for Fe3O4@L-ABM300 (a), Fe3O4@L-ABM500 (b), Fe3O4@L-ABM700 (c).
Preprints 82473 g002
Figure 3. XRD patterns (a) and FTIR spectra (b) of as-prepared biochar microspheres.
Preprints 82473 g003
Figure 4. XPS survey spectra of BM, Fe3O4@ABM500 and Fe3O4@L-ABM500 (a); High-resolution spectra of Fe 2p in Fe3O4@ABM500 and Fe3O4@L-ABM500 (b).
Preprints 82473 g004
Figure 5. Effects of pyrolysis time (a), biochar dosage (b), adsorption time (c) and initial pH (d) on the adsorption abilities of biochar microspheres for oily wastewater.
Preprints 82473 g005
Figure 6. Adsorption kinetic model-fitting curves of Fe3O4@L-ABM500 for oily wastewater.
Preprints 82473 g006
Figure 7. Diagram of adsorption mechanism of oil agent onto biochar microsphere.
Preprints 82473 g007
Table 1. Adsorption kinetics parameters of Pseudo-first and Pseudo-second order models.
Model Fitting parameters Values
Pseudo-first order equation K1 (min-1) 0.06
Qe (mg/g) 146.94
R2 0.79
Pseudo-second order equation K2 (min-1) 7.56*10^-4
Qe (mg/g) 909.11
R2 0.99
Disclaimer/Publisher’s Note: The statements, opinions and data contained in all publications are solely those of the individual author(s) and contributor(s) and not of MDPI and/or the editor(s). MDPI and/or the editor(s) disclaim responsibility for any injury to people or property resulting from any ideas, methods, instructions or products referred to in the content.
Copyright: This open access article is published under a Creative Commons CC BY 4.0 license, which permit the free download, distribution, and reuse, provided that the author and preprint are cited in any reuse.
Prerpints.org logo

Preprints.org is a free preprint server supported by MDPI in Basel, Switzerland.

Subscribe

© 2024 MDPI (Basel, Switzerland) unless otherwise stated