Preprint
Article

Comprehensive Analysis of DNA Methyltransferases Expression in Primary and Relapsed Ovarian Carcinoma

Altmetrics

Downloads

130

Views

41

Comments

0

A peer-reviewed article of this preprint also exists.

Submitted:

15 August 2023

Posted:

16 August 2023

You are already at the latest version

Alerts
Abstract
Background: Despite recent advances in epithelial ovarian carcinoma (EOC) treatment, recur-rence and mortality rates have not improved significantly. DNA hypermethylation has generally been associated with ominous prognosis and chemotherapy resistance, but the role of DNMTs in EOC remains to be investigated. Methods: In the current study, we systematically retrieved gene expression data from patients with EOC and studied the immunohistochemical expression of DNMTs in 108 primary and 26 relapsed tumors. Results: Our results showed that DNMT1, DNMT3A, DNMT3B and DNMT3L RNA levels were higher and DNMT2 lower in tumors compared to non-neoplastic tissue, and DNMT3A and DNMT2 expression decreased from Stage II to Stage IV carcinomas. Proteomic data also suggested that DNMT1 and DNMT3A levels were increased in tumors. Similarly, DNMT1, DNMT3A and DNMT3L protein levels were overex-pressed and DNMT2 expression was reduced in high grade carcinomas compared to non-neoplastic tissue and low-grade tumors. Moreover, DNMT1 and DNMT3L were increased in relapsed tumors compared to their primaries. DNMT3A, DNMT1 and DNMT3B mRNA lev-els were correlated with overall survival. Conclusions: Our study demonstrates that DNMT1 and DNMT3L are upregulated in primary high grade EOC and further increase in relapses, whereas DNMT3A is upregulated only in the earlier stages of cancer progression. DNMT2 downregulation highlights a presumptive tumor-suppressor activity of this gene in ovarian car-cinoma.
Keywords: 
Subject: Medicine and Pharmacology  -   Obstetrics and Gynaecology

1. Introduction

Ovarian cancer (OC) is the seventh most common and one of the deadliest types of cancer in women [1]. It most commonly occurs in postmenopausal women with an average of 65 years old [2]. Major risk factors for OC are: Hereditary Breast and Ovarian Cancer (HBOC) Syndrome, Lynch Syndrome, postmenopausal hormonal therapy, endometriosis, IVF treatment, use of fertility drugs, late menopause and null parity [3]. OC is difficult to detect at early stage and 60% of the cases are diagnosed at advanced stage disease [4]. Due to its asymptomatic nature and late presentation, it is known as the “whispering” or “silent” cancer [5].
Epithelial ovarian cancer (EOC) accounts for 90% of the OC cases. Five major histological types of EOC are recognized: high-grade serous ovarian carcinoma (HGSOC), low grade serous ovarian carcinoma (LGSOC), mucinous ovarian carcinoma (MOC), clear cell ovarian carcinoma (CCOC) and endometrioid ovarian carcinoma (EnOC) [4]. Each EOC subtype is characterized by different gene mutations that deregulate diverse signaling pathways and this knowledge should be employed for the development of personalized treatment strategies. HGSOC, the largest subgroup (75%), is the most aggressive and chemoresistant form of EOCs, responsible for 70–80% of OC-related deaths [6]. Approximately 15–20% of HGSOC patients have germline BRCA1 or BRCA2 mutations [7]. Homologous recombination deficiency (HRD), either sporadic or germ-line, is seen in nearly half of HGSOC [8]. HRD is a key determinant of platinum sensitivity in HGSOC and has been exploited for treatment with poly (ADP-ribose) polymerase inhibitors (PARPi). HGSOCs are also characterized by a high frequency (90%) of somatic TP53 mutations [9] and frequent DNA copy number alterations involving CCN1, PIK3CA and PTEN [10].
LGSOCs are less aggressive tumors with a relatively better prognosis than HGSOCs, occur in younger women (median age of 55 years) and account less than 5% of all OCs [4]. A small subset of patients has a prior history of a serous borderline tumour (SBT). LGSOCs have a significantly higher expression of ER and PR compared to HGSOCs and are not associated with BRCA germline mutations [11], showing KRAS and BRAF mutations instead [10].
Mucinous, clear cell and endometrioid carcinomas are less frequently seen, with the latter two being associated with endometriosis. Numerous studies have demonstrated increased incidence of defective mismatch repair (dMMR) and an associated microsatellite instability-high (MSI-H) phenotype in non-serous ovarian cancer (typically tumors of endometrioid or clear-cell histology) [12].
Despite the combined use of surgery and chemotherapy in the modern era, mortality rates have not improved significantly over the last decades for OC [13]. LGSOCs are chemoresistant, with less than 5% response rate to first-line chemotherapy compared to the 80% response rate of HGSOC treated with platinum/taxane drugs [11]. Even though HGSOCs initially respond to platinum/taxane-based therapies, the majority of the patients will eventually develop chemotherapy resistance and tumor recurrence [14]. Thus, the detection of novel therapeutic targets that will drive personalized therapy is crucial for improving OC patients’ prognosis [15].
Epigenetic mechanisms, that is changes in DNA expression without any alteration in DNA sequence, include DNA methylation, histone post-transcriptional modifications and microRNA expression, are considered pivotal in tumor initiation and progression and represent potential therapeutic targets [16]. DNA methylation is a biological process in which the cytosine bases of eukaryotic DNA are converted to 5-methylcytosine. This event usually takes place in CpG dinucleotides located within the promoter region of the genes, thereby silencing transcriptional activity [17]. Transcriptional silencing can be inherited to daughter cells following cell division [18] and can be pharmacologically inverted [19]. In cancer cells, the genome is generally hypomethylated [20] compared to normal cells and this leads to genomic instability and oncogene expression [21,22]. However, hypermethylation is seen in specific promoters, namely those of tumor-suppressor genes, resulting in reduced expression of the respective protein [23,24].
DNA methylation is mediated by DNA methyltransferases (DNMT1, 2, 3A, 3B and 3L). DNMT1 is responsible for maintaining methylation patterns following replication, and DNMT3A and DNMT3B initiate de novo methylation [25]. DNMT3L is catalytically inactive but enables DNMT3s’ interaction with the histone code. DNMT2 is the fifth member of the family, and even though it shows structural similarity to the other DNMTs, it harbors a weak DNA methylation activity, but is, instead, capable of methylating aspartic acid tRNAs [26]. Thus, DNMT2, also called TRDMT1, represents an RNA methyltransferase.
Alterations in the expression of DNMTs have been shown in various solid tumors and hematologic malignancies and have been associated with diverse clinicopathologic features and survival outcomes [27], frequently, independently of other prognostic factors, underscoring their importance as potential drivers in a variety of cancer types. These data rationalized the development of DNA methyltransferase inhibitors (DNMTi) which can restore the exrpession of tumour suppressor genes [28]. At present, two DNMTi drugs, 5- azacytidine (AZA) and decitabine, have been approved for treating patients with myelodysplastic syndrome (MDS) and acute myeloid leukemia (AML) [29], and are also being tested as therapeutic options in several solid cancers such as colon, ovarian, and lung carcinomas [30]. However, many items remain unsolved considering tumor responses, suggesting the presence of alternative ways by which DNMTi may modulate cancer cells [31].
A mounting amount of evidence suggests that DNA methylation is implicated in OC development and progression. Studies have shown that tumor suppressor gene loss in OC is mediated by DNA methylation [32] and many epidemiological studies focus on the role of DNA methylation in OC susceptibility [33]. DNMTs are often overexpressed in various cancer tissues and cell lines and their levels have been associated with poor survival [34]. However, few studies have analyzed the expression of DNMTs in ovarian carcinomas, with conflicting results, and the prognostic effect of these enzymes in ovarian cancer remains to be investigated [35,36,37].
In the current study, we used publicly available datasets from patients with OC (TNMplot, Gepia2., Protein Data Commons and Kaplan-Meier Plotter) to analyze the expression of DNMTs at the RNA and protein level and correlate it with clinical data. We also analyzed the expression of DNMTs in a cohort of primary epithelial ovarian carcinomas and theirs relapses using immunohistochemistry, in an attempt to provide a thorough understanding of the role of DNMTs in ovarian cancer and identify potentially effective drug targets.

2. Materials and Methods

To compare the expression of the DNMTs between normal, tumor and metastatic tissue we used data from TNM plot and TCGA for mRNA levels and Proteomic data commons for protein levels. To analyze the expression of the markers according to stage the Gepia 2 platform was used.

 TNM plot 

TNM plot (http://www.kmplot.com) is the largest currently available transcriptomic cancer database, consisting of nearly 57,000 tissue samples and utilizing multiple RNA-seq and microarray datasets [41,42]. This database includes 33,520 samples from 3180 gene chip-based studies from GEO (453 metastatic, 29,376 cancer and 3691 normal samples), 11,010 samples from TCGA (394 metastatic, 9886 cancer and 730 normal samples), 1193 samples from TARGET (1 metastatic, 1180 cancer and 12 normal samples) and 11,215 normal samples from GTEx. Differential expression analyses in a variety of cancer subtypes, primary and metastatic, as well as clinical data are also available, making it possible to identify genes with aberrant expression in a variety of neoplasms.
In the current study, we adopted the TNMplot database to compare the expression of DNMT1, DNMT2, DNMT3A, DNMT3B and DNMT3L in normal, tumor and metastatic ovarian samples. Only datasets utilizing the Affymetrix HGU133, HGU133A_2 and HGU133A platforms were considered because these platforms use identical sequences for the detection of the same gene. The RNA seq data included 133 normal and 374 tumor tissues and the gene chip data included 46 normal, and 744 primary and 44 metastatic tumor tissues. Statistical significance was computed using Mann–Whitney or Kruskal–Wallis tests.

 TCGA 

Differential gene expression analyses were implemented, using 319 primary ovarian tumor samples from TCGA (the Genome Cancer Atlas, TCGA-OV project) and 88 normal ovarian samples from GTEx, using the R packages limma and edger [38].

 Proteomic data commons 

The proteomic data commons (PDC) are one of the several repositories within the NCI Cancer Research Data Commons (CRDC) and was developed to advance in-depth analysis of how proteomics are involved in cancer risk, diagnosis, development, progression, and treatment. The Cancer Proteogenomic Data Analysis Site (cProSite) (https://cprosite.ccr.cancer.gov/) is a web-based interactive platform that contains data derived from the PDC and currently includes 11 cancer types (breast, colon, head and neck, liver, lung, ovarian, pancreatic, stomach and uterine).
Using the cProSite we compared the quantity and phosphorylation levels of the DNMT1, DNMT2, DNMT3A, DNMT3B and DNMT3L proteins between 83 tumors and 19 normal tissues and correlated them with their respective mRNA expression levels.

 GEPIA 2 

GEPIA 2 (Gene Expression Profiling Interactive Analysis) is a newly developed web-based tool used for analyzing RNA sequence data from 9,736 tumors and 8,587 normal samples from the Cancer Genome Atlas (TCGA) and the Genotype-Tissue Expression (GTEx) projects, using a standard processing pipeline [44]. GEPIA provides key interactive and customizable functions including tumor/normal differential expression analysis, profiling according to cancer types or pathological stages, patient survival analysis, similar gene detection, correlation analysis, and dimensionality reduction analysis. GEPIA is available at http://gepia.cancer-pku.cn/. We used GEPIA to correlate mRNA DNMTs expression with tumor stage in 404 tumor samples that were included in the TCGA dataset.

Survival analysis

In order to evaluate the prognostic significance of DNMTs, the Kaplan–Meier plotter and the Gepia2 software were used. Overall survival (OS) and progression free survival (PFS) were selected as endpoints. We restricted the analysis to high grade ovarian serous carcinomas, as these are by far the most common aggressive carcinomas.
The online database Kaplan-Meier plotter (www.kmplot.com) contains gene expression data and survival information from lung, ovarian, gastric and breast cancer patients. To analyze the OS and PFS of 1268 patients with HGSOC the patient samples were divided into two groups according to the expression levels of each gene (high vs. low expression). The best performing threshold was automatically used as a cutoff for determining low vs. high expression for Kaplan Meier plotter. For Gepia 2 we used various thresholds. The data shown were obtained using the thresholds (mostly around 50%) that revealed the most significant results. The log rank p-value and hazard ratio (HR) with 95% confidence intervals were calculated and displayed on the webpage. Briefly, the five genes (DNMT1, DNMT2, DNMT3A, DNMT3B, DNMT3L) were uploaded into the database to obtain the Kaplan-Meier survival plots. Log rank p-value and hazard ratio (HR) with 95% confidence intervals were calculated and displayed on the webpage. Only the JetSet best probe set was chosen to obtain Kaplan-Meier plots.

Tissue cohort

 Patients 

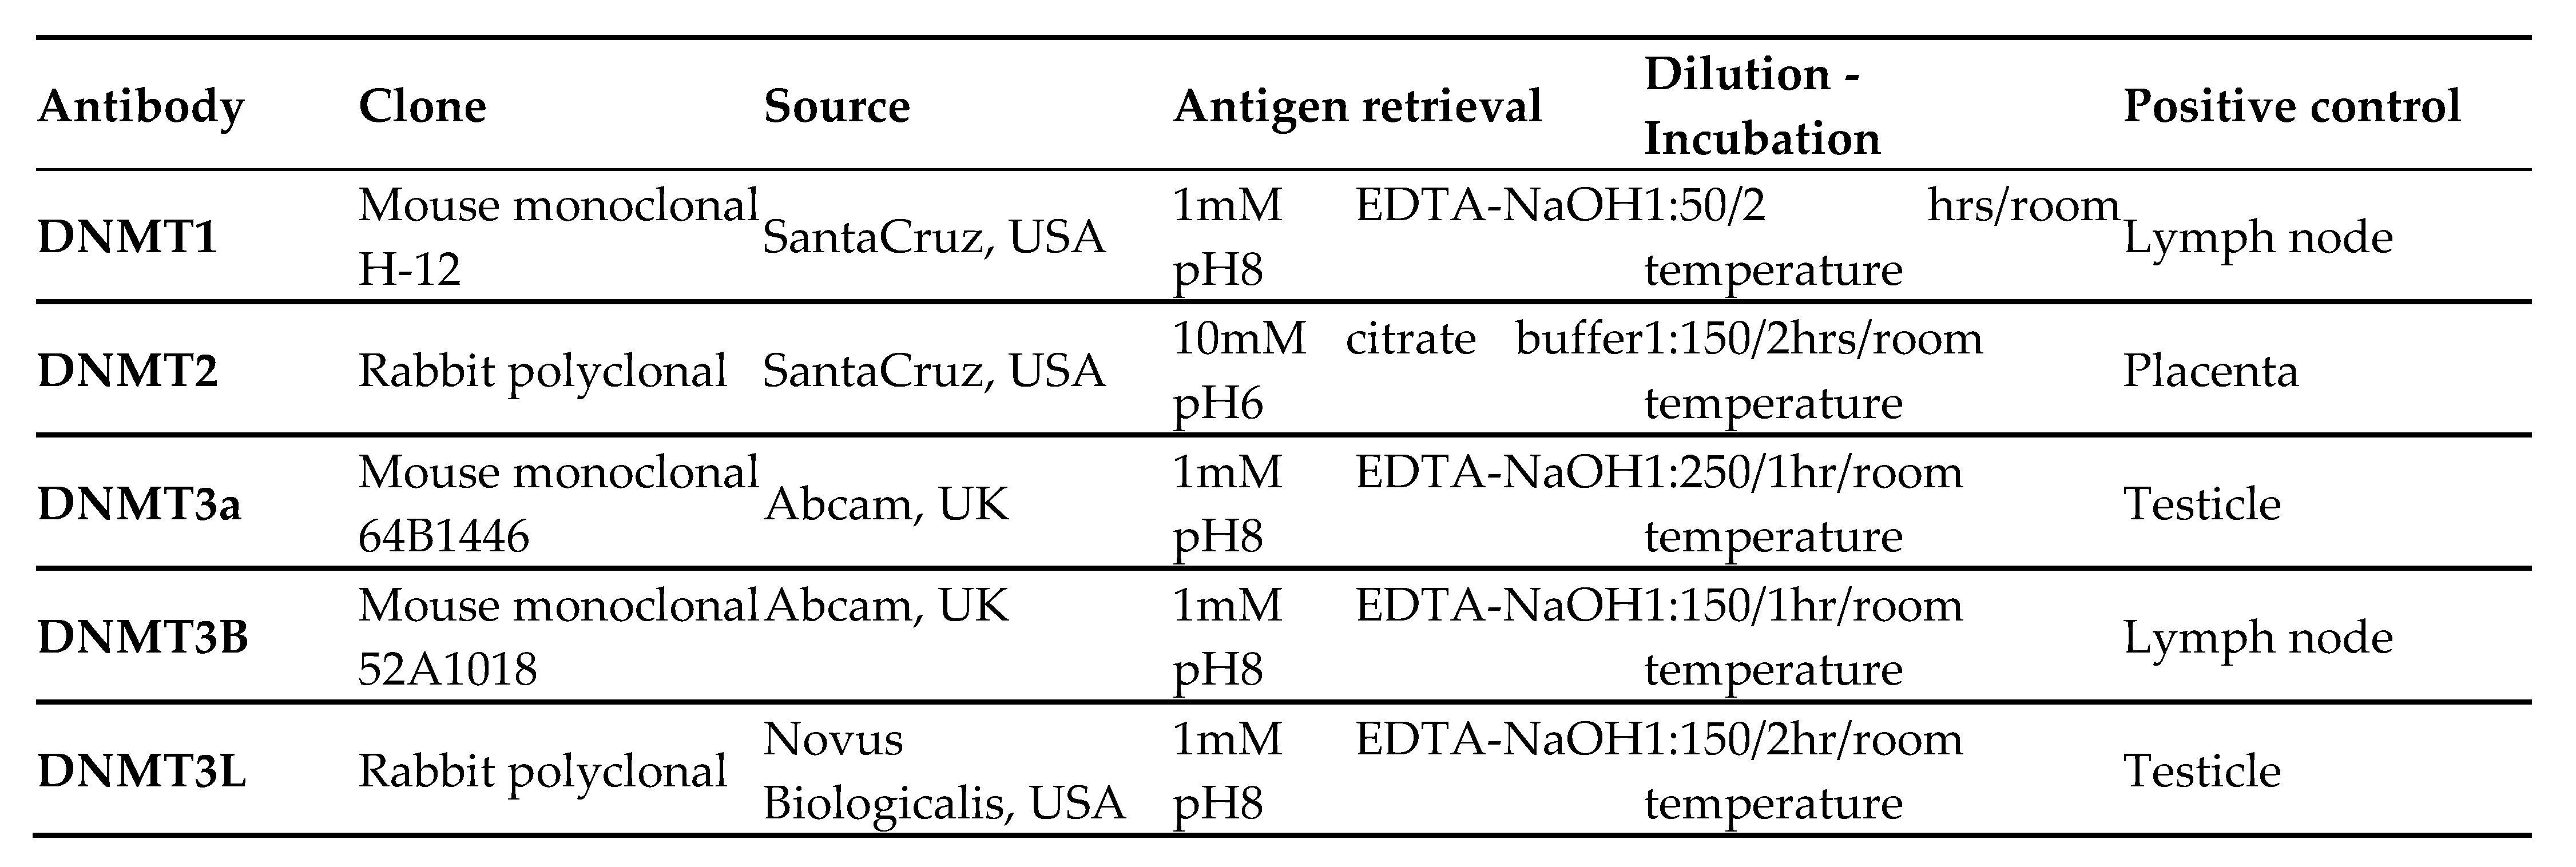
We retrieved tissue samples from 108 patients with primary ovarian tumors from the files of the Department of Pathology of the University Hospital of Patras. In 26 of them, tissue from disease relapse was also available. All patients had undergone Systematic Surgical Staging for OEC at the University Hospital of Patras between 2000-2017. The mean age of the patients at surgery was 52 years (ranging from 18 to 80 years). Eight-nine (89) patients had serous tumors (12 borderline tumors, 17 low-grade carcinomas, 60 high-grade carcinomas) and 19 had mucinous tumors (12 borderline tumors and 7 carcinomas). None of the patients had received preoperative Systematic Therapy. The 26 relapses included 1 SBT, 4 LGSOC, 19 HGSOC, 1 mucinous borderline tumor and 1MOC. Relapsed tumors had received adjuvant platinum-based chemotherapy. Table 1 shows the clinicopathologic characteristics of the patients.
All tumors were placed in formalin within 10 minutes from resection, processed within 48 hrs and then embedded in paraffin. The hematoxylin and eosin (H&E) stained slides of the specimens were reviewed by an expert pathologist (VT) in order to determine the histological subtype, grade and Tumor (T), Lymph node (N) and Metastasis (M) stage and FIGO stage, the latter two according to the 8th Edition of the AJCC Cancer Staging Manual [39]. A representative block was selected from the tumor for each patient. This study was approved by the Ethical Committee of the University Hospital of Patras (# 127/09.03.2021).

 Ιmmun 

 Immunohistochemistry 

Paraffin-embedded tissue sections, 3 μm thick, were sliced from each tissue block, were dried at 60 °C for 15 min, deparaffinized in xylene, rehydrated in a graded alcohol series, and washed in tap water. For antigen-retrieval, the sections were heated, at 600 W in a microwave for 20 min. Endogenous peroxidase activity was blocked (0.3% H2O in methanol) at room temperature for 15 min. The sections were then incubated under the conditions indicated by the manufacturer with primary antibodies against DNMT1, DNMT2, DNMT3A, DNMT3B and DNMT3L. Source and dilutions of the antibodies used are shown in Table 2. Dako EnVision polymer (Dako EnVision Mini Flex, Dako Omnis, Angilent Technology Inc., California, USA, GV823) was used for signal detection. Diaminobenzidine (Dako Omnis, GV823) was used as a chromogen and Harris hematoxylin was used for nuclear counterstaining. Positive controls for antibody validation were used according to the manufacturer’s instructions. Control experiments without the primary antibody demonstrated that the signals observed were specific.
Preprints 82450 i001

 Evaluation of immunohistochemical stains 

All slides were observed under light microscopy (BX241, Olympus, Tokyo, Japan). The immunoreactivity was assessed by an expert pathologist (VT), blinded to the pathologic characteristics of each case. Areas with the highest density of positive cells (hot spots) were selected at low power (x40) magnification. Cell counts were performed at a 400X magnification using a 10x10 microscope grid. More than 1000 cells were counted. The intensity and the percentage of positively stained cells were evaluated. Intensity of staining (1-3) was multiplied by the % of positive tumor cells and a combined score (H-SCORE) was reported (range 0-300) for each case. The localization (nuclear and cytoplasmic) of the positive signal was also assessed.

Statistical analysis

In order to summarize patient characteristics and biomarker expression data various descriptive statistical methods, as well as exploratory analysis techniques were used. Continuously scaled variables were summarized with descriptive statistical measures, for example, median and standard deviation (SD). Kolmogorov Smirnoff/Lilliefors test was used to test whether the data follow a normal distribution. Kruskal Wallis test was used in order to perform comparisons between biomarker expressions. Wilcoxon signed rank test was used for paired comparisons. All reported p-values are two-sided at a significance level of 0.05. In order to adjust for multiple comparisons, a Bonferroni correction was used. Analyses were performed using R programming language (R version 4.2.0).

3. Results

3.1. Aberrant DNMTs expression correlates with OΕC development.

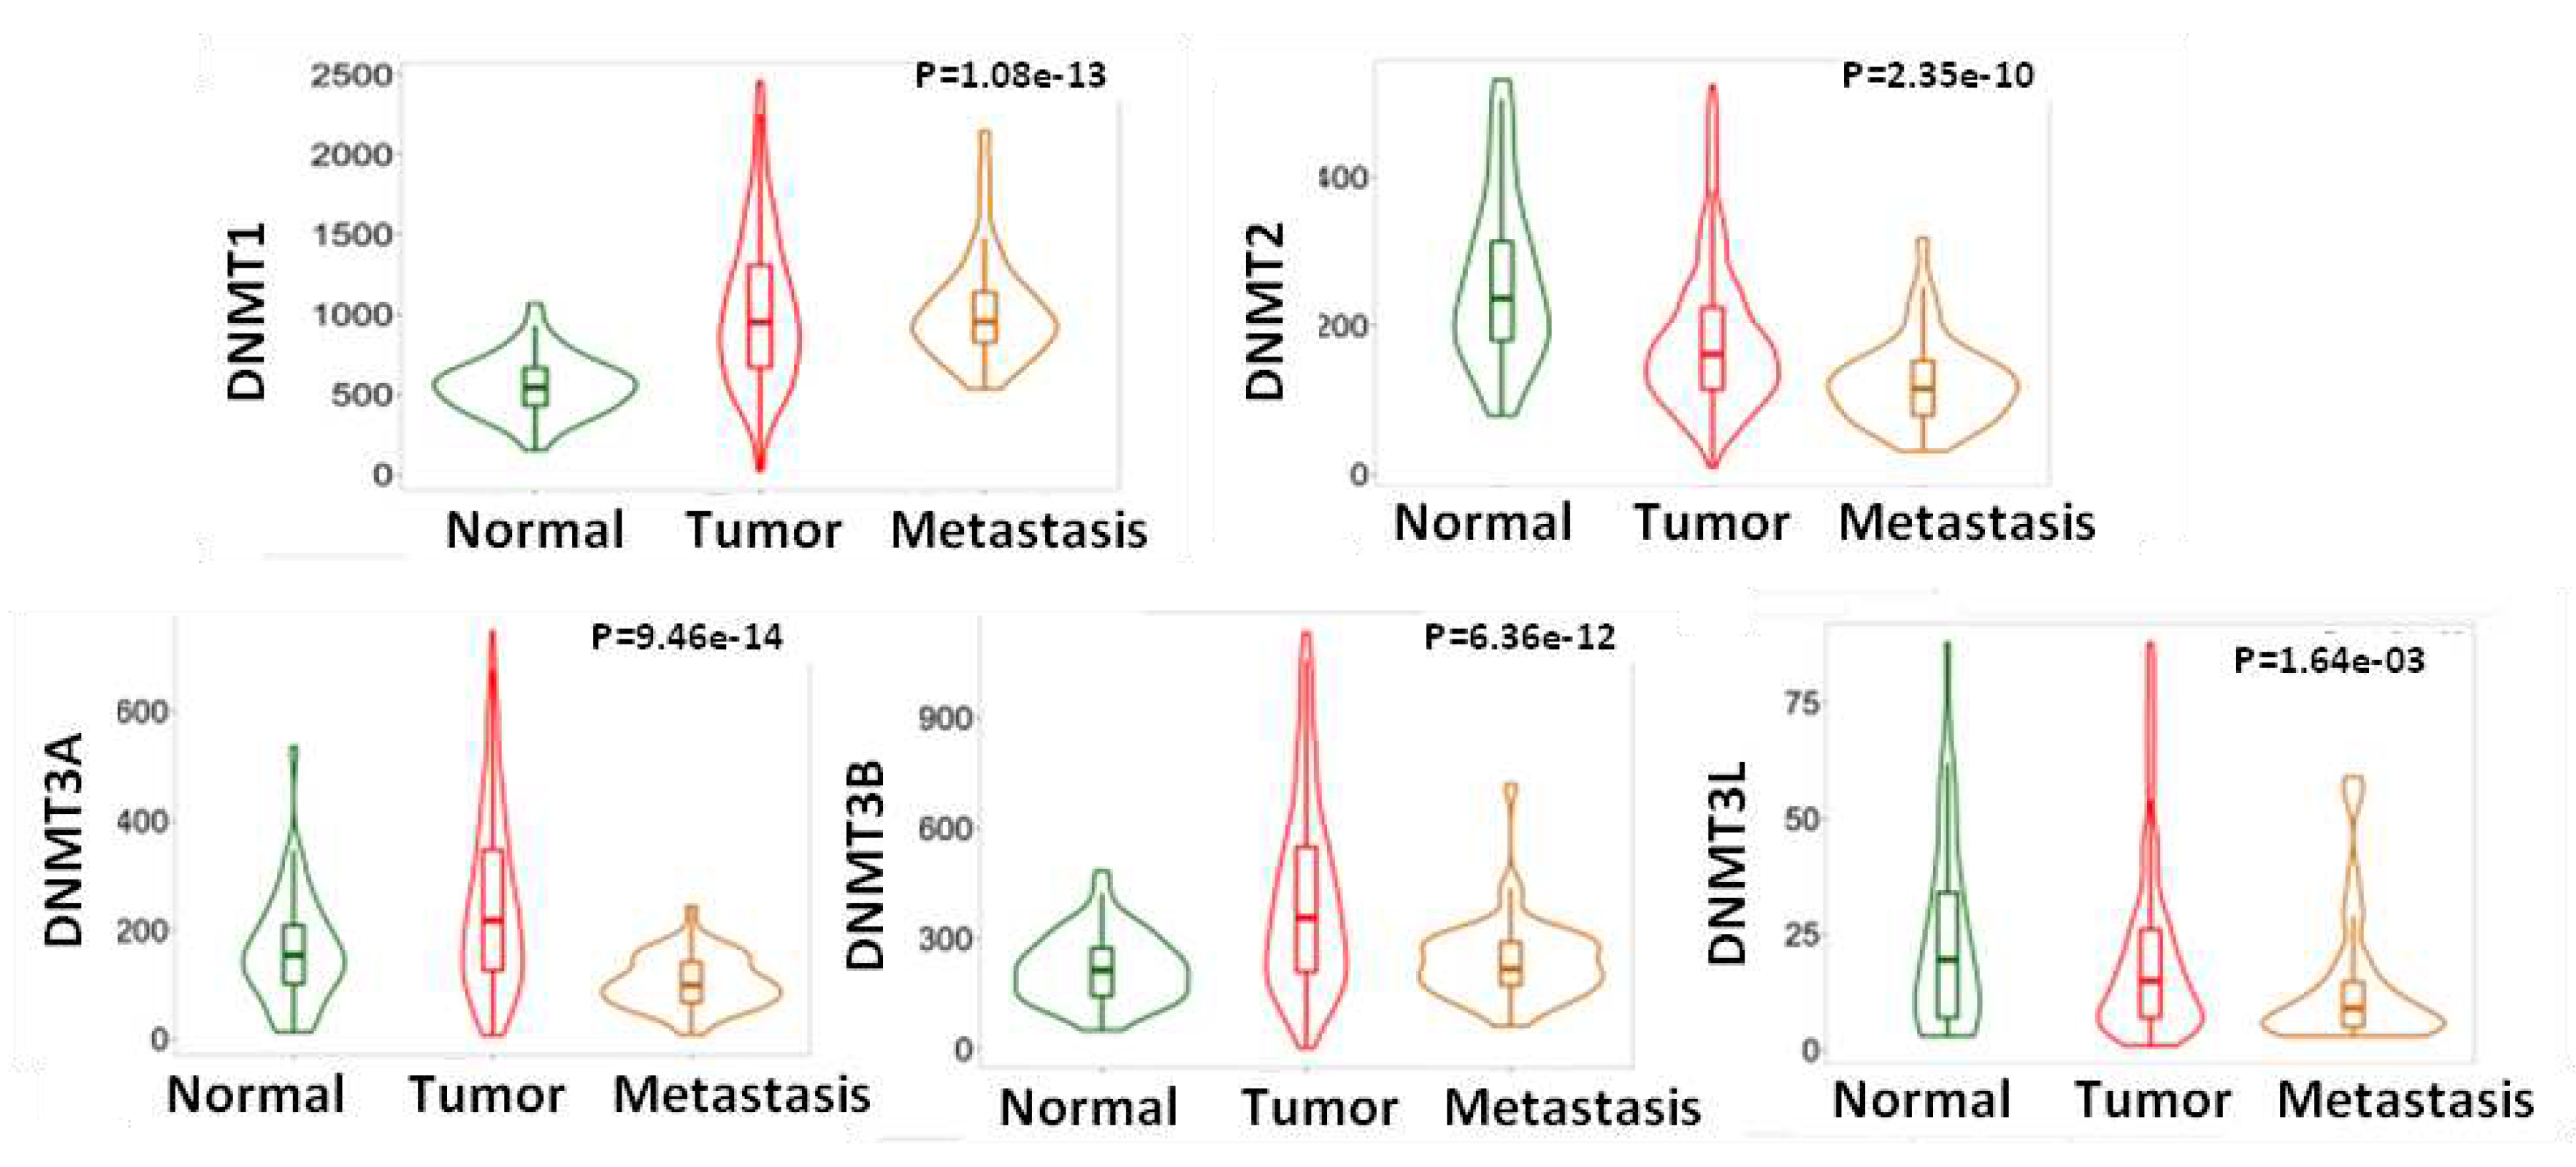
RNAseq data from TNMplot (TCGA, GTEx and TARGET projects) revealed that DNMT1, DNMT3A, DNMT3B and DNMT3L mRNA levels were higher and DNMT2 mRNA expression was lower in HGSOC, compared to non-neoplastic tissue (P<0.0001 for all markers) (Figure 1). These results were confirmed with gene chip data from GEO series (TNMplot) for DNMT1, DNMT2, DNMT3A and DNMT3B (p<0,001 for all markers), but not for DNMT3L (p=0.237) (Figure 2).
Additionally, gene chip data (Figure 2) from GEO series (TNMplot) indicated that DNMT3A (P<0,0001), DNMT3B (P<0,0001) and DNMT3L mRNA (P<0,0001) expression was reduced in metastatic tumors compared to the primaries and almost reached the levels of normal tissues, while DNMT1 expression was maintained at high levels in metastasis and was not statistically different from that of the primary tumors. Regarding the expression of DNMT2/TRDMT1 a further decline in metastatic tumors compared to primary carcinomas was noted (P<0,001) (Figure 2).
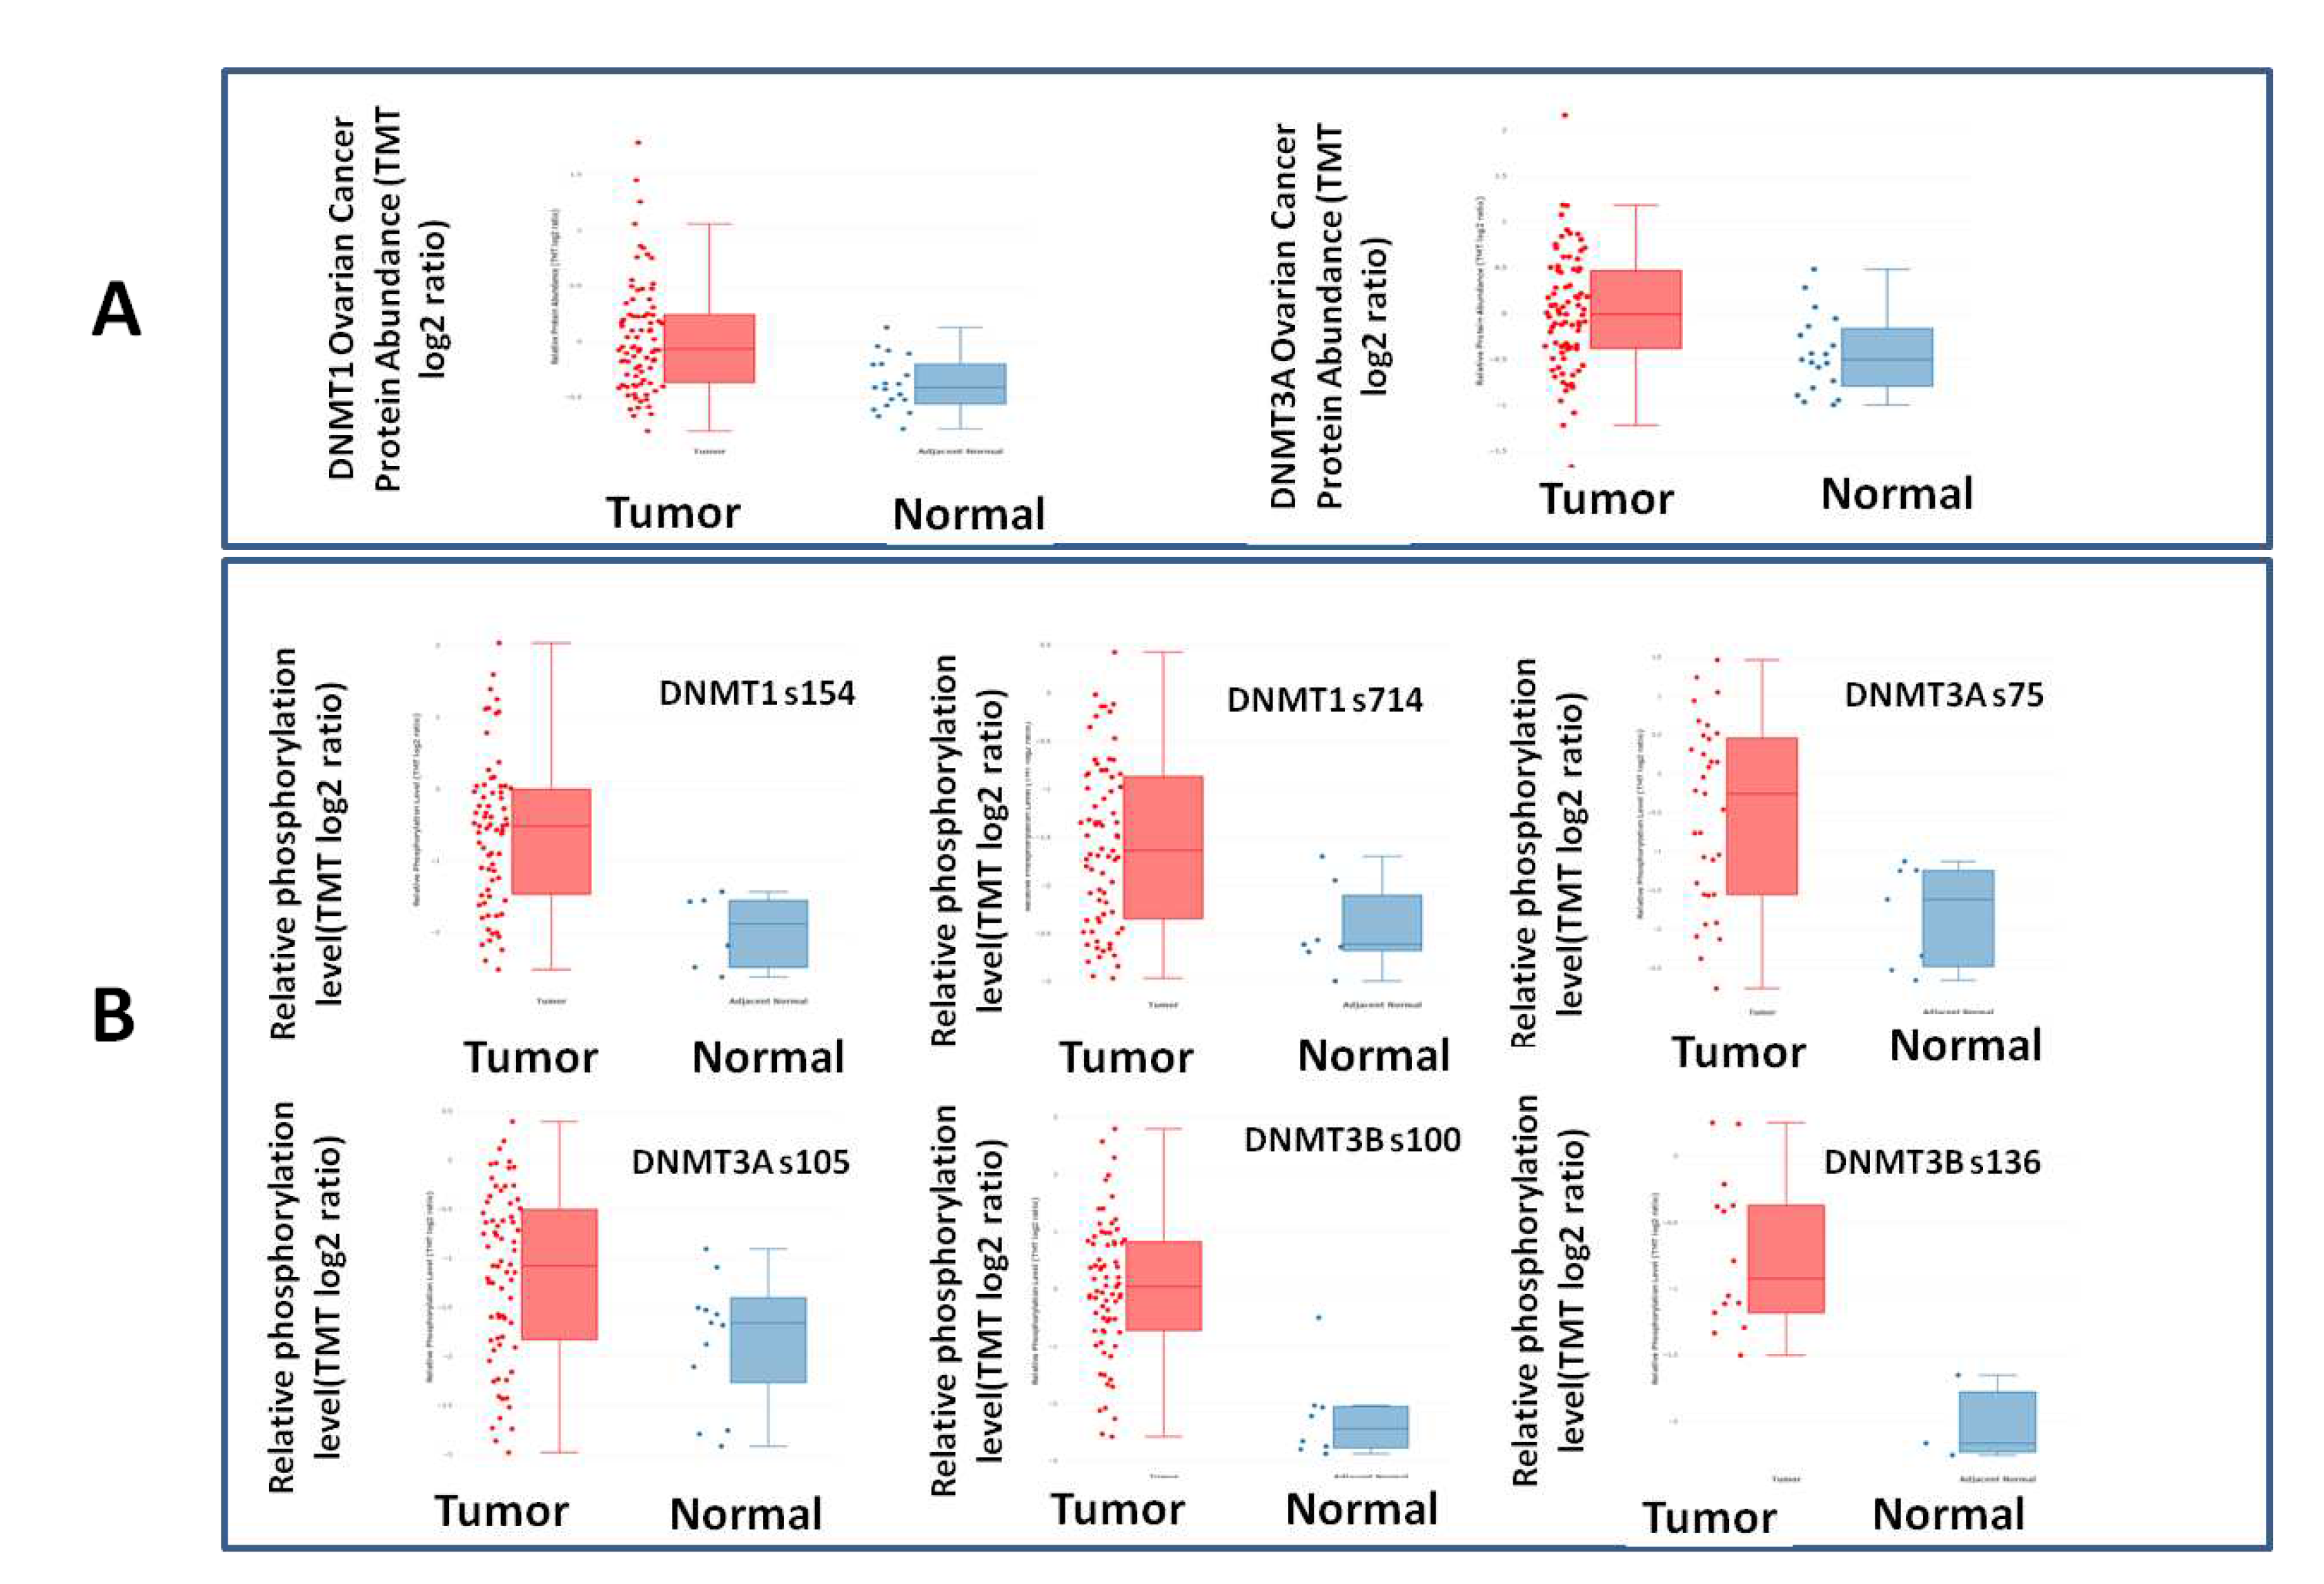
In line with the mRNA results, the cProSite analysis, showed higher levels of DNMT1 and DNMT3A proteins in ovarian cancers compared with normal adjacent tissues (p<0,0001 and p<0,0005 respectively), even though DNMT1 and DNMT3A protein did not correlate with their mRNA expression levels (Figure 3).
Further strengthening the role of DNMTs in EOC, cProSite analysis showed that phosphorylation levels of the DNMT1 protein at s154 and s714, of the DNMT3A protein at s75 and s105 and of the DNMT3B protein at s100 and s136 were significantly increased in tumors compared to normal tissues (p=0,0004, p=0,0012, p=0,001, p=0,037, p<0,0001 and p=0,0027, respectively) (Figure 3).

3.2. DNMTs expression is altered with the progression of EOC

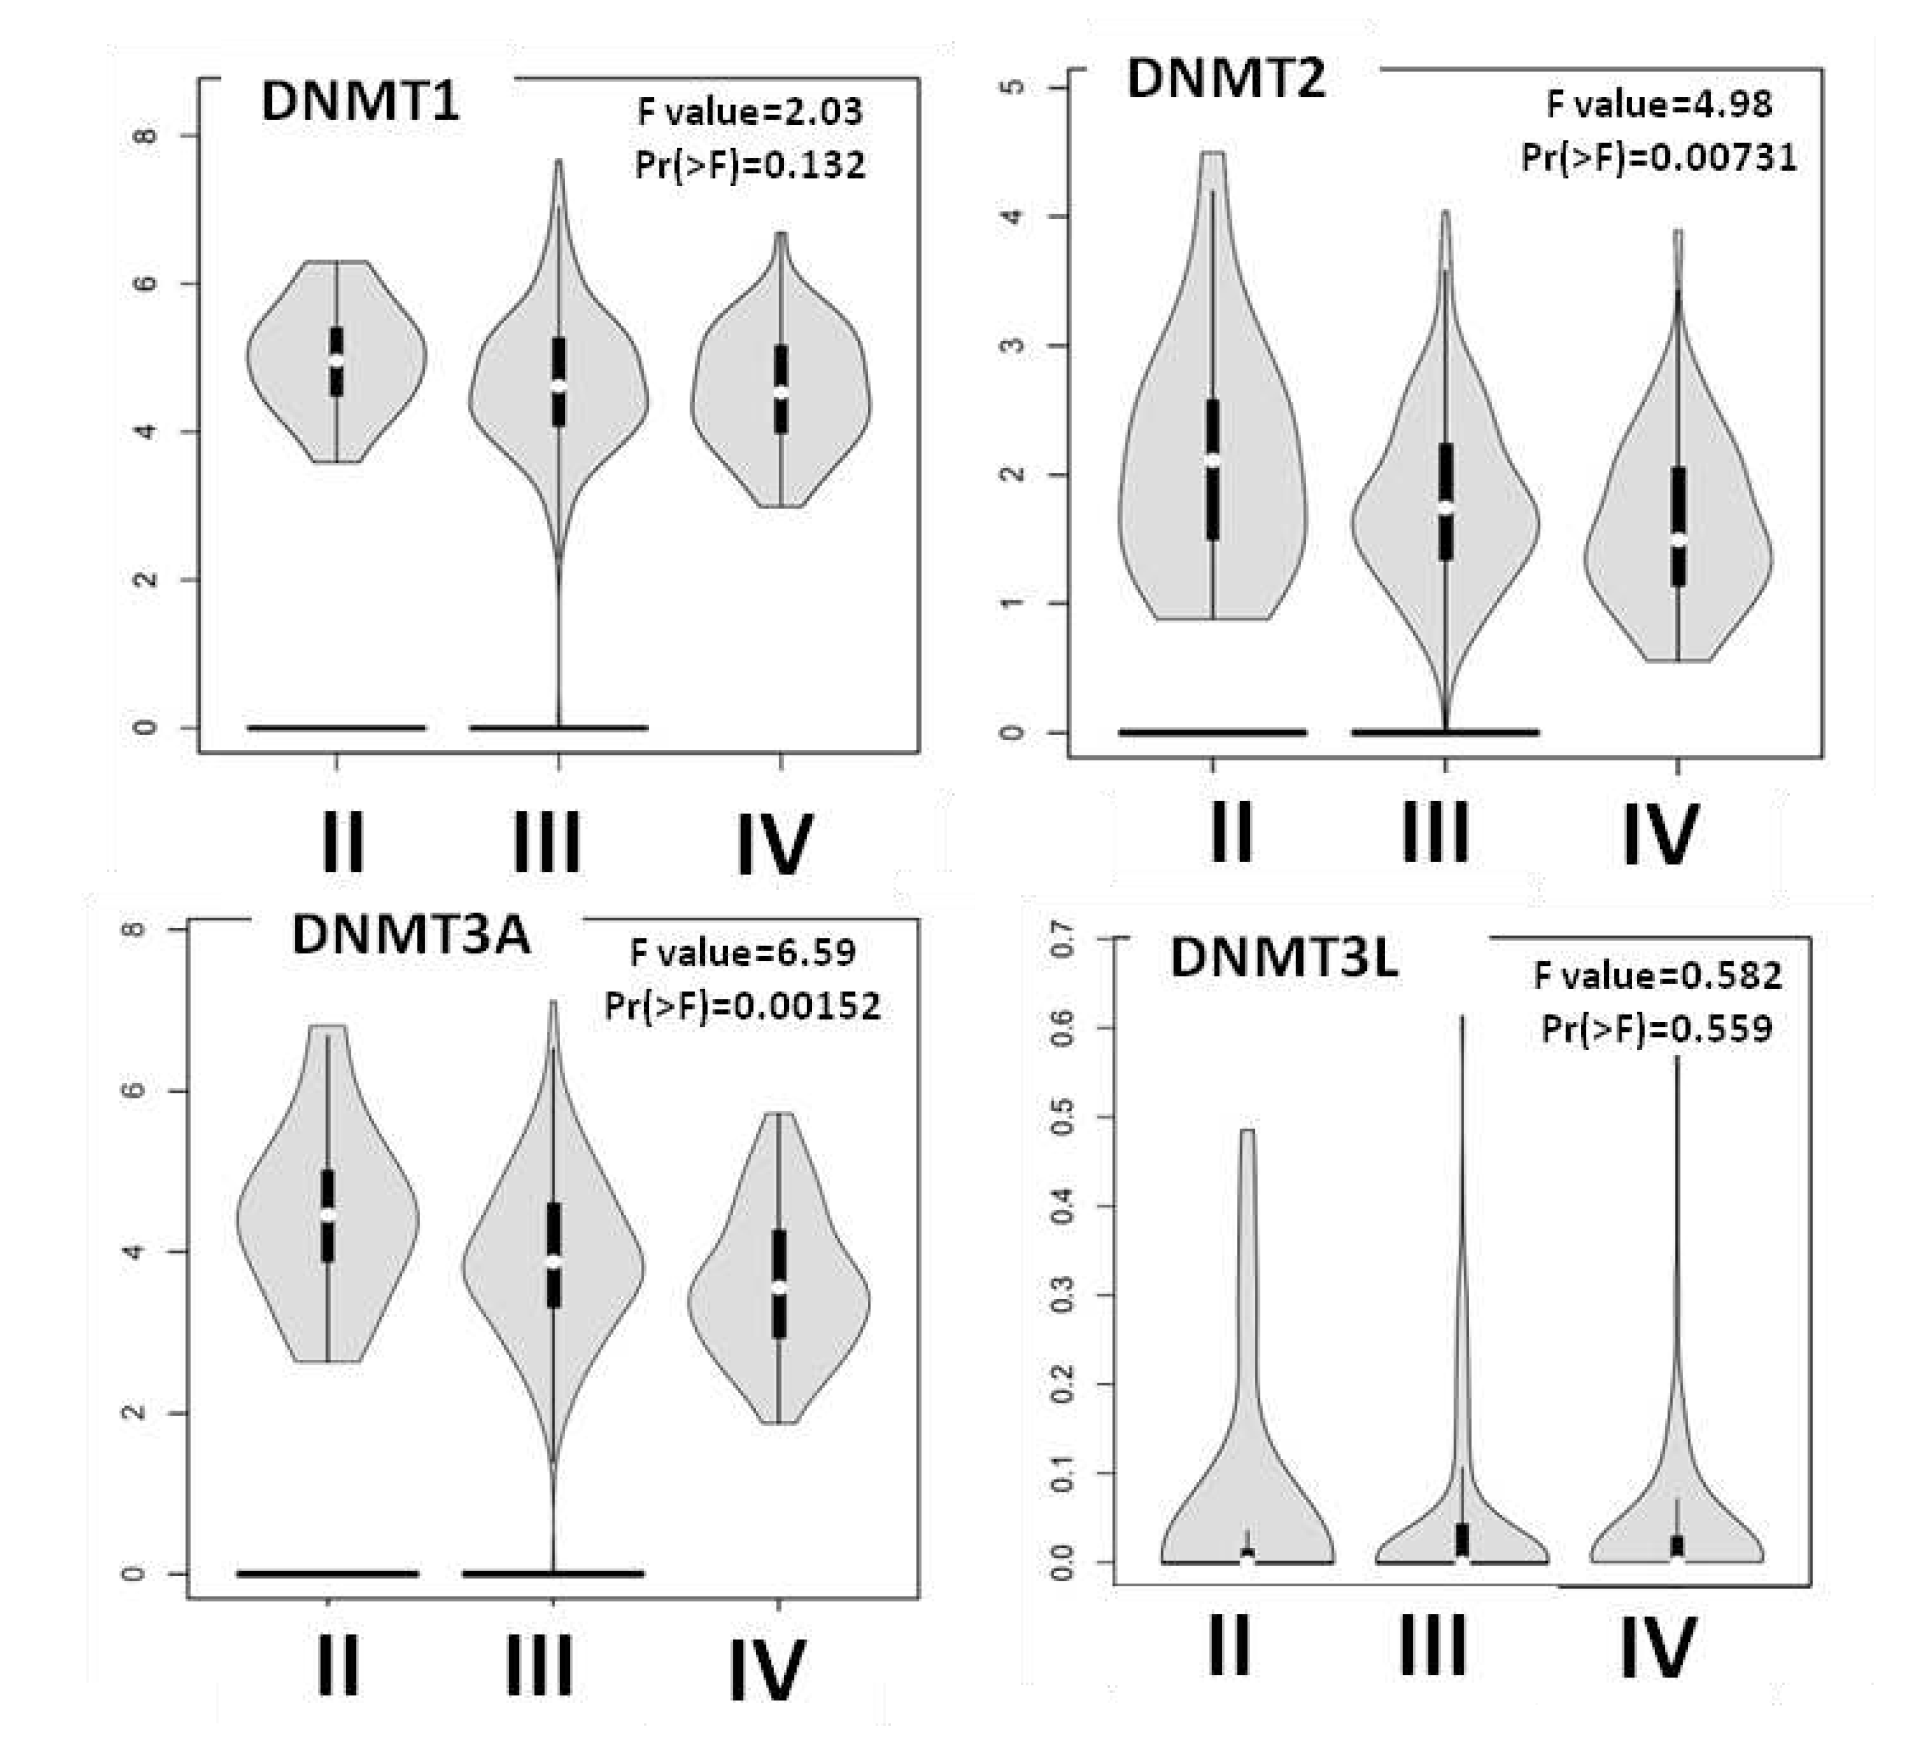
Next, we used the Gepia2 and TCGA databases to explore the correlation between individual DNMTs and stage progression (Figure 4). Gepia2 analysis revealed that DNMT3A and DNMT2 levels decreased from Stage II to Stage IV (p=0.00152 and p=0.00731 respectively). In agreement with this result, statistical analysis of the TCGA data showed higher expression of DNMT3A in Stage II tumors compared to Stage IV ones (p=0,00152). Νo correlation between either DNMT1 or DNMT3L Mrna expression and clinical stage was detected in both platforms. Gepia2 did not include data on the stage-specific expression of DNMT3B.

3.3. DNMTs expression correlates with patients’ prognosis.

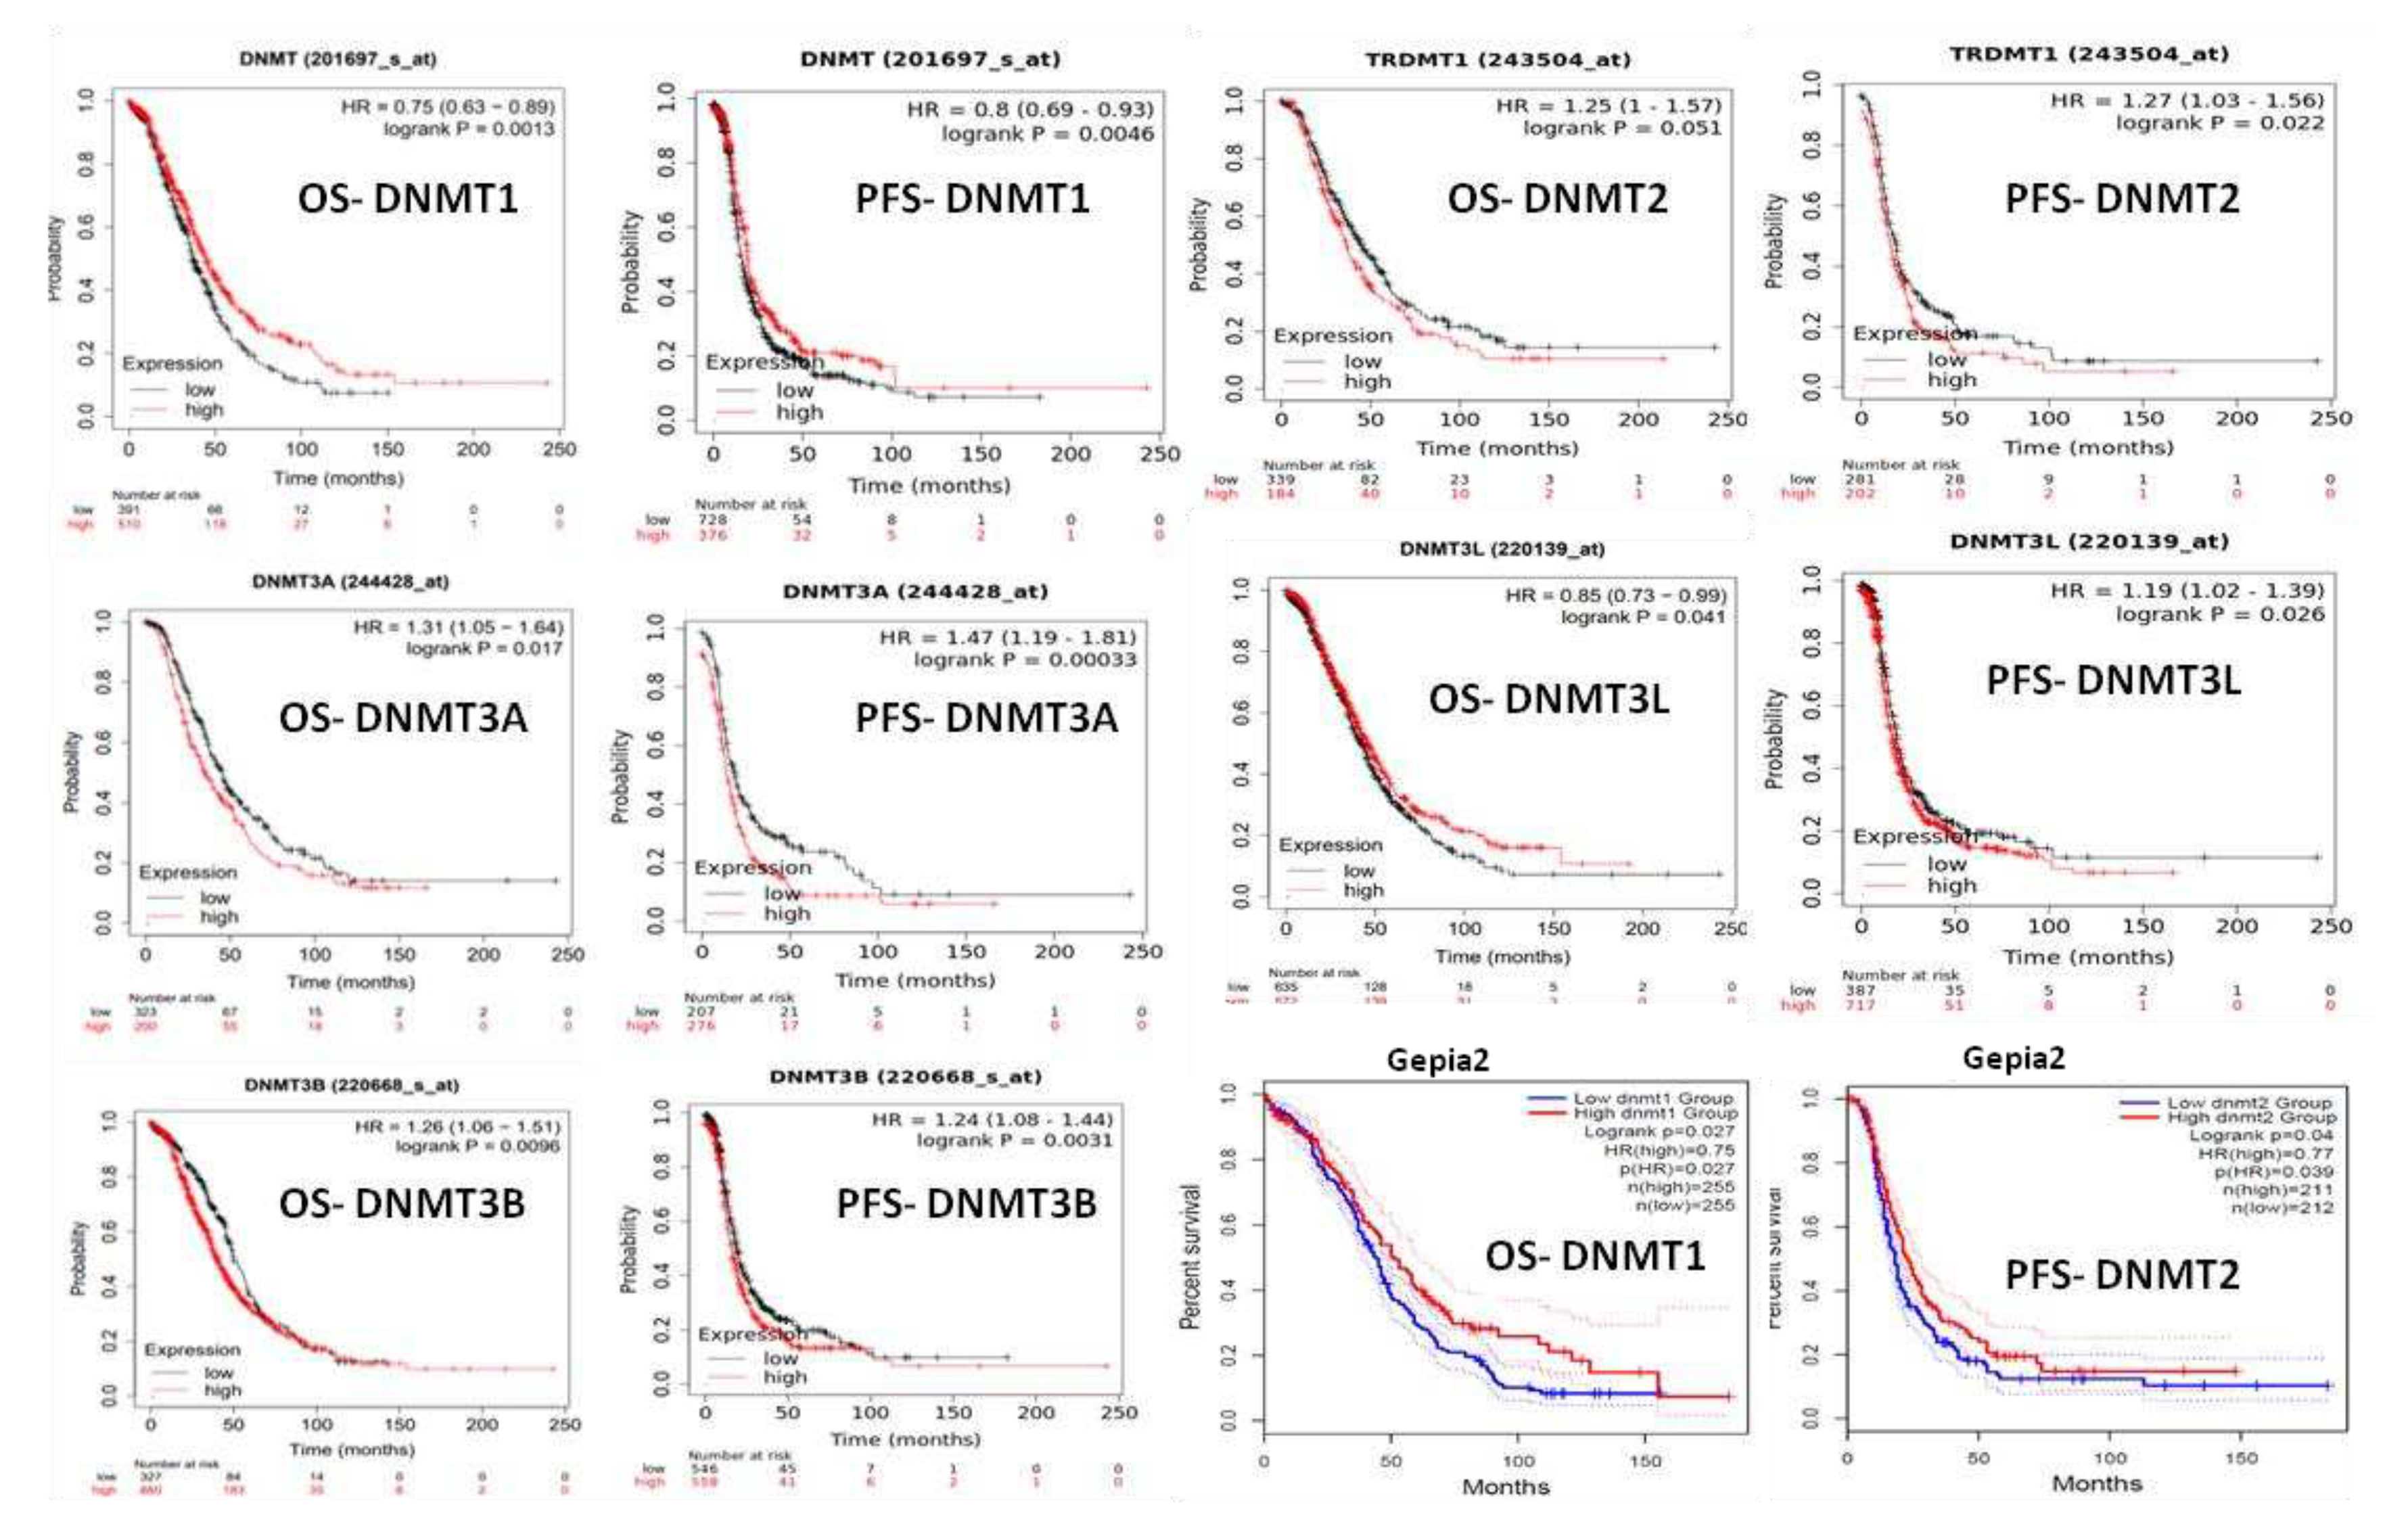
KM plotter curves demonstrated that high mRNA levels of DNMT1, were associated with better OS and PFS survival (p=0,013 and p=0,0046 respectively) (Figure 5). On the contrary, high mRNA levels of DNMT3A and DNMT3B were correlated with worse OS (p=0,017 and p=0,0096 respectively) and PFS (p=0,00033 and p=0,0031 respectively) (Figure 5). DNMT2 mRNA expression was also associated with marginally worse OS and PFS survival (p=0,051 and p=0,022 respectively) (Figure 5). DNMT3L mRNA levels showed ambiguous results as they were associated with better OS (p=0,041) but worse PFS (p=0,026) (Figure 5).
Gepia 2 survival plots confirmed the association of DNMT1 mRNA overexpression with favorable overall survival (p=0,027) (Figure 5). Also, the DNMT2/TRDMT1 was associated with poor DFS (p=0,04) but not OS. Νo statistical correlations were found between the other DNMTs mRNA levels and patients’ prognosis.

3.4. Expression of DNMTs in a Cohort of EOC Patients

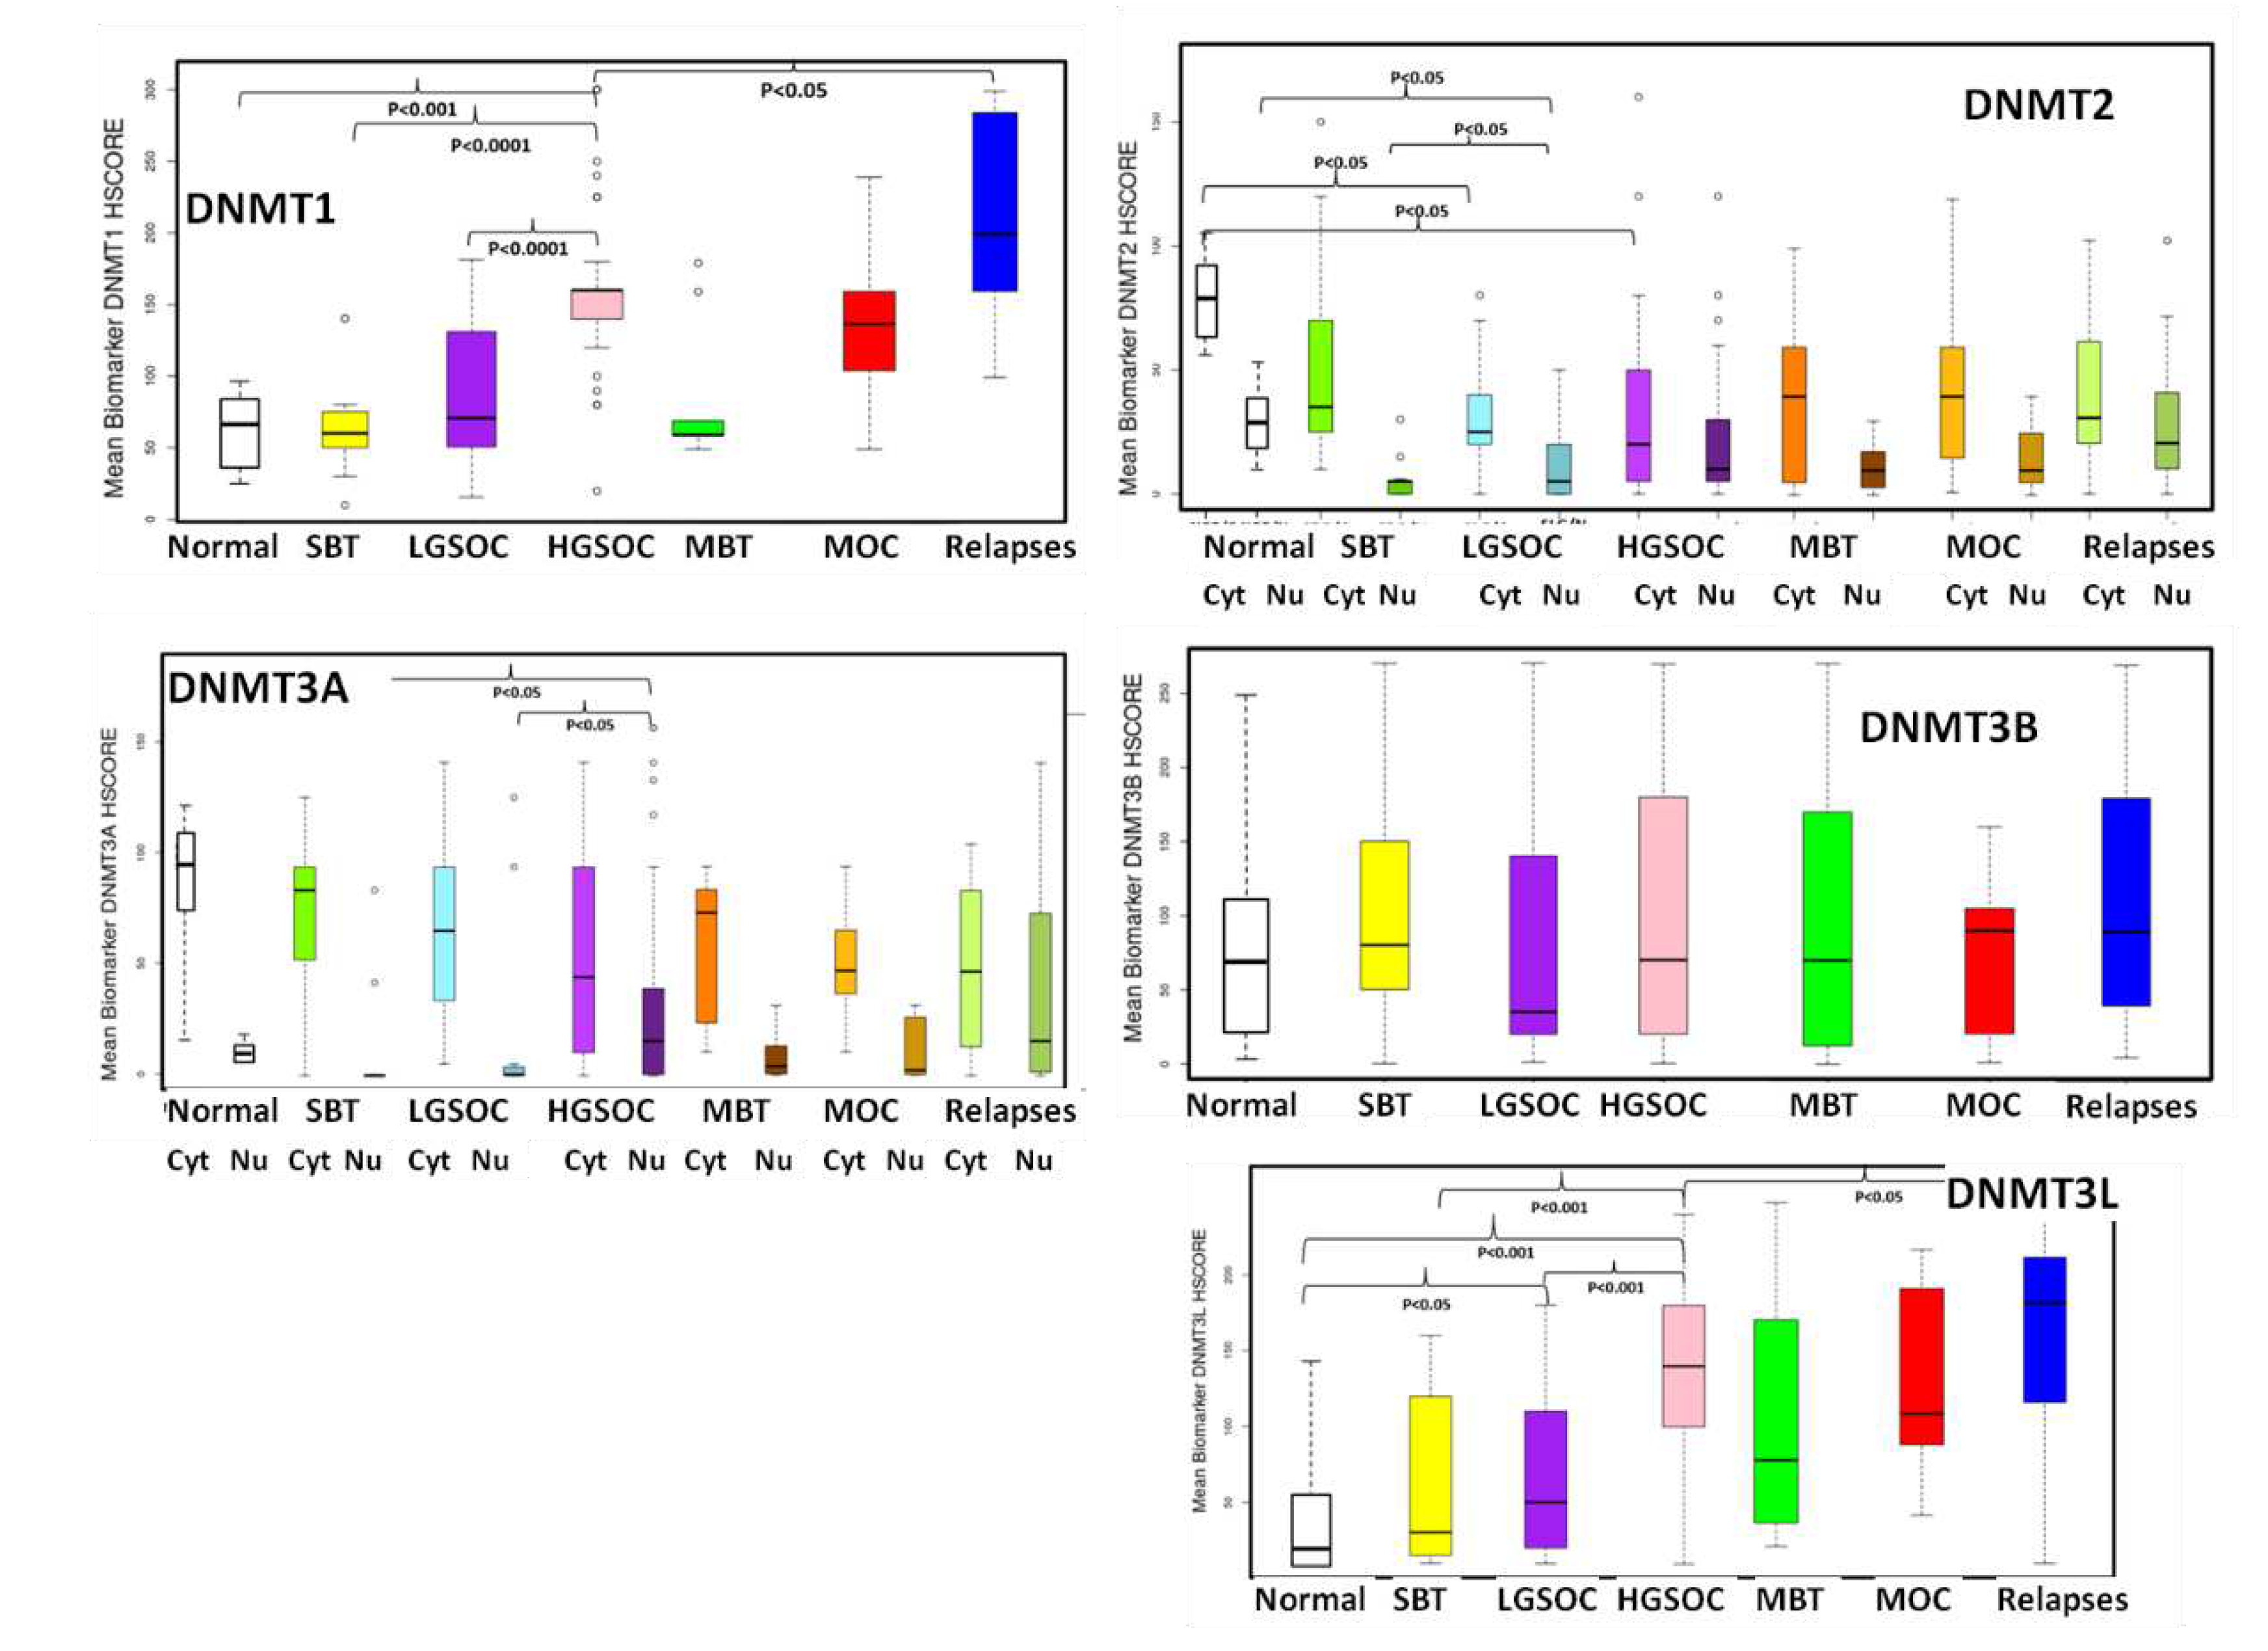
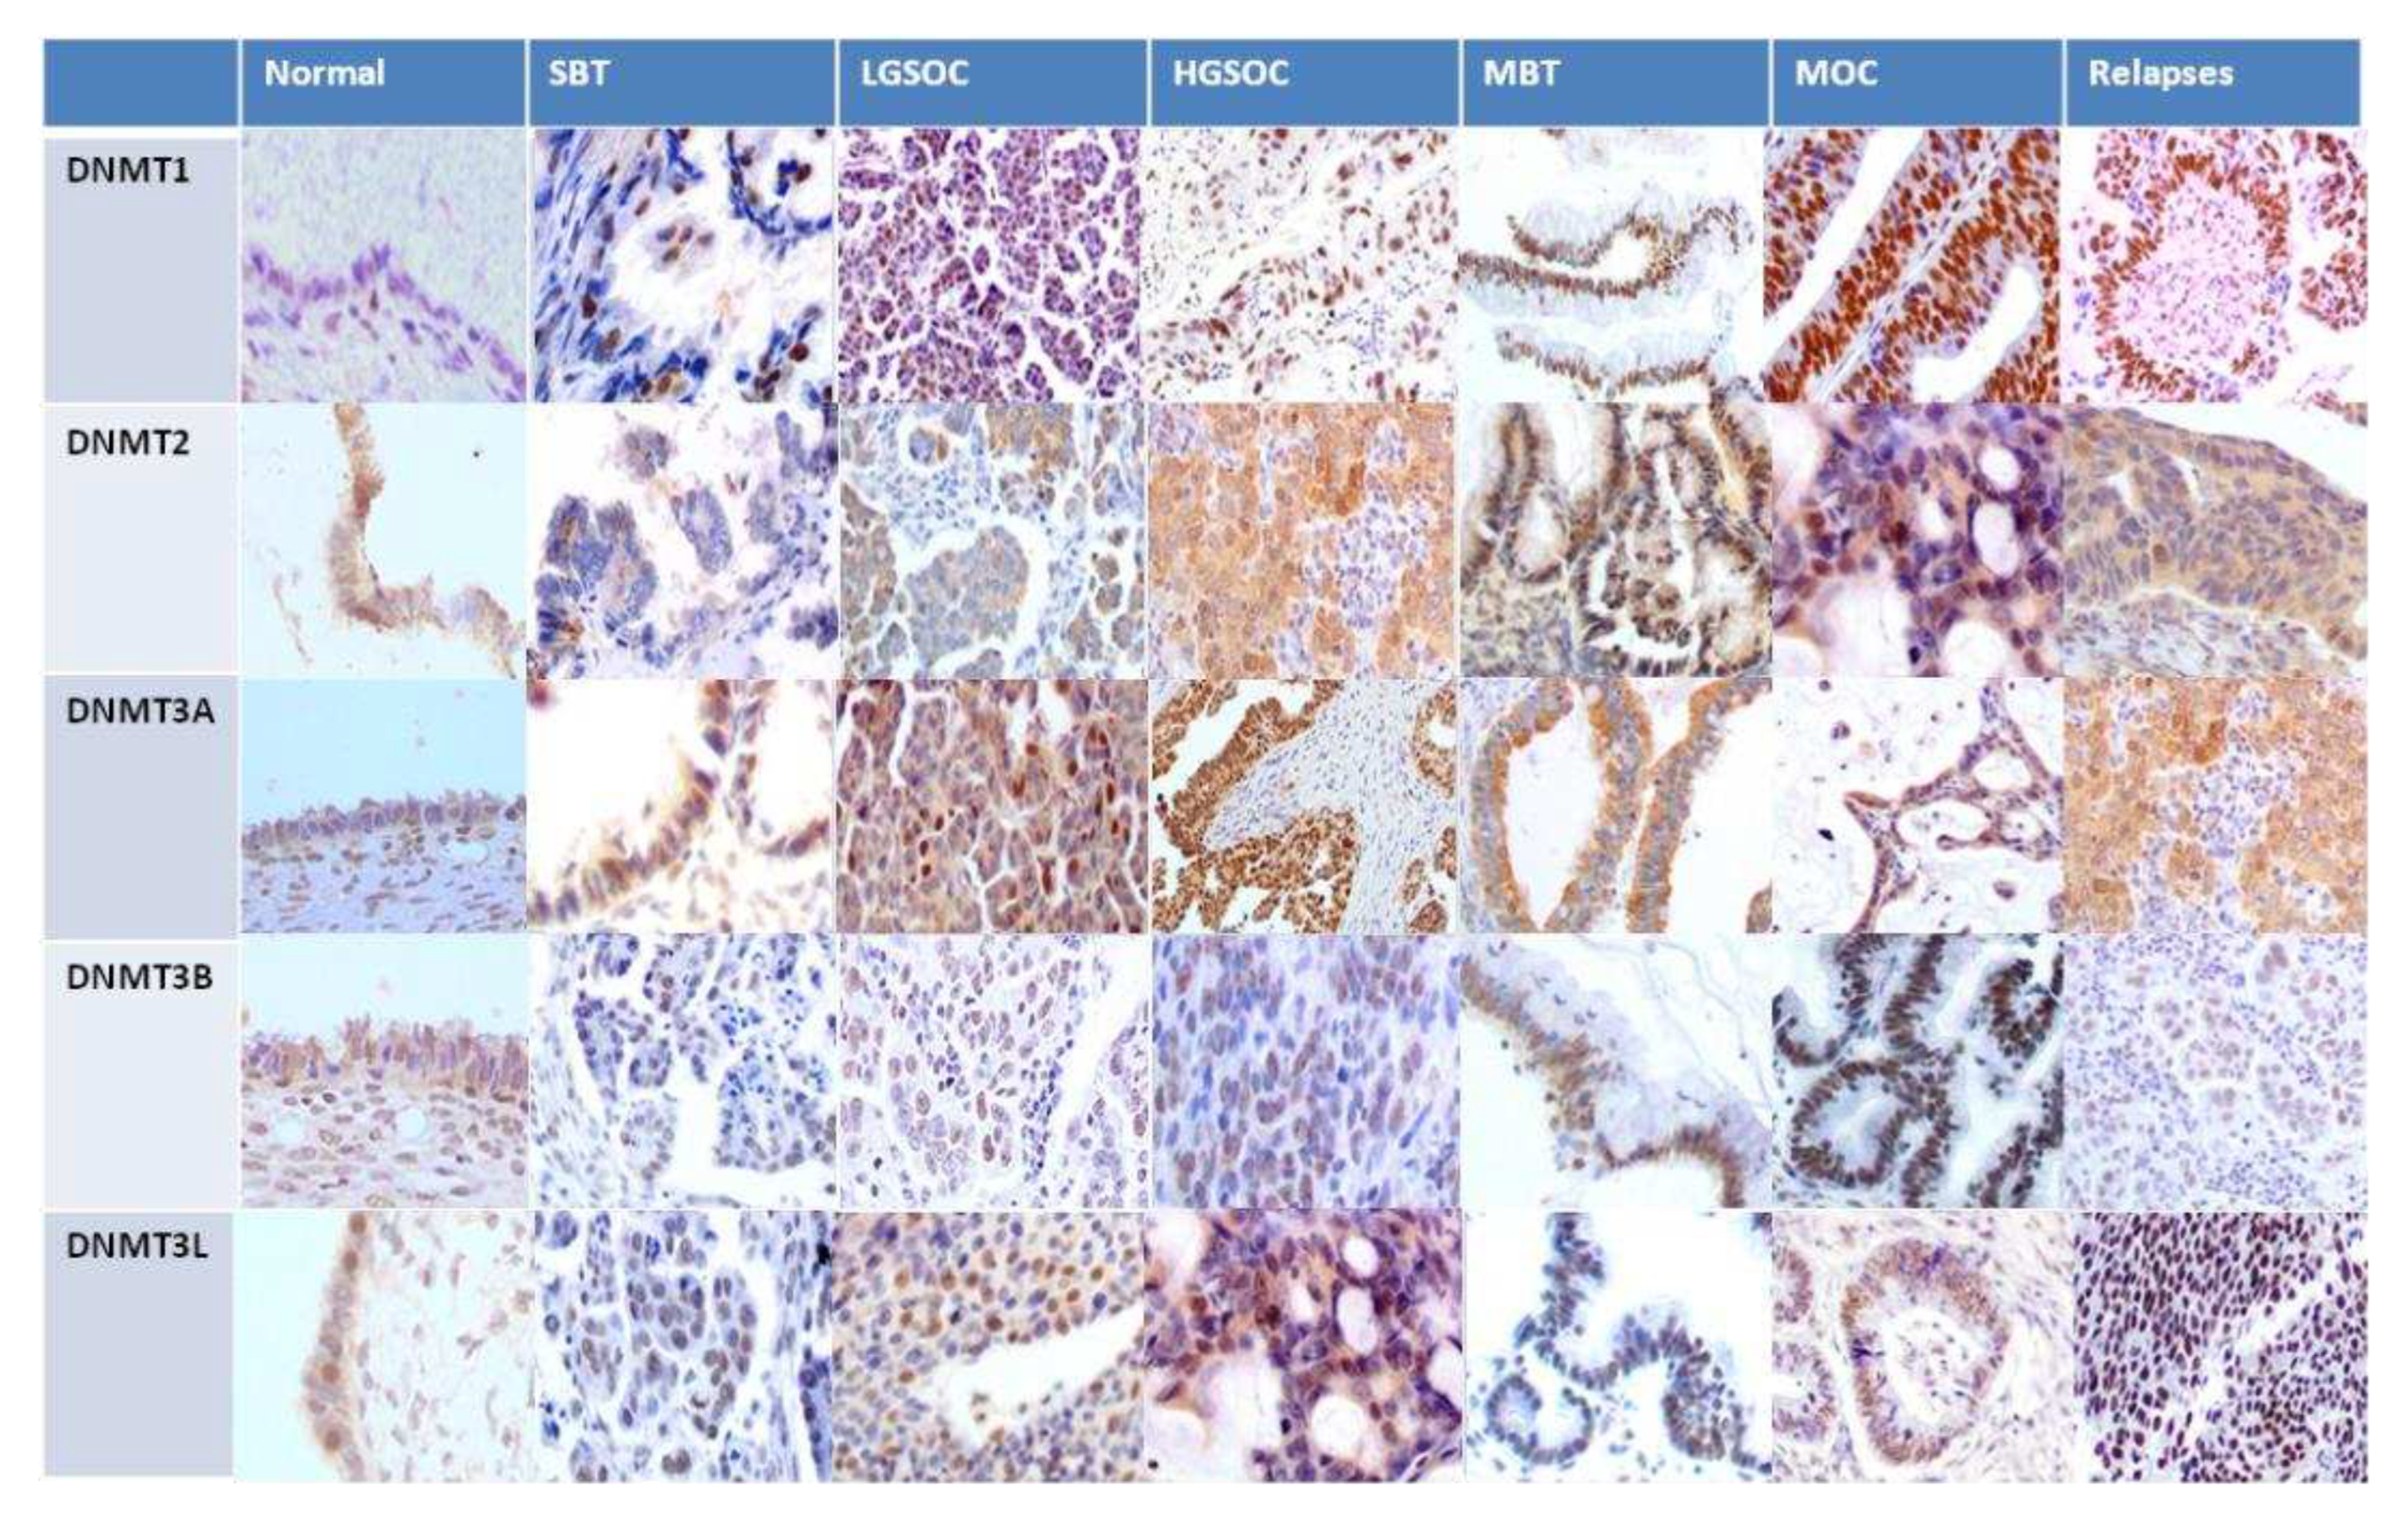
In order to validate the results of the publicly available database analyses we performed immunohistochemical evaluation of DNMTs protein expression in 108 tissue samples from patients with ovarian serous and mucinous tumors. Both the tumor and the non-neoplastic ovarian surface epithelium were evaluated. DNMT1, DNMT3B and DNMT3L demonstrated nuclear staining, whereas DNMT2 and DNMT3A exhibited nuclear and cytoplasmic staining. Table 3 and Table 4 summarize the mean expression of the markers in primary and relapsed tumors and in correlation with histologic type, and FIGO tumor stage. Box-plot graphical illustration of DNMTs expression in the various histologic types is shown in Figure 6. Representative images from tissue sections are shown in Figure 7.
Statistical analysis, generally in line with the results of the publicly available datasets, showed that nuclear expression of DNMT1 was highly elevated in HGSOC compared to non-neoplastic ovarian epithelial cells, SBT and LGSOC (p=0.04 p<0.001 and p<0.001 respectively) (Table 3, Figure 6). Similarly, DNMT2 nuclear expression was reduced in SBT and LGSOC (p=0.03) and cytoplasmic expression was lower in LGSOC and HGSOC compared to non-neoplastic tissue (p=0.045) (Table 3, Figure 6 and Figure 7). Nuclear DNMT3A expression was significantly upregulated in HGSOC tumors in comparison with non-neoplastic tissue, SBT and LGSOC (p=0.02) (Table 4, Figure 6 and Figure 7). Μοreover, DNMT3L expression protein was increased in HGSOC and LGSOC compared with non-neoplastic tissue (p<0.001 and p<0.005 respectively) and in HGSOC compared with LGSOC (p<0.001) and SBT (p<0.001) (Table 4, Figure 6 and Figure 7).
Like serous carcinomas, mucinous carcinomas also displayed higher expression of DNMT1 and DNMT3L in comparison with non-neoplastic tissues (p=0,042 and p=0,045 respectively) (Table 3 and Table 4, Figure 6 and Figure 7).
Relapses demonstrated significantly elevated DNMT1 and DNMT3L protein expression compared to the corresponding primary HGSOC (p=0.02 and p=0,032 respectively) (Table 3 and Table 4, Figure 6 and Figure 9).
As far as DNMT3B is concerned, no statistically significant alteration was found between its expression and histological type or in relapses vs. primary tumors (Table 3, Figure 8). Νo statistical difference was observed in DNMTs expression according to FIGO stages (Table 3 and Table 4).

4. Discussion

In the present study we systematically retrieved data regarding the mRNA and protein expression of DNMT1, 2, 3A, 3B and 3L in epithelial ovarian carcinoma samples from interactive web applications such as TNMplot, GEPIA2, Kaplan-Meier Plotter and Proteomic data commons. We performed differential gene expression analyses between tumor and normal samples and correlation of mRNA expression levels with FIGO Stage. Then, we investigated the correlation of DNMTs’ expression with patients’ prognosis. Finally, using immunohistochemistry, we evaluated DNMTs’ protein expression in 108 tissue samples from patients with primary and relapsed ovarian tumors and correlated with normal tissues and histological subtypes. Ιt should be noted that the expression of DNMT2 and DNMT3L proteins in ovarian carcinomas by immunohistochemistry has not been reported in the literature before.
Our results showed that DNMT1 expression was elevated from non-neoplastic to tumor tissue, at the mRNA and protein level, further increased with grade progression and in tumor relapses, and its phosphorylation levels were also increased in carcinomas. DNMT3A levels increased from non-neoplastic to tumor tissue at both the mRNA and protein level, with further increase with increasing the grade of the tumors, albeit its levels were lower in higher stage and in metastatic tumors. DNMT3B expression was increased at the mRNA level from non-neoplastic to tumor tissue and was decreased in the metastases compared to primary foci but no difference was noted at the protein level. DNMT3L was increased in the primary tumors compared to non-neoplastic tissue at the mRNA and protein level and was further increased in relapses. In contrast to the other DNMTs DNMT2 levels seemed to decrease from non-neoplastic to tumor tissue at the mRNA and protein level and further decrease with stage progression. To the best of our knowledge this is the first study to have addressed the differential expression of DNMTs according to the histology of OEC, and between primary and relapsed tumors at the protein and cellular/sucellular level by immunohistochemistry. This is important as we and others [40,41] have shown that mRNA levels do not always correlate with protein levels, which is attributed to translational regulation, differences in protein in vivo half-lives, and differences in experimental conditions [42]. In addition, using immunohistochemistry, the specific cellular and subcellular expression of the markers was assessed, a feature that PCR and RNA sequencing techniques can not address [43,44].
Previous studies have shown that DNMTs expression is upregulated in various malignancies (colon, prostate, breast, liver, leukemia) [45,46] and that their expression is associated with aggressive pathologic characteristics [46,47]. Results regarding the expression of DNMTs in ovarian tumors in the literature are equivocal. This is probably a result of the different patient populations studied and the different methodologies used. In addition, as we have shown in this study and reviewed here [48], DNMT expression depends on OEC histologic subtype.
One of the first studies of DNMT expression in ovarian tumors used cancer cell lines and showed increased expression of DNMT1, and DNMT3B, but not DNMT3A mRNA levels in ovarian cancer cell lines compared to normal ovarian surface epithelial cells [49]. In patients samples, and similarly to our results, DNMT3A protein, was found to be elevated in ovarian cancer tissues compared to normal ovary tissues [50]. Importantly, and in agreement with our results, protein and mRNA levels did not correlate with each other [50]. Another study showed significantly lower expression of DNMT3A1 and DNMT2 mRNAs, the latter in agreement with our results, but higher expression of DNMT3B1/B2 mRNA isoforms in carcinomas than in low malignant potential tumors and that DNMT3B1/3B2 mRNA levels were associated with the methylation status of CDH13, MLH-M2B, SEZ6L and MINT31-M1B [37]. In accordance with this, using qPCR in 63 ovarian cancer patient samples, DNMT3B1 and DNMT3B3 overexpression was seen in advanced stages and high-grade serous carcinomas [51]. More recently, the expression of DNMT1, DNMT3A, and DNMT3B was examined by immunohistochemistry in ovarian cancers and benign tumors. The data showed higher DNMT3A and lower DNMT3B protein expression in ovarian cancers compared to that of the benign tumors whereas DNMT1 expression showed no difference [35]. In contrast, using qRT-PCR and immunohistochemistry, DNMT1 and DNMT3B expression was shown to be elevated in carcinomas compared to non-neoplastic tissue and further enhanced in higher stage carcinomas [52].
Taken together and in accordance with our findings, there is abundant evidence in the literature of aberrant expression of DNMTs in ovarian carcinomas compared to non-neoplastic cells or benign tumors, with further deregulation in high grade ovarian carcinomas and in metastases/relapses. Considering our comprehensive analysis of DNMTs expression across the progression of OEC, we hypothesize that DNMT1 and DNTM3A seem to play a role in tumor initiation, DNMT3B in tumor progression and DNMT3L in tumor relapse whereas DNMT2 may have an opposite role, acting as a tumor-suppressor gene. This stage specific role of distinct DNMTs has been accounted for the progression of other neoplasms like prostate carcinomas [46,53]. In addition, others have hypothesized a similar carcinogenesis model in which DNMT3A and DNMT3B are specifically recruited during tumor initiation and promotion, with subsequent downregulation of their expression, whereas DNMT1 is involved in tumor progression [54]. These findings support the notion that alterations in DNMT expression might contribute to the development and progression of high-grade ovarian carcinomas i.e., through the establishment of a CpG Island methylator phenotype in ovarian cancer.
We, also, examined the association of DNMTs expression with patient’s survival and showed that DNMT3A, DNMT3B and DNMT2 mRNA levels were correlated with bad prognosis and DNMT1 expression with favorable prognosis. The correlation of DNMTs with prognosis is ambiguous and seems to be cancer specific. Some studies have shown that DNMTs levels are associated with an ominous prognosis [47], while others have found that the expression of these molecules, in particular DNMT3A, is associated with good prognosis [27,47]. Regarding ovarian carcinoma, the literature regarding the prognostic role of DNMTs expression is rather sparse. Using immunohistochemistry, Bai et al showed that expression of DNMT1 and DNMT3B were marginally associated with better overall survival [35], the first in agreement with our results. The combined expression of both markers had a better statistical correlation [35]. Analysis of DNMT3B isoforms expression using qPCR in 63 OEC showed that DNMT3B1 and DNMT3B3 overexpression was associated with poor prognosis [51]. This agrees with our results, albeit we did not specifically analyze the different isoforms of the molecule. Similarly, in agreement with our findings, DNMT3A has been found to be associated with poor prognosis [50]. Taken together, these findings show that DNMT1, DNMT3A and DNMT3B may have a prognostic role in OEC. Further studies, with a higher number of patients and a combination of techniques will be needed to validate this hypothesis.
Regarding DNMT1, an interesting finding was that the phosphorylation levels at s154 were increased in tumors compared to normal tissues. In Human Mammary Epithelial Cells it has been shown that the elevated DNMT1 protein levels are not a result of increased mRNA levels, but rather an increase in protein half-life, due to the deleted destruction domain which is required for its proper ubiquitination and degradation [55]. It has also been suggested that phosphorylation on Ser154 by cyclin-dependent kinases may play a role in controlling DNMT1 activity and protein stability, leading to increased DNMT1 activity [56]. Thus, our findings highlight protein phosphorylation as one of the mechanisms of DNMT1 overexpression in OEC.
DNMT3L is involved in DNMT3A function as it forms a complex with DNMT3A2 and prevents DNMT3A2 from being degraded. Restoring the DNMT3A protein level in DNMT3L-deficient embryonal stem cells (ESC) partially recovers DNA methylation [57]. DNMT3L is expressed in ESC and downregulated in differentiated embryonal cells, thus, being associated with pluripotency [58]. The available data regarding DNMT3L mRNA and protein expression in different cancer subtypes is very limited. Overexpressiοn of DNMT3L protein has been shown in embryonal carcinoma, but not in the other types of testicular germ cell tumors [59]. It has, also been shown to be overexpressed in prostate carcinomas, especially high grade ones [46]. Expression in OEC has not been studied before. Ιn our study we observed overexpression of DNMT3L protein in high grade carcinomas compared to low grade tumors and non-neoplastic epithelium and in relapses compared to primary neoplasms. Further study of the role of DNMT3L in de novo DNA methylation in ovarian tumors is warranted.
DNMT2 (TRDMT1) is actually an aspartic acid tRNA methyltransferase, with weak, if any, DNA methyltransferase activity [26]. DNMT2 mutations have been reported in human tumors and are associated with alterations of its methylation activity [60]. DNMT2 upregulation has been reported in GIST [61], glioma [62], prostate carcinoma [46] and clear cell renal cell carcinoma [63]. Its expression in OEC has not been studied before. In the present study we showed both cytoplasmic and nuclear expression of DNMT2/TRDMT1 as has been reported previously [26,46]. It is reasonable and expected that a cytosine-5 methyltransferase such as DNMT2, with activity towards both DNA and RNA, would function in both cellular compartments. Database analysis showed that DNMT2 was decreased in carcinomas compared to non-neoplastic tissue. We also noticed that both cytoplasmic and nuclear DNMT2 expression gradually decreased from borderline to high grade serous tumors, although it did not reach a statistically significant level. It has previously been reported that DNMT2/TRDMT1 is required for efficient homologous recombination and that loss of its function makes the cells sensitive to PARP inhibitors [64]. This observation is of particular importance in ovarian cancer patients where homologous recombination deficiency (HRD) and PARP inhibitor therapy is the treatment of choice for at least half of the patients with high grade serous ovarian tumors. Analysis of DNMT2 expression in ovarian cancer could contribute to the selection of patients as candidates for PARP inhibitor therapy.
Even though a straight link between hypermethylation of specific genes that contribute to carcinogenesis and overexpression of DNMTs has not been proven, DNMTs have been correlated with tumor progression and patients’ prognosis, and therefore, they may represent potential prognostic biomarkers and therapeutic targets [37,65]. A recent, very promising, study showed that overexpression of DNMT1 and DNMT3B is highly linked to genome wide hypermethylation profile in prostate cancer and paved the way studying their use in clinical practice in many malignances [66]. DNMT inhibitors (DNMTi) have shown promising results in ovarian cancer in preclinical models by enhancing IFNγ-mediated [67] and type I interferon-mediated inflammatory responses [68]. In addition, DNMTi seem to work synergistically with other therapies. Administration of DNMTis seems to enhance sensitivity to platinum treatment [69], immunotherapy [70] and PARP inhibition [71].

5. Conclusions

In conclusion, our study demonstrated altered expression of DNMTs in epithelial ovarian cancer and differential expression of individual DNMTs during cancer progression. Namely, we hypothesize that DNMT1 and DNTM3A seem to play a role in tumor initiation, DNMT3B in tumor progression and DNMT3L in tumor relapse, whereas DNMT2 may have an opposite role. We hope that these data might be translated into future therapeutic approaches as biomarker expression is of outmost importance for developing treatment strategies. Nevertheless, future studies are needed to further validate the role and prognostic significance of DNMTs alteration in ovarian cancer.

Author Contributions

Conceptualization, E.P. and V.T.; methodology, E.P., I.P. and V.T.; software, E.P. and I.P.; validation, E.P., I.P. and V.T.; formal analysis, E.P.; investigation, E.P.; resources, G.A., G.Ad, I.M. and V.T.; data curation, E.P and V.T.; writing—original draft preparation, E.P and V.T.; writing—review and editing, E.P., I.P., G.A., G.Ad, I.M. and V.T. X.X.; visualization, E.P. an V.T.; supervision, V.T.; project administration, V.T.; funding acquisition, V.T. All authors have read and agreed to the published version of the manuscript.” Please turn to the CRediT taxonomy for the term explanation. Authorship must be limited to those who have contributed substantially to the work reported.

Funding

This research was funded by the Research Committee of the University of Patras via “K. Karatheodori” program a grant (N: 56570000).

Institutional Review Board Statement

“The study was conducted in accordance with the Declaration of Helsinki and approved by the Ethical Committee of the University Hospital of Patras (# 127/09.03.2021).

Informed Consent Statement

Patient consent was waived due to the retrospective nature of the study.

Data Availability Statement

Data will be available upon reasonable requests.

Acknowledgments

The authors would like to thank Souzana Logotheti, University of Patras and Maria Roumelioti, University Hospital of Patras for their assistance with immunohistochemistry.

Conflicts of Interest

The authors declare no conflict of interest.

References

  1. Cabasag, C.J.; Fagan, P.J.; Ferlay, J.; Vignat, J.; Laversanne, M.; Liu, L.; van der Aa, M.A.; Bray, F.; Soerjomataram, I. Ovarian cancer today and tomorrow: A global assessment by world region and Human Development Index using <scp>GLOBOCAN</scp> 2020. Int. J. Cancer 2022, 151, 1535–1541. [Google Scholar] [CrossRef]
  2. Lheureux, S.; Gourley, C.; Vergote, I.; Oza, A.M. Epithelial ovarian cancer. Lancet 2019, 393, 1240–1253. [Google Scholar] [CrossRef] [PubMed]
  3. La Vecchia, C. Ovarian cancer: epidemiology and risk factors. Eur. J. Cancer Prev. 2017, 26, 55–62. [Google Scholar] [CrossRef] [PubMed]
  4. Romero, I.; Leskelä, S.; Mies, B.P.; Velasco, A.P.; Palacios, J. Morphological and molecular heterogeneity of epithelial ovarian cancer: Therapeutic implications. Eur. J. Cancer Suppl. 2020, 15, 1–15. [Google Scholar] [CrossRef] [PubMed]
  5. Jasen, P. From the “Silent Killer” to the “Whispering Disease”: Ovarian Cancer and the Uses of Metaphor. Med. Hist. 2009, 53, 489–512. [Google Scholar] [CrossRef]
  6. Hatano, Y.; Hatano, K.; Tamada, M.; Morishige, K.; Tomita, H.; Yanai, H.; Hara, A. A Comprehensive Review of Ovarian Serous Carcinoma. Adv. Anat. Pathol. 2019, 26, 329–339. [Google Scholar] [CrossRef] [PubMed]
  7. Ramus, S.J.; Gayther, S.A. The Contribution of BRCA1 and BRCA2 to Ovarian Cancer. Mol. Oncol. 2009, 3, 138–150. [Google Scholar] [CrossRef]
  8. Quesada, S.; Fabbro, M.; Solassol, J. Toward More Comprehensive Homologous Recombination Deficiency Assays in Ovarian Cancer, Part 1: Technical Considerations. Cancers (Basel). 2022, 14, 1132. [Google Scholar] [CrossRef]
  9. Cole, A.J.; Dwight, T.; Gill, A.J.; Dickson, K.-A.; Zhu, Y.; Clarkson, A.; Gard, G.B.; Maidens, J.; Valmadre, S.; Clifton-Bligh, R.; et al. Assessing mutant p53 in primary high-grade serous ovarian cancer using immunohistochemistry and massively parallel sequencing. Sci. Rep. 2016, 6, 26191. [Google Scholar] [CrossRef]
  10. Lapke, N.; Chen, C.-H.; Chang, T.-C.; Chao, A.; Lu, Y.-J.; Lai, C.-H.; Tan, K.T.; Chen, H.-C.; Lu, H.-Y.; Chen, S.-J. Genetic alterations and their therapeutic implications in epithelial ovarian cancer. BMC Cancer 2021, 21, 499. [Google Scholar] [CrossRef]
  11. Ricciardi, E.; Baert, T.; Ataseven, B.; Heitz, F.; Prader, S.; Bommert, M.; Schneider, S.; du Bois, A.; Harter, P. Low-grade Serous Ovarian Carcinoma. Geburtshilfe Frauenheilkd. 2018, 78, 972–976. [Google Scholar] [CrossRef] [PubMed]
  12. Nonomura, Y.; Nakayama, K.; Nakamura, K.; Razia, S.; Yamashita, H.; Ishibashi, T.; Ishikawa, M.; Sato, S.; Nakayama, S.; Otsuki, Y.; et al. Ovarian Endometrioid and Clear Cell Carcinomas with Low Prevalence of Microsatellite Instability: A Unique Subset of Ovarian Carcinomas Could Benefit from Combination Therapy with Immune Checkpoint Inhibitors and Other Anticancer Agents. Healthcare 2022, 10, 694. [Google Scholar] [CrossRef] [PubMed]
  13. Lisio, M.-A.; Fu, L.; Goyeneche, A.; Gao, Z.; Telleria, C. High-Grade Serous Ovarian Cancer: Basic Sciences, Clinical and Therapeutic Standpoints. Int. J. Mol. Sci. 2019, 20, 952. [Google Scholar] [CrossRef] [PubMed]
  14. Matulonis, U.A.; Sood, A.K.; Fallowfield, L.; Howitt, B.E.; Sehouli, J.; Karlan, B.Y. Ovarian cancer. Nat. Rev. Dis. Prim. 2016, 2, 16061. [Google Scholar] [CrossRef] [PubMed]
  15. Yang, Q.; Yang, Y.; Zhou, N.; Tang, K.; Lau, W.B.; Lau, B.; Wang, W.; Xu, L.; Yang, Z.; Huang, S.; et al. Epigenetics in ovarian cancer: premise, properties, and perspectives. Mol. Cancer 2018, 17, 109. [Google Scholar] [CrossRef]
  16. Sharma, S.; Kelly, T.K.; Jones, P.A. Epigenetics in cancer. Carcinogenesis 2010, 31, 27–36. [Google Scholar] [CrossRef]
  17. Jin, B.; Li, Y.; Robertson, K.D. DNA Methylation: Superior or Subordinate in the Epigenetic Hierarchy? Genes Cancer 2011, 2, 607–617. [Google Scholar] [CrossRef]
  18. Moore, L.D.; Le, T.; Fan, G. DNA Methylation and Its Basic Function. Neuropsychopharmacology 2013, 38, 23–38. [Google Scholar] [CrossRef]
  19. Jones, P.A.; Taylor, S.M.; Wilson, V.L. Inhibition of DNA Methylation by 5-Azacytidine. In Modified Nucleosides and Cancer; Springer Berlin Heidelberg: Berlin, Heidelberg, 1983; pp. 202–211. [Google Scholar]
  20. Feinberg, A.P.; Vogelstein, B. Hypomethylation distinguishes genes of some human cancers from their normal counterparts. Nature 1983, 301, 89–92. [Google Scholar] [CrossRef]
  21. Ehrlich, M. DNA hypomethylation in cancer cells. Epigenomics 2009, 1, 239–259. [Google Scholar] [CrossRef]
  22. Rodriguez, J.; Frigola, J.; Vendrell, E.; Risques, R.-A.; Fraga, M.F.; Morales, C.; Moreno, V.; Esteller, M.; Capellà, G.; Ribas, M.; et al. Chromosomal Instability Correlates with Genome-wide DNA Demethylation in Human Primary Colorectal Cancers. Cancer Res. 2006, 66, 8462–9468. [Google Scholar] [CrossRef]
  23. Costello, J.F.; Frühwald, M.C.; Smiraglia, D.J.; Rush, L.J.; Robertson, G.P.; Gao, X.; Wright, F.A.; Feramisco, J.D.; Peltomäki, P.; Lang, J.C.; et al. Aberrant CpG-island methylation has non-random and tumour-type–specific patterns. Nat. Genet. 2000, 24, 132–138. [Google Scholar] [CrossRef] [PubMed]
  24. Melki, J.R.; Vincent, P.C.; Clark, S.J. Concurrent DNA hypermethylation of multiple genes in acute myeloid leukemia. Cancer Res. 1999, 59, 3730–40. [Google Scholar] [PubMed]
  25. Kanwal, R.; Gupta, K.; Gupta, S. Cancer Epigenetics: An Introduction. In; 2015; pp. 3–25.
  26. Jeltsch, A.; Ehrenhofer-Murray, A.; Jurkowski, T.P.; Lyko, F.; Reuter, G.; Ankri, S.; Nellen, W.; Schaefer, M.; Helm, M. Mechanism and biological role of Dnmt2 in Nucleic Acid Methylation. RNA Biol. 2017, 14, 1108–1123. [Google Scholar] [CrossRef] [PubMed]
  27. Zhang, J.; Yang, C.; Wu, C.; Cui, W.; Wang, L. DNA methyltransferases in cancer: Biology, paradox, aberrations, and targeted therapy. Cancers (Basel). 2020, 12, 1–22. [Google Scholar] [CrossRef] [PubMed]
  28. Cheray, M.; Pacaud, R.; Hervouet, E.; Vallette, F.; Cartron, P.-F. DNMT Inhibitors in Cancer, Current Treatments and Future Promising Approach: Inhibition of Specific DNMT-Including Complexes. Epigenetic Diagnosis Ther. 2015, 1, 37–48. [Google Scholar] [CrossRef]
  29. Blecua, P.; Martinez-Verbo, L.; Esteller, M. The DNA methylation landscape of hematological malignancies: an update. Mol. Oncol. 2020, 14, 1616–1639. [Google Scholar] [CrossRef]
  30. Hu, C.; Liu, X.; Zeng, Y.; Liu, J.; Wu, F. DNA methyltransferase inhibitors combination therapy for the treatment of solid tumor: mechanism and clinical application. Clin. Epigenetics 2021, 13, 166. [Google Scholar] [CrossRef]
  31. Giri, A.K.; Aittokallio, T. DNMT Inhibitors Increase Methylation in the Cancer Genome. Front. Pharmacol. 2019, 10, 385. [Google Scholar] [CrossRef]
  32. Hentze, J.; H�gdall, C.; H�gdall, E. Methylation and ovarian cancer: Can DNA methylation be of diagnostic use? (Review). Mol. Clin. Oncol. 2019. [Google Scholar] [CrossRef]
  33. Reid, B.M.; Fridley, B.L. DNA Methylation in Ovarian Cancer Susceptibility. Cancers (Basel). 2020, 13. [Google Scholar] [CrossRef]
  34. Subramaniam, D.; Thombre, R.; Dhar, A.; Anant, S. DNA Methyltransferases: A Novel Target for Prevention and Therapy. Front. Oncol. 2014, 4, 1–13. [Google Scholar] [CrossRef] [PubMed]
  35. Bai, X.; Song, Z.; Fu, Y.; Yu, Z.; Zhao, L.; Zhao, H.; Yao, W.; Huang, D.; Mi, X.; Wang, E.; et al. Clinicopathological Significance and Prognostic Value of DNA Methyltransferase 1, 3a, and 3b Expressions in Sporadic Epithelial Ovarian Cancer. PLoS One 2012, 7, e40024. [Google Scholar] [CrossRef] [PubMed]
  36. Chen, C.; Yan, X.; Gao, Y.; Liao, Q. [Expression of DNA methyltransferase 1, 3A and 3B mRNA in the epithelial ovarian carcinoma]. Zhonghua Fu Chan Ke Za Zhi 2005, 40, 770–4. [Google Scholar] [PubMed]
  37. Ehrlich, M.; Woods, C.B.; Yu, M.C.; Dubeau, L.; Yang, F.; Campan, M.; Weisenberger, D.J.; Long, T.; Youn, B.; Fiala, E.S.; et al. Quantitative analysis of associations between DNA hypermethylation, hypomethylation, and DNMT RNA levels in ovarian tumors. Oncogene 2006, 25, 2636–2645. [Google Scholar] [CrossRef] [PubMed]
  38. Robinson, M.D.; McCarthy, D.J.; Smyth, G.K. edgeR : a Bioconductor package for differential expression analysis of digital gene expression data. Bioinformatics 2010, 26, 139–140. [Google Scholar] [CrossRef]
  39. Berek, J.S.; Renz, M.; Kehoe, S.; Kumar, L.; Friedlander, M. Cancer of the ovary, fallopian tube, and peritoneum: 2021 update. Int. J. Gynecol. Obstet. 2021, 155, 61–85. [Google Scholar] [CrossRef]
  40. Koussounadis, A.; Langdon, S.P.; Um, I.H.; Harrison, D.J.; Smith, V.A. Relationship between differentially expressed mRNA and mRNA-protein correlations in a xenograft model system. Sci. Rep. 2015, 5, 10775. [Google Scholar] [CrossRef]
  41. Maier, T.; Güell, M.; Serrano, L. Correlation of mRNA and protein in complex biological samples. FEBS Lett. 2009, 583, 3966–3973. [Google Scholar] [CrossRef]
  42. Greenbaum, D.; Colangelo, C.; Williams, K.; Gerstein, M. Comparing protein abundance and mRNA expression levels on a genomic scale. Genome Biol. 2003, 4, 117. [Google Scholar] [CrossRef]
  43. Uhlen, M.; Oksvold, P.; Fagerberg, L.; Lundberg, E.; Jonasson, K.; Forsberg, M.; Zwahlen, M.; Kampf, C.; Wester, K.; Hober, S.; et al. Towards a knowledge-based Human Protein Atlas. Nat. Biotechnol. 2010, 28, 1248–1250. [Google Scholar] [CrossRef] [PubMed]
  44. Fagerberg, L.; Hallström, B.M.; Oksvold, P.; Kampf, C.; Djureinovic, D.; Odeberg, J.; Habuka, M.; Tahmasebpoor, S.; Danielsson, A.; Edlund, K.; et al. Analysis of the Human Tissue-specific Expression by Genome-wide Integration of Transcriptomics and Antibody-based Proteomics. Mol. Cell. Proteomics 2014, 13, 397–406. [Google Scholar] [CrossRef] [PubMed]
  45. Zhang, W.; Xu, J. DNA methyltransferases and their roles in tumorigenesis. Biomark. Res. 2017, 5, 1. [Google Scholar] [CrossRef] [PubMed]
  46. Tzelepi, V.; Logotheti, S.; Efstathiou, E.; Troncoso, P.; Aparicio, A.; Sakellakis, M.; Hoang, A.; Perimenis, P.; Melachrinou, M.; Logothetis, C.; et al. Epigenetics and prostate cancer: defining the timing of DNA methyltransferase deregulation during prostate cancer progression. Pathology 2020, 52, 218–227. [Google Scholar] [CrossRef]
  47. Liu, P.; Yang, F.; Zhang, L.; Hu, Y.; Chen, B.; Wang, J.; Su, L.; Wu, M.; Chen, W. Emerging role of different DNA methyltransferases in the pathogenesis of cancer. Front. Pharmacol. 2022, 13. [Google Scholar] [CrossRef] [PubMed]
  48. Papakonstantinou, E.; Androutsopoulos, G.; Logotheti, S.; Adonakis, G.; Maroulis, I.; Tzelepi, V. DNA Methylation in Epithelial Ovarian Cancer: Current Data and Future Perspectives. Curr. Mol. Pharmacol. 2021, 14, 1013–1027. [Google Scholar] [CrossRef]
  49. Ahluwalia, A.; Hurteau, J.A.; Bigsby, R.M.; Nephew, K.P. DNA Methylation in Ovarian Cancer. Gynecol. Oncol. 2001, 82, 299–304. [Google Scholar] [CrossRef]
  50. Lu, J.; Zhen, S.; Tuo, X.; Chang, S.; Yang, X.; Zhou, Y.; Chen, W.; Zhao, L.; Li, X. Downregulation of DNMT3A Attenuates the Warburg Effect, Proliferation, and Invasion via Promoting the Inhibition of miR-603 on HK2 in Ovarian Cancer. Technol. Cancer Res. Treat. 2022, 21, 153303382211106. [Google Scholar] [CrossRef]
  51. Del Castillo Falconi, V.M.; Díaz-Chávez, J.; Torres-Arciga, K.; Luna-Maldonado, F.; Gudiño-Gomez, A.A.; Pedroza-Torres, A.; Castro-Hernández, C.; Cantú de León, D.; Herrera, L.A. Expression of DNA Methyltransferase 3B Isoforms Is Associated with DNA Satellite 2 Hypomethylation and Clinical Prognosis in Advanced High-Grade Serous Ovarian Carcinoma. Int. J. Mol. Sci. 2022, 23. [Google Scholar] [CrossRef]
  52. Gu, Yi.; Yang, P.; Shao, Q.; Liu, X.; Xia, S.; Zhang, M.; Xu, H.; Shao, Q. Investigation of the expression patterns and correlation of DNA methyltransferases and class I histone deacetylases in ovarian cancer tissues. Oncol. Lett. 2013, 5, 452–458. [Google Scholar] [CrossRef]
  53. Kinney, S.R.M.; Moser, M.T.; Pascual, M.; Greally, J.M.; Foster, B.A.; Karpf, A.R. Opposing roles of Dnmt1 in early- and late-stage murine prostate cancer. Mol. Cell. Biol. 2010, 30, 4159–74. [Google Scholar] [CrossRef] [PubMed]
  54. Antunez, C.A.V.; Chayeb, L.T.; Rodriguez-Secura, M.Á.; Álvarez, G.S.L.; Garcia-Cuellar, C.M.; Trevino, S.V. DNA methyltransferases 3a and 3b are differentially expressed in the early stages of a rat liver carcinogenesis model. Oncol. Rep. 2014, 32, 2093–2103. [Google Scholar] [CrossRef]
  55. Agoston, A.T.; Argani, P.; Yegnasubramanian, S.; De Marzo, A.M.; Ansari-Lari, M.A.; Hicks, J.L.; Davidson, N.E.; Nelson, W.G. Increased Protein Stability Causes DNA Methyltransferase 1 Dysregulation in Breast Cancer. J. Biol. Chem. 2005, 280, 18302–18310. [Google Scholar] [CrossRef]
  56. Lavoie, G.; St-Pierre, Y. Phosphorylation of human DNMT1: Implication of cyclin-dependent kinases. Biochem. Biophys. Res. Commun. 2011, 409, 187–192. [Google Scholar] [CrossRef] [PubMed]
  57. Veland, N.; Lu, Y.; Hardikar, S.; Gaddis, S.; Zeng, Y.; Liu, B.; Estecio, M.R.; Takata, Y.; Lin, K.; Tomida, M.W.; et al. DNMT3L facilitates DNA methylation partly by maintaining DNMT3A stability in mouse embryonic stem cells. Nucleic Acids Res. 2019, 47, 152–167. [Google Scholar] [CrossRef]
  58. Takashima, S.; Takehashi, M.; Lee, J.; Chuma, S.; Okano, M.; Hata, K.; Suetake, I.; Nakatsuji, N.; Miyoshi, H.; Tajima, S.; et al. Abnormal DNA Methyltransferase Expression in Mouse Germline Stem Cells Results in Spermatogenic Defects1. Biol. Reprod. 2009, 81, 155–164. [Google Scholar] [CrossRef] [PubMed]
  59. Minami, K.; Chano, T.; Kawakami, T.; Ushida, H.; Kushima, R.; Okabe, H.; Okada, Y.; Okamoto, K. DNMT3L Is a Novel Marker and Is Essential for the Growth of Human Embryonal Carcinoma. Clin. Cancer Res. 2010, 16, 2751–2759. [Google Scholar] [CrossRef] [PubMed]
  60. Elhardt, W.; Shanmugam, R.; Jurkowski, T.P.; Jeltsch, A. Somatic cancer mutations in the DNMT2 tRNA methyltransferase alter its catalytic properties. Biochimie 2015, 112, 66–72. [Google Scholar] [CrossRef] [PubMed]
  61. HE, M.; FAN, J.; JIANG, R.; TANG, W.-X.; WANG, Z.-W. Expression of DNMTs and MBD2 in GIST. Biomed. Reports 2013, 1, 223–227. [Google Scholar] [CrossRef]
  62. Li, X.; Meng, Y. Expression and prognostic characteristics of m 5 C regulators in low-grade glioma. J. Cell. Mol. Med. 2021, 25, 1383–1393. [Google Scholar] [CrossRef]
  63. Li, M.; Tao, Z.; Zhao, Y.; Li, L.; Zheng, J.; Li, Z.; Chen, X. 5-methylcytosine RNA methyltransferases and their potential roles in cancer. J. Transl. Med. 2022, 20, 214. [Google Scholar] [CrossRef]
  64. Chen, H.; Yang, H.; Zhu, X.; Yadav, T.; Ouyang, J.; Truesdell, S.S.; Tan, J.; Wang, Y.; Duan, M.; Wei, L.; et al. m5C modification of mRNA serves a DNA damage code to promote homologous recombination. Nat. Commun. 2020, 11, 2834. [Google Scholar] [CrossRef]
  65. Cao, Y.-L.; Zhuang, T.; Xing, B.-H.; Li, N.; Li, Q. Exosomal DNMT1 mediates cisplatin resistance in ovarian cancer. Cell Biochem. Funct. 2017, 35, 296–303. [Google Scholar] [CrossRef] [PubMed]
  66. Kobayashi, Y.; Absher, D.M.; Gulzar, Z.G.; Young, S.R.; McKenney, J.K.; Peehl, D.M.; Brooks, J.D.; Myers, R.M.; Sherlock, G. DNA methylation profiling reveals novel biomarkers and important roles for DNA methyltransferases in prostate cancer. Genome Res. 2011, 21, 1017–1027. [Google Scholar] [CrossRef] [PubMed]
  67. Gomez, S.; Cox, O.L.; Walker, R.R.; Rentia, U.; Hadley, M.; Arthofer, E.; Diab, N.; Grundy, E.E.; Kanholm, T.; McDonald, J.I.; et al. Inhibiting DNA methylation and RNA editing upregulates immunogenic RNA to transform the tumor microenvironment and prolong survival in ovarian cancer. J. Immunother. Cancer 2022, 10, e004974. [Google Scholar] [CrossRef]
  68. Moufarrij, S.; Srivastava, A.; Gomez, S.; Hadley, M.; Palmer, E.; Austin, P.T.; Chisholm, S.; Diab, N.; Roche, K.; Yu, A.; et al. Combining DNMT and HDAC6 inhibitors increases anti-tumor immune signaling and decreases tumor burden in ovarian cancer. Sci. Rep. 2020, 10, 3470. [Google Scholar] [CrossRef] [PubMed]
  69. Matei, D.; Fang, F.; Shen, C.; Schilder, J.; Arnold, A.; Zeng, Y.; Berry, W.A.; Huang, T.; Nephew, K.P. Epigenetic resensitization to platinum in ovarian cancer. Cancer Res. 2012, 72, 2197–2205. [Google Scholar] [CrossRef] [PubMed]
  70. Xie, W.; Sun, H.; Li, X.; Lin, F.; Wang, Z.; Wang, X. Ovarian cancer: epigenetics, drug resistance, and progression. Cancer Cell Int. 2021, 21, 434. [Google Scholar] [CrossRef]
  71. Abbotts, R.; Topper, M.J.; Biondi, C.; Fontaine, D.; Goswami, R.; Stojanovic, L.; Choi, E.Y.; McLaughlin, L.; Kogan, A.A.; Xia, L.; et al. DNA methyltransferase inhibitors induce a BRCAness phenotype that sensitizes NSCLC to PARP inhibitor and ionizing radiation. Proc. Natl. Acad. Sci. U. S. A. 2019, 116, 22609–22618. [Google Scholar] [CrossRef]
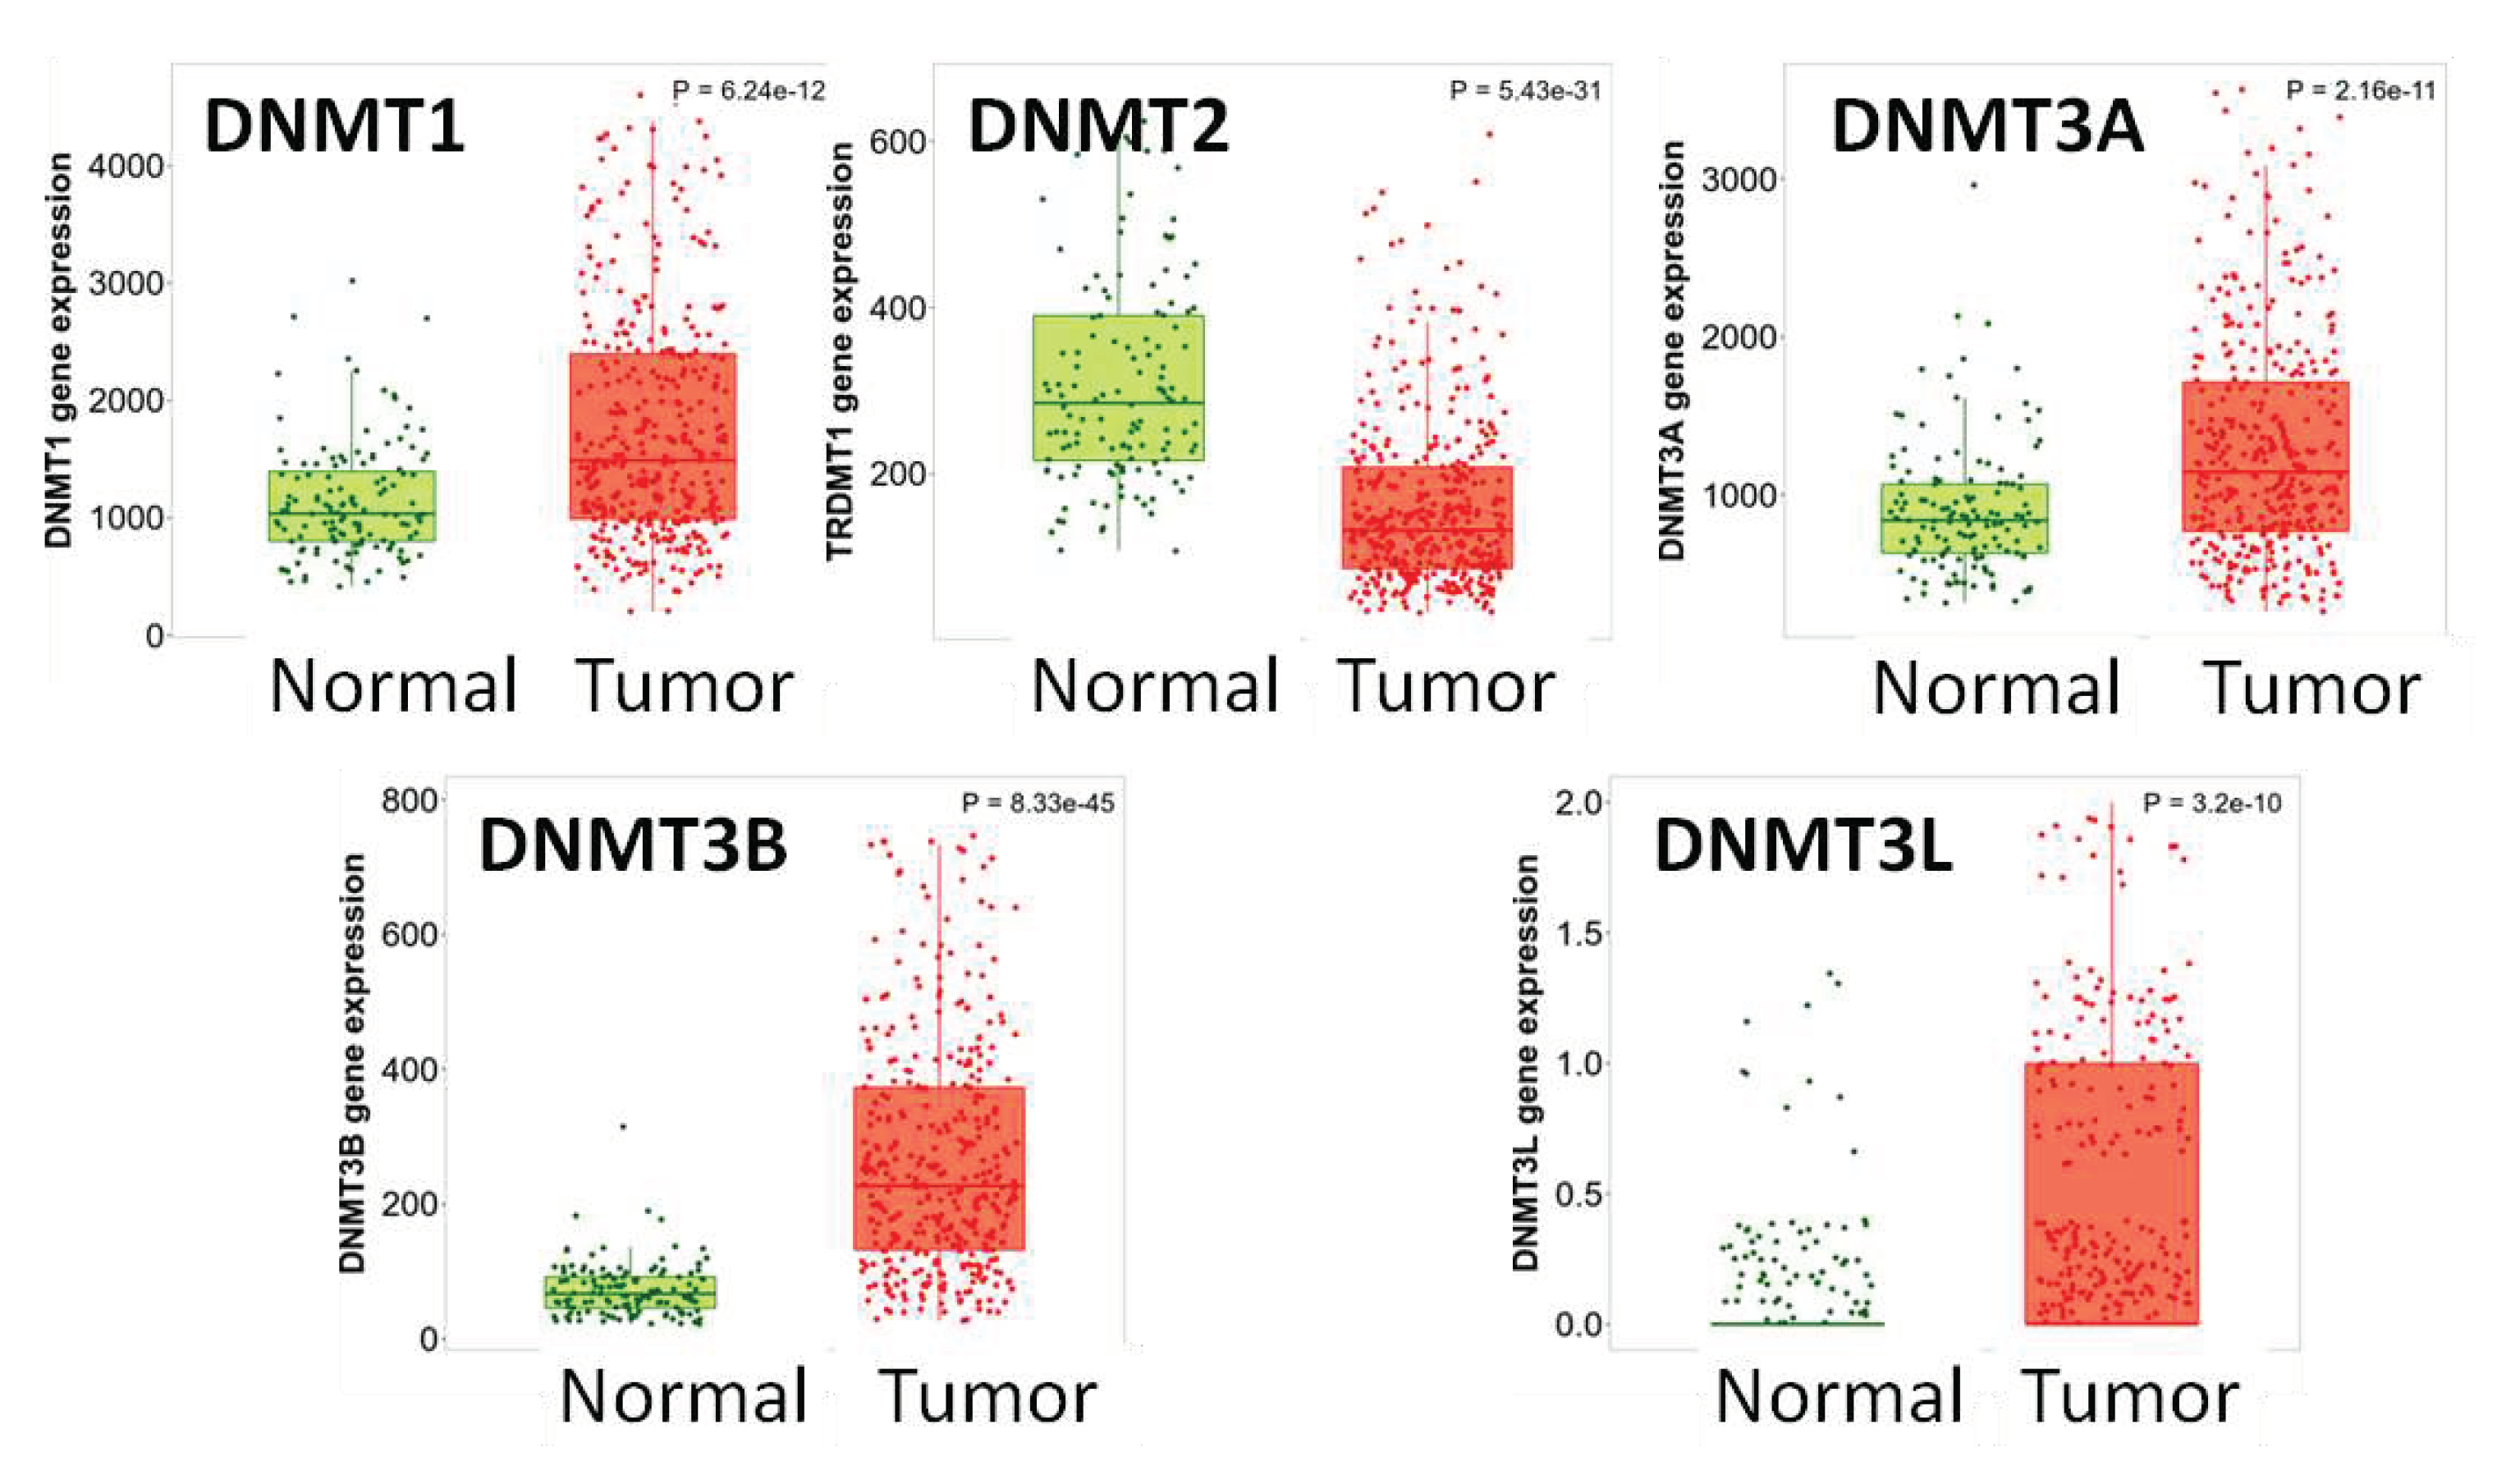
Figure 1. DNMTs mRNA expression in normal vs. tumor (RNAseq data from TCGA, GTEx and TARGET). DNMT1, DNMT3A, DNMT3B and DNMT3L levels are elevated and DNMT2 levels are decreased in tumor compared to non-neoplastic tissue.
Preprints 82450 g001
Figure 2. DNMTs mRNA expression in normal vs. neoplastic vs. metastatic tissue (gene chip data from GEO). DNMT3A, DNMT3B, DNMT3L and DNMT2 expression is reduced in metastatic tumors compared to primary neoplasms.
Preprints 82450 g002
Figure 3. A. DNMT1 and DNMT3A protein expression is elevated in ovarian tumors vs. normal tissues. B. DNMT1, DNMT3A and DNMT3B protein phosphorylation sites in ovarian tumors vs. normal tissues.
Preprints 82450 g003
Figure 4. DNMTs Mrna expression according to stage. DNMT2 and DNMT3A levels decreased from Stage II to Stage IV.
Preprints 82450 g004
Figure 5. DNMTs mRNA expression in ovarian carcinoma and patients’ survival.
Preprints 82450 g005
Figure 6. Boxplots of the expression of DNMTs in association with histologic type and relapses (SBT: serous borderline tumor, LGSOC low grade serous ovarian carcinoma, HGSOC: high-grade serous ovarian carcinoma, MBT: mucinous borderline tumor, MOC: mucinous ovarian carcinoma).
Preprints 82450 g006
Figure 7. Representative images from DNMTs immunohistochemistry.
Preprints 82450 g007
Table 1. Clinicopathologic characteristics of the patients from the OEC cohort.
SBT
Ν=12
LGSOC
Ν=17
HGSOC
Ν=60
MBT
Ν=12
MOC
Ν=7
Total
N=108
Mean Age 38 63 57 41 51 55
Figo Stage
1 12 7 13 12 4 48
2 2 4 1 7
3 8 41 2 51
4 2 2
T stage
T1 12 7 13 12 4 48
T2 0 2 7 0 1 10
T3 0 8 40 0 2 50
N Stage
N0 12 15 40 12 7 86
N1 0 2 20 0 0 22
SBT: serous borderline tumor, LGSOC: low grade serous ovarian carcinoma, HGSOC: high grade serous ovarian carcinoma, MBT: mucinous borderline tumor, MOC: mucinous ovarian carcinoma
Table 3. Mean expression of DNMT1 and DNMT2 in association with histologic type, FIGO Stage and relapses.
N DNMT1 P value DNMT2
Nucleus
P value DNMT2
Cytoplasm
P value
Non-neoplastic (non) 20 70 vs. SHGOCp=0.04vs. MOC
p=0.04
30 85
Histologic type SBT 12 68.3 vs. HGSOC <0.0001 6.3 vs. non p=0,03 52.9
LGSOC 17 89.6 vs. HGSOC <0.0001 11.9 vs. non p=0,03 32.6 vs. non p=0.045
HGSOC 60 159.6 21.2 31.3 vs. non p=0.045
MBT 12 82 10.9 41.1
MOC 7 136.8 vs. non
p=0.042
15.7 44.4
FIGO Stage 1 48 100.2 15.2 47.8
2 7 132.5 7.5 70
3 51 147.5 17.7 28.9
4 2 85 5 60
Relapses 26 210.4 vs.
HGSOC P=0.02
28.2 36.2
SBT: serous borderline tumor, LGSOC low grade serous ovarian carcinoma, HGSOC: high-grade serous ovarian carcinoma, MBT: mucinous borderline tumor, MOC: mucinous ovarian carcinoma
Table 4. Mean expression of DNMT3A, DNMT3B and DNMT3L in association with histologic type, FIGO Stage and relapses.
N DNMT3a
Nucleus
P value DNMT3a
Cytoplasm
P value DNMT3b P value DNMT3L P value
Non- neoplastic (non) 20 10 vs. HGSOC
p=0.02
95 70 20 vs. LGSOC
<0.005
vs. HGSOC <0.001
Histologic type SBT 12 20.2 vs. HGSOC
p=0.02
138.3 103.3 62.5 vs. HGSOC
<0.001
LGSOC 17 28.06 vs. HGSOC
<p=0.02
123.75 71.1 68.1 vs. HGSOC
<0.001
HGSOC 60 58.3 102.6 95.1 133.1
MBT 12 14 109.1 104.1 100.8
MOC 7 21.1 vs. non
p=0.04
96.2 71.7 127.8 vs. non
p=0.045
FIGO Stage 1 48 25.4 113.3 94.9 94.4
2 7 37.8 153.3 82.5 55.8
3 51 56.6 102.5 90.6 126.5
4 2 7.5 70 60 60
Relapses 26 67 87.8 108.7 157.3 vs.
SHGOC p=0.032
SBT: serous borderline tumor, LGSOC low grade serous ovarian carcinoma, HGSOC: high-grade serous ovarian carcinoma, MBT: mucinous borderline tumor, MOC: mucinous ovarian carcinoma
Disclaimer/Publisher’s Note: The statements, opinions and data contained in all publications are solely those of the individual author(s) and contributor(s) and not of MDPI and/or the editor(s). MDPI and/or the editor(s) disclaim responsibility for any injury to people or property resulting from any ideas, methods, instructions or products referred to in the content.
Copyright: This open access article is published under a Creative Commons CC BY 4.0 license, which permit the free download, distribution, and reuse, provided that the author and preprint are cited in any reuse.
Prerpints.org logo

Preprints.org is a free preprint server supported by MDPI in Basel, Switzerland.

Subscribe

© 2024 MDPI (Basel, Switzerland) unless otherwise stated