Preprint
Article

A Survey on Factors Preventing the Adoption of Automated Software Testing: A Principle Component Analysis Approach

Altmetrics

Downloads

120

Views

55

Comments

0

A peer-reviewed article of this preprint also exists.

Submitted:

15 August 2023

Posted:

17 August 2023

You are already at the latest version

Alerts
Abstract
Software testing is an integral yet time-consuming component of software development, and even with capable software testing resources (technology and people), it is still regarded as problematic. Test automation is widely being utilised within the software industry to provide increased testing capacity to ensure high product quality and reliability. In this paper, we are specifically addressing automated testing whereby test cases are manually written. Test automation has its benefits, drawbacks, and impacts on different stages of development. Furthermore, there is often a disconnect between non-technical and technical roles, where non-technical roles (e.g., management) predominantly strive to reduce costs and delivery time whereas technical roles are often driven by quality and completeness. Although it is widely understood that there are challenges with adopting and using automated testing, there is a lack of evidence to understand the different attitudes toward automated testing (AtAT), focusing specifically on why it is not adopted. In this paper, the authors have surveyed practitioners within the software industry from different roles to determine common trends and draw conclusions. A two-stage approach is presented, comprising a comprehensive descriptive analysis and the use of Principle Component Analysis. In total, 81 participants were provided with a series of 22 questions and their responses are compared against job role types and experience levels. In summary, 6 key findings are presented covering expertise, time, cost, tools and techniques, utilisation, organisation, and capacity
Keywords: 
Subject: Computer Science and Mathematics  -   Software

1. Introduction

The development of computer science, software engineering, and the increasing use of artificial intelligence and data mining technologies has led to the development of a wide range of applications that are critical to operations in business, health care, and education. The development of software is a complex and expensive process, prone to error and subsequent failure to meet user requirements [1]. Organisations, therefore, invest significant resources into ensuring that software products are tested against set criteria, ensuring they are of the best quality before being released to their clients and users [2]. Traditionally testing has been a manual process, involving humans executing applications and comparing their behaviour against certain benchmarks. However, advances in technology and the constant desire to improve quality have introduced and increased the use of automated testing, which uses computer algorithms to detect bugs in software applications [3]. Automated testing can generally be categorised into two types: that where manual test cases are written and used by automated testing tools, or a framework whereby the testing tools automatically generate test cases. In this study, we focus on the first type where test cases are manually created. The phrase `automated testing’ is used throughout the rest of the paper and is referring to instances of automated testing involving the manual creation and automated use of testing.
A key aspect of software development processes is that they all have distinct testing phases. For example, the Waterfall development process has a distinct test phase after development has taken place [4]. Although there are processes involving iterative and concurrent testing, many development processes assume users can specify a finished set of requirements in advance, ignoring the fact that they develop as the project progresses and changes depending on the client’s circumstances. Manual testing and the correction of errors, as well as the integration of changes, is feasible in small projects as the code size is easy to manage. However, as client requirements change or more requirements are added, the projects grow in complexity, yielding more lines of code and a higher probability of software faults occurring (commonly named bugs). This results in the need for an increased frequency of manual software testing. Consequently, there has been a shift to more flexible methodologies that combine testing with the completion of each phase to identify software problems before progressing to the next phase.
Automated software testing has many well-established known benefits [5,6]; however, several organisations are still not using automation techniques. The results from the 2018 State of Testing Report survey on test automation1 identified that automation is not yet as common as organisations desire. There are still many factors hindering update and use, such as challenges in acquiring and maintaining expertise, cost, and the utilisation of the correct testing tools and frameworks. Although previous studies present the reasons why automated testing might not be used, there is an absence of literature focusing on different job roles and experiences and how they relate to factors preventing the adoption of automated testing. There is also debate amongst academics and professionals as to the merits of automated testing over traditional, manual testing methods [7]. This research paper presents an empirical study to gain an understanding of the different attitudes of employees working within the software industry. The particular focus of this research is to understand whether there are common patterns surrounding different roles and levels of experience. Furthermore, this research aims to identify common reasons as to why automation is not being used.
At the end of this research, it is foreseen that the following question will be answered: do common themes emerge when investigating opinions as to why automated testing is not used, with the focus being on job role and level of experience? To answer this research question, a twenty-two-question survey has been created to collect attitudes toward automated testing (AtAT) from employees working in the software testing industry. The data is then thoroughly analysed by using quantitative techniques to determine key patterns and themes.
This paper is structured as follows: Section 2 presents and discusses existing work, grounding this study in the relevant literature. Section 3 describes and justifies the process adopted in this paper, which includes using a two-stage analysis approach. This section also presents and discusses the results of the study in detail, identifying common themes pertinent to the aim of this study. Section 4 provides a summary of key findings, discussing how these findings motivate future work. Finally, in Section 5 a conclusion of the work is provided. The full set of participant responses is available in Appendix A.1.

2. Related Work

The purpose of this paper is to identify the attitudes of those working in software testing. This section surveys academic works which tackle this question, comparing any existing approaches and methodologies. In one recent study, the authors define manual testing as a procedure to test the product for discovering software bugs [2]. Software is erroneous if it deviates from the system requirements and/or implements any requirement incorrectly. Taipale et al. agree by stating manual software testing is the procedure of physically testing software for imperfections, and it requires a tester to assume the job of an end-user whereby they utilise the application’s features to ensure correct functionality [7]. There are several types of software testing that target different objectives, such as effectiveness, efficiency, user satisfaction, completeness, defect types, etc. A methodological framework has been developed for this purpose that outputs a set of guidelines and checklists on what type of testing should be applied to achieve a certain objective based on a given case study [8].
Whilst software testing usually identifies errors and hence reduces associated costs and maintains quality, evidence suggests that its proportion to the aggregated costs of total development is high. A research study has determined that it contributes between 40% and 80% of the total development costs [9]. This could be regarded as contrary to business strategy for profit maximisation, and hence software manufacturers are increasingly looking for ways to reduce their development costs. In one recent report, process efficiency is described as the ability of a process to produce the desired outcome with the optimum number of resources [10]. Whilst it is commonly agreed that automated testing helps to identify software faults quicker when compared to manual testing, literature questions whether it is able to significantly reduce the overall costs of a project [11]. Automated software testing is defined as a process where software testing frameworks (like the Selenium web-testing suite [12]) are utilised to conduct pre-scripted tests on software, to confirm whether all functionality is working appropriately [13].

2.1. Requirement for Automated Software Testing

There is strong evidence to suggest that expenditures can be reduced using test automation. A report by Infosys [10] states that the manual testing of product features and performance is an expensive, lengthy and tedious task. A recent survey [14] claims that the cost of software testing is between 30% and 50% of the entire budget, and there is an undeniable requirement for testing methods that can decrease the duration required to guarantee software quality and reliability. In another work, the authors discovered a set of factors that influences the cost of test automation, which all provide positive outcomes on cost, quality and release time to market [11]. Another research study presented an experiment on an automated test generation tool and proposed a methodology named `TestDescriber’, which creates comprehensive documentation for each individual test, thereby improving and aiding the reduction of expert knowledge required to perform the tests [15]. This is an extension of previous work [16] that developed a toolkit to facilitate the automatic generation of test data for structural testing cases. In relation to the financial impacts of automated testing, a study discovered that the cost increases from 1:5 (from requirements to after release) for simple systems to as high as 1:100 for complex systems [17]. This statement confirms that once the bug is found in production, it will cost more to rectify as the system might need to be taken out of operation in order for the bug to be fixed, which will result in the company losing revenue or even customers migrating to competitors because of lack of confidence with their software systems. A similar study confirms that the longer a software fault is left undetected, the more expensive it will be to fix once discovered [18].
A recent research work examined the relative proficiencies of both random and organised methods to automated software testing and identified that proficiency is an imperative property of software testing; conceivably significantly more essential than adequacy [19]. Test automation can provide benefits in many ways, such as test reusability, repeatability, test inclusion and exertion spared in test executions. Another work added that since complex software faults exist even in basic software systems, engineers are searching for automated systems to identify software faults, resulting in increased trust and accuracy [20]. A similar study states that automated testing is a productive method to gain trust in the software’s accuracy[21]. This observation is well argued and is based on the premise that automated software testing removes the element of human error and is faster to run regression tests, which can take days if they are to be performed manually. Furthermore, another paper claimed that when comparing automated software testing versus manual software testing, the impacts and advantages of automated testing are provided in the long term when compared to manual testing [22]. This is due to the fact that an automated testing tool can consider and process all factors holistically, in an efficient manner, as compared to manual testing.
A research study examined different methods of software testing and concluded that performing manual testing is wasteful and error-prone; using automated tests is efficient in reducing the release time of software [23]. The experiment was based on a mathematical procedure with the intention of increasing the chances of having a resource-effective test automation process. Another paper investigated the techniques for enhancing the effectiveness of software test automation. This point is supported by stating that automated testing liberates testing staff to accomplish other testing duties [24]. This paper also explored the challenges and the best practices related to quality within software development and determined that completing software testing can reduce financial expenditure by catching issues before they make it far through the product development process.
Another paper reports that the primary issue of a tester and or organisation that desire to automate their software testing process is how much the testing tools cost [25]. Furthermore, the concern is whether it will satisfy the testing requirements. Open-source testing tools are available as well and free to use, which is seen as a positive aspect and does help organisations to automate software testing. Another research study conducted an experiment to investigate the benefits of automated testing techniques by using the open-source Ball Aviation Universe testing framework. It concluded that automated testing yields numerous advantages, such as mitigation against client input errors, quicker execution times, and decreased client oversight amid execution [26].

2.2. Current Limitations of Automated Testing

A study states that during the research into the current situation and potential improvements in software test automation, it was observed that the principle advantages of test automation were a quality improvement, the likelihood to execute more tests in less time, and familiar reuse of testware [27]. However, other work identified that when investigating the present condition of test automation in software testing, through surveying the perspectives and perceptions of supervisors, testers and developers in every company, it was concluded that the biggest burdens were the expenses related to implementing test automation, particularly in unique altered conditions [7]. Another paper performed an experiment using the AutoTest tool, which is a fully automated testing framework running on the Linux system. After combining automated and manual testing, it was realised that software can be tested either physically or automatically, and these two methodologies are able to complement each other [28].
Similarly, another experimental framework is presented to compare testing procedures based on efficiency, effectiveness and applicability [9]. It employed 70 distinct test design techniques and concluded that automated testing cannot be applied in every case due to a lack of ability to determine issues and/or increased difficulty in the implementation. This agrees with the observations and lessons learned from automated testing [29] that the utilisation of automated test tools does not improve fault detection when compared to manual testing. Moreover, it was discovered that 80% of professionals disagreed that automation testing would serve as a complete replacement for manual testing. This issue seems to be well known as another paper determined that automated tests found only 26% (on average) of the faults [27]. They further state that when an automated test suite has been configured and integrated, it is usually reused in future tests. This makes the testing substantially less likely to uncover defects in the product during the next iteration. Regarding the open-source software testing tools, a paper investigated a number of such tools and concluded that they are not regularly maintained and are difficult to use [30]. Also, organisations are still likely to use commercial tools due to the level of support available, which can help them fully utilise the technology. Hence, due to the aforementioned reasons, automated software testing is not used in some organisations.
Existing literature highlights that there is a known gap between academic and practitioner opinions on automated software testing, and there is a need to close the gap by exploring attitudes concerning the benefits and restrictions of test automation [31]. However, the appreciation for test automation is unbalanced as the achievement rate is low and the impediments are always high at the beginning for acquiring the resources to set up automation testing and training tools. Moreover, the automated tests are not well-suited for every organisation and are varied in terms of accuracy, applicability and usefulness factors.

2.3. Survey-based Research

There are many examples of recent research that involves surveying practitioners in the software industry. A recent survey was conducted into determining the importance of automated bug report management [32]. This research consulted 327 practitioners to gain their insights into automated bug report management techniques. Their study concluded that practitioners due value automated bug report management techniques, but many recommendations were identified. In another recent survey, 3,000 industry practitioners were invited to rate the relevance of research published at leading conferences [33]. The research was performed to understand how practitioners perceive software engineering research, helping conference organisers and academics understand software engineering research priorities and what elements of their research are favourably perceived, and thus have stronger end-user impact. Another recent research study focused on acquiring a software developer’s perception of productivity [34]. In this survey, the authors consulted 379 software developers, eliciting themes around tasks, activities, and workflow.

3. Materials and Methods

In this work, we use a two-stage analysis to address the research question. In the first phase, a comprehensive yet basic analysis is performed to provide the foundation for understanding how individuals’ attitudes towards the reasons why automated testing is not used, and also to illuminate patterns specific to individuals performing different roles and of different experiences.
Next, we conduct a principal component factor analysis (principal components extraction). This is a standardised and widely used approach, which provides the opportunity to further examine the relationships between participant opinions on automated testing as a whole while looking for clustering of certain variables [35]. In particular, we examine the dimensionality of individual responses to investigate whether or not automated testing attitudes comprise a distinct attitudinal dimension. Principal component factor analysis is a standard and widely used technique to be used during analysis [36].

3.1. Questions and Process

To measure attitudes toward automated testing (AtAT), a scale was constructed based on twenty items asking respondents about their broad feelings about automated software functionality as well as about the adoption. The questionnaire was created in a way that develops a comprehensive analysis of the common reasons why automated software testing is not being used. To understand this, and what facilitates the development of technological mechanisms, practitioners’ attitudes and concerns must first be investigated. The questionnaire is mostly derived with the help of existing frameworks and methodologies. The survey was distributed through professional and social media channels to acquire participants. Groups such as the following will be targeted: Quality Assurance (QA) testers, Software Developers in Test (SDIT), Software Testing Managers and Automation Engineers. The questionnaire that has been designed consists of 22 questions.
The questions are grouped into the construct of biographic, time, cost, tools and techniques, utilisation, organisation and capability. We selected construct themes as they repeatedly were presented in related research and they represent a natural divide of the individual, the technology, and the environment within which both operate. Table 1 provides the mapping of the questions to each construct, including a citation to the literature presented in related work that motivates their inclusion in the questionnaire. A question number is provided as it is used in later discussions. The numbering is provided in the order that they were asked to the participants and it is evident that questions for each construct are diversely distributed. The purpose of this is to extract more information from the participants on their AtAT to enable stronger analysis. As this questionnaire aims to deduce the reasons for not accepting automated testing, all items are negatively worded. There is also an open-ended section for the participant to provide further comments. Note that the questions are not asked in a grouped order to try to introduce variation within the questions being asked, making the participant revisit the theme after changing to a different theme. For each question, the participant will be presented with a statement with which they can either agree or disagree. The participant will be provided with responses based on the Likert scale [37], which are either strongly disagree, disagree, neutral, agree, or strongly agree. Furthermore, free text input is made possible at two points in the survey to acquire any additional information. The purpose of these inputs is to acquire comments from the participant that might rationalise their answer or provide further information. The first at approximately halfway through the survey at question 10 and the second at the end of the survey at question 22.
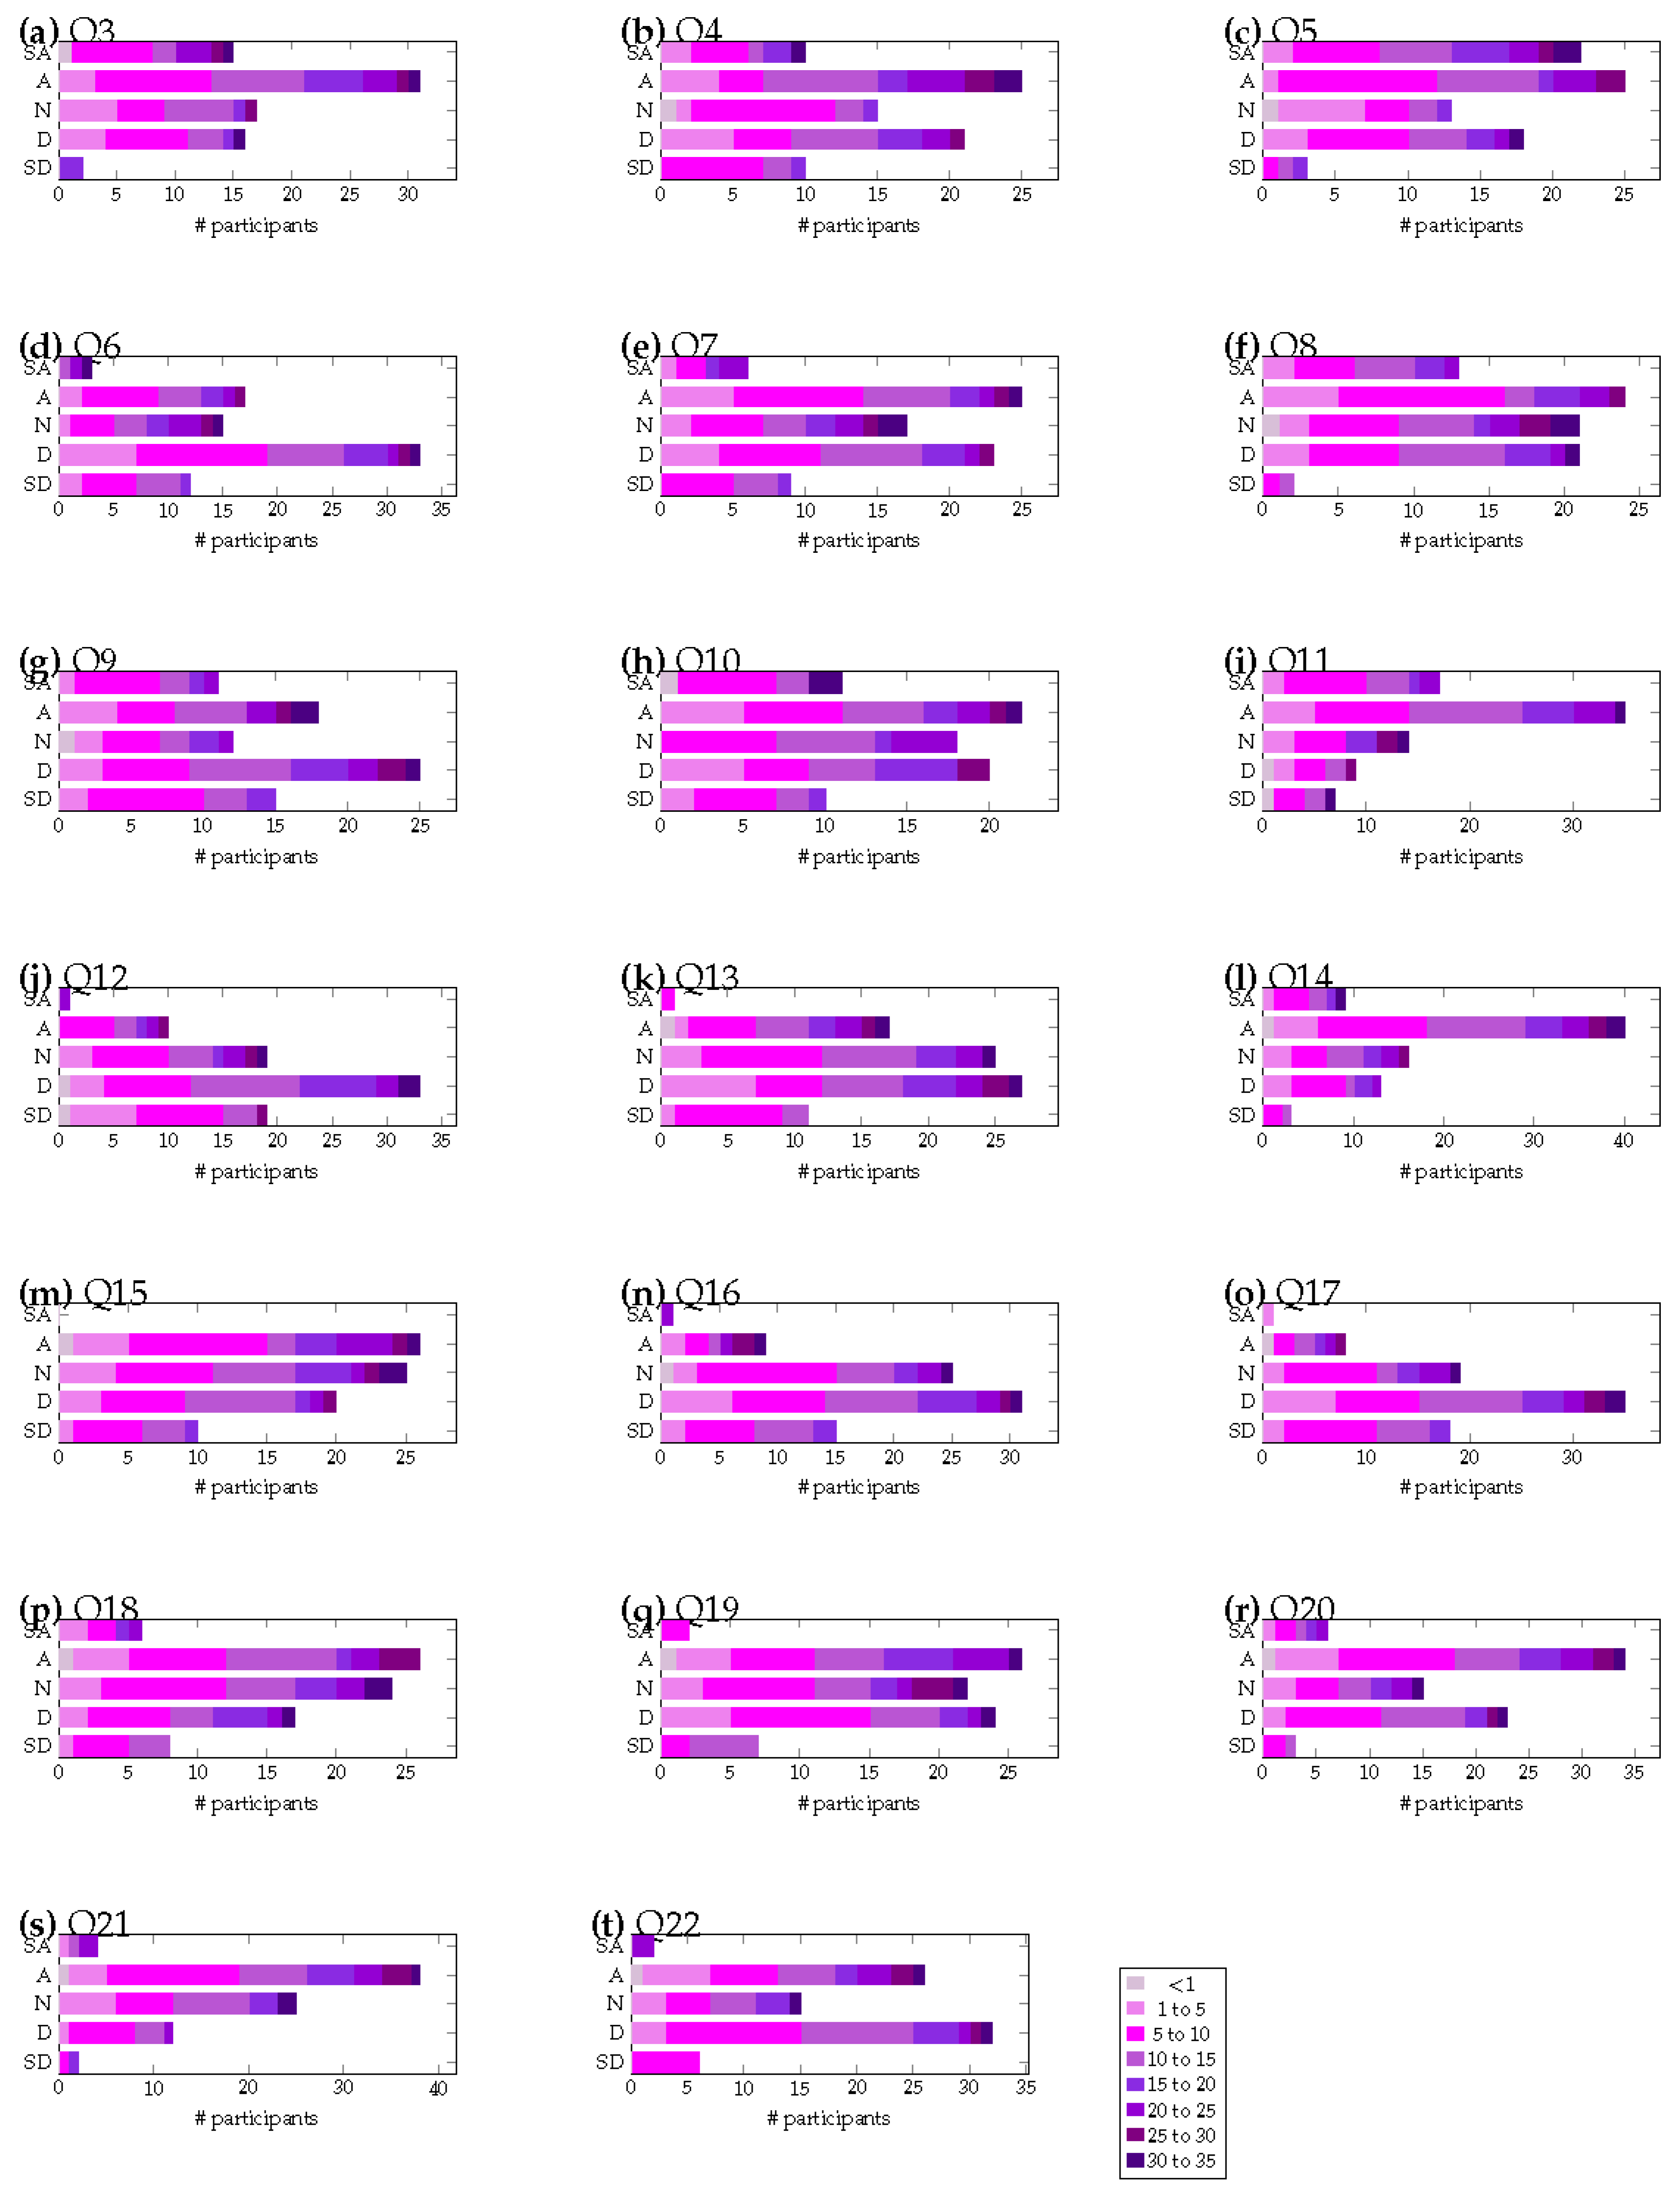
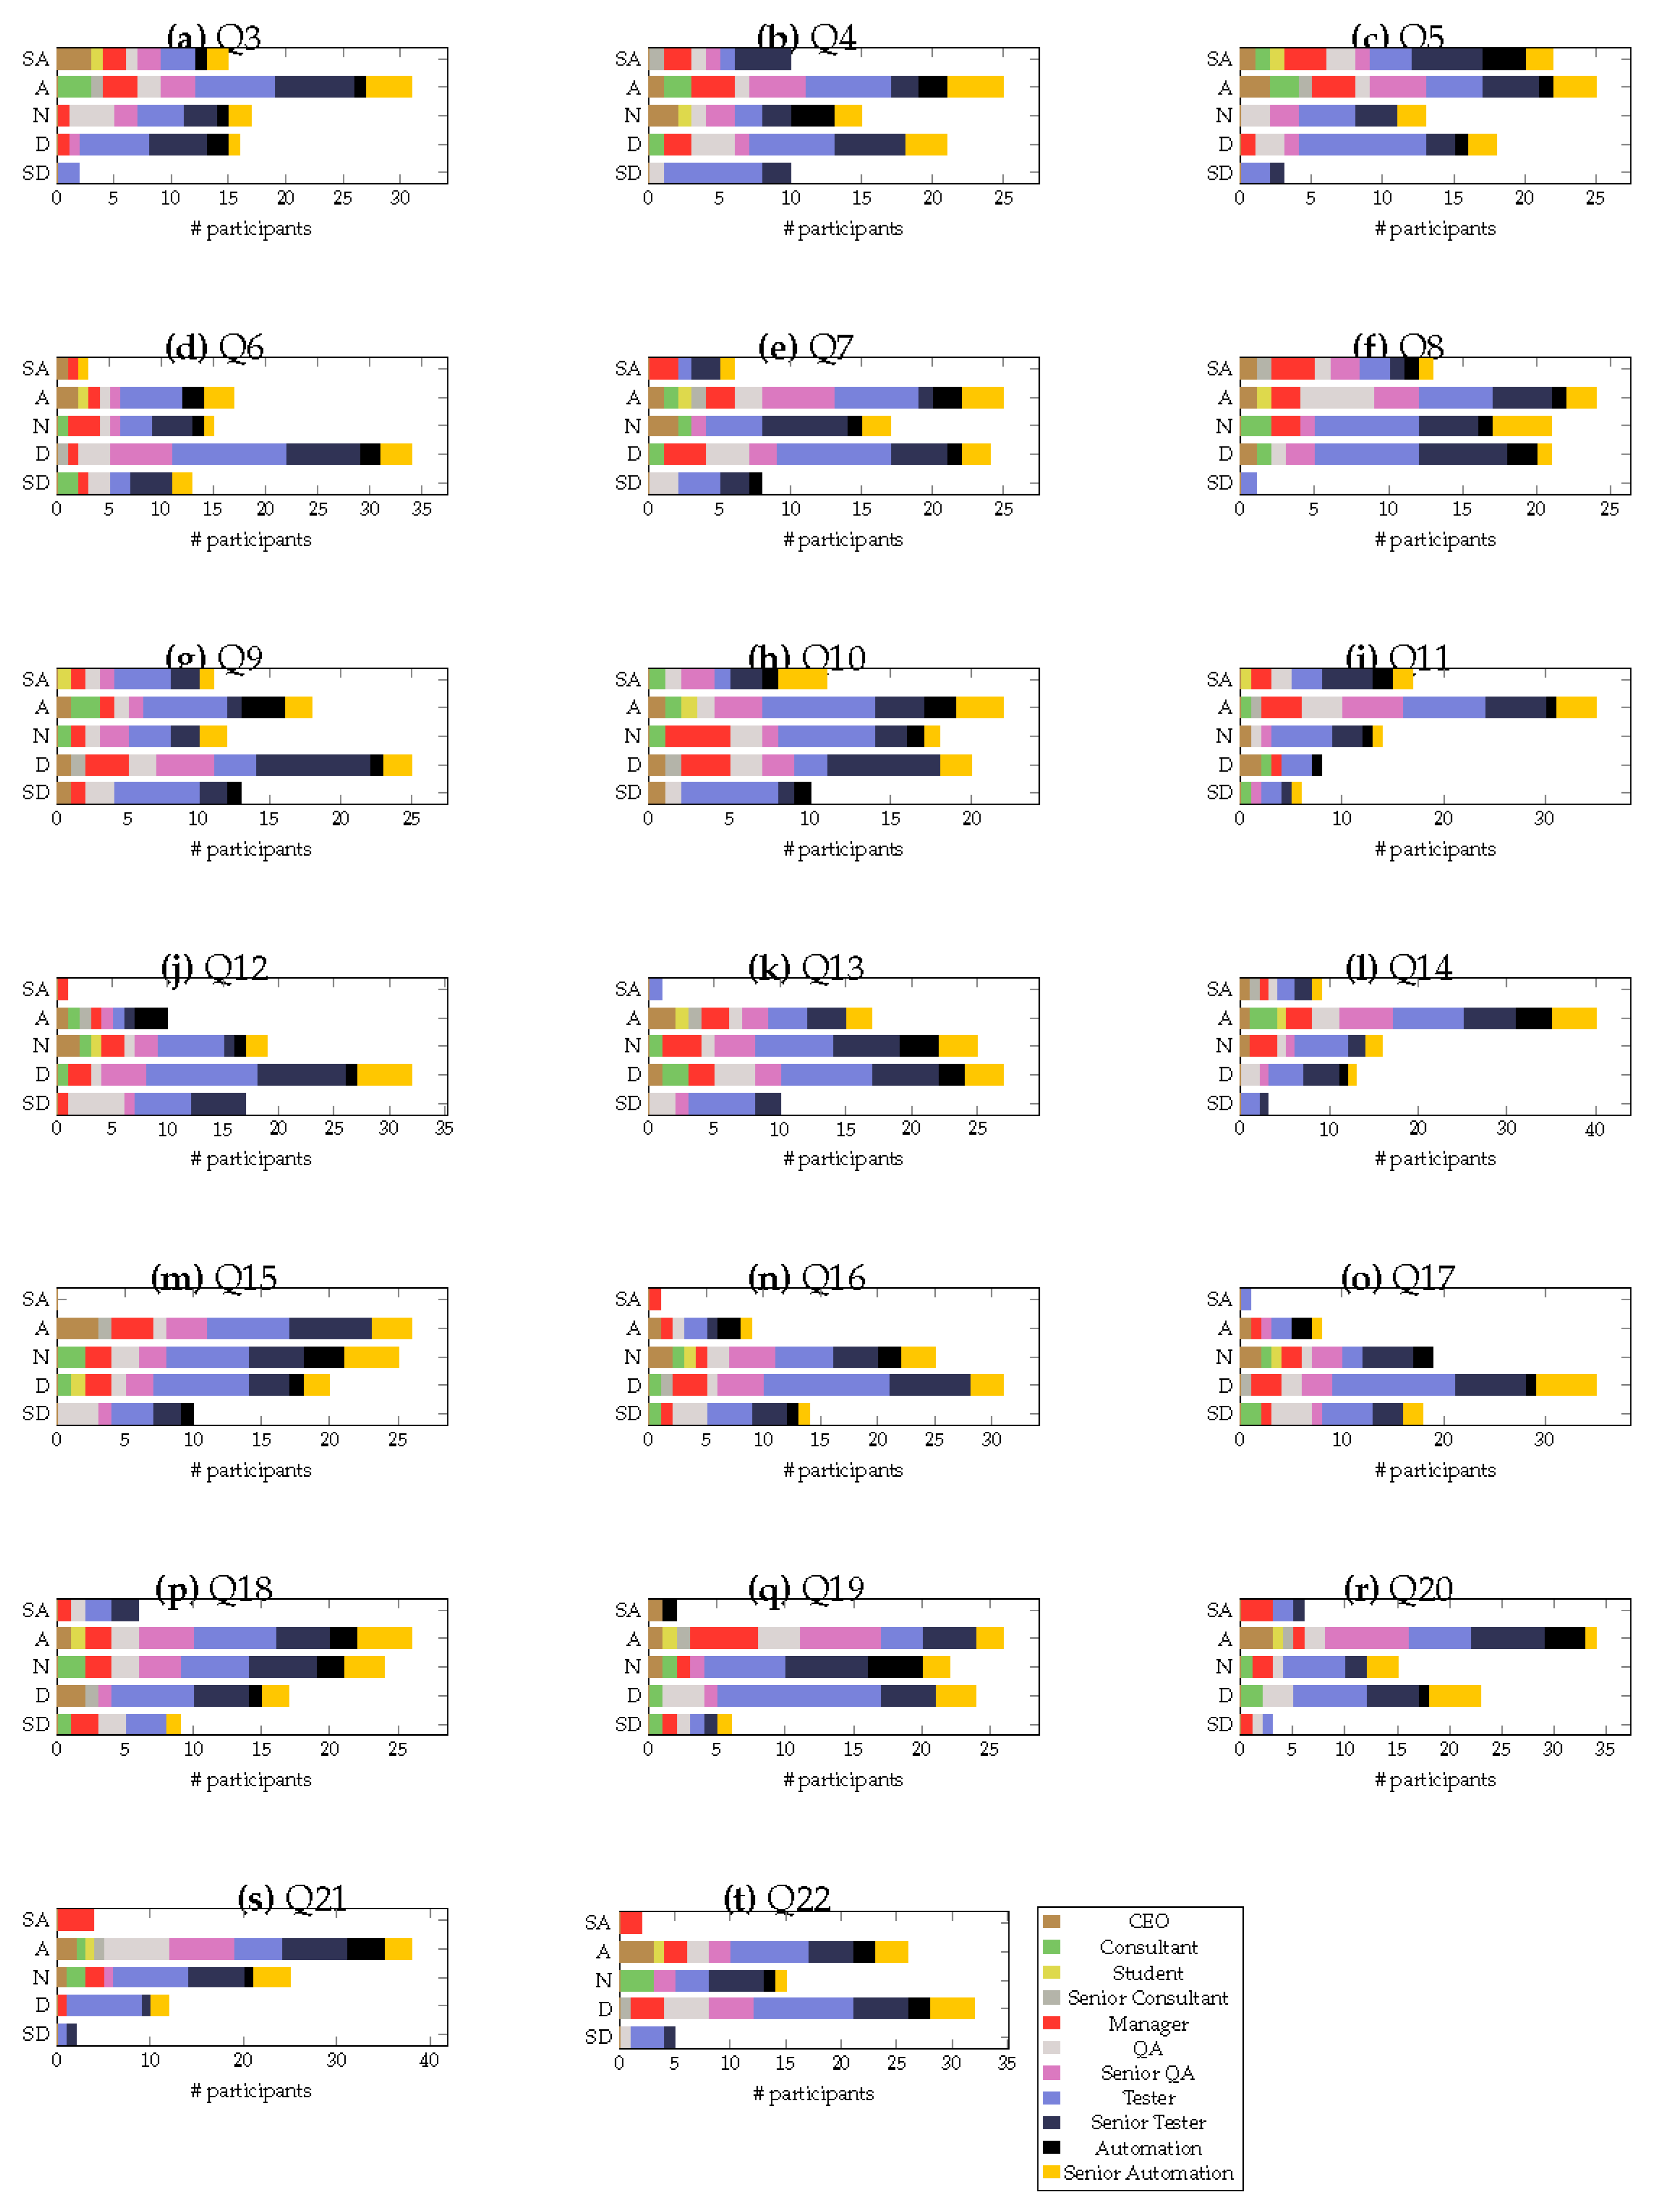
As all questions were multiple choice, the responses provided in Appendix A.1 are their numerical versions (strong agree = 5, agree = 4, neutral = 3, disagree = 2, strongly disagree = 1). Furthermore, the graphs provided in Figure 3 and Figure 4 use a character abbreviation (strong agree = SA, agree = A, neutral = N, disagree = D, strongly disagree = SD). Because all items are negatively worded, so score reverses were not needed.
The survey was created as a digital survey and distributed through special interest groups. More specifically, we created used Google Forms to create and host the survey and software engineering and testing special interest groups on LinkedIn. The survey is open to responses from all professionals working in software testing, regardless of whether they are employed or have experience working within an organisation where test automation is applied. This is to ensure that responses are captured from respondents with different experiences to represent the diversity within the software test community. It is also worth noting that we do not ask participants to disclose information regarding organisations that they are employed to work within. The purpose is to maintain anonymity and follows the survey style performed in practitioner-based surveys in the software engineering discipline [32,33,34].

3.2. Participants

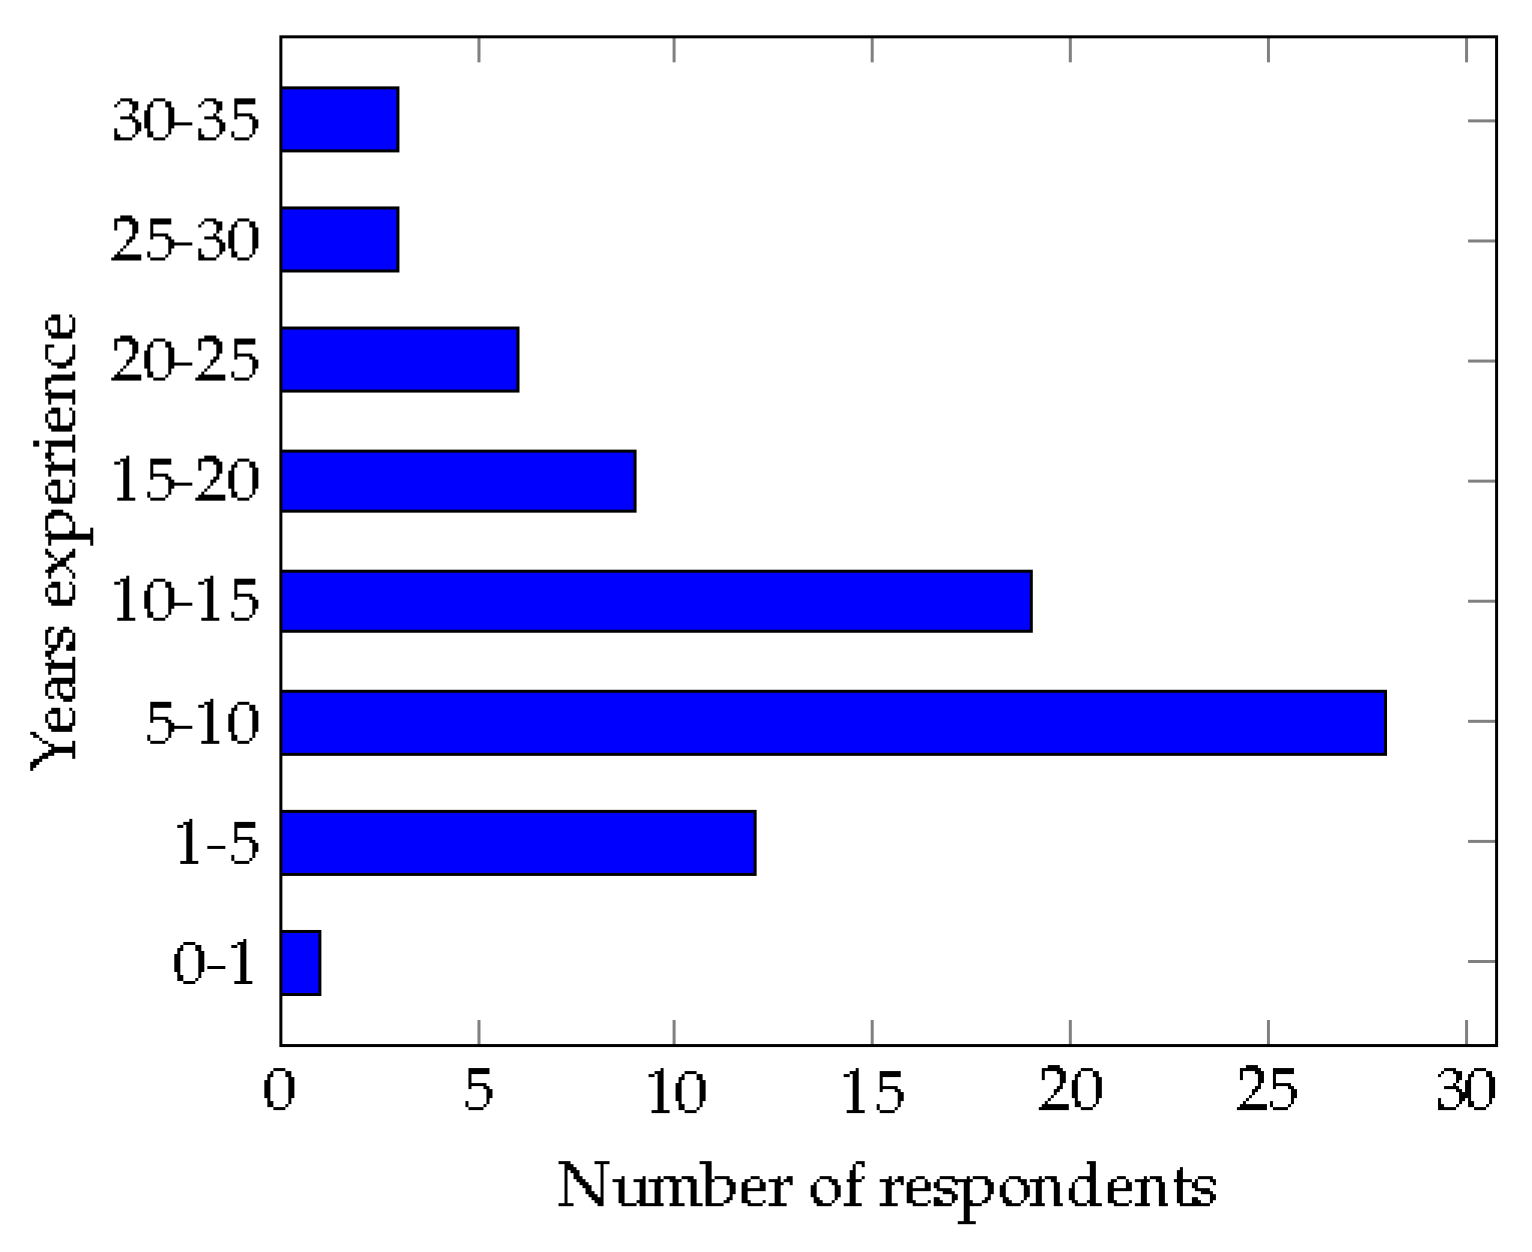
Figure 1 illustrates the experience of the participants. Years of experience are used to measure how long a participant has been involved with automated testing, which is a measure also utilised in other academic work [38]. It is important to make the distinction that the authors are not assuming that years of experience related to an individual’s skill level, more that an assumption is made that they will have had more interaction with automated testing tools and techniques, therefore forming more strong attitudes. Experience duration ranges from 0.5 to 33 years, and as evident in the table, a good variation was surveyed. However, the majority of participants are in the range between 1 and 20 years. This is of significant importance as it demonstrates that the survey will not be overly biased toward IT professionals with either short or long experience duration. Table 2 illustrates the variation of roles and the number of respondents. Note that the role title was entered by the user and resulted in a wide variation of roles. It is worth noting that the roles have been placed in themes for ease of comparison. The themes adopted are the same as those in the State of Testing Report (2018) as discussed in Section 1. In the table, it is evident that the majority of job role themes are in Quality Assurance, Software Testing, and then senior versions of each role. Outside of technical roles, there are 3 Chief Executive Officers, 4 consultants, 7 managers, and 1 student. Although it can be seen that in general, the majority of respondents are undertaking more technical roles, the 15 non-technical responses account for 18% of the total responses and are not insignificant.

3.3. Results: Stage 1

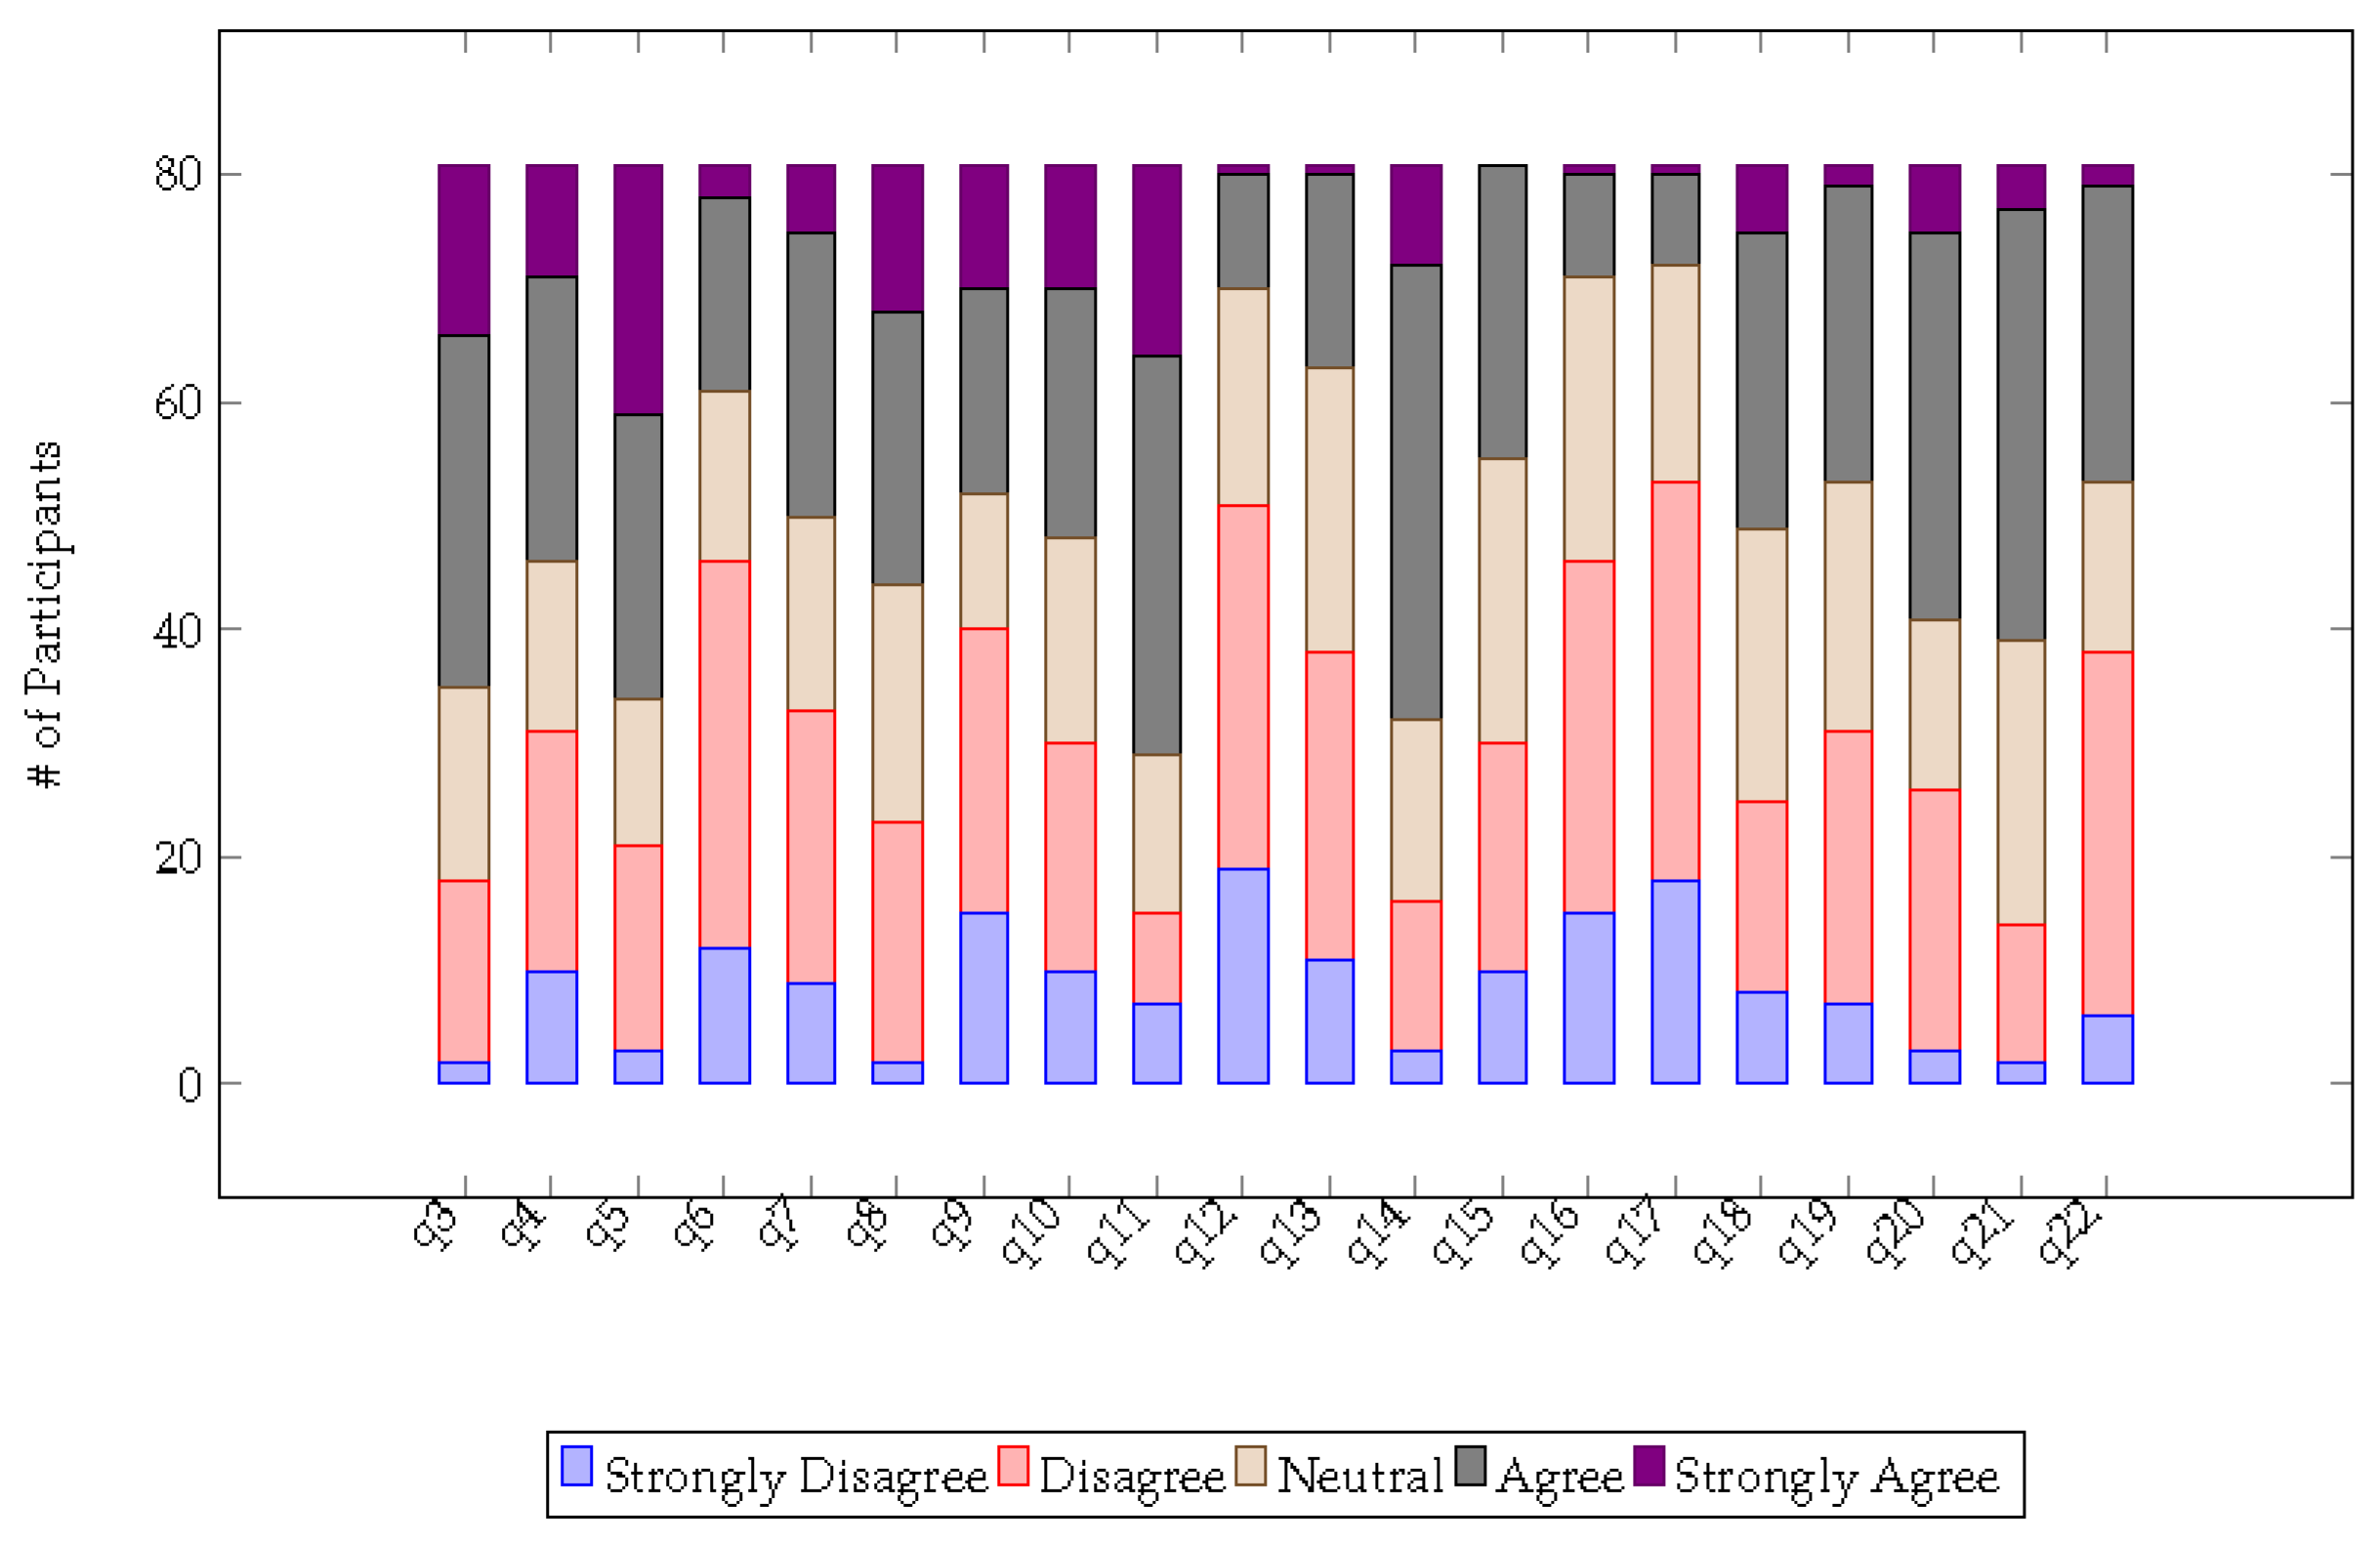
In this section, the responses from the questionnaire are analysed and discussed. Figure 2 provide the numbers of responses for each available response (strongly disagree, disagree, neutral, agree, strongly agree) Figure 3 provides bar charts for each response in relation to the response choices, whilst also showing the response split between different job roles, as provided in Table 2. Furthermore, Figure 4 provides information on how many years of experience the participants have against the responses. The discussion is grouped based on the constructs presented in Table 1, except for biographic which is discussed in Section 3.2.
Figure 2. Response to questions
Preprints 82509 g002
Figure 3. Responses for each survey by question, illustrating the distribution of answers based on job role
Preprints 82509 g003
Figure 4. Responses for each survey by question, illustrating the distribution of answers based on number of years experience
Preprints 82509 g004

3.3.1. Time

Question 4 asks the participants if they believe an individual’s not having enough time prevents the use of automated testing. The response to the question is well-balanced with only a small majority stating that they agree. As demonstrated in Figure 3b, the distribution of job roles amongst the responses is balanced, with both technical and non-technical roles agreeing and disagreeing. One identified trend is that participants that are strongly disagreeing have identified as performing a technical role, with only 2 of the 10 responses occupying a senior role. This indicates that more junior roles more strongly disagree with the presented statement. It can also be established from Figure 4b that there is an even distribution of years of experience amongst responses.
Question 15 then asked the participants whether the participant believe that automated testing techniques are time-consuming to learn. The responses to this question are also quite evenly distributed. The low percentage of participants strongly agreeing with this statement results in an average between neutral and disagreement. Figure 3m demonstrates the distribution of job roles amongst response categories and it is worth noting that in general non-technical roles are responding more closely with agree and neutral replies, which could perhaps be down to their lack of experience with the technology. Figure 4m demonstrates the years of experience for each response category. For example, all responses from CEOs are in the agreed category. Interestingly, there is an even distribution apart from agree whereby there is the highest quantity of participants with the lowest number of years of experience, which could demonstrate that those with a lower amount of experience could believe that automated testing takes more time to learn, which would most likely originate from the fact that they will have more to learn during earlier years of employment.

3.3.2. Cost

Question 11 asked whether the participant agreed or disagreed that commercial tools are too expensive, thus preventing their use. The majority of the participants agreed with this statement. Figure 3i illustrates the number of responses in relation to each job role. It is observed that the majority of management, senior consultants, and QA and senior QA roles agree with the statement, whereas CEOs are neutral or disagree. Furthermore, Figure 4i where the years of experience are evenly distributed amongst the available responses.
Question 19 asked the participant whether they believe automated test scripts and cases are expensive to generate. The responses to this question are balanced with only a slight emphasis on disagreement. Figure 3q illustrates that the general trend is that it is more likely for managerial roles to agree with this statement. It is also worth noting from Figure 4q that the small number of responses that both strongly agree and disagree have greater than 5 years of experience, whereas the other categories have an even distribution. This could indicate that the views of experienced employees are on average neutral, with a minority having polarised views.
Question 20 asked the participants whether they agree that automated testing requires high maintenance costs. Overall, the participants agreed with this statement, but it is evident that those in non-technical roles are more likely to agree with this statement, which is perhaps to be expected considering their daily interaction with financial operations Figure 3r illustrates that in general non-technical roles are more likely to agree with this statement, which is perhaps to be expected considering their daily interaction with financial operations. There is a slight emphasis on technical staff not agreeing with this statement, which is perhaps down to their lack of involvement with the financial side of their employer’s activities. Furthermore, Figure 4r identifies that those strongly agreeing or disagreeing have a higher number of years of experience.

3.3.3. Tools and techniques

Question 6 asks the participants whether they believe not having the right automation tools and frameworks is preventing use. It is evident that overall the majority of participants do not believe the use of automated testing is prohibited by the inability to identify and use the correct tools. Interestingly, Figure 4d illustrates that participants that are strongly agreeing have 10 to 15 and 30 to 35 years of experience. However, overall there is an even distribution of years of experience among the responses.
Question 16 asked participants whether they believed that automated testing tools and techniques lack the necessary functionality. Overall, the majority of participants disagree with this statement. Figure 4n demonstrates that there is a slight increase in the portion of responses from participants with an increased number of years of experience in the agree and strongly agree categories. This could perhaps indicate that more experienced employees have a stronger belief that current techniques and tools lack functionality, which could be down to the fact that they have in-depth experience and knowledge of missing functionality.
Question 17 asked the participants whether they believe that automated testing tools and techniques are not reliable enough, making them unsuitable for use. The responses overwhelmingly disagreed with this statement. Figure 3o illustrates that there is a diverse distribution of job roles amongst each response category. It is worth noting that only one participant strongly agreed and they are performing a technical role, which could indicate that their dissatisfaction originates from working closely with automated testing tools and techniques. Furthermore, as evident in Figure 4o, there is no relationship between years of experience and response, apart from the observation that there is a higher proportion of participants with a lower number of years of experience either agreeing or strongly agreeing. This could indicate that they have not yet mastered their craft and utilised the full potential of automated tools, or even their dissatisfaction with their chosen career.
Question 18 asked the participants whether they agree that automated testing lacks support for testing non-functional requirements (usability, safety, security.) The responses to this statement are close, but the majority are in agreement with this statement. Figure 3p and Figure 4p presents that there is an even distribution amongst roles and year’s experience within the response categories.
Question 21 asked the participants whether or not they agree that automated testing tools and techniques change too often, introducing problems that need fixing. A majority of the responses agree with this statement. Figure 3s illustrates that non-technical employees are more likely to agree with the statement, with only management roles submitting as strong accept. Interestingly, it also illustrates that QA and senior QA roles only responded as agreed. The majority of technical testing, engineering, and automation roles are either neutral or disagree, and they are also the only roles to strongly disagree. Furthermore, Figure 4s also displays that in general, the participants with a higher number of years of experience are more likely to respond with a neutral or disagreeing response. This indicates a different point-of-view between non-technical and technical roles, as well as the number of years of experience that an individual has. Experienced individuals may have gained sufficient expertise in how to maintain their scripts and keep them updated with new versions of testing tools.

3.3.4. Utilisation

Question 5 asks the participants whether they believe that difficulties in preparing test data and environments are responsible for preventing the use of automated testing. Overall, the majority of the responses agree with this statement. Figure 3c presents the breakdown of responses versus job roles. Interestingly, the results demonstrate that non-technical roles (CEO, Consultant, Management) are mostly agreeing with this statement and there is only 1 response from a Manager that disagrees.
Question 7 asked the participant whether they agreed with the statement that difficulties in integrating different tools/frameworks together are preventing their use. A small majority were in favour of disagreeing with the statement. Figure 3e illustrates that the majority of non-technical roles agree with this statement and the balance based on technical roles is almost even, with a slight emphasis on disagreeing with the statement. Figure 4e demonstrates an even distribution of years of experience among the responses, although the responses with a greater number of years of experience are on balance more in agreement than disagreement.
Question 8 asks the participant whether they agree or not with the statement that frequent requirement changes are often preventing the use of automated testing. The provided responses are overall in agreement with the statement. In Figure 3f it is evident that the job role distribution is mostly even with the majority of respondents operating in Software Tester, Engineering, Analysts and Test Architects, whereas respondents with Quality Assurance roles are majority agreeing. Interestingly non-technical positions, such as CEOs, are either neutral or disagree with this statement, which could indicate a misalignment between both non-technical and technical employee experiences with automated testing when it comes to the impact of changing software requirements.
Question 12 asked the participant whether they think that open-source automation tools are difficult to use and the majority of participants disagree. As illustrated in Figure 3j, the number of non-senior and technical roles is low for both agree and strongly agree. In relation to years of experience, Figure 4j illustrates that a higher number of individuals with a lower number of years of experience disagree with the statement, which could be down to the fact that those with fewer years of experience received dedicated training on the tools that they are using, i.e, they might be recent graduated having been training specifically on the used technology.
Question 22 is the final question and asked the participants whether they agree that it is difficult to reuse test scripts and data across different stages of testing. The responses in general align with disagreeing with this statement. The lower number of neutral responses indicates polarised views on this statement. From analysing the different roles that are presented in Figure 3t, it is evident that non-technical employees are more likely to agree with the statement; however, this is a weak correlation as some non-technical staff do disagree. Furthermore, technical staff are distributed across all categories. However, only those undertaking QA and technical roles strongly disagree. Figure 4t illustrates that of users who strongly agree, they all have a high number of years of experience. The different categories of experience and then evenly distributed among the different response categories, apart from those that strongly disagree that have between 5 and 10 years of experience only.

3.3.5. Organisation and Capabilities

Question 3 asked the participants whether they agreed with the statement that the lack of skilled resources is preventing automated testing from being adopted within an organisation. This demonstrates that the majority of the responses agree that a lack of skilled resources is a problem. Furthermore, as demonstrated in Figure 3a, the majority of people agreeing with this statement are performing non-technical roles, whereas the majority of the people disagreeing are performing more technical roles. This is of significance as it highlights the different viewpoints when considering whether there is a resourcing issue. In addition, Figure 4a highlights that the majority of responses provided by participants with in excess of 20 years of experience either agree or strongly agree. However, it is also worth noting that participants that strongly disagree are only in the 15-20 years of experience category.
Question 9 asked whether people believed that automated testing is often not used due to people not realising and understanding the potential benefits. The overall trend is that a majority disagree with this statement.
Question 10 asked the participant whether they believed a lack of support from senior management is preventing their use. The results from this question are well-balanced with the number of participants agreeing with the statement being slightly higher than those disagreeing. In Figure 3h, it is evident that there is an even distribution of job roles amongst the responses; however, the role of consultant only appears in the neutral, agree, and strongly agree responses, whereas managers and CEOs are on average disagreeing with the statement. The difference with consultants could be due to the fact that they are not directly employed by an organisation and provide independent observation.
Question 13 asked the participant whether they agree or disagree with the statement that test automation requires a high level of expertise, which is often not available. Overall the trend is that the respondents disagree with the majority. Figure 3k illustrates how different roles selected their answers, It is evident that there is an even distribution of roles. It is therefore a fair assumption to state that only those with a good technical understanding disagree with the statement. Figure 4k illustrates that the number of years of experience within each reply category is well distributed; however, strongly disagree has the highest average years of experience when compared to the other categories.
Question 14 asked whether the participants believe that automated testing requires strong programming skills. The responses overall strongly agreed with this statement. Figure 3l demonstrates that there is an even distribution of roles providing responses within each response category, and Figure 4l illustrates that there is an even distribution of years of experience within each response category.

3.4. Results: Stage 2

In this stage, Principle Component Analysis (PCA) is performed using SPSS (version 24). PCA is a statistical analysis technique that uses linear algebra techniques (specifically orthogonal transformation) to convert a data set believed to contain correlations into subsets of correlated data, known as principal components. In this process, the twenty items (questions) were used and these comprised the final attitude scale. In performing PCA, the level of variance (known as the Cronbach’s alpha) is calculated and is used as a measure of how suitable the data is for identifying principal components. Nunnally and Bernstein [39] state that 0.70 is an acceptable minimum for a scale that is newly developed. In our results, reliability for these 20 items of the sample produced a Cronbach’s alpha of 0.86 and is presented in Table 4. It is important to note that the alpha coefficient was not increased by eliminating items. Ferketich [40] recommended that corrected item-total correlations should range between 0.30 and 0.70 for a good scale [41]. In our result, all 20 questions had significant item-total correlations and were retained (ranging from 0.24 to 0.60).
Table 3 presents the results using the Kaiser-Meyer-Olkin (KMO) and Bartlett’s measure the sampling adequacy. As evident in the results, the KMO value is very close to 0.8, which is often determined as the determining that the sample is adequate. A value of below 0.6 determines that the sampling would be inadequate but anything above 0.7 is acceptable [42,43]. Furthermore, Barlett’s test of sphericity is used to measure the correlation between the questions within a theme. In our results, we obtain a value of 553.333 and the further the value is from 0, the higher the correlation between two variables [44].
Table 3. KMO and Bartlett’s Test.
Kaiser-Meyer-Olkin Measure of Sampling Adequacy .778
Bartlett’s Test of Sphericity Approx. Chi-Square 553.333
Significance .000
Table 4. Reliability Statistics.
Cronbach’s Alpha Number of Items
.860 20
AtAT with oblique (nonorthogonal) rotation was used to investigate the components that stop people from adopting automated testing. Analysis of the scree plot and eigenvalues led to the extraction of two components, which together accounted for 39% of variance in the data (see Table 5). We termed component one non-software factors, which comprises items relating to finance, expertise, and time. The second component we termed software factors, which comprises of ten items loading on this component related to the effectiveness, efficiency, completeness, and adaptability.
Our analyses of the twenty items reveal a two-component structure (Table 5). The non-software component consists of ten items explaining 29% of the variance and yields an eigenvalue of 5.8. Eigenvalue values are a measure of a component’s magnitude. The non-software factors component is highly correlated with a high internal consistency (Cronbach’s alpha=.813). The software factors consists of ten items explaining 10% of the variance and yields an eigenvalue of 2.0. The software factor also highly correlates (Cronbach’s alpha=.790). The results present the commonality scores, indicating how well each item fits the components. Furthermore, all existing theoretical guarantees for PCA assume that the data and the corrupting (all items grouped together into one theme) components are mutually independent (uncorrelated).
Table 6 presents the average percentage response grouped by role type and also by identified components from the principle component factor analysis. It is evident that based on the identified factor, participants undertaking a technical role more strongly agree that non-software reasons are preventing their use and they more strongly disagree that software reasons are preventing their use. It is also evident that they more strongly agree with the non-software factor being responsible for not adopting automated testing. Participants undertaking a non-technical role are more strongly agreeing that both non-software and software factors are preventing the use of automated testing.

4. Discussion and Findings

The purpose of this study was to test the nature of the relationship between a set of predictors including software characteristics, non-software issues and those reasons relating to practitioner support and opposition to AT adoption. In this spirit, scholars have found that AT characteristics, e.g. functionality and usability and adaptability can have a strong effect on practitioners’ support or opposition. In particular, we sought to test these predictors across different scenarios in order to gain an understanding of how the perceptions of individuals operating in different roles and with different levels of experience differ. To that end, it has been established that there are key identifiable patterns surrounding the attitudes towards automated testing from employees undertaking different roles and having different levels of experience. These key findings can be used by employers within the software industry to better understand the viewpoints of their employees.
Based on the values in Table 6, the responses for technical roles are asymmetric as technical roles believe that the reasons for not adopting AT are due to the non-software factor. However, the responses for non-technical roles are symmetric and, agree with both non-software and software reasons are the factors preventing adoption. We deduce that this could be down to the following reasons: (1) questions in non-software factors related to cost that all i.e not just non-technical employees agree with; (2) Based on common practice in the IT sector, technical employees are often promoted to non-technical (managerial) roles, meaning that they have both technical and non-technical attitudes; and, (3) Non-technical might have less understanding on how capable technical people are. I.e, management lack of understanding of their employees’ skills.
Based on the combination of the comprehensive basic analysis and principle component analysis, we draw the key findings presented in the remainder of this section. Throughout this section, the original questions and their responses are cross-referenced by adding the question number in parenthesis (e.q., q3 for question 3). In this section, free text optional responses provided by the user are analysed alongside the previously discussed quantitative information. The full responses provided by 19 of the participants can be seen in Table A1, and as this section is trying to establish key findings from the data, they are used to substantiate quantitative patterns. A summary of the key themes in the free text submissions can be seen in Table A2.
Summary Point 1.Although technical employees are more likely to believe that testers require a high level of expertise and that open-source tools are challenging, this is not identified as a factor preventing their adoption. However, on the contrary, non-technical roles do agree that an absence of expertise is preventing the use of automated testing.
When asking participants about whether they believe a lack of skilled resources is preventing automated testing from being used, it is evident that managerial staff believe this to be true, whereas those with more technical expertise do not (q3). This is an interesting finding as it confirms that there is a different perception between technical and non-technical staff in regard to whether a lack of skilled resources is a prevention factor. This could be because non-technical staff are unable to determine the requirements of expertise and match it with the capabilities within their organisation. Furthermore, it could also be because technical staff overstate their ability without having significant expertise in automated testing.
It is also evident that people do not believe that automated testing is not fully utilised due to people not realising its benefits (q9). Furthermore, technical roles do not believe there is an issue with open-source tools; however, less technical roles are more likely to support this argument (q12). In addition, there is a weak indication that those with technical expertise believe a high level of expertise is required (q13). It is however evident that the majority of the participants believe that strong programming skills are required to undertake automated testing (q14). However, when relating this to the results of the principle component analysis, it is evident that technical employees do not believe that technical reasons are preventing the use of automated testing.
It is perhaps not too surprising that technical roles are more likely to believe that a high level of expertise is required. This is because they are working closely with the technology and will have a comprehensive understanding of what knowledge is required. However, as demonstrated, technical roles are less likely to believe that skilled resources are preventing the use of automated testing as they have already gone through the learning process, becoming competent testers. On the contrary, management is more likely to be viewing the capability within their organisation versus what is to be delivered, and therefore, a lack of skilled resources might refer to there being insufficient resources available to deliver a project on time, rather than the absence of expertise from preventing thorough software testing. On the contrary, it is possible that those in technical roles report that they have the expertise required to utilise automated testing tools; however, this raises the question of why they are not always utilised if the necessary expertise is available.
In terms of comments provided by the participants, 7 of the 19 responses were directed at the necessity and lack of expertise. All of the 7 responses provided in Table A2 are provided by individuals performing technical roles (cross reference participant number with Table A1). Interestingly, all the responses do agree that technical knowledge is important, but one interesting observation is that some responses draw attention to the fact that there is a lack of training and mentorship within testing roles. One response even highlights the importance of individuals being able to learn the necessary skills independently. It is also interesting that a couple of responses directly state that the management of people is extremely important to help remove any skill and expertise gap, resulting in a more thorough and robust testing process.
Summary Point 2.Those with less experience are more likely to agree that individuals do not have enough time to engage in automated testing. Furthermore, employees with less technical experience with automated testing and increased management responsibilities disagree that they are time-consuming to learn.
Whether individuals have enough time to perform automated testing is polarised, with an even split agreeing and disagreeing. However, it has been identified that those with more junior roles are more likely to agree with this statement (q4). Furthermore, when considering how difficult they are to learn, the majority of people disagree that they are time-consuming to learn. However, in general, the least experienced employees tend to agree, and so do managers and CEOs (q15). This is agreeing with the results of the principle component analysis whereby technical staff are identified to agree that non-technical reasons are behind not adopting automated testing.
This finding agrees with the fact that the work levels and deadline pressures will be different in different organisations, and furthermore, people will respond to and handle these pressures differently. The fact that junior employees are more likely to state that they do not have sufficient time to perform automated testing duties is explainable by the fact that junior employees might take longer to perform testing duties. This might also be due to a lack of experience due to the employee learning new expertise necessary for their role, which could be slowing down the testing. It is also possible that those with less experience are burdened with learning the necessary knowledge and expertise to perform their entire role and therefore have little capacity to take on improvement activities. This may change as an individual gains more experience, becoming more efficient in their role and creating more space for learning and improvement.
Summary Point 3.The majority of participants agree that automated testing is expensive, with non-technical roles more likely to agree that they are expensive to use and maintain.
The majority of participants agree that commercial tools are expensive to use, but there is no discernible pattern (q11). However, there is a weak correlation that managerial roles are more likely to agree with the statement that test scripts are more expensive to generate (q19). This is further compounded whereby non-technical roles agree that there are high maintenance costs for test cases and scripts (q20). This agrees with the presented principle component analysis as both technical employees agree with non-technical reasons being responsible for not adopting automated testing. Furthermore, non-technical roles are split between believing that software and non-software factors are responsible for not adopting automated testing.
It is not surprising that the majority of users agree that the costs of automated testing are expensive. Furthermore, the pattern that managerial staff more strongly agree with this statement is explainable through their closeness with the financial operations of the business. It is however quite surprising that managerial staff believe that automated testing has high maintenance costs. A fundamental aspect of automated testing is its reuse and ease of maintenance. This difference in perspective is likely to originate from management’s lack of understanding when it comes to fundamental aspects of automated testing.
Comments provided by the participants also mirror the fact that automated testing is expensive to perform and maintain, which is largely down to the cost of the testing team. One participant (#75) states that management does not see the wasted amount of time in automated software testing, and this could provide justification as to why non-technical roles agree that they are expensive to maintain. If they saw the amount of wasted time, they might have a better understanding of the true cost.
Summary Point 4.All but the more experienced employees disagree that automated testing tools and techniques lack functionality. Furthermore, experienced employees are more likely to disagree that problems are introduced due to fast revisions, whereas those with managerial roles agree.
When considering whether automated testing tools and techniques lack functionality, in general, the more experienced employees are likely to agree, but overall the majority disagree (q16). When asked whether people believe that automated tools are reliable enough, there was a very strong tendency to disagree (q17). There is a slight agreement in that people believe that automated testing tools lack support for testing non-functional requirements (q18). When asking about whether automated testing tools and techniques change too often, introducing problems that need fixing, the general trend is that a higher number of years of experience leads to an increased chance of disagreement. Furthermore, of the response categories, non-technical roles agree/strongly agree (q21). This aligns with the findings from performing principle component analysis where non-technical roles more strongly believe that software reasons are preventing the use of automated testing, whereas those undertaking technical roles believe it is non-software issues.
The reason behind more experienced employees disagreeing that automated testing tools and techniques lack functionality is most likely down to the fact that more experienced employees either have fully mastered the tools, or they have developed sufficient workaround or alternative techniques. Furthermore, experienced staff do not believe that updates cause significant problems, which could be put down to the fact that they are experienced in how to handle revisions within the automated testing frameworks. Non-functional requirements are a secondary feature set of automated testing tools and techniques, and as such, are not the primary feature set integral to their core use. This is most likely the reason why the majority of participants do not see an issue with their lack of support for non-functional requirements.
Many comments were received in regard to the capabilities of tools and techniques, and in general, they state that the tools, techniques and frameworks do not lack functionality. Rather, they justify the complexity of tightly integrating the functionality within a project and how this can make it hard to reuse and fix revisions. Furthermore, it is evident that technical employees also believe that those in managerial roles do not understand what is involved in the implementation of automated testing. It is also interesting that one response from an individual performing a technical role (#64) even states that test scripts breaking is a good sign as it clearly demonstrates that they are working. A comment from an individual in management (#81) states that product delivery is more important than testing, demonstrating that for management their emphasis is on project completion rather than testing.
Summary Point 5.Only managerial staff believe that test preparation and integration inhibit their use. Furthermore, only managerial staff do not believe that software requirements change too frequently, having negative impacts on automated testing.
In terms of utilisation, when considering whether difficulties in preparing test data and scripts inhibit their use, only non-technical staff agree and there is a balanced response from technical roles (q5). Furthermore, the majority of participants do not believe that not having the right automation tools and available frameworks is preventing use (q6). When asking staff specifically about whether the difficulty to integrate tools is a problem, non-technical roles agree. technical roles are balanced with a slight emphasis on disagreement (q7). The majority of participants also agreed that requirements changing too frequently are impacting their use (q8); however, it is also the case that non-technical roles do not agree. There is also a strong disagreement from technical staff that test scripts are difficult to reuse across different testing stages (q22). This finding also agrees with the performed principle component analysis where it was identified that non-technical staff more strongly believe the reasons for not adopting automated testing to be technical.
The fact that non-technical employees believe that there are difficulties, both in setting up and maintaining automated tests, are prohibiting the use of automated testing tools is most likely down to the disconnect between non-technical and technical staff when it comes to understanding limitations with software testing. All participants believe that there are sufficient frameworks to meet their individual testing requirements. Interestingly, only management believes that changing requirements do not impact automated testing techniques. This difference could most likely originate due to a managerial misunderstanding of the impact of changing requirements throughout the software development cycle.
Comments provided by the participants do support the argument that those in testing roles understand the technical complexities involved and why automated testing might not be fully utilised. However, there is a lack of responses from managerial staff to justify that this is only a viewpoint from technical employees. There are many reasons specified for poor utilisation, from formal training and guidance, a preference to view automated testing as second to manual, and that automation might be used for the wrong reasons i.e., to replace manual rather than complement.
Summary Point 6.Whether a lack of support is preventing automated testing use is polarised.
There is neither agreement nor disagreement that a lack of support is preventing the use of automated testing. There is however an observation that consultants tend to agree with this statement (q10). This is interesting as it demonstrates that there is no majority, either in terms of role or experience, that are stating a lack of support is preventing them from adopting and using automated testing within their organisation. However, it is also worth noting that the responses to this question are rather polarised with people agreeing and disagreeing, but overall there are few holding strong views on this. This is consistent with the performed principle component analysis, which determined that non-technical roles and technical roles both agree (technically more strongly) that non-software factors, such as finance, expertise, and time are preventing the adoption of automated testing.
Comments received from participants detail that training is a common limiting factor to their update, but the biggest theme is that non-technical either do not understand or value test automation. This means that automation is seen as an afterthought from manual testing and thus will not be well supported by their employer.
5. Conclusion

Six key findings have been established, demonstrating key differences in perceptions of both technical and managerial employees, as well as employees of different experience levels. The two-stage analysis approach presented in this paper demonstrated that an overarching two-factor split can be established when considering the attitudes towards automated testing of both technical and non-technical staff. It has been established that technical employees strongly believe that preventing factors to automated testing use are those of a non-software nature, whereas non-technical roles believe it is both the reasons for software and non-software challenges. These attitudes have been further analysed and explained by considering different roles and years of experience.
Although the study is based on the responses from 81 different users, future work should focus on gaining a larger number of samples with a more even distribution across the different role types. However, it is important to note that 81 responses from those working in software testing are significant and worthy of investigation and analysis. Another limitation of the study is that the questionnaire focused on reasons as to why automated testing is not adopted and is therefore negatively worded. This does mean that the positive aspects of using automated testing have been ignored. Although this was a deliberate design choice in this work, collecting positive attitudes may also help gain further understanding.
One of the main limitations of this survey is that it is performed on a relatively small (81) dataset, which makes it difficult to form a generalised view and opinions. Although this was a deliberate design choice to incentives busy individuals to undertake the survey, we do acknowledge
Loadings with a high Cronbach’s alpha that have several high loading marker variables (> .80) do not require such large sample sizes as solutions with lower loadings [45]. Our results produced a Cronbach alpha of .86, justifying the reliability of the survey. Another limitation is that the questionnaire does not cover all factors that are involved in the process of automated software testing, and therefore, the key findings might not be true or applicable in every case. However, this research has achieved its aim of developing an understanding as to why people are not adopting automated planning, which establishes a suitable position for further research.
Another limitation of our study is that we consider large-scale AT software in a general sense rather than focusing on any specific AT software. Research finds that public opposition tends to be highest when projects are proposed and then ebbs once construction is completed [46]. However, we believe this limitation to be fairly minor because we are trying to understand practitioners’ attitudes about AT generally rather than any relation to any testing software adoption. The selection of questionnaire items always restricts the potential structure that can emerge from innovation adoption studies. We designed the questionnaire to include items relating to a broad range of potential experiences, motivated both theoretically and by prior qualitative research.

Appendix A

Appendix A.1

Table A1 provides the full breakdown of the individual questionnaire responses. Table A2 provides comments provided at the two designated points when performing the test.
Table A1. Questionnaire responses
Response No Q1 Q2 Q3 Q4 Q5 Q6 Q7 Q8 Q9 Q10 Q11 Q12 Q13 Q14 Q15 Q16 Q17 Q18 Q19 Q20 Q21 Q22
1 Tester/Engineer/Analyst/Architect/Automation 6 5 3 3 4 4 5 5 5 4 3 1 2 1 2 1 3 2 2 2 2
2 Tester/Engineer/Analyst/Architect/Automation 17 4 1 5 2 2 2 2 4 3 2 3 4 3 2 2 2 4 5 3 4
3 Senior QA 20 5 4 2 2 2 2 4 4 4 2 2 4 2 2 2 2 2 4 4 2
4 Tester/Engineer/Analyst/Architect/Automation 5 4 1 3 4 3 4 5 1 3 3 3 4 4 3 2 3 3 3 2 3
5 Consultant 31 4 4 5 3 3 3 4 5 1 3 2 4 3 3 3 3 2 3 3 3
6 Tester/Engineer/Analyst/Architect/Automation 10 3 4 5 4 3 2 4 3 5 4 3 4 2 3 4 4 3 4 4 2
7 Consultant 12 4 2 4 1 4 3 4 4 4 4 2 4 2 1 1 1 1 2 3 3
8 CEO 10 5 3 5 5 4 2 4 4 2 3 2 4 4 3 3 2 4 4 3 4
9 Manager 21 5 4 4 3 4 3 3 3 5 4 3 4 4 5 4 4 4 4 5 5
10 QA 5 3 2 2 1 1 4 2 3 5 1 1 2 1 3 2 1 1 3 4 1
11 Tester/Engineer/Analyst/Architect/Automation 6 2 4 5 3 2 4 5 4 5 2 5 5 3 3 1 5 2 5 4 1
12 Tester/Engineer/Analyst/Architect/Automation 3 2 2 2 4 4 2 4 4 4 1 3 3 4 2 2 4 3 3 3 4
13 Senior Tester/Engineer/Analyst/Architect/Automation 10 2 2 3 1 2 3 2 4 4 2 3 4 3 2 2 2 2 3 3 2
14 Tester/Engineer/Analyst/Architect/Automation 5 2 1 1 1 1 1 1 1 1 1 1 1 1 1 1 1 2 2 3 1
15 Senior Tester/Engineer/Analyst/Architect/Automation 4 2 3 3 1 2 4 2 2 5 1 3 4 3 1 1 3 3 4 3 3
16 Senior Consultant 15 4 5 4 2 4 5 2 2 4 4 4 5 4 2 2 2 4 4 4 2
17 Tester/Engineer/Analyst/Architect/Automation 3 4 4 3 2 4 4 2 2 5 3 2 3 4 2 3 4 2 4 4 4
18 Tester/Engineer/Analyst/Architect/Automation 5 3 1 2 2 2 3 1 2 2 2 1 4 2 2 2 2 2 2 2 2
19 Senior Tester/Engineer/Analyst/Architect/Automation 17 4 5 5 3 3 4 5 4 5 2 4 4 4 3 3 5 4 4 4 3
20 Senior Tester/Engineer/Analyst/Architect/Automation 6 3 1 3 2 3 4 3 4 5 2 3 3 2 3 2 3 3 3 3 3
21 Senior QA 6 4 3 4 2 3 4 3 5 4 3 3 4 3 2 3 4 3 4 4 3
22 Senior Tester/Engineer/Analyst/Architect/Automation 10 4 2 4 2 4 2 2 3 4 2 2 3 3 2 2 4 2 2 2 2
23 Tester/Engineer/Analyst/Architect/Automation 5 2 3 2 2 1 2 1 1 4 4 2 2 1 1 4 2 3 4 4 2
24 Senior Tester/Engineer/Analyst/Architect/Automation 10 3 4 4 4 4 4 5 5 5 3 3 4 2 3 2 3 2 2 3 4
25 Senior Tester/Engineer/Analyst/Architect/Automation 11 4 4 5 2 3 5 1 2 5 1 4 4 2 1 1 4 1 2 3 2
26 Consultant 13 4 4 4 1 2 2 3 3 2 2 3 4 3 2 1 3 3 2 4 3
27 Senior Tester/Engineer/Analyst/Architect/Automation 9 4 3 4 2 2 3 4 3 4 2 3 4 3 2 2 4 3 4 3 4
28 Senior Tester/Engineer/Analyst/Architect/Automation 10 3 4 1 1 1 2 5 5 1 3 1 1 1 1 3 3 1 4 4 3
29 QA 3 3 4 3 2 4 4 5 1 4 3 3 4 3 2 3 3 4 4 4 4
30 CEO 5 5 3 4 4 3 5 1 1 3 3 4 5 4 3 3 2 5 4 4 4
31 QA 3 3 2 5 2 4 5 2 2 4 1 2 4 2 3 2 4 2 2 4 2
32 Senior Tester/Engineer/Analyst/Architect/Automation 7 4 5 5 2 5 5 3 5 5 4 3 5 4 2 1 5 4 5 4 2
33 Senior QA 8 2 4 4 2 4 3 2 4 4 3 1 4 2 3 2 4 4 4 4 4
34 Senior Tester/Engineer/Analyst/Architect/Automation 2 4 2 3 3 3 2 1 2 3 1 1 2 1 1 2 2 2 2 3 3
35 Tester/Engineer/Analyst/Architect/Automation 5 5 3 5 4 4 5 2 5 5 4 3 4 3 4 3 3 5 4 4 4
36 Student 9 5 3 5 4 4 4 5 4 5 3 4 4 2 3 3 4 4 4 4 4
37 Tester/Engineer/Analyst/Architect/Automation 3 3 4 5 4 5 2 4 4 3 2 2 2 2 4 5 5 3 3 3 4
38 Senior Tester/Engineer/Analyst/Architect/Automation 20 4 4 5 3 3 3 2 3 4 2 4 3 4 2 3 4 4 4 4 4
39 Senior Tester/Engineer/Analyst/Architect/Automation 5 4 5 5 1 1 3 1 2 4 1 2 2 4 2 1 3 2 2 1 1
40 Tester/Engineer/Analyst/Architect/Automation 2 2 2 4 2 2 4 3 4 2 1 2 2 3 2 2 4 4 4 3 3
41 Senior Tester/Engineer/Analyst/Architect/Automation 15 4 2 5 2 5 2 2 2 4 2 2 2 4 2 2 2 2 3 3 2
42 Senior Tester/Engineer/Analyst/Architect/Automation 5 2 1 4 3 4 4 2 2 3 2 2 2 2 3 3 2 2 2 3 2
43 Tester/Engineer/Analyst/Architect/Automation 7 4 1 2 2 2 2 4 4 4 2 4 4 4 2 2 2 2 4 2 2
44 QA 9 3 1 2 1 1 4 1 3 5 1 2 4 3 1 1 1 2 2 4 2
45 Tester/Engineer/Analyst/Architect/Automation 1.5 3 2 3 2 3 3 4 4 3 2 2 3 3 2 2 3 2 3 3 4
46 Tester/Engineer/Analyst/Architect/Automation 18 1 4 2 4 3 3 1 3 4 3 3 3 3 1 1 2 2 2 3 2
47 Senior QA 8.5 5 5 5 2 4 2 5 5 1 1 3 3 4 3 3 3 4 4 4 2
48 Tester/Engineer/Analyst/Architect/Automation 2 3 4 2 2 4 3 3 1 4 2 2 4 2 3 2 2 2 4 2 2
49 Manager 10 4 4 5 3 4 5 2 2 4 2 4 5 3 2 2 4 4 5 5 4
50 Senior Tester/Engineer/Analyst/Architect/Automation 0.6 5 3 3 2 2 3 3 5 1 1 4 4 4 3 4 4 4 4 4 4
51 Senior Tester/Engineer/Analyst/Architect/Automation 12 3 4 2 4 1 1 3 4 4 2 2 4 3 2 2 4 3 3 4 3
52 Senior Tester/Engineer/Analyst/Architect/Automation 5 4 3 2 4 5 3 1 2 1 2 1 3 4 1 1 3 1 2 2 1
53 Senior Tester/Engineer/Analyst/Architect/Automation 5 2 2 4 1 3 2 2 1 5 1 2 5 3 4 2 2 3 2 2 2
54 Tester/Engineer/Analyst/Architect/Automation 25 4 4 5 3 4 3 4 4 3 3 2 4 3 4 2 4 3 4 4 4
55 Senior QA 15 3 4 3 4 4 4 3 2 3 2 2 4 3 2 4 3 4 4 4 3
56 Senior Tester/Engineer/Analyst/Architect/Automation 15 2 2 2 2 2 2 2 2 4 2 3 4 3 3 3 4 3 4 4 4
57 QA 2 4 5 3 2 2 4 4 4 4 1 4 5 4 4 1 5 4 4 4 4
58 Senior QA 8 4 3 4 3 4 4 2 3 4 4 4 4 4 3 3 3 4 4 3 2
59 Senior QA 12 3 2 4 2 4 5 2 4 4 2 4 4 4 3 2 4 4 4 4 2
60 Manager 13 4 5 5 3 2 3 4 2 4 1 2 3 2 1 1 1 1 1 3 2
61 CEO 25 5 4 4 4 3 4 2 2 2 4 4 3 4 4 4 4 3 4 4 4
62 Senior QA 10 4 4 3 2 2 5 2 2 4 2 3 2 1 2 1 4 4 4 4 4
63 Tester/Engineer/Analyst/Architect/Automation 6 4 5 4 3 4 3 3 3 3 3 4 3 4 2 3 4 3 4 4 2
64 Tester/Engineer/Analyst/Architect/Automation 11 4 1 2 2 2 2 4 1 4 3 4 5 2 4 4 2 2 2 2 2
65 QA 16 4 3 5 3 2 4 3 2 4 2 2 3 1 1 1 3 4 2 4 2
66 Tester/Engineer/Analyst/Architect/Automation 13 2 2 2 3 3 3 1 3 5 2 1 4 2 3 2 3 2 2 4 2
67 Tester/Engineer/Analyst/Architect/Automation 8 2 3 4 2 2 4 4 4 2 2 3 4 3 3 3 3 3 2 3 3
68 Senior Tester/Engineer/Analyst/Architect/Automation 20 4 2 4 3 3 4 4 4 4 3 2 2 4 3 2 3 4 3 4 4
69 Tester/Engineer/Analyst/Architect/Automation 15 1 2 1 1 1 5 1 1 3 2 2 2 2 2 2 3 3 3 1 3
70 Tester/Engineer/Analyst/Architect/Automation 8 5 4 4 2 4 4 5 3 4 4 3 4 4 3 4 4 4 3 4 4
71 Tester/Engineer/Analyst/Architect/Automation 5 4 2 2 2 2 2 4 3 2 1 1 1 2 1 1 1 2 1 2 1
72 Senior Tester/Engineer/Analyst/Architect/Automation 30 2 5 2 2 3 2 2 4 4 2 4 4 4 2 2 3 4 4 4 4
73 Manager 20 5 4 5 4 5 5 5 3 5 5 4 4 3 3 3 5 4 5 5 5
74 Manager 12 3 2 4 2 2 4 2 3 4 2 3 3 2 2 2 3 4 3 3 2
75 Tester/Engineer/Analyst/Architect/Automation 12 5 1 2 4 1 2 1 1 1 1 3 3 1 1 2 1 1 2 2 2
76 QA 7 5 2 4 4 2 2 1 5 3 1 1 2 1 1 1 4 2 1 4 2
77 Senior Tester/Engineer/Analyst/Architect/Automation 33 5 4 5 5 4 3 4 5 3 2 3 5 3 4 2 2 3 2 3 2
78 Senior Tester/Engineer/Analyst/Architect/Automation 25 3 2 4 2 2 3 2 2 3 1 2 4 2 2 2 4 3 2 4 2
79 Manager 4 2 5 2 1 2 5 1 2 2 3 2 4 4 2 2 1 4 5 5 2
80 Tester/Engineer/Analyst/Architect/Automation 10 2 3 4 2 2 3 2 3 4 2 2 4 3 2 2 4 3 4 3 4
81 Manager 20 4 2 4 5 5 4 2 3 4 3 3 3 4 4 3 3 3 3 2 4
Table A2. Summary of free-text responses
Response # Summary points
2
  • Problems are with people and not technology.
3
  • Skilled team will prevent issues.
5
  • False expectations from management.
  • Lack of consideration to test data and scripts.
  • People are the cost and over expectation of automation.
  • Setting and using testing tools requires knowledge.
15
  • Company recognise value of automation.
20
  • High maintenance due to when testing is performed.
24
  • Management do not understand automation.
33
  • People management is poor.
35
  • Lack of mentorship and guidance.
  • Self-teaching is important and widely performed.
39
  • Management does not understand the time/effort required.
  • Automation is always seen as nice to have after manual is performed.
  • Benefits of automated testing are significant.
43
  • Implementation of open-source frameworks is key to their value.
49
  • Training is the most challenging aspect.
51
  • Management sees value in automated testing for the stability of the end product.
55
  • Training is the most challenging point.
56
  • Once automated testing is used, it may become tricky to understand its value.
64
  • Automation still viewed as secondary.
  • The need to maintain scripts as new tools and techniques develop is a good sign.
66
  • Automated testing is more of a process than a skill.
  • Test automation needs to be pre-planned to consider software development factors.
75
  • New experienced testers are likely to make mistakes.
  • Automation engineers lack product knowledge and are disconnected from the project they are working on.
  • Those involved in automation spend lots of time making scripts and maintaining them.
  • Managers often do not see the level of waste in automated testing.
  • Managers invest heavily without seeing or understanding the benefit.
  • Management pushing advice on automation without knowledge is a bad thing.
  • People often build their own frameworks, but spending too much time here can be disadvantageous for the project.
  • Translation of testing output to management is currently underperformed.
  • Changing requirements is normal and a necessary part of a product’s life-cycle.
  • Automation used for the wrong reasons.
  • Automated testing can be hard to see the true benefits, and therefore management are likely to want it until they do not see any positive impact.
  • Commercial tools are too expensive.
  • Open-source tools are not hard to utilise unless the person is unfamiliar with the area.
  • Knowing when and how to use automated testing is important.
  • Level of programming ability is less important than the ability to learn when needed.
  • A wrongly utilised tool is expensive.
  • Challenges with maintenance stem from a lack of understanding.
  • Bespoke and low-level test scripts can be translated to new projects, but this is necessary as they encode application-specific behaviour.
77
  • A deep understanding is required.
81
  • Product delivery is more important than testing.

Note

1
State of Testing Report (2018) is available at https://spring2019.stpcon.com/wp-content/uploads/2018/12/SOTS18.pdf.

References

  1. Charette, R.N. Why software fails [software failure]. IEEE spectrum 2005, 42, 42–49. [Google Scholar] [CrossRef]
  2. Ammann, P.; Offutt, J. Introduction to software testing; Cambridge University Press, 2016.
  3. Dustin, E.; Rashka, J.; Paul, J. Automated software testing: introduction, management, and performance; Addison-Wesley Professional, 1999.
  4. Elghondakly, R.; Moussa, S.; Badr, N. Waterfall and agile requirements-based model for automated test cases generation. 2015 IEEE Seventh International Conferenc e on Intelligent Computing and Information Systems (ICICIS). IEEE, 2015, pp. 607–612.
  5. Rafi, D.M.; Moses, K.R.K.; Petersen, K.; Mäntylä, M.V. Benefits and limitations of automated software testing: Systematic literature review and practitioner survey. 2012 7th International Workshop on Automation of Software Test (AST). IEEE, 2012, pp. 36–42.
  6. Asfaw, D. Benefits of Automated Testing Over Manual Testing. International Journal of Innovative Research in Information Security 2015, 2, 5–13. [Google Scholar]
  7. Taipale, O.; Kasurinen, J.; Karhu, K.; Smolander, K. Trade-off between automated and manual software testing. International Journal of System Assurance Engineering and Management 2011, 2, 114–125. [Google Scholar] [CrossRef]
  8. Vos, T.E.; Marin, B.; Escalona, M.J.; Marchetto, A. A methodological framework for evaluating software testing techniques and tools. 2012 12th international conference on quality software. IEEE, 2012, pp. 230–239.
  9. Eldh, S.; Hansson, H.; Punnekkat, S.; Pettersson, A.; Sundmark, D. A framework for comparing efficiency, effectiveness and applicability of software testing techniques. Testing: Academic & Industrial Conference-Practice And Research Techniques (TAIC PART’06). IEEE, 2006, pp. 159–170.
  10. 2019.
  11. Kumar, D.; Mishra, K. The Impacts of Test Automation on Software’s Cost, Quality and Time to Market. Procedia Computer Science 2016, 79, 8–15. [Google Scholar] [CrossRef]
  12. Mittal, V.; Garg, N. Test Automation using Selenium Webdriver 3.0 with C 2018.
  13. Vogel-Heuser, B.; Fay, A.; Schaefer, I.; Tichy, M. Evolution of software in automated production systems: Challenges and research directions. Journal of Systems and Software 2015, 110, 54–84. [Google Scholar] [CrossRef]
  14. Zhou, Z.Q.; Sinaga, A.; Susilo, W.; Zhao, L.; Cai, K.Y. A cost-effective software testing strategy employing online feedback information. Information Sciences 2018, 422, 318–335. [Google Scholar] [CrossRef]
  15. Panichella, S.; Di Sorbo, A.; Guzman, E.; Visaggio, C.A.; Canfora, G.; Gall, H.C. How can i improve my app? classifying user reviews for software maintenance and evolution. 2015 IEEE International Conference on Software Maintenance and Evolution (ICSME). IEEE, 2015, pp. 281–290.
  16. Tracey, N.; Clark, J.; Mander, K.; McDermid, J. An automated framework for structural test-data generation. Proceedings 13th IEEE International Conference on Automated Software Engineering (Cat. No. 98EX239). IEEE, 1998, pp. 285–288.
  17. Fewster, M.; Graham, D. Software test automation: effective use of test execution tools; ACM Press/Addison-Wesley Publishing Co., 1999.
  18. Graham, D.; Fewster, M. Experiences of test automation: case studies of software test automation; Addison-Wesley Professional, 2012.
  19. Böhme, M.; Paul, S. A probabilistic analysis of the efficiency of automated software testing. IEEE Transactions on Software Engineering 2015, 42, 345–360. [Google Scholar] [CrossRef]
  20. Rahman, A.A.; Hasim, N. Defect Management Life Cycle Process for Software Quality Improvement. 2015 3rd International Conference on Artificial Intelligence, Modelling and Simulation (AIMS), 2015, pp. 241–244. [CrossRef]
  21. Garrett, T. Useful Automated Software Testing Metrics. Software Testing Geek 2011.
  22. Rex, B. Managing the Testing Process: Practical Tools and Techniques for Managing Hardware and Software Testing, 2002.
  23. Berner, S.; Weber, R.; Keller, R.K. Observations and lessons learned from automated testing. Proceedings of the 27th international conference on Software engineering. ACM, 2005, pp. 571–579.
  24. Jansing, D.; Novillo, J.; Cavallo, R.; Spetka, S. ; others. Enhancing the Effectiveness of Software Test Automation. PhD thesis, 2015.
  25. Dustin, E.; Garrett, T.; Gauf, B. Implementing automated software testing: How to save time and lower costs while raising quality; Pearson Education, 2009.
  26. Melton, J.R. The Hidden Benefits of automated Testing. Proceedings of the 2015 Aerospace Testing Seniar. CVENTS, 2015.
  27. Kasurinen, J.; Taipale, O.; Smolander, K. Software test automation in practice: empirical observations. Advances in Software Engineering 2010, 2010. [Google Scholar] [CrossRef]
  28. Leitner, A.; Ciupa, I.; Meyer, B.; Howard, M. Reconciling manual and automated testing: The autotest experience. 2007 40th Annual Hawaii International Conference on System Sciences (HICSS’07). IEEE, 2007, pp. 261a–261a.
  29. Rafi, D.M.; Moses, K.R.K.; Petersen, K.; Mäntylä, M.V. Benefits and limitations of automated software testing: Systematic literature review and practitioner survey. Proceedings of the 7th International Workshop on Automation of Software Test. IEEE Press, 2012, pp. 36–42.
  30. Monier, M.; El-mahdy, M.M. Evaluation of automated web testing tools. International Journal of Computer Applications Technology and Research 2015, 4, 405–408. [Google Scholar] [CrossRef]
  31. Garousi, V.; Felderer, M. Worlds Apart: Industrial and Academic Focus Areas in Software Testing. IEEE Software 2017, 34, 38–45. [Google Scholar] [CrossRef]
  32. Zou, W.; Lo, D.; Chen, Z.; Xia, X.; Feng, Y.; Xu, B. How practitioners perceive automated bug report management techniques. IEEE Transactions on Software Engineering 2018. [Google Scholar] [CrossRef]
  33. Lo, D.; Nagappan, N.; Zimmermann, T. How practitioners perceive the relevance of software engineering research. Proceedings of the 2015 10th Joint Meeting on Foundations of Software Engineering, 2015, pp. 415–425.
  34. Meyer, A.N.; Fritz, T.; Murphy, G.C.; Zimmermann, T. Software developers’ perceptions of productivity. Proceedings of the 22nd ACM SIGSOFT International Symposium on Foundations of Software Engineering, 2014, pp. 19–29.
  35. Abdi, H.; Williams, L.J. Principal component analysis. Wiley interdisciplinary reviews: computational statistics 2010, 2, 433–459. [Google Scholar] [CrossRef]
  36. Jolliffe, I.T.; Cadima, J. Principal component analysis: a review and recent developments. Philosophical Transactions of the Royal Society A: Mathematical, Physical and Engineering Sciences 2016, 374, 20150202. [Google Scholar] [CrossRef] [PubMed]
  37. Boone, H.N.; Boone, D.A. Analyzing likert data. Journal of extension 2012, 50, 1–5. [Google Scholar] [CrossRef]
  38. Faraj, S.; Sproull, L. Coordinating expertise in software development teams. Management science 2000, 46, 1554–1568. [Google Scholar] [CrossRef]
  39. Nunnally, J.C.; Bernstein, I.H.; Berge, J.M.t. Psychometric theory; Vol. 226, McGraw-hill New York, 1967.
  40. Ferketich, S. Focus on psychometrics. Aspects of item analysis. Research in nursing & health 1991, 14, 165–168. [Google Scholar]
  41. Cortina, J.M. What is coefficient alpha? An examination of theory and applications. Journal of applied psychology 1993, 78, 98. [Google Scholar] [CrossRef]
  42. Ferguson, E.; Cox, T. Exploratory factor analysis: A users’ guide. International journal of selection and assessment 1993, 1, 84–94. [Google Scholar] [CrossRef]
  43. Nunnally, J.C. Psychometric theory 3E; Tata McGraw-hill education, 1994.
  44. Tobias, S.; Carlson, J.E. Brief report: Bartlett’s test of sphericity and chance findings in factor analysis. Multivariate behavioral research 1969, 4, 375–377. [Google Scholar] [CrossRef] [PubMed]
  45. Tabachnick, B.G.; Fidell, L.S.; Ullman, J.B. Using multivariate statistics; Vol. 5, Pearson Boston, MA, 2007.
  46. Warren, C.R.; Lumsden, C.; O’Dowd, S.; Birnie, R.V. ‘Green on green’: public perceptions of wind power in Scotland and Ireland. Journal of environmental planning and management 2005, 48, 853–875. [Google Scholar] [CrossRef]
Figure 1. Respondent experience in the IT sector
Preprints 82509 g001
Table 1. Questions and construct
Construct Questions Sources
Biographic
q1
What is your job title?
q2
How many years of experience in the IT sector do you have?
 [19]
Time
q4
Individuals not having enough time prevents the use of test automation.
q15
Automated testing techniques are time-consuming to learn.
 [11,23,27]
Cost
q11
Commercial tools are too expensive, which prevents their use.
q19
Expensive to generate test cases/test scripts.
q20
They require high maintenance costs for test cases, test scripts and test data.
 [9,14,17,18,25]
Tools and Techniques
q6
Not having the right automation tools and frameworks is preventing use.
q16
Automated testing tools and techniques lack the necessary functionality.
q17
They are not reliable enough to make them suitable for use.
q18
They lack support for testing non-functional requirements (usability, safety, security, etc.).
q20
Automated testing tools and techniques change too often, introducing problems that need fixing.
 [26,38]
Utilisation
q5
Difficulties in preparing test data and environments prevents their use.
q7
Difficult to integrate different automation tools/frameworks together is preventing their use.
q8
Requirements change too often in software projects resulting in them being too time-consuming when required to quickly react to change.
q12
Open-source tools are not easy to use.
q22
Difficult to reuse test scripts and data across stages of testing.
 [21,22,24]
Organisation and Capability
q3
Lack of skilled resources prevents automated testing from being used.
q9
Not realising and understanding the benefits of test automation is preventing their use.
q10
A lack of support from senior management is preventing their use.
q13
Test automation tools require a high level of expertise, which is often not available.
q14
Automated testing requires strong programming skills.
 [7,15]
Table 2. Participant roles in the IT sector
Job role # participants
CEO 3
Consultant 3
Senior Consultant 1
Manager 7
Student 1
QA 7
Senior QA 8
Tester/Engineer/Analyst/Architect/Automation 27
Senior Tester/Engineer/Analyst/Architect/Automation 24
Total 81
Table 5. Pattern Matrix. Rotation Method: Oblimin with Kaiser Normalization. Rotation converged in 8 iterations.
Question Non-software factors Software factors Commonalities
Q20 .786 .606
Q19 .708 .568
Q13 .688 .499
Q14 .623 .384
Q21 .608 .375
Q8 .572 .294
Q15 .515 .347
Q11 .492 .217
Q18 .483 .397
Q4 .447 .278
Q22 .419 .362 .404
Q6 .741 .496
Q3 .662 .401
Q9 .618 .371
Q7 .617 .452
Q10 .504 .243
Q5 .500 .386
Q16 .487 .419
Q17 .469 .303
Q12 .343 .380 .346
Eigenvalues 5.815 1.971
Percent variance explained 29.076 9.857
Table 6. Average % responses to questions, grouped by role type and factor
Technical role Non-Technical role
Component % Disagree % Neutral % Agree % Disagree % Neutral % Agree
Non-software 35 25 41 22 23 55
Software 50 21 29 31 24 45
Disclaimer/Publisher’s Note: The statements, opinions and data contained in all publications are solely those of the individual author(s) and contributor(s) and not of MDPI and/or the editor(s). MDPI and/or the editor(s) disclaim responsibility for any injury to people or property resulting from any ideas, methods, instructions or products referred to in the content.
Copyright: This open access article is published under a Creative Commons CC BY 4.0 license, which permit the free download, distribution, and reuse, provided that the author and preprint are cited in any reuse.
Prerpints.org logo

Preprints.org is a free preprint server supported by MDPI in Basel, Switzerland.

Subscribe

© 2024 MDPI (Basel, Switzerland) unless otherwise stated