Preprint
Article

Study of the Removal Efficiency of Chromium Ions using a Membrane by Electro Kinetic Technique from Sludge

Altmetrics

Downloads

59

Views

21

Comments

0

A peer-reviewed article of this preprint also exists.

This version is not peer-reviewed

Submitted:

16 August 2023

Posted:

18 August 2023

You are already at the latest version

Alerts
Abstract
Abstract Aims: In recent years, electro kinetic (EK) remediation has become more popular as a novel method for removing chromium contamination from soil. This approach, however, is ineffective since it uses both cationic and anionic forms of chromium. In this work, a membrane –based technique was employed to increase the efficiency of the electro kinetic removal of chromium. Methods: Chromium removal from polluted sludge was studied in four bench-scale experiments, two of which used distilled water (EK-1, EK2 & Membrane) and two of which used acetic acid as a catholyte (EK-3, EK4 &Membrane). Results: The pH, total chromium, and fractionation of chromium in the sludge were measured after remediation. In the EK-1, EK-2 & Membrane and EK-3, EK-4 & Membrane trials, the average removal efficiency of total chromium was 47.6%, 58.6%, and 74.4%, 79.6%, respectively. Conclusion: In contrast to the electro kinetic remediation strategy, which left approximately 80% of the sludge neutral or alkaline after treatment, the use of the membrane created acidic soil conditions throughout the sludge. For example, the high field intensity used in the membrane tests may have helped to facilitate chromium desorption, dissolution and separation from the sludge, as well as enhance chromium mobility. The findings show that the membrane can improve the effectiveness of chromium removal from sludge when utilized in the EK remediation process.
Keywords: 
Subject: Engineering  -   Civil Engineering

1. Introduction

Remediation strategies that employ transport mechanisms that are generated by introducing an electrical DC field to the soil are referred to as electro kinetic. It is possible to use electro kinetics to transport ions, water, and charged particles by using electro migration (EM), electro osmosis (EO), and electrophoresis (EP) [Matloub et al. 2018; Sulaiman et al. 2018]. For fine-grained soils when conventional remediation methods seem to have failed, electro kinetic offers a substantial benefit [Ottosen et al.2019].
This technique can be used on site (in situ) or to excavate contaminated soil and take it to the laboratory (ex situ) [Talib et al.2019]. The major feature of the electro kinetic methods is the removal of in situ soil contaminants and may be considered a preferred treatment choice compared to other conventional ex situ treatment methods, such as solidification/stabilization and soil washing [Al-Khafaji et al.2017; Zainab et al. 2017; Al-Khafaji et al. 2018; Hussain and Al-Khafaji 2020]. During the electro kinetic remediation process, heavy metals accumulate in the pH leaping zone. The ability of electro kinetic remediation to remove heavy metals from soil is hampered by the accumulation effect. It has been observed that various strategies of improving the mobility of heavy metals may help reduce this limiting issue. In addition to chelating complexing compounds, electro kinetic remediation of anodes has been a popular strategy in recent years. Soil acidification has been utilized to increase the buildup of heavy metals, according to previous reports [Sun et al.2019].
Four EK remediation experiments were conducted to compare the effects of anodes with and without a membrane. Various parameters, including current, pH, chromium removal and change in Cr+3 chemical fractionation, have been used to evaluate the process. The findings show that electro kinetic remediation of the approaching anodes enhanced the current and reduced the sludge pH. Citric acid as a catholyte was more appropriate for reducing the accumulation effect and improving the Cr(total) removal rate. This study aimed to discover the effect of the membrane technique, which limits the Cr accumulation problem after the enhancement of electro kinetic treatment. To estimate the influence of using distilled water (DW) and a single (Acetic acid (AA)) purging solution for Cr+3 removal from contaminated sludge. and to assess the potential of the influence of the membrane in the electro kinetic remediation experiments on the removal efficiency of Cr+3.

2. Materials

2.1. Contaminants

To simulate the sludge chromium contaminant, a solution of Cr(NO3)3. 9H2O was used. The prepared solution was added to the specimen to obtain a representative concentration. The chromium nitrate (Cr(NO3)3. 9H2O) used in this study has a density of 1.85 g/cm3, solubility in water of 81 g/100 ml (20 ), and molecular weight of 238.011 g/mol. For example, for preparing a sludge specimen with a chromium concentration of 599.8 mg/kg and an initial moisture content equal to 40% by weight, 4.889 g. of Cr(NO3)3.9H2O dissolved in 400 mL of distilled water, and the solution was added to 1 kg of dried sludge, which is in accordance with the same procedure adopted by Ref. [Faisal and Hussein 2015; Faisal and Rashid 2015].

2.2. Sludge

The sludge utilized in this work was obtained from the Municipality of Baghdad/Baghdad Water Department/Operation Department/Kadhimiya Water Project. It was collected from clay sediments for the sedimentation basins of the Kadhimiya Water Project, as shown in Figure 1.
It was thoroughly cleaned, dried, and sifted with an extra sieve to ensure a satisfactory level of homogeneity. Table 1 explains the physical and chemical properties of the utilized sludge.

2.3. Membrane

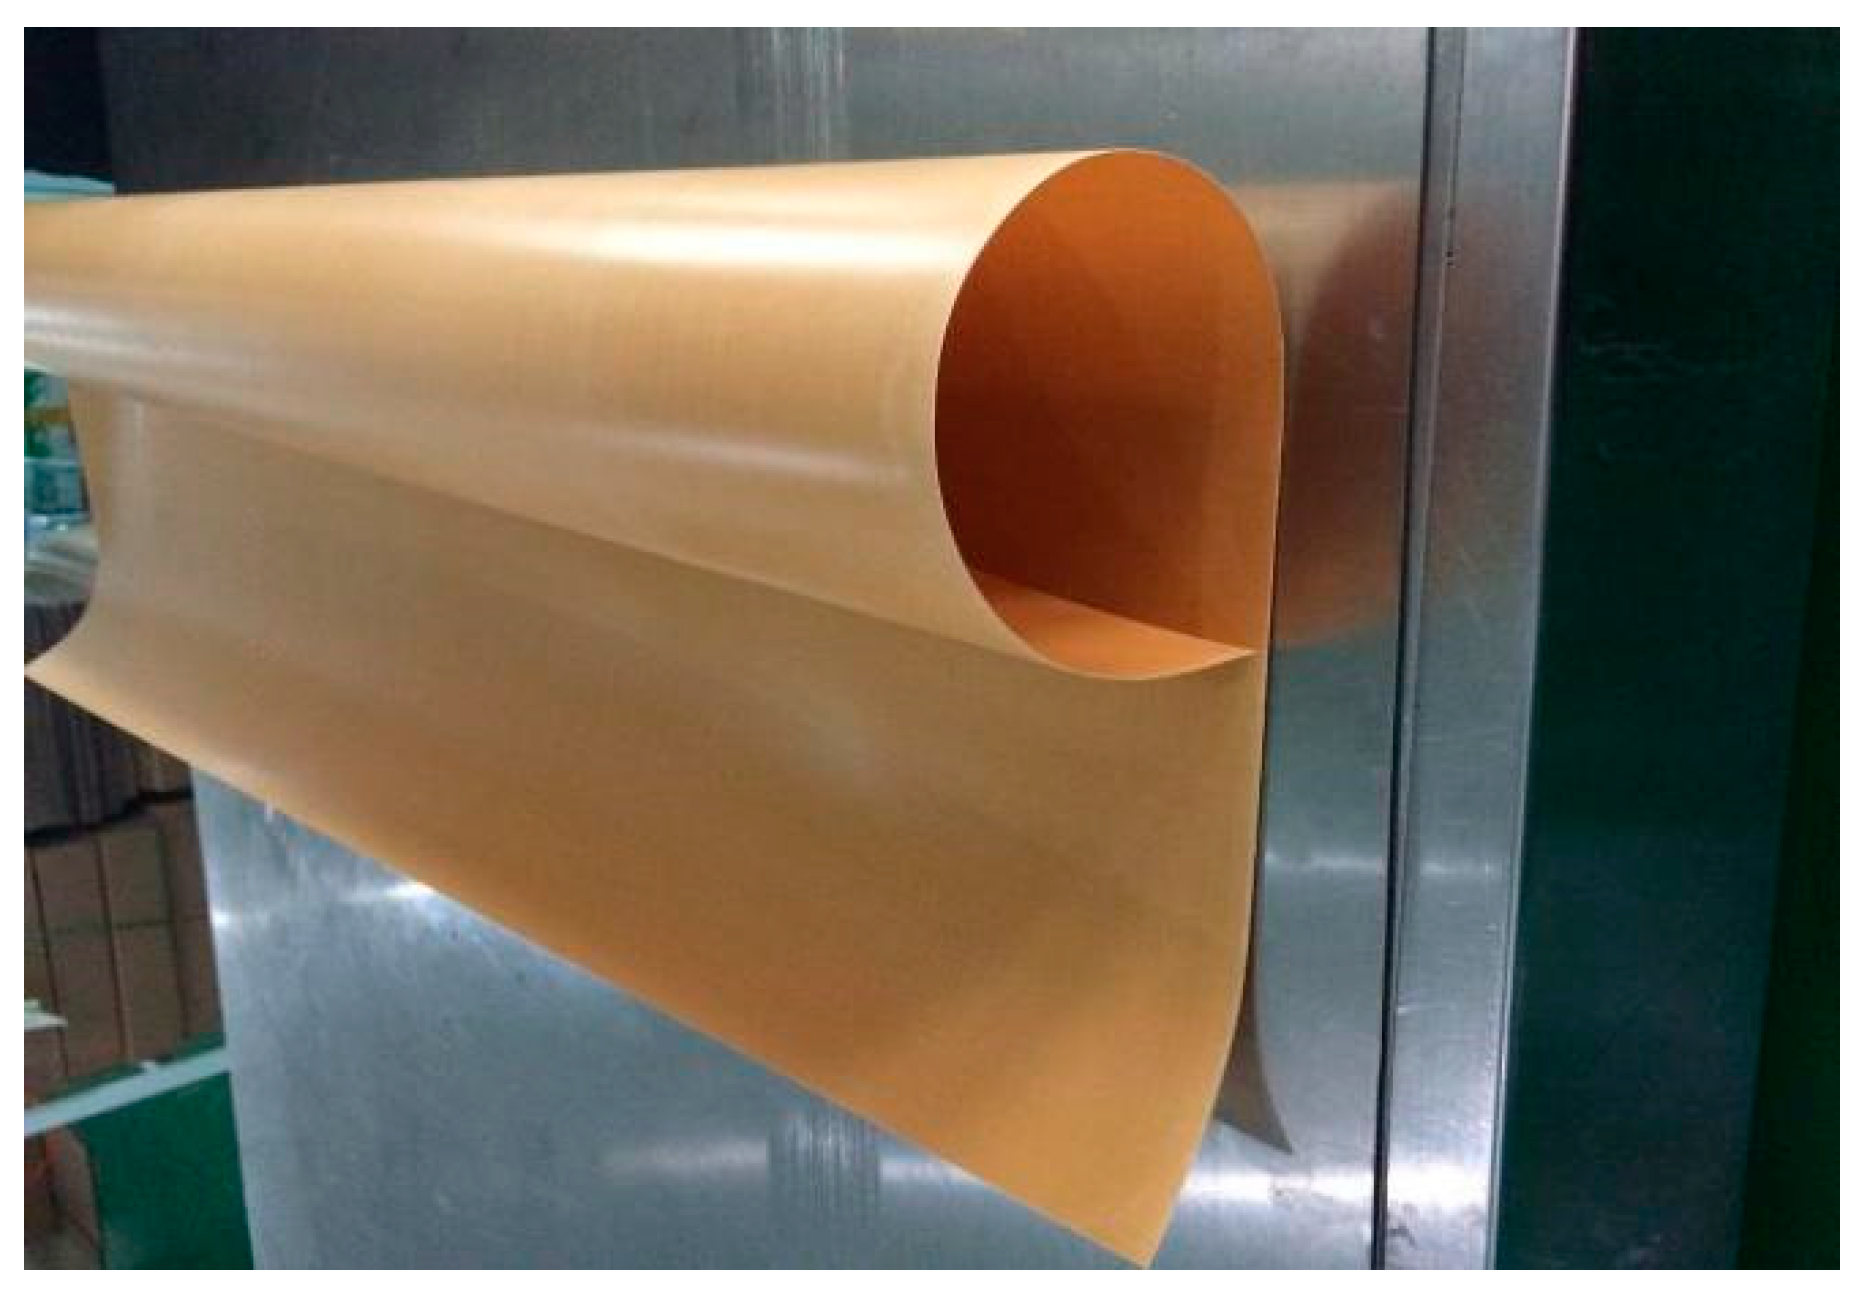
The anionic and cationic heterogeneous ion exchange membranes used in this work for the electro coating process and water treatment are depicted in Figure 2. Superior in terms of performance and physical stability, our cation exchange membranes are suitable for use in AED processes of all kinds. Table 2 lists the technical specifications for cation exchange flat sheet membranes.

2.4. Acetic Acid (AA)

The cathode chamber was flushed with it as a cleaning solution. It is monoprostonic acid and acetic acid, which have the formula CH3COOH. In aqueous solution, this acid dissociates partially into hydrogen ions (H+) and acetate ions (CH3COO-). The produced hydrogen ions (H+) can decrease the solution pH and dissolve metal precipitates, while the acetate ions may complex with other metal ions present in the solution [Rashid 2015].

3. Experimental Setup

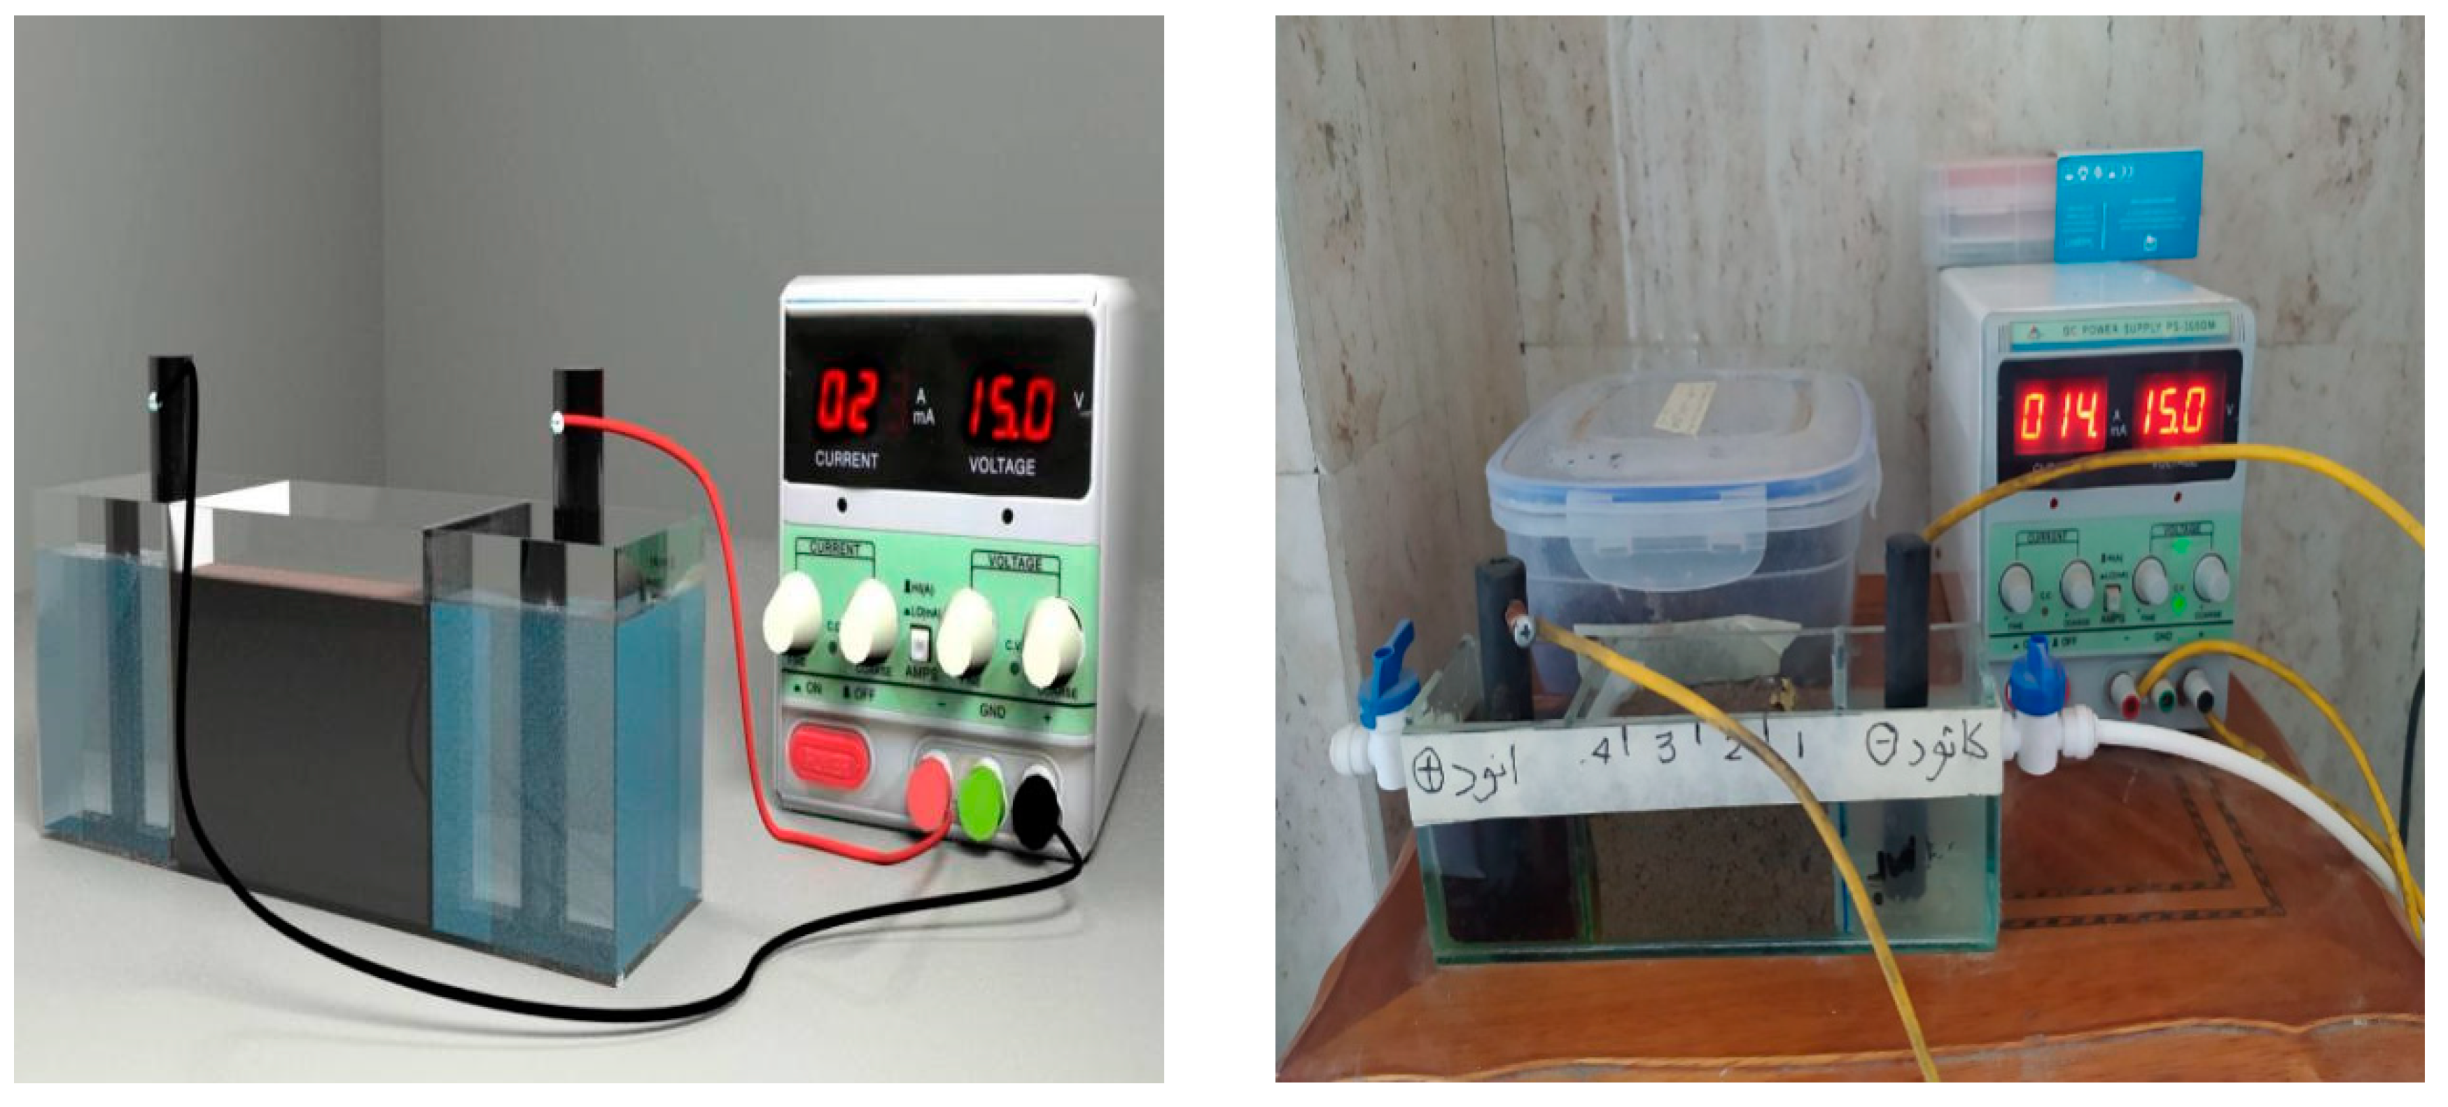
Figure 3 shows the four shapes of the EK experimental setup presented in this study by using electro kinetic with and without membrane techniques. The first set up experiment consisted of a rectangular chamber made of plexiglass (7 cm D * 6cm W * 22cm L) and divided into three chambers, which were made of rectangular chambers in the middle ( 7cm D* 6cm W* 10cm L) and each side (7cm D* 6cm W* 6cm L), 2 electrodes, a power supply, and a multi-meter. Sludge with a height of 5 cm is created in the cells centre. The anode and cathode were placed in the middle of the chambers on either side of the cell, creating an anode and cathode pair. The cathode and anode electrodes were comprised of two cylindrical graphite electrodes that were chemically inert to electrolysis operations (the diameter and length of the electrodes were 1.5 cm and 10 cm, respectively). Additional chemical species may complicate electrochemistry during processing if inert electrodes are used. Because the oxidation process has a very corrosive impact on the anode, its utilization is essential there [Acar and Alshawabkeh 1996]. The length of the sludge specimen in this cell was determined to be five centimeters. Electro-osmotic water flow may be achieved by perforating the plexiglass surfaces of the middel chamber. Sludge could not enter the electrode compartments because the edges of the intermediate chamber were lined with filter paper.
According to Ref. [Turer and Genc 2005], the electrolysis gases were vented via the open tops of the anode and cathode chambers. Power cables placed into the electrodes' tops provided continuous voltage, and a multimeter was used to monitor voltage as well as quantify the flow of current through sampled sludge as reported by Ref. [Faisal and Hussein 2015]. The second setup experiment was the same arrangement as the first setup experiment except the membrane had dimensions (6cm D* 6cm W) inserted between filter paper and the contaminated sludge on the side surface of the middle chamber near the cathode chamber. These experiments were conducted using distilled water (pH ~ 10 ) as the catholyte.
Figure 3 also displays a schematic diagram of the setup (third & fourth) experiments using the electro kinetic with and without membrane, the same arrangement as the setup experiments ( first & second), except that these experiments were conducted using 1M acetic acid (pH ~ 3 ) as the catholyte. Because acetic acid is a weak acid that cannot strongly dissociate, it is frequently sufficient to drop sludge pH, and as a consequence, adding acetic acid to sludge would not significantly enhance sludge electrical conductivity [Saeedi and Gharehtapeh 2013].
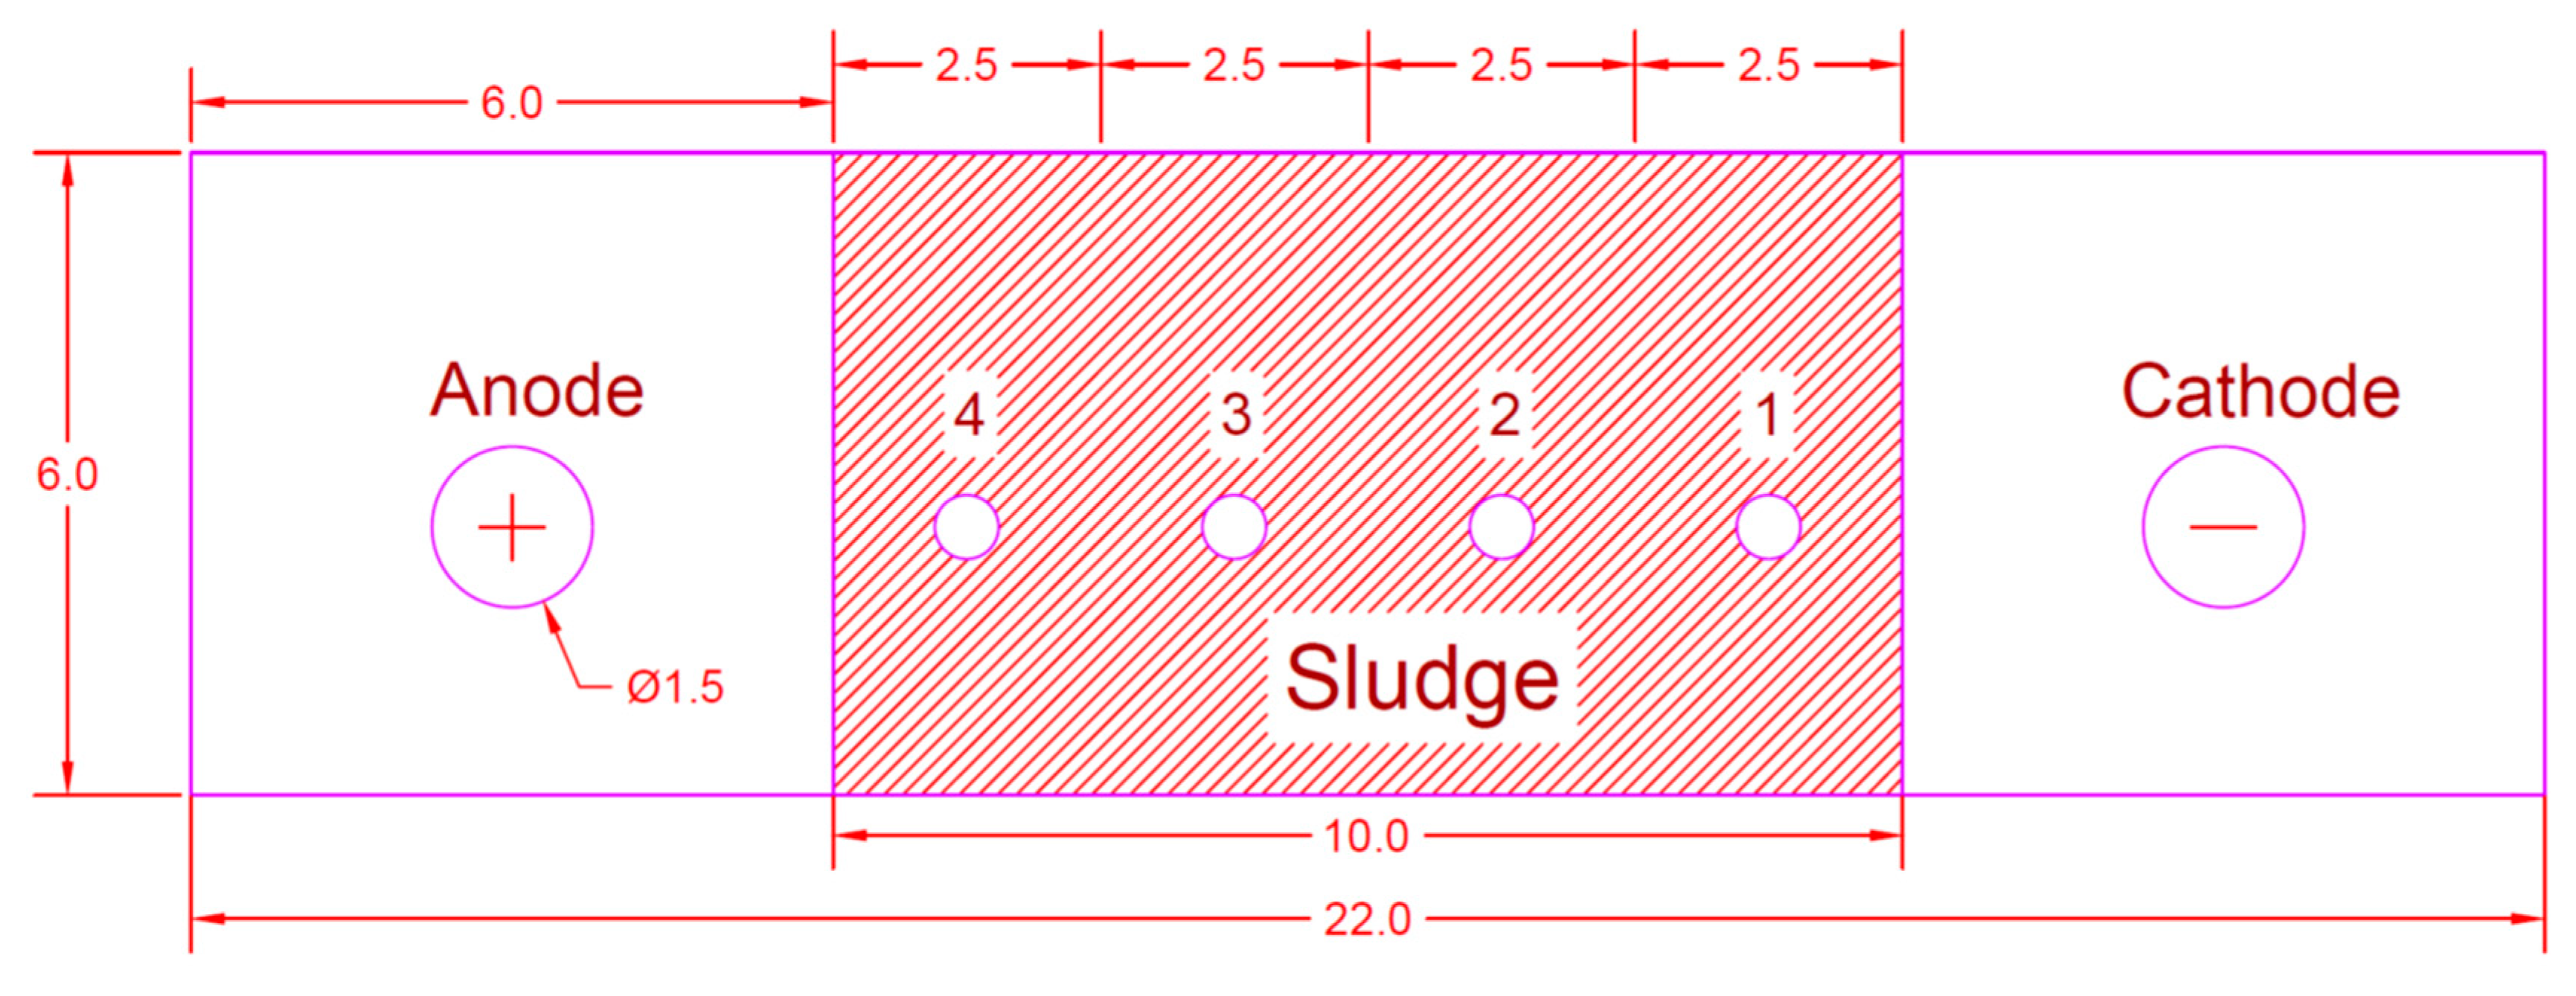
Figure 4 explains the schematic diagram of four shapes of the setup EK experiments: sludge sampling point (0) and the arrangement of the electrodes (C, cathode; A, anode). After EK operation for 96 hr, sludge samples were collected at the indicated points (Figure 4 using a hand auger). Then, the samples were dried, crushed, and used for analysis, as described by [Kim et al. 2014]. Table 3 summarizes the results of four series of experiments to determine the effect of an electrode arrangement with and without a membrane on the mechanical, chemical, and physical properties of chromium-contaminated sludge in electro kinetic remediation experiments (i.e., an electric field with a potential gradient of 1.5 V/cm).
At the end of each experiment, the sludge specimen was removed from the cell, depending on the layout of the sampling points, as described by [Wan et al. 2019], which is shown in Figure 4 to determine the remaining chromium and the pH in the sludge. The distance between sampling points (1, 2, 3, and 4) was equal to 2.5 cm between each point. Sample point (4) was near the anode electrode, whereas sample point (1) was near the cathode electrode.

Analysis of Samples

The contaminated sludge samples were analyzed to determine the amount of residual chromium ions in the sludge. One gram of dry sludge was taken and digested with HCl/HNO3 solution at a percent of 25:5 (v/v) (6). The chemical properties of the contaminated sludge sample are pH (7.8), organic matter content (OMC) (4.36%), calcium carbonate (CaCO3) (18.7889%), sulphate ions (SO4) (0.15 mg/l) and chloride content(Cl-1)(1.099 mg/l). The average removal efficiency of total chromium was obtained by the electro kinetic remediation process technique, according to the procedure adopted by many studies, such as Ref. [Faisal and Hussein 2015; Rosul and Amal 2020; Shen et al.2007].

4. Results and Discussion

4.1. Results of Sludge Analyses

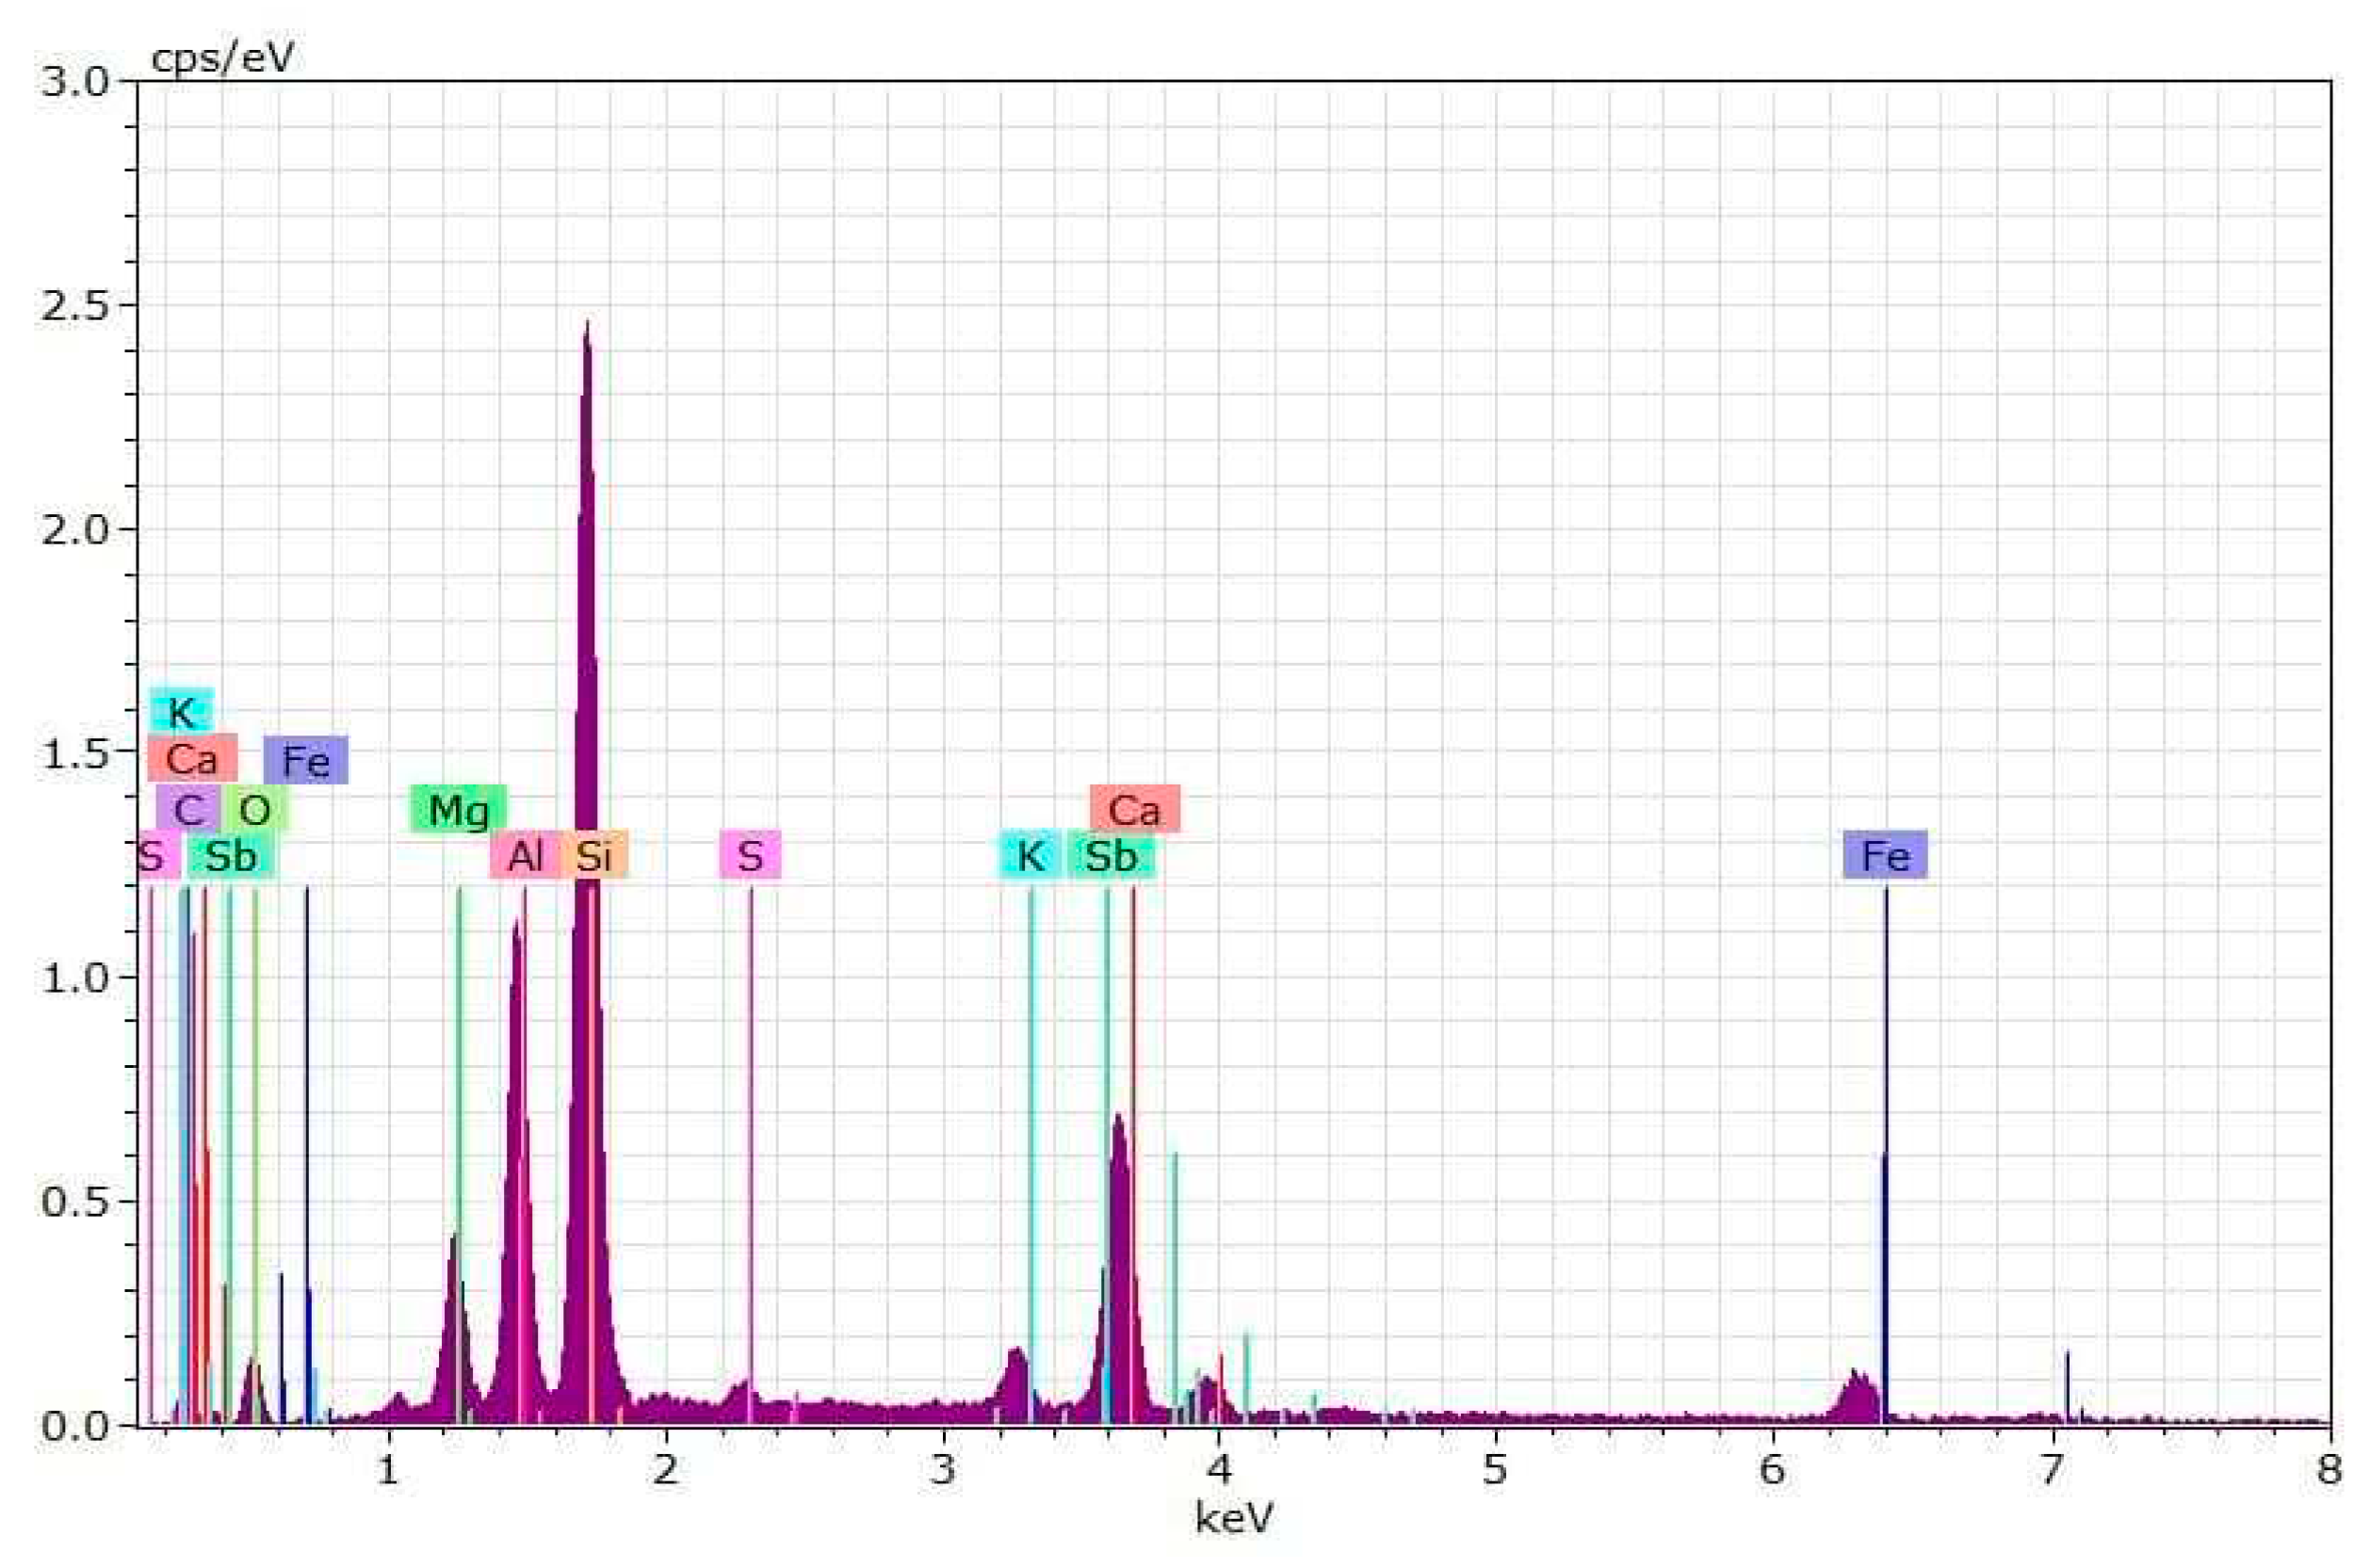
Because of its strong buffering capacity, the pH of sludge had an acidity level equal to 8.25 and a calcium carbonate concentration of 25.18455%. The sludge was categorized as silty clay sludge based on particle-size distributional analysis. Table 1 demonstrates this. Figure 5 shows the EDS curve for sludge, which shows that Si, Ca, K, S, Cl, Mg, Al, Na, Mg, Sb, and Fe are present in relatively high amounts.

4.2. Unenhanced Condition Experiment

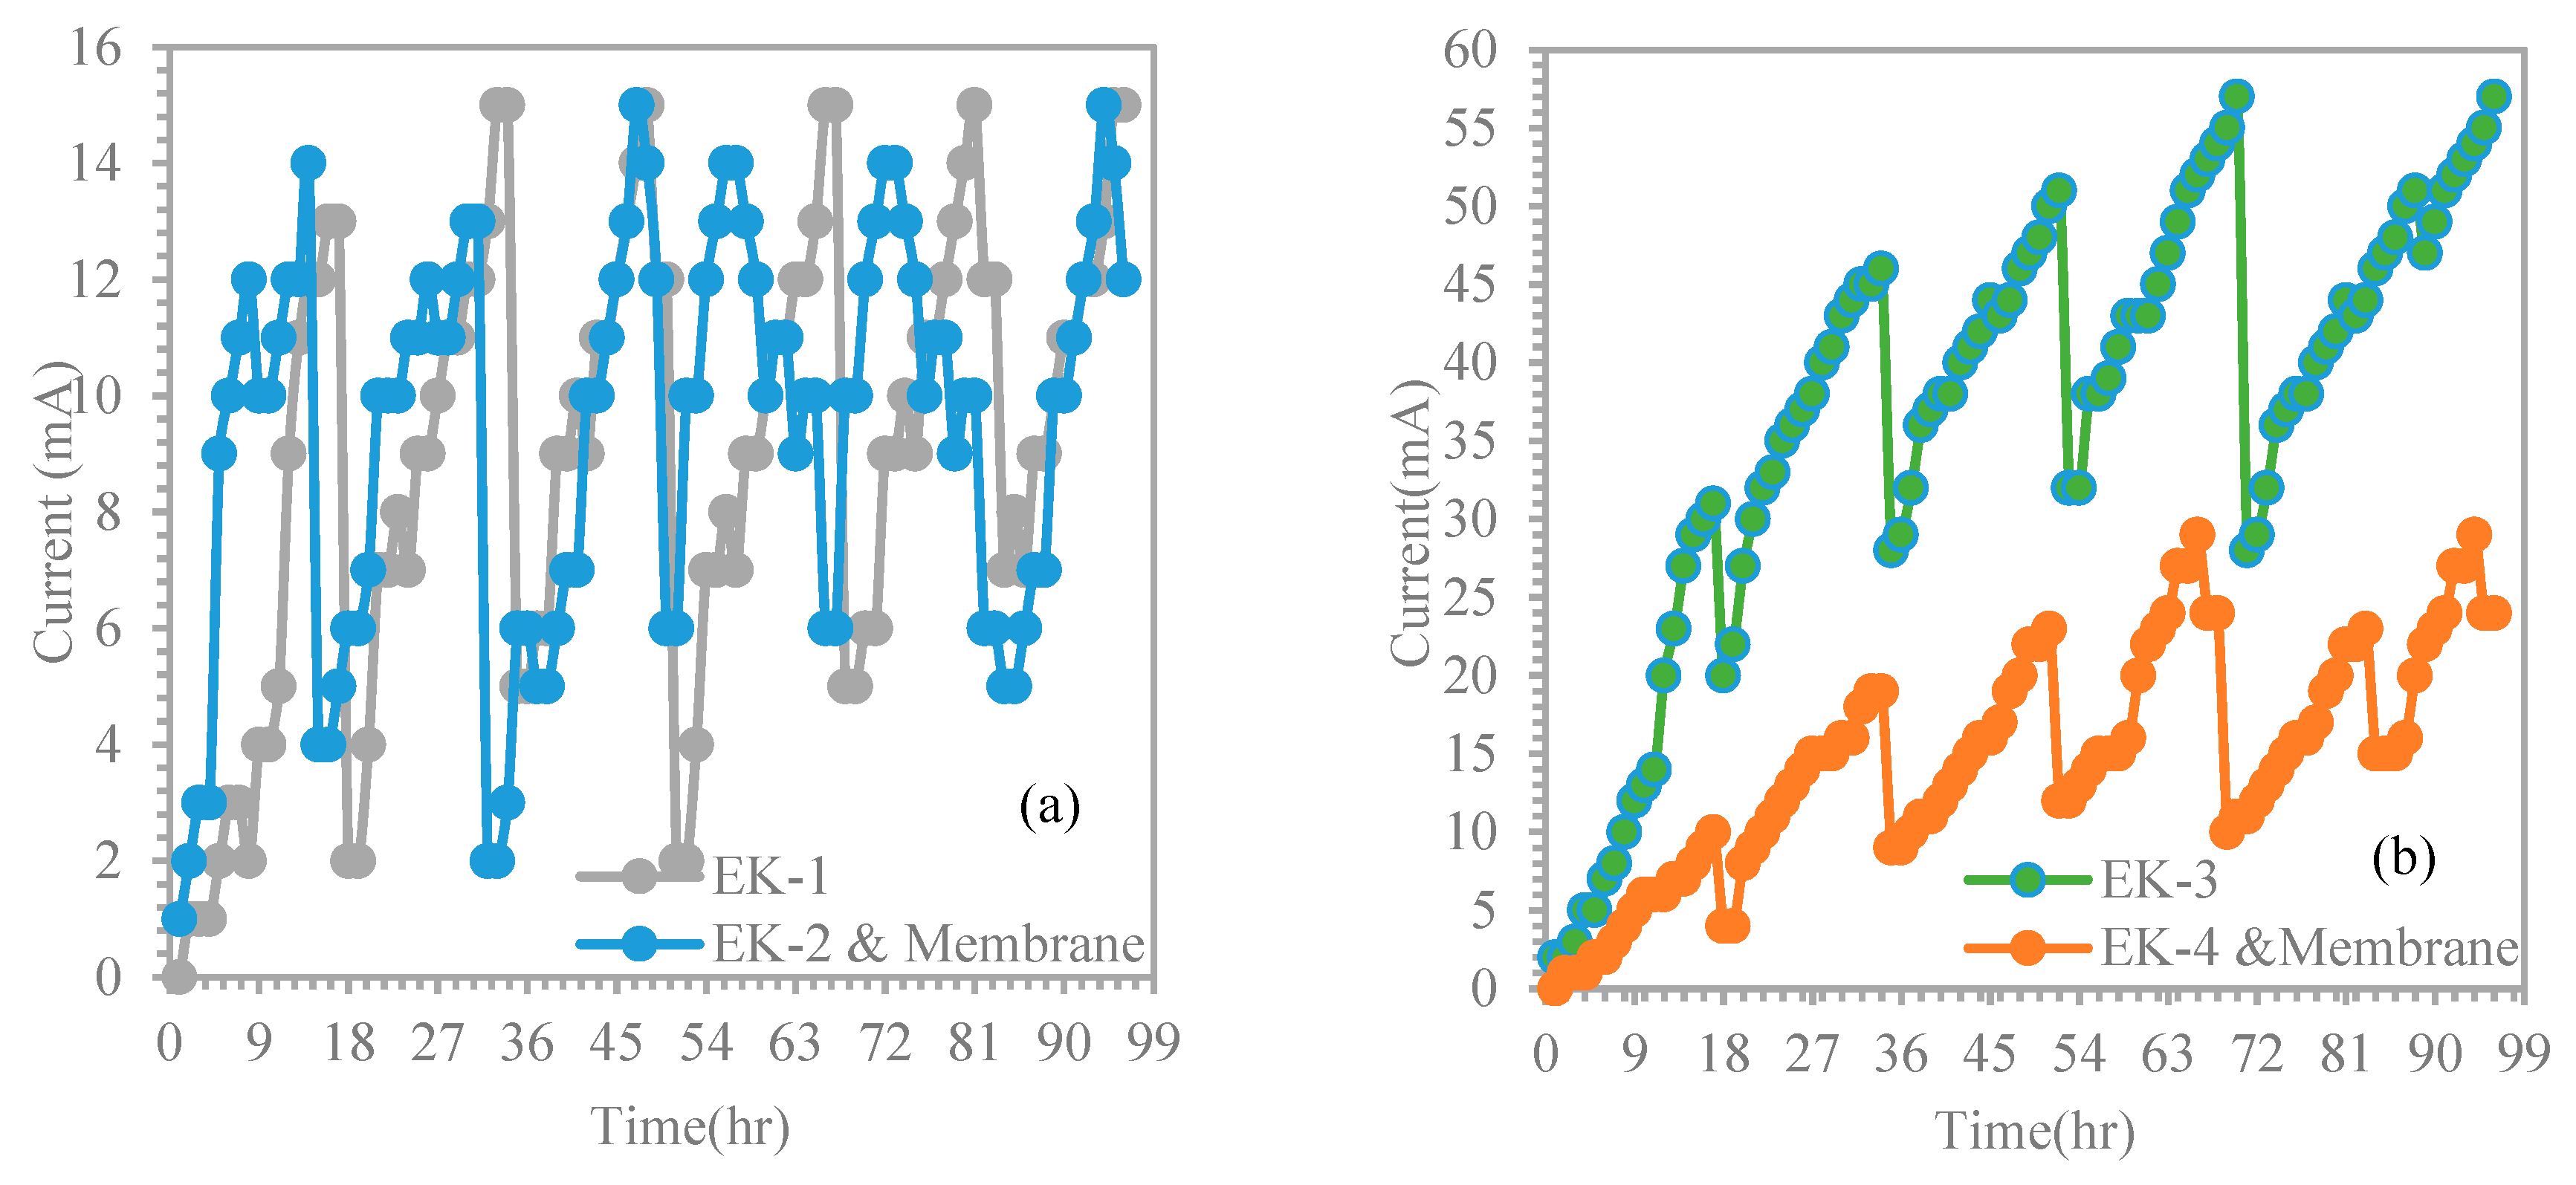
To study the effect of electric variation with time, the experimental results of EK-1 are compared with the results of EK-2 &Membrane (Figure 6a). Study tests have the conditions (i.e. initial Cr+3 concentration of 599.8 mg/kg, voltage gradient of 1.5 V/cm, treatment duration of 4 days, the cell height of 5cm and using distilled water (pH ~ 10 ) as catholyte. Using Membrane with contaminated sludge in EK-2 & Membrane represented the difference with EK-1. Similar observations were made with tests EK-3, EK-4& Membrane except that acetic acid (pH ~ 3 ) was used as the catholyte (Figure 6b). For EK-1, EK-2 & Membrane, the current gradually increased to reach high values of 15 and 12 mA compared to the current values of EK-3 and EK-4 &Membrane, which were 57 and 24 mA, respectively. However, there was evidence of fluctuation in the current profile for all tests EK-1, EK-2 & Membrane, EK-3, and EK-4 &Membrane. However, an appreciable difference between the current values of EK-1, EK-2 &Membrane and EK-3, EK-4& Membrane can be recognized. This may be due to the effect of using acetic acid, which uniformly supplies the ions of the puring solution through the soil medium from the cathode to the anode electrode. Therefore, the current flowing through the soil was determined using soil conductivity, which is determined by the concentration of ionic species in the pore fluid. This suggests that larger ionic concentration are responsible for higher current values going through the soil.
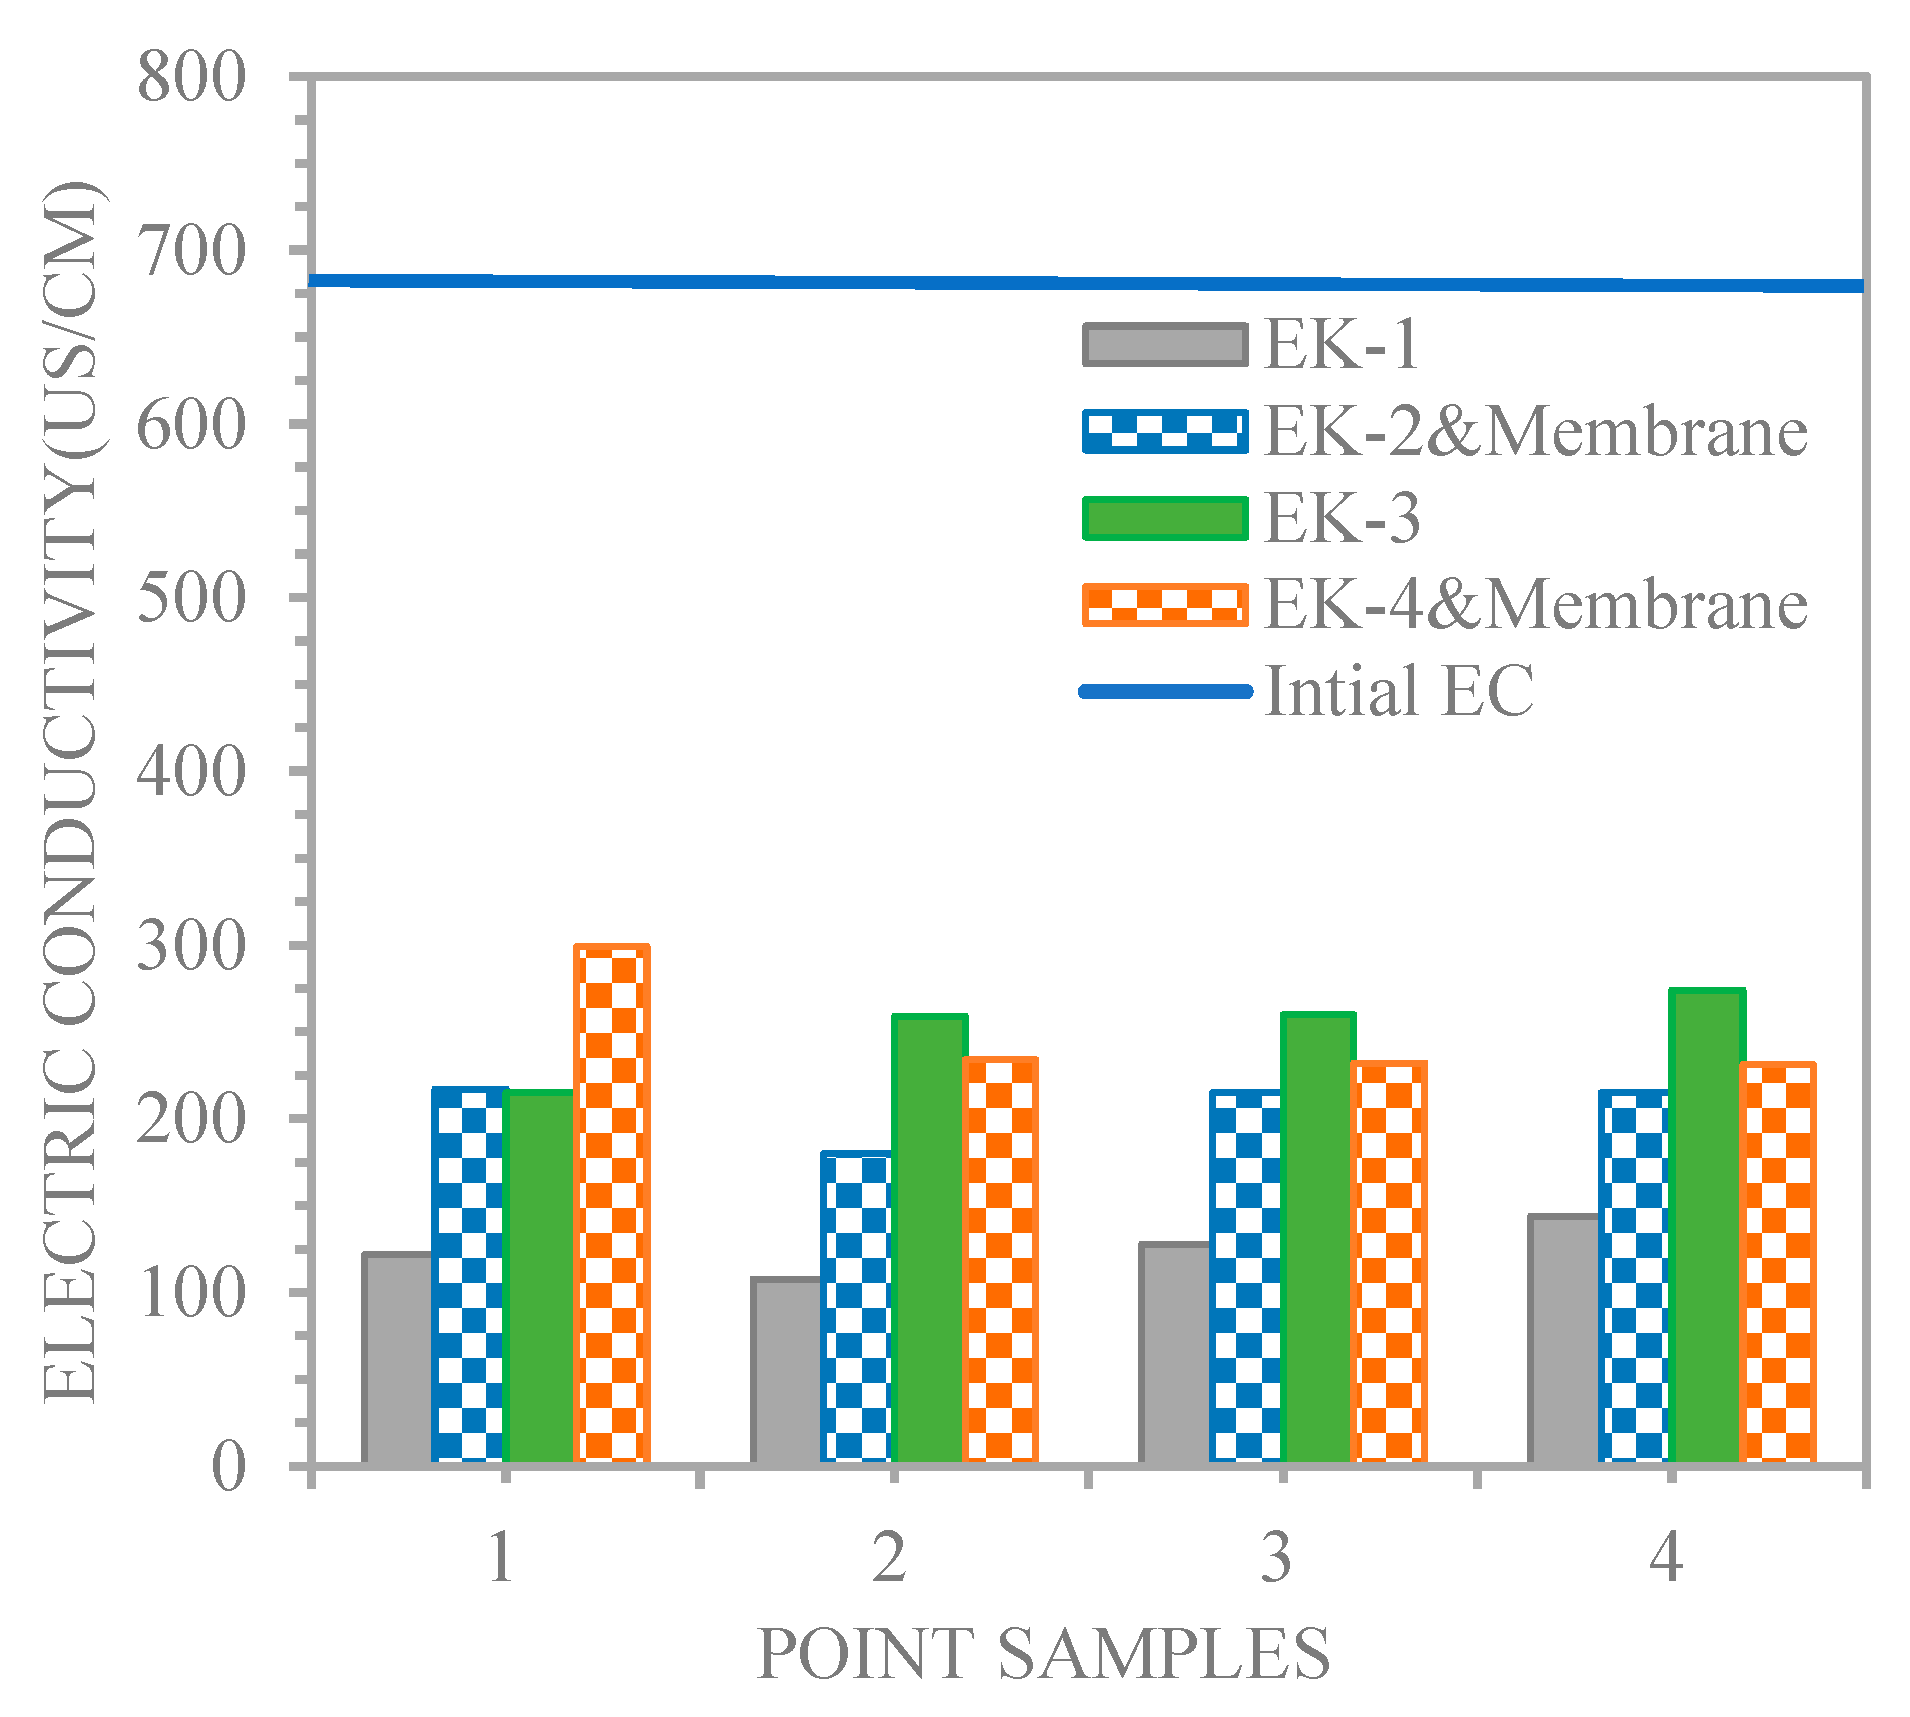
The quantity of ion electro migration is an indicator of the electric current [Shen et al.2007]. Therefore, the electric current variations for the EK-1, EK-2 &Membrane, EK-3, EK-4 &Membrane experiments are regarded as a function of the distances from the cathode for the lines of sample points 1, 2, 3 and 4. Figure 7 The soil electrical conductivity increase in the experiments (215, 259, 260, 274 and 299, 234, 232, 231 μ s / c m for EK-3, EK-4 &Membrane, respectively) is greater than that in the experiments (121.8, 107.5, 127.7, 143.8 and 217, 179.8, 215, 215   μ s / c m for EK-1, EK-2 &Membrane). [Saeedi et al. 2013] indicated that dissociation of some compounds, such as acetic acid, might increase the soil electrical conductivity during experiments. Therefore, acetic acid positively enhanced the electrical current through the soil.
Effect of electrokinetic remediation with chromium-contaminated soil on the chemical properties
On the other hand, according to Ref. [Delil and Köleli 2018], the solubility of heavy metal ions in soil depends on the heavy metal structure and the chemical compounds, pH, and Eh (redox potential) methodologies. There are scientists who believe that pH is a critical factor in how soil pollutants are absorbed and mobilized. During the investigation, it was discovered that the polluted sludge had an acidic pH of 7.8, whereas the native sludge had an alkaline pH of 8.26. Sludge samples having the greatest pH buffering ability owing to their high salt content, such as calcite, carbonate, or other kinds, had a modest variance in pH value. Calcium carbonate (CaCO3) concentrations were found to be 25.1846 % in native sludge and 18.7889% in polluted sludge.
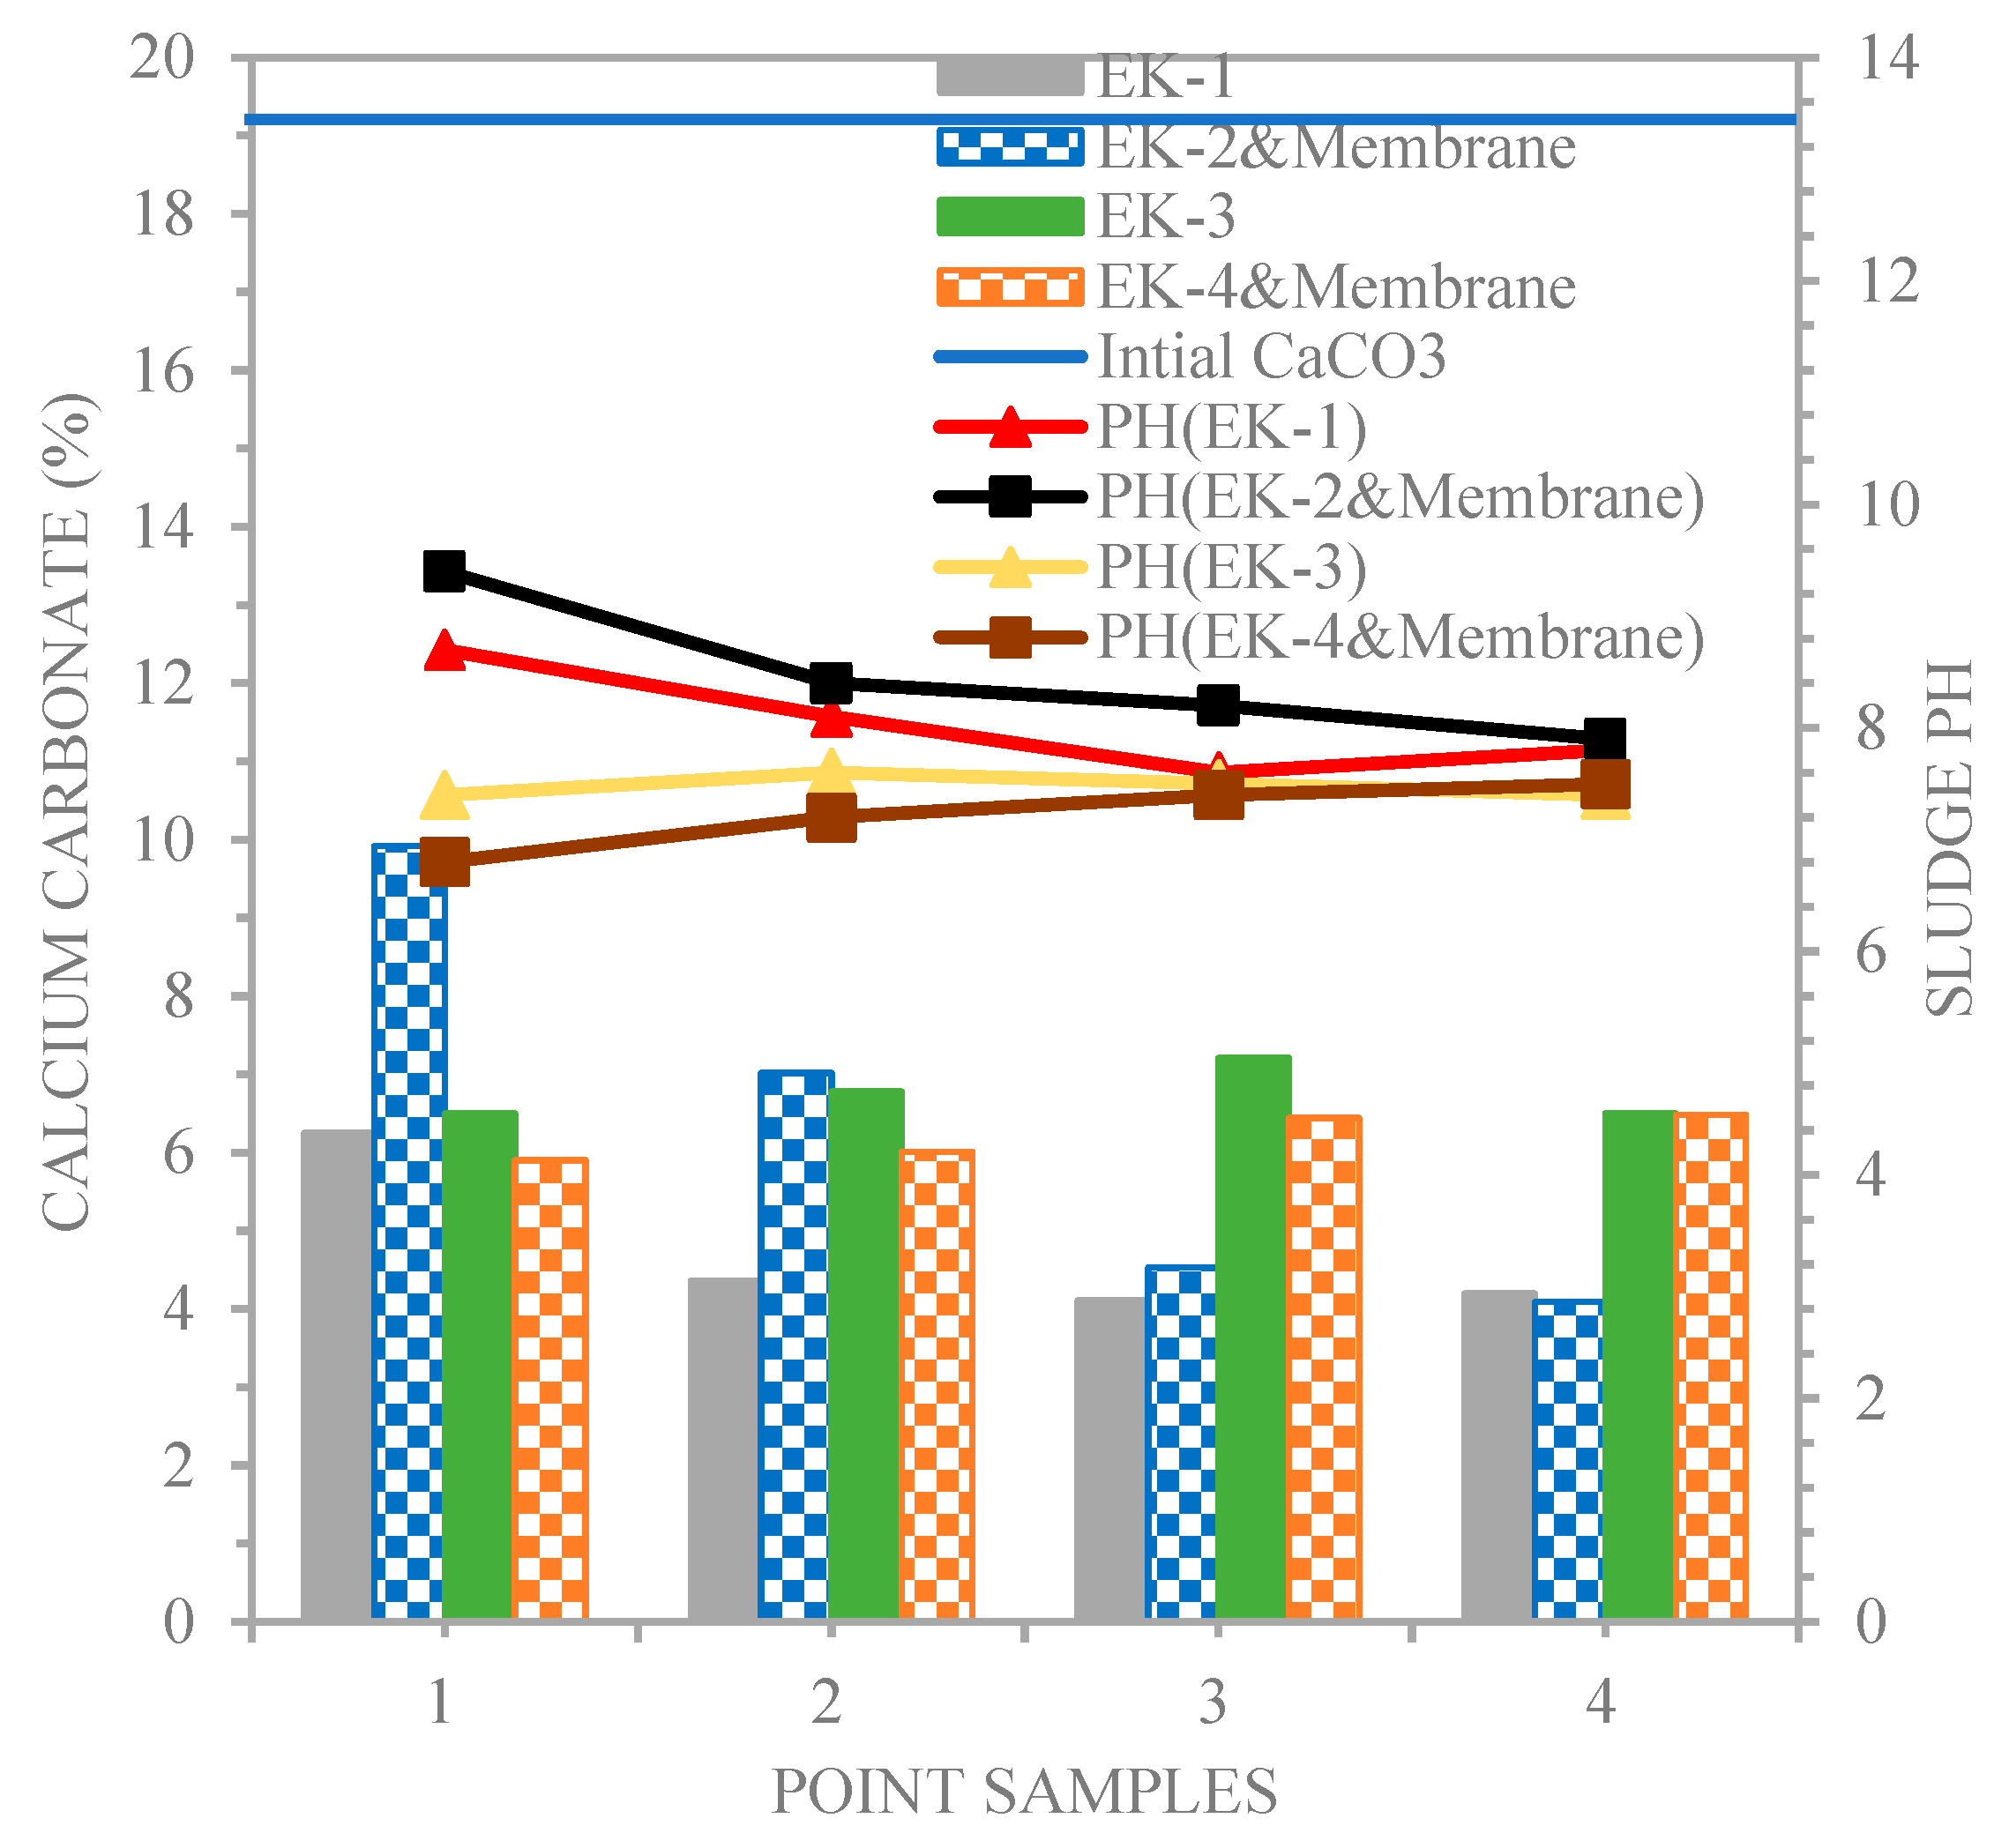
Figure 8 shows that the calcium carbonate (CaCO3) and pH values were 6.25, 4.36, 4.11, and 4.20% and 8.7, 8.1, 7.6, and 7.8(EK-1), 9.9146, 7.02, 4.53, and 4.09% and 9.4, 8.4, 8.2, and 7.9(EK-2 &Membrane), 6.5, 6.781, 7.21, and 6.498% and 7.4, 7.6, 7.5, and 7.4 (EK-3) and 5.9, 6.01, 6.44, and 6.48% and 6.8, 7.2, 7.4, and 7.5 (EK-4 &Membrane), respectively. The effect of the anode electrode and membrane placed in the soil with a high buffering capacity (higher pH buffering capacity due to its high content of carbonate) under the action of acetic acid as a catholyte dissociated had a more remarkable input of H+ ions, which led to a decrease in the soil pH throughout the sampling points along the line of the sludge beginning at the cathode for EK-3, EK-4 &Membrane. This technique would prevent the soil pH from reaching a high value due to the transport of H+ ions produced from one anode electrode to the cathode during the electro-kinetic technique by electro migration. [Almeira et al. 2009] studied the effect of electrode configuration on the acid/basic region, minimizing the basic area and maximizing the acidity of the soil.
In Table 4, the values of chloride ions was 0.5998 mg/L (Native sludge), 0.0999, 0.0999, 0.1599, 0.199 mg/L(EK-1), 0.1999, 0.4998, 0.4998, 0.5990 mg/l(EK-2 &Membrane), 1.1996, 1.299, 1.299, 1.399 mg/L (EK-3) and 1.16, 1.099, 1.099, 1.1996 mg/l (EK-4 &Membrane) sludge samples points, respectively, corresponding to a reduction of 83.3, 83.3, 73.3, 66.8% ( EK-1 ), 66.7, 16.7, 16.7, 0.13% ( Ek-2&Membrane ), -100, -116.6, -116.6, -133.2% ( EK-3 ) and -93.4, -83.2, -83.2, -100% (Ek-4&Membrane), respectively, as compared with the Native sludge. The reduction decreased with increasing distance from the cathode for lines 1, 2, 3 and 4 in EK-1 and EK-2 & Membrane, except in EK-3 and EK-4 & Membrane.
Scanning electron microscopy (SEM) of sludge samples
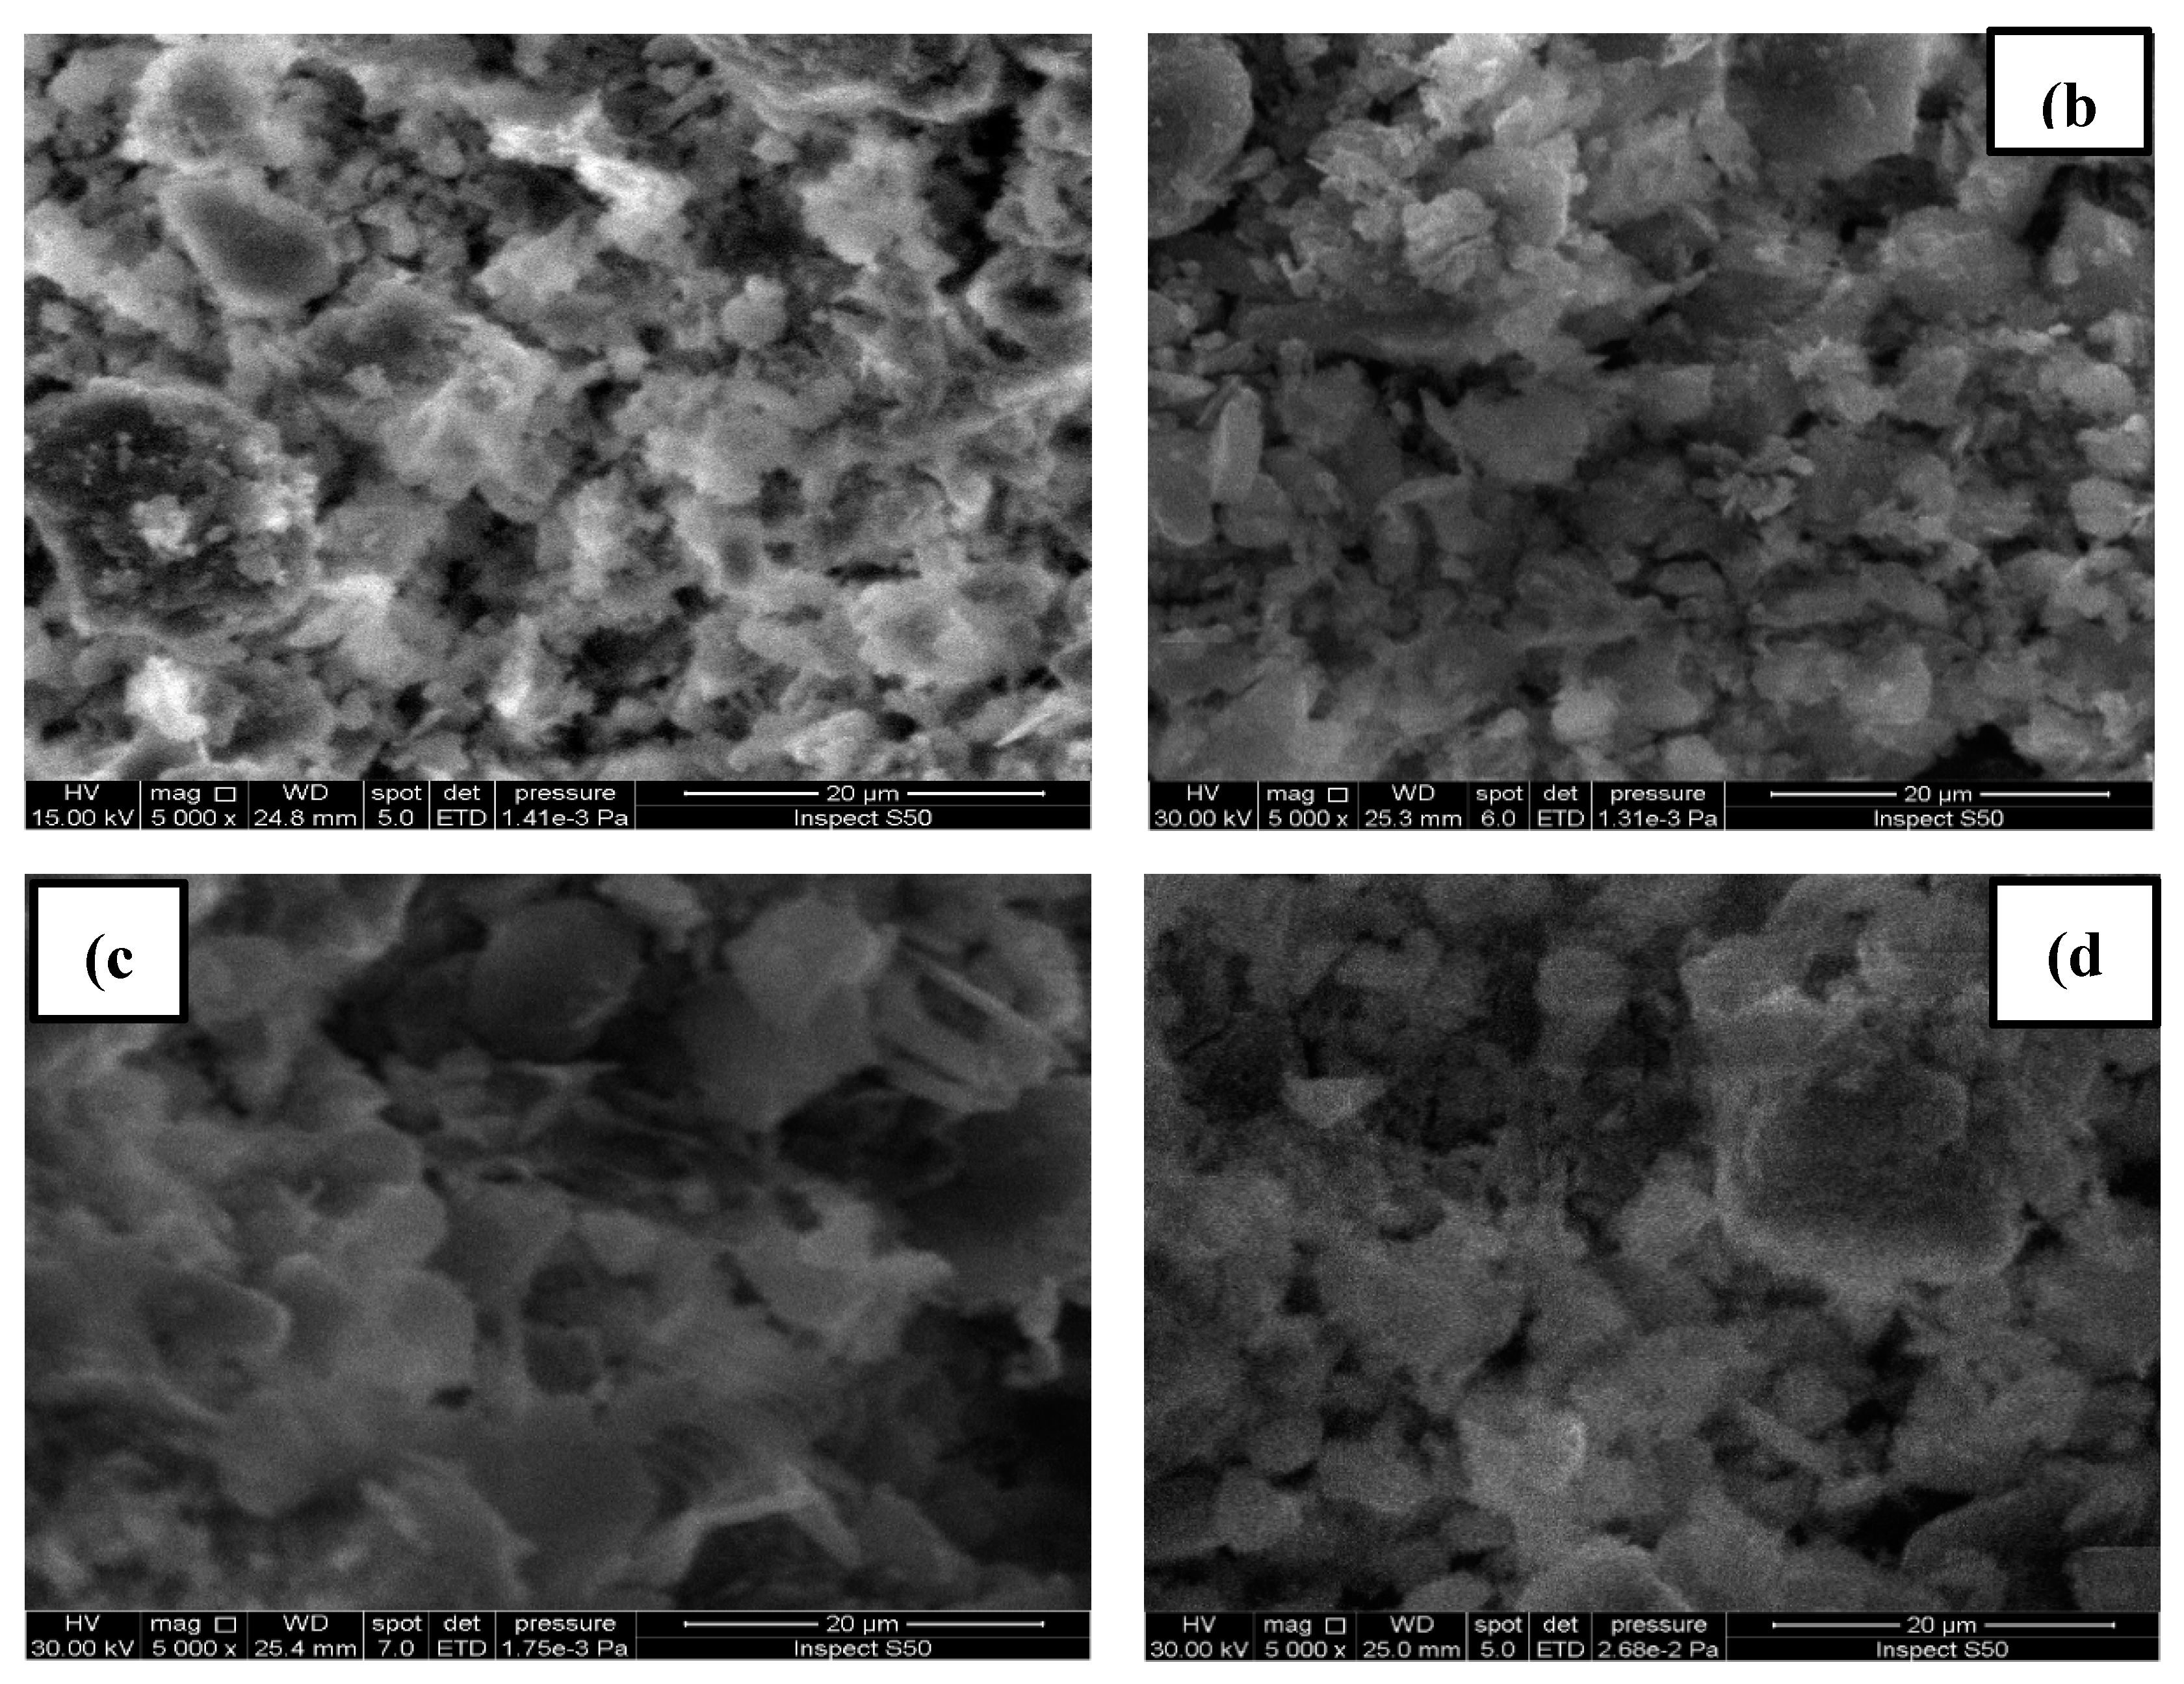
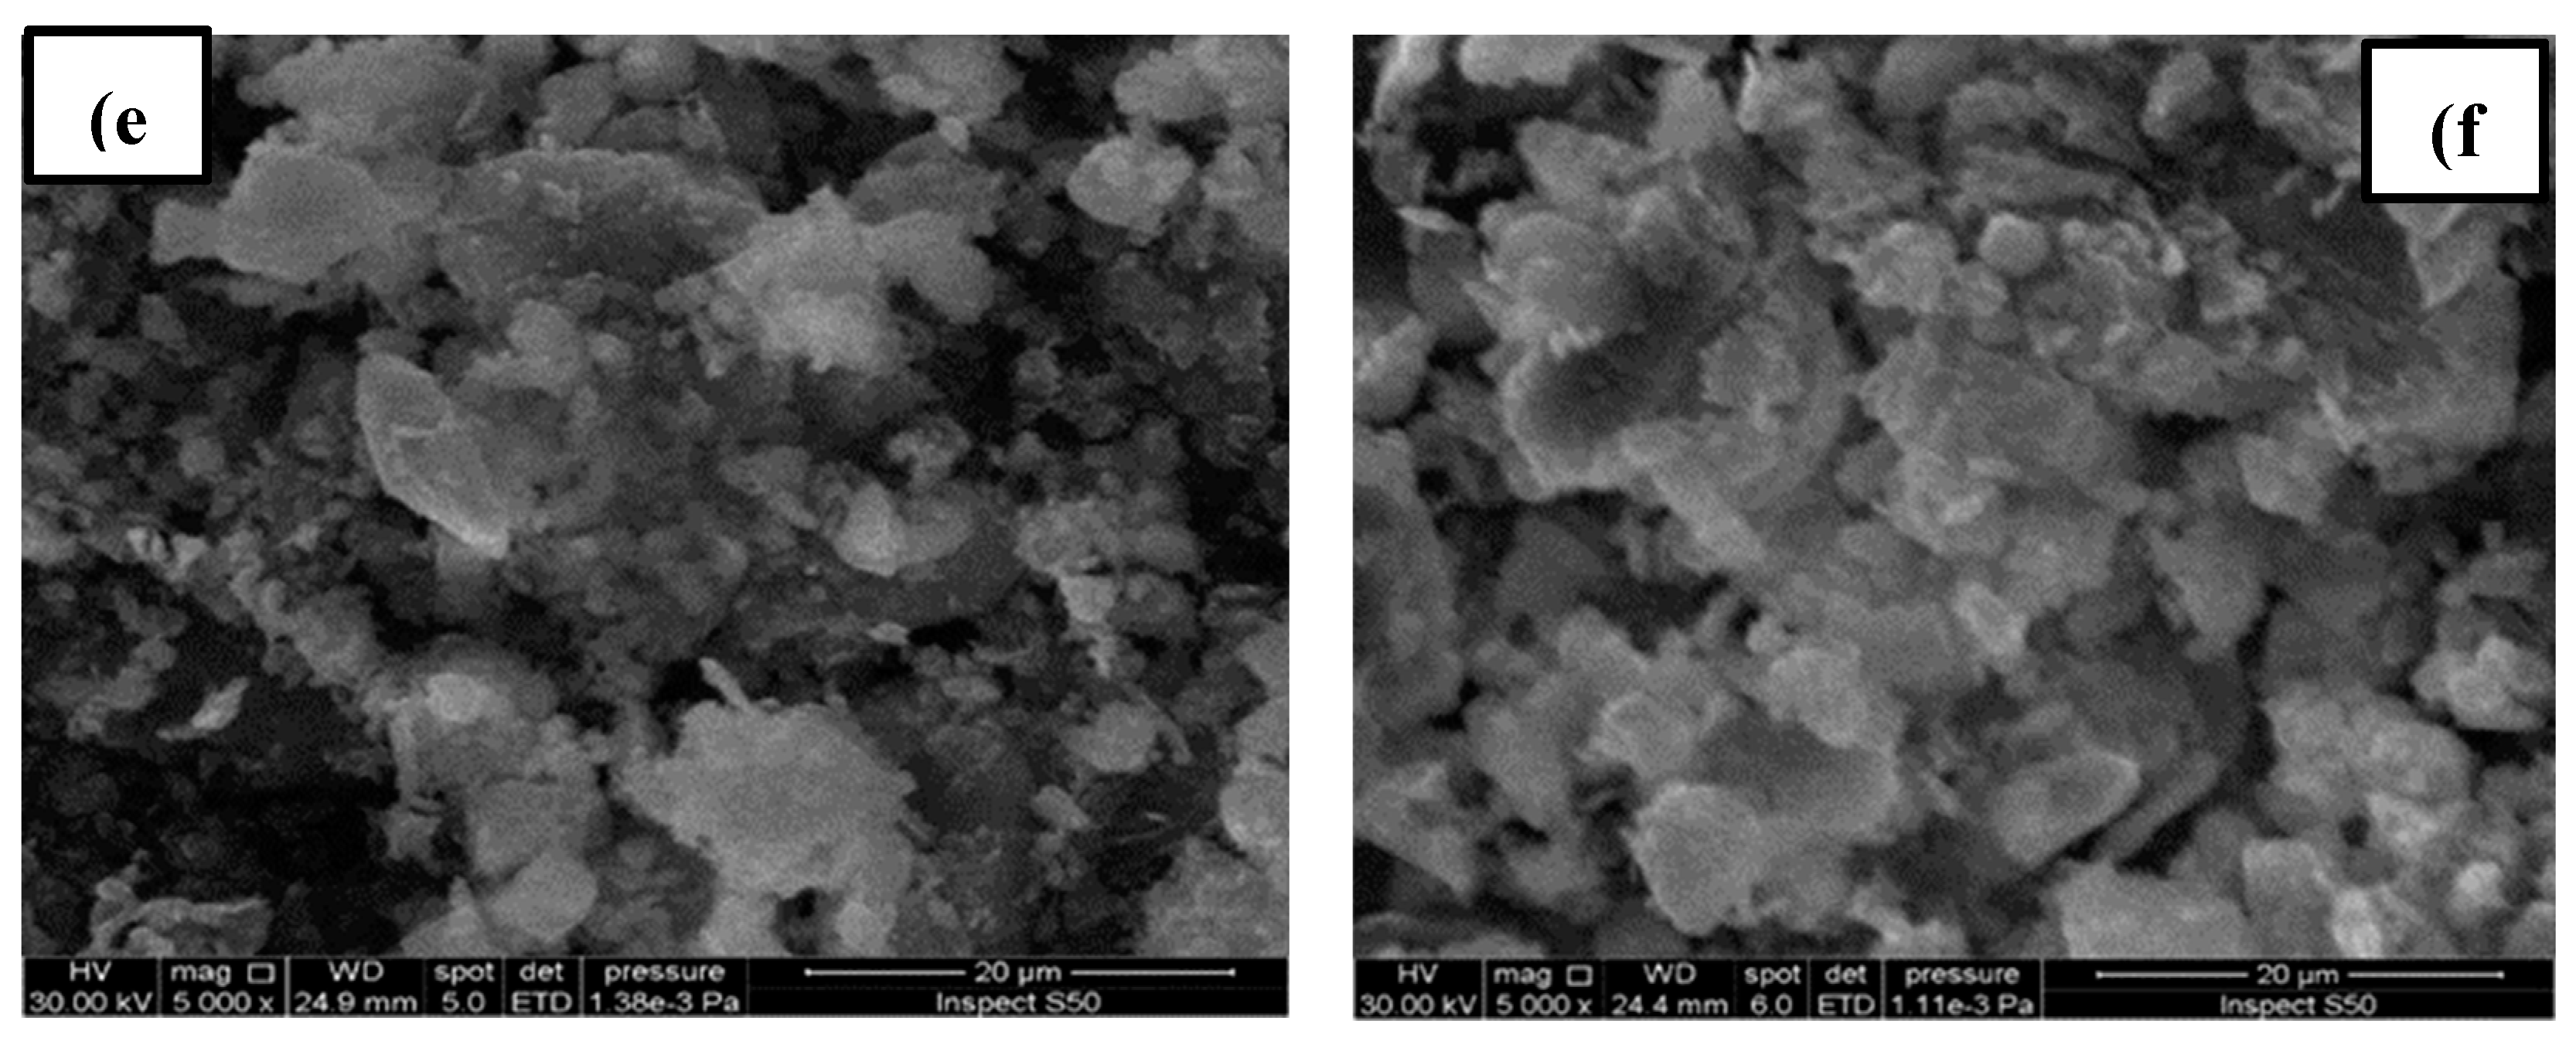
Scanning electron microscopy (SEM) images of sludge particles and pore structures were used to characterize electro kinetic treatment processes with and without membranes. Magnification of sludge, chromium- contaminated sludge, and sludge treatment (EK-1, EK-2 &Membrane, EK-3 and EK-4 & Membrane)was performed to a 20 μ m scale by scanning electron microscopy (SEM). Before and after the electro kinetic treatment operations, the morphological parameters of the sludge samples before and after the removal of chromium ions are shown in Figure 9. As seen in Figure 9(b), the sludge particles are saturated with residues of pollutant, resulting in the sludge surface being coated in with (chromium ions).
There will be no more pollutants sorbed as a consequence of the reduction in sorption [ Hayder and Ayad 2018]. Compared to (EK-2 & Membrane) and (EK-4 & Membrane) where Membrane were added to contaminated sludge with chromium ions, the pore spacing between sludge particles for (EK-1, EK-3) was larger (c, d, e & f).

4.3. Distributions for pH and Chromium in the Electro kinetic Experiments.

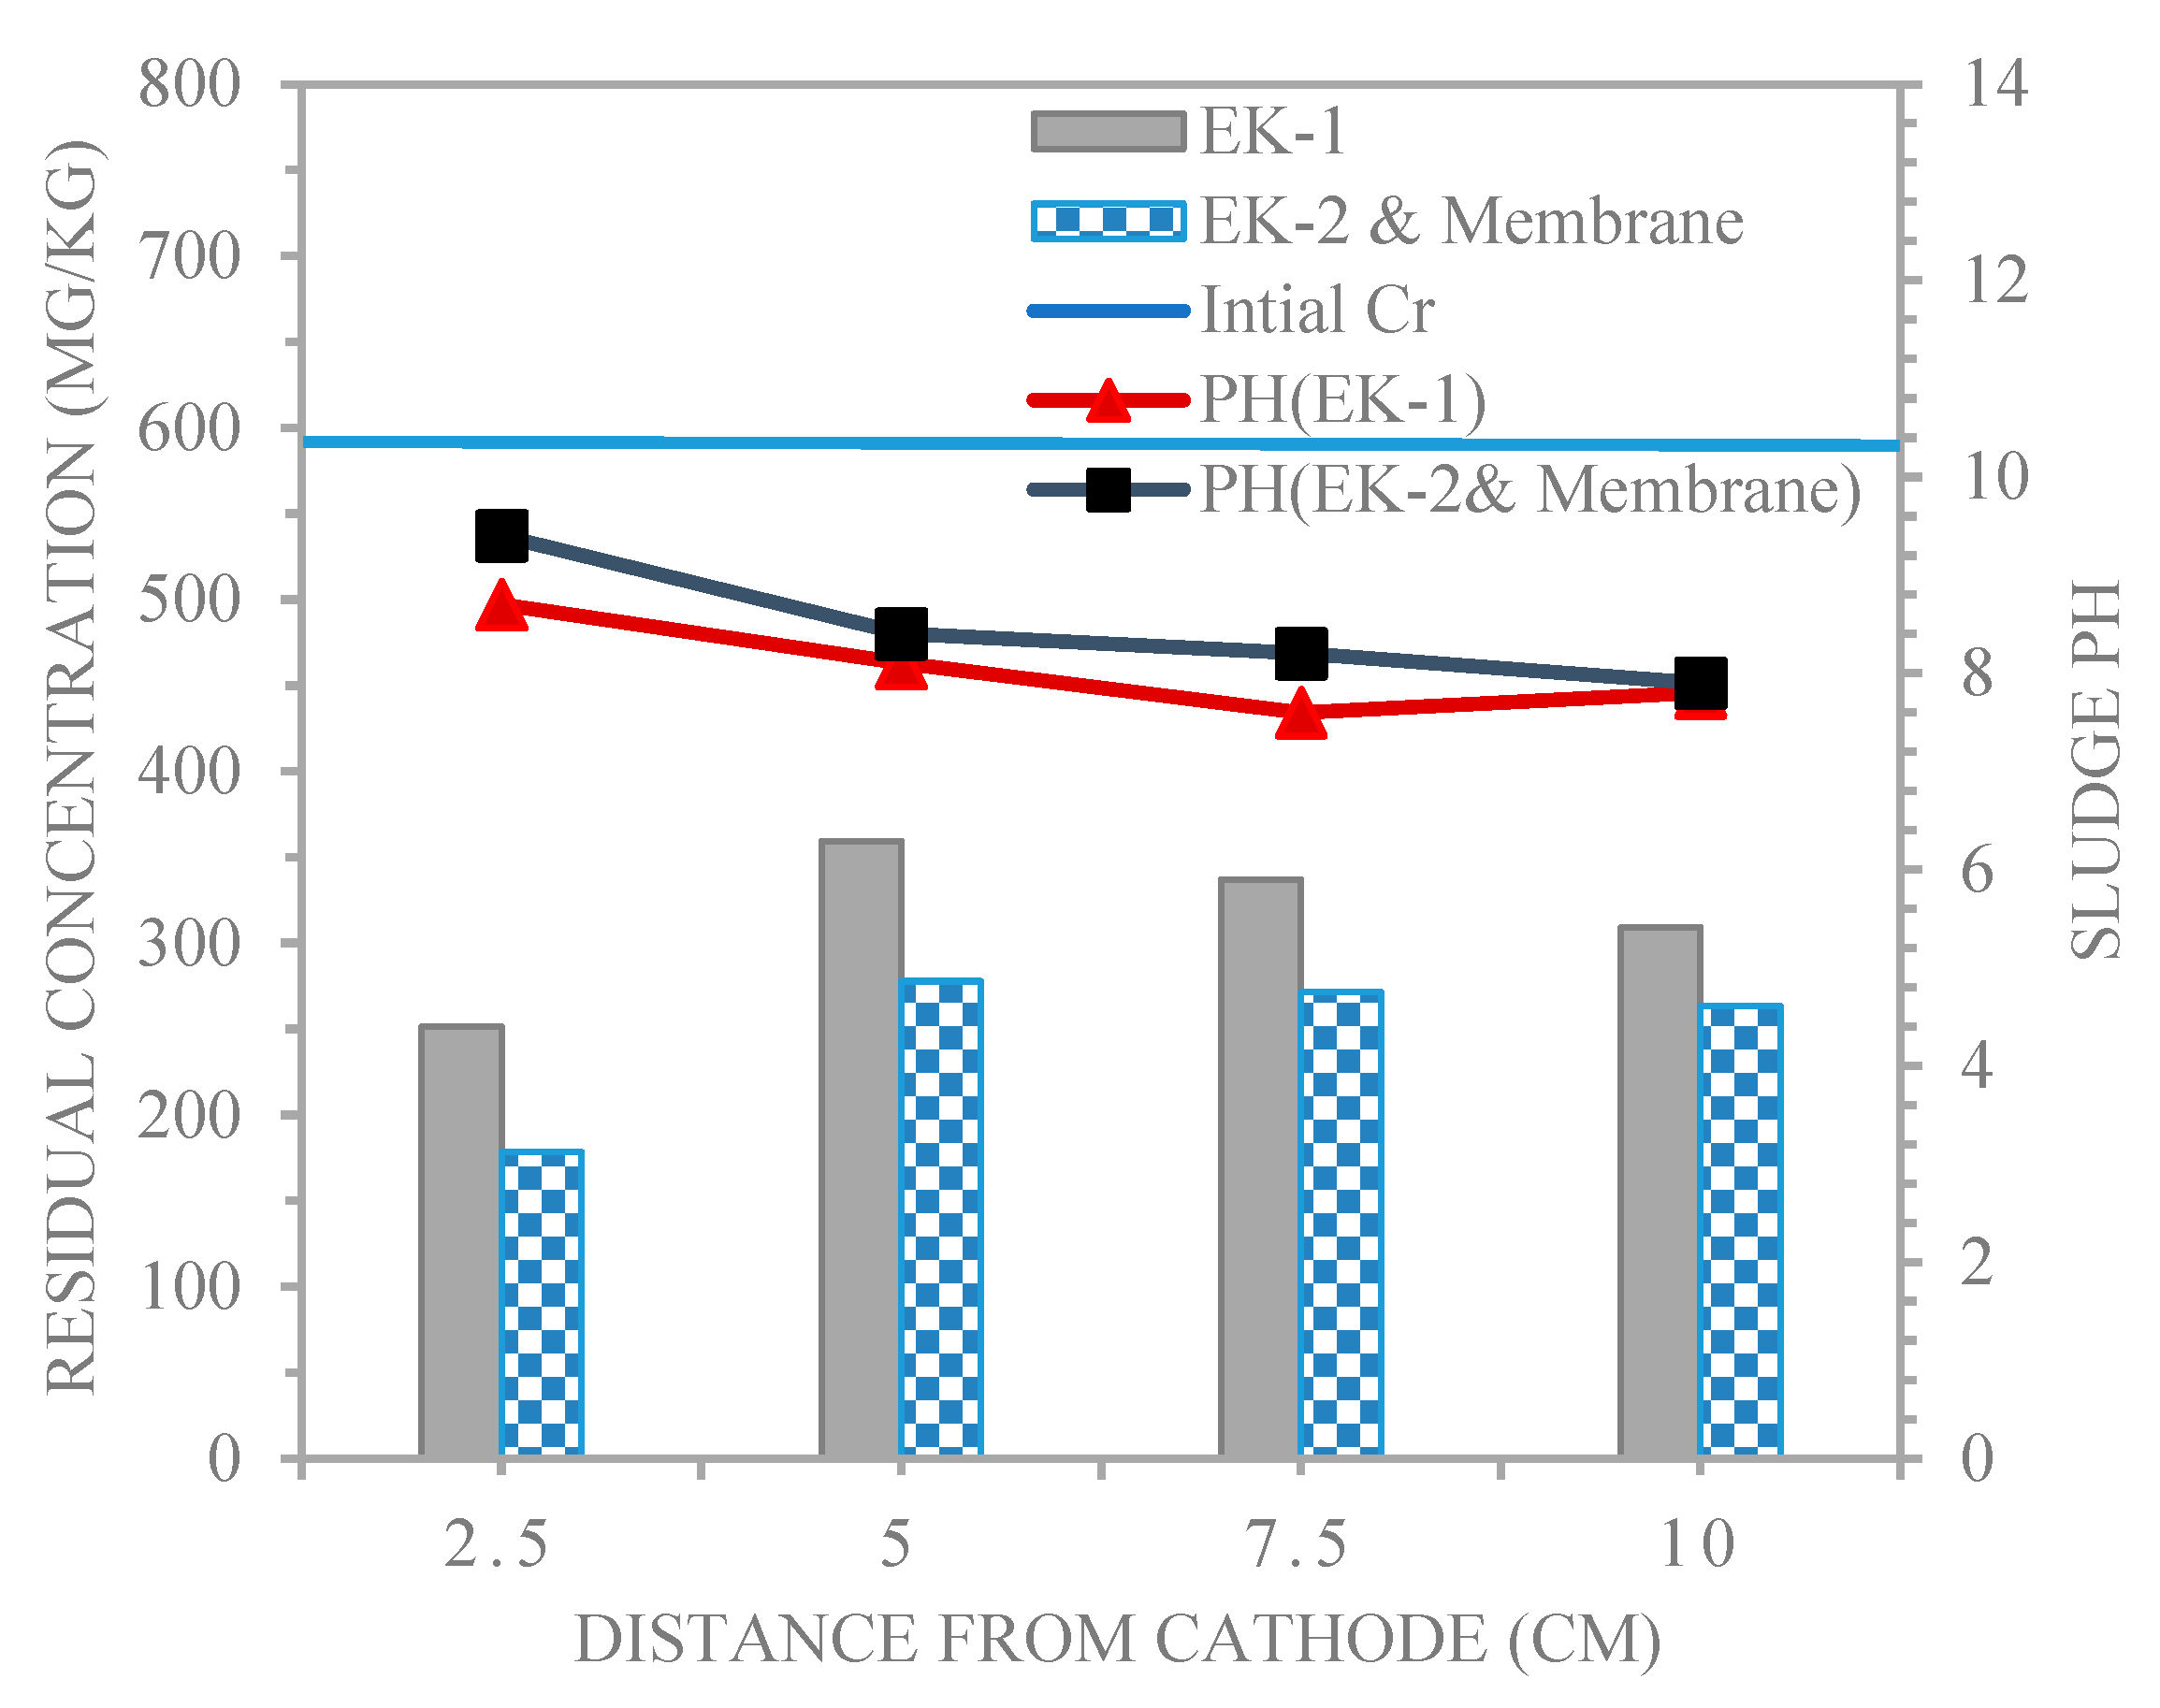
Figure 10 shows the distribution of Cr+3 content and pH detected after the end of the electro kinetic remediation period for experiments EK-1 and EK-2 & Membrane, which was 96 hr., at four distances from the cathode for lines of sample points 1, 2, 3, & 4: 2.5, 5, 7.5 and 10cm. As displayed in Figure 10, the profiles of the soil pH in the EK-1 and EK-2 & Membrane experiments for each line of sample points are above the background value of 7.8. In the EK-1 and EK-2 &Membrane experiments for each line of sample point 1, the sludge pH at point 1 located at a distance of 2.5 cm from the cathode was 8.7 and 9.4, respectively. At middle points 2 and 3, which are located at distances of 5 and 7.5cm from the cathode, H+ and OH- ions are transported and encountered in the middle sections (2 and 3), in which the pH values become 8.1 and 7.6 and 8.4 and 8.2, respectively. The sludge pH at point 4, which is 10 cm away from the cathode, was equal to the background pH value of 7.8. H+ and OH- ions were generated during the EK cleanup procedure by electrolysis of water [ Shucai et al. 2012]. The sludge pH increased near the cathode region and decreased close to the anode region compared to the initial condition.
The remaining concentration of Cr+3 in the sample lines that were obtained for the EK-1 and EK-2 &Membrane experiments after remediation is shown in Figure 10, together with Table 5. It is obvious that the remaining concentration of Cr+3 in the silty clay sludge after treatment using distilled water as a purging solution is as follows:
The amount of Cr+3 residual for treated sludge at point 1(near the cathode) and point 4(near the anode) for EK-1, equivalent to 251.3, 359.2, 337 and 309.2 mg/kg, respectively, was higher than that in EK-2 &Membrane (178.4, 277.8, 271.6 and 263.4 mg/kg). it was clear that the residual concentration of Cr+3 at points 1, 2, 3 and 4 for EK-1 and EK-2 &Membrane decreased from an initial value of 599.8mg/kg.
It is noted that the concentration of chromium at sample points 1, 2, 3 and 4 for EK-1, as explained in Table 5, was higher than in the case for EK-2 &Membrane because using Membrane in sludge achieved more efficient removal for Chromium compared to EK-1, as is evident from the reduction for Chromium that is observed for EK-2 &Membrane, which was equal to 70.2, 53.6, 54.7 and 56.1% for points 1, 2, 3 and 4, respectively, and was higher than those for EK-1 (58.1, 40.1, 43.8 and 48.4%, respectively). H+ from the anode and membrane was more rapidly transported to the cathode when there was a shorter distance between the two electrodes. As the rate of H+ migration increased, so did the rate at which chromium was desorbed and dissolved from the sludge, improving the removal impact [Zhang et al. 2019].
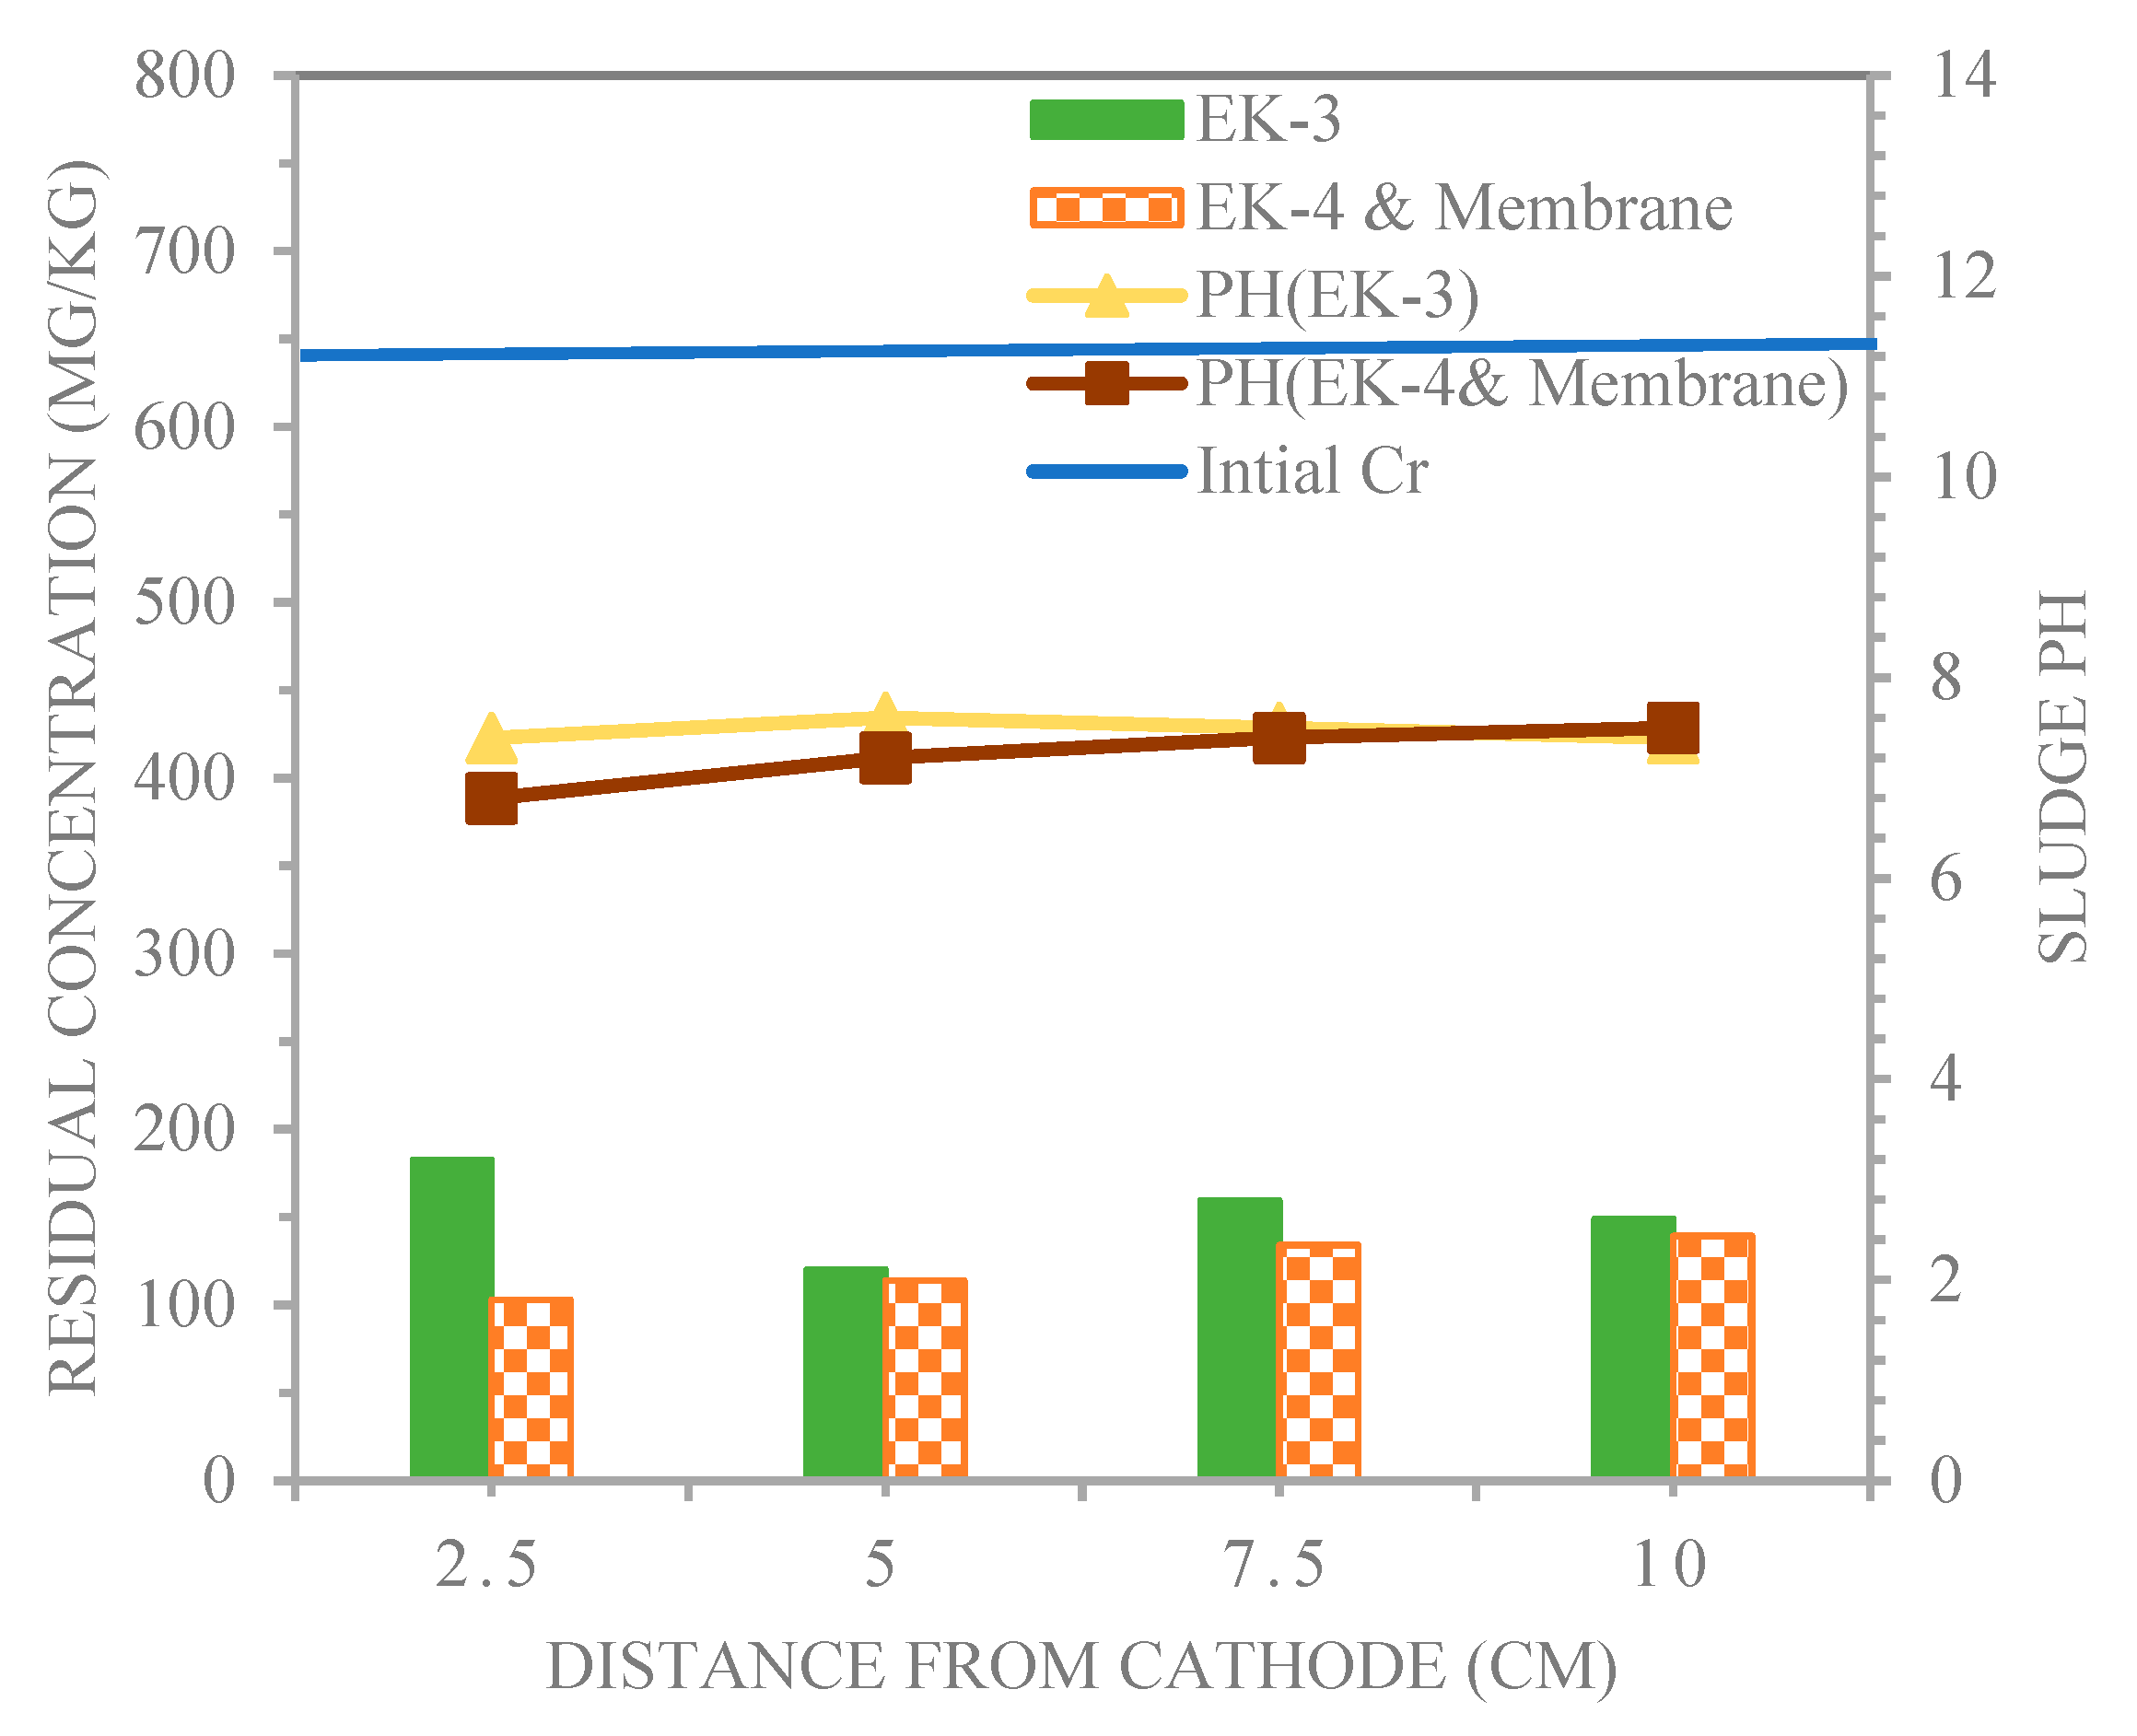
Figure 11 illustrates the distribution of the chromium concentration and pH in the sludge after the EK-3 and EK-4 &Membrane experiments in the longitudinal direction for sampling. In Figure 11, an optimal trend of an excessively low pH was formed gradually from 1, 2, 3, and 4 in EK-4 &Membrane, and the pH of both sludge sample line experiments of EK-3 and EK-4 &Membrane for 1, 2, 3, and 4 was 7.4, 7.6, 7.5, 7.4 and 6.8, 7.2, 7.4, 7.5, respectively. The sludge pH ranged from 6.8 to 7.6 (below the initial pH=7.8), and the pH of the sludge and solubility of the metal compound are of critical importance for the effective removal of Cr+3 from contaminated sludge [Zhang et al. 2019]. These results were in agreement with previous studies. [Wan et al.2019] stated that the soil pH value was between 4.0 and 6.1 after 120 hr. of electrodynamics restoration. This indicates that the acidity zone advances gradually in the whole soil, which is conducive to the removal of heavy metals.
Table 6 shows that the electro kinetic processes witnessed residual concentrations of chromium of 182.6, 120.2, 159.5, and 149.1 and 102.8, 113.8, 134.1, and 139.3 mg/kg for EK-3 and EK-4 &Membrane, respectively, corresponding to effective removal efficiencies of 69.5%, 79.9%, 73.4%, and 75.1% and 82.8%, 81%, 77.6% and 76.8%, respectively. As a result, a low pH level is a desirable condition for the extraction of metal from sludge. In electro kinetic processes, a large proportion of H+ ions was produced by electrolyte electrolysis from the anode. The soil around the anode was acidified so that metal ions were more easily dissolved from the sludge, dissolved in the solution, and transported by electromigration and electroosmotic flow. In addition, the ion speed of movement accelerated under the acid state [Zhang et al. 2019].
Sludge pH at the point 1 sample locations that are 2.5cm from the cathode showed a gradual decreasing trend (EK-4 &Membrane). The sludge pH value of the electrodynamic reaction chamber ranged from 4 to 6.8 after the restoration. Because the pH of the anode sludge was not controlled, an acidic migration zone progressively emerged throughout the whole batch. This allowed heavy metals to dissolve and be removed more easily. Heavy metal removal will be affected by an excessively low sludge pH, which alters the polarity of the zeta potential. Therefore, sludge pH must be maintained at an appropriate level to ensure that heavy metal ions remain dissolved and that the soil's negative zeta potential is maintained.
To study the effect of the membrane on the migration of Cr+3 that occurred toward the cathode. For EK-4 & Membrane, the residual concentration of Cr+3 at point 1 was relatively low, with a value of 102.8 mg/kg, compared to the residual concentration value of EK-3, which was 182.6 mg/kg. it can be observed that (EK-4 &Membrane) clearly outperforms (EK-3). The lower the soil pH (i.e., pH equal to 6.8 and 7.4 at point 1 for EK-4 & Membrane and EK-3, respectively) becomes the more positive charges Cr+3 species have and soluble (Cr+3) with net cationic charges, which will speed up toward the cathode by electromigration. Therefore, high redox potential and low pH are useful to extract metal ions from all sludge fractions and expedite the electrotreatment influence, especially close to the anode, as cited by Ref. [ Shen et al. 2007].
For heavy metals to move through the soil, acidity is critical. As pH decreases, metals become more mobile as they desorb from the surface of the soil M s o i l 2 + to the aqueous phase M 2 + according to equilibrium circumstances [ Palma et al. 2007 ].
M s o i l 2 + + 2 H + 2 H s o i l + + M 2 +
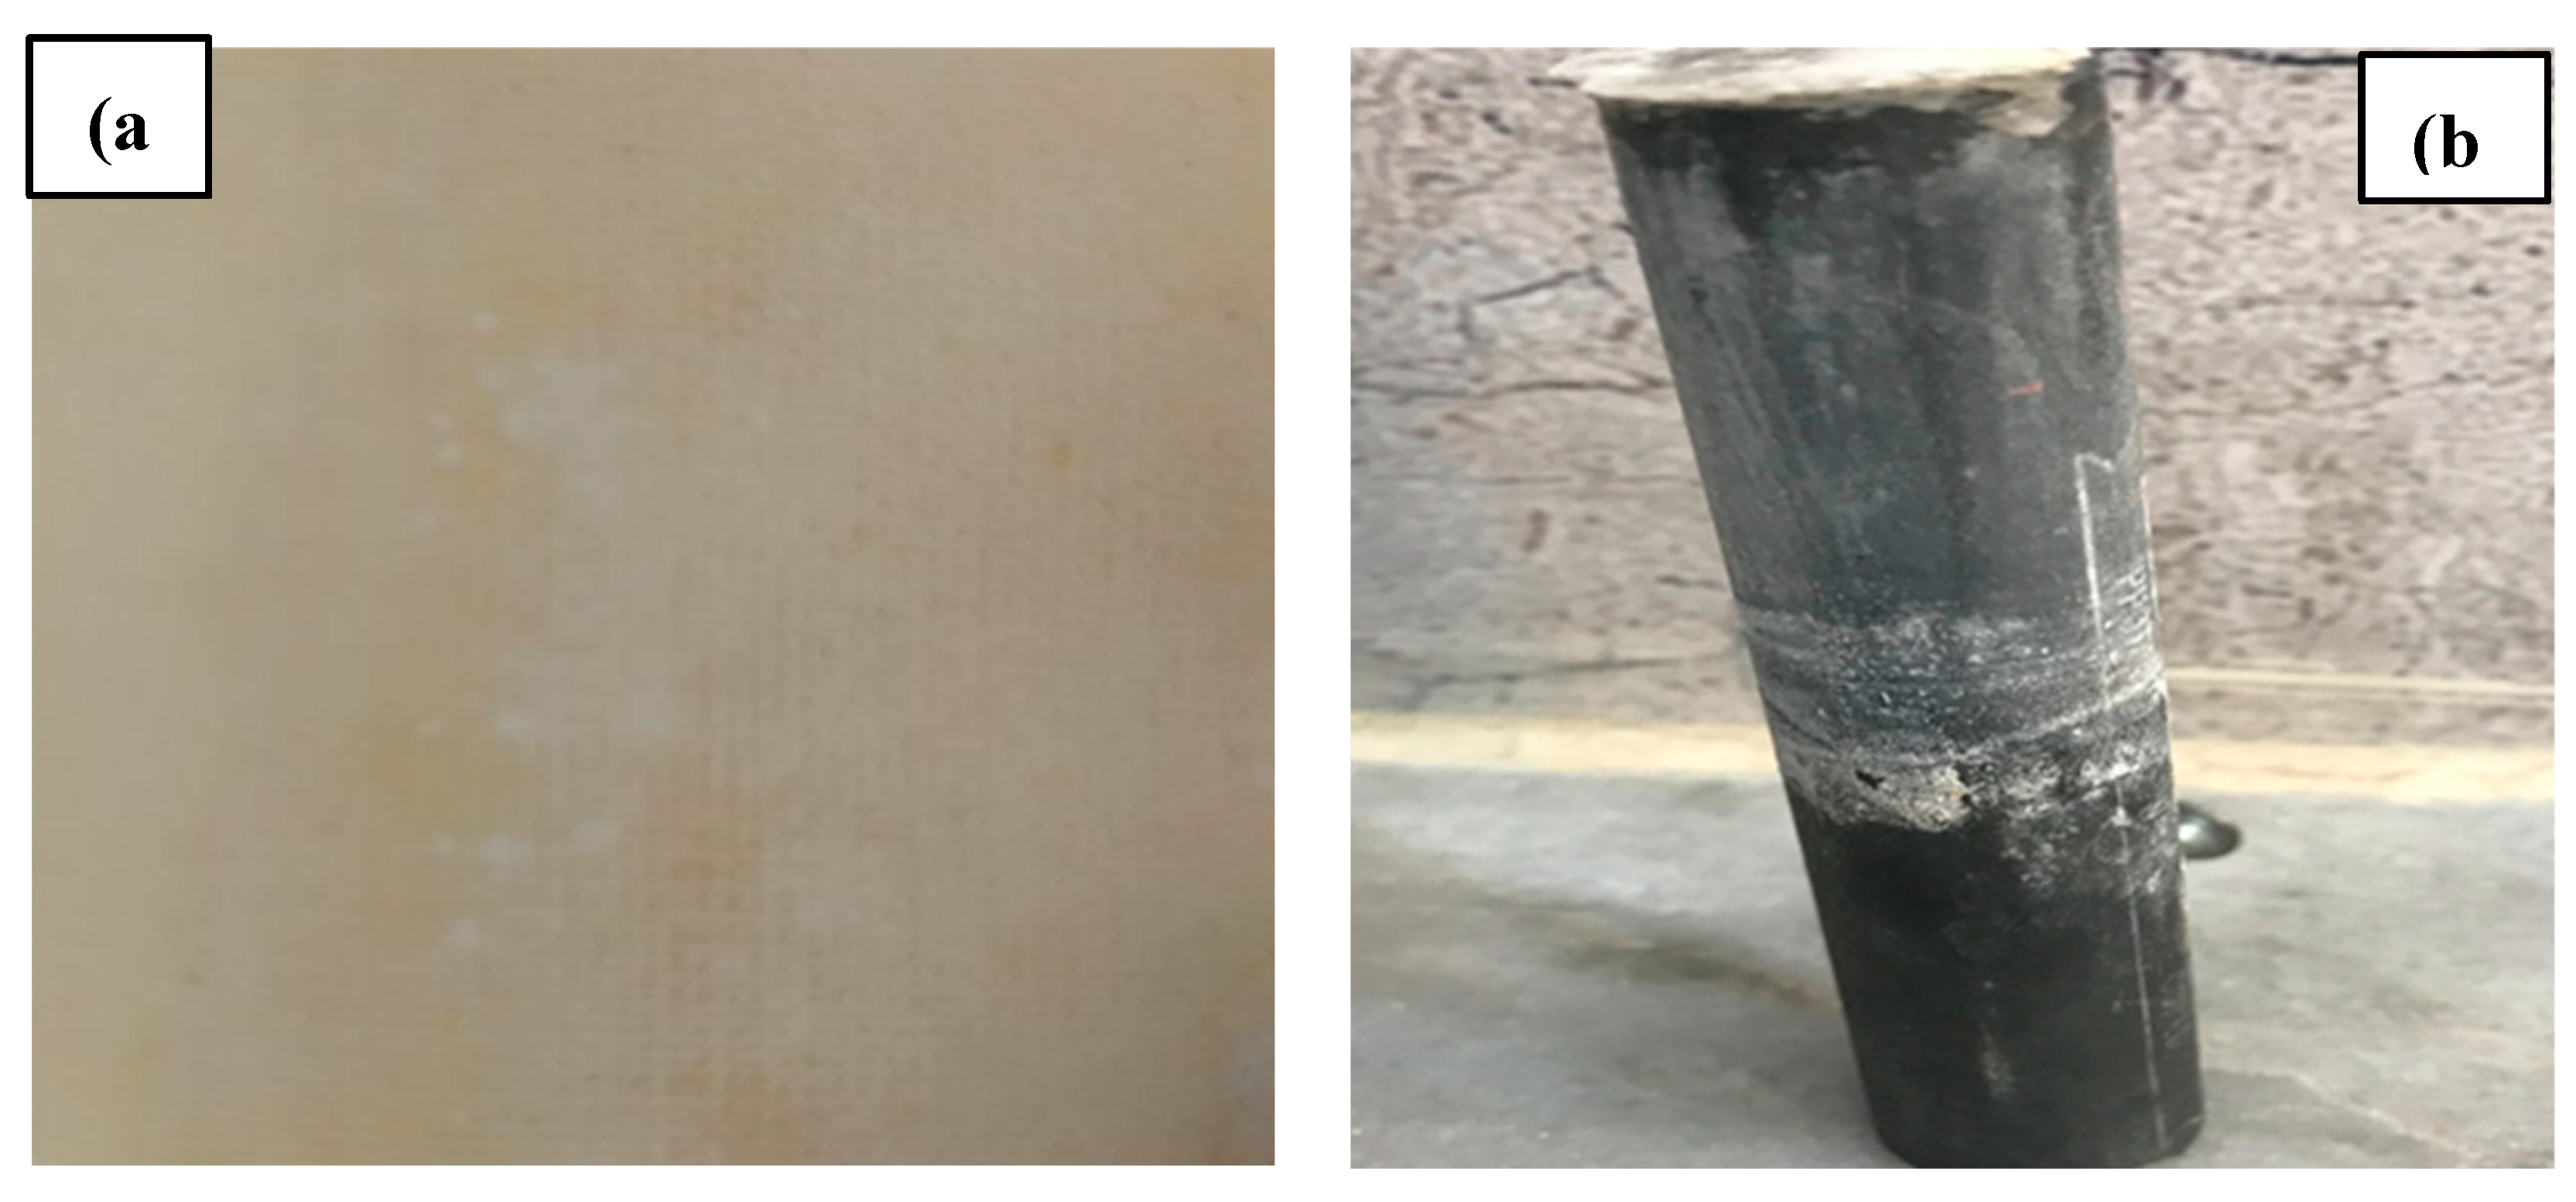
Therefore, the effects of the anode electrode and membrane were remarkable through replenishing the sludge solution system with H+ ions. Thus, the sludge pH for the treated sludge in the EK-4 & Membrane varied from 6.8 to 7.5. Accordingly, the increasing removal of the salts from the specimen with one anode electrode and the membrane surrounding the cathode electrode can be distinguished by large quantities of these salts on the surface of the membrane and cathode electrodes compared to other experiments, as shown in Figure 12.

5. Conclusions

The following are the key findings from the experimentation:
  • The Cr+3 removal efficiencies in the electro kinetic and membrane techniques were higher than those in the electro kinetic techniques conducted under the same purging solution conditions.
  • The electro kinetic process offers an advantage by using the membrane technique, in which there is no accumulation of chromium at all the sampling points of all the experiments, and this is a success in itself.
  • The membrane technique for acetic acid as a catholyte witnessed an excessively low pH of 6.8 in the EK-4 & Membrane system at point 1 sampling points in the remediation of chromium contaminated sludge. In addition to providing a higher removal efficiency by using the same acetic acid, the average removal efficiencies for the EK-3 and EK-4 &Membrane methods were 74.4% and 79.6% at the 1, 2, 3, and 4 sampling points, respectively.

Author Contributions

Nabaa S. Hadi, and Huda H. Awadh: Conceptualization, Performed the Analysis, Writing – Original Draft, Review & Editing.

Funding

The study was not supported by any funding.

Institutional Review Board Statement

Written informed consent was received from all study participants.

Data Availability Statement

The authors declare that all data supporting the findings of this study are available within the article.

Acknowledgments

The authors would like to thank the Environmental & Civil Engineering Department/College of Engineering at the University of Babylon. Additionally, the author is grateful to Prof. Dr. Amal Hamza Khalil for the assistance given to complete the work study involved in writing this paper.

Conflicts of Interest

The authors declare that they have no conflicts of interest.

References

  1. Acar, Y.B.; and Alshawabkeh, A.N. (1996). Electro-kinetic remediation. I: pilot-scale tests with lead-spiked kaolinite. Journal of Geotechnical Engineering, 122, 173-185. [CrossRef]
  2. Almeira, J.; Peng, C.; Wang, Z. Effect of different electrode configurations on the migration of copper ions during the electrokinetic remediation process. Asia-Pac. J. Chem. Eng. 2009, 4, 581–585. [Google Scholar] [CrossRef]
  3. Al-Khafaji, Z.S.; Jafer, H.; Dulaimi, A.; Atherton, W.; and Al Masoodi, Z. (2017). The Soft Soil Stabilisation Using Binary Blending of Ordinary Portland Cement And High Alumina Silica Waste Material, in The 3rd BUiD Doctoral Research Conference, the British University in Dubai, 13th May 2017, UAE. Dubai, 13th May 2017, UAE.
  4. Al-Khafaji, Z. S.; AL-Naely, H. K.; Al-Najar, A. E. A Review Applying Industrial Waste Materials in Stabilisation of Soft Soil. Electronic Journal of Structural Engineering 2018, 18, 2. [Google Scholar] [CrossRef]
  5. Delil, A. D.; and Köleli, N. (2018). The Removal of Pb and Cd from Heavily Contaminated Soil in Kayseri, Turkey by a Combined Process of Soil Washing and Electrodeposition. Soil and Sediment Contamination. 27(6): 469-484. [CrossRef]
  6. Faisal, A.A.H.; Hussein, A.A. An Acidic Injection Well Technique for Enhancement of the Removal of Copper from Contaminated Soil by Electro kinetic Remediation Process. Separation Science and Technology 2015, 50, 2578–2586. [Google Scholar]
  7. Faisal, A.A.H.; Rashid, I.T. Enhancement Solution to Improve Remediation of Soil Contaminated with Lead by Electrical Field. Journal of Engineering 2015, 21, 11. [Google Scholar] [CrossRef]
  8. Hayder, M. R.; Ayad, A. H. F. Removal of dissolved cadmium ions from contaminated wastewater using raw scrap zero-valent iron and zero valent aluminum as locally available and inexpensive sorbent wastes. Iraqi Journal of Chemical and Petroleum Engineering 2018, 19, 39–45. [Google Scholar]
  9. Hussain, A. J.; and Al-Khafaji, Z. S. (2020). Reduction of environmental pollution and improving the (Mechanical, physical and chemical characteristics) of contaminated clay soil by using of recycled oil. Journal of Advanced Research in Dynamical and Control Systems, 12(4 Special Issue), 1276–1286. [CrossRef]
  10. Kim, W.S.; Jeon, E.K.; Jung, J.M.; Jung, H.B.; Ko, S.H.; Seo, C.I.; and Baek, K. ( 2014). Field application of electro-kinetic remediation for multi-metal contaminated paddy soil using two-dimensional electrode configuration. Environmental Science Pollution Research, 21, 4482–4491. [CrossRef]
  11. Matloub, F. K.; Sulaiman, M. M. Investigating the effect of PH and salt Concentration on Cathodic Protection of Pipe- Lines. Technology 2018, 9, 474–480. [Google Scholar]
  12. Ottosen, L.M.; Larsen, T.H.; Jensen, P.E.; Kirkelund, G.M.; Kerrn-Jespersen, H.; Tuxen, N.; Hyldegaard, B.H. Electrokinetics applied in remediation of subsurface soil contaminated with chlorinated ethenese A review. Chemosphere 2019, 235, 113–125. [Google Scholar] [CrossRef] [PubMed]
  13. Palma, J.; Graves, A.R.; Burgess, P.J.; Van der werf, W.; and Herzog, F. (2007). Integrating environmental and economic performance to assess modern silvoarable agroforestry in Europe. EcologicalEconomics,Volume63,Issue4,Pages759-767. [CrossRef]
  14. Rashid, I.T. (2015). Improve Remediation of Soil Contaminated with Lead and Chromium by Electrical Field Technique. Ph.D., Thesis, Baghdad University, College of Engineering.
  15. RisingSun Membrane Technology (Beijing) Co., Ltd. Available online: www.risingsunmem.com.
  16. Rosul, N.; Amal, H. K. Resolving the accumulation effect of lead ions in the contaminated soil by electro-kinetic remediation. Solid State Technology 2020, 63, 1–16. [Google Scholar]
  17. Saeedi, M.; Li, L.Y.; and Gharehtapeh, M. (2013). Effect of alternative electrolytes on enhanced electrokinetic remediation of hexavalent chromium in clayey soil. Int. J. Environ. Res., 7(1):39-50. [CrossRef]
  18. Shen, Z.; Chen, X.; Jia, J.; Qu, L.; Wang, W. Comparison of electrokinetic soil remediation methods using one fixed anode and approaching anodes. Environmental Pollution 2007, 150, 193–199. [Google Scholar] [CrossRef] [PubMed]
  19. Shucai, L.; Tingting, L.; Gang, L.; Fengmei, L.; Shuhai, G. Enhanced electrokinetic remediation of chromium contaminated soil using approaching anodes. Front. Environ. Sci. Eng. 2012, 6, 869–874. [Google Scholar]
  20. Sulaiman, M. M.; Matloub, F. K.; and Shareef, Z. N. (2018). Simulation and optimization of natural gas sweetening process: A case study of Ng sweeting unit designed by CHEN group in the Gulf of Mexico. AIP Conference Proceedings. American Institute of Physics, 2030(1), p. 20075. [CrossRef]
  21. Sun; Z.; Wu, B.; Guo, P.; Wang, S.; and Guo, S. (2019). Enhanced electrokinetic remediation and simulation of cadmium contaminated Lead-Contaminated Kaolinite and Natural Soils. CSAWAC 47 (4) · Vol. 47 · No. 4.
  22. Talib, A.N.A.; Tajudin, S.A.A.; Sunar, N.M. Copper Removal from Soil using EKR Technique. Journal of Applied Geoscience and Built Environmen 2019, 1, 1–6. [Google Scholar]
  23. Turer, D.; and Genc, A. (2005). Assessing effect of electrode configuration on the efficiency of electrokinetic remediation by sequential extraction analysis. Journal of Hazardous Materials B119 167–174. /: https. [CrossRef]
  24. Wan, Y.; Wang, A.; Shen, M. Restoration of Cadmium Contaminated Soil Using Approaching Anode Method of Polygonal Electrode. Ekoloji 2019, 28, 1041–1047. [Google Scholar]
  25. Zainab, O. Al Masoodi.; Zainab, Al Khafaji.; Hassnen, M. Jafer.; and Anmar Dulaimi, W. A. (2017) ‘The effect of a high alumina silica waste material on the engineering properties of a cement-stabilised soft soil’, in The 3rd BUiD Doctoral Research Conference. Dubai, AUE.
  26. Zhang, Z.; Ren, W.; Zhang, J.; and Zhu, F. (2019). Electrokinetic remediation of Pb near the e-waste dismantle site with Fe(NO3)3 as cathode electrolyte. Environmental Technology. [CrossRef]
Figure 1. The sedimentation basins of the Kadhimiya Water Project.
Preprints 82547 g001
Figure 2. Cation Exchange Flat Sheet Membrane[www.risingsunmem.com].
Preprints 82547 g002
Figure 3. The experimental setup of the electro kinetic cell utilized in the present study.
Preprints 82547 g003
Figure 4. Sampling point layout.
Preprints 82547 g004
Figure 5. EDS for the composition of the sludge sample.
Preprints 82547 g005
Figure 6. Current variation versus time: (a) EK-1, EK-2 &Membrane and (b) EK-3, EK-4 &Membrane.
Preprints 82547 g006
Figure 7. Electric conductivity profiles for the line of sampling points.
Preprints 82547 g007
Figure 8. Calcium carbonate and pH profiles for the line of sampling points.
Preprints 82547 g008
Figure 9. SEM images for the samples, a) sludge, b) contaminated sludge with chromium ions, c) sludge treatment (EK-1), d) sludge treatment (EK-2&membrane), e)sludge treatment(EK-3), f)sludge treatment (EK-4&membrane).
Preprints 82547 g009aPreprints 82547 g009b
Figure 10. Chromium and pH profiles in the sludge treated by the electro kinetic technique for EK-1 and EK-2 &Membrane.
Preprints 82547 g010
Figure 11. Chromium and pH profiles in the sludge treated by electro kinetic technique for EK-3 and EK-4& Membrane.
Preprints 82547 g011
Figure 12. Accumulation of salts on the surface of the membrane and cathode electrodes after the end of the electro kinetic process (EK-4 &Membrane). (a) Membrane (b) cathode electrode.
Preprints 82547 g012
Table 1. Composition and properties of the sludge.
Property Value
Particle size distribution
Sand (%)
Silt (%)
Clay (%)

1.1
63.5
35.3
Cation exchange capacity
(cmol.kg-1)
32.87
Porosity (%) 51.69
pH value 8.26
Electric conductivity, EC (μs/cm) 1500
Organic Matter (OMC %) 5.34
Calcium carbonate CaCO3 (%) 25.18455
Sulphate ions, SO4 (mg/l) 0.00514
Chloride ions, Cl-1 (mg/l) 0.5998
Total suspended solids, TSS (mg/l) 600
Table 2. Flat Sheet Membrane Samples for Feasibility Test[www.risingsunmem.com].
Model: CE2
Physical and Chemical Properties U.S. Units Metric Units
Functional group Sulfonic acid Sulfonic acid
Exchange capacity min. meq/g 1.4
Current density max. Ampere/ft2 50 Ampere/m2 538
Area resistance ohm/cm 0.1 N NaCl 25 0.1 N NaCl 25
1.0 N NaCl 10 1.0 N NaCl 10
Permeslectivity 0.5 N NaCl /1.0 N NaCl 96 96
Water permeability @5psi max. ml/hr/ft2 50 ml/hr/ft2 538
Mullen burst test min. psi 150 bar 10.3
Stability pH range 1-10 1-10
Stability max.temp 176 80
Dimensions max.width inches 43 meters 1.09
Dimensions max.length inches 122 meters 3.1
Dimensions approx.thickness mils 20 mm 0.51
Ionic form as shipped Na+ Na+
Storability of products max.years 2 max.years 2
Storability temp range 40-75 4-24
Table 3. Electro kinetic remediation experiments are described in detail.
Series Experiment
Designation
Conc.
(mg/kg)
Time
(hr)
PS (pH) Electrodes Arrangement Membrane
Cathode Anode
Series I EK-1 599.8 96 DW DW One Cathode
+ One Anode
----
Series II EK-2 & Membrane 599.8 96 DW DW One Cathode
+ One Anode
Membrane
Series III EK-3 599.8 96 AA DW One Cathode
+ One Anode
----
Series IIII EK-4 & Membrane 599.8 96 AA DW One Cathode
+ One Anode
Membrane
DW: Distilled water. AA: Acetic acid.
Table 4. The concentration of chloride ions for various sludge samples.
Sludge Samples Chloride Ions (mg/l)
EK-1 Ek-2&Membrane EK-3 Ek-4&Membrane
Native Sludge 0.5998 Reduction (%) 0.5998 Reduction (%) 0.5998 Reduction (%) 0.5998 Reduction (%)
1 0.0999 83.3 0.1999 66.7 1.1996 -100 1.16 -93.4
2 0.0999 83.3 0.4998 16.7 1.299 -116.6 1.099 -83.2
3 0.1599 73.3 0.4998 16.7 1.299 -116.6 1.099 -83.2
4 0.199 66.8 0.5990 0.13 1.399 -133.2 1.1996 -100
Table 5. Residual Con. of chromium for sampling points at the end of the electro kinetic treatment using distilled water.
Parameters Points of samples(EK-1) Points of samples (EK-2) & Membrane
1 2 3 4 1 2 3 4
Initial Con. of Cr(II) 599.8 mg/kg
Con. of Cr(II) mg/kg 251.3 359.2 337 309.2 178.4 277.8 271.6 263.4
Reduction (%) 58.1 40.1 43.8 48.4 70.2 53.6 54.7 56.1
Average (%) 47.6 58.6
Table 6. Residual Con. Of chromium for sampling points at the end of the electro kinetic treatment using distilled water and acetic acid as the purging solution.
Parameters Points of Samples(EK-3) Points of Samples (EK-4) & Membrane
1 2 3 4 1 2 3 4
Initial Con. of Cr(II) 599.8 mg/kg
Con. of Cr(II) mg/kg 182.6 120.2 159.5 149.1 102.8 113.8 134.1 139.3
Reduction (%) 69.5 79.9 73.4 75.1 82.8 81 77.6 76.8
Average (%) 74.4 79.6
Disclaimer/Publisher’s Note: The statements, opinions and data contained in all publications are solely those of the individual author(s) and contributor(s) and not of MDPI and/or the editor(s). MDPI and/or the editor(s) disclaim responsibility for any injury to people or property resulting from any ideas, methods, instructions or products referred to in the content.
Copyright: This open access article is published under a Creative Commons CC BY 4.0 license, which permit the free download, distribution, and reuse, provided that the author and preprint are cited in any reuse.
Prerpints.org logo

Preprints.org is a free preprint server supported by MDPI in Basel, Switzerland.

Subscribe

© 2024 MDPI (Basel, Switzerland) unless otherwise stated