1. Introduction
Metrology is an activity to achieve unity of units and ensure accurate and reliable measurements, which is related to the national economy and people's livelihood [
1]. Length is one of the seven international basic units of measurement, and length metrology plays a very important role in scientific study and industrial production [
2]. Gauge blocks are used to transfer the unit of length to other length standards [
3]. At present, the uncalibrated gauge blocks are usually sent to the laboratory because the measurement results are easily affected by the field environment. However, the gauge block may be damaged during transportation. Not only remote calibration can reduce the impact of these problems., but also can improve the efficiency of calibration verification. Therefore, it is of great significance to study the remote calibration of length measurement. In this article, an optical remote calibration system to realize length measurement combining remote calibration technology and optical fibre sensing technology.
Remote calibration first appeared in developed countries. The National Institute of Standards and Technology (NIST) has long been responsible for the study on the application of remote metrology for comparison between laboratories, such as real-time video, audio exchange and data communication for monitoring remote calibration and comparison [
4]. The UK's National Physical Laboratory (NPL) has proposed three thematic projects for Internet-based metrology, one of which was to develop general software for a remote calibration service for voltage and resistance, which can spread to other different metrology fields, such as remote calibration services for optical time domain reflectometers [
5]. The National Metrology Institute of Japan (NMIJ) has also worked on remote calibration techniques for voltage, frequency, pressure, flow, etc. Akiko Hirai et al. of Japan has developed a new remote-measurement technique of length in which a low-coherence tandem interferometer and a single-mode optical fibre are used [
6].
The length metrology plays a very important role in the quality assurance of national defense scientific research and industrial production, which is closely related to people's lives and has received close attention from countries around the world. Various optical methods have been proposed, such as laser triangulation method [7, 8], optical lever method [
9], structured light method [10, 11], confocal microscopy [12, 13] and optical interferometry [14, 15]. Optical interferometry used interference fringes as the observation value to detect the length value, which can realize nanometer-level measurement. This measurement method had the advantages of high resolution and high precision [16, 17]. With the update of measuring devices and the combination of computer-aided technology, optical interferometry continued to be modernized[
18]. Various devices based on optical interferometry are used to measure surface roughness[
19], acceleration[
20], temperature[
21], and the device designed in this paper is used to achieve length measurement.
2. Study on the method of length measurement based on optical fiber information transmission
2.1. Methods of realizing length measurement
According to the verification method of the gauge block, the measurement of the length of the gauge block can be divided into absolute and the relative measurement method [
22].
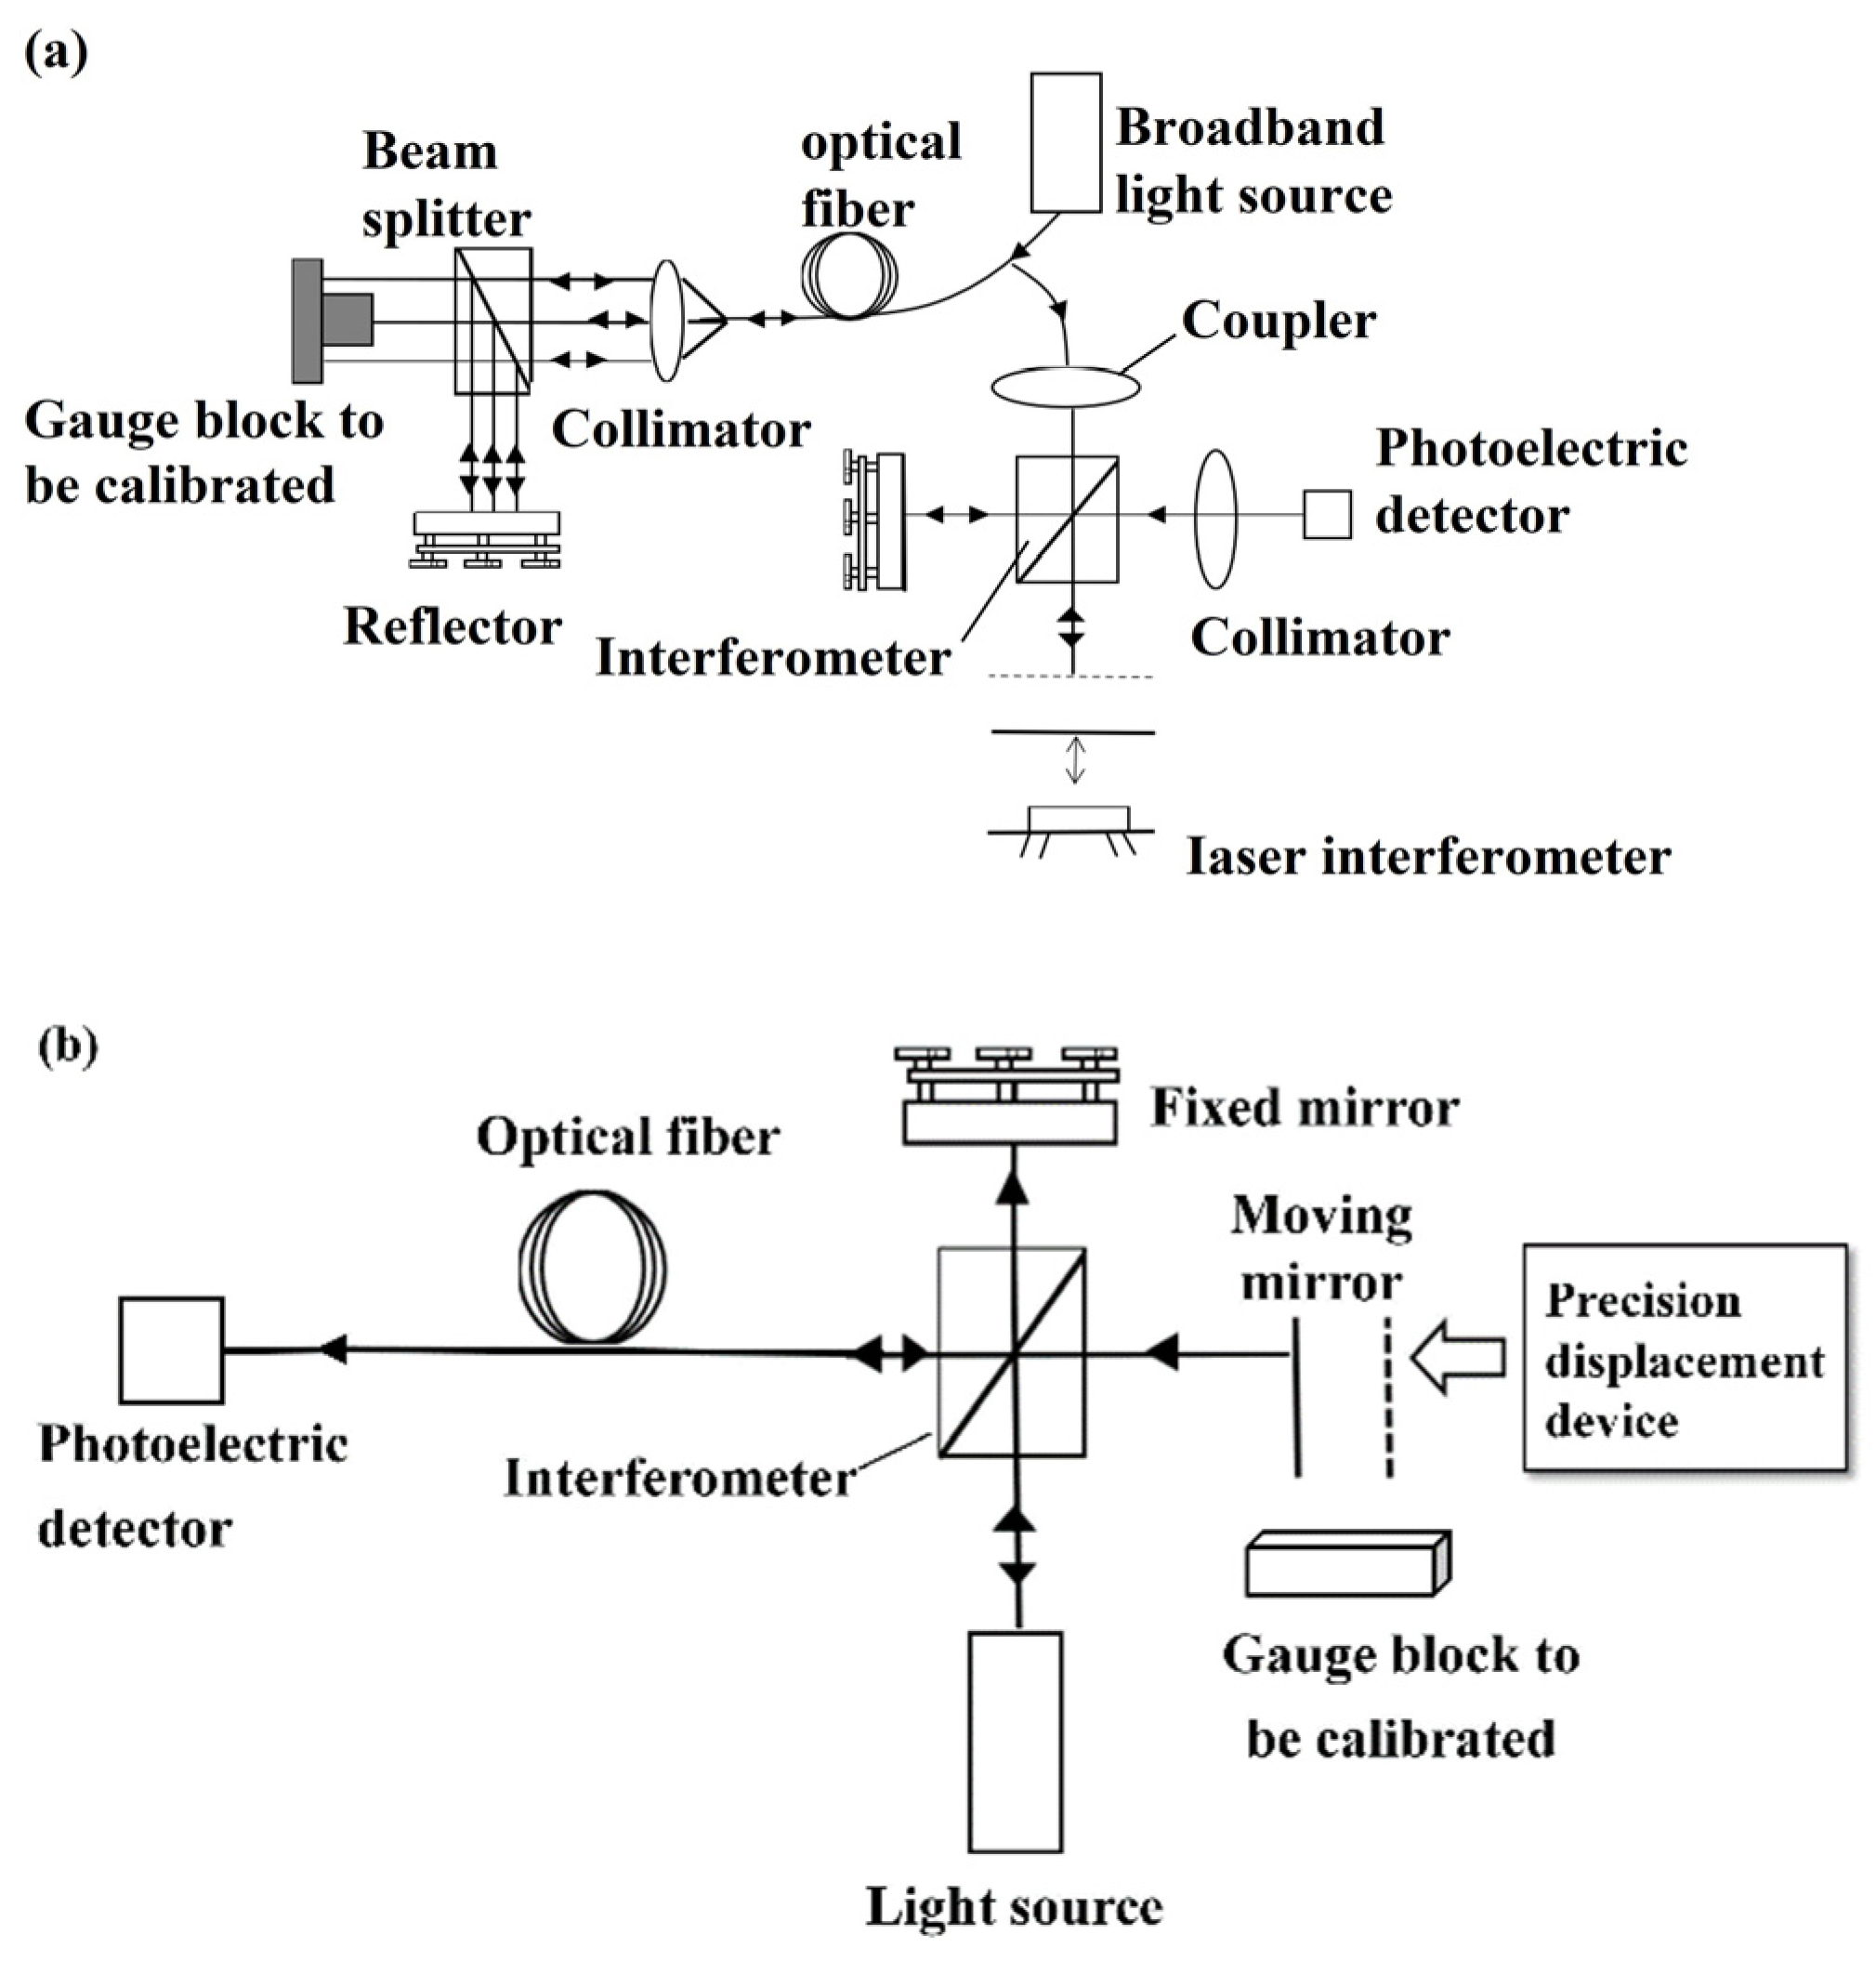
The absolute measurement method of the gauge block was shown in
Figure 1(a). The gage block and the gage block stage created an optical path difference as
.
was transmitted through the optical fiber to the interferometer in the laboratory. When the optical path difference between the interferometers was equal to the gage block optical path difference, the difference between the mirrors was recorded. This difference was the length of the gauge block to be measured. Another absolute measurement method was the transmission of interferometric fringes by optical fiber to achieve length measurements. The movement of the mirror caused the interference fringes to change. The resulting interference fringes were transmitted through the optical fiber to the detection end of the laboratory. Since the length of the gauge block was equivalent to the distance moved by the mirror, the length of the gauge block can be measured according to the change of the interference fringes. The structure is shown in
Figure 1(b).
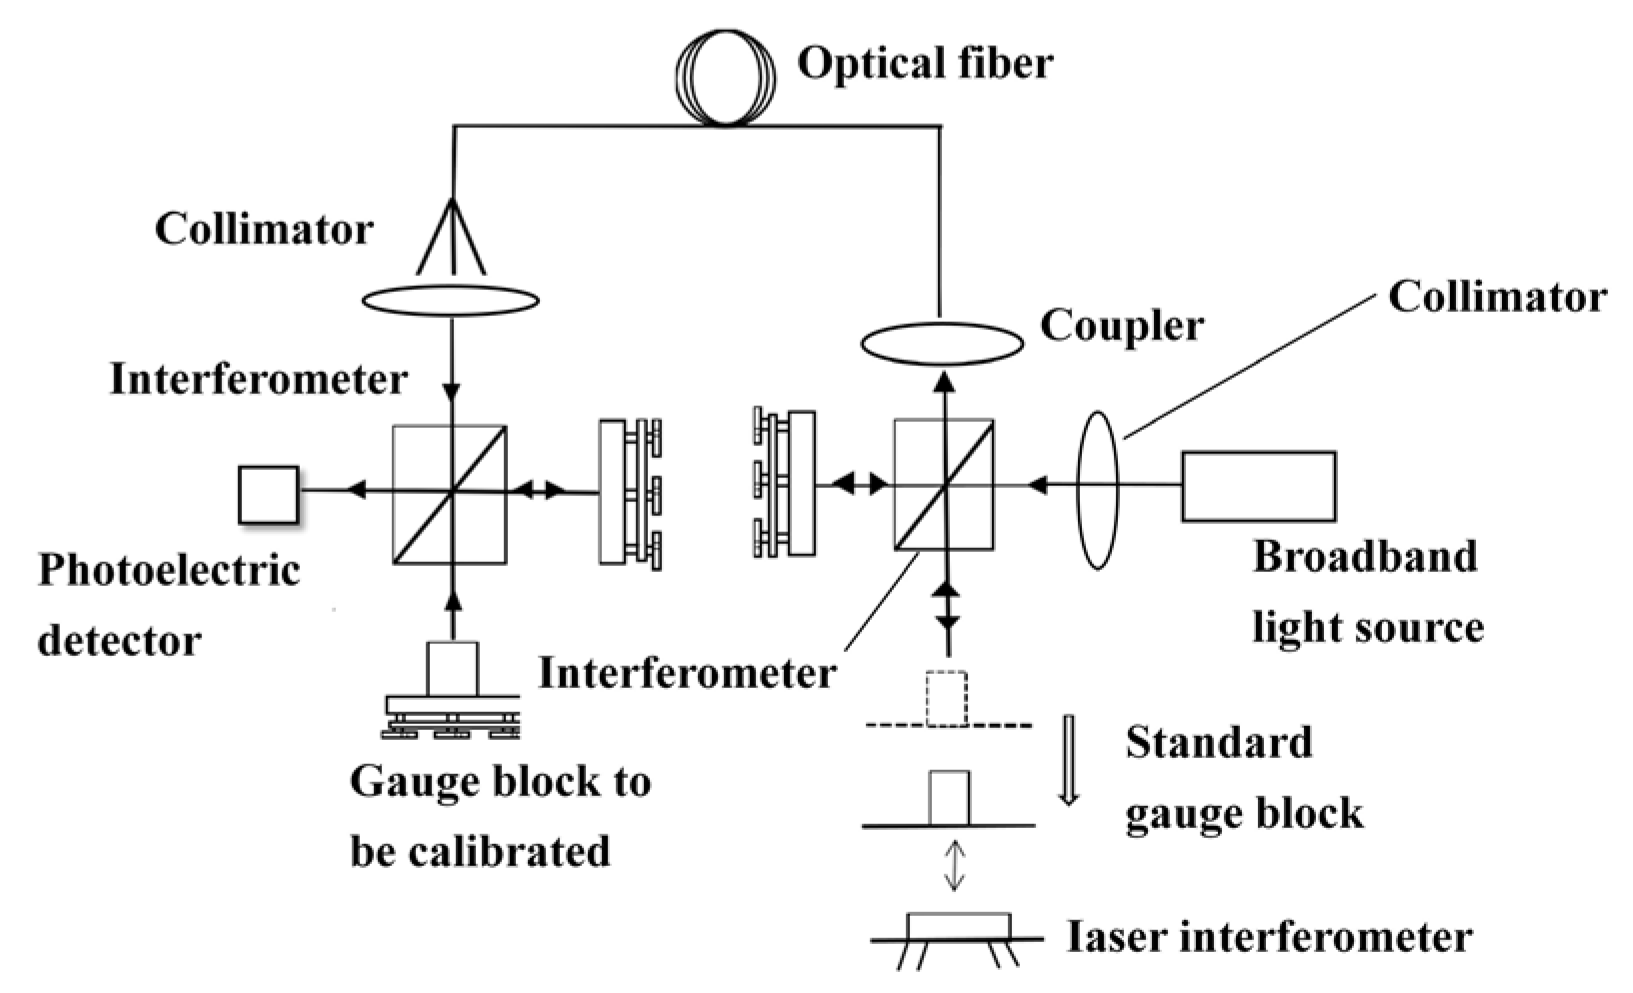
The remote calibration method based on relative length measurement was shown in
Figure 2. A broadband light source in the calibration laboratory emitted light beam. The beam was divided into two beams after passing through the beam splitter, in which one beam was irradiated on the fixed mirror, and the other beam was irradiated on the surface of the standard gauge block. These two beams of light were converged and coupled into the optical fibre, and then transmitted to the end of the uncalibrated gauge block. Before placing the gauge block, the optical path difference of the interferometer in the calibration laboratory and the test site was set to be equal. At this time, the light intensity value detected by the photodetector was the largest. When the standard gauge block and the uncalibrated gauge block was placed, the mirror on the laboratory side was moved. When the light intensity value detected by the photodetector was maximum, the distance λ moved by the mirror was recorded. The distance λ was the difference between the uncalibrated gauge block and the standard gauge block.
2.2. Structural design based on different methods
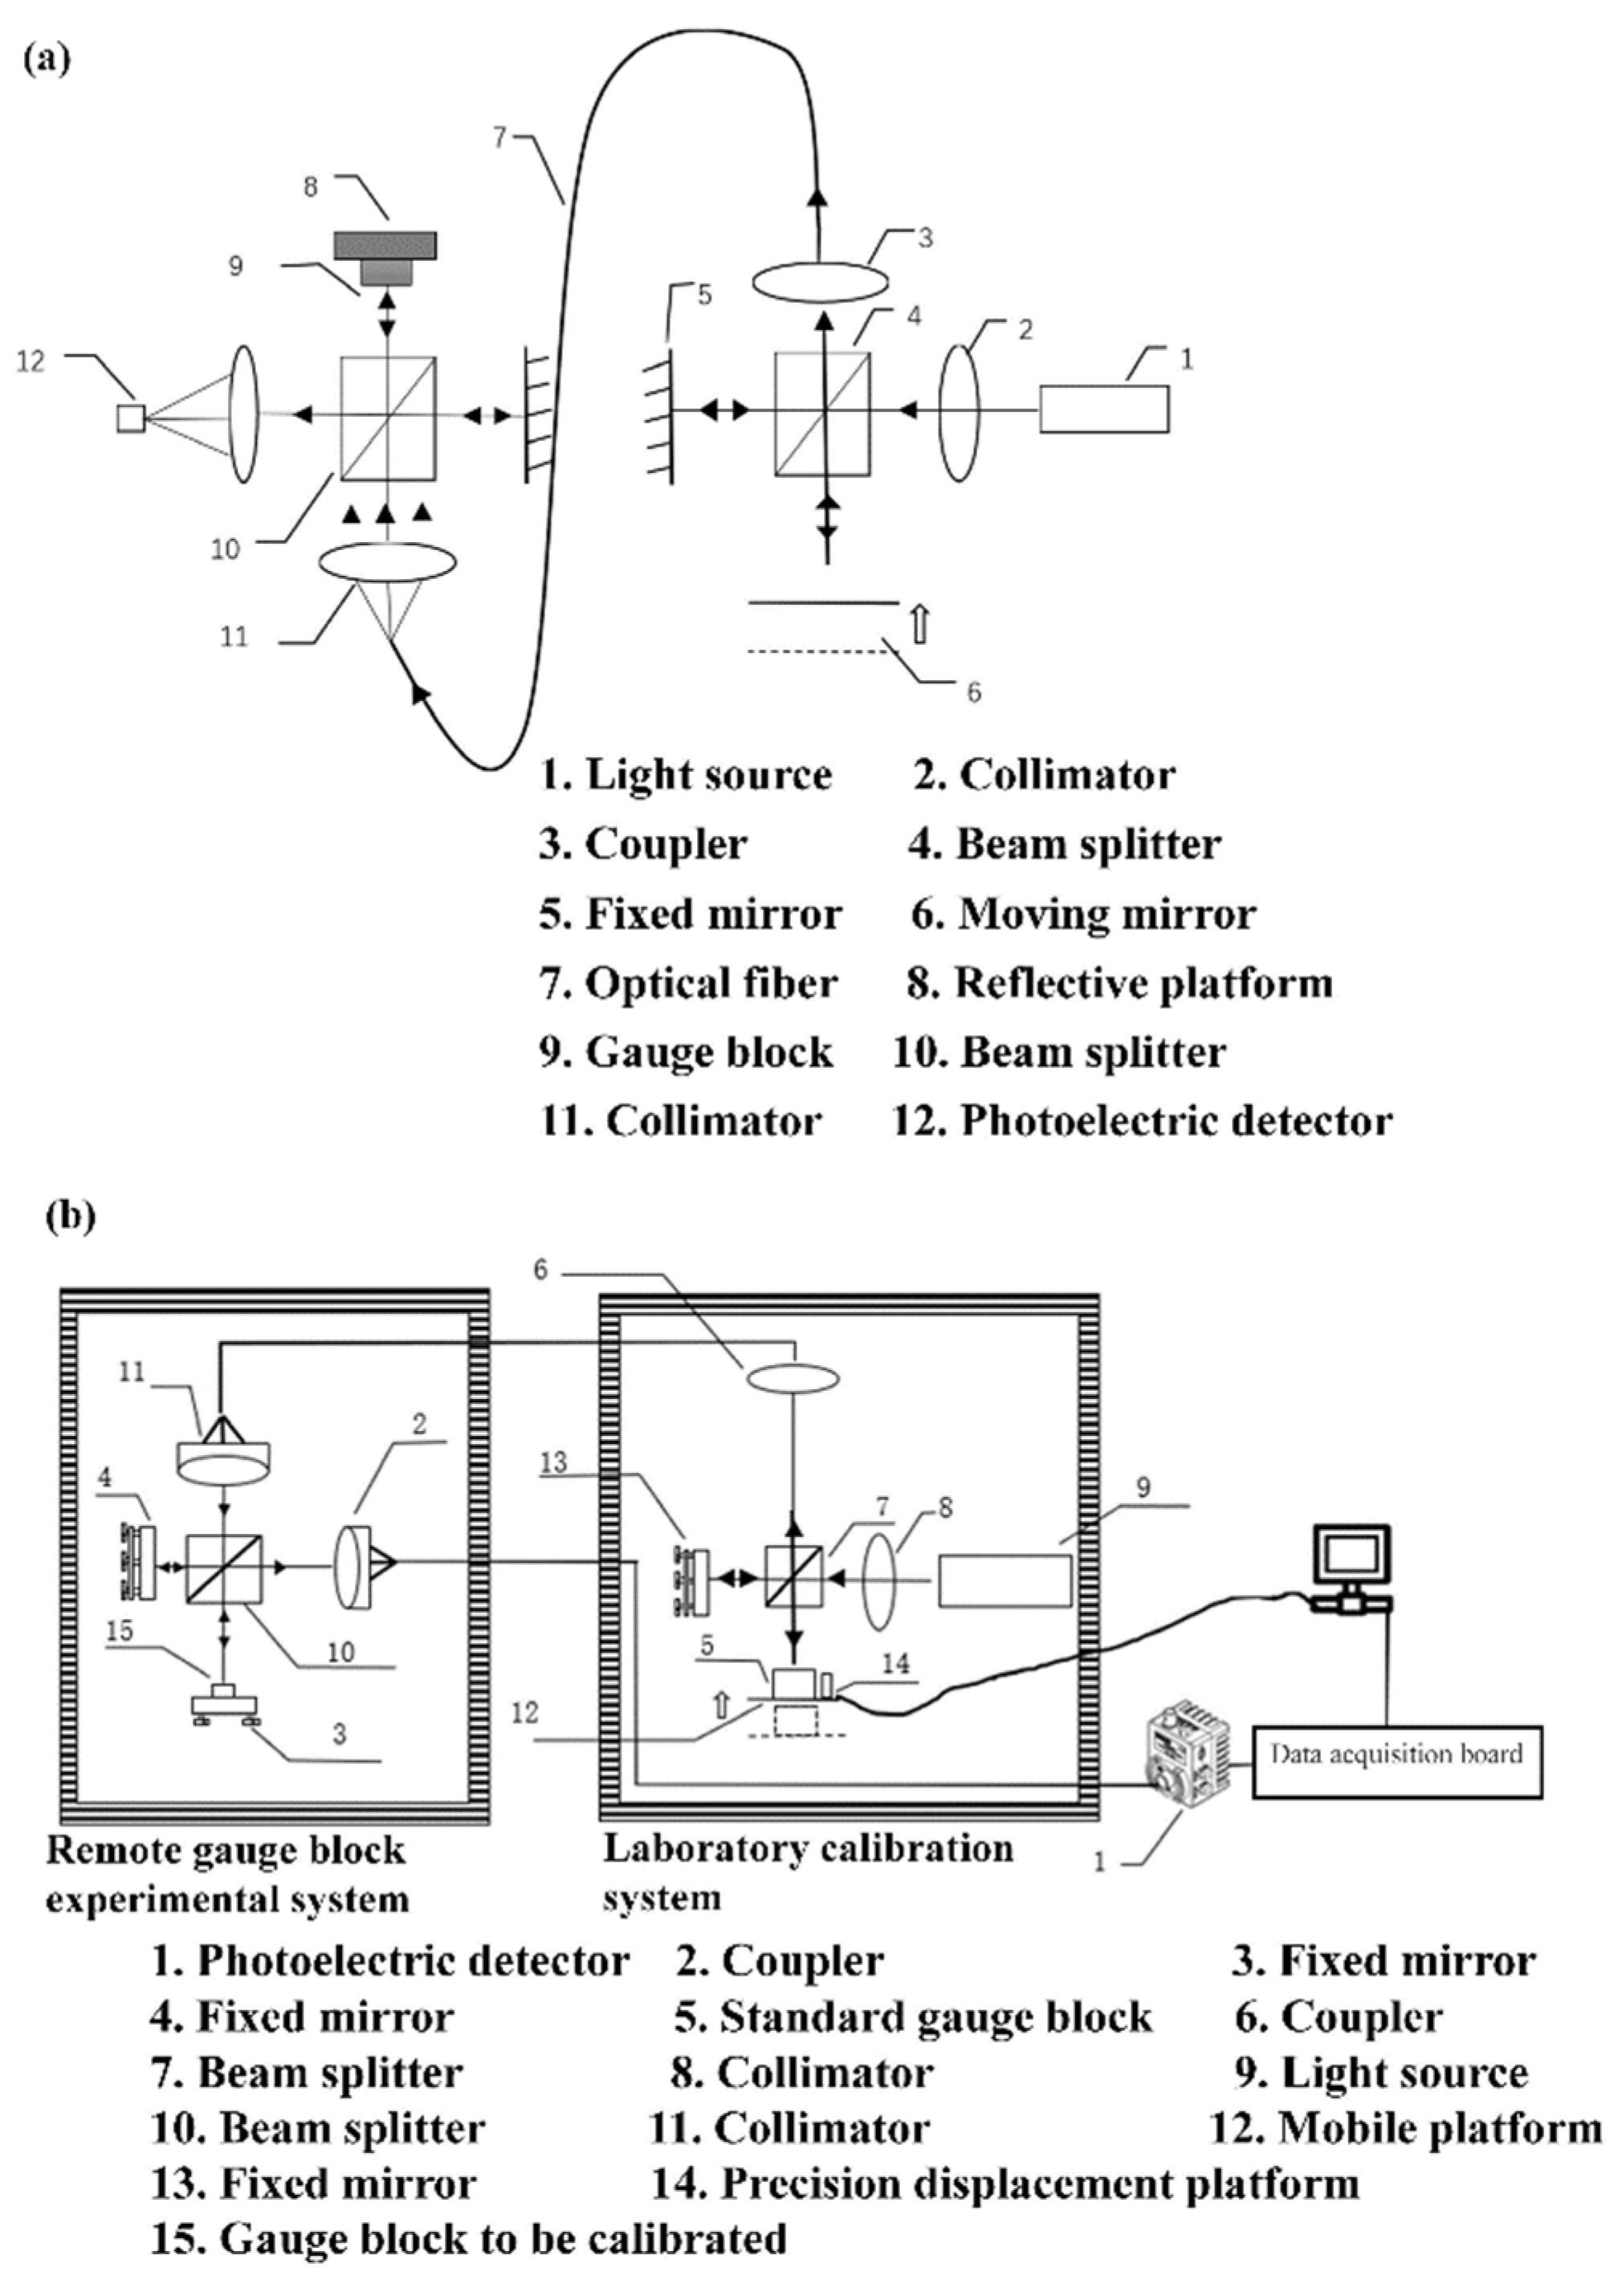
In the structural design of absolute measurement (
Figure 3(a)), two combined Michelson interferometer devices were placed at the remote site end and in the laboratory, respectively. The measured block was placed in the interferometer at the end to be calibrated. The light source 1 emitted a light beam, following with divided into two beams after passing through the beam splitter 4, which were respectively irradiated the fixed mirror 5 and the moving mirror 6. The mirror 6 of the laboratory was controlled by a precision console. The coherent light generated by the laboratory measuring instrument will be transmitted to the calibration site through the single-mode fiber 7, and the light at the calibration site will be detected by the photodetector 12. At the calibration field end, there would be an optical path difference
between the surface of the gauge block 9 and the reflector. When the position of the mirror 6 was moved to the position of optical path difference between mirror 6 and the mirror 5 being equal to
, the interference fringes had a maximum value. Currently, the distance of the mirror 6 was
. In addition, an optical path difference
also was generated between the platform 8 and the mirror. When the mirror 6 was moved again so that the optical path difference with mirror 5 was equal to
, the distance of mirror 6 was
. Then the value of the gauge block was
obtained by absolute measurement.
The structural design of the relative measurement was shown in
Figure 3(b). After the light source 9 passed through the beam splitter 7, it irradiated on the surfaces of the mirror 13 and the standard gauge block 5, respectively. The optical path difference generated by the mirror 13 and the top surface of the standard gauge block 5 was called
. The light was converged by coupler 6 and then imported into the optical fiber [
23]. The light was then directed into the user's interferometer through an optical fiber. The light split by the other beam splitter 10 was irradiated on the measuring block 15 and the platen. The top surface of the measuring block 15 and the beam splitter 4 had an optical path difference value. The value of this optical path difference was
. The concentrated light transmitted the two optical signals to the photodetector through the optical fiber. The precision displacement device 14 was adjusted. When the optical path difference Δ and the optical path difference
had the same values, bright streaks were produced. At this time, the light intensity was the maximum which was detected by the photodetector 1. The distance moved by the precision displacement device 14 was the difference value of the measured block. The moving distance was detected by a laser interferometer.
Relative measurement was based on absolute measurement. A more standard gauge block was added to the interferometer in the laboratory to verify the calibrated gauge block. The placement of the gauge block introduces errors. The compensation distance brought by the movement of the mirror was the error between the gauge block to be checked and the standard gauge block. Therefore, the displacement of its mirrors was reduced. But the number of its devices increased, and the uncertainty of measuring devices increased. The absolute measurement had two advantages. One was that and the uncertainty caused by the components will be reduced for the fewer components being used. The other was that this method could directly measure the length of the gauge block. However, the moving distance of the mirror was long, and the influence of uncertainty factors will increase during the moving process.
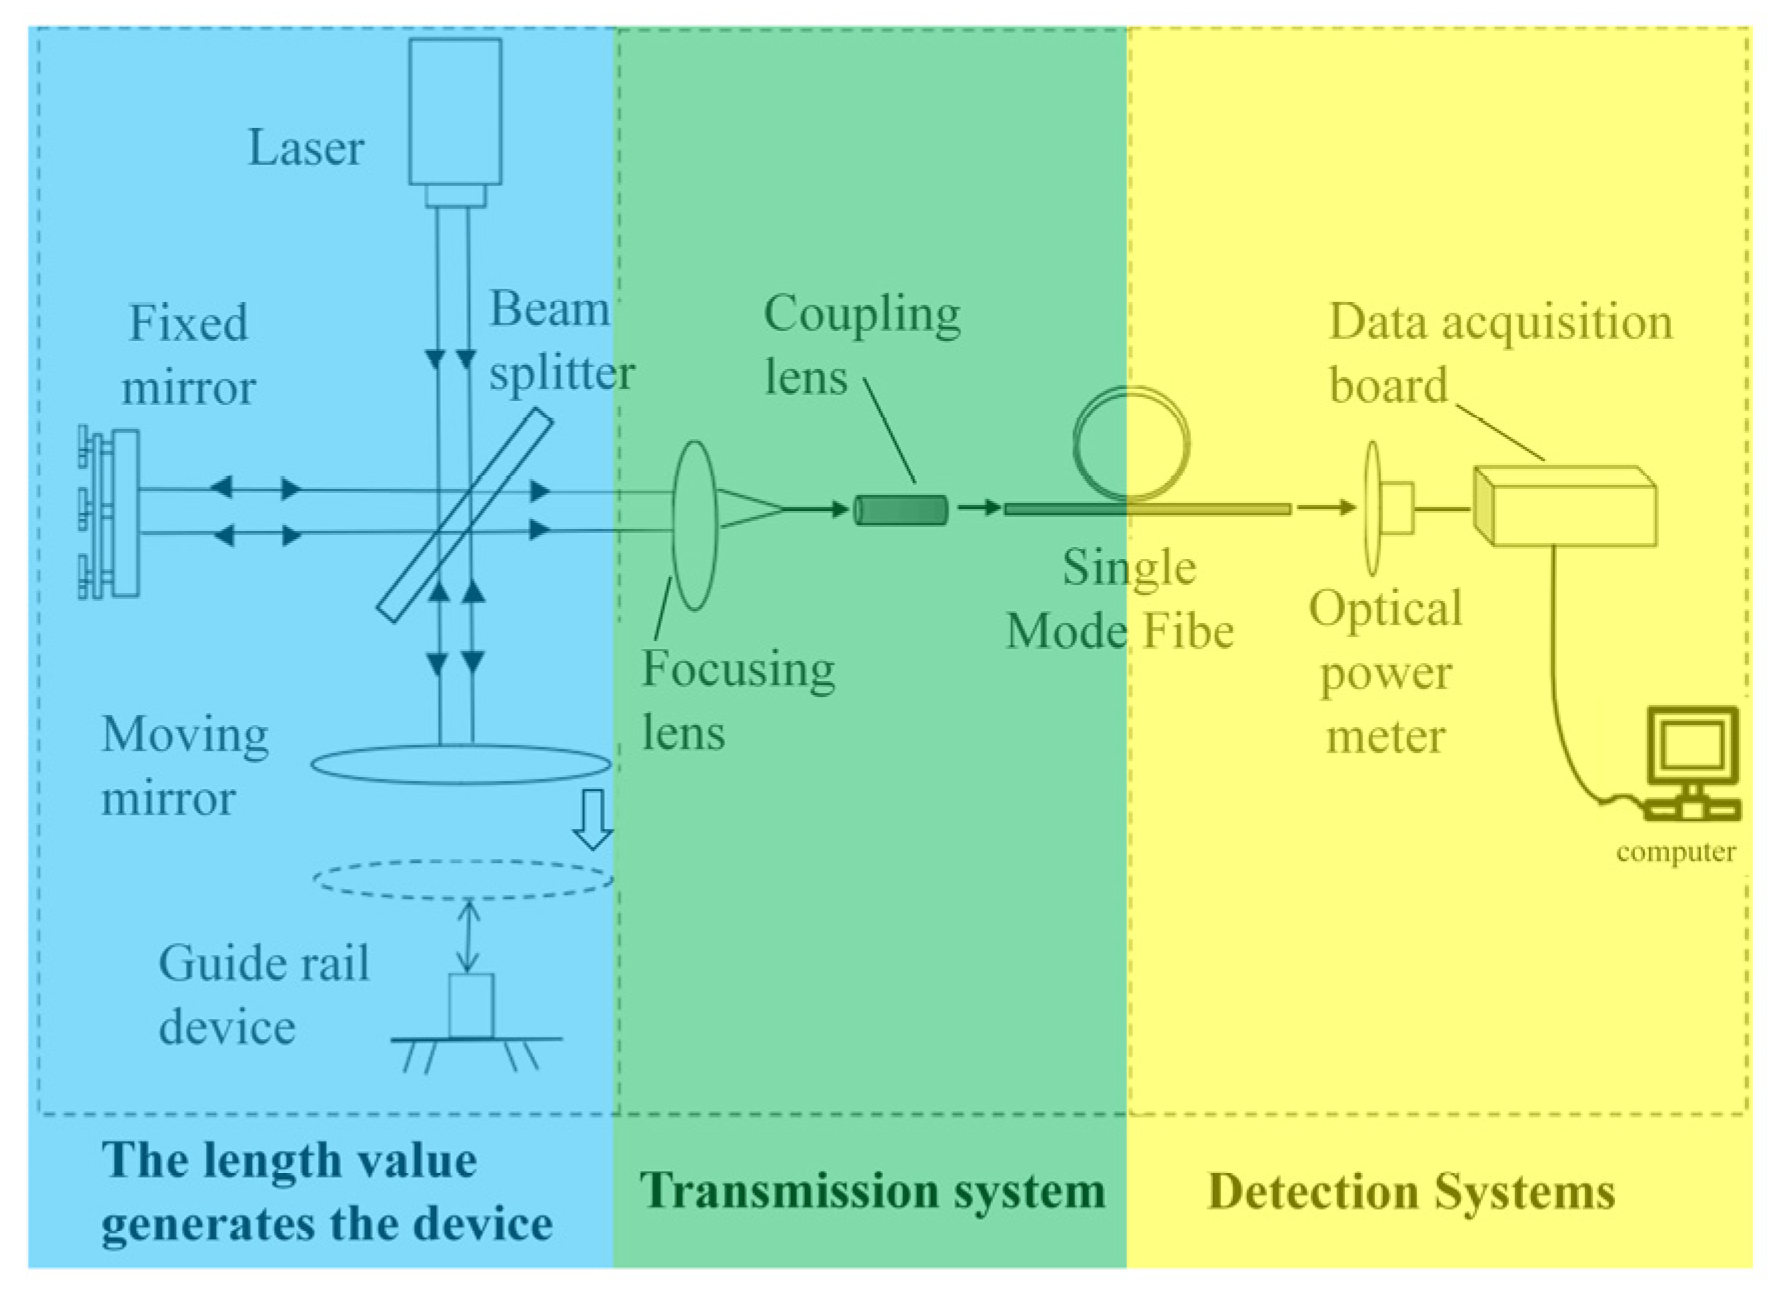
In this study, the method of absolute measurement was adopted, and the length measurement system was designed based on the above structure of absolute measurement. The design of experimental system was shown in
Figure 4. When the power was turned on, the laser produced red laser light and divided into two beams by a beam splitter. One beam was transmitted and the other was reflected. The coherent light can be directly coupled into the fiber without a compensating mirror because of the better coherence of the laser. Due to the total reflection of the fiber, the coherent light became a circular light source through light propagates in the fiber. When coherent light propagated out of the fiber, circular fringes were observed. The changes of these fringes were detected by an optical power meter. When the bright stripes passed through the optical power meter, the voltage value of the power meter became lower. Conversely, the voltage value of the power meter increased. These voltage values were quickly detected by the data acquisition card and transmitted to the computer. To research the voltage changes. In addition, the plane mirror moved with the movement of the guide rail. There is a certain relationship between the optical path distance that the mirror moves and the interference fringes. The distance moved by the optical path difference was obtained by the number of interference fringes moved. There are experiments of long-distance optical fiber transmission in Japan [
24].
3. Design of device based on absolute measurement mode
3.1. Design of experimental system
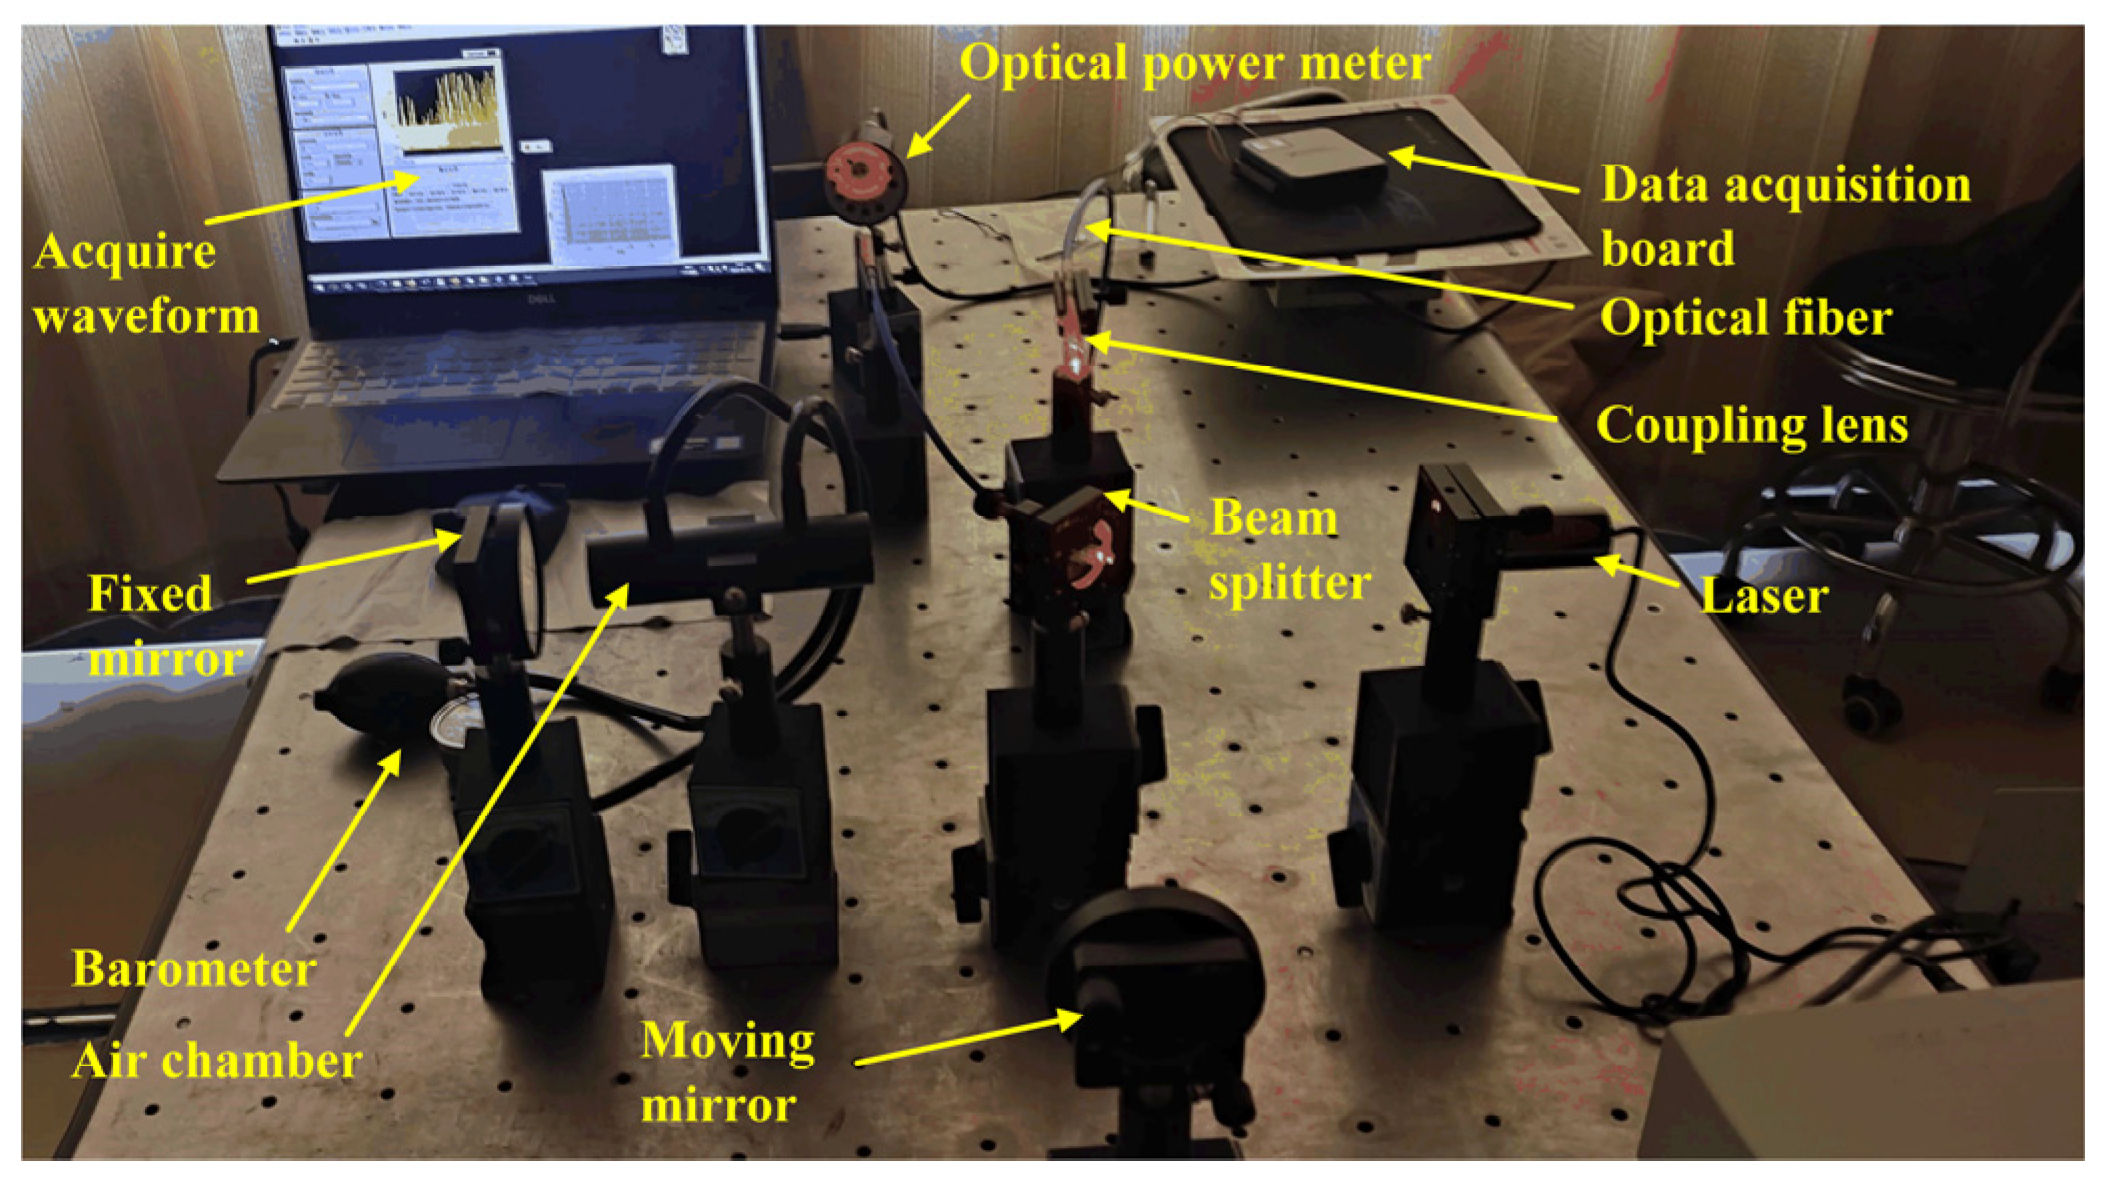
According to the principle described in fig. 4, the experimental system for length measurement was built (
Figure 5(a)). In this system, a laser with a rated output power of 5 mW was used as the light source, emitting red light with a wavelength of 635.7 ± 0.2 nm. A beam splitter with KBr material was used to realize the transmission and reflection of the incident beam in the interferometer with spectral range of 350-8000 cm
-1. Optical fiber was used that can precisely fit the SMF interface with the coupler being adopted. A moving guide rail with a precision of 10 μm was used to make the reflection. A photoelectric optical power detector made of silicon material and NI USB6002 acquisition card was used in this system.
3.2. Software design
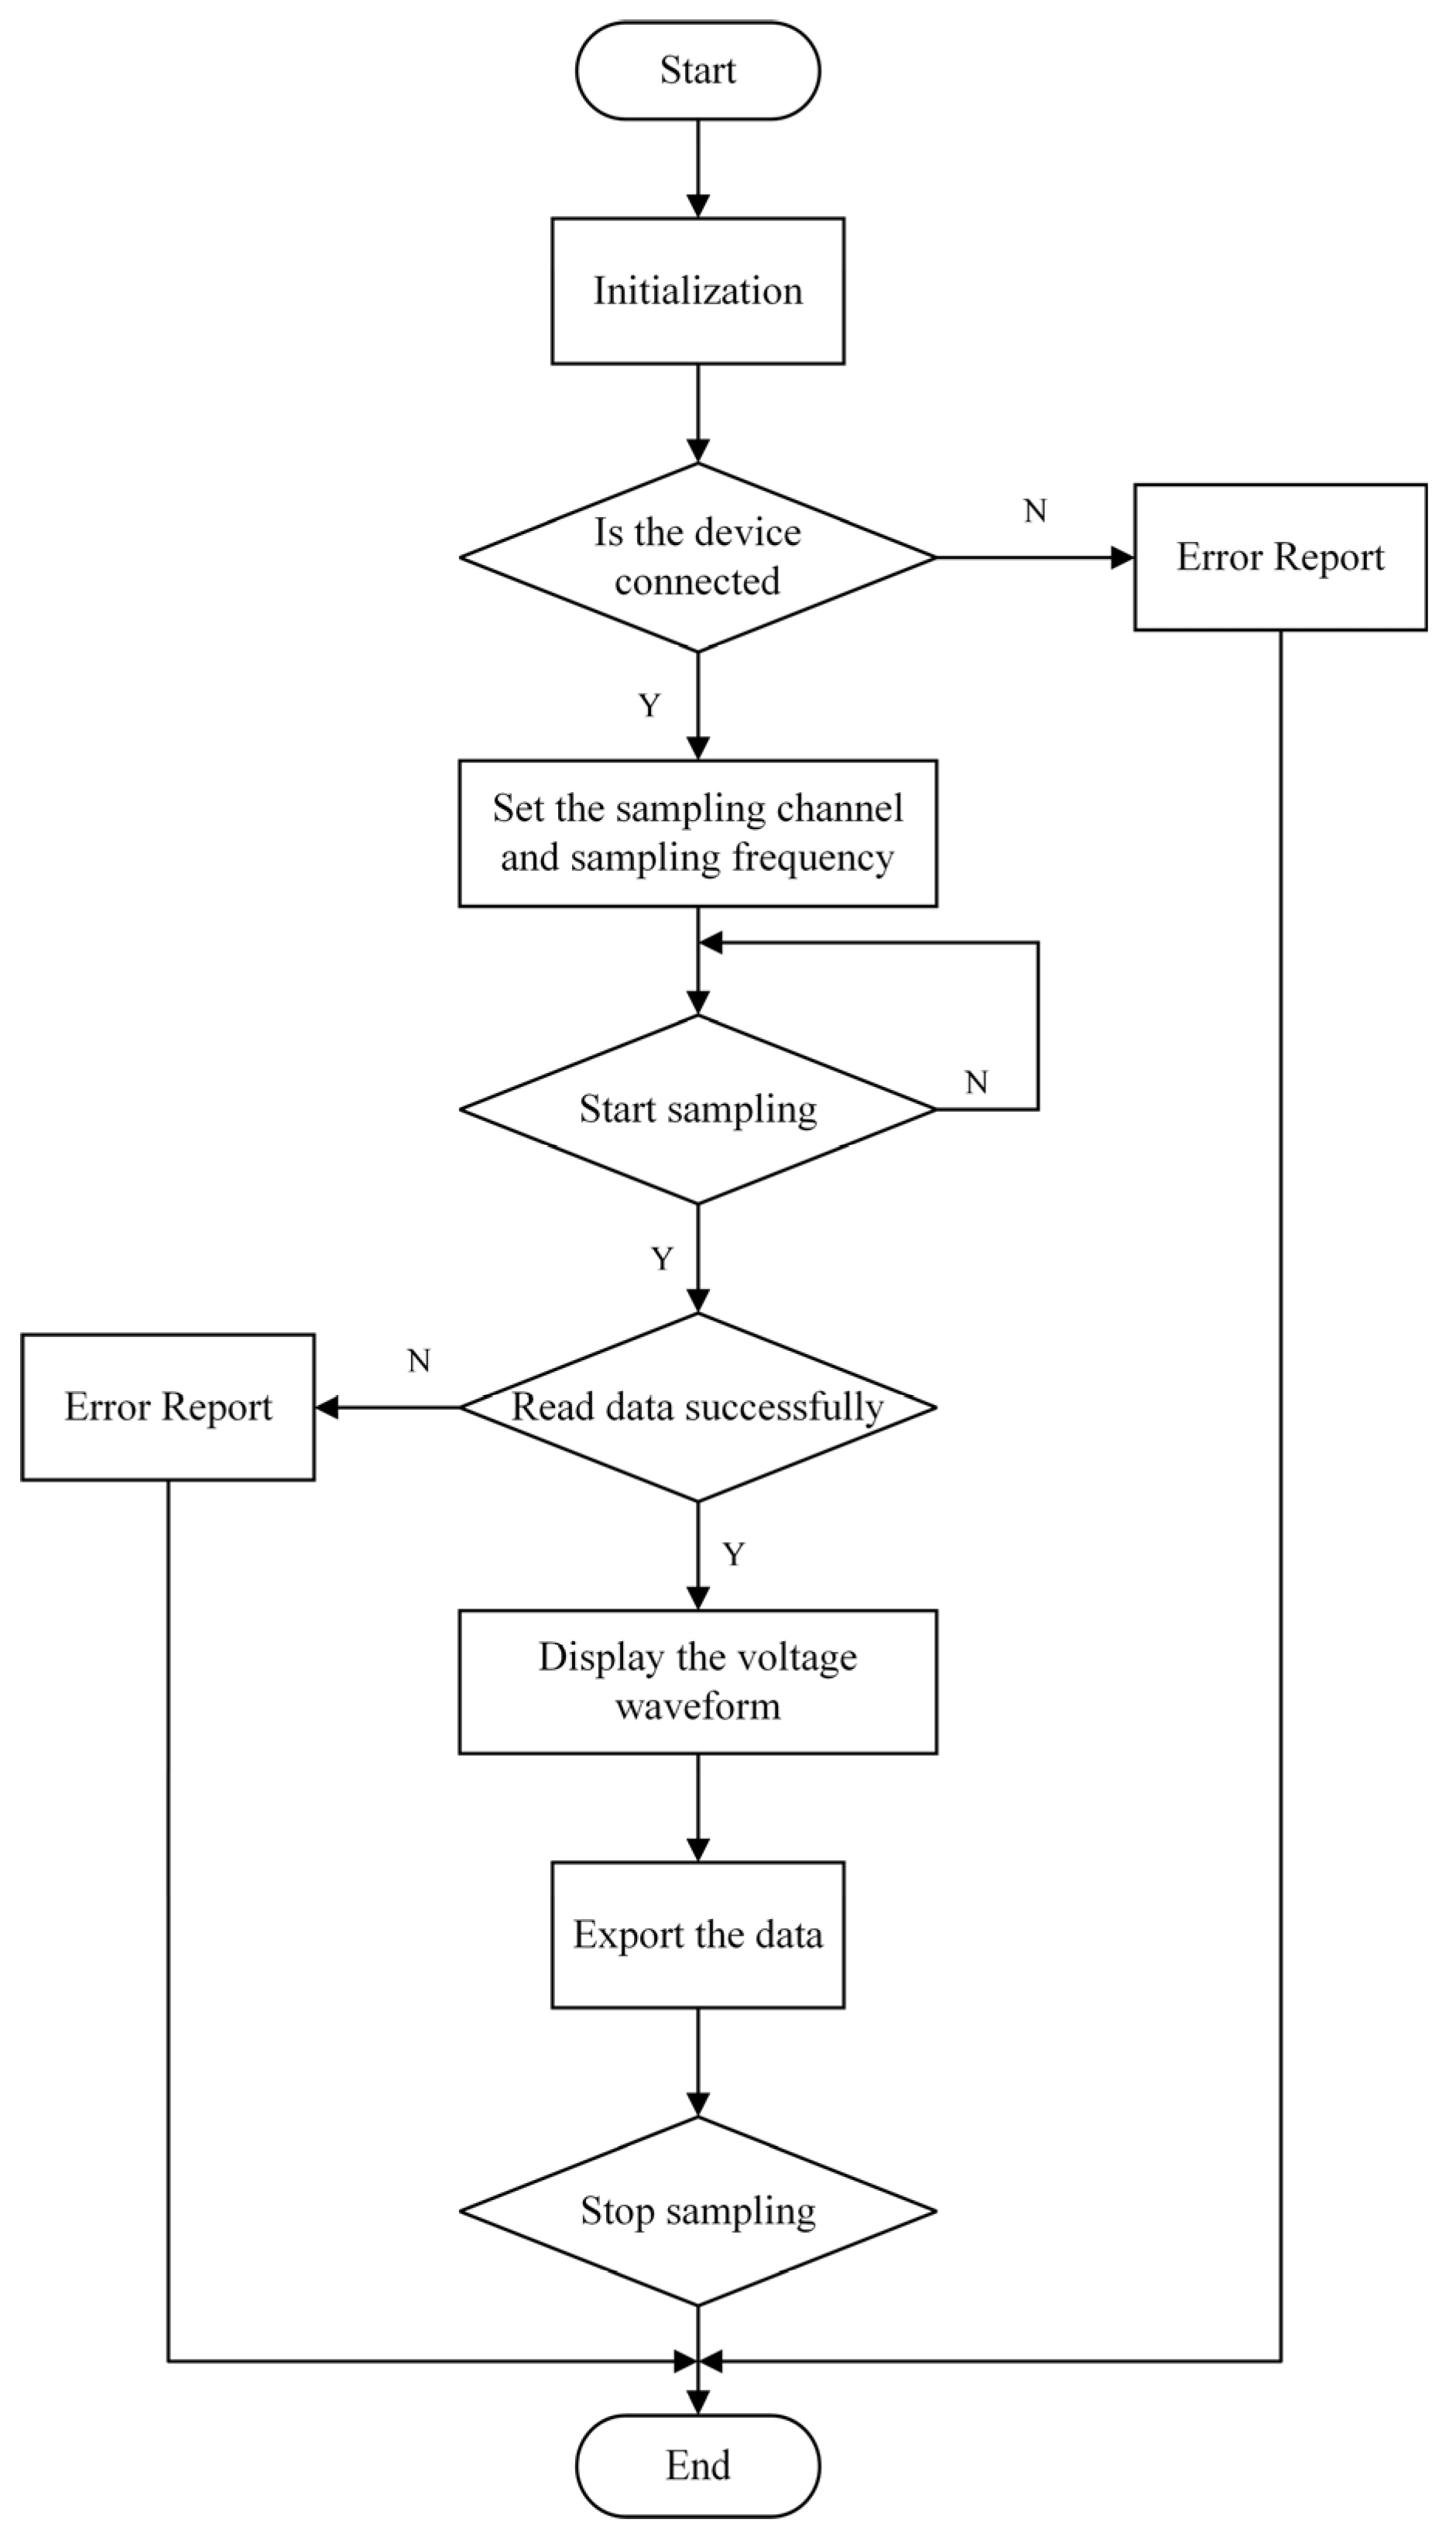
The flow chart of stripe collection designed by this system was shown in
Figure 6. The function of the software design was mainly to convert the light and dark stripes collected by the power meter into voltage values for collection. In order to display the voltage values in the form of waveform diagrams, the acquisition frequency settings, trigger the start button to start collection, channel settings, taking out the collected files, and setting the device running status were set.
The NI USB6002 acquisition card was used to collect the data, and the LabVIEW software was used to process the data of the data acquisition system. Function codes of peak statistics, spacing settings, stripe statistics and stripe reading were imported into MATHSCRPIT, and the number of stripes and stripe statistics were displayed on the front panel of LabVIEW.
4. Experimental model
4.1. Establishment of Mathematical Models
A remote calibration method of length value based on optical fiber information transmission was studied. The mathematical model was established according to the method of optical interferometry. The mathematical model of the length , the number of interference fringe changes and the laser wavelength was .
The relative combined standard uncertainty of the long-distance calibration device based on optical fiber information transmission designed in this paper should reach . Based on the above mathematical model, the uncertainty factors affecting the device were analysed, and it is known that the measurement accuracy of length is mainly affected by the number of interference fringes and the laser wavelength of the interferometer.
The uncertainty of length
can be expressed as the combined standard uncertainty:
In the formula, and and are the uncertainty of each component.
Then the sensitivity coefficients are:
Because
(
、
) are independent of each other, the relative standard uncertainty is expressed as:
According to the verification regulation of gauge block, the measurement uncertainty of the second gauge block was . Because the wavelength and fringe statistics were independent of each other, the system error was equally distributed. When the displacement guide moves 1 mm, the measurement error should be less than 550 nm. After calculation, the number of interference fringes produced by the mirror moving 1 mm was about 3146, and the wavelength of the light source was 635.7 nm.
According to the principle of error distribution,
Therefore, the measurement errors of wavelength and interferometer were respectively as follows:
That is, when the length was 1 mm, the limit error of wavelength was 0.3 nm. And the limit error of fringe counting was 1.2 within the error range of 550 nm.
4.2. Extraction of stripes
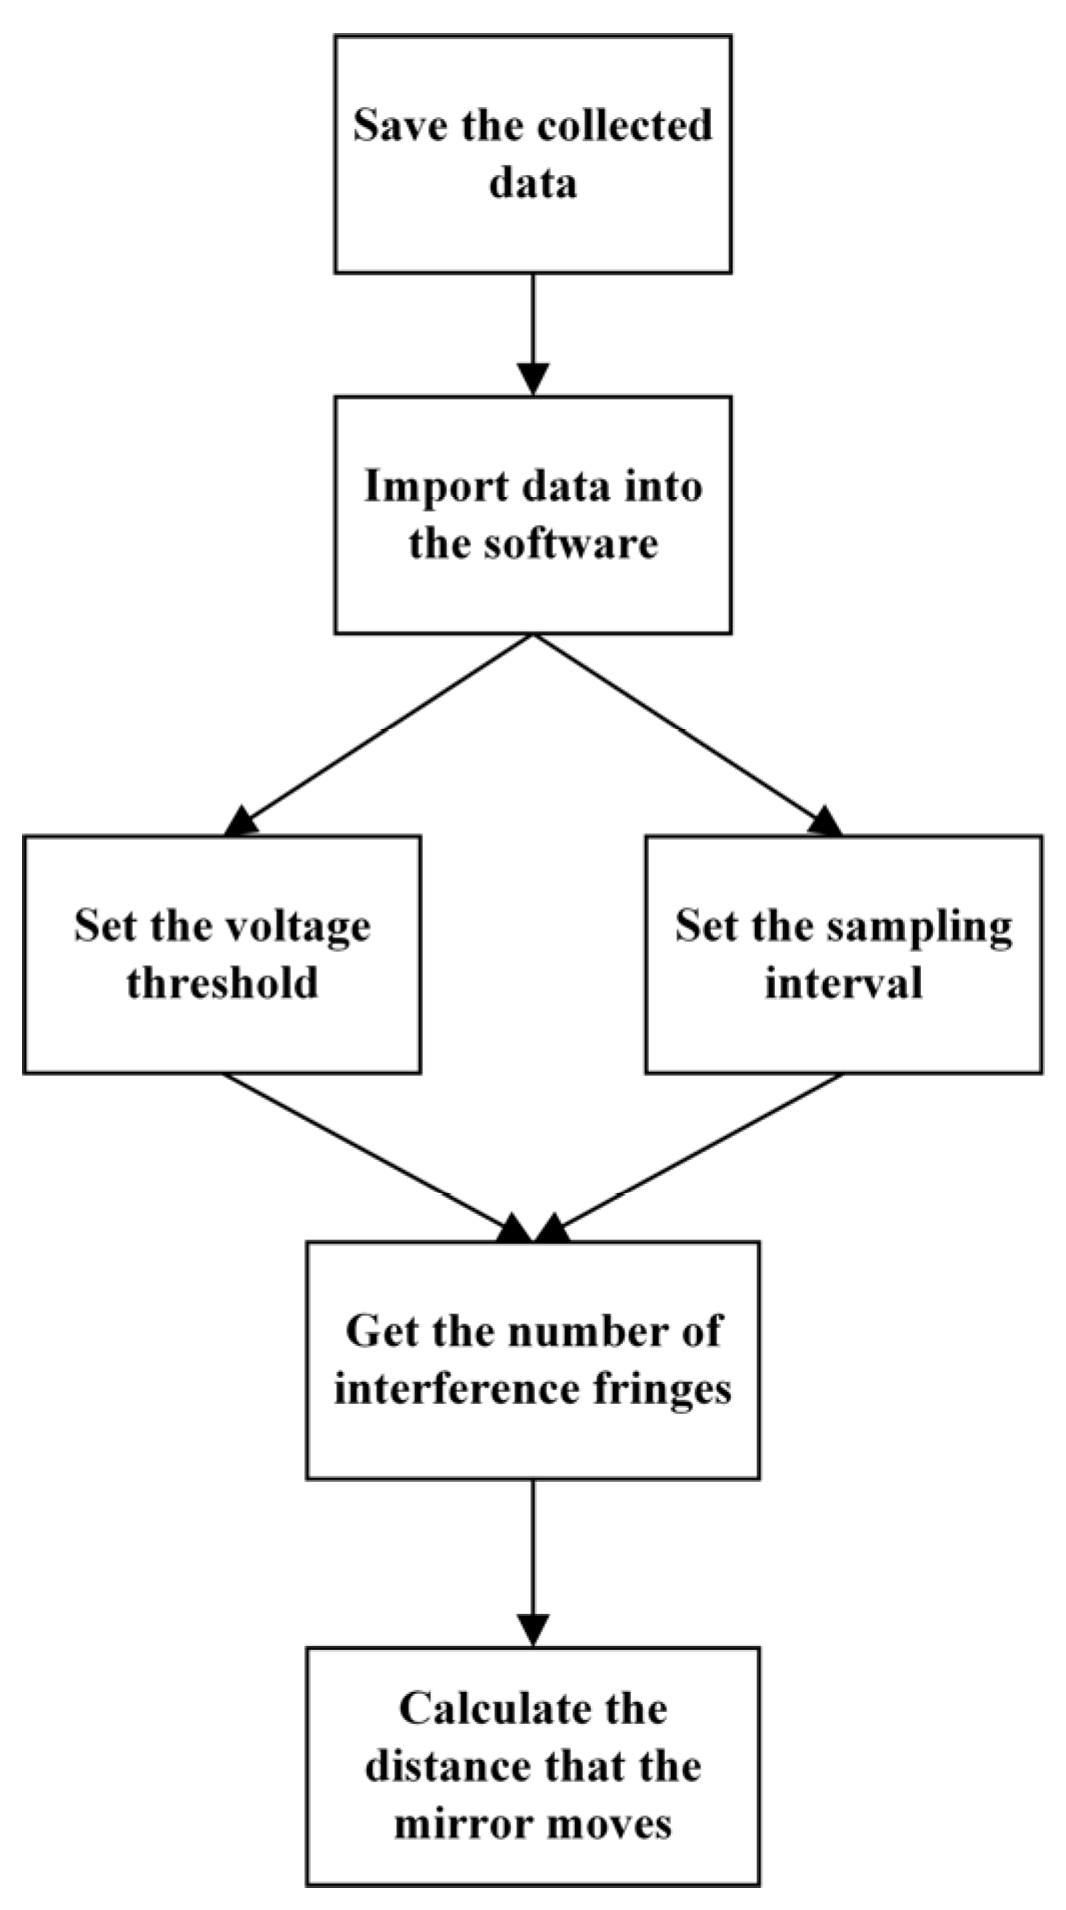
The key of the experiment is to extract the number of interference fringes. The information of the interference fringes into voltage was collected and converted by the optical power meter. The voltage value was derived, and the fringe statistics were performed using the peak statistics method. When performing peak statistics, the following steps were designed to obtain the number of stripes, as shown in
Figure 7. Interference fringe processing mainly included three steps: peak statistics, spacing setting, and stripe statistics.
4.2.1. Peak statistics
The number of fluctuation peaks was obtained by the method of peak statistics. The change of the interference fringes was corresponded to the change of the voltage. The voltage value increased when dark stripes passed and decreased when bright stripes pass. According to the waveform of this voltage change, the number of stripes was indirectly obtained by counting the number of peaks. Therefore, the number of peaks and fringes can be obtained by collecting the voltage signal and using the FINDPEAKS function.
4.2.2. Spacing setting
In order to better estimate the cycle duration and reduce the influence of the interference fringes caused by the vibration of the mirror, the peak spacing of the sampling points were limited. Since the sampling frequency of the capture card was 25Khz, the MinPeakDistance function was used to find the fringe values separated by at least 10,000 sampling point distances. When a peak was counted, the peaks within 10,000 sampling points before and after the peak would not be counted. When a stripe changed from light to dark, the voltage value was about 1.2V, between -0.2-1V. This part of the error could be filtered out with the MinPeakHeight function.
4.2.3. Readout of streak data and model calculation
When the light sources were superimposed and the fixed mirror and the moving mirror in the system were parallel to each other, the interference image observed on the optical plate was a set of isoinclined interference rings. Interference fringes of equal thickness occurred when the two mirrors were not strictly parallel. Since the optical path difference of the incident light in all directions was equal, the field of view was uniform and the light intensity was the largest when the two mirrors were completely coincident.
In the interference fringes, with the increase or decrease of
, the fringes emerged or shrunk from the center. When the displacement of the guide rail was
, the fringe variation was N, then
In the formula, was the wavelength of the light source used, and the wavelength used in the experiment was 635.7 nm. Therefore, the moving distance of the guide rail can be calculated according to the formula.
5. Experimental analysis of measuring length based on absolute measurement method
The experiment is carried out indoors with central air-conditioning. Keep 25℃ indoors for a long time. For the calibration experiment of the guide rail, the length is set to 10 μm, 20 μm, 30 μm, 40 μm, 50 μm, 100 μm and 1 mm. During the experimental test, the sampling frequency was designed to be 25 KHz, and 10 data were collected at each point. In order to obtain the number of stripes more accurately, add decimals to the last number of collected stripe as incomplete fringes to calculate displacement. It means that the ratio of the last collected voltage and the voltage of the light and dark changes of the stripes was calculated.
The same measuring point was subjected to repetitive experiments. After the gross error being eliminated, the site data were compared with the data at the remote computer. The remote calibration of the field end guide rail was realized.
In order to ensure the reliability of calibration, the absolute error and relative error of different lengths were calculated.
Absolute error was the absolute value of the difference between the measured value and the true value, and its formula was as follows:
Where is the absolute error, was the measured value, was the true value of the measured value, which was usually replaced by the conventional true value.
Relative error was the ratio of the absolute error to the true value of the measurand.
Where was the absolute error, r was the relative error, and was the true value of the measured value, which was usually replaced by the conventional true value.
5.1. Measurement within 100 μm length
The experimental data of the guide rail moving by 10 μm were shown in
Table 1(a). The average number of stripes collected by moving 10 μm was 31.28. The actual moving distance was 9942.35 nm calculated by formula 9. As shown in
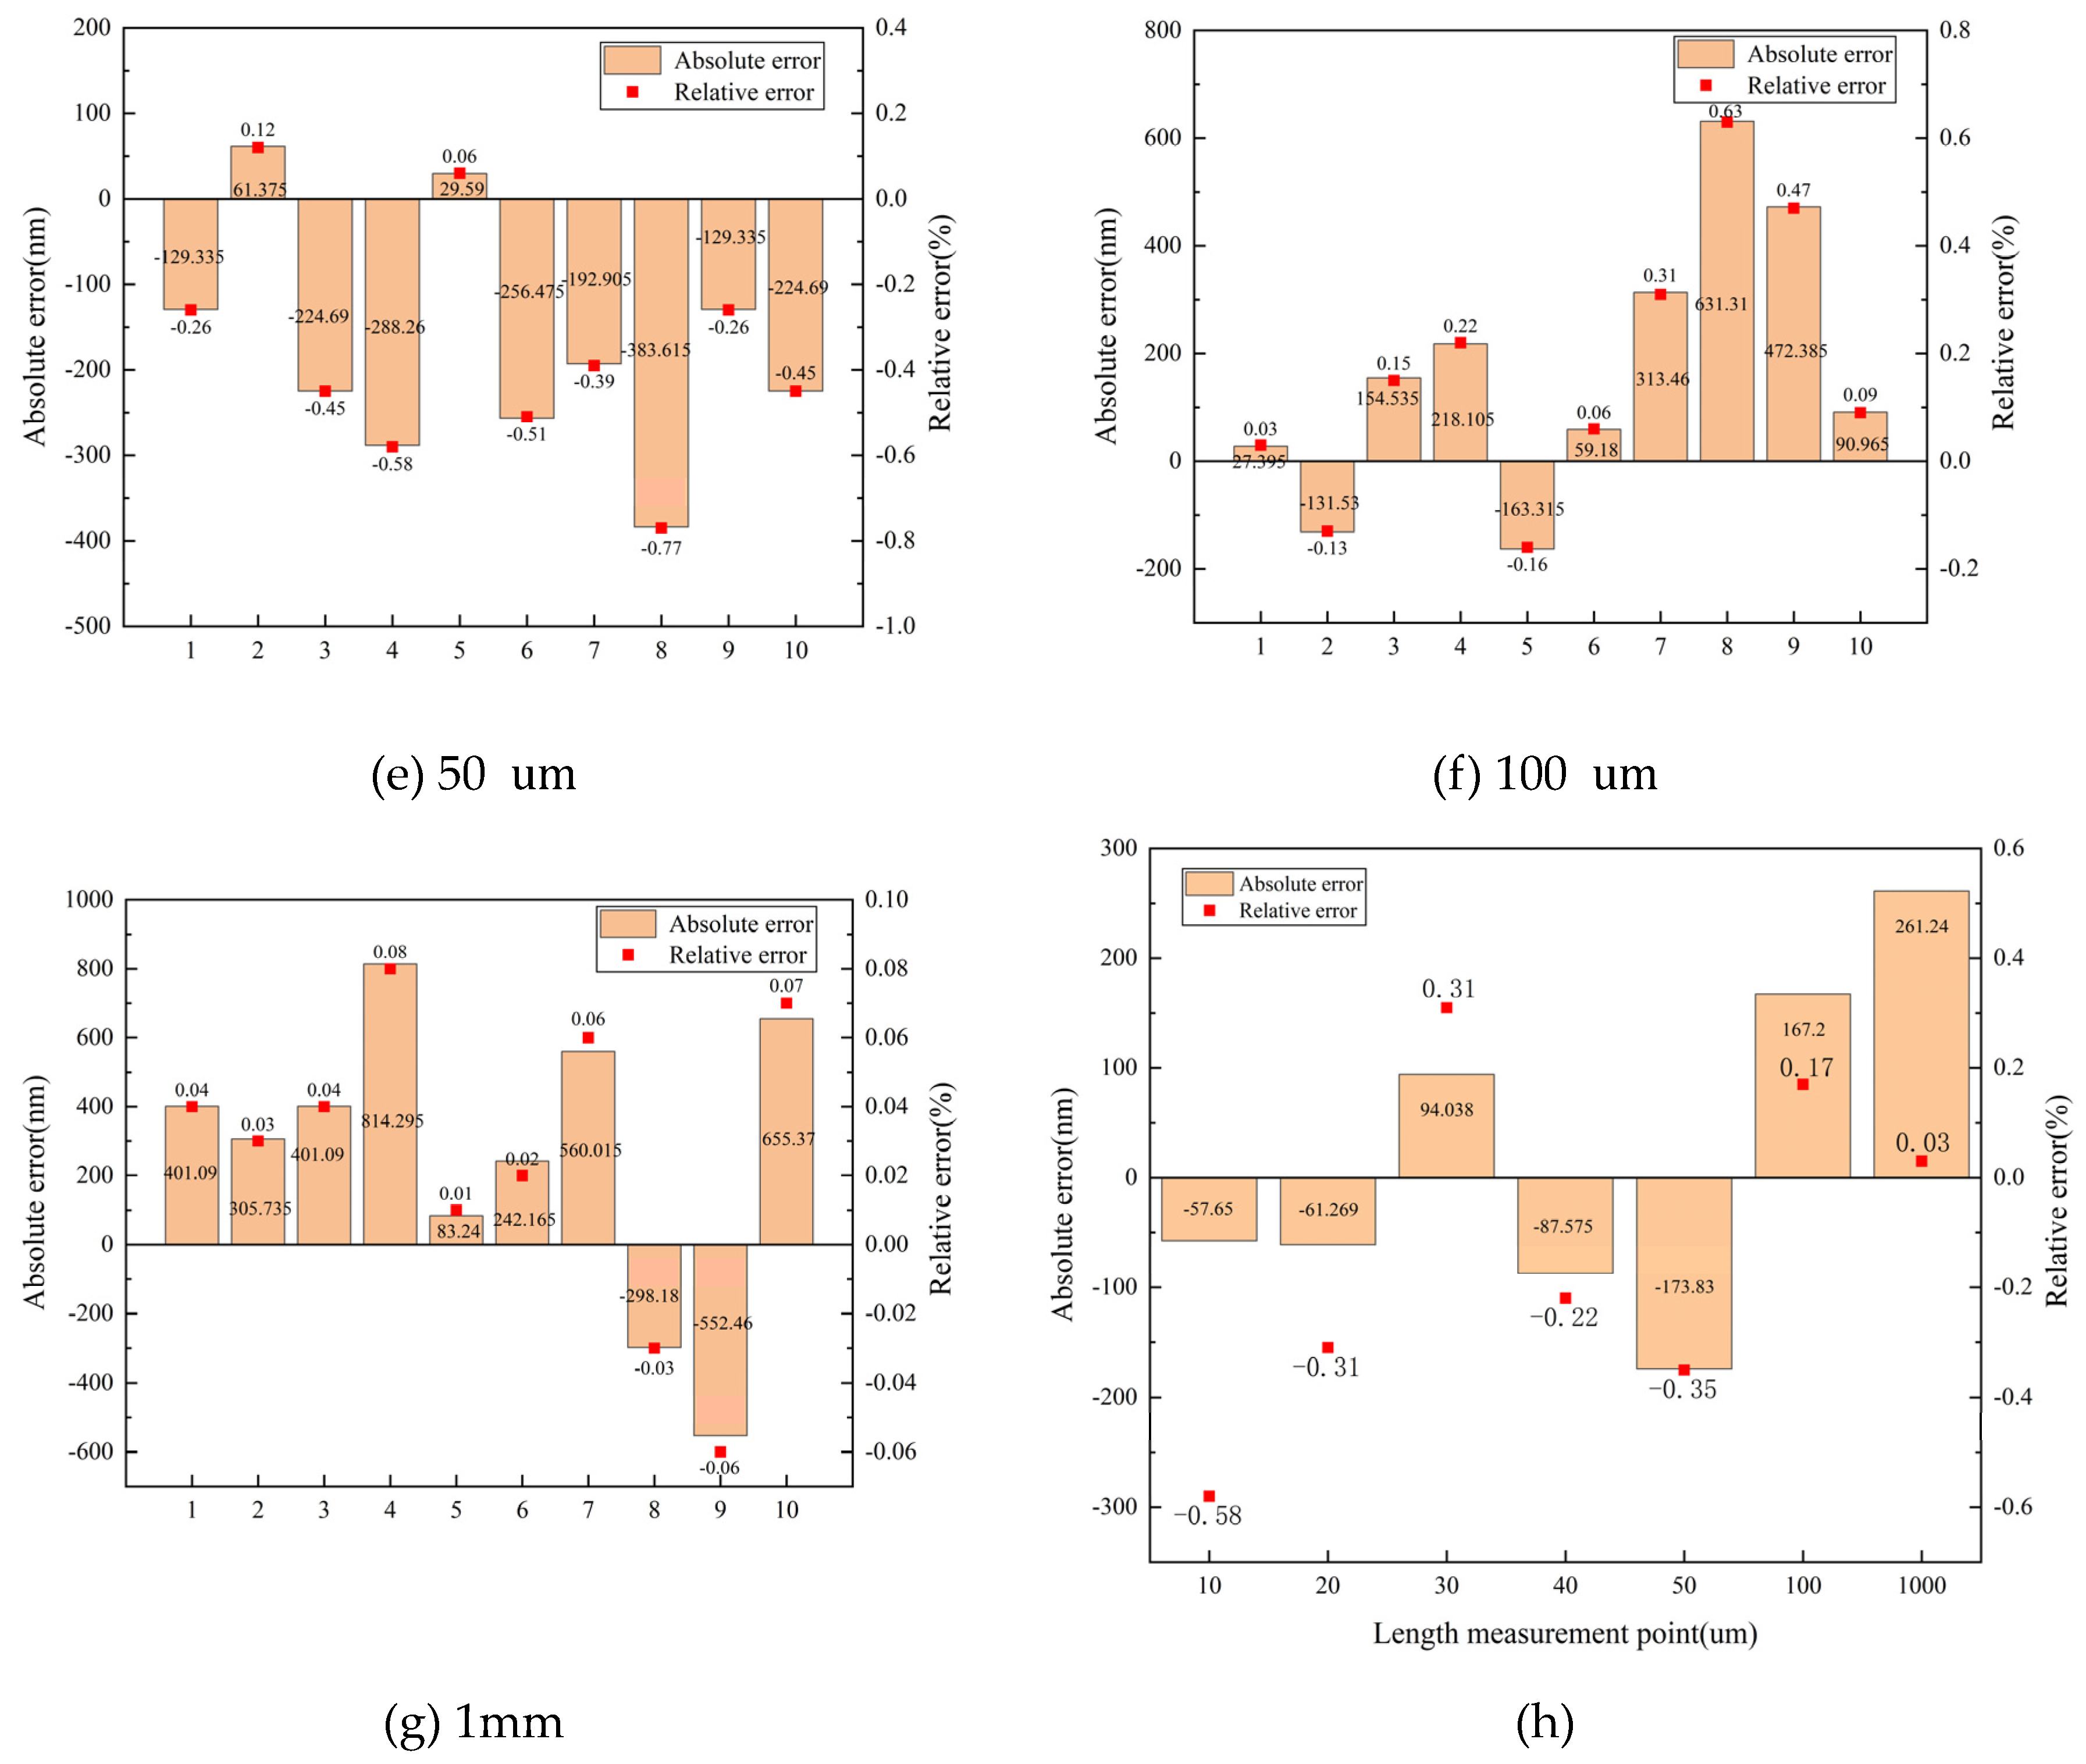
Figure 8(h), the absolute and relative errors of the guide rail moving by 10 μm were -57.65 nm and -0.58%, respectively.
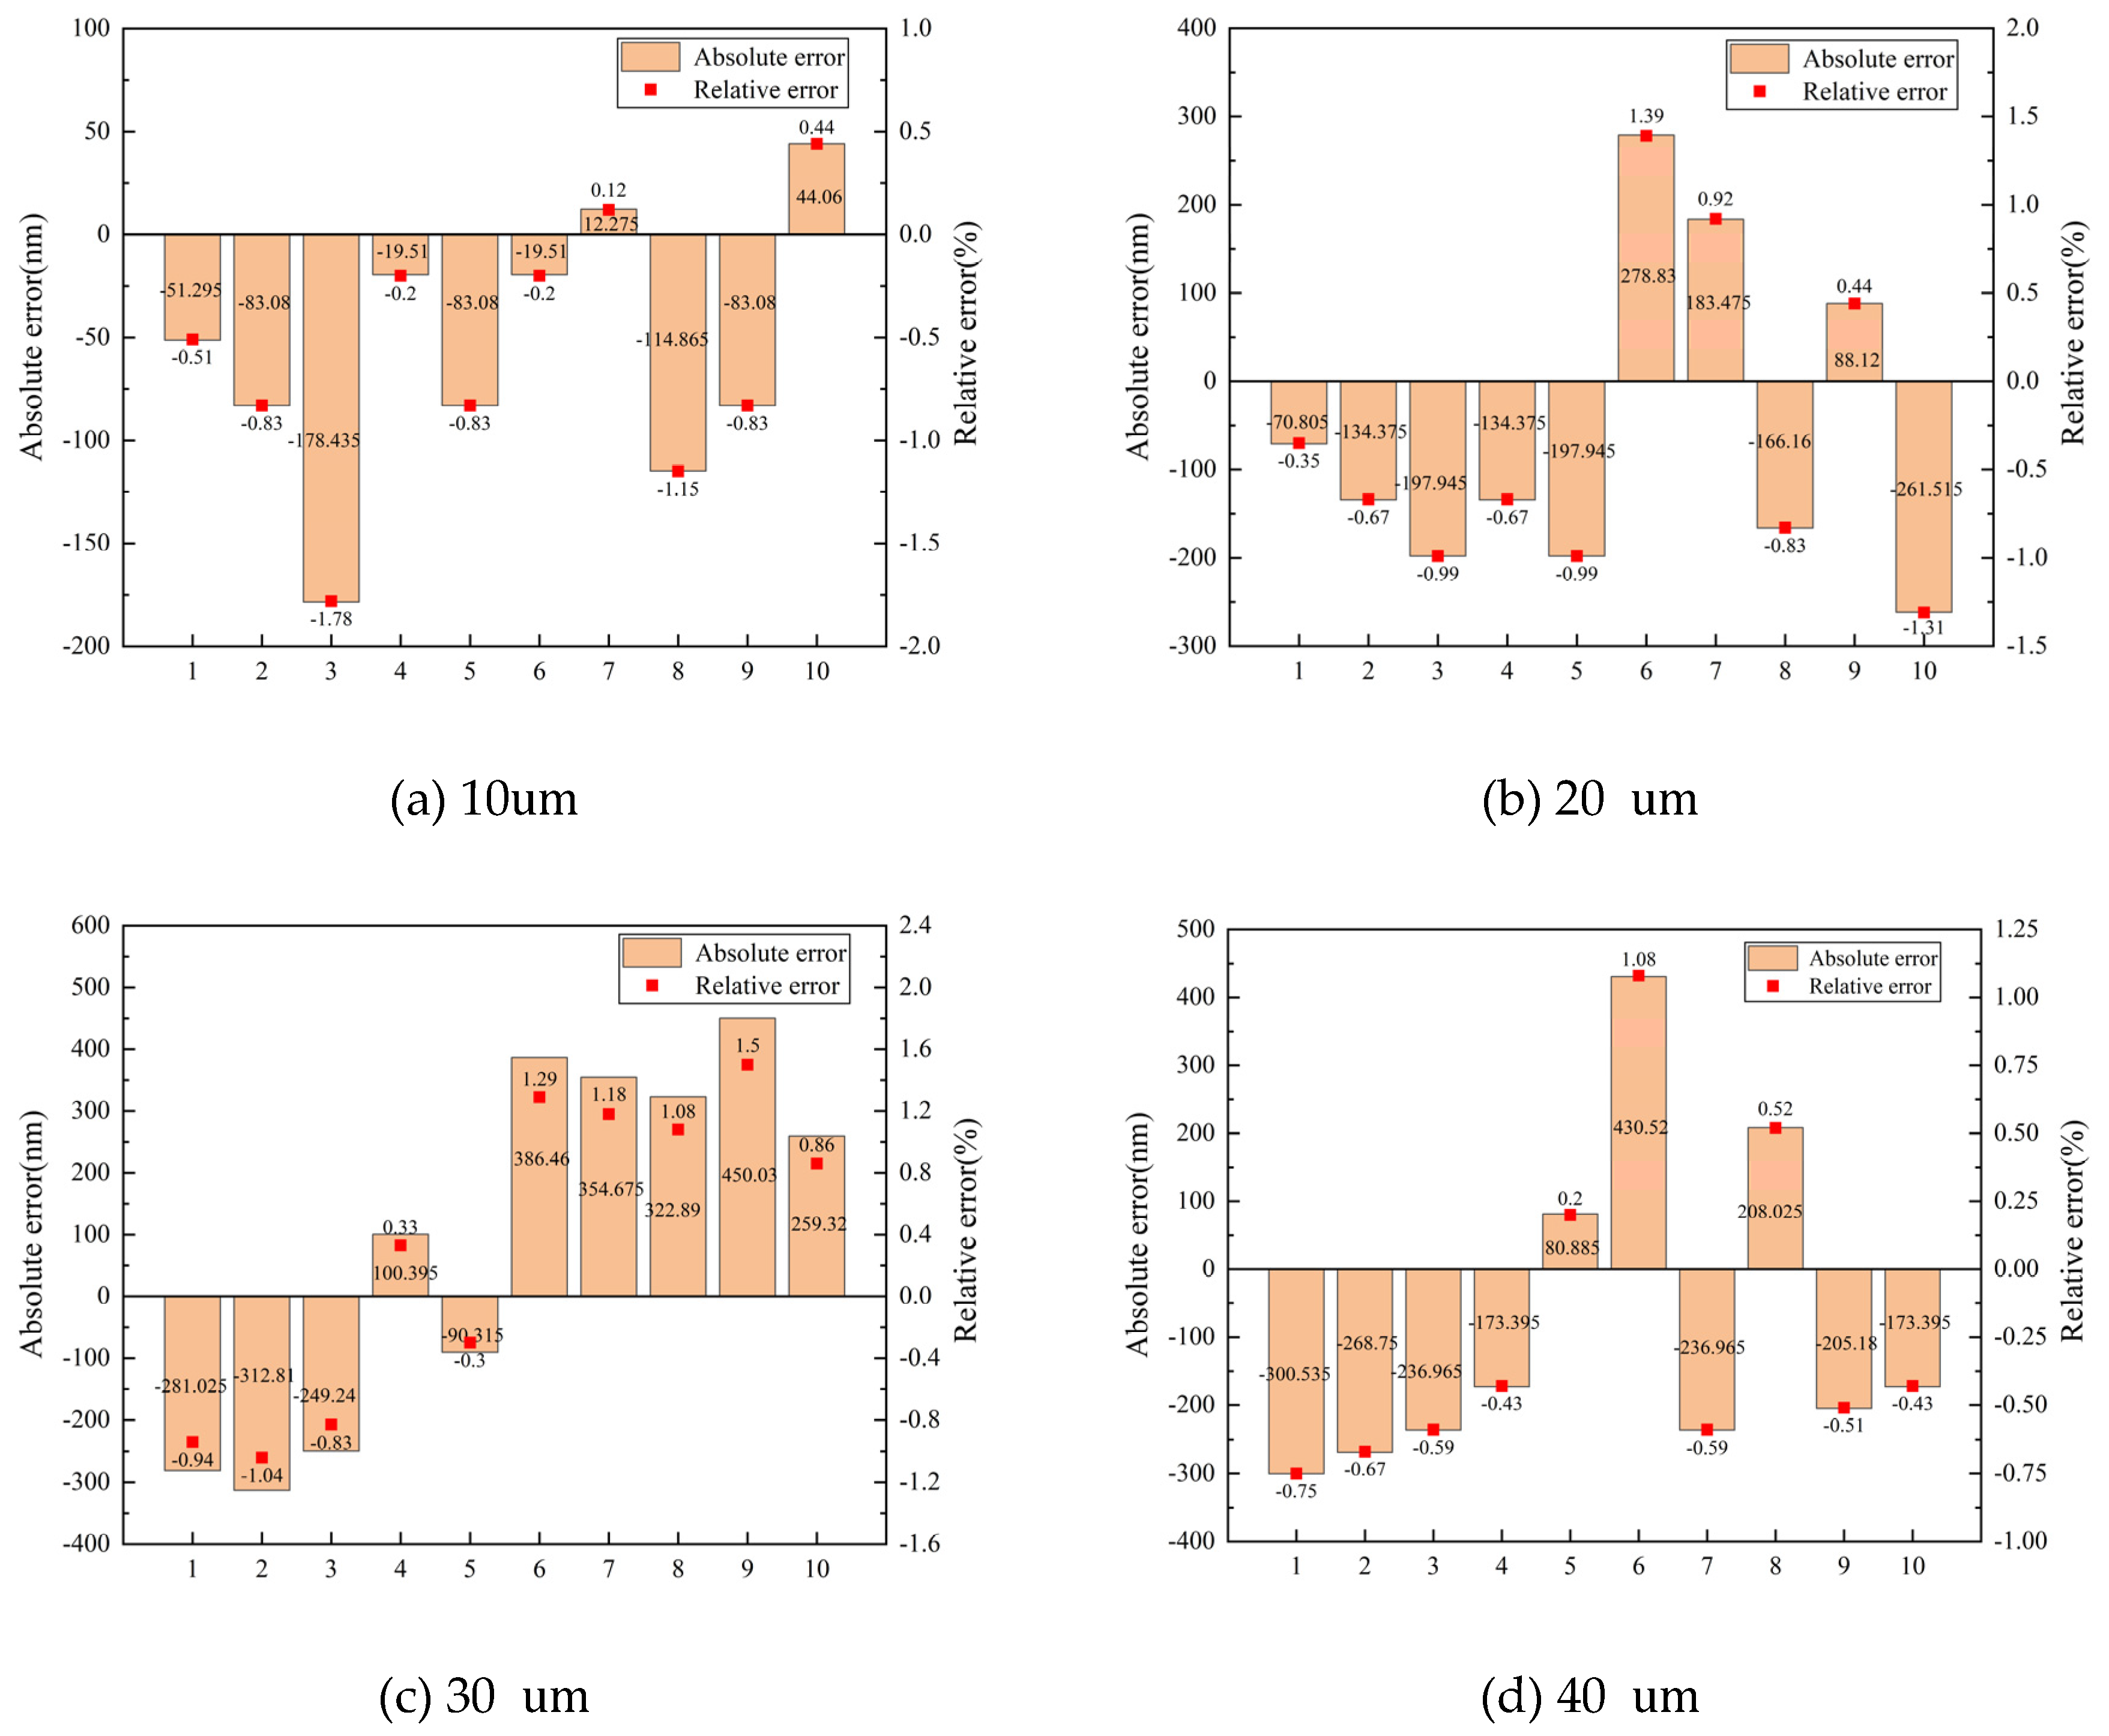
Figure 8(a) showed the error distribution of the guide rail moving by 10 μm, the maximum absolute error and the maximum relative error were -178.435 nm and -1.78%, respectively. The maximum error was within the range of a fringe variation and the relative error distribution was relatively stable. Therefore, the system was reliable in the 10 μm measurement range. The detection of the length value of 20, 30, 40 and 50 μm was set to further conduct a remote measurement experiment on the length value.
Table 1(b) was the experimental data of the guide rail moving by 20 μm. The average number of stripes collected by moving 20 μm was 62.73. The actual moving distance calculated by formula 9 was 19938.73 nm.
Figure 8(b) showed the error distribution of the guide rail moving by 20 μm, the maximum absolute error and the maximum relative error were 278.83 nm and 1.39%, respectively. As shown in
Figure 8(h), the absolute and relative errors of the guide rail moving by 20 μm were -61.269 nm and -0.31%, respectively.
Table 1(c) showed the experimental data of the guide rail moving by 30 μm. The average number of stripes collected by moving 30 μm was 94.68. The actual moving distance calculated was 30094.04 nm.
Figure 8(c) showed the error distribution of the guide rail moving by 30 μm, the maximum absolute error and the maximum relative error were 450.03nm and 1.5%, respectively. As shown in
Figure 8(h), the absolute and relative errors of the guide rail moving by 30 μm were 94.038 nm and 0.31%, respectively.
Table 1(d) showed the experimental data of the guide rail moving by 40 μm. The average number of stripes collected was 125.57. The actual moving distance calculated was 39912.42 nm.
Figure 8(d) showed the error distribution of the guide rail moving by 40 μm, the maximum absolute error and the maximum relative error in this set of data were 430.52 nm and 1.08%, respectively. As shown in
Figure 8(h), the absolute and relative errors were -87.575 nm and -0.22%, respectively.
Table 1(e) showed the experimental data of the guide rail moving by 50 μm. The average number of stripes collected was 156.76. The actual moving distance calculated was 49826.17 nm. Figures 8(e) showed the error distribution of the guide rail moving by 50 μm, the maximum absolute error and the maximum relative error were -383.61 nm and -0.77%, respectively. As shown in
Figure 8(h), the absolute and relative errors were -173.83 nm and -0.35%, respectively.
5.2. 100 μm length measurement
Table 1(f) showed the experimental data of the guide rail moving by 100 μm. The average number of stripes collected by moving 100 μm was 315.14 and the actual moving distance was 100167.2 nm.
Figure 8(f) showed the error distribution of the guide rail moving by 100 μm, the maximum absolute error and the maximum relative error were 631.31nm and 0.63%, respectively. As shown in
Figure 8(h), the absolute and relative errors of the guide rail moving by 100 μm were 167.2nm and 0.17%, respectively.
5.3. 1 mm length measurement
Table 1(g) showed the experimental data of the guide rail moving by 1 mm. The average number of stripes collected by moving 1 mm was 3146.96 and the actual moving distance was 1000261.24 nm.
Figure 8(g) showed the error distribution of the guide rail moving by 1 mm, the maximum absolute error and the maximum relative error were 814.295 nm and 0.08%, respectively. As shown in
Figure 8(h), the absolute and relative errors of the guide rail moving by 1 mm were 261.24 nm and 0.03%, respectively.
5.4. Analysis of measurement results
Figure 8(h) shows the relative error of the guide rail moving by different distances. According to the calibration of the optical interferometer, the relative error of the moving distance of the guide rail is less than 0.6%. As the test distance gradually increased, the relative error gradually decreased, but fluctuated at 50 μm. According to the analysis, the accuracy of calibration should be improved from the following aspects:
(1) According to the theoretical analysis and the existing experimental conditions, the error should be changed based on . If a subdivision circuit and a direction discrimination circuit were added in the process of signal processing, the accuracy of the calibration system will increase by an order of magnitude.
(2) In the process of fringe counting, the integer number of fringes was calculated. However, when the first fringe and the last fringe were detected by the optical power meter, the fringes may not pass through completely. Statistics produced errors in the range of 2 fringes. The fractional part of the stripes was refined simply, and the fractional part was not detailed designed.
(3) It is necessary to give precise control of the mirror. When the stripe changed with a stripe moving, the distance corresponding to the mirror movement was half of the wavelength. This indicated that when the mirror was moved with nanometer scale, the fringe statistics will be more accurate. And the effects caused by changes in the optical path will be reduced.
5.5. Analysis of uncertainty of measurement
Move the distance of 10 μm, 100 μm and 1 mm, the relative error was -0.58%, 0.17% and 0.03%, respectively. And the absolute error was -57.65, 251.701 and 167.249 nm, respectively. As the measurement distance increased, the absolute error increased. In addition, the measurement uncertainty of these three points was solved and analysed.
Table 2.
Calculation of measurement uncertainty.
Table 2.
Calculation of measurement uncertainty.
|
=8 |
=95% |
10 μm |
100 μm |
1 mm |
| The average value |
|
9942.348 |
100167.249 |
1000251.701 |
| Standard deviation |
|
64.967 |
251.260 |
426.980 |
| Standard deviation of the average |
|
20.559 |
79.511 |
135.120 |
| Standard uncertainty of the average |
|
20.559 |
79.511 |
135.120 |
| Expanded uncertainty of the average |
|
47.492 |
183.674 |
312.128 |
Uncertainty of measurement was a parameter associated with a measurement result that reasonably characterized the dispersion of the measurement result. The smaller the measurement uncertainty, the smaller the data dispersion and the higher the data quality. Usually, the uncertainty was expressed in multiples of the standard deviation.
Where U refers to the extended uncertainty, k refers to the inclusion factor, and u refers to the standard uncertainty.
For the distances of 10 μm, 100 μm and 1 mm, the uncertainty of type A was calculated, with the degree of freedom , the confidence probability of P=95%, and k=2.31 according to t distribution table. The results were shown below.
According to the calculation, the measurement of 10 μm, 100 μm and 1 mm was 9942.348 ± 47.492 nm, 100167.249±183.674 nm and 1000251.701±312.128 nm, in which v = 9 and P = 95%.
6. Conclusions
In this paper, a new method of remote calibration of length value based on optical fiber information transmission is studied. Based on this, a remote measurement system including interference system, electrical signal acquisition and data processing was built to verify the length value. This system adopted the Michelson interference system, which can improve the measurement accuracy. Also, the use of coherent light propagation could realize the long-distance transmission of the interference system. The system acquisition was designed and the fringe was acquired by electrical signal, and the electrical signal was transmitted to the computer to realize remote measurement. The collected data was processed. The effects of vibration was reduced by setting the spacing. The number of stripes precisely was read by setting the peak value. The displacement guide rail is calibrated according to the number of stripes and the mathematical model between stripes and distances. The remote calibration experiment on the length is carried out, and the minimum relative error of the guide rail is 0.03% and the maximum relative error is 0.58% under different displacements. The calibration results meet the actual standards of the guide rail. The experiment completed the principle verification. This design can be considered as one of the methods of remote length measurement.
Acknowledgements
The authors are grateful for the support by the National Natural Science Foundation of China, China (62173122), Key Project of Natural Science Foundation of Hebei Province (F2021201031), Beijing-Tianjin-Hebei Collaborative Innovation Community Construction Project (20540301D), Hebei Provincial Postgraduate Demonstration Course Project (KCJSX2021009), Postdoctoral Fund of Hebei University (703202105) and Post-graduate's Innovation Fund Project of Hebei University (HBU2023SS035).
Conflicts of interest
The authors declare that they have no known competing financial interests or personal relationships that could have appeared to influence the work reported in this paper.
References
- Wang Li-ji, Fundamentals of Metrology. China Quality and Standards Publishing & Media Co.,Ltd., 1997.
- LI Xiao-ting, Length metrology. China Quality and Standards Publishing & Media Co.,Ltd., 2006.
- M. Dobosz and O. Iwasinska-Kowalska, "A new method of non-contact gauge block calibration using a fringe-counting technique: I. Theoretical basis," Optics and Laser Technology, Article vol. 42, no. 1, pp. 141-148, 2010 FEB 2010. [CrossRef]
- SU Chang-lin and QIU Dong-li, " Survey of Internet-enabled calibration," China Measurement Technology, no. 03, pp. 1-6, 2006.
- SHU Wei-qun, "Coming nearer to the Internet-based Calibration-A Primary Survey about the Technolocly of the Tele-calibration," Application Research of Computers, no. 09, pp. 23-26, 2002. [CrossRef]
- A. Hirai and H. Matsumoto, "Remote calibration of end standards using a low-coherence tandem interferometer with an optical fiber," Optics Communications, vol. 215, no. 1-3, pp. 25-30, Jan 1 2003, Art no. Pii s0030-4018(02)02196-x. [CrossRef]
- M. Norgia, I. Boniolo, M. Tanelli, S. M. Savaresi, and C. Svelto, "Optical Sensors for Real-Time Measurement of Motorcycle Tilt Angle," IEEE Transactions on Instrumentation and Measurement, vol. 58, no. 5, pp. 1640-1649, 2009. [CrossRef]
- J. L. Vilaca, J. C. Fonseca, and A. M. Pinho, "Non-contact 3D acquisition system based on stereo vision and laser triangulation," Machine Vision and Applications, Article vol. 21, no. 3, pp. 341-350, 2010 APR 2010. [CrossRef]
- X. M. Liu, Y. Wu, P. F. Zhang, and G. G. Yang, "Research of a nanometer system for displacement measurement based on optical lever," Guangdianzi Jiguang/Journal of Optoelectronics Laser, vol. 17, no. 8, pp. 969-973, 2006. [CrossRef]
- V. E. Marin, Z. Kashino, W. H. W. Chang, P. Luitjens, and G. Nejat, "Design of three-dimensional structured-light sensory systems for microscale measurements," Optical Engineering, Article vol. 56, no. 12, 2017 DEC 2017, Art no. 124109. [CrossRef]
- Y. Yin, M. Wang, B. Z. Gao, X. Liu, and X. Peng, "Fringe projection 3D microscopy with the general imaging model," Optics Eepress, Article vol. 23, no. 5, pp. 6846-6857, 2015 MAR 9 2015. [CrossRef]
- B. S. Chun, K. Kim, and D. Gweon, "Three-dimensional surface profile measurement using a beam scanning chromatic confocal microscope," Review of Scientific Instruments, Article vol. 80, no. 7, 2009 JUL 2009, Art no. 073706. [CrossRef]
- D. K. Hamilton and T. Wilson, "Three-dimensional surface measurement using the confocal scanning microscope," Applied Physics B Photophysics and Laser Chemistry, vol. 27, no. 4, pp. 211-213, 1982. [CrossRef]
- G. Berkovic and E. Shafir, "Optical methods for distance and displacement measurements," Advances in Optics and Photonics, vol. 4, no. 4, pp. 441-471, Dec 2012. [CrossRef]
- P. de Groot, J. Biegen, J. Clark, X. C. de Lega, and D. Grigg, "Optical interferometry for measurement of the geometric dimensions of industrial parts," Applied optics, Journal Article vol. 41, no. 19, pp. 3853-60, 2002 Jul 01 2002. [CrossRef]
- G. Jaeger, "Limitations of precision length measurements based on interferometers," Measurement, ArticleProceedings Paper vol. 43, no. 5, pp. 652-658, 2010 JUN 2010. [CrossRef]
- S. Yang and G. Zhang, "A review of interferometry for geometric measurement," Measurement Science and Technology, Review vol. 29, no. 10, 2018 OCT 2018, Art no. 102001. [CrossRef]
- Z. Yan, G. Chen, C. Xu, and W. Xu, "Design and experimental study of a sensitization structure with fiber grating sensor for nonintrusive pipeline pressure detection," ISA Trans, vol. 101, pp. 442-452, Jun 2020. [CrossRef]
- C. S. Lin, S. W. Yang, H. L. Lin, and J. W. Li, " Measurement Of Surface Profile and Surface Roughness of Fibre-Optic Interconnect by Fast Fourier Transform," Metrology and Measurement Systems, vol. 24, no. 2, pp. 381-390, Jun 2017. [CrossRef]
- P. J. Sun et al., "Monolithic Integrated Micro-Opto-Electromechanical Accelerometer Based On Michelson Interferometer Structure," Journal of Lightwave Technology, vol. 40, no. 13, pp. 4364-4372, JUL 1 2022. [CrossRef]
- Guo Jiahao, et al."High-Temperature Measurement of a Fiber Probe Sensor Based on the Michelson Interferometer." Sensors 22.1(2021). [CrossRef]
- A. Winarno, S. Takahashi, A. Hirai, K. Takamasu, and H. Matsumoto, "Absolute measurement of gauge block without wringing using tandem low-coherence interferometry," Measurement Science and Technology, Article vol. 23, no. 12, 2012 DEC 2012, Art no. 125001. [CrossRef]
- J. Dietvorst, J. Goyvaerts, T. Nils Ackermann, E. Alvarez, X. Munoz-Berbel, and A. Llobera, "Microfluidic-controlled optical router for lab on a chip," Lab On a Chip, Article vol. 19, no. 12, pp. 2081-2088, 2019 JUN 21 2019. [CrossRef]
- H. MATSUMOTO, K. SASAKI, and A. HIRAI, "Remote Calibration of Length Standards Using 47-km-Long Optical Fiber Network," Japanese journal of applied physics, vol. 44, no. 28/32, 2005. [CrossRef]
|
Disclaimer/Publisher’s Note: The statements, opinions and data contained in all publications are solely those of the individual author(s) and contributor(s) and not of MDPI and/or the editor(s). MDPI and/or the editor(s) disclaim responsibility for any injury to people or property resulting from any ideas, methods, instructions or products referred to in the content. |
© 2023 by the authors. Licensee MDPI, Basel, Switzerland. This article is an open access article distributed under the terms and conditions of the Creative Commons Attribution (CC BY) license (http://creativecommons.org/licenses/by/4.0/).
