1. Introduction
Over the last two decades, Cd has emerged as a severe environmental threat to both the plant kingdom and human health. Cd is a highly toxic heavy metal that is easily transferrable in soil and absorbed by various plants such as rice, Chinese cabbage and carrot [
1,
2,
3]. Cd has been linked to a variety of human health issues including cancer and cardiovascular diseases [
4,
5,
6]. Due to the rapid increase in industrialization and improper application of pesticides and chemical fertilizers, the soil is widely contaminated by Cd, affecting not only the plants but also humans through the food chain. The accumulation of Cd in cells or tissues can inhibit cell growth through a wide range of physiological, biochemical, morphological, cellular and ultrastructural changes [
7,
8,
9,
10,
11]. Cd enhances the accumulation of ROS and MDA, which are also highly toxic and trigger various cellular alterations, such as DNA repair, DNA methylation, gene transcription and gene translation [
12,
13,
14,
15]. At the molecular level, extensive research has been conducted on Cd stress, revealing a multitude of candidate genes that encode metal transporters and transcription factors involved in Cd detoxification and tolerance in plants and other species [
16,
17,
18,
19,
20].
The MYB proteins belong to a superfamily of plant transcription factors, which play a central role in regulating plant biotic and abiotic stresses. The MYB transcription factor family is the largest family of transcriptional regulators, involved not only in plant growth and developmental processes, but also in abiotic stress tolerance [
21,
22]. The MYB family genes are classified into four subfamilies: 1R, 2R, 3R and 4R-MYB [
23,
24], each containing one or more conserved structural domains. 2R-MYB is the most abundant type in plants [
24,
25]. Thousands of MYB genes have been identified in various plant species that regulate physiological, biochemical and molecular processes under normal and abiotic stresses [
26,
27,
28]. Several studies have reported on MYB genes conferring stress tolerance in plants. For example,
AtMYB20 and
MYBS1 induce drought stress tolerance in
Arabidopsis,
PsnMYB108 enhances salinity stress in tobacco, and
RmMYB108 enhances cold stress in
Arabidopsis [
29,
30,
31,
32]. MYB15 regulates cold stress tolerance by interacting with the inducer of C-repeat binding factor (CBF) Expression 1 (ICE1) and binding to the promoter of CBF [
33]. The R2R3-MYB transcription factor AtMYB49 positively regulates Cd accumulation through associating with the basic helix-look-helix transcription factors bHLH38 and bHLH101, which activates iron-regulated transporter 1 (IRT1) and heavy metal-associated isoprenylated proteins (HIPP22 and HIPP44) [
34]. In addition, overexpression of the MYB transcription factor BnMYB2 from ramie (
Boehmeria nivea) regulates Cd tolerance and Cd accumulation in
Arabidopsis [
35]. OsMYB45 plays an important role in resistance to Cd stress in rice [
36]. AtMYB4 regulates Cd tolerance by providing enhanced protection against oxidative damage and upregulating the expression of PCS1 and MT1C in
Arabidopsis [
37]. SbMYB15 from the succulent halophyte
Salicornia Brachiata Roxb mitigates cadmium and nickel stress in transgenic tobacco by limiting uptake and modulating antioxidative defense systems [
38]. However, most of these MYB genes identified in Cd tolerance do not influence Cd accumulation, with the exceptions of AtMYB49 and BnMYB2.
Chinese cabbage (
Brassica rapa) is one of the most popular leafy vegetables in East Asia, and like many other leafy vegetables, it has a high capacity for accumulating Cadmium (Cd) in its leaves [
39,
40,
41]. It is essential to specifically identify Cd tolerance candidate genes in Chinese cabbage. In this study, we investigated genes through a transcript profiling analysis conducted on Chinese cabbage “Guangdongzao” cultivar [
42]; and BrMYB116, a MYB transcription factor in Chinese cabbage, has been discovered to enhance Cd tolerance using a yeast system. Previously, MYB116 from the sweetpotato was described to play a role in drought tolerance [
43]. However, as a transcription factor, the downstream targets were not identified. To gain further insights, we generated the BrMYB116 overexpressing Chinese cabbage. However, the transgenic Chinese cabbage did not enhance the Cd tolerance comparing with the wild type control, which is different from the phenotype in yeast. Thus, we performed RNA-seq transcriptome analysis on Cd-treated yeast cells carrying either an empty vector or the BrMYB16 transgene vector, leading to the identification of eighteen differentially expressed genes (DEGs). Notably, overexpressing one of these DEGs, only DEG5 (FIT3, CENPK1137D_2397), in yeast greatly enhanced Cd tolerance while reducing Cd accumulation in the cells, which aligned with the Cd tolerance phenotype displayed by BrMYB116. More importantly, FIT3 can enhance Cd tolerance and reduce Cd accumulation in Chinese cabbage. Considering there are no homologs of FIT3 in Chinese cabbage, the loss function of MYB116 in the Chinese cabbage in Cd tolerance is probably due to the loss of FIT3 in the evolutionary process. Our results further demonstrated that the MYB116 protein is directly bound to the FIT3 promoter, thereby activating FIT3 in response to Cd stress. We hypothesize that
FIT3 acts as a downstream gene to mediate the iron transporter channel in Cd stress tolerance and Cd exclusion. This study has shed light on a novel molecular basis for Cd stress tolerance, paving the way for future investigations on genetically modified crops.
2. Materials and methods
2.1. Plant treatments
Chinese cabbage (Cv. Guangdongzao) seeds were subjected to a pretreatment by soaking them with 8% sodium hypochlorite for 3 min, followed by thorough washing with ddH
2O at least five times to remove any excessive sodium hypochlorite. The retreated seeds were then germinated in half MS media in a growth chamber. The uniform seedlings were transferred to a hydroponic culture and grew for five days before being exposed to a treatment of 75 μM Cd. At different time points (0, 2, 4, 8, 12, and 24 hours) after the Cd treatment, samples were collected, and the plant tissues were rapidly ground in liquid nitrogen to extract total RNA for further analysis. For the generation of transformed Chinese cabbage plants, the floral dip method and vernalization infiltration technique were employed [
44].
2.2. Gene clone and plasmid construction
To construct the overexpression vectors for yeast (Saccharomyces cerevisiae), the coding sequences of Chinese cabbage gene BrMYB116 and ScFIT3 were cloned into vector pRS416-GFP, and the gene NSR1 and VLD1 were cloned and into the vector pRS423 in fusion with the RFP sequence. The coding sequence of BrMYB116 was amplified from the cDNA of Chinese cabbage (Cv. Guangdongzao), while the coding sequence of ScFIT3, and NSR1 and VLD1 were amplified from the cDNA of yeast (JRY472) with specific primers. Subsequently, the amplified sequences were inserted into pRS416-GFP and pRS423 in fusion with the RFP sequence using the infusion cloning kit (Catalog no. 011614; Clontech). For expression constructs BrMYB116 and ScFIT3, DNA was PCR amplified from Chinese cabbage (Cv. Guangdongzao) and yeast (JRY472) genomic DNA with specific primers. And then, the amplified sequences were inserted into the XbaΙ site of binary vector pCambia3300 to yield pBrMYB116::BrMYB116 and pScFIT3::ZmO2L1 using the infusion cloning kit (Catalog no. 011614; Clontech). The sequence insertions were confirmed through SANGER sequencing. All primers are listed in Supplementary Table S1.
2.3. Total RNA extraction, RT-qPCR and quantitative real-time PCR analysis
The total RNA was extracted from Chinese cabbage tissues using TRIzol, while yeast RNA was extracted using a M5 EASYspin yeast RNA rapid extraction kit and MF158-01 (Mei5 Biotechnology, Co., Ltd). For yeast RNA extraction, the cells were grown to OD600~ 0.3 at 30°C, and then treated with 75 μM Cd for 12 h before the total RNA was harvested. The double-stand cDNA was synthesized using a PrimeScript and RT reagent kit with gDNA Eraser (TAKARA). A SYBR Premix Ex-Taq Kit (TAKARA) was used for quantitative real time PCR. All experiments were performed with three independent biological replications. The transcript levels were calculated using the 2∆∆-CT method. The primers used for RT-qPCR are presented in Supplementary Table S1.
2.4. Tolerance assay and growth curve
The yeast cells transformed with BrMYB116 and ScFIT3 expressing pRS416-GFP vectors, along with those transformed with empty pRS416-GFP (WT) vector, were cultured overnight in SC (URA-) fluid medium at 30°C. The cell solutions were then diluted to reach an OD600 of approximately 0.1, and allowed to grow to OD600~0.3. After precisely adjusting the OD600 to 0.3, the cell solutions were five-fold diluted and spotted onto plates without or with 75 μM Cd. The cells were incubated at 30°C for two days. The experiments were repeated three times. The growth curve of BrMYB116 and WT was conducted after being grown in liquid SC (URA-) medium at 30°C. The solutions were diluted to an OD600 of approximately 0.1, and then further incubated to reach an OD600 of approximately 0.3. After precisely adjusting the OD600 to 0.3, the solution was treated with 75 μM Cd for 12 h. Subsequently, the OD600 was measured every 2 hours to monitor the growth pattern.
2.5. Protein subcellular localization assay
The yeast cells co-transformed with pRS416-GFP vectors expressing or BrMYB116 ScFIT3 and pRS423 vector expressing NSR1 and VLD1 in fusion with RFP were cultured overnight in SC (URA- and HIS-) fluid medium at 30°C. The yeast cells transformed with an empty pRS416-GFP vector were also cultured overnight in SC (URA-) fluid medium at 30°C. Then, the solutions were diluted to an OD600 of approximately 0.1 and allowed to grow until reaching an OD600 of approximately 0.3. After adjusting the OD600 to 0.3 exactly, the solutions were treated without or with 75 μM Cd. After incubating for about 12 h at 30°C, the yeast cells were observed under a Zeiss 300 confocal microscope.
2.6. RNA-Seq library construction and sequencing
The transgenic yeast cells expressing BrMYB116 were treated with 75 μM Cd for 14 h, and then the cells were harvested and stored at -80°C before being sent to Noveogen for RNA-seq analysis. Total RNA isolation, library construction, sequencing, and basic data analysis were carried out by Novogene. Three independent biological replicates were performed. Briefly, the RNA integrity was evaluated using the RNA Nano 6000 Assay Kit of the Bioanalyzer 2100 system (Agilent Technologies, CA, USA). Total RNA was used as input material for RNA sample preparation. The mRNA was purified from total RNA using poly-T oligo-attached magnetic beads. Fragmentation was conducted using divalent cations under elevated temperatures in First Strand Synthesis Reaction Buffer. The first strand cDNA was synthesized using a random hexamer primer and M-MuLV Reverse Transcriptase (RNase H-). Second strand cDNA synthesis was subsequently carried out using DNA Polymerase I and RNase H. Remaining overhangs were transferred into blunt ends via exonuclease/polymerase activities. After adenylation of the 3’ ends of the DNA fragments, adaptors with hairpin loop structures were ligated to prepare for hybridization. To select cDNA fragments within the preferred length range of 370~420 bp, the library fragments were purified with an AMPure XP system (Beckman Coulter, Beverly, USA). Subsequently, PCR was carried out with Phusion High-Fidelity DNA polymerase, Universal PCR primers and Index (X) Primer. The resulting PCR products were purified using the AMPure XP system, and the library quality was evaluated on an Agilent Bioanalyzer 2100 system. The clustering of the index-coded samples was carried out on a cBot Cluster Generation System using a TruSeq PE Cluster Kit v3-cBot-HS (Illumia). After cluster generation, the library was sequenced on an Illumina Novaseq platform and 150 bp paired-end reads were generated.
2.7. Promoter activity assay
Nicotiana benthamiana seedlings were grown in a controlled environment at 22°C, with a 16-h-light/8-h-dark photoperiod. The infiltration process was conducted on 4-week-old plants. Single clones of GV3101, each carrying different vectors, were inoculated to YEP medium containing rifampicin and kanamycin and then grown for more than 20 h at 28°C. Next, approximately one microliter Agrobacterium was inoculated to 20 mL fresh YEP medium containing 10 mM MES (pH 5.6), and 20 mM acetosyringone and grown for about 4 h at 28°C. The cells were collected and resuspended in the infiltration medium (10 mM MgSO4, 200 mM acetosyringone, and 10 mM MES) to reach an OD600 of 1. The cells were incubated at room temperature for 2 h. The infiltration medium contains three A. tumefaciens strains: 1 mL of transcription activator strain (p35S::BrMYB116 or empty vector), 100 mL promoter strain (ScFIT3 promoter-fluc), and 5 mL reference strain (35S-rLUC). Infiltration was carried out with N. benthamiana leaves using a syringe. After infiltration, tobaccos were kept in a dark chamber with high humidity overnight and then transferred back to a normal growth room for 2 d. The luciferase values were measured using a Dual-Luciferase Reporter Assay System (catalog no. E1910; Promega).
2.8. Chromatin Immunoprecipitation
One hundred microliters of cells (OD600~1.0) were subjected to cross-linking by 1% formaldehyde for 20 min at 30˚C, which was stopped by adding 125 mM glycine and incubating for 5 min. Cell pellet was collected, washed twice with PBS (137 mM sodium chloride, 2.7 mM potassium chloride, and 11.9 mM phosphate buffer, pH 7.4), and then frozen immediately in liquid nitrogen. The cell pellets were resuspended in sorbitol buffer (1.2 M sorbitol in PBS buffer) containing 1.5 mg lyticase (Cat# L4025, Sigma) and incubated at 30˚C for 30 min. Then, the pellets were washed twice with PBS buffer and resuspended in 0.2 ml lysis buffer (50 mM HEPES-KOH pH 7.5, 140 mM NaCl, 1 mM EDTA, 1%Triton X-100, 0.1% sodium deoxycholate, 1 mM PMSF) containing 1% SDS. The lysates were sonicated using a M220 sonicator (Covaris) to yield chromatin fragments with an average size of 500 bp. To reduce the SDS concentration to 0.1%, the lysis buffer was added to the solution to achieve a final volume of 2 ml. The samples were centrifuged at 4˚C. One hundred microliter of the soluble chromatin was saved as the input, while the rest was immunoprecipitated with specific antibodies [2 µg monoclonal anti-GFP antibody (Cat# ab16918, Abcam) overnight at 4˚C, and then 25 µl mixture (1:1) of Dynabeads® Protein A (Cat# 10002D, Life Technologies AS) and protein G (Cat#10004D, Life Technologies AS) was added and incubated at 4˚C for over 6 h. The beads were washed twice in low salt buffer (50 mM HEPES-KOH pH 7.5, 140 mM NaCl, 1 mM EDTA, 1%Triton X-100, 0.1% sodium deoxycholate, 0.1% SDS), twice in high salt buffer (50 mM HEPES-KOH pH 7.5, 500 mM NaCl, 1 mM EDTA, 1%Triton X-100, 0.1% sodium deoxycholate, 0.1% SDS), twice in the washing buffer (10 mM Tris pH 8.0, 0.25 M LiCl, 0.5% NP-40, 0.5% sodium deoxycholate, 1 mM EDTA and 1 mM PMSF) and twice in TE (10 mM Tris pH 8.0, 1 mM EDTA). DNA was eluted by incubating the beads overnight at 65˚C with 0.3 ml elution buffer (50 mM Tris pH 7.5, 10 mM EDTA pH 8.0, 1% SDS), and cross-linking was reversed. The proteins were digested by incubation for 2 h at 50˚C with 0.3 mg/ml proteinase K (Cat# P6556, Sigma). Then, 1 µg RNase A (Cat# A1101A, TaKaRa) was added, and the samples were incubated for 2 h at 37˚C. The ChIPed DNA was purified by phenol/chloroform extraction and precipitated with ethanol/NaOAC overnight at -20˚C. DNA was resuspended in 0.2 ml ddH2O. Actin 1 of Saccharomyces cerevisiae was used as the international control. Recovered DNA fragments were quantified by qPCR with a SYBR® Premix Ex TaqTM Mix (Cat# DRR820A, TaKaRa). The CP (crossing point) values of the immunoprecipitated DNA fractions with GFP or no antibody control (NoAb) were normalized to the CP value of the input DNA fractions for the same qPCR assay. The ChIP signals were calculated as the relative enrichment in signals relative to the NoAb control. All experiments were repeated three times. All primers are listed in Supplemental Table S1.
2.9. Cd accumulation measurement
For the measurement of the Cd concentration in the seedlings, the Chinese cabbage seedlings grown on half-strength MS solid media with Cd treatment were collected and washed as previously described [
45] with minor modifications. Three biological replicates of each Cd-treated group were collected.
2.10. Statistical analysis
All experiments were conducted in triplicates. Data were analyzed using variance (ANOVA) analysis with Duncan’s multiple range test (DMRT). Standard errors were calculated for all mean values, and differences were considered significant at the P ≤ 0.05 level.
2.11. Accession numbers
Sequence data for the RNA-seq samples can be found in the NCBI’s Sequence Read Archive (SRA) database under the following accession number SUB12330385.
Figure 1.
Cd tolerance tests in yeast. A. Yeast dilution bioassay with the wild-type strain and the wild-type strain transformed with a ScMPC1 expressing pRS416 vector in SD medium. Triangles represent serial 10-fold dilutions (starting concentration of 0.3 OD600). B. The wild-type yeast strain and transgenic cells were grown at 30˚C in SD liquid media and exposed to 75 µM CdCl2 at the concentration of 0.3 OD600. Cell density was monitored with the absorbance at 600 nm at 12, 14, 16, 18, 20, and 22 h after the Cd treatment. Error Bars indicate ±SD from three independent experiments.
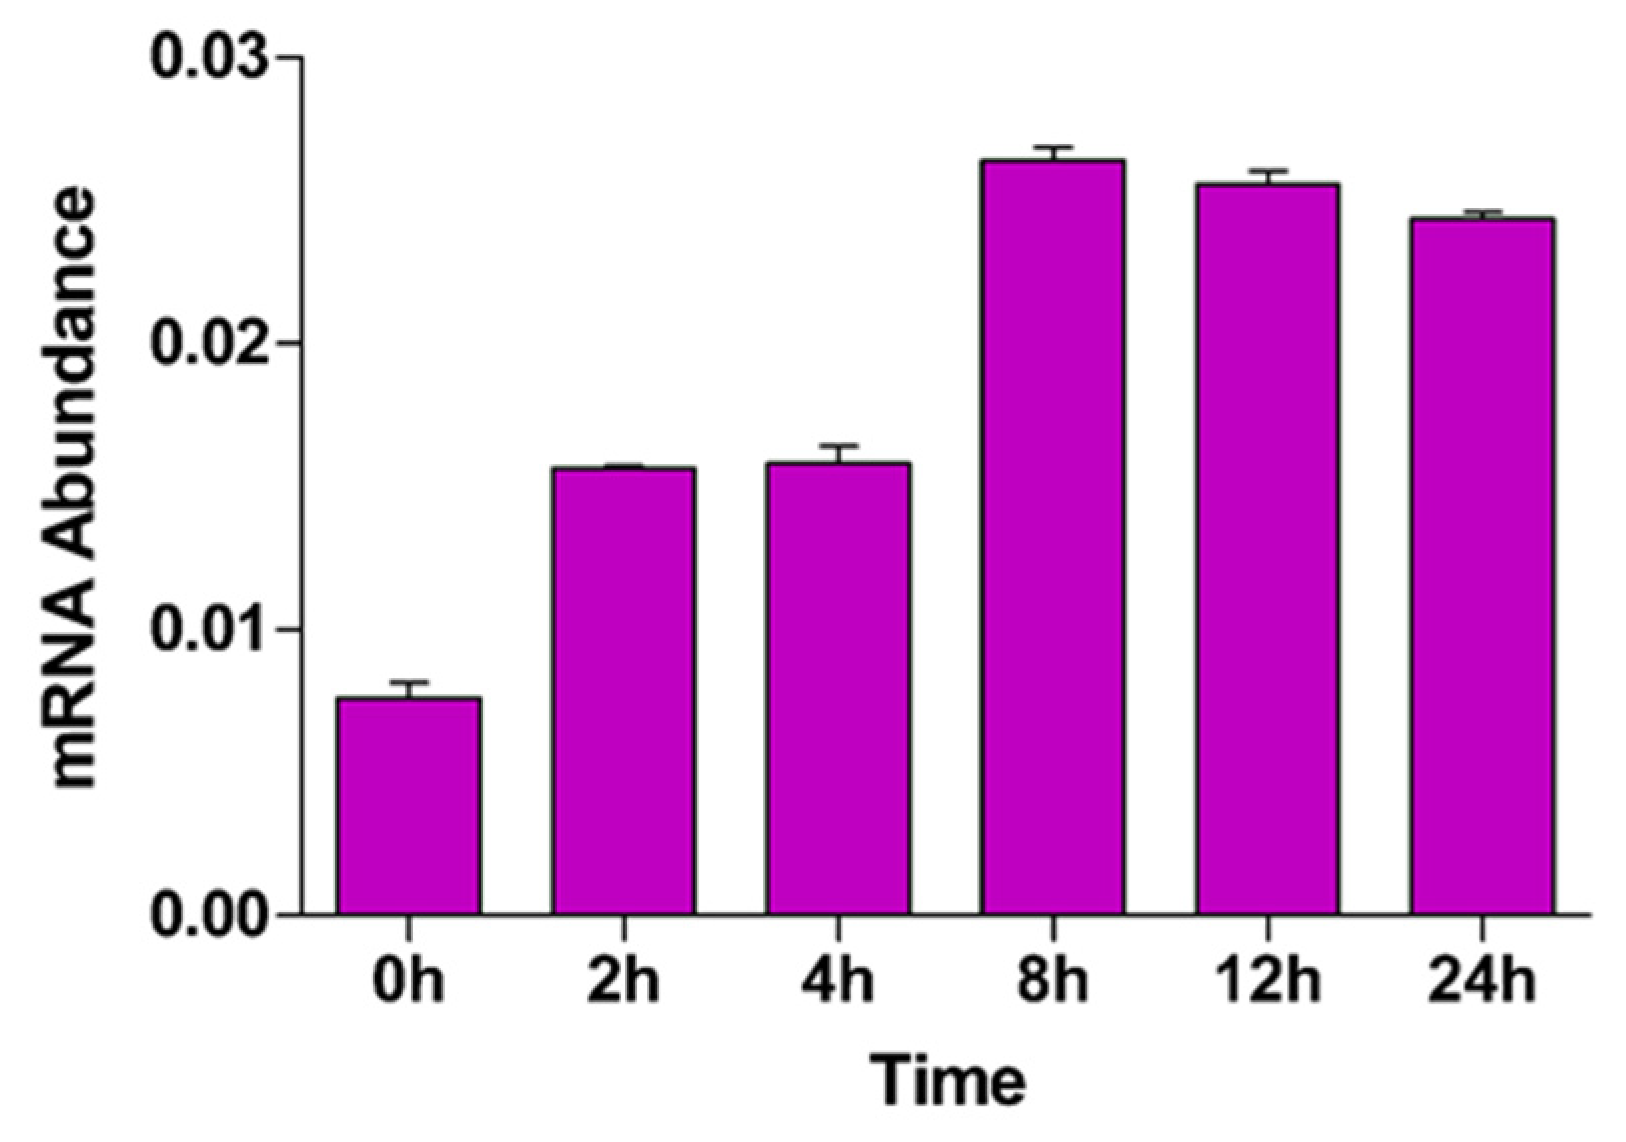
Figure 2.
BrMYB116 transcript abundance in Chinese cabbage without or with 75 µM CdCl2. BrMYB116 transcript abundance in Chinese cabbage seedlings (relative to BrACT2 control) was determined by RT-qPCR. Six-day-old seedlings were exposed to 75 µM CdCl2. Error bars indicate ±SD from three independent experiments.
Figure 3.
Subcellular localization of BrMYB116 and empty vector tagged with GFP and expressed in yeast cells without or with 75 µM CdCl2. The nuclear localized gene NSR1 (YGR159C) was used as positive control. The images were obtained from the RFP channel, GFP channel, DIC channel, or a merged image of the two channels. Scale bar: 10 μm.
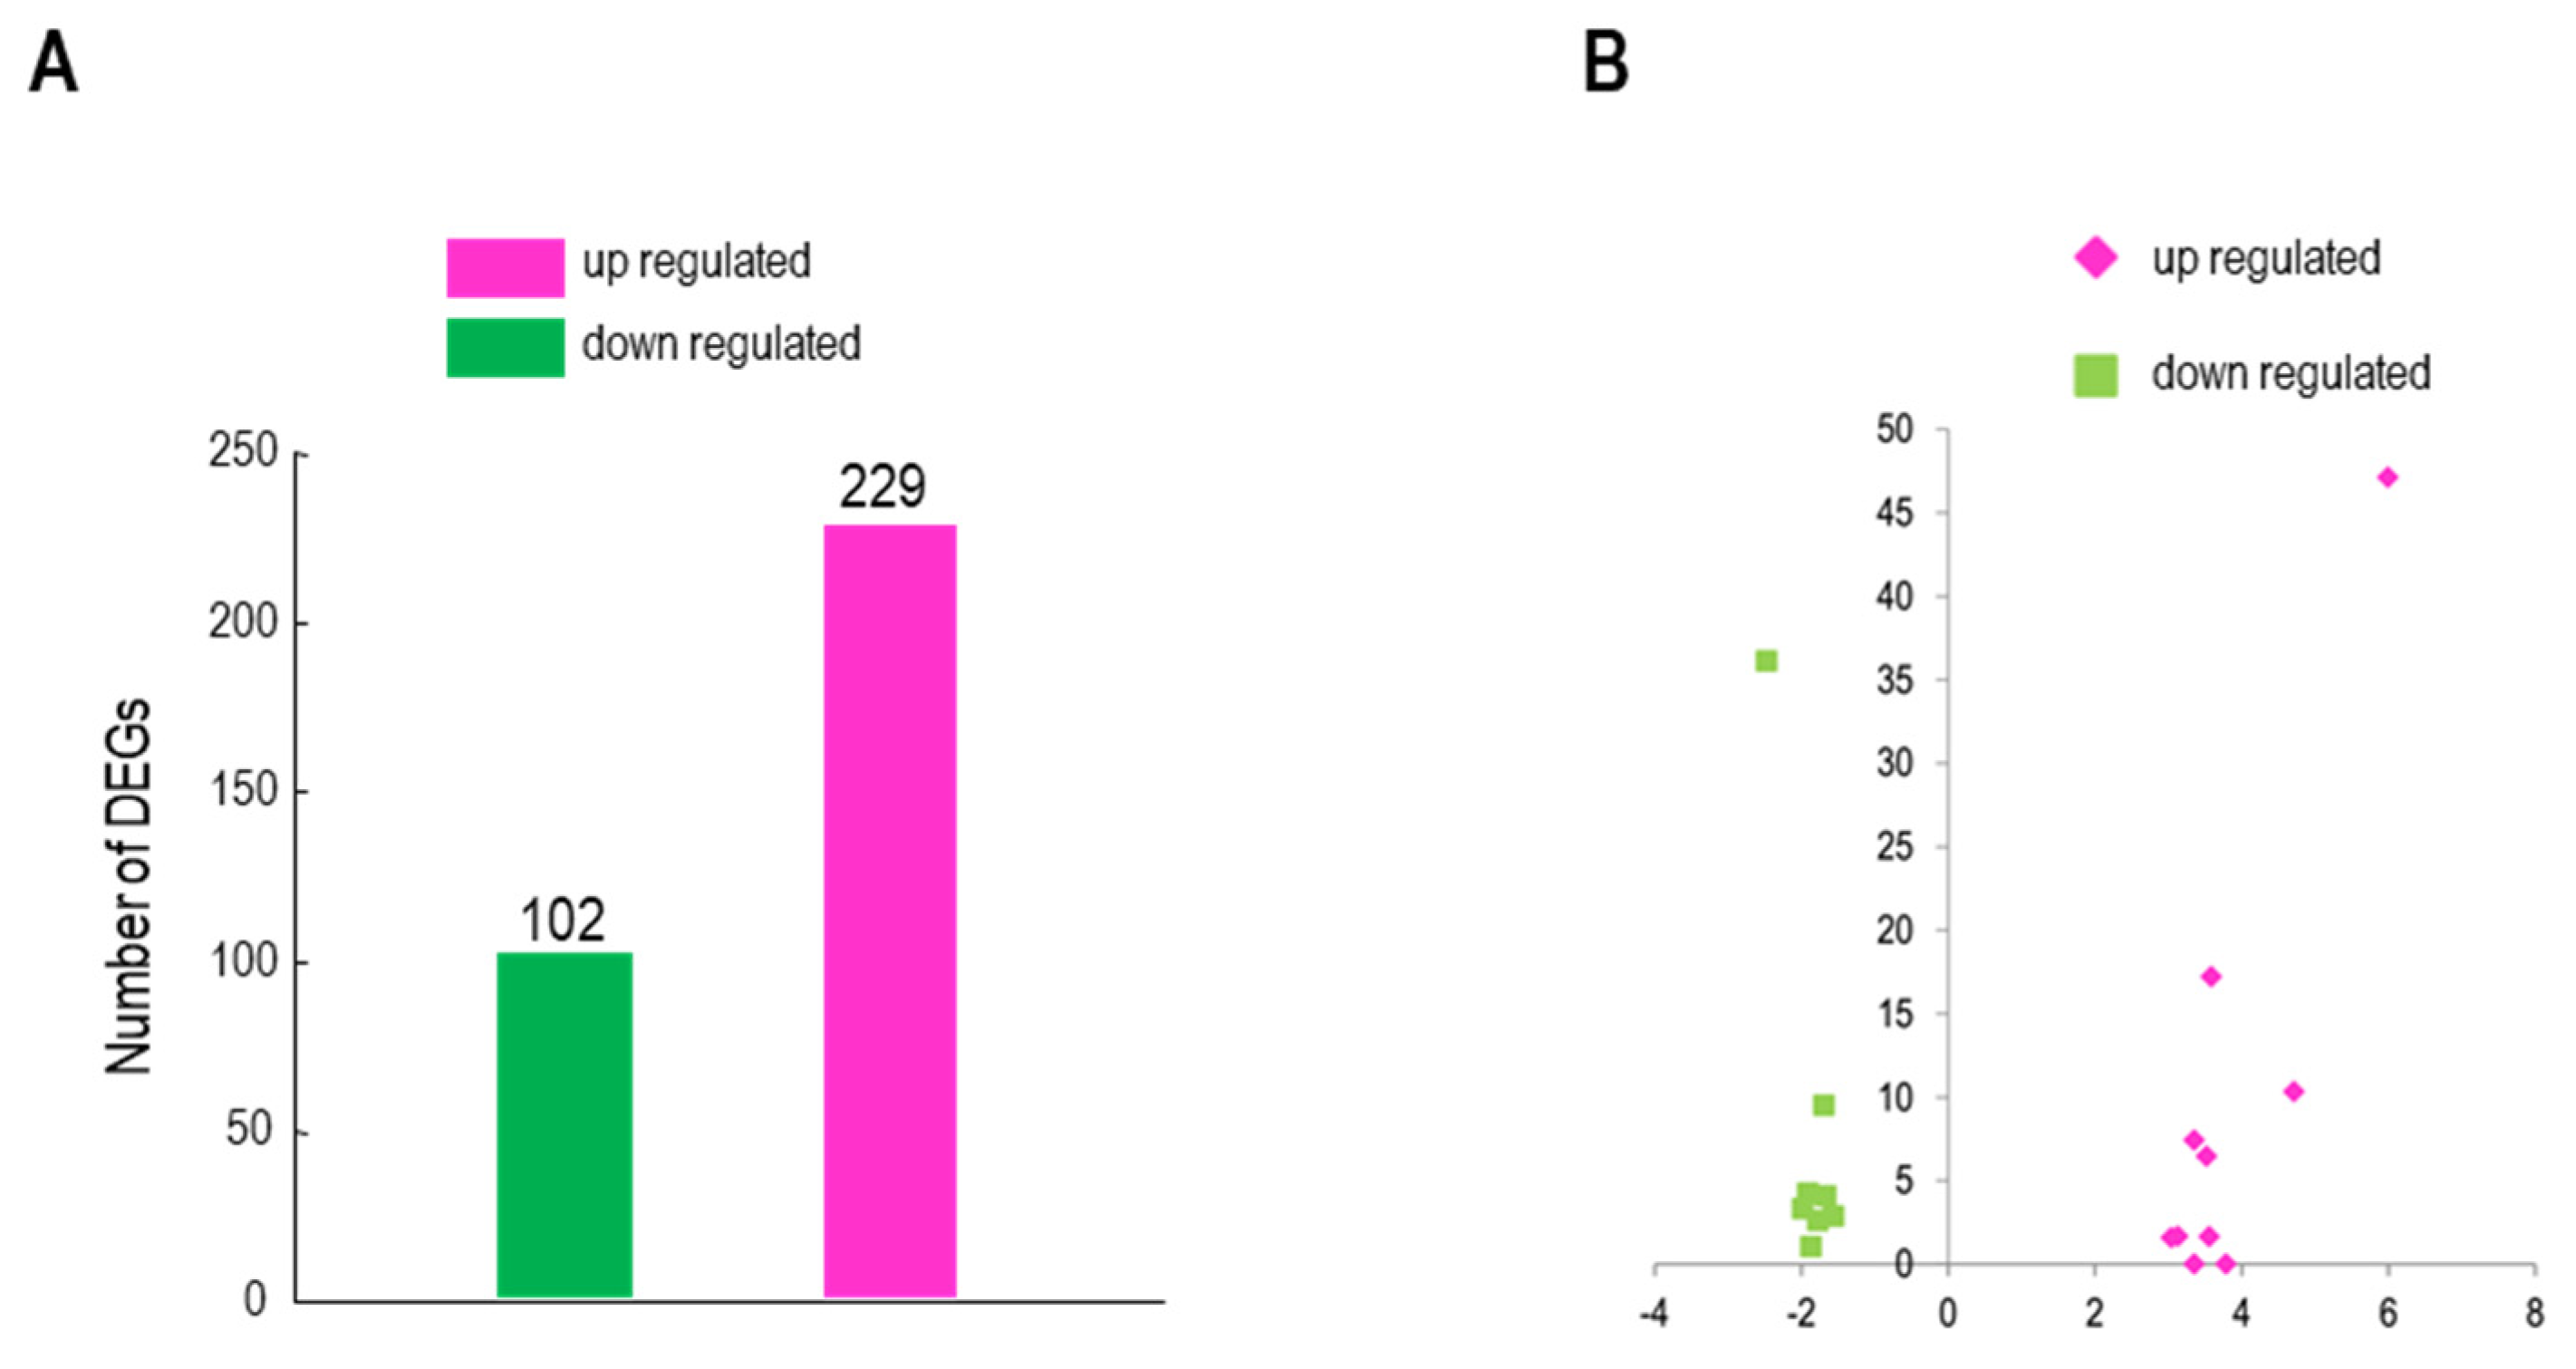
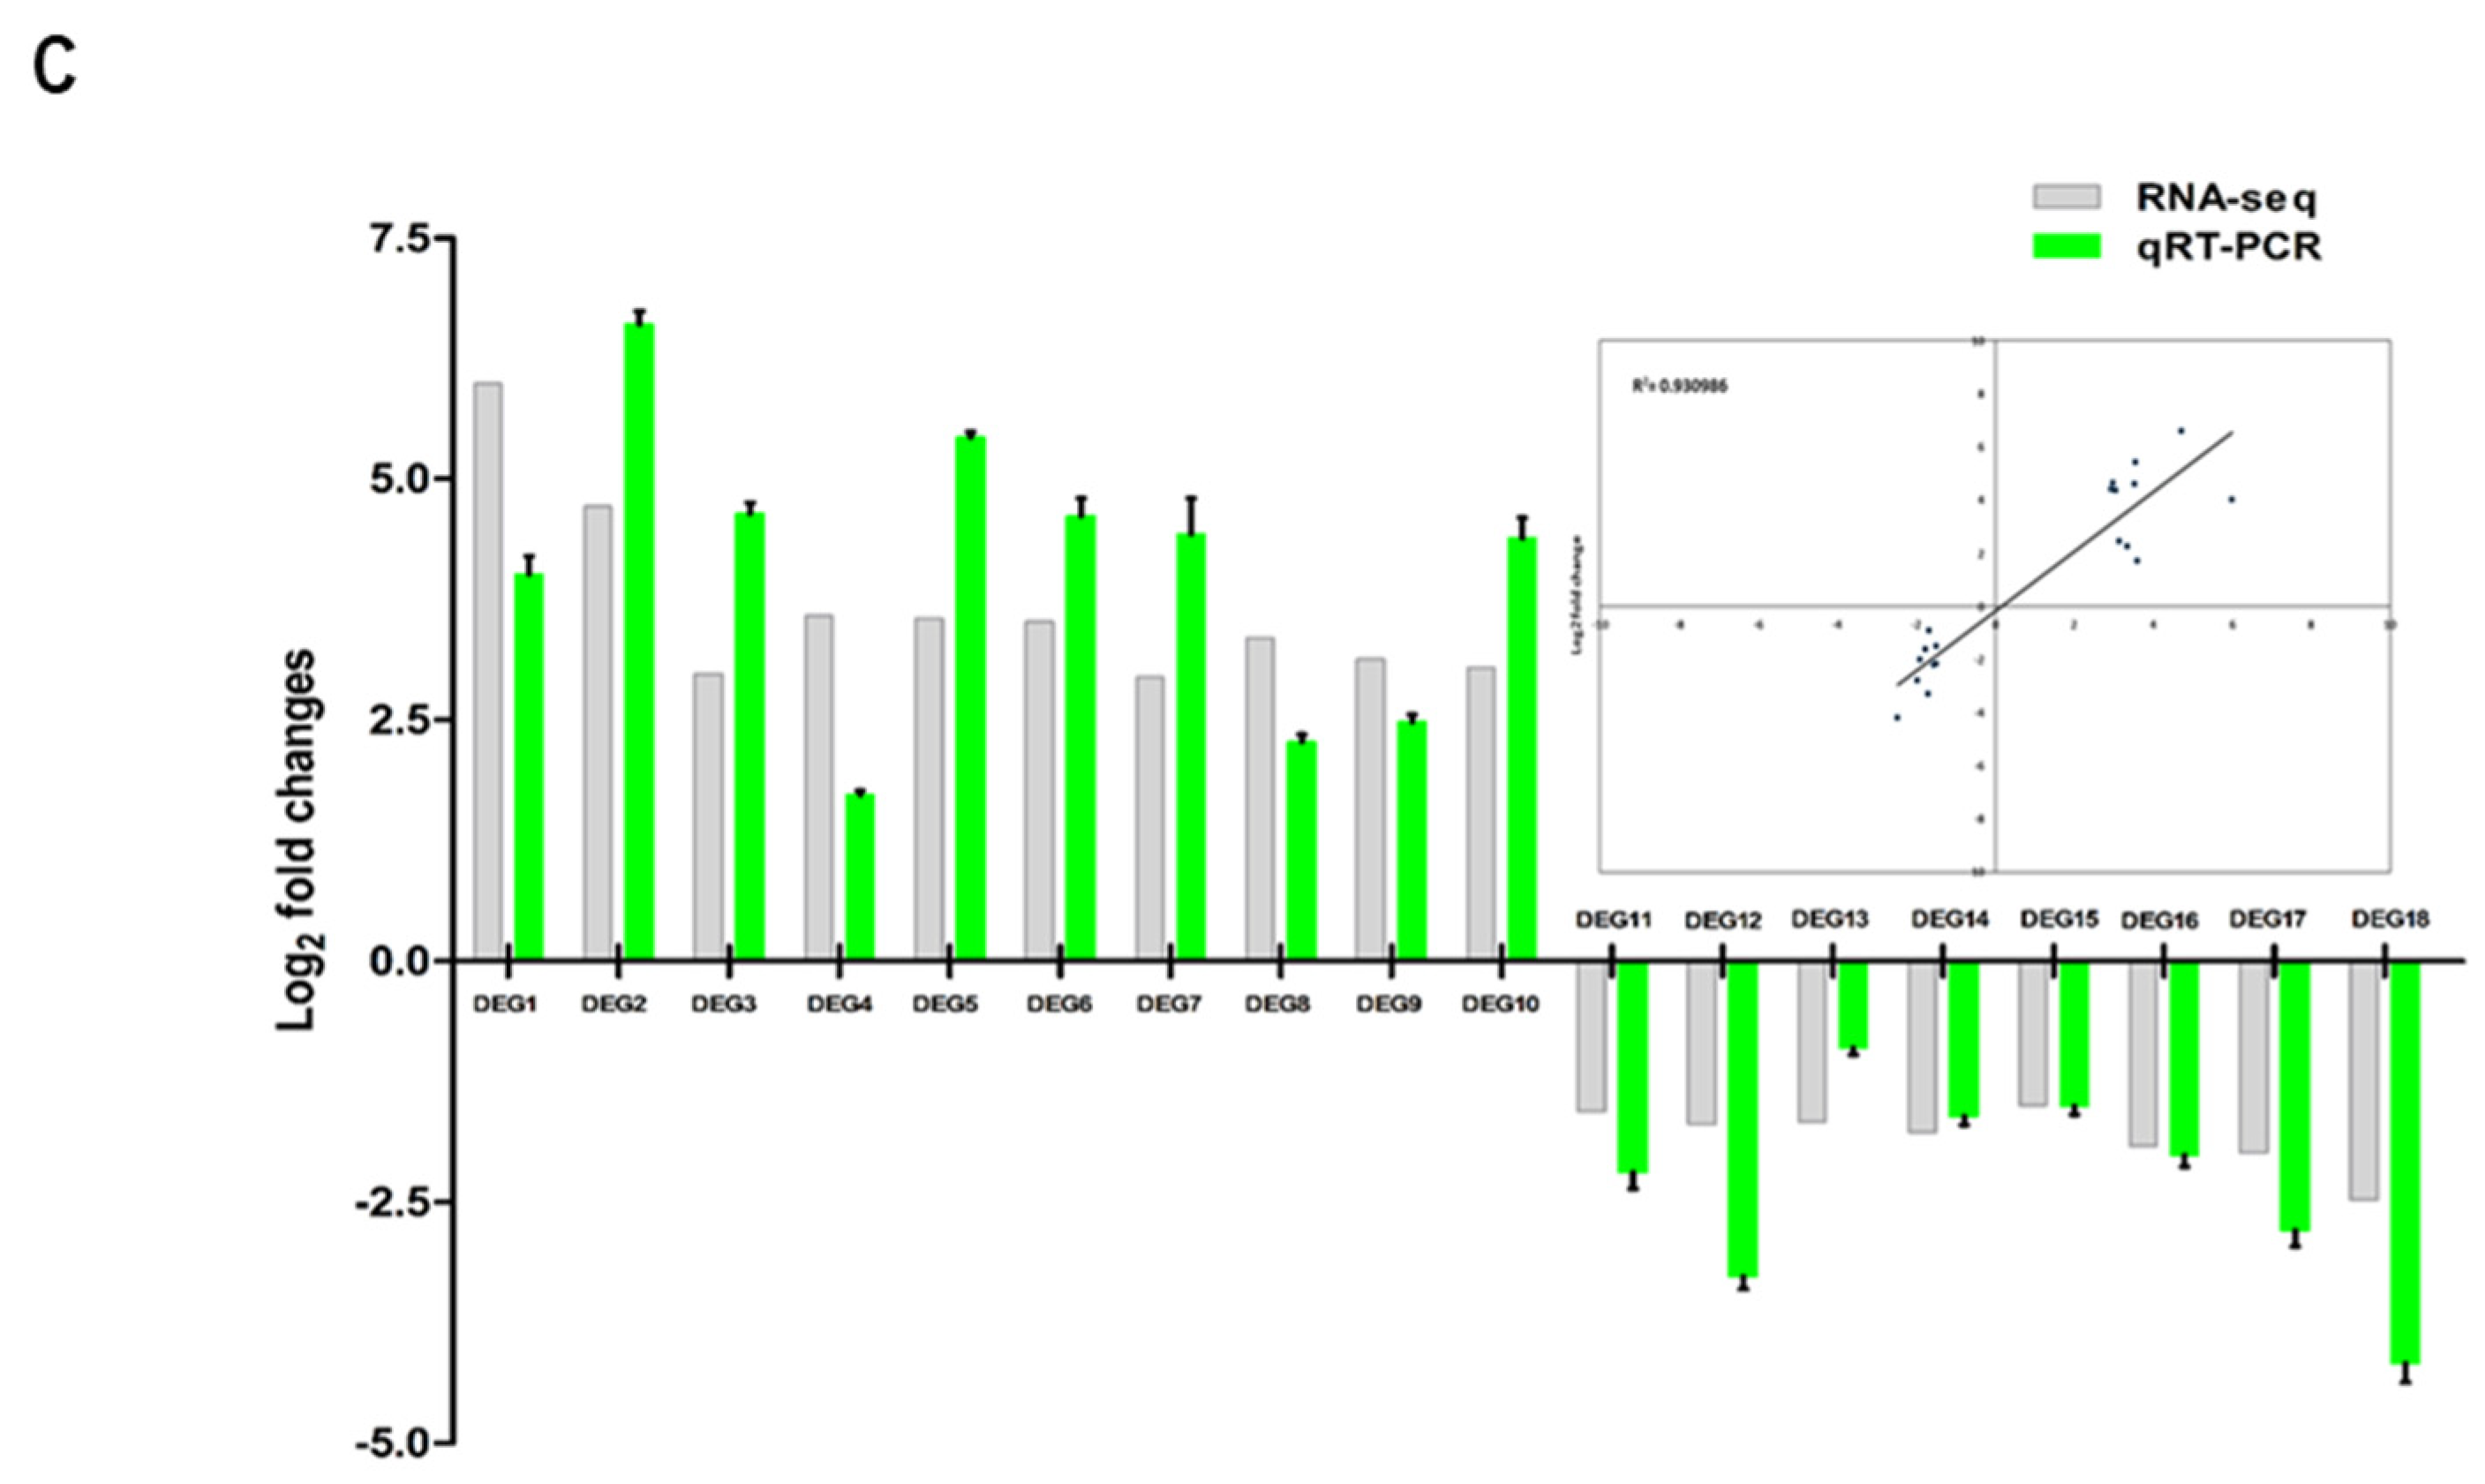
Figure 4.
RNA-seq analysis. A. Numbers of DEGs in transgenic cells expressing BrMYB116 VS WT group. B. Volcano plot of the selected DEGs (log2 values >3 or < -1.5) from (A). X axis represents fold change shown as log2 values; Y axis represents adjust P value shown as -log10. Magenta represents increased expression; green represents decreased expression compared to WT. C. qPCR identification of the selected DEGs (relative to ACT2) in the same batch Cd-treated yeast cells of RNA-seq. Error bars indicate ±SD from three independent experiments.
Figure 5.
Cd tolerance phenotype and accumulation. A. Dilution bioassay for the wild-type yeast strain and the wild-type strain overexpressing ScFIT3 in SC medium. Triangles represent serial 10-fold dilutions (starting concentration of 0.3 OD600). Representative test from three reproducible experiments was shown. B. Cd concentration in yeast cells. Yeast strains grown on SC solid plates without or with 75 µM CdCl2 at 30℃ for 2 d. Cells were collected in liquid SC with 75 µM Cd and the OD600 was recorded before atomic absorption spectrometer measuring. Error bars indicate ±SD of three independent experiments. P value of student’s t test: BrMYB116 compared with empty vector. *P<0.05; **P<0.01; ***P<0.001. . P value of student’s t test: BrMYB116 compared with ScFIT3. aP<0.05.
Figure 6.
Subcellular localization of ScFIT3 and empty vector tagged with GFP and expressed in yeast cells without or with 75 µM CdCl2. The vacuole localized gene VLD1 (YIR014W) was used as positive control. The images were obtained from the RFP channel, GFP channel, DIC channel, or a merged image of the two channels. Scale bar: 10 μm.
Figure 7.
BrMYB116 associates the fragment of the ScFIT3 promoter under Cd stress. A. BrMYB116 activation of the ScFIT3 promoter (include 5’ UTR) determined by infiltration mediated transient expression assay. The X axis is the ratio of LUC to rLUC activity two days after infiltration. The numbers indicate the position of the starting nucleotide of each BOXS2 relative to the translation start. Error bars indicate ± SD of three biological repeats. P value of student’s t test: BrMYB116 compared with empty vector. *P<0.05; **P<0.01; ***P<0.001. B. BrMYB116 binds the promoter of ScFit3. ChIP-qPCR was performed to test the in vivo interaction of promoters (including 5’UTR) with BrMYB116 in cells from WT, and WT (BrMYB116-GFP) treated with 75 μM Cd. DNA fragments from different parts of the promoter were tested (labeled with F1 - F4). The CP (crossing point) value of immuno-precipitated DNA fractions with GFP or the no-antibody control (NoAb) normalized to the CP value of the input DNA fractions for the same qPCR assay. The Y axis is the ChIP signals calculated as the enrichment relative to the no-antibody control (NoAb). Error bars indicate ± SD from three independent experiments.
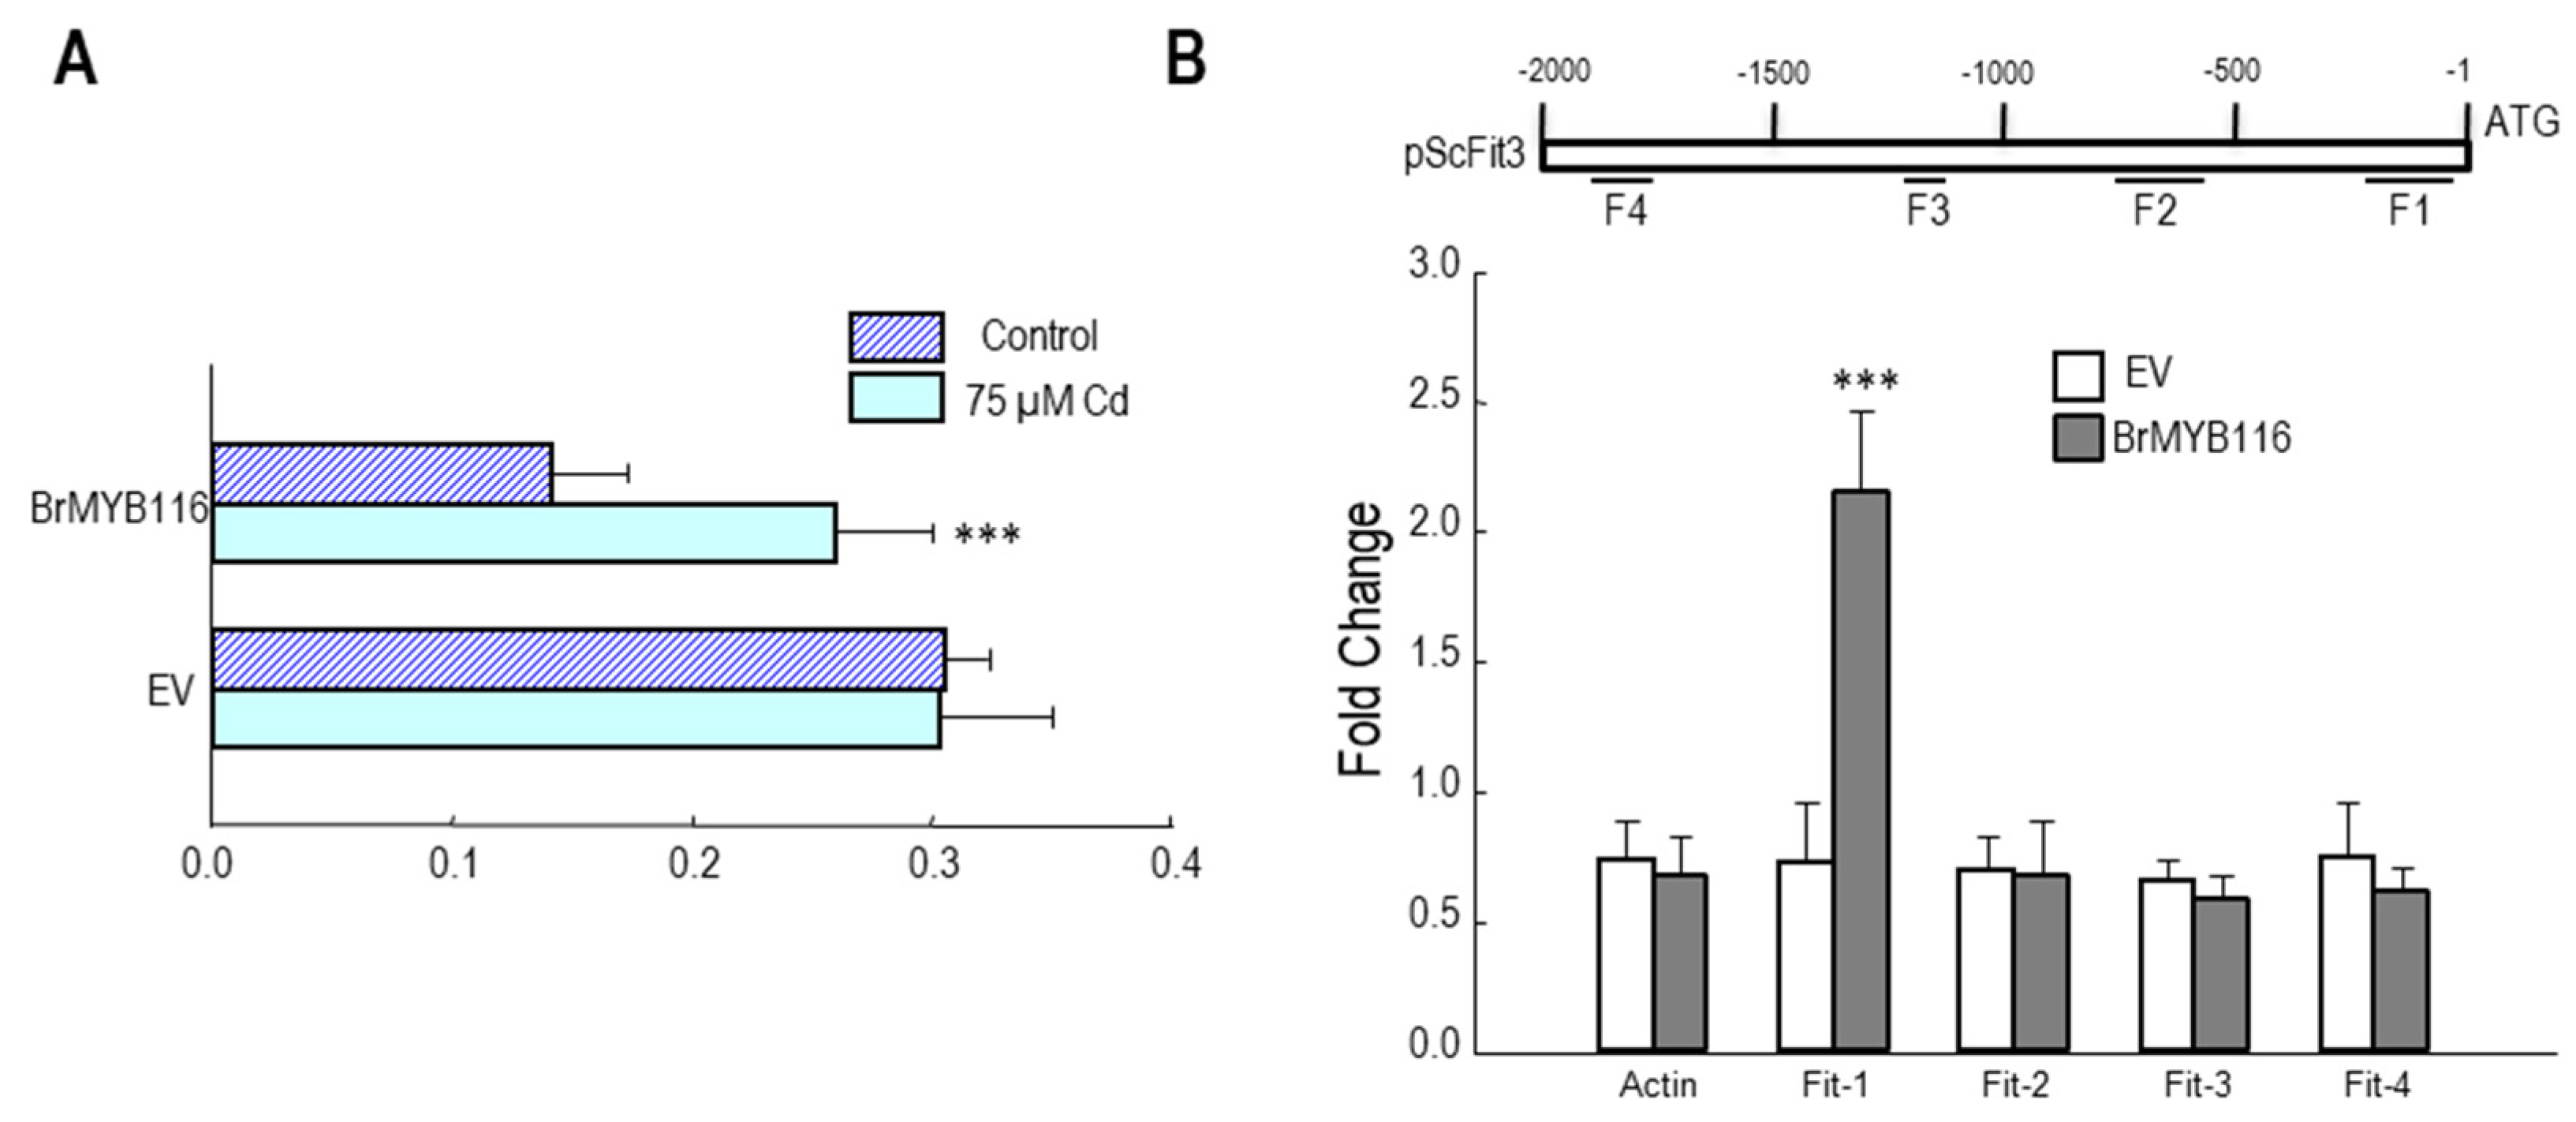
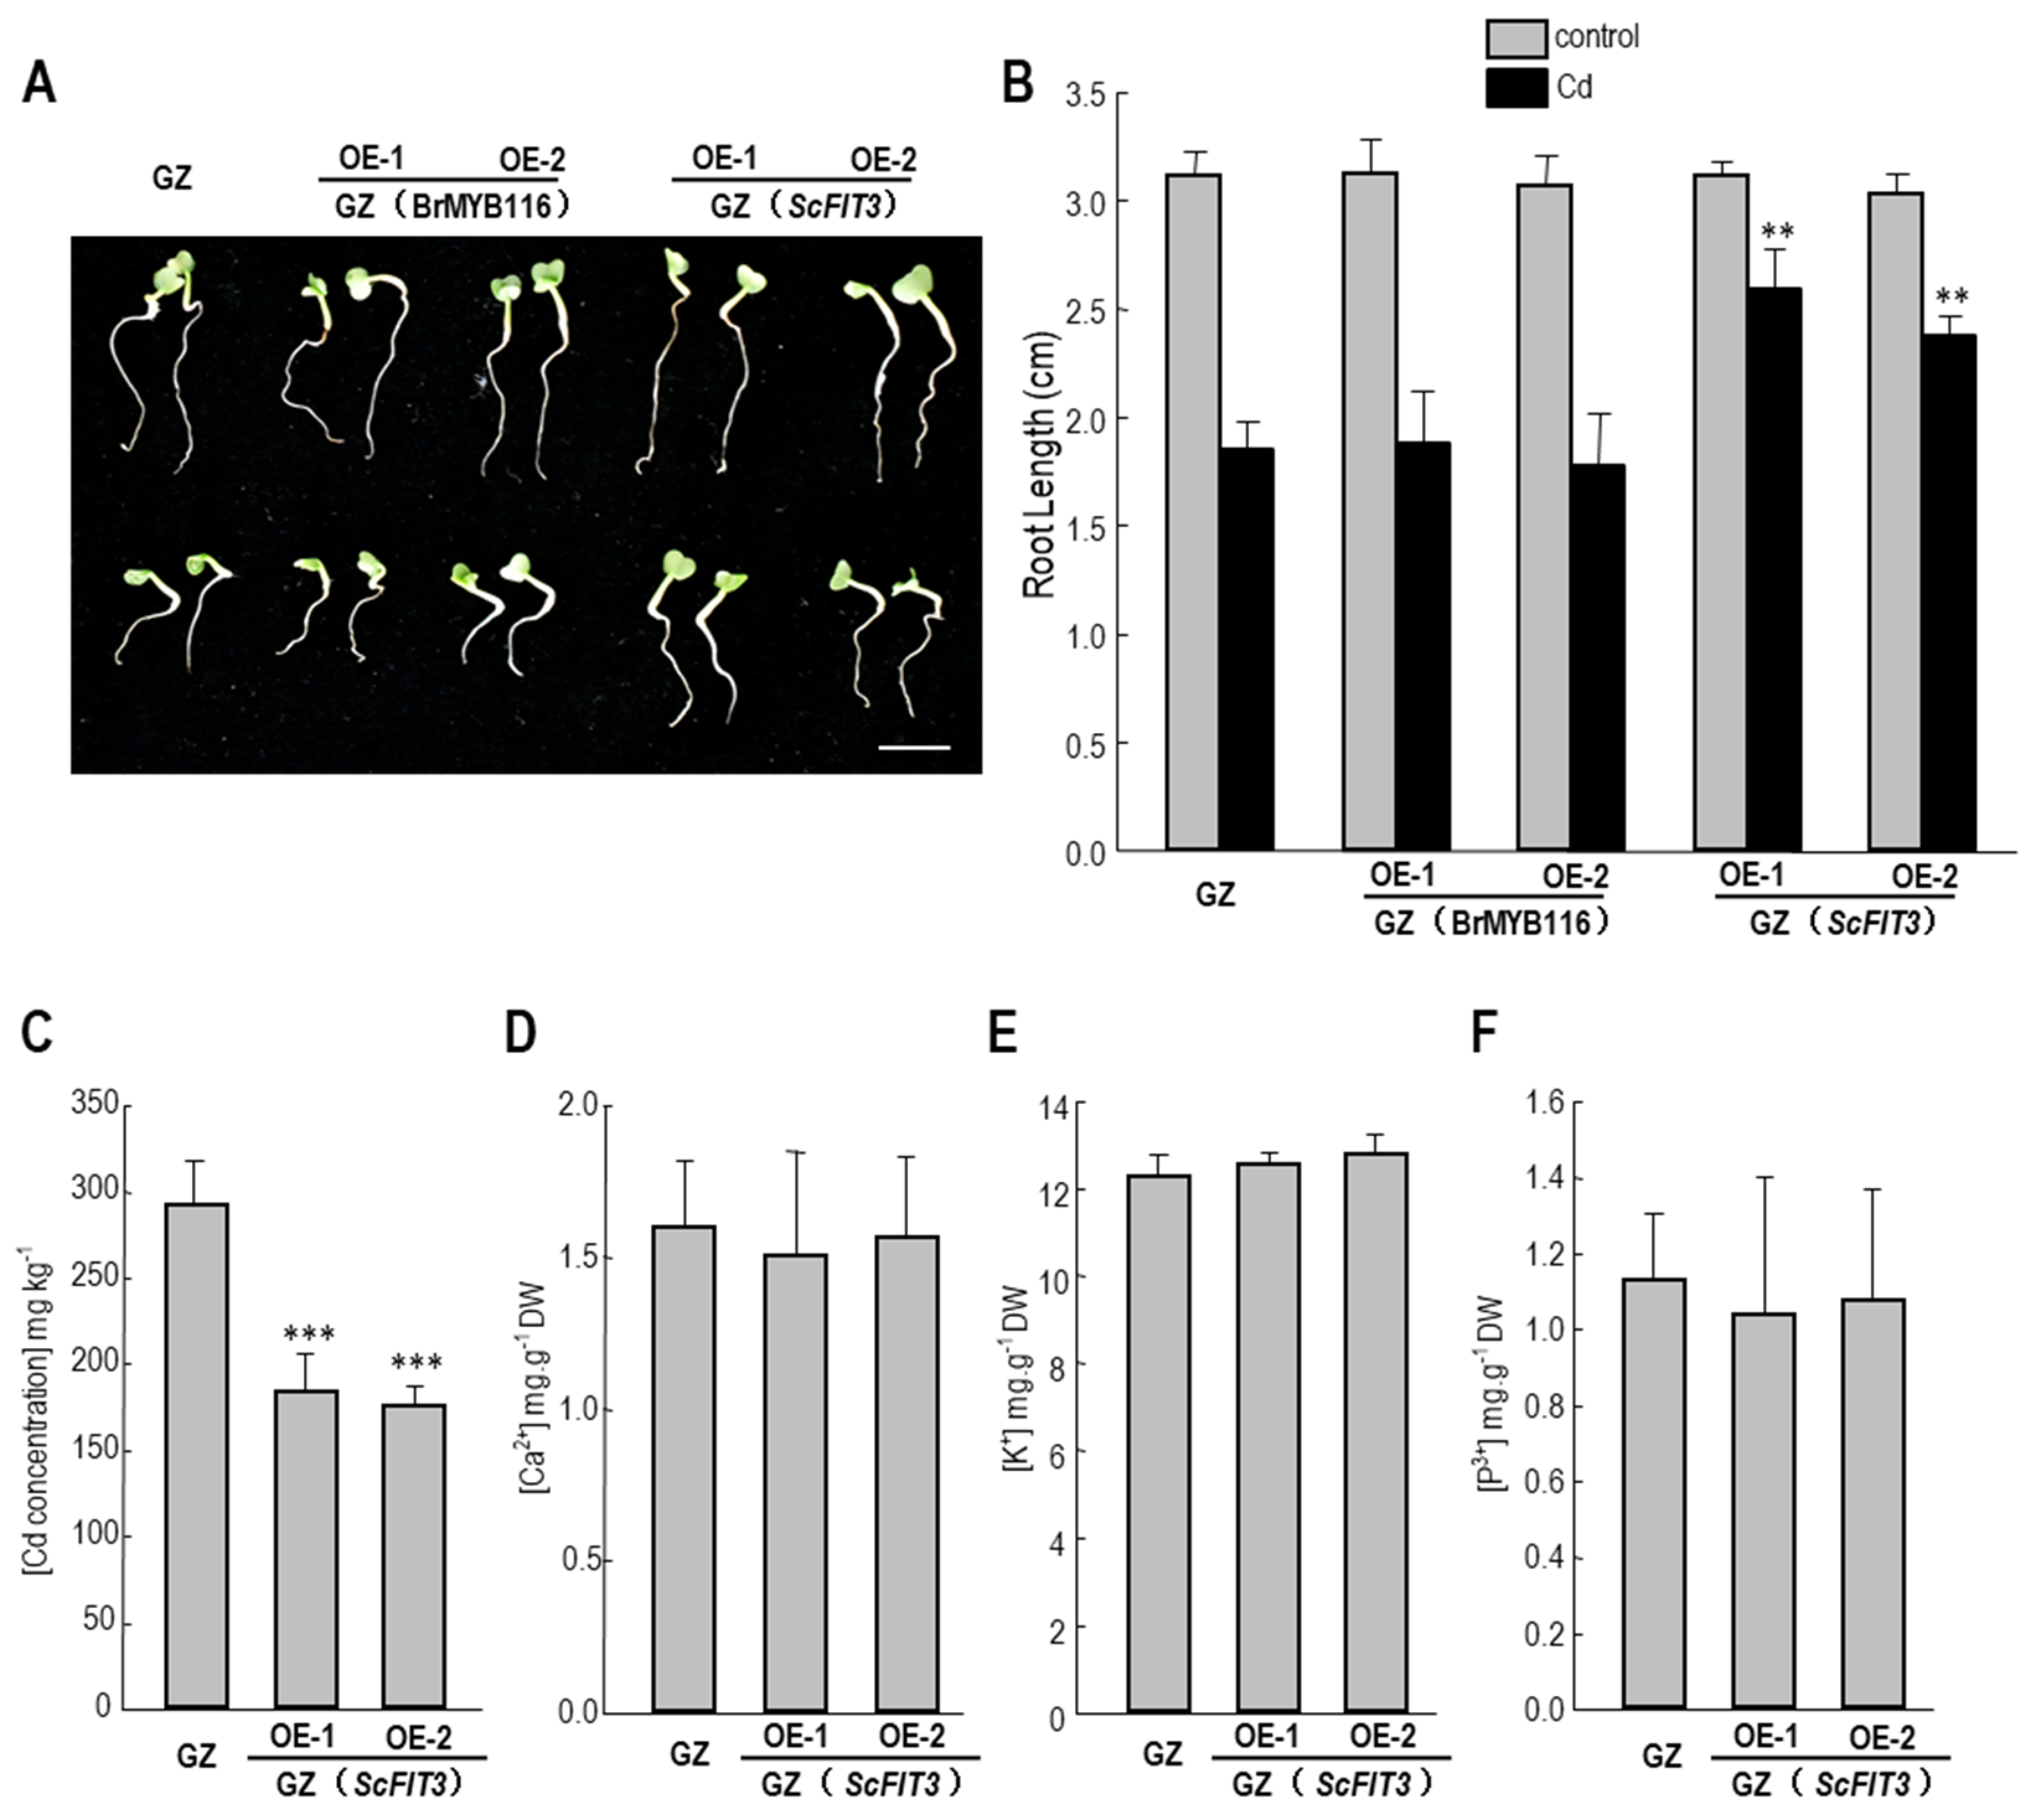
Figure 8.
Cd tolerance and content, and some nutrition ion contents in the Chinese cabbage. A. Chinese cabbage plants germinated for 2 d were transferred to hydroponic MS media without or with 50 µM CdCl2 for another 3 d. Representative results from three reproducible experiments are shown. OE-1 and OE-2 are two independent transgenic lines. B. Average root length of seedlings cultured under the same growth condition as shown in A. The root length of three seedlings of each class was measured as the mean value. The content of Cd (C), Ca2+ (D), K+ (E), p3+ (F) in the wild-type and ScFIT3 transgenic Chinese cabbage. Error bars indicate ± SD of three biological repeats. P value of student’s t test: BrMYB116 or ScFIT3 transgenic plants compared with the wild-type control. **P; ***P<0.001.
Figure 9.
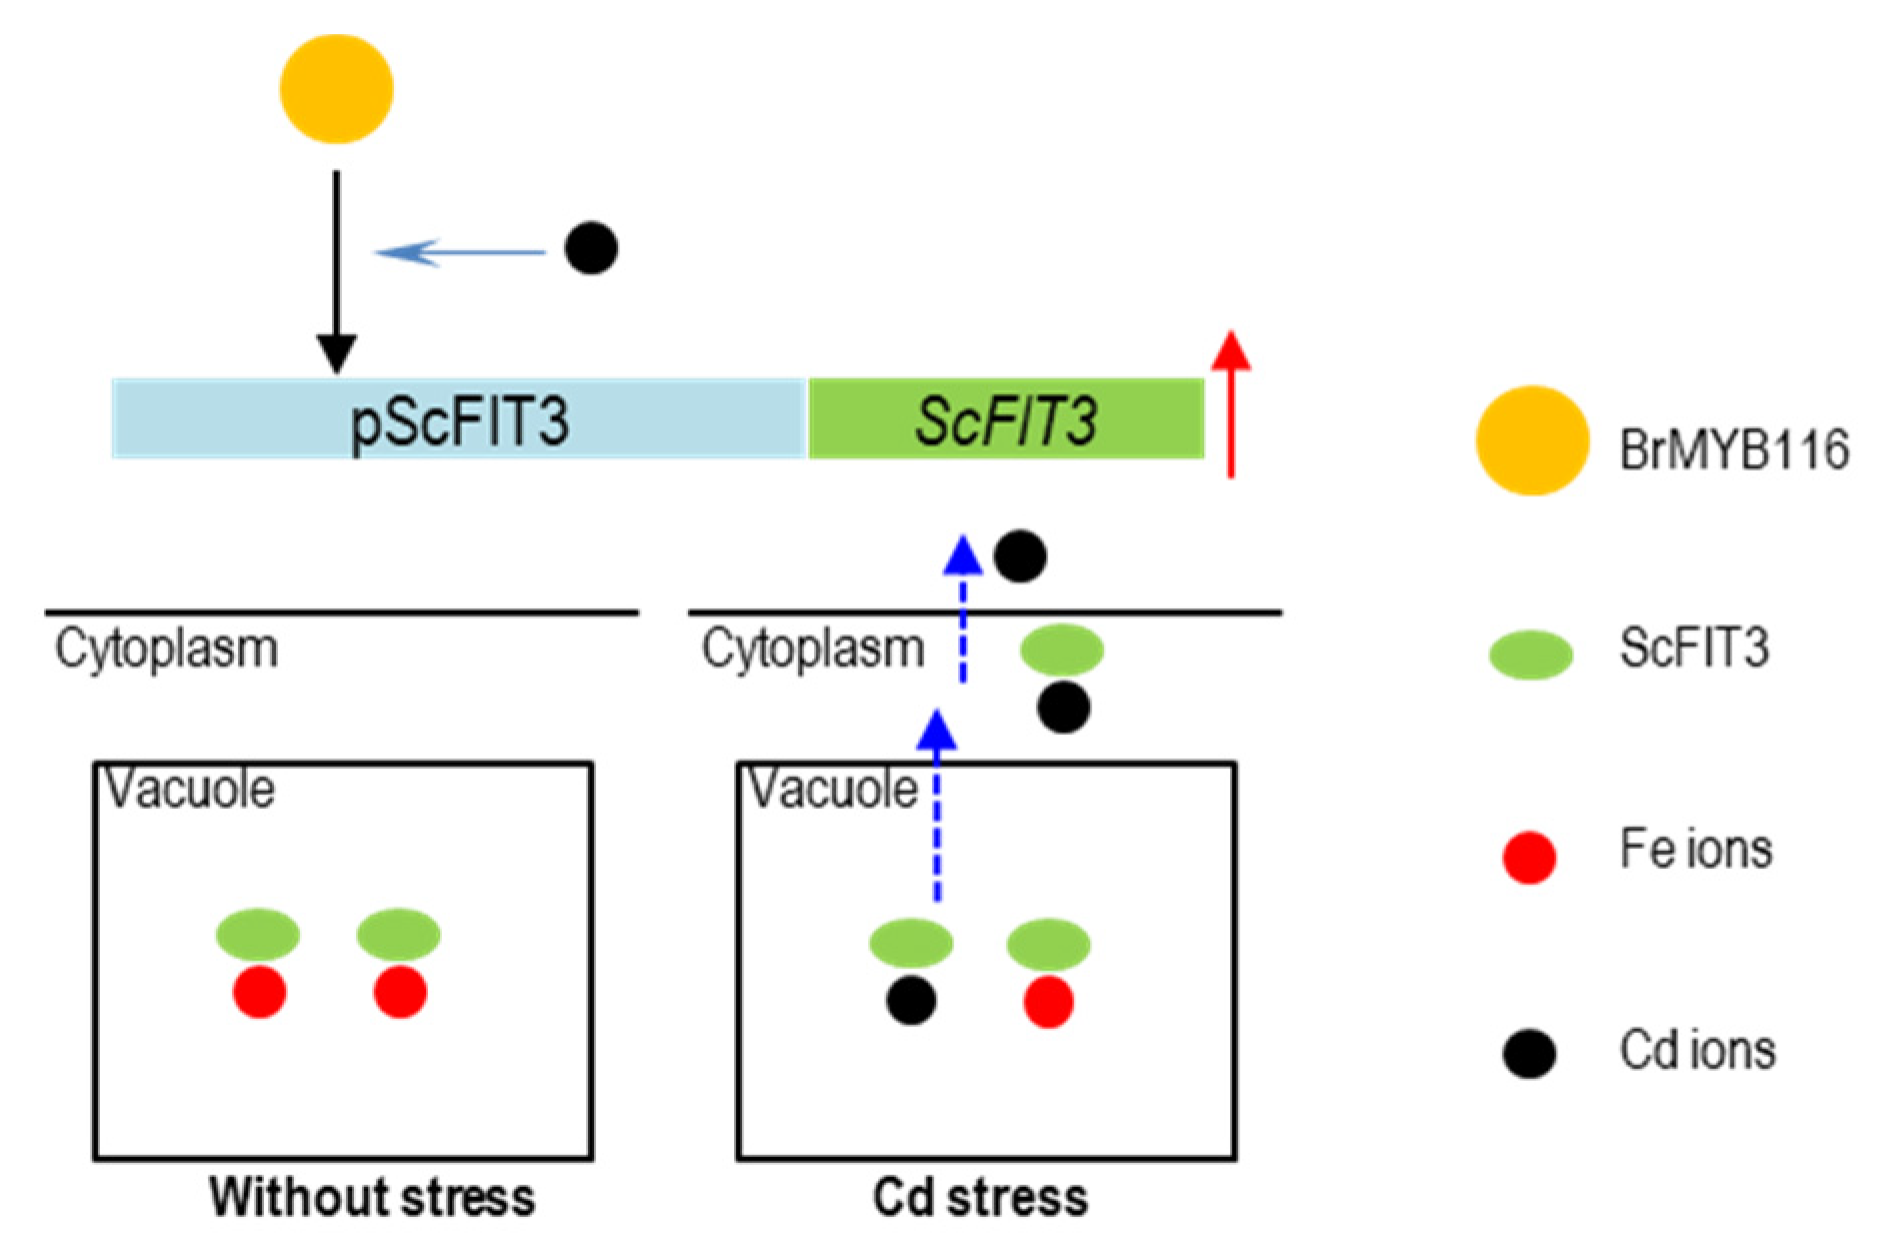
The hypothesis model of BrMYB116 regulating Cd tolerance in yeast cells. BrMYB116 is shown in yellow roundness, ScFIT3 is shown in green oval, Fe ions is shown in red roundness, and Cd ions is shown in black roundness.
Figure 9.
The hypothesis model of BrMYB116 regulating Cd tolerance in yeast cells. BrMYB116 is shown in yellow roundness, ScFIT3 is shown in green oval, Fe ions is shown in red roundness, and Cd ions is shown in black roundness.

