Preprint
Article

Valorisation of Madagascar’s Wildlife Trade and Wildlife Tourism; what Are the Conservation Benefits?

Altmetrics

Downloads

102

Views

27

Comments

0

A peer-reviewed article of this preprint also exists.

This version is not peer-reviewed

Submitted:

17 August 2023

Posted:

18 August 2023

You are already at the latest version

Alerts
Abstract
Wildlife tourism and wildlife trade may appear juxtaposed, but are two, potentially aligning, in-come generators that could benefit conservation in developing countries. Utilising data sets collated from Madagascar’s Ministère du Tourisme and CITES respectively for the period 2007 to 2018, this study estimated levels of income from wildlife tourism and wildlife trade for Madagascar. Between 2007-2018, tourism reported yearly incomes ranging from a low of US \$1.4 million up to a high of US \$15.7 million. However, it was unclear what percentage of this figure flowed to benefit local communities. Alternatively, using reported networks for the live wildlife trade, the estimated eco-nomic value reaching collectors and/or intermediaries on Madagascar was US $72,299.80 for the period 2007 to 2018. Both revenue generators operated within different geographical areas, with tourism opportunities presenting themselves to communities adjacent NPs, while wildlife trade networks were not restricted to National Parks and operated sporadically across Madagascar. Hence, the economic benefits reached different Malagasy participants across the country. The management of both activities needs great care to ensure that environmental impacts and sus-tainability are core measures on any such activities. Whilst this study shines light on economic values and novel perspectives regarding these two trade types, it also highlighted knowledge gaps. Thus, indicating where much greater research attentions was required to allow better understanding of the specific benefits and risks from engaging with both trade types for local Malagasy people and their environments.
Keywords: 
Subject: Environmental and Earth Sciences  -   Environmental Science

1. Introduction

1.1. Socioeconomic Aspects of Wildlife Valorisation in Madagascar

A long-standing ambition in many societies has been to seek the alignment of conservation requirements and poverty alleviation to engender mutual benefits [1,2,3,4]. The paucity of reported successful case studies highlights the complexities, juxtapositions and contested notions of justice that surround such projects [5], espe-cially regarding efforts to improve distributive justice concerned with benefits and burden sharing [6]. One of the most persistent issues is that lower income groups pay disproportionately higher costs for conservation whereas the rich secure most of the benefits [7,8,9].
To varying degrees, conservation benefits have been derived globally from the sustainable exploitation of wildlife resources [3,9,10,11]. Conversely, it has also been stated that unsustainable trade in wildlife was one of the major drivers causing species decline globally [11,12]. However, on Madagascar the impacts from harvesting wild flora and fauna were relatively poorly known, with both illegal [9,13,14] and unsus-tainable harvesting havinge been reported within and outside of protected areas [15]. A situation further compounded by the fact that high numbers of new species, endemic to Madagascar, were still being reported while others were to follow [16,17,18].
Historically, National Parks (NPs) were established on Madagascar with the over-riding aim to protect its unique biodiversity [19,20]. However, often local communities had little or no involvement in the establishment of NPs and other protected areas on Madagascar [21]. Yet in many cases local communities have ostensibly received vary-ing scales of negative impact from their creation, as local communities were prevented from utilizing these areas, and the natural resources within them, for either subsist-ence or commerce [19,21,22,23]. Since 2003, during an expansion of almost 100 addi-tional protected areas, the selection rationale also expanded to include cultural herit-age, poverty alleviation and sustainable use of natural resources [24]. However, local communities’ knowledge on the legal processes and legislation governing protected areas and/or species protection was mostly very poor [25] and, therefore, unaware of the legal status and conservation protections afforded species and habitats.

1.2. Wildlife Tourism Revenue

An alternative to extractive approaches for valorising wildlife would be to view it in-situ; wildlife tourism. Tourism, across its varying formats, was often viewed as a panacea to resolving potential conflicts between local peoples’ needs and NP protection, by bringing tourists to see the wildlife in-situ and having associated services develop around this premise [26,27]. Hence, wildlife tourism has been suggested as a non-extractive method for use on Madagascar [26,28,29]. However, it requires careful management to ensure long-term sustainability, from broad scale issues, such as operator responsibility (eg. deleterious impacts from water supply demands to waste product disposal) [30], to fine scale issues, such as negative impacts on species populations and animal welfare [31,32,33], to minimize potential negative impacts on Madagascar’s environments.
Several studies have estimated the economic value of tourism to a few protected areas and more generally for Madagascar. For example, at Mantadia NP the economic values generated from tourism were estimated at US $24-65 per individual visitor or US $0.8-2.2 million per annum [26]. At Ranomafana NP, in 2002, it was estimated that a total of US $29-31,246 was generated per annum with US $15,836 going to the local communities, while lemurs were stated by visitors to be the wildlife attraction [34]. Similarly, over 600 tourists visiting different NPs on Madagascar also stated lemurs to be the main attraction, with chameleons ranked second [35]. Revenues estimated to be received by local communities at Masoala NP ranged from US $700, in 1999, to US $500, in 2001 [28]. A national scale estimate of income generation via tourism was stated to be between US $26-29 million, with approximately 17% of tourists to Madagascar visiting national parks [35].

1.3. Flora and Fauna trade Revenues

In addition to their apparent lack of knowledge regarding NP and species conservation legislation [25], not all local communities were keen to engage in the live trade of wildlife for international markets (which typically omits bush meat, other derivatives, and domestic uses, such as medicinal plants) for several reasons. For example, individuals reported being repulsed by reptiles, while payment insecurity, fear of legal repercussions and traditional barriers to harvesting certain species were other reported concerns [36,37]. However, it has been argued that Malagasy communities have the right to trade in their local wildlife resources [38]. Certainly, the international, live wildlife trade appeared to be flourishing on Madagascar. For example, relatively high levels of trade in Malagasy flora and fauna have been reported in studies to meet international demands [37,39,40,41,42,43,44,45].
As to the value generated from the international wildlife trade in Malagasy flora and fauna, estimates vary greatly, between product types and years. For example, Waeber and Wilmé [39] reported that illegal Rosewood and Ebony timber stockpiles due for export were valued at a minimum of US $600 million, while trade conducted in 2013 alone, across all CITES listed flora and fauna, was estimated at between US $ 346,246 to US $646,226 [37]. Alternatively, various estimated values have been provided for specific taxonomic groups; such as Chameleons generating over US $14.5 million [44], amphibians traded between 2000-2006 generating up to US $906,750 [43] or just Mantella traded between 2001–2003 generating up to US $246,372 [42]. Supply chain structures on Madagascar vary [46,47], though the three-actor level chain was most commonly used with collector and intermediary positions filled by Malagasy people [37,42]. However, the wildlife trade comes with potential hazards to an already challenging situation of protecting Madagascar’s wildlife, such as the potential of overharvesting, animal welfare issues, cartel formations, the possibility of introducing the amphibian disease chytridiomycosis into new locations, etc. [18,35,48].
This study draws together national scale data sets on these two forms of income generation to investigate both the levels and dynamics of the income generated. Furthermore, it will compare across both forms and discuss the potential benefits and costs to Madagascar for local communities. Such information will greatly enhance discussions on Madagascar and internationally, which currently lack any such comparisons, regarding advancing management options and seeking the best outcomes for conservation and poverty alleviation. This paper will present: (1) numbers of tourists and levels of income generated over the period 2007 – 2018. (2) the numbers of ecotourists and income generated each year over the same period. (3) the CITES listed species of flora and fauna exported from Madagascar and the numbers exported in the period 2007-2018. (4) the income generated from the trade in wildlife exported from Madagascar.

2. Materials and Methods

Tourism data were obtained by request (collated Oct. 2019) from the Ministère du Tourisme on Madagascar. The Ministry supplied data covering the period 2007-2018 that included the total number of overseas visitors (tourists) each year and estimated income from tourism for each year (Table 1). Wollenberg et al.’s [35] value of 17% (percentage of tourists who were ecotourists) was applied to the yearly tourist num-bers to provide an estimate for the number of ecotourists visiting Madagascar each year (Table 1).
To estimate the income values generated from ecotourism, the yearly number of ecotourists (Table 1b) were multiplied with published conversion values presented by both Wollenberg et al. [35] and Dixon & Pagiola [26], in each case the published values were adjusted for inflation in US$ to 2019. Estimation 1 was calculated using Wollenberg et al.’s [35] conversion value with yearly ecotourist numbers. Estimation 2 used Dixon & Pagiola’s [26] conversion values, who provided an upper and lower value. Hence there were two calculations performed and two sets of estimates, upper and lower values, presented.
CITES data were obtained from the CITES Trade database (https://trade.cites.org/). These data were collated on 23rd Dec. 2019 using the following criteria; export country = Madagascar, source = wild, purpose = commercial, terms = live. These criteria were applied while the ‘Search by taxon’ was left empty to collect trade data records across all CITES listed taxa groups, animals and plants, for the period 2007-2018. These data were downloaded in an excel format for analysis and presentation.
Flora and fauna trade prices were extracted from published literature [37,42] and adjusted for inflation, in US$, for each year over the period. For plants, there were no trade structure price data available other than a single average export price [49]. The price structure reported for animals displayed a decrease in the order of two magnitude from export to collector, hence, it has been assumed here that a similar price structure would be observed for plants. Thus, the average plant price has been reduced by two-fold to provide a general indicator of price at the collector level.

3. Results

3.1. Ecotourism Revenue Generation

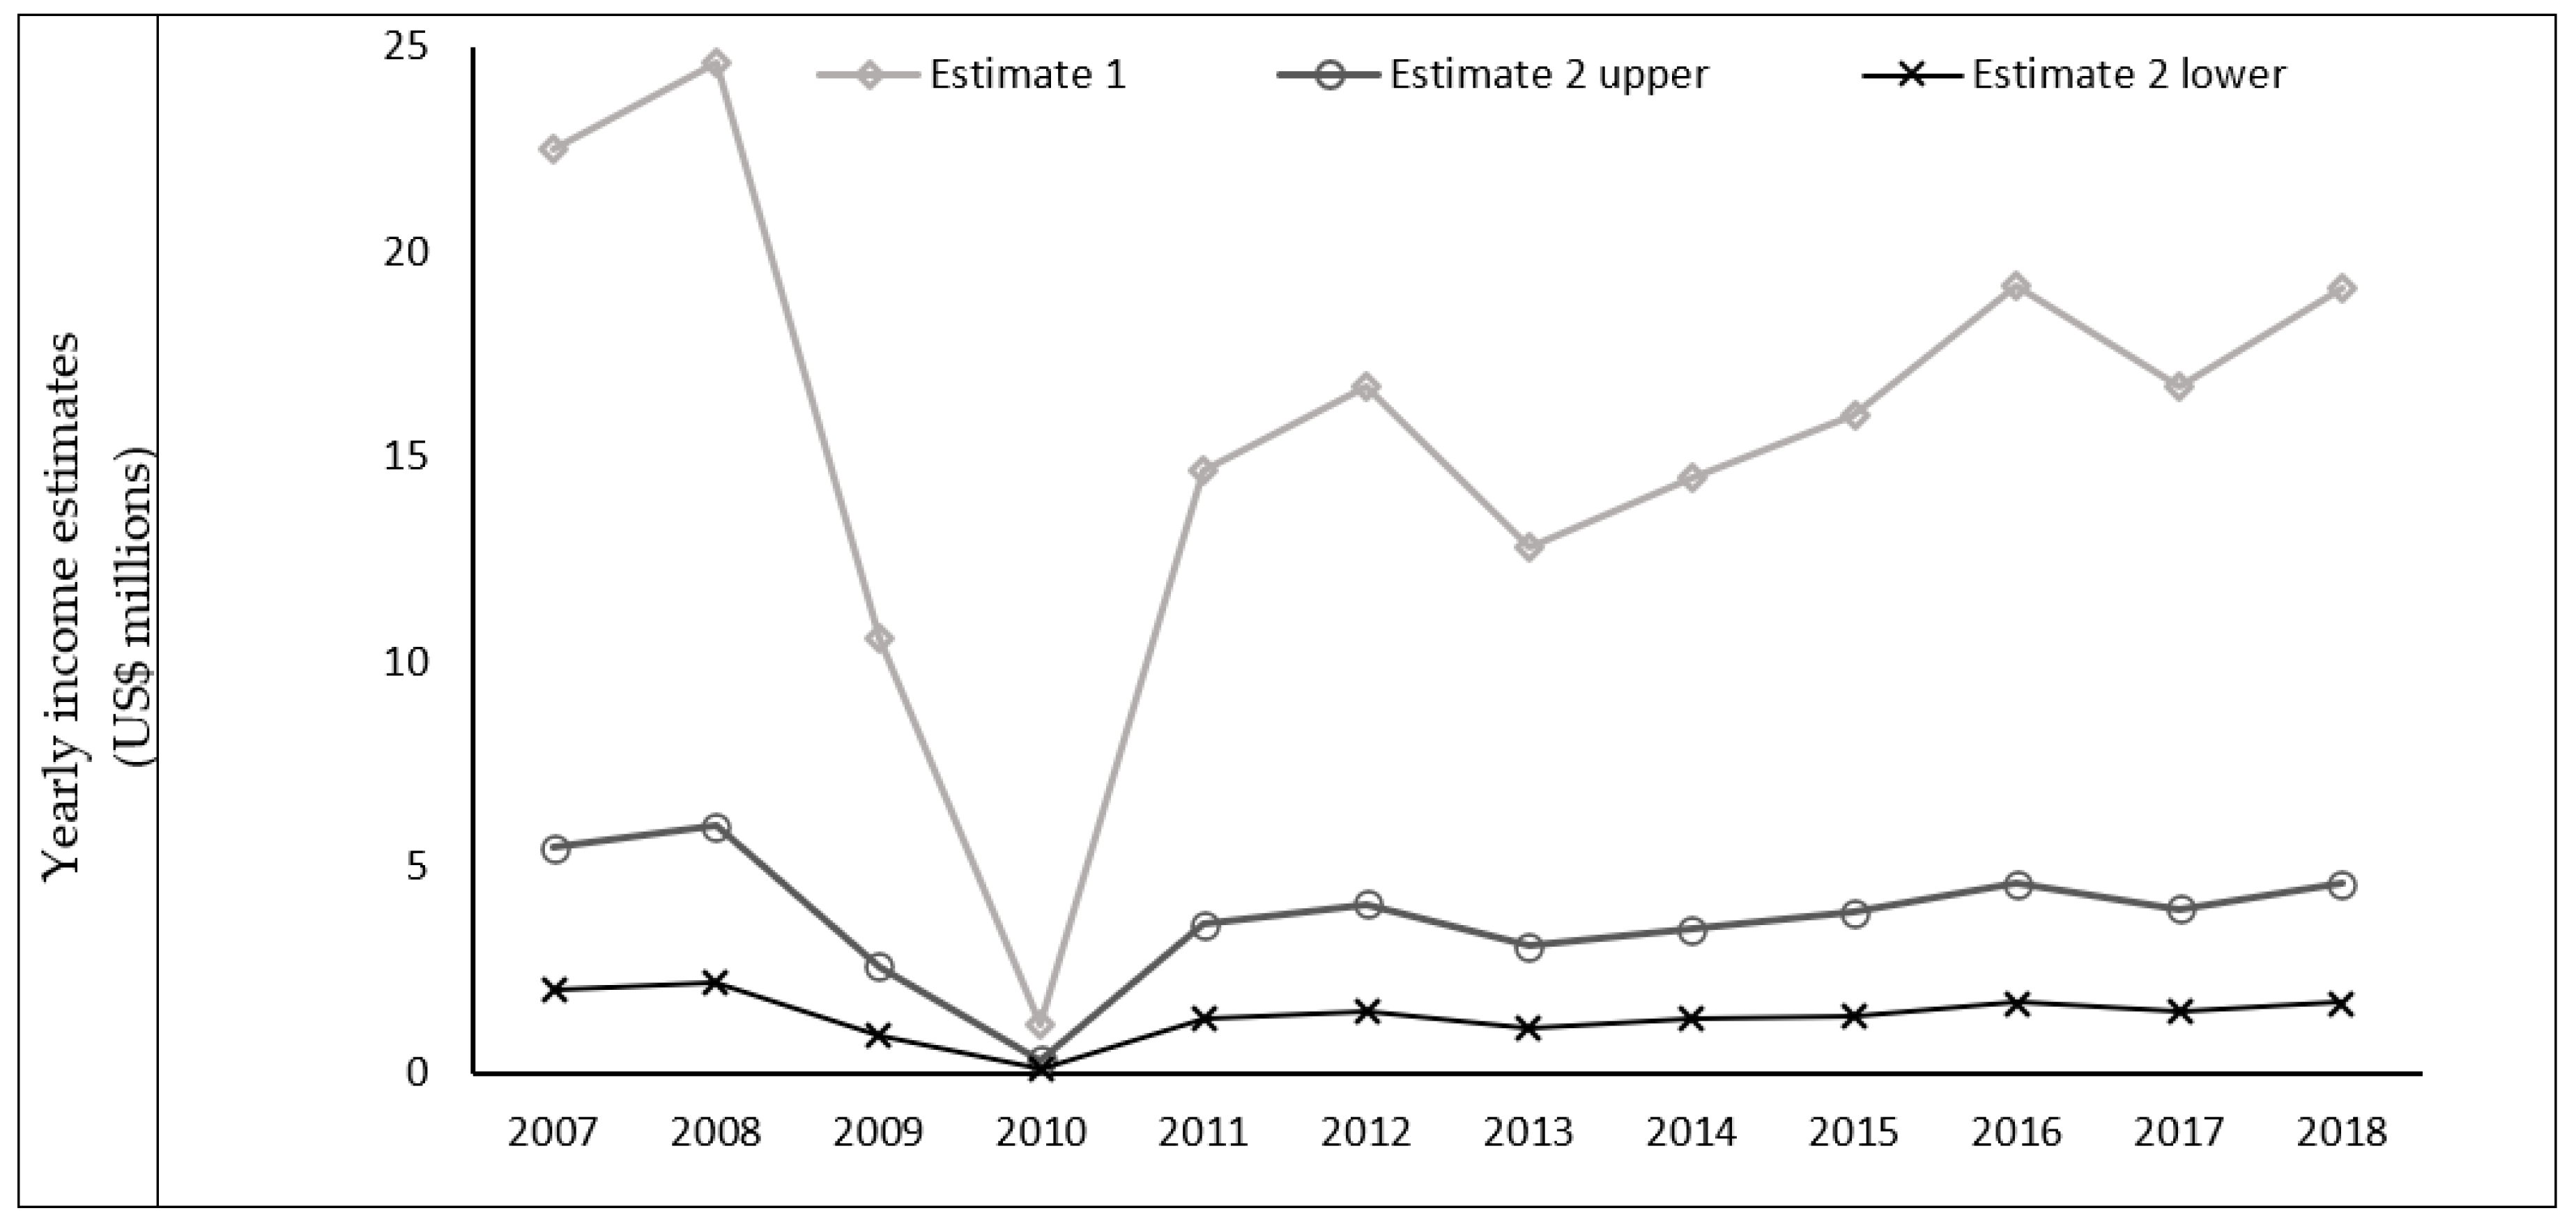
The total number of tourists arriving on Madagascar for the period 2007 to 2018 was nearly 3 million people with, on average, over 240,000 people arriving each year (Table 1a). Of this number of tourists, it was estimated that the number of ecotourists visiting each year was nearly 41,000 (Table 1b). Over the total period 2007-2018, eco-tourism generated a total income of nearly US $189 million using Estimate 1, nearly US $46 million using Estimate 2 upper and nearly US $17 million with Estimate 2 lower value. On average, across the period 2007-2018, a yearly income was reported ranging from a low of US$1.4 million up to a high of US$15.7 million (Figure 1).
The highest level of income in any one year from ecotourists was in 2008 when it generated US$24.6 million, while the lowest was in 2010 when US$0.1 million was generated (Figure 2). Over 2007-2018, a linear regression analysis found no increase in ecotourism growth over the period (y=0.0741x+15.235; R2=0.002) for estimate 1. However, any long-term trend would be masked by the significant decrease in 2010. Applying a linear regression to a subset of the data, after the crash from 2011 to 2018, income generated from ecotourism using estimate 1 was generally increasing (y=0.613x+13.454; R2=0.4556) back towards the high recorded in 2008 (Figure 2).

3.2. Flora and Fauna trade Revenues

Between 2007 and 2018. a total of 286,938 individual organisms were reported being exported from Madagascar with over 83% being animals and nearly 17% plants. The exported flora and fauna were from 52 known genera; 35 (67%) plant genera and 17 (33%) animal genera.
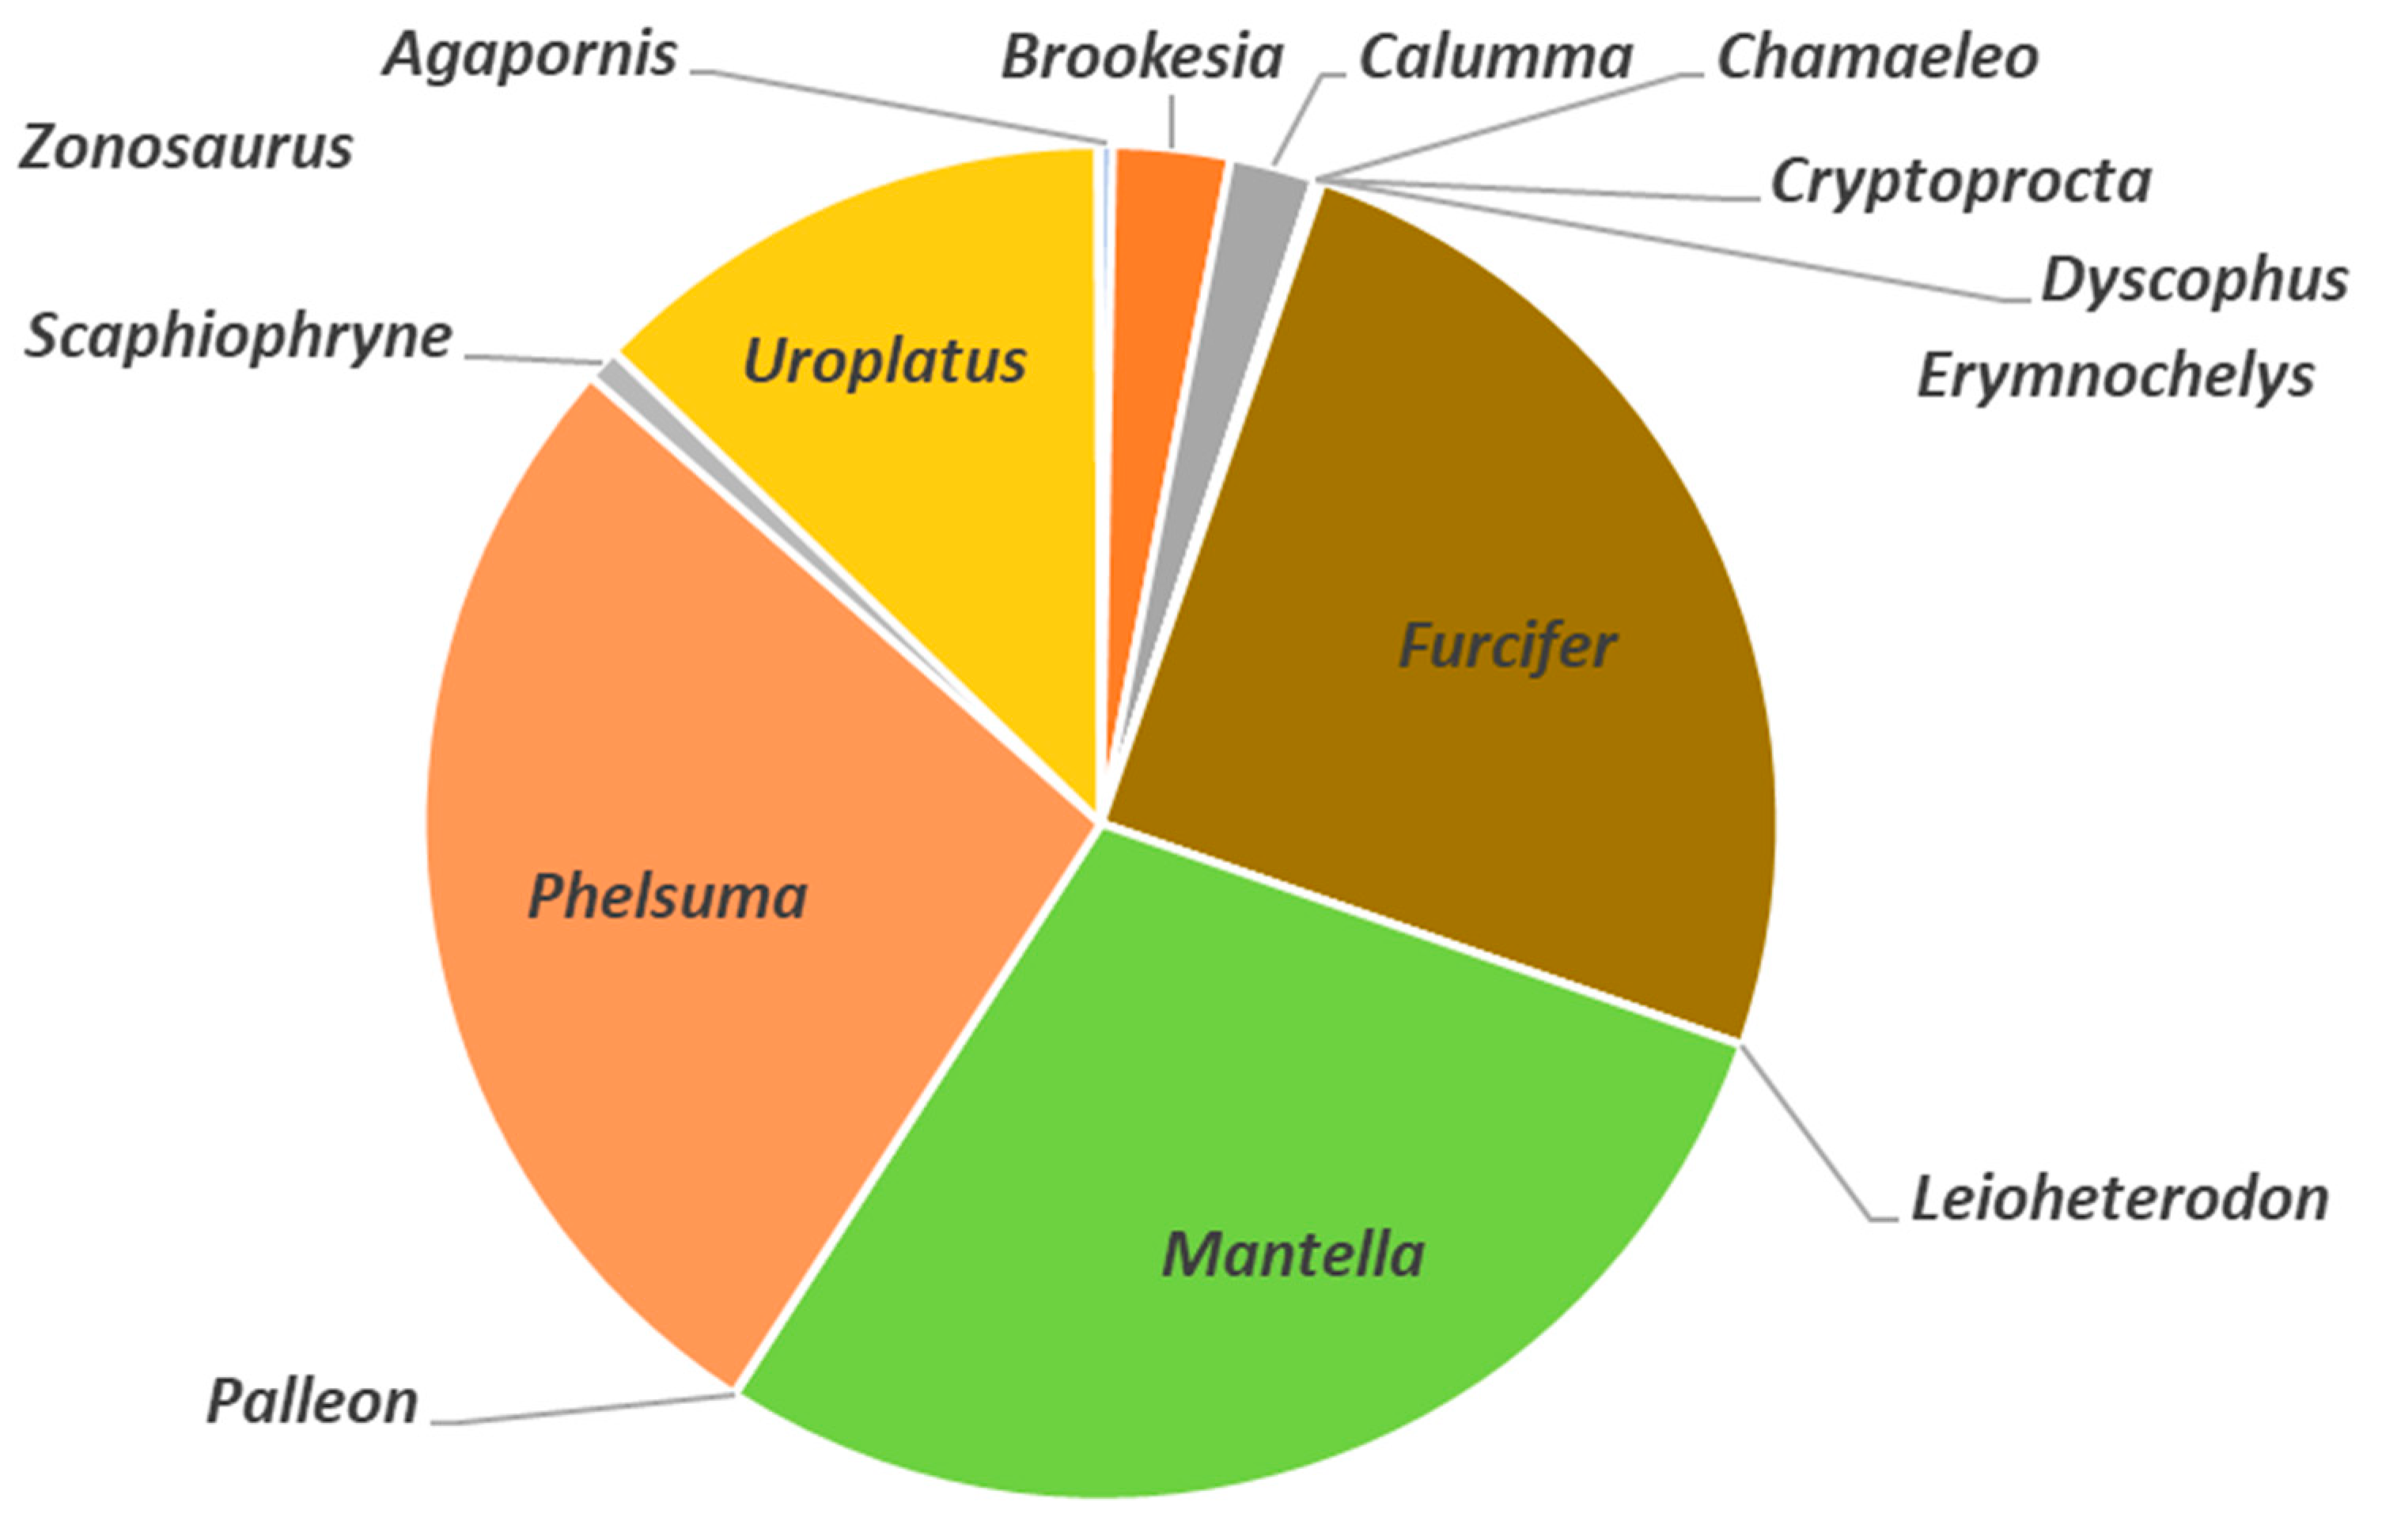
Of the 238,961 individual animals traded, over 70% was in Reptilia, over 29% in Amphibia with minor amounts in Aves (0.3%) and Mammalia (0.002%). Reviewing trade within the animal grouping at the genus level, the top five genera, which accounted for 97% of the trade in animals, were Mantella (29%), Phelsuma (27%), Furcifer (25%), Uroplatus (13%) and Brookesia (3%) (Figure 3). Furthermore, within each genus just a handful of species accounted for the majority of its trade (Table 2). The top five species traded accounted for over 40.5% of the total number of animals exported; Mantella betsileo (Brown mantella, n=22737, 9.5%), Mantella baroni (Baron’s mantella, n=21110, 8.8%), Furcifer pardalis (Panther chameleon, n=19029, 7.9%), Phelsuma lineata (Lined day gecko, n=17939, 7.5%) and Furcifer lateralis (Carpet chameleon, n=15908, 6.74%).
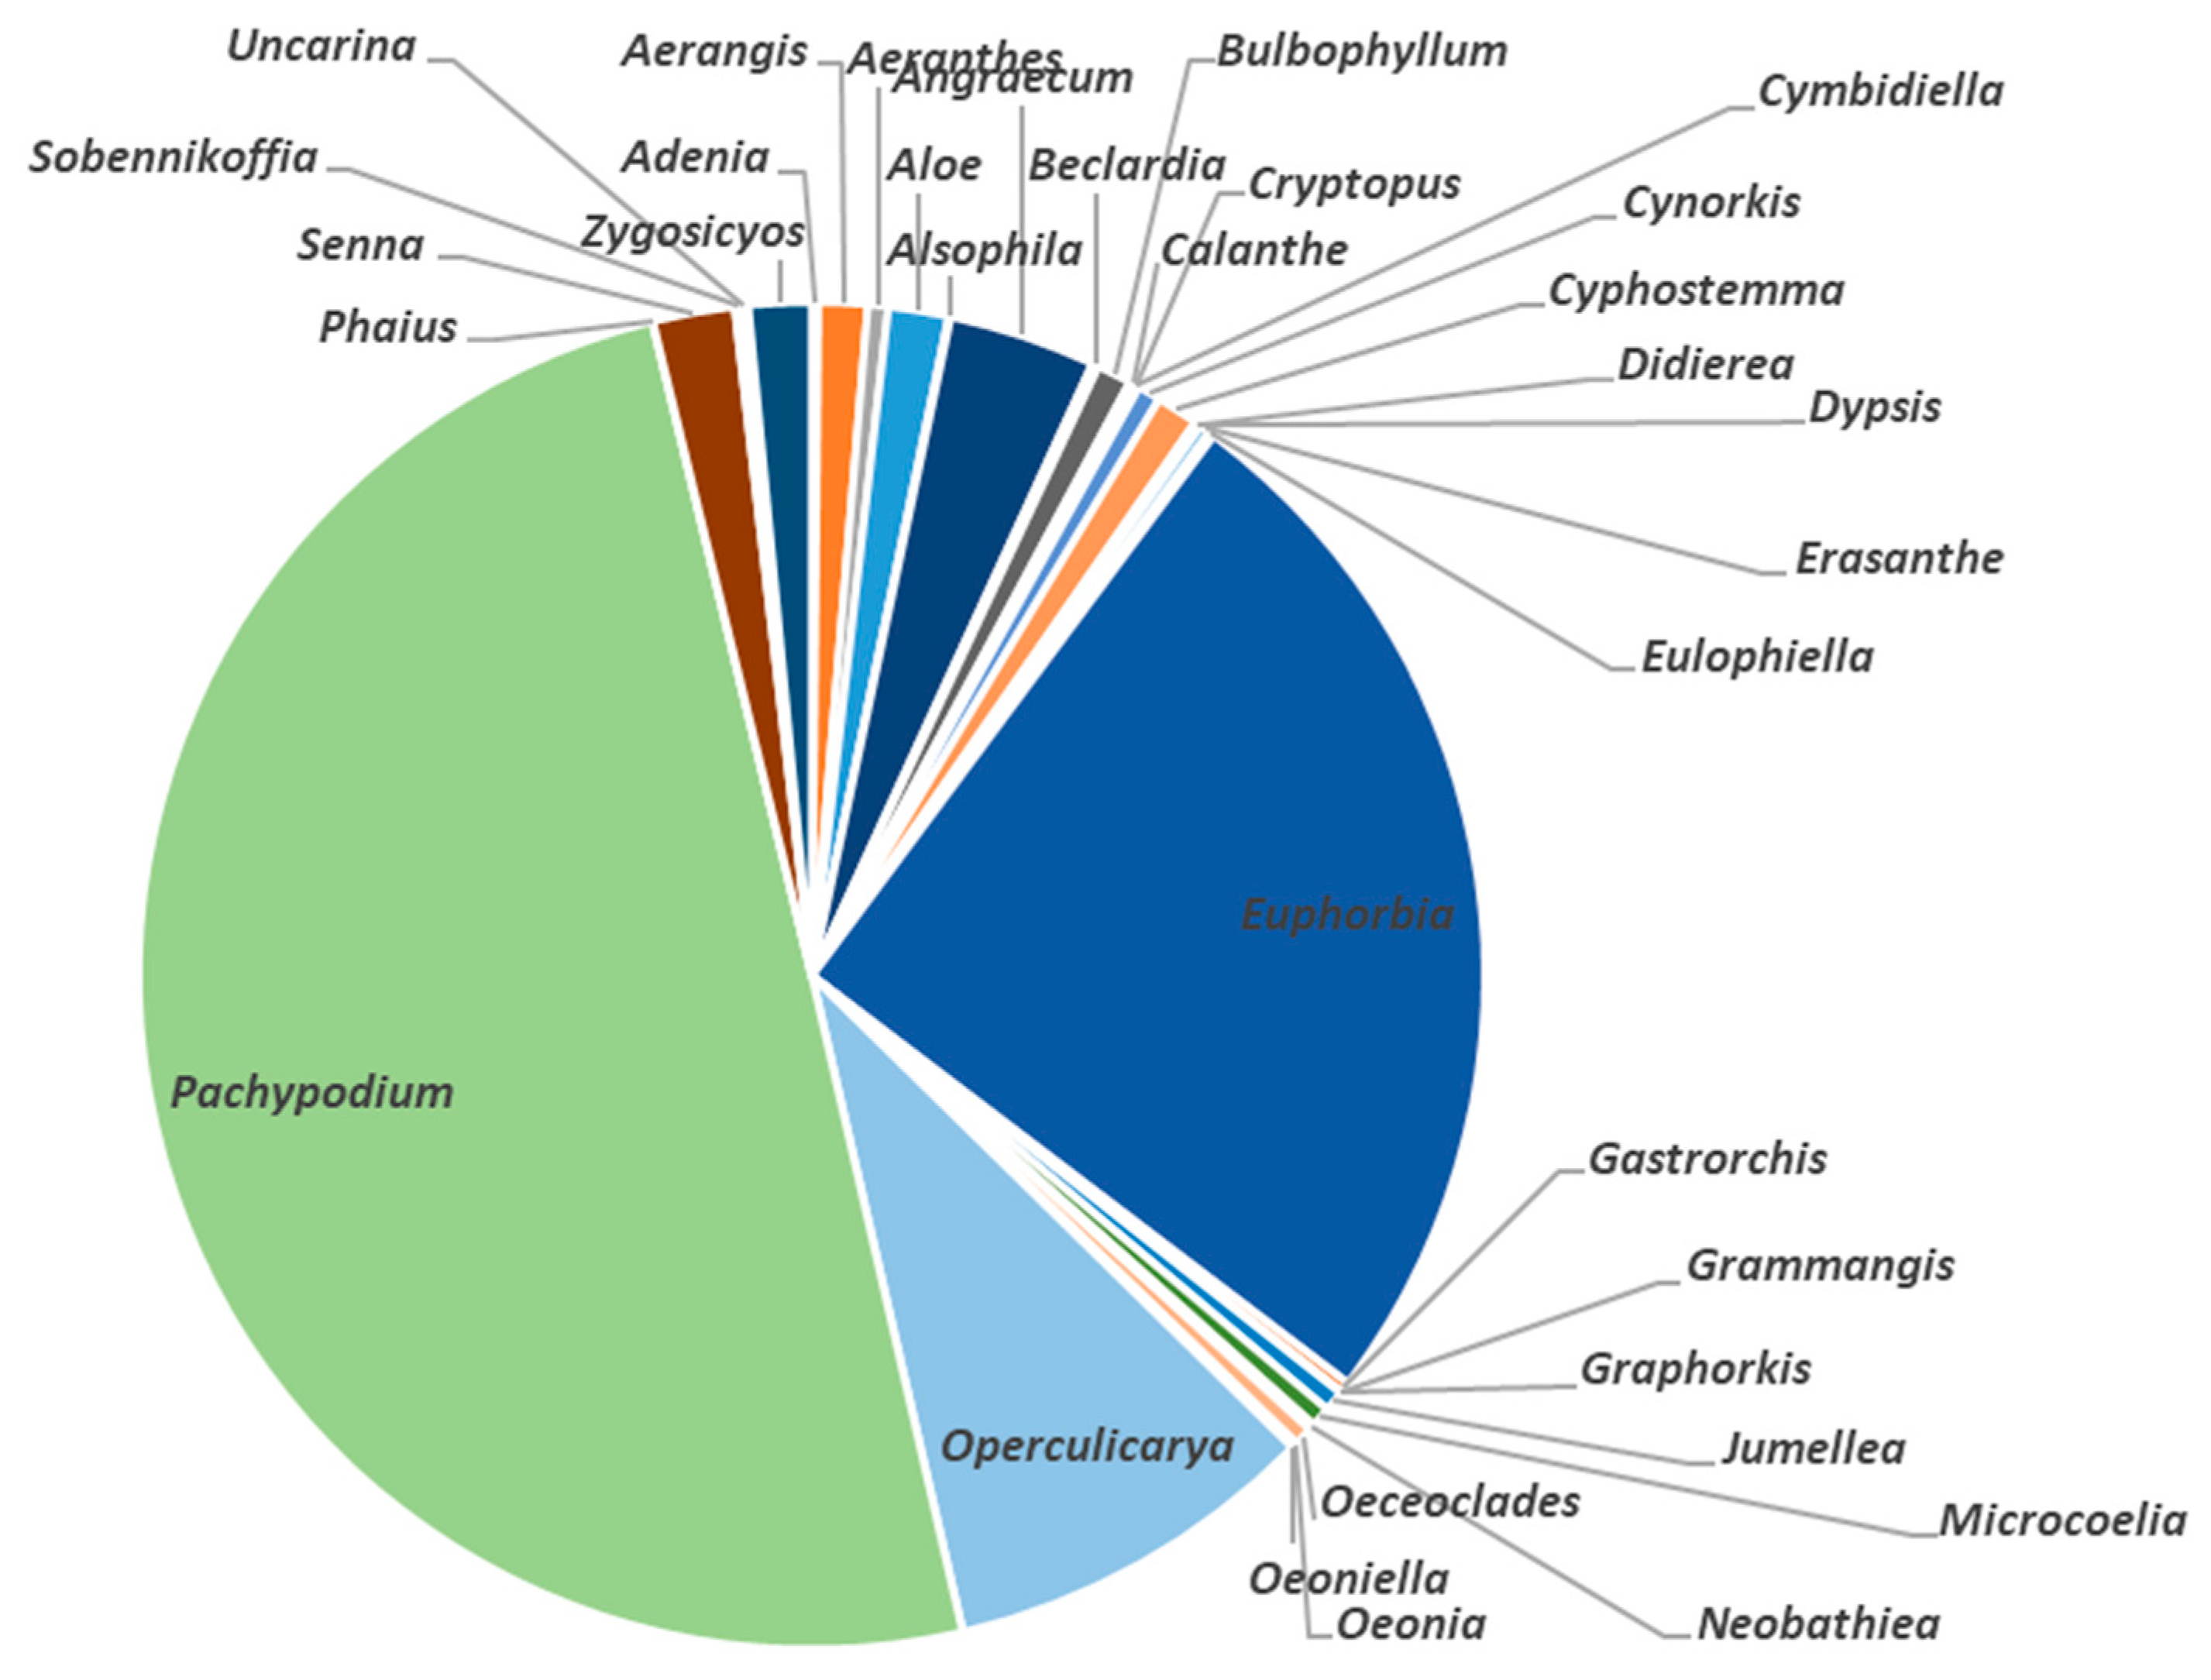
Of the 47,977 individual plants traded, four genera accounted for over 84% (n=40382) of the exported plants from Madagascar with these four genera being Pachypodium, nearly 48% (n=22967), Euphorbia, over 24% (n=11608), Operculicarya, nearly 9% (n=4175) and Angraecum, over 3% (n=1632) (Figure 4). Furthermore, within each genus just a handful of species accounted for most of the trade (Table 3). The top five plant species traded accounted for nearly 47% (n=22504) of the total number ex-ported; Pachypodium spp. (n=7532, 15.7%), Pachypodium densiflorum (n=4232, 8.8%), Pachypodium brevicaule (n=4219, 8.7%), Operculicarya pachypus (n=3337, 6.9%) and Euphorbia primulifolia (n=3184, 6.6%).
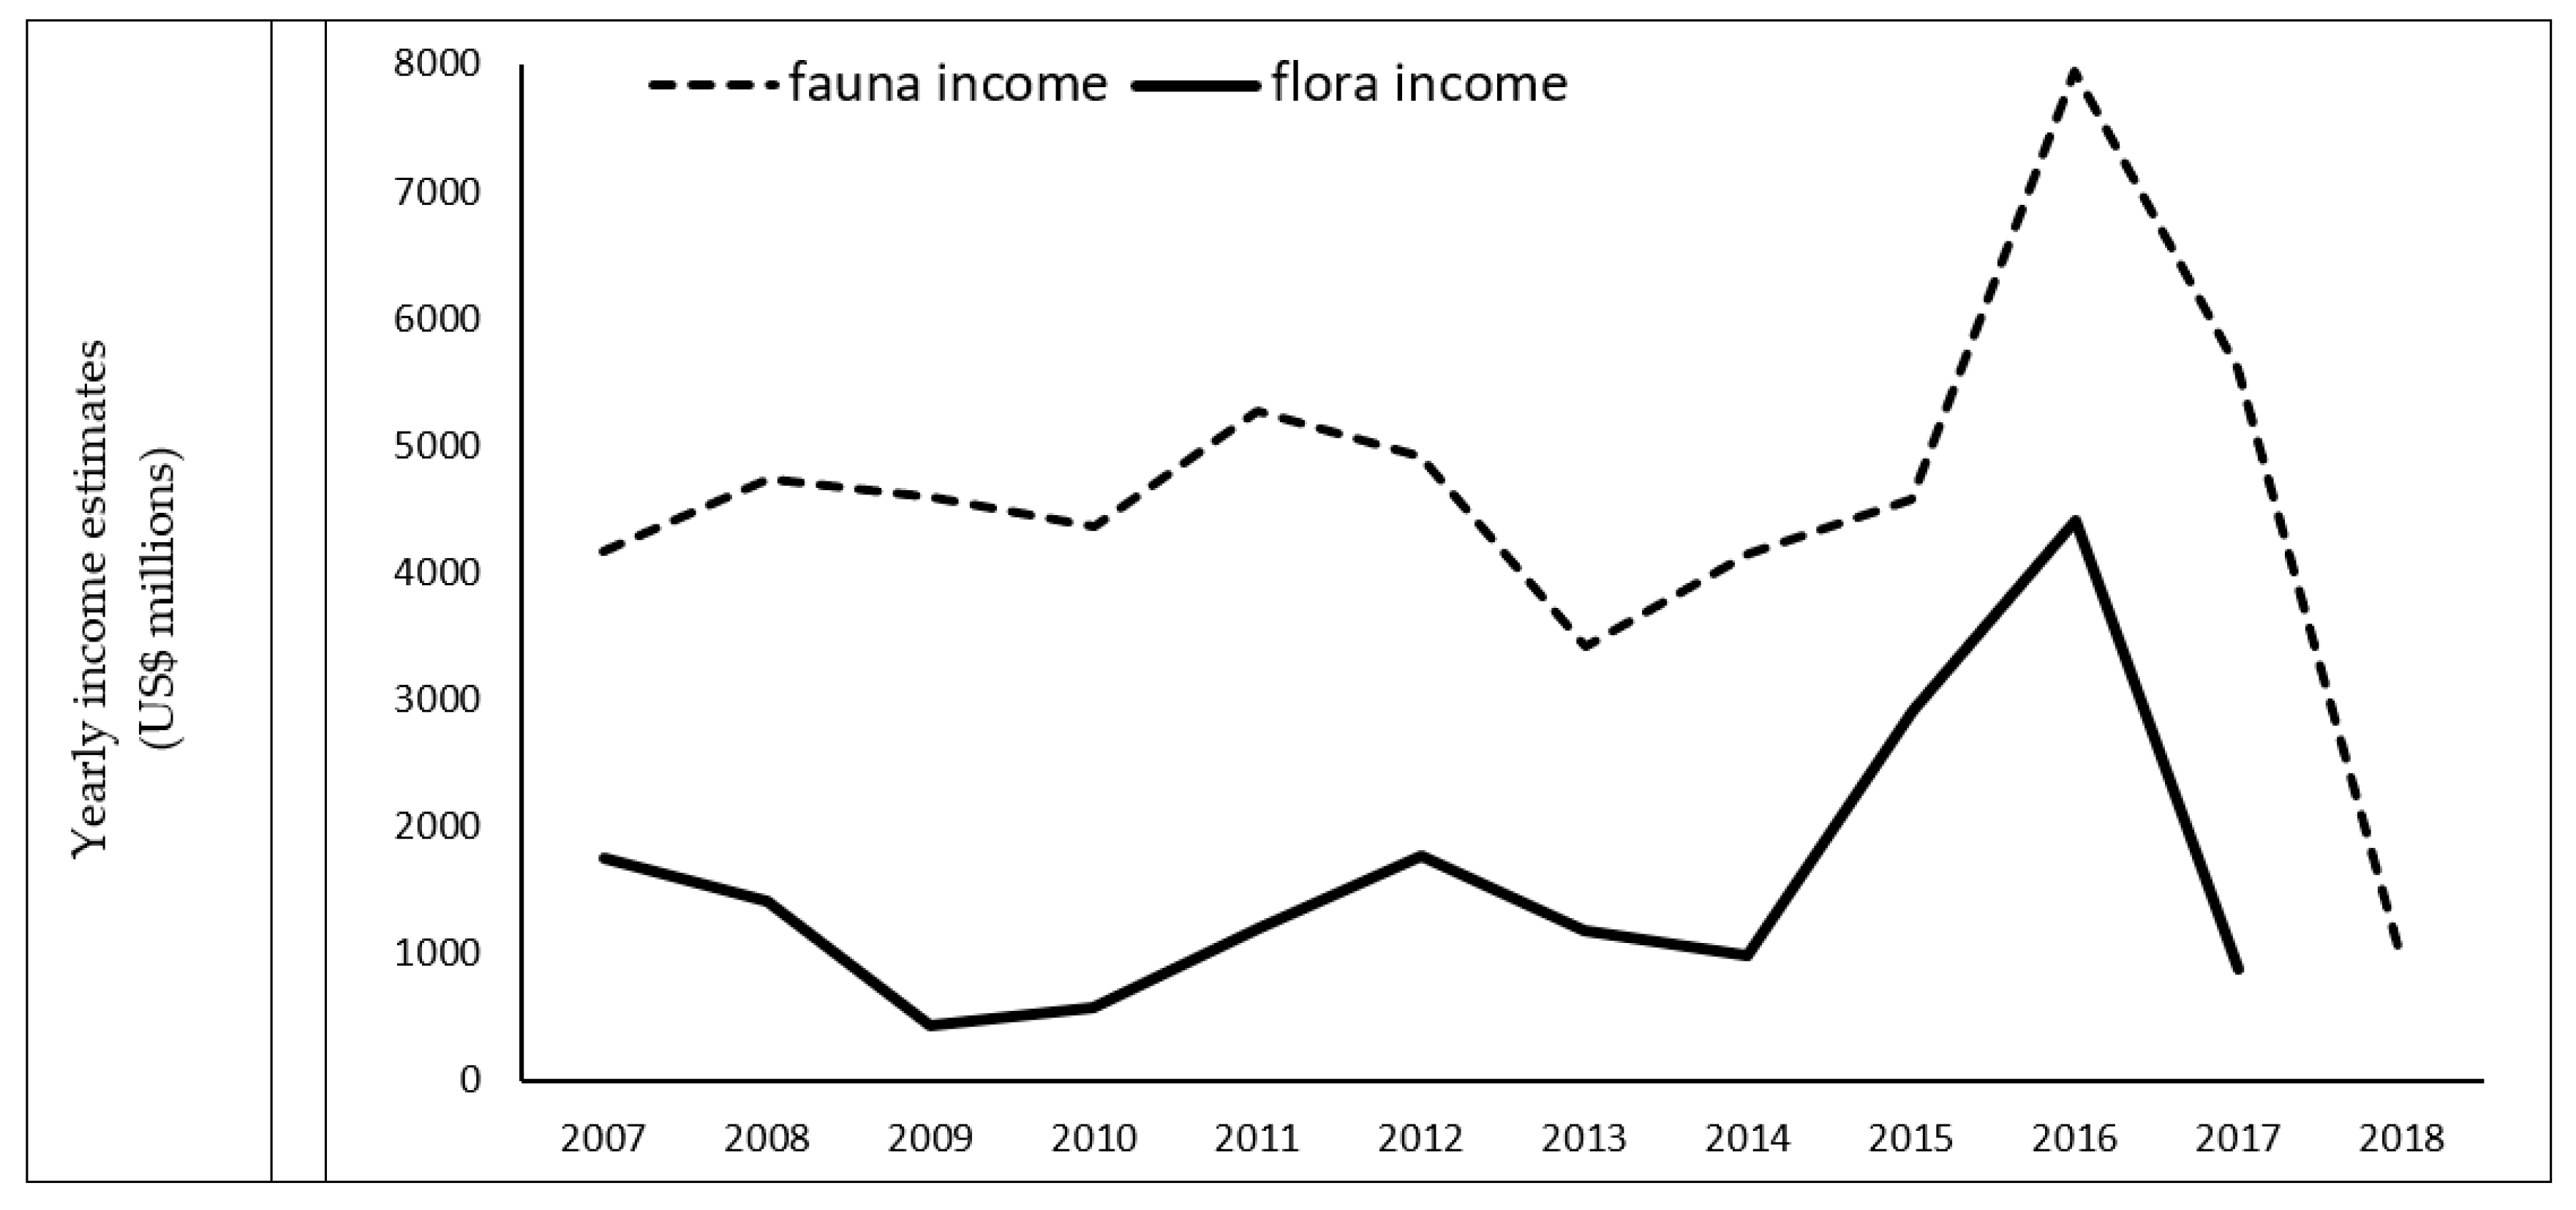
Consequently, based on dedicated species prices extracted from the published scientific literature, adjusted for varying yearly levels of inflation, an estimated total of US$72,300 was generated from the trade between 2007-2018 and potentially made available to people within local communities (Table 4). The animal grouping contributed the majority (US$54,728, nearly 76%) to the total value, with the plants grouping contributing US$17,572 (over 24%). In the year 2016, both the animal and plant groupings recorded the highest levels of income (animals = US$7,944; plants = US$4,416), but both decreased rapidly post 2016. Trade remained static until 2013 (animals) and 2014 (plants) after which both groupings increased rapidly in the levels of trade (Figure 5).
All remaining prices were extracted from Robinson et al. [37] adjusted for yearly inflation levels in US$
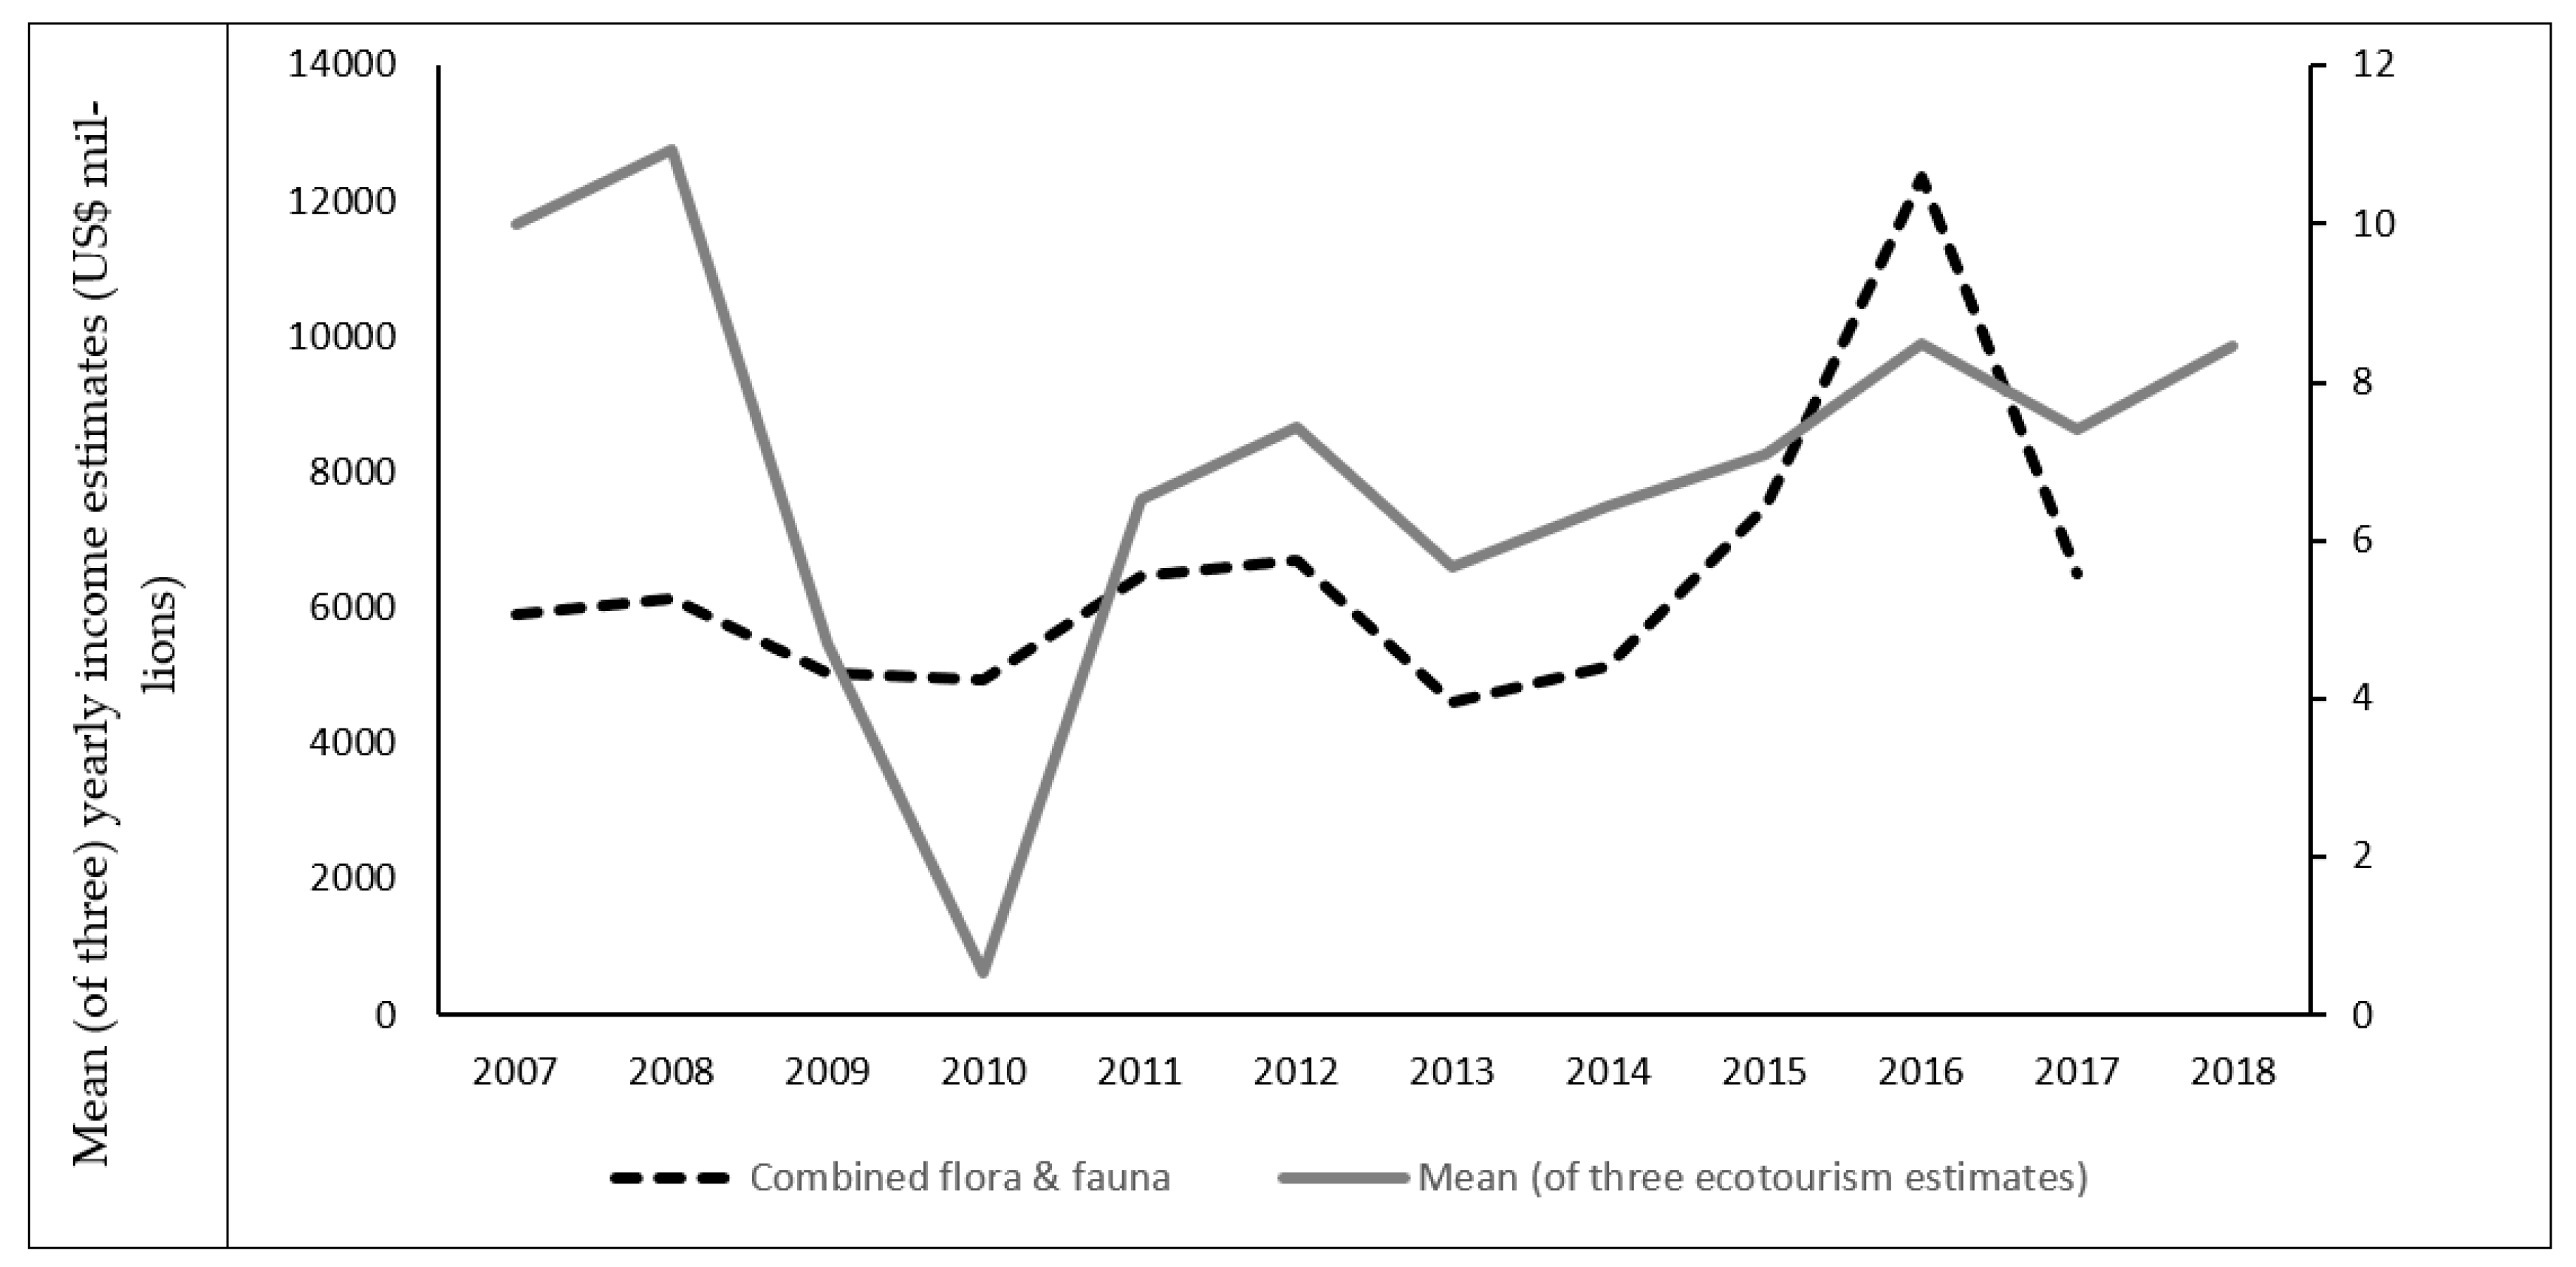
Comparing the estimated levels of income generated from both ecotourism and wildlife trade on Madagascar, a much greater level of income generation was garnered from wildlife tourism (Figure 6). Wildlife tourism reported yearly income estimated in the millions of US dollars, while estimates of income generation from the wildlife trade was recorded in thousands of US dollars (Figure 6). However, the wildlife trade displayed a positive increase in trade (y=305.23x + 4657.4, R2=0.224) (excluding 2018; as it has been reported that observed drops in trade in the latest year of reporting were more likely due to an artifact of countries failure to meet CITES reporting timelines than a true drop in any trade – see [46]).

4. Discussion

Over the whole time period for which data exists (2007–2018), the international live trade in Malagasy herpetofauna generated revenues estimated at a total of US$401,470 reaching local Malagasy people. Taking just the upper estimate, for the reptile and amphibian focused wildlife tourism, it was valued at over US$51 million while the general figure was estimated at US$17-46 million. However, both these revenue estimates were greater than the estimated revenue generated from the wildlife trade, though actually how much flows to reach the local people is unknown. For comparison however, in just 2018, Madagascar’s top revenue generators ranged from; firstly, coffee, tea and spices (valued at US$1 billion; on its own vanilla was worth US$855.4 million and cloves US$149 million) to tenth place, mineral fuels, including oil (valued at US$51.5 million) [50]. The vast differences highlighted here between top in-come generators and the trade in wildlife, potentially, offers some justification for the government of Madagascar’s apparent lack of attention and focus to issues raised by this trade type. It can sometimes be forgotten by conservationists that Madagascar’s government are often dealing with perceived greater priorities and with minimal resources.
However, it should also be remembered that this study is presenting wildlife trade data only for CITES listed species. There would also be much trade in non-CITES listed species happening in parallel to these data presented here. Therefore, the monetary values presented should be viewed as minimum values. Furthermore, whilst CITES listed species do have non-detrimental findings (NDFs – albeit NDFs remain highly questionable in terms of population data used and robustness of outputs) that allow quotas to be assigned to a species limiting the number of individuals they are traded in, this is not the case for non-CITES listed species. Thus, questions over the sustainability of trade in all species of flora and fauna remain. However, by presenting both flora and fauna data together within this study does allow for a more complete ‘picture’ of the wildlife trade on Madagascar, whilst highlighting that many questions remain unanswered over the sustainability and management of its wildlife.
Whilst tourism with a herpetological focus was over two magnitudes of difference higher than that generated from the international live trade, the revenue was focused towards local communities located adjacent to NPs benefiting. Conversely, those involved with the live trade were more geographically dispersed and, likely, with no association to a national park. Hence, the two sources of revenue generation were possibly complementary to each other in that they could potentially engage with different sets of local people. Therefore, they should not be seen as alternatives, but rather can operate side by side, as long as it is sustainably conducted. Thus, both avenues to valorisation of wildlife raise not only the levels of revenue generated but also the opportunities to engage in revenue generation for a wide spectrum of local communities. However, one has to be careful of the wider dynamics involved. For example, one hotel Northeast of Mahajunga, Anjajavy, attempted to train individuals from the adjacent, remote, village to work in the hotel (author, pers obs.). However, due to the multiple juxtapositions between the individuals and the western facing hotel, the training of local people to work within the hotel and, thus, provide local benefits had very mixed results. This resulted in the hotel ceased trying to utilize staff from the local village due to several reasons, but instead recruited individuals with more western ‘standards’ exposure from major towns and importing them to work at the hotel but living in the local village. These new recruits were from different tribes with very different social / behavioural mannerisms, outlooks and more western experiences. Yet they were expected to be both located within the local village and welcomed by those living there. The impacts were extremely wide ranging and both negative and positive.
Despite the short-term economic benefits, the long-term conservation impacts re-sulting from the current scope and scale of the consumptive use of wildlife was being increasingly brought into question [1,11]. However, the potential negative impacts of unsustainable exploitation are not limited to extractive use of Madagascar’s flora and fauna alone. For example, broad scale issues can arise from ecotourism operators’ environmental responsibility, such as deleterious impacts from the demand for water supplies or waste product disposal [30]. Alternatively, at a finer scale, irresponsible ecotourism can also bring net negative impacts on both the conservation and welfare of wild animals, including reptiles [32,33]. For example, regular, close proximity of tourists with free-ranging wildlife can negatively impact an array of animal behaviors, such as breeding [51] or foraging [52]. Direct physical contact with wild caught wildlife can also lead to the unintentional transfer of zoonotic diseases [35], the death of individual animals or to species, potentially threatened species, being brought into captivity to show-off to tourists. Often these types of negative impacts are difficult to detect, especially by tourists themselves [32], while different attitudes and societal expectations further complicate such decision-making [33].
Both trade types reported here, whilst generating income, raise questions over their sustainability, both from direct and indirect effects. However, it is imperative that Madagascar’s authorities seek to implement much more robust and greater detailed reporting of the structures operating within both trade types. For example, taxes are collected from both trade types and there are potential benefits to government, local communities and conservation from implementing better monitoring. However, presently, there is a lack of knowledge and openness as to both the supply chain networks and financial flows operating within the country. Hence, to allow both fuller evaluation and greater management of these income generation types, much greater effort needs to be focused at reporting on and managing both supply chain networks and financial flows. This would permit adjustment of higher financial flows away from wildlife exporters / foreign businesses and more towards government and local communities; importantly raising the benefits gained by local communities from maintaining local wildlife and habitats. Considering local communities are a conservation concern in places, this could be managed to benefit both local people and conservation.
No previous study has sought to estimate and compare such complex scenarios, especially for a country that has such a high conservation profile and in need of such evidence upon which to make more robust and sustainable management decisions for the national good. Ultimately, there are positives and negatives associated with both the live trade in wildlife and ecotourism. However, it will be the long-term sustainability with minimum environmental impacts that follow both activities that managers will need to ensure going forward. These will be multi-dimensional, ranging across species and ecosystems to human dimensions, and spanning both temporal and spatial scales. Hence, balancing social demands with environmental capacity to minimise impacts and maintain sustainability should be the goal of government and managers alike.

5. Conclusions

There have been no comprehensive reviews undertaken previously on the value of these two sectors for the potential conservation benefits they offer. This study was the first that sought to contrast and compare the extent of each trade type on Madagascar. It provides a comprehensive baseline from which to further investigate these areas, but also highlights the vast differences in income generated from both. However, it also highlights the need to better understand the flow of these revenue streams to better improve their benefits to both poverty alleviation and conservation. Certainly, without a much improved understanding of the flow and divisions of income, from country level down to the local family, study’s such as this one, lack the detail and nuances to best advise on the changes required. This study has highlighted the levels of incomes involved, detailed the trade networks involved, highlighted the wild flora and fauna being traded and highlighted broadscale issues. It is now incumbent on others to take the fundamentals reported in this study and add to the detail to allow sensitive, adaptive management proposals that benefit both poverty alleviation and conservation equally.

Author Contributions

The individual contributions were as follow: “Conceptualization, AIC; methodology, AIC; formal analysis, AIC; investigation, AIC; data curation, AIC; writing—original draft preparation, AIC; writing—review and editing, AIC and FA; visualization, AIC and FA; project administration, AIC and FA.

Funding

This research received no external funding.

Data Availability Statement

CITES species trade data was openly and freely available from CITES Trade Database.

Acknowledgments

AIC thanks the University of Cumbria for administrative, technical support and the donations in kind towards producing this study.

Conflicts of Interest

The authors declare no conflict of interest.

References

  1. IPBES. Global assessment report on biodiversity and ecosystem services of the 733 Intergovernmental Science- Policy Platform on Biodiversity and Ecosystem Services. IPBES Secretariat, Bonn, Germany, 2019.
  2. Low, B.R.; Costanza, E.; Ostrom, J.; Wilson, S.C. Human-ecosystem interactions: a dynamic integrated model. Ecological economics 1999, 31, 227–242. [Google Scholar] [CrossRef]
  3. Milner-Gulland, E.; Mace, R. Conservation of Biological Resources; Blackwell Science: Oxford, London, UK, 1998. [Google Scholar]
  4. Brown, D. Participatory biodiversity conservation rethinking the strategy in the low potential areas of tropical Africa. Natural Resource Perspectives 1998, London, Overseas. [Google Scholar]
  5. Martin, A.; McGuire, S.; Sullivan, S. Global environmental justice and biodiversity conservation. The Geographical Journal 2013, 179, 122–131. [Google Scholar] [CrossRef]
  6. Walker, G. Environmental justice: concepts, evidence and politics. Routledge, London, UK, 2012.
  7. Chan, K.; Satterfield, T. Justice, equity and biodiversity. In The encyclopedia of biodiversity. Levin, S., Daily, G. C., Colwell, R. K., Eds. Elsevier, Oxford, UK 2007, pp.1-9.
  8. Casse, T.; Milhøj, A.; Ranaivoson, S.; Randriamanarivo, J. R. Causes of deforestation in southwestern Madagascar: what do we know? Forest Policy and Economics 2004, 6, 33–48. [Google Scholar] [CrossRef]
  9. Golden, C.D.; Bonds, M.H.; Brashares, J.S.; Rasolofoniaina, B. J. R.; Kremen, C. Economic Valuation of Subsistence Harvest of Wildlife in Madagascar. Conservation Biology 2014, 28, 234–243. [Google Scholar] [CrossRef] [PubMed]
  10. Norman, D. Man and tegu lizards in eastern Paraguay. Biological Conservation 1987, 41, 39–56. [Google Scholar] [CrossRef]
  11. IPBES. Summary for Policymakers of the Methodological Assessment Report on the Diverse Values and Valuation of Nature of the Intergovernmental Science-Policy Platform on Biodiversity and Ecosystem Services. Pascual, U. IPBES. Summary for Policymakers of the Methodological Assessment Report on the Diverse Values and Valuation of Nature of the Intergovernmental Science-Policy Platform on Biodiversity and Ecosystem Services. Pascual, U., Balvanera, P., Christie, M., Baptiste, B., González-Jiménez, D., Anderson, C.B., Athayde, S., Barton, D.N., Chaplin-Kramer, R., Jacobs, S., Kelemen, E., Kumar, R., Lazos, E., Martin, A., Mwampamba, T.H., Nakangu, B., O’Farrell, P., Raymond, C.M., Subramanian, S.M., Termansen, M., Van Noordwijk, M., Vatn, A. Eds. IPBES secretariat, Bonn, Germany, 2022. [CrossRef]
  12. Gibbons, J.W.; Scott, D.E.; Ryan, T.J.; Buhlmann, K.A.; Tuberville, T.D.; Metts, B.S.; Greene, J.L.; Mills, T.; Leiden, Y.; Poppy, S.; Winne, C.T. The Global Decline of Reptiles, Déjà Vu Amphibians. BioScience 2000, 50, 653–666. [Google Scholar] [CrossRef]
  13. Reuter, K.E.; LaFleur, M.; Clarke, T.A. Illegal lemur trade grows in Madagascar. Nature 2017, 541, 157. [Google Scholar] [CrossRef]
  14. Patel, E. R. Logging of rare Rosewood and Palisander (Dalbergia spp.) within Marojejy National Park, Madagascar. Madagascar conservation and development 2007, 2, 11–16. [Google Scholar]
  15. Jenkins, R.K.B.; Tognelli, M.F.; Bowles, P.; Cox, N.; Brown, J.L.; Chan, L.; Andreone, F.; Andriamazava, A.; Andriantsimanarilafy, R.R.; Anjeriniaina, M.; Bora, P.; Brady, L.; Hantalalaina, E.F.; Glaw, F.; Griffiths, R.A.; Hilton-Taylor, G.; Hoffmann, M.; Katariya1, V.; Rabibisoa, N.H.; Rafanomezantsoa, J.; Rakotomalala, D.; Rakotondravony, H.; Rakotondrazafy, N.A.; Ralambonirainy, J.; Ramanamanjato, J.-B.; Randriamahazo, H.; Randrianantoandro, J.C.; Randrianasolo, H.H.; Randrianirina, J.E.; Randrianizahana, H.; Raselimanana, A.P.; Rasolohery, A.; Ratsoavina, F.M.; Raxworthy, C.; Robsomanitrandrasana, E.; Rollande, F.; van Dijk, P.P.; Yoder, A.D.; Vences, M. Extinction Risks and the Conservation of Madagascar’s Reptiles. PLoS ONE 2014, 9, 100173. [Google Scholar] [CrossRef]
  16. Glaw, F.; Vences, M. Current counts of species diversity and endemism of Malagasy amphibians and reptiles. In Diversité et Endémisme à Madagascar, Lourenço, W. R.; Goodman, S. M. Eds. Mémoires de la Société de Biogéographie, Paris 2000, pp. 243–248.
  17. Vieites, D.R.; Wollenberg, K.C.; Andreone, F.; Köhler, J.; Glaw, F.; Vences, M. Vast underestimation of Madagascar’s biodiversity evidenced by an integrative amphibian inventory. PNAS 2009, 106, 8267–8272. [Google Scholar] [CrossRef] [PubMed]
  18. Goodman, S. M. (Ed.) The New Natural History of Madagascar. Princeton University Press, Princeton, New Jersey, USA, 2022.
  19. Rabesahala Horning, N. Madagascar’s biodiversity conservation challenge: from local- to national-level dynamics. Environmental Sciences 2008, 5, 109–128. [Google Scholar] [CrossRef]
  20. Ferraro, P.J. The local costs of establishing protected areas in low-income nations: Ranomafana National Park, Madagascar. Ecological Economics 2002, 43, 261–275. [Google Scholar] [CrossRef]
  21. Shyamsundar, P.; Kramer, R. Biodiversity conservation – at what cost? A study of households in the vicinity of Madagascar’s Mantadia National Park. Ambio 1997, 26, 180–184. [Google Scholar]
  22. Nicoll, M.E.; Langrand, O. Madagascar: revue de la conservation et des aires protégées. WWF, Gland, Switzerland, 1989.
  23. Durbin, J.; Ralambo, J.A. The role of local people in the successful maintenance of protected areas in Madagascar. Environmental Conservation 1994, 21, 115–120. [Google Scholar] [CrossRef]
  24. Gardner, C. J.; Nicoll, M. E.; Mbohoahy, T.; Oleson, K. L. L.; Ratsifandrihamanana, A. N.; Ratsirarson, J.; de Roland, L.-A. R.; Virah-Sawmy, M.; Zafindrasilivonona, B.; Davies, Z. G. Protected areas for conservation and poverty alleviation: experiences from Madagascar. Journal of Applied Ecology 2013, 50, 1289–1294. [Google Scholar] [CrossRef]
  25. Keane, A.; Ramarolahy, A. A.; Jones, J.P.G.; Milner-Gulland, E. J. ; Evidence for the effects of environmental engagement and education on knowledge of wildlife laws in Madagascar. Conservation Letters 2011, 4, 55–63. [Google Scholar] [CrossRef]
  26. Dixon, J.A.; Pagiola, S. Ecotourism: Incentives for conservation success. Environment department, World Bank, 2001.
  27. Buckley, R. Conservation tourism. CABI, Cambridge, USA, 2010.
  28. Ormsby, A.; Mannle, K. Ecotourism benefits and the role of local guides at Masoala National Park, Madagascar. Journal of Sustainable Tourism 2006, 14, 271–287. [Google Scholar] [CrossRef]
  29. Neudert, R.; Ganzhorn, J.U.; Wathold, F. Global benefits and local costs – The dilemma of tropical forest conservation: A review of the situation in Madagascar. Environmental Conservation 2017, 44, 82–96. [Google Scholar] [CrossRef]
  30. Kasim, A. Towards a wider adoption of environmental responsibility in the hotel sector. International Journal of Hospitality & Tourism Administration 2007, 8, 25–49. [Google Scholar]
  31. Platt, J. R.; Ring-tailed lemurs threatened by illegal pet trade. Scientific American 2015. Available online: https://blogs.scientificamerican.com/extinction-countdown/ring-tailed-lemurs-pet-trade/ (accessed on 1 December 2019).
  32. Moorhouse, T.P.; Dahlsjö, C.A.; Baker, S.E.; D’Cruze, N.C.; Macdonald, D.W. The customer isn’t always right— conservation and animal welfare implications of the increasing demand for wildlife tourism. PloS One 2015, 10, e0138939. [Google Scholar] [CrossRef] [PubMed]
  33. Moorhouse, T.; D’Cruze, N. C.; Macdonald, D. W. Unethical use of wildlife in tourism: What’s the problem, who is responsible, and what can be done? Journal of Sustainable Tourism 2017, 25, 505–516. [Google Scholar] [CrossRef]
  34. Peters, J. Sharing national park entrance fees: Forging new partnerships in Madagascar. Society & Natural Resources 1998, 11, 517–530. [Google Scholar]
  35. Wollenberg, K.C.; Jenkins, R.K.; Randrianavelona, R.; Rampilamanana, R.; Ralisata, M.; Ramanandraibe, A.; Ravoahangimalala, O.R.; Vences, M. On the shoulders of lemurs: pinpointing the ecotouristic potential of Madagascar’s unique herpetofauna. Journal of Ecotourism 2011, 10, 101–117. [Google Scholar] [CrossRef]
  36. Brady, L.D.; Griffiths, R.A. Status Assessment of Chameleons in Madagascar. IUCN Species Survival Commission. IUCN, Cambridge, UK, 1999.
  37. Robinson, J.E.; Fraser, I. M.; St. John, F.A.V.; Randrianantoandro, J. C.; Andriantsimanarilafy, R. R.; Razafimanahaka, J. H.; Griffiths, R.A.; Roberts, D.L. Wildlife supply chains in Madagascar from local collection to global export. Biological Conservation 2018, 226, 144–152. [Google Scholar] [CrossRef]
  38. Ganzhorn, J.; Manjoazy, T.; Paplow, O.; Randrianavelona, R.; Razafimanahaka, J.; Ronto, W.; Walker, R. Rights to trade for species conservation: Exploring the issue of the radiated tortoise in Madagascar. Environmental Conservation 2015, 42, 291–293. [Google Scholar] [CrossRef]
  39. Waeber, P. O.; Wilmé, L. Madagascar rich and intransparent. Madagascar conservation and development 2013, 8, 52–54. [Google Scholar] [CrossRef]
  40. Morgan, J.; Chng, S. Rising internet-based trade in the Critically Endangered ploughshare tortoise Astrochelys yniphora in Indonesia highlights need for improved enforcement of CITES. Oryx 2018, 52, 744–750. [Google Scholar] [CrossRef]
  41. Innes, J. L. Madagascar rosewood, illegal logging and the tropical timber trade. Madagascar Conservation & Development 2010, 5, 6–10. [Google Scholar]
  42. Rabemananjara, F. C. E.; Raminosoa, N. R.; Ramilijaona, O. R.; Rakotondravony, D.; Andreone, F.; Bora, P.; Carpenter, A. I.; Glaw, F.; Razafindrabe, T.; Vallan, D.; Vieites, D. R.; Vences, M. Malagasy poison frogs in the pet trade: a survey of levels of exploitation of species in the genus Mantella. In Conservation Strategy for the Amphibians of Madagascar proceedings, Andreone, F. Ed. Monografie del Museo Regionale di Scienze Natural di Torino 2008, pp.277-300.
  43. Carpenter, A.I.; Robson, O. Madagascan amphibians as a wildlife resource and their potential as a conservation tool: species and numbers exported, revenue generation and bio-economic models to explore conservation benefits. In Conservation Strategy for the Amphibians of Madagascar proceedings, Andreone, F. Ed. Monografie del Museo Regionale di Scienze Natural di Torino 2008, pp.357-376.
  44. Carpenter, A.I.; Rowcliffe, M.; Watkinson, A.R. The dynamics of the global trade in chameleons. Biological Conservation 2004, 120, 295–305. [Google Scholar] [CrossRef]
  45. Carpenter, A.I.; Andreone, F.; Moore, R.D.; Griffiths, R.A. A review of the global trade in amphibians: The types of trade, levels and dynamics in CITES listed species. Oryx 2014, 48, 565–574. [Google Scholar] [CrossRef]
  46. Carpenter, A.I. The ecology and exploitation of chameleons in Madagascar. PhD thesis, University of East Anglia, UK, 2003.
  47. Carpenter, A.I.; Robson, O.; Rowcliffe, M.; Watkinson, A.R. The impacts of international and national governance on a traded resource: A case study of Madagascar and its chameleon trade. Biological Conservation 2005, 123, 279–287. [Google Scholar] [CrossRef]
  48. Andreone, F.; Carpenter, A.I.; Cox, N.; du Preez, L.; Freeman, K.; Furrer, S.; Carcia, G.; Glaw, F.; Glos, J.; Kohler, J.; Mendelson, J.R.; Mercurio, V.; Mittermeier, R.A.; Moore, R.D.; Rabibisoa, N.H.C.; Randriamahazo, H.; Randrianasolo, H.; Raminosoa, N.R.; Ramilijaona, O.R.; Raxworthy, C.J.; Vallan, D.; Vence, M.; Vieites, D.R.; Wheldon, C. The challenge of conserving amphibian megadiversity in Madagascar. PLoS Biology 2008, 6, 0943–0946. [Google Scholar] [CrossRef] [PubMed]
  49. Vaglica, V.; Sajeva1, M.; McGough, H. N.; Hutchison, D.; Russo, C.; Gordon, A. D.; Ramarosandratana, A., V.; Stuppy, W.; Smith, M., J. Monitoring internet trade to inform species conservation actions. Endangered Species Research 2017, 32, 223–235. [Google Scholar] [CrossRef]
  50. World’s top exports. Madagascar’s Top 10 Exports. 2019. Available online: http://www.worldstopexports.com/madagascars-top-10-exports/ (accessed on 15 October 2019).
  51. Jacobson, S. K.; Lopez, A. F. Biological impacts of ecotourism: Tourists and nesting turtles in Tortuguero National Park, Costa Rica. Wildlife Society Bulletin 1994, 22, 414–419. [Google Scholar]
  52. Meissner, A. M.; Christiansen, F.; Martinez, E.; Pawley, M. D.; Orams, M. B.; Stockin, K. A. Behavioural effects of tourism on oceanic common dolphins, Delphinus sp., in New Zealand: The effects of markov analysis variations and current tour operator compliance with regulations. PLoS One 2015, 10, e0116962. [Google Scholar] [CrossRef]
  53. Author 1, A.; Author 2, B. Title of the chapter. In Book Title, 2nd ed.; Editor 1, A., Editor 2, B., Eds.; Publisher: Publisher Location, Country, 2007; Volume 3, pp. 154–196. [Google Scholar]
  54. Author 1, A.; Author 2, B. Book Title, 3rd ed.; Publisher: Publisher Location, Country, 2008; pp. 154–196. [Google Scholar]
  55. Author 1, A.B.; Author 2, C. Title of Unpublished Work. Abbreviated Journal Name.
  56. Author 1, A.B. (University, City, State, Country); Author 2, C. (Institute, City, State, Country). Personal communication, 2012.
  57. Author 1, A.B.; Author 2, C.D.; Author 3, E.F. Title of Presentation. In Proceedings of the Name of the Conference, Location of Conference, Country, Date of Conference (Day Month Year).
  58. Author 1, A.B. Title of Thesis. Level of Thesis, Degree-Granting University, Location of University, Date of Completion.
  59. Title of Site. Available online: URL (accessed on Day Month Year).
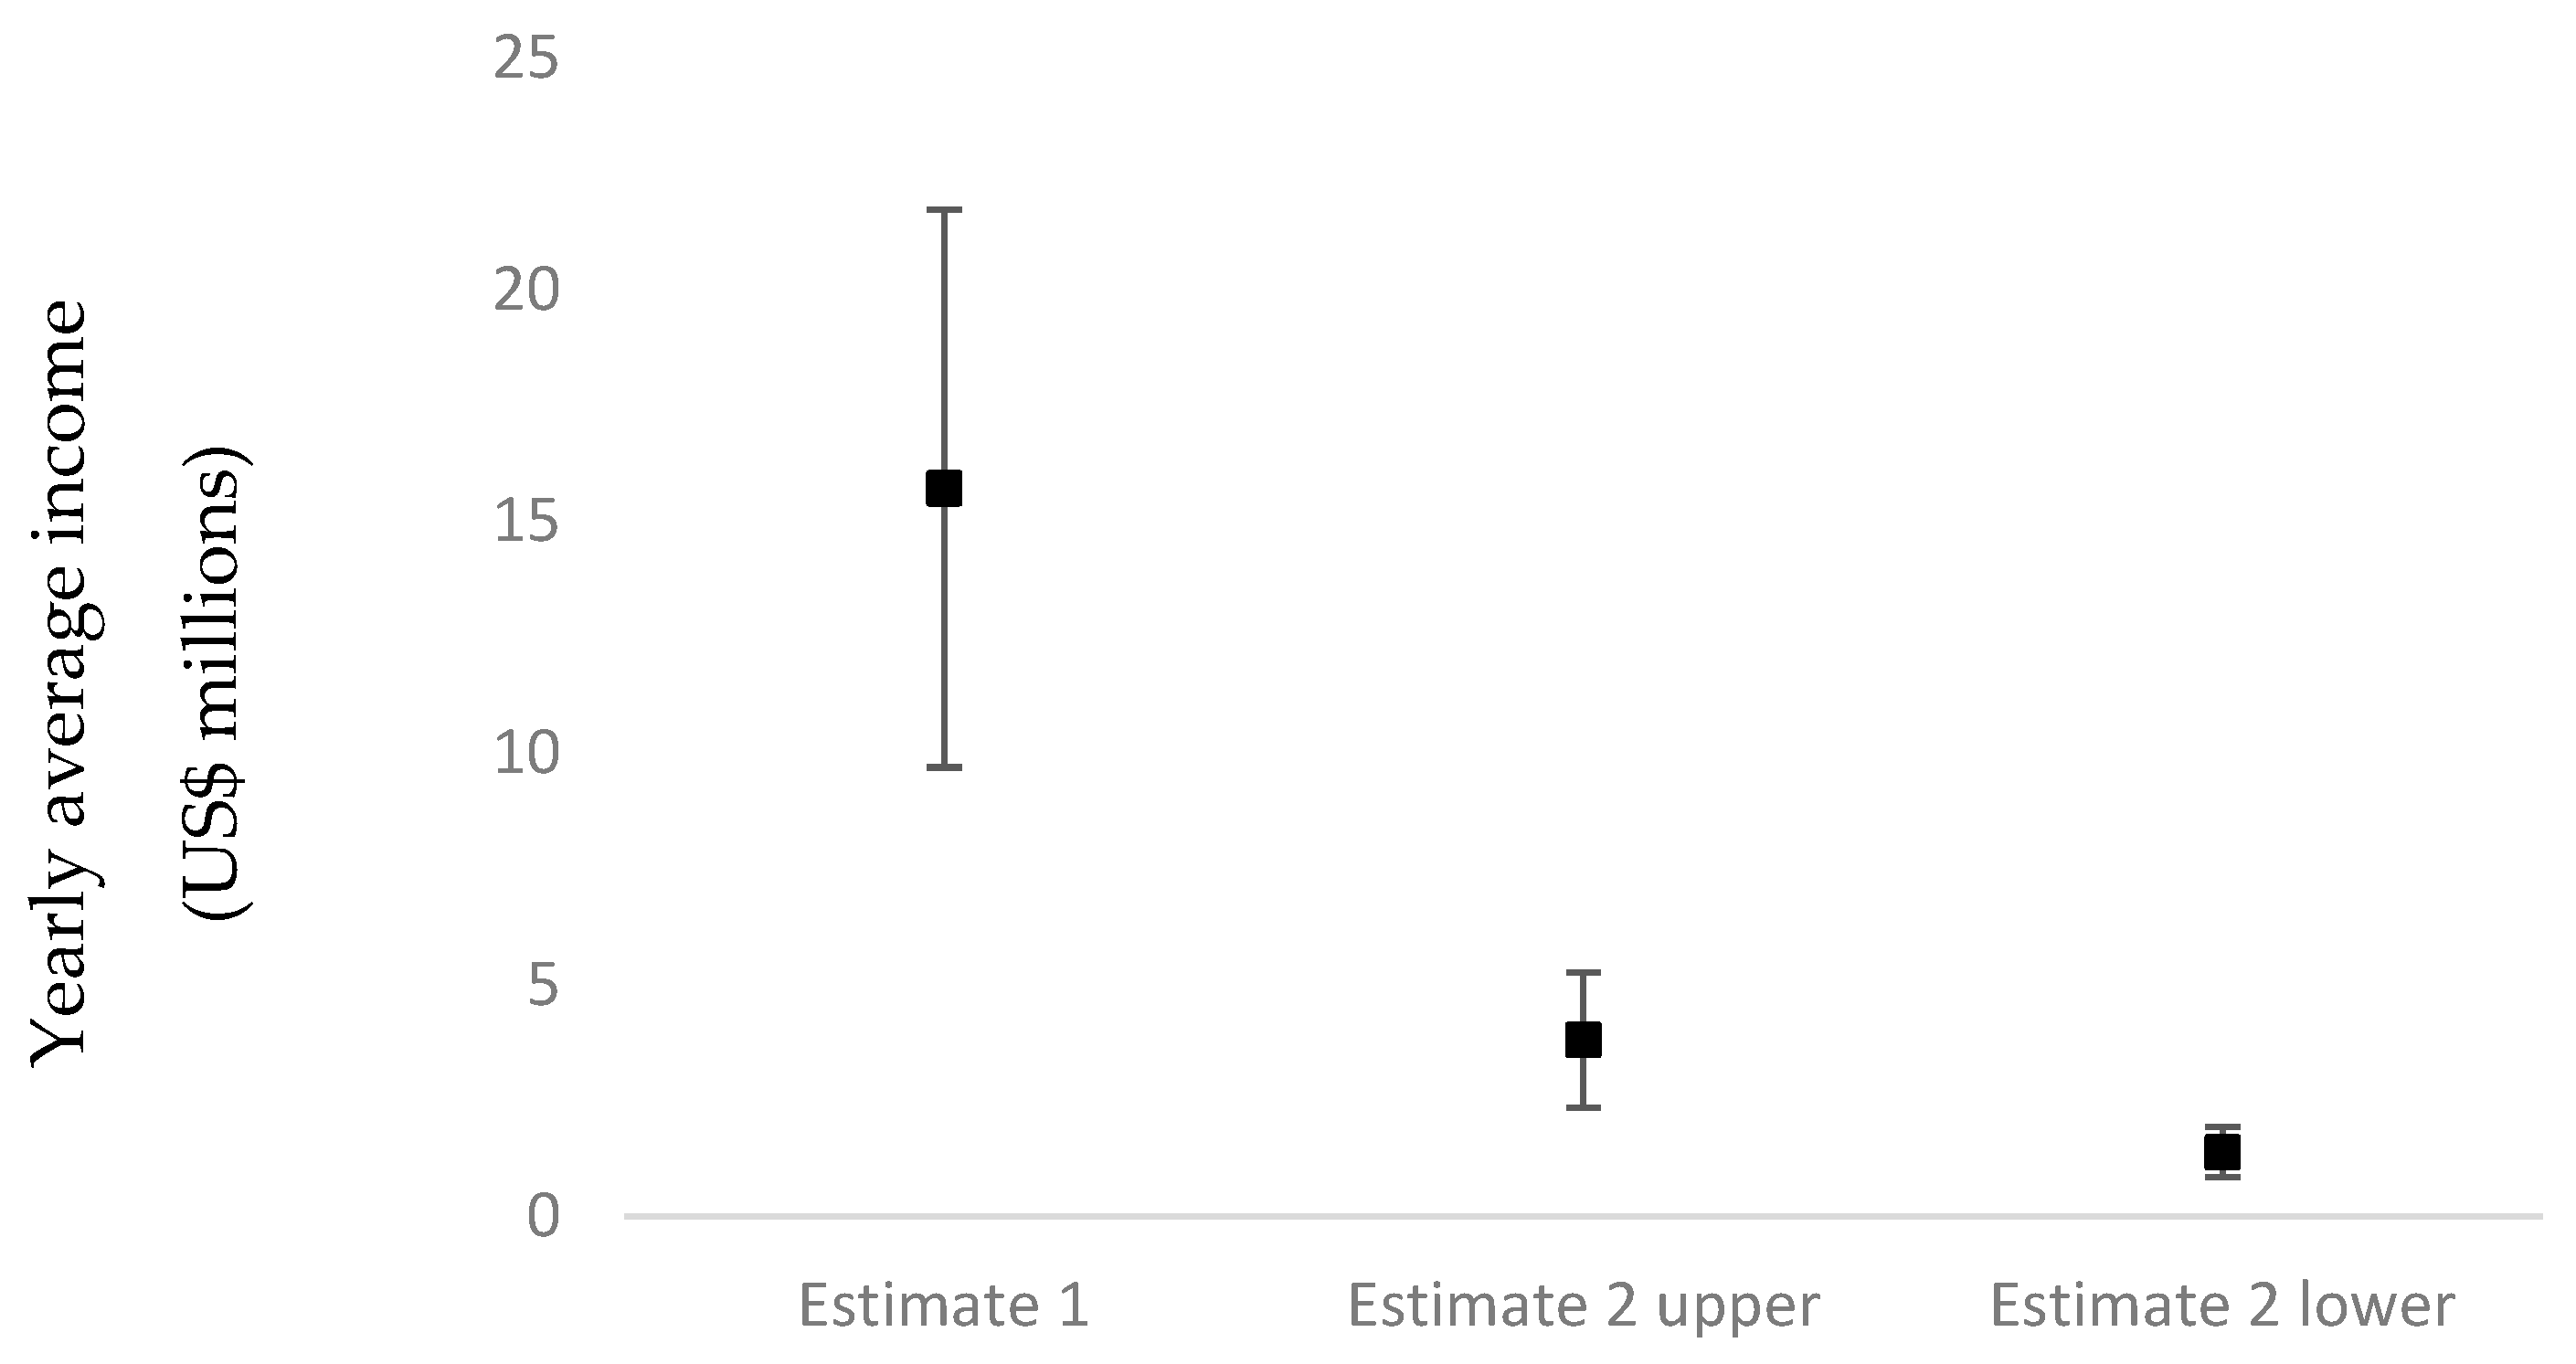
Figure 1. The average yearly level of income (+/- Std. Dev.) generated using the published conversion values of Wollenberg et al., [35] (Estimate 1) and Dixon and Pagiola, [26] (Estimate 2 upper and lower values) to estimate ecotourism income, based on the original source tourist data from the Ministère du Tourisme, Madagascar. All values in US$ at 2019 rates.
Preprints 82661 g001

2007 2008 2009 2010 2011 2012 2013 2014 2015 2016 2017 2018
TABLE 1a
Number of tourists arriving on Madagascar* 344348 375010 162687 19052 225055 255942 196375 222374 244321 293185 255460 291299
Tourist income generation (US$ millions) 313 459,65 178,5 211,1 262,49 279,81 390,42 649,62 585,38 748,297 668,262
TABLE 1b
Number of ecotourists (17%; Wollenberg et al., 2011) 58539 63752 27657 3239 38259 43510 33384 37804 41535 49841 43428 49521
* denotes data source Ministère du Tourisme/PAF/ADEMA/RAVINALA AIR-PORTS/APMF (col-lated Oct 2019).
Figure 2. The trends in yearly estimated values (in US$) from ecotourism on Madagascar using the published conversion values of Wollenberg et al., [35] (Estimate 1) and Dixon and Pagiola, [26] (Estimate 2 upper and lower values). All values in US$ at 2019 rates.
Preprints 82661 g002
Figure 3. The trends in yearly estimated values (in US$) from ecotourism on Madagascar using the published conversion values of Wollenberg et al., [35] (Estimate 1) and Dixon and Pagiola, [26] (Estimate 2 upper and lower values). All values in US$ at 2019 rates.
Preprints 82661 g003
Figure 4. Each of the plant genera with species and numbers reported within the import data (one genera, Alluaudia, was reported in the import data set but with no data reported) exported from Madagascar between 2007 and 2018 (Source: CITES Database).
Preprints 82661 g004
Figure 5. Yearly income estimates from the live trade in CITES listed animals and plants exported from Madagascar between 2007 and 2018 (Source: CITES Database).
Preprints 82661 g005
Figure 6. Yearly income estimates from both the combined live trade in CITES listed animals and plants exported from Madagascar and the mean estimated income from ecotourism to Madagascar between 2007 and 2018.
Preprints 82661 g006
Table 1. The yearly number of tourists visiting Madagascar between 2007-2018 and the levels of income generated from those tourists, in US$ as reported, in 2019, by Madagascar’s Ministère du Tourisme.
2007 2008 2009 2010 2011 2012 2013 2014 2015 2016 2017 2018
TABLE 1a
Number of tourists arriving on Madagascar* 344348 375010 162687 19052 225055 255942 196375 222374 244321 293185 255460 291299
Tourist income generation (US$ millions) 313 459,65 178,5 211,1 262,49 279,81 390,42 649,62 585,38 748,297 668,262
TABLE 1b
Number of ecotourists (17%; Wollenberg et al., 2011) 58539 63752 27657 3239 38259 43510 33384 37804 41535 49841 43428 49521
* denotes data source Ministère du Tourisme/PAF/ADEMA/RAVINALA AIR-PORTS/APMF (col-lated Oct 2019).
Table 2. The top five traded genera within the animals grouping exported from Madagascar over the period 2007-2018, showing the total number traded within a genus and the four highest traded species within that genus and the percentage that species accounts for within the genus in trade. (Source: CITES).
Genus Species No. %
Mantella 68798
Mantella betsileo 22737 33.0
Mantella baroni 21110 30.7
Mantella nigricans 7306 10.6
Mantella pulchra 5969 8.7
Phelsuma 65329
Phelsuma lineata 17939 27.5
Phelsuma quadriocellata 15534 23.8
Phelsuma laticauda 14124 21.6
Phelsuma madagascariensis 10563 16.2
Furcifer 59722
Furcifer pardalis 19029 31.9
Furcifer lateralis 15908 26.6
Furcifer oustaleti 11268 18.9
Furcifer verrucosus 11312 18.9
Uroplatus 30335
Uroplatus sikorae 10059 33.2
Uroplatus fimbriatus 6170 20.3
Uroplatus phantasticus 5002 16.5
Uroplatus ebenaui 4202 13.9
Brookesia 6686
Brookesia superciliaris 1927 28.8
Brookesia stumpffi 1657 24.8
Brookesia thieli 1326 19.8
Brookesia therezieni 1169 17.5
Table 3. The top four traded genera within the plants grouping exported from Madagascar over the period 2007-2018, showing the total number traded within a genus and the four highest traded species within that genus and the percentage that species accounts for trade within the genus. (Source: CITES).
Genus Species No. %
Pachypodium 22967
Pachypodium spp 7532 32.8
Pachypodium brevicaule 4219 18.4
Pachypodium densiflorum 4232 18.4
Pachypodium eburneum 2352 10.2
Euphorbia 11608
Euphorbia primulifolia 3184 27.4
Euphorbia spp 1222 10.5
Euphorbia itremensis 1088 9.4
Euphorbia guillauminiana 1029 8.9
Operculicarya 4175
Operculicarya pachypus 3337 79.9
Operculicarya decaryi 430 10.3
Operculicarya hyphaenoides 408 9.8
Angraecum 1632
Angraecum urschianum 113 6.9
Angraecum breve 95 5.8
Angraecum germinyanum 95 5.8
Angraecum teretifolium 89 5.5
Table 4. The value (US$ in 2019) of the reptile and amphibian trade to the three actor levels (Coll. = collector, Inter. = intermediary, Export. = exporter) in-volved with the wildlife trade on Madagascar for the period between 2007 to 2018.
Preprints 82661 i001
Ϯ denotes dedicated chameleon prices extracted from Carpenter et al. (47) adjusted for inflation in US$.; * denotes dedicated Mantella prices extracted from Rabemananjara et al. (42) adjusted for inflation in Malagasy Ariary before conversion to US$ .
Disclaimer/Publisher’s Note: The statements, opinions and data contained in all publications are solely those of the individual author(s) and contributor(s) and not of MDPI and/or the editor(s). MDPI and/or the editor(s) disclaim responsibility for any injury to people or property resulting from any ideas, methods, instructions or products referred to in the content.
Copyright: This open access article is published under a Creative Commons CC BY 4.0 license, which permit the free download, distribution, and reuse, provided that the author and preprint are cited in any reuse.
Prerpints.org logo

Preprints.org is a free preprint server supported by MDPI in Basel, Switzerland.

Subscribe

© 2024 MDPI (Basel, Switzerland) unless otherwise stated