1. Introduction
Water is an important substance for human and all organism on the planet especially for our biochemical development, although its usage cover other aspects such as human recreational needs (Meride and Ayenew, 2016; Kılıç, 2020). Keeping the recreational quality up to the best environmental standards is necessary for public health (Department of Water Affairs and Forestry, 1996), as every deterioration of the environment, including water, can result in devastating effects on those who are exposed to it. Throughout the year, tourists come in numbers to enjoy the unique and natural beauty of the Western Cape Province in south Africa, and Plettenberg Bay receives a considerable of these tourists who engage in water activities for leisure. Therefore, the quality of recreational water should be maintained for both residents' and tourists' interests.
The National Environmental Management Act 107 Of 1998 defines the environment as the surroundings in which humans exist which are inclusive of the land, water, and the atmosphere, and taking into account the interrelationships, combinations, properties, and conditions of all organisms that exist within the surroundings. Yigitcanlar and Kamruzzaman (2015) suggest that since the mid-20th century, the main threat to the sustainability of natural resources has been globalisation and human population growth. This threat has been observed in the apparent change in the structure and functioning of the environment through various human activities.
Globalisation on the other hand is the process by which people and communities come to experience an increasingly common economic, social, and cultural environment (Jorgenson & Kick, 2006). From this definition, the process affects everybody throughout the world. As a result of globalisation, the world experiences vast amounts of overconsumption, overproduction, waste disposal, and international travel which in turn puts a strain on the environment. The same can be seen with the overproduction and consumption of household cleaning chemicals, the raw materials needed to manufacture these chemicals, the processes involved in manufacturing them and their ultimate disposal put a strain on the environment. In many areas such as the Plettenberg Bay area municipal; wastewater is disposed of in surface waters and this water usually contains the raw materials used to manufacture household cleaning chemicals, and this influences the quality of water parameters over a period (Opere et al., 2020).
During holiday seasons Plettenberg Bay host a significant number of holiday makers who enjoy engaging in a number of recreational activities, both on land and in water (King, 2021). One of the major tourist attractions for holiday makers is water activities as Plettenberg Bay has three Blue Flag status beaches. Tourists enjoy swimming, boating, whale watching, and many other recreational activities, maintaining a pollution-free environment for the enjoyment of tourists and community members is very important (Lück, 2009). If the overall water quality of recreational water in Plettenberg Bay is degraded it will have a negative impact on the economy of Plettenberg Bay as tourists will prefer to go elsewhere.
Pollutants come in various. For example, household cleaning chemicals are often poured down drains and are carried away by sewage systems to wastewater treatment plants (Opere et al., 2020), where they undergo a series of treatments before being discharged as effluent into water bodies which are also used for recreational purposes. According to Edokpayi et al. (2017), wastewater effluents are major contributors to a variety of water pollution problems. The poor quality of wastewater effluents is responsible for the degradation of the receiving surface water body. Wastewater effluent should be treated efficiently to avoid adverse health risks to humans and the aquatic ecosystem.
The area of Plettenberg Bay is a tourist destination, and the local economy relies heavily on recreational activities such as swimming (Cornelissen, 2005). Engaging in recreational activities in water that is contaminated represents a considerable risk to public and ecological health (Pakasi, 2018). In the case of recreational water, for example, allowing contamination may lead to severe damage to the reputation of a tourist attraction such as Plettenberg. Such an event will have ripple economic effects on areas of Plettenberg Bay which depends heavily on tourism and reactional water activities. Therefore, it is important to analyse the water quality within the area as it relates to the recreational activities’ guidelines and other relevant standards. The monitoring and analysis of the quality of recreational water will provide a comprehensive characterization of the water quality which will assist to determine the potential impacts of contaminated recreational on tourism.
Given the above-mentioned, the purpose of this study is to evaluate the surface water quality of the greater Plettenberg Bay area to ensure that the surface water quality is compliant with relevant water quality standards. The specific objectives are of this study are to: (1) assess the proximate parameters of (Ammonia, Suspended Solids, Conductivity, Nitrates/Nitrites and pH) water in the greater Plettenberg Bay, (2) assess the microbial water quality by analysing the E. coli parameters, and (3) provide a possible solution to reduce the impact of possibly polluted recreational waters in the Plettenberg Bay area.
2. Materials and Methods
Study area
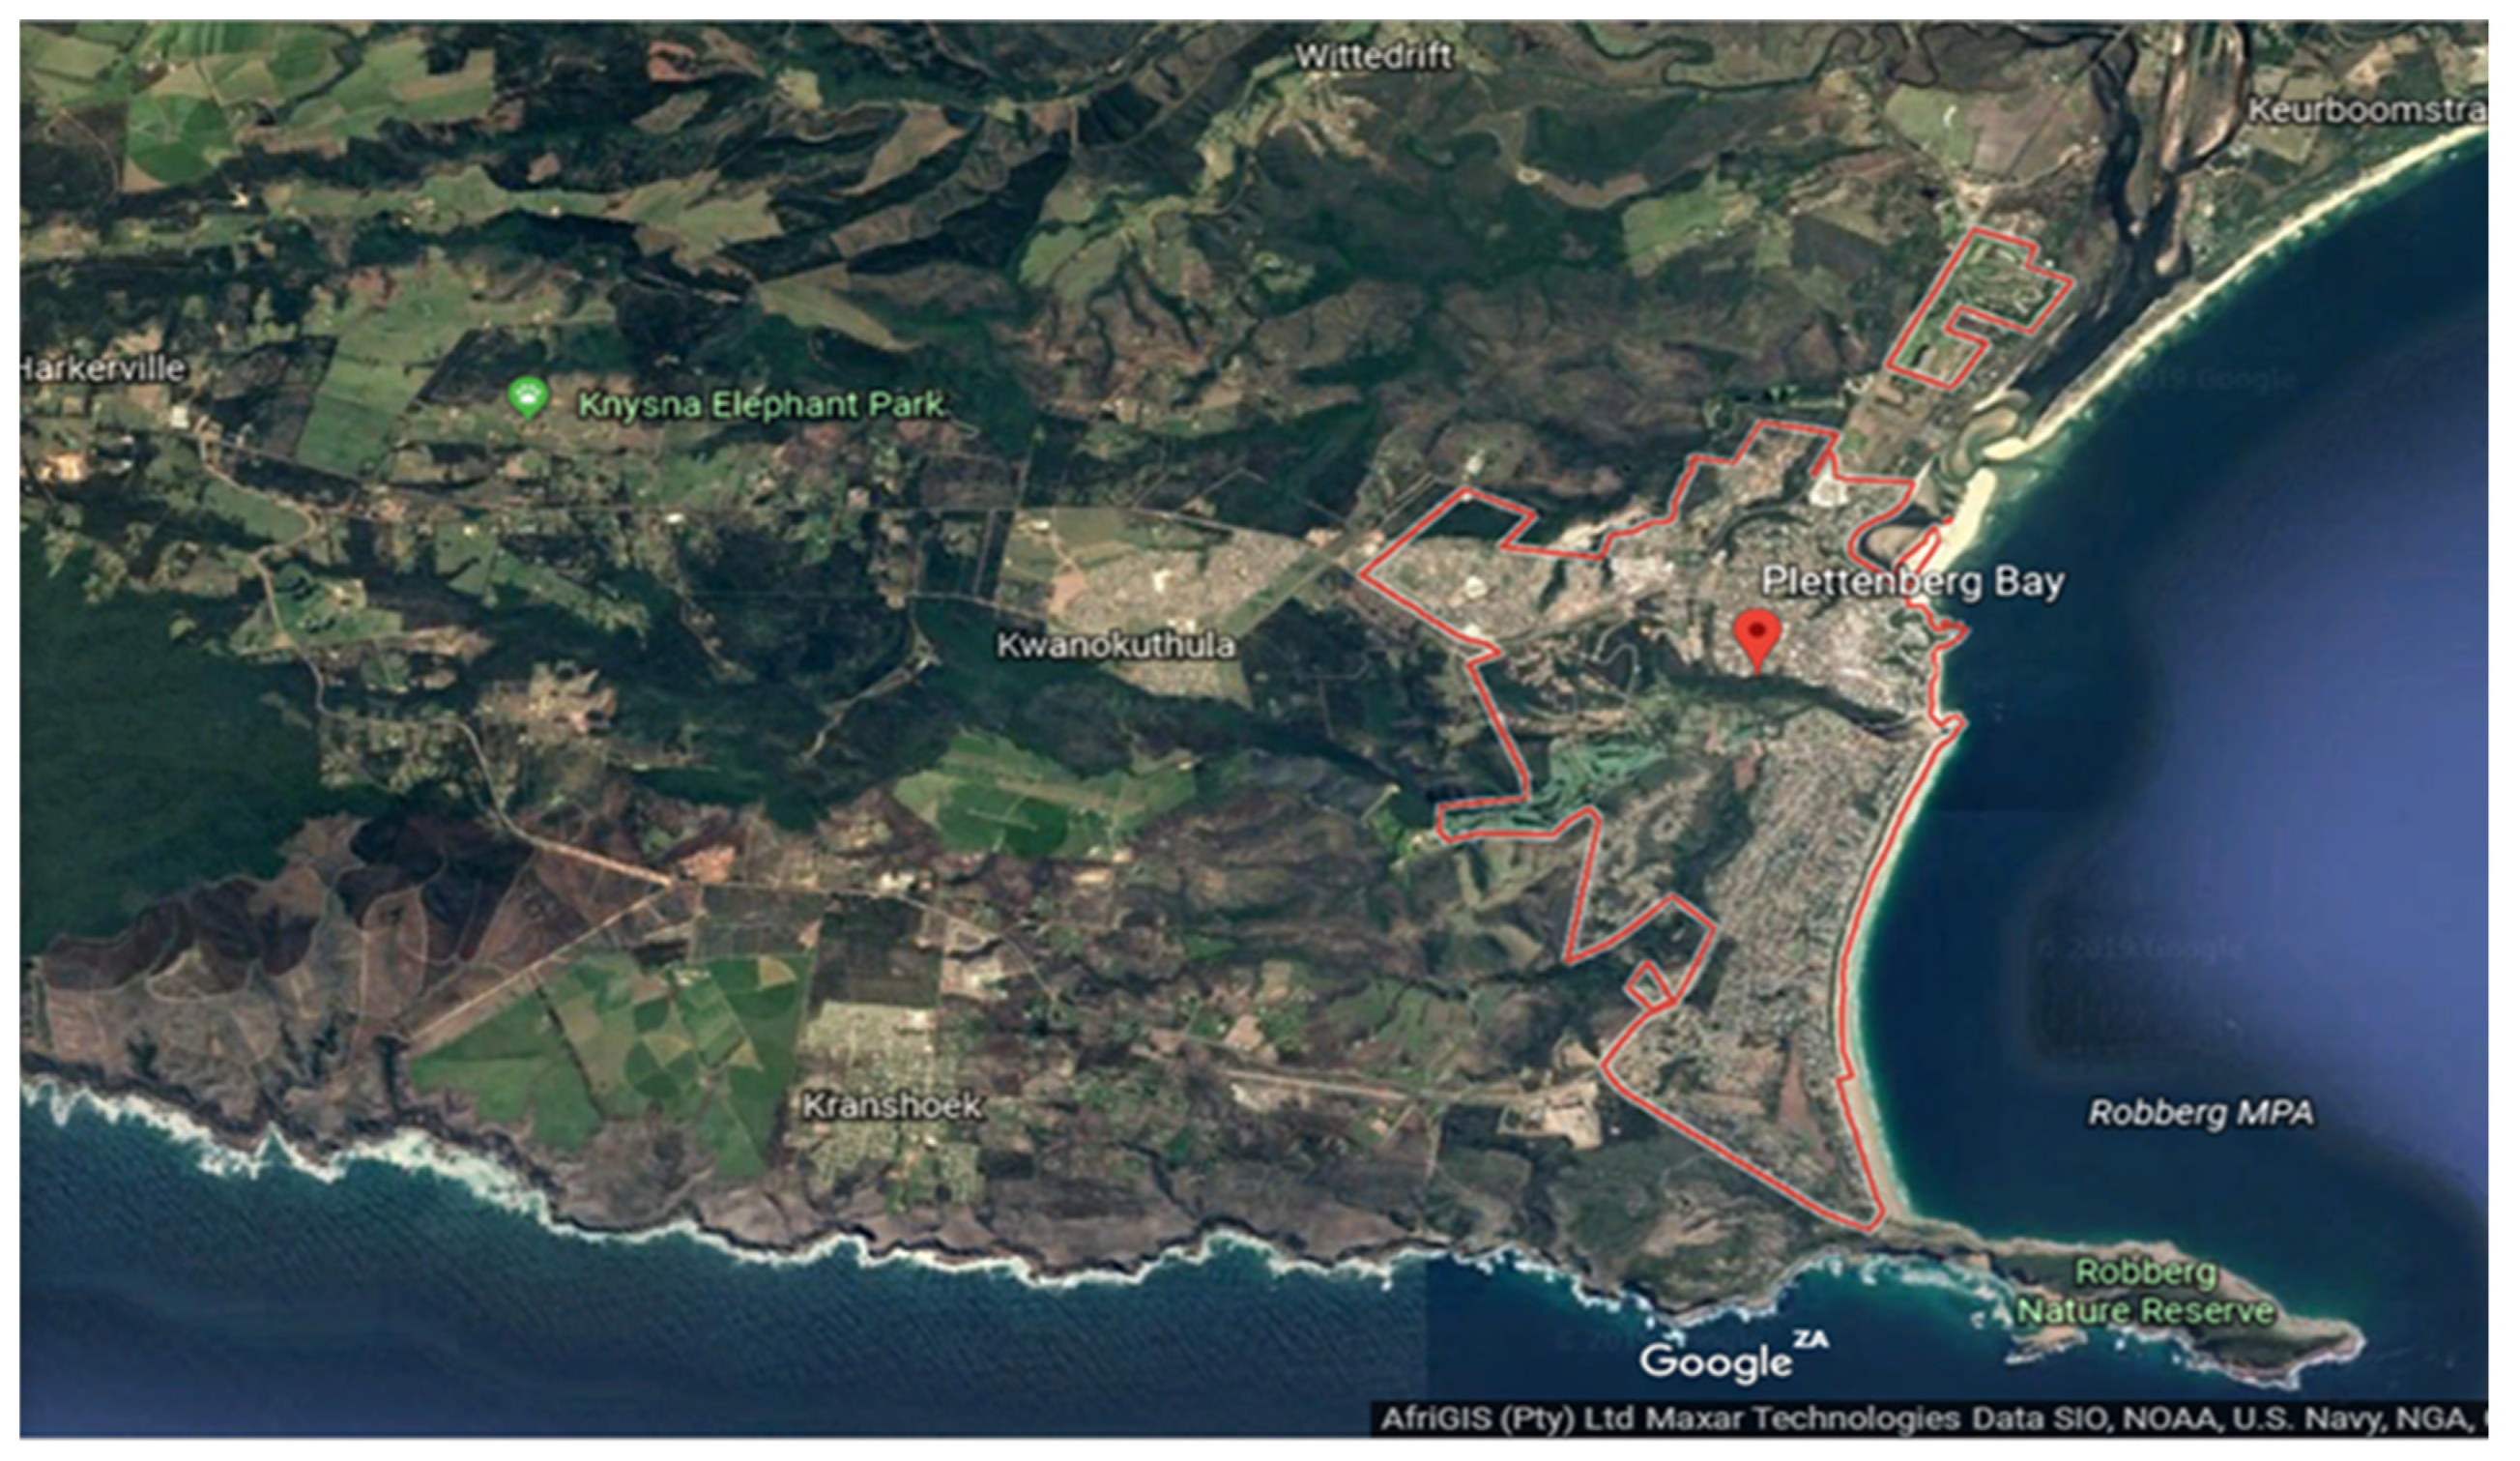
Plettenberg Bay is situated along the Garden Route of the Southern Cape Coast. Plettenberg Bay is bounded on the South-Western side by a rocky headland and the Robberg Peninsula. Four estuaries are present, namely, the Keurbooms estuary which is formed by the confluence of the Bitou and Keurbooms rivers, the Piesang estuary, the Sout River estuary, and the Groot River estuary. The local vegetation predominantly consists of Cape Fynbos and indigenous forests.
Plettenberg Bay has a population of 59,157 people according to the community survey in 2016. Tourism is one of the main sources of economic growth in Plettenberg Bay as it contributes significantly to the local economy. Plettenberg Bay is a well-known tourist destination, people travel from all over the world to spend their holidays in Plettenberg Bay which allows for various employment and business opportunities for the local people.
Figure 2.
Local map of Plettenberg Bay.
Figure 2.
Local map of Plettenberg Bay.
The Bitou Municipality forms part of the Garden Route District Municipality’s water quality control programme, where the water quality monitoring programme strives to provide accurate and consistent information to the public on water quality performance per specific water supply system. The microbial, chemical and physical quality of water is determined through sampling at different sources towards a “catchment to consumer” monitoring approach. Sources of sampling include boreholes, rivers, dams, reservoirs, water purification works and taps.
Data source and collection approach
Field work was not conducted for this study, data were sourced from existing datasets available at the Bitou Municipality waterworks department. The municipality has an extensive monitoring programme through which water quality data are collected every month. The data were collected by the municipality cover a period of five years during which sampling was done on a monthly and seasonal basis. Each sample was compared to identify any similarities and trends that may arise thereof. The study focused on six specific water quality parameters as they are considered to be major indicators of the quality of a water body (Jang et al., 2017; Omer, 2020; Saalidong et al., 2022). They are Ammonia, Suspended Solids, Conductivity, Nitrates/Nitrites, pH, and E. coli. The water quality parameters that are being specifically considered in each sample are:
Ammonia can be measured using ammonia sensors or ion-specific electrodes (ISE).
Suspended Solids are commonly measured through filtration and weighing of a water sample.
Conductivity is usually measured using the 2-AC Bipolar method, where the current that passes through a solution between a pair of electrodes is measured.
Nitrates/Nitrites are commonly measured using ion-specific sensors (ISE) that can detect the nitrate activity in a water sample.
pH which is measured through the colourimetric method; colourimetric paper is dipped in a water sample and the obtained colour is computed to find a respective value.
E. coli is measured through an EPA-approved method known as Colilert, the water sample is mixed with a reagent powder and incubated for 24 hours, after 24 hours the sample is held under UV light to check for fluorescence.
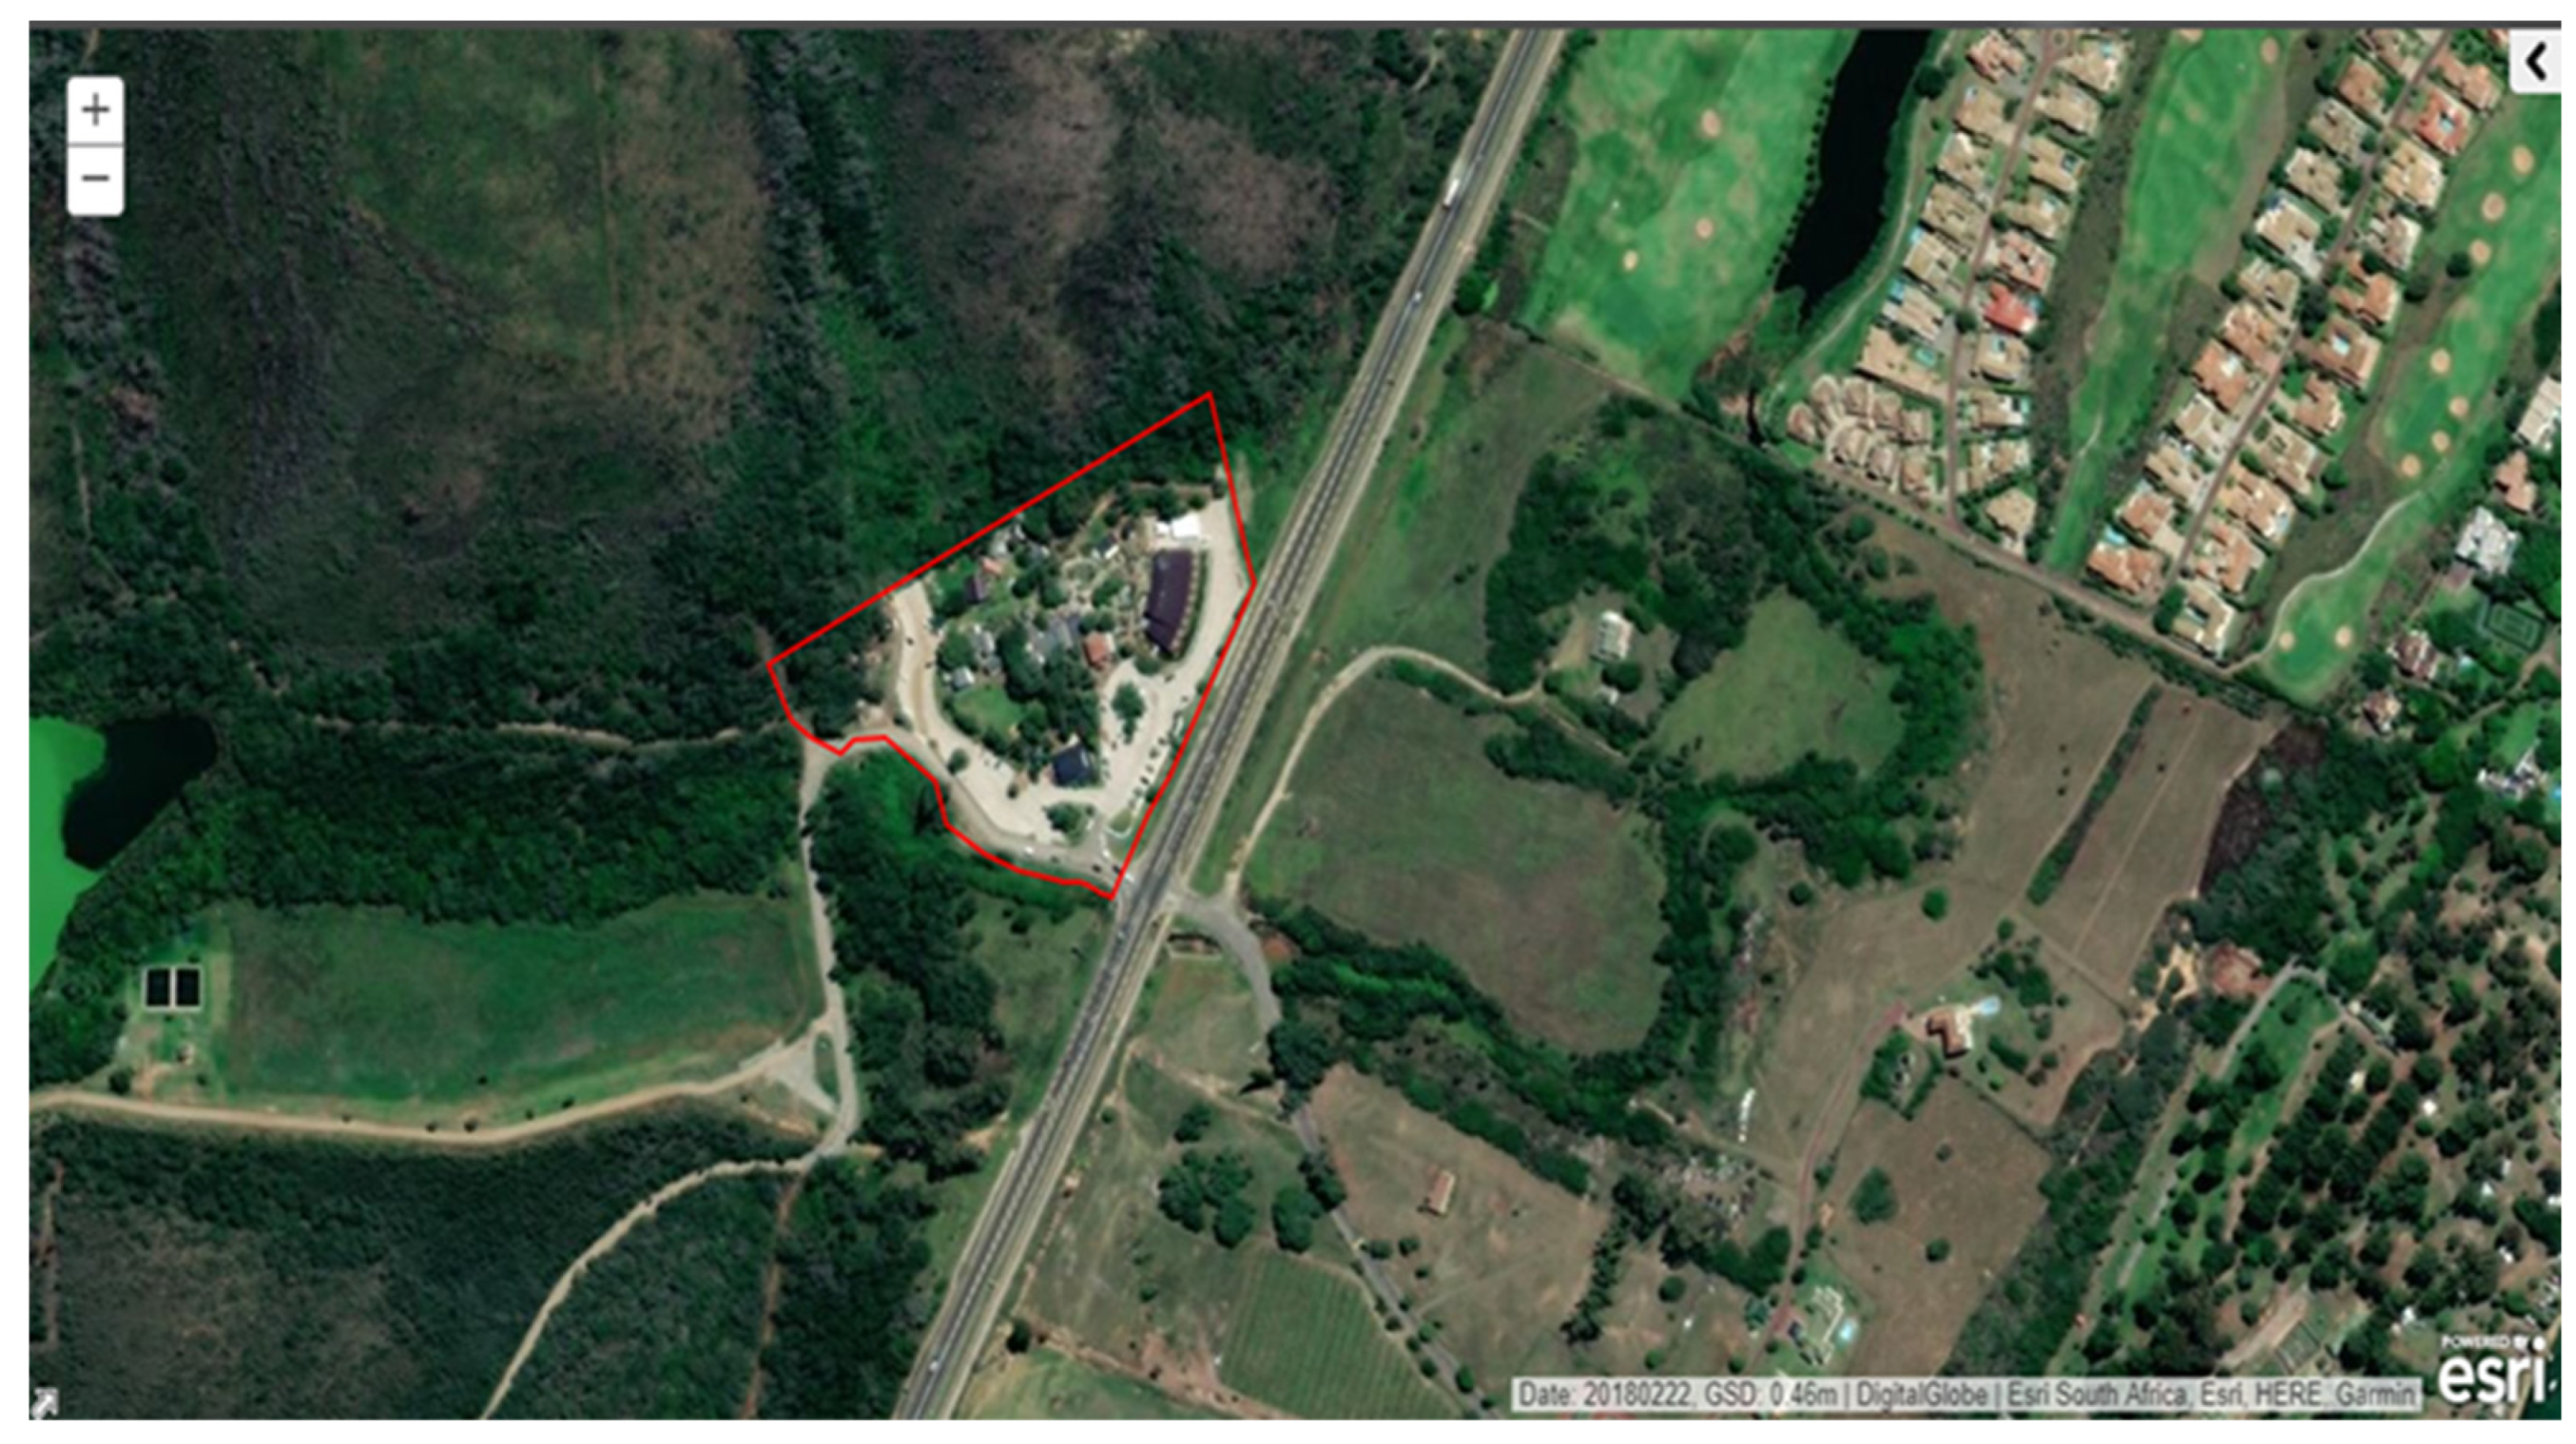
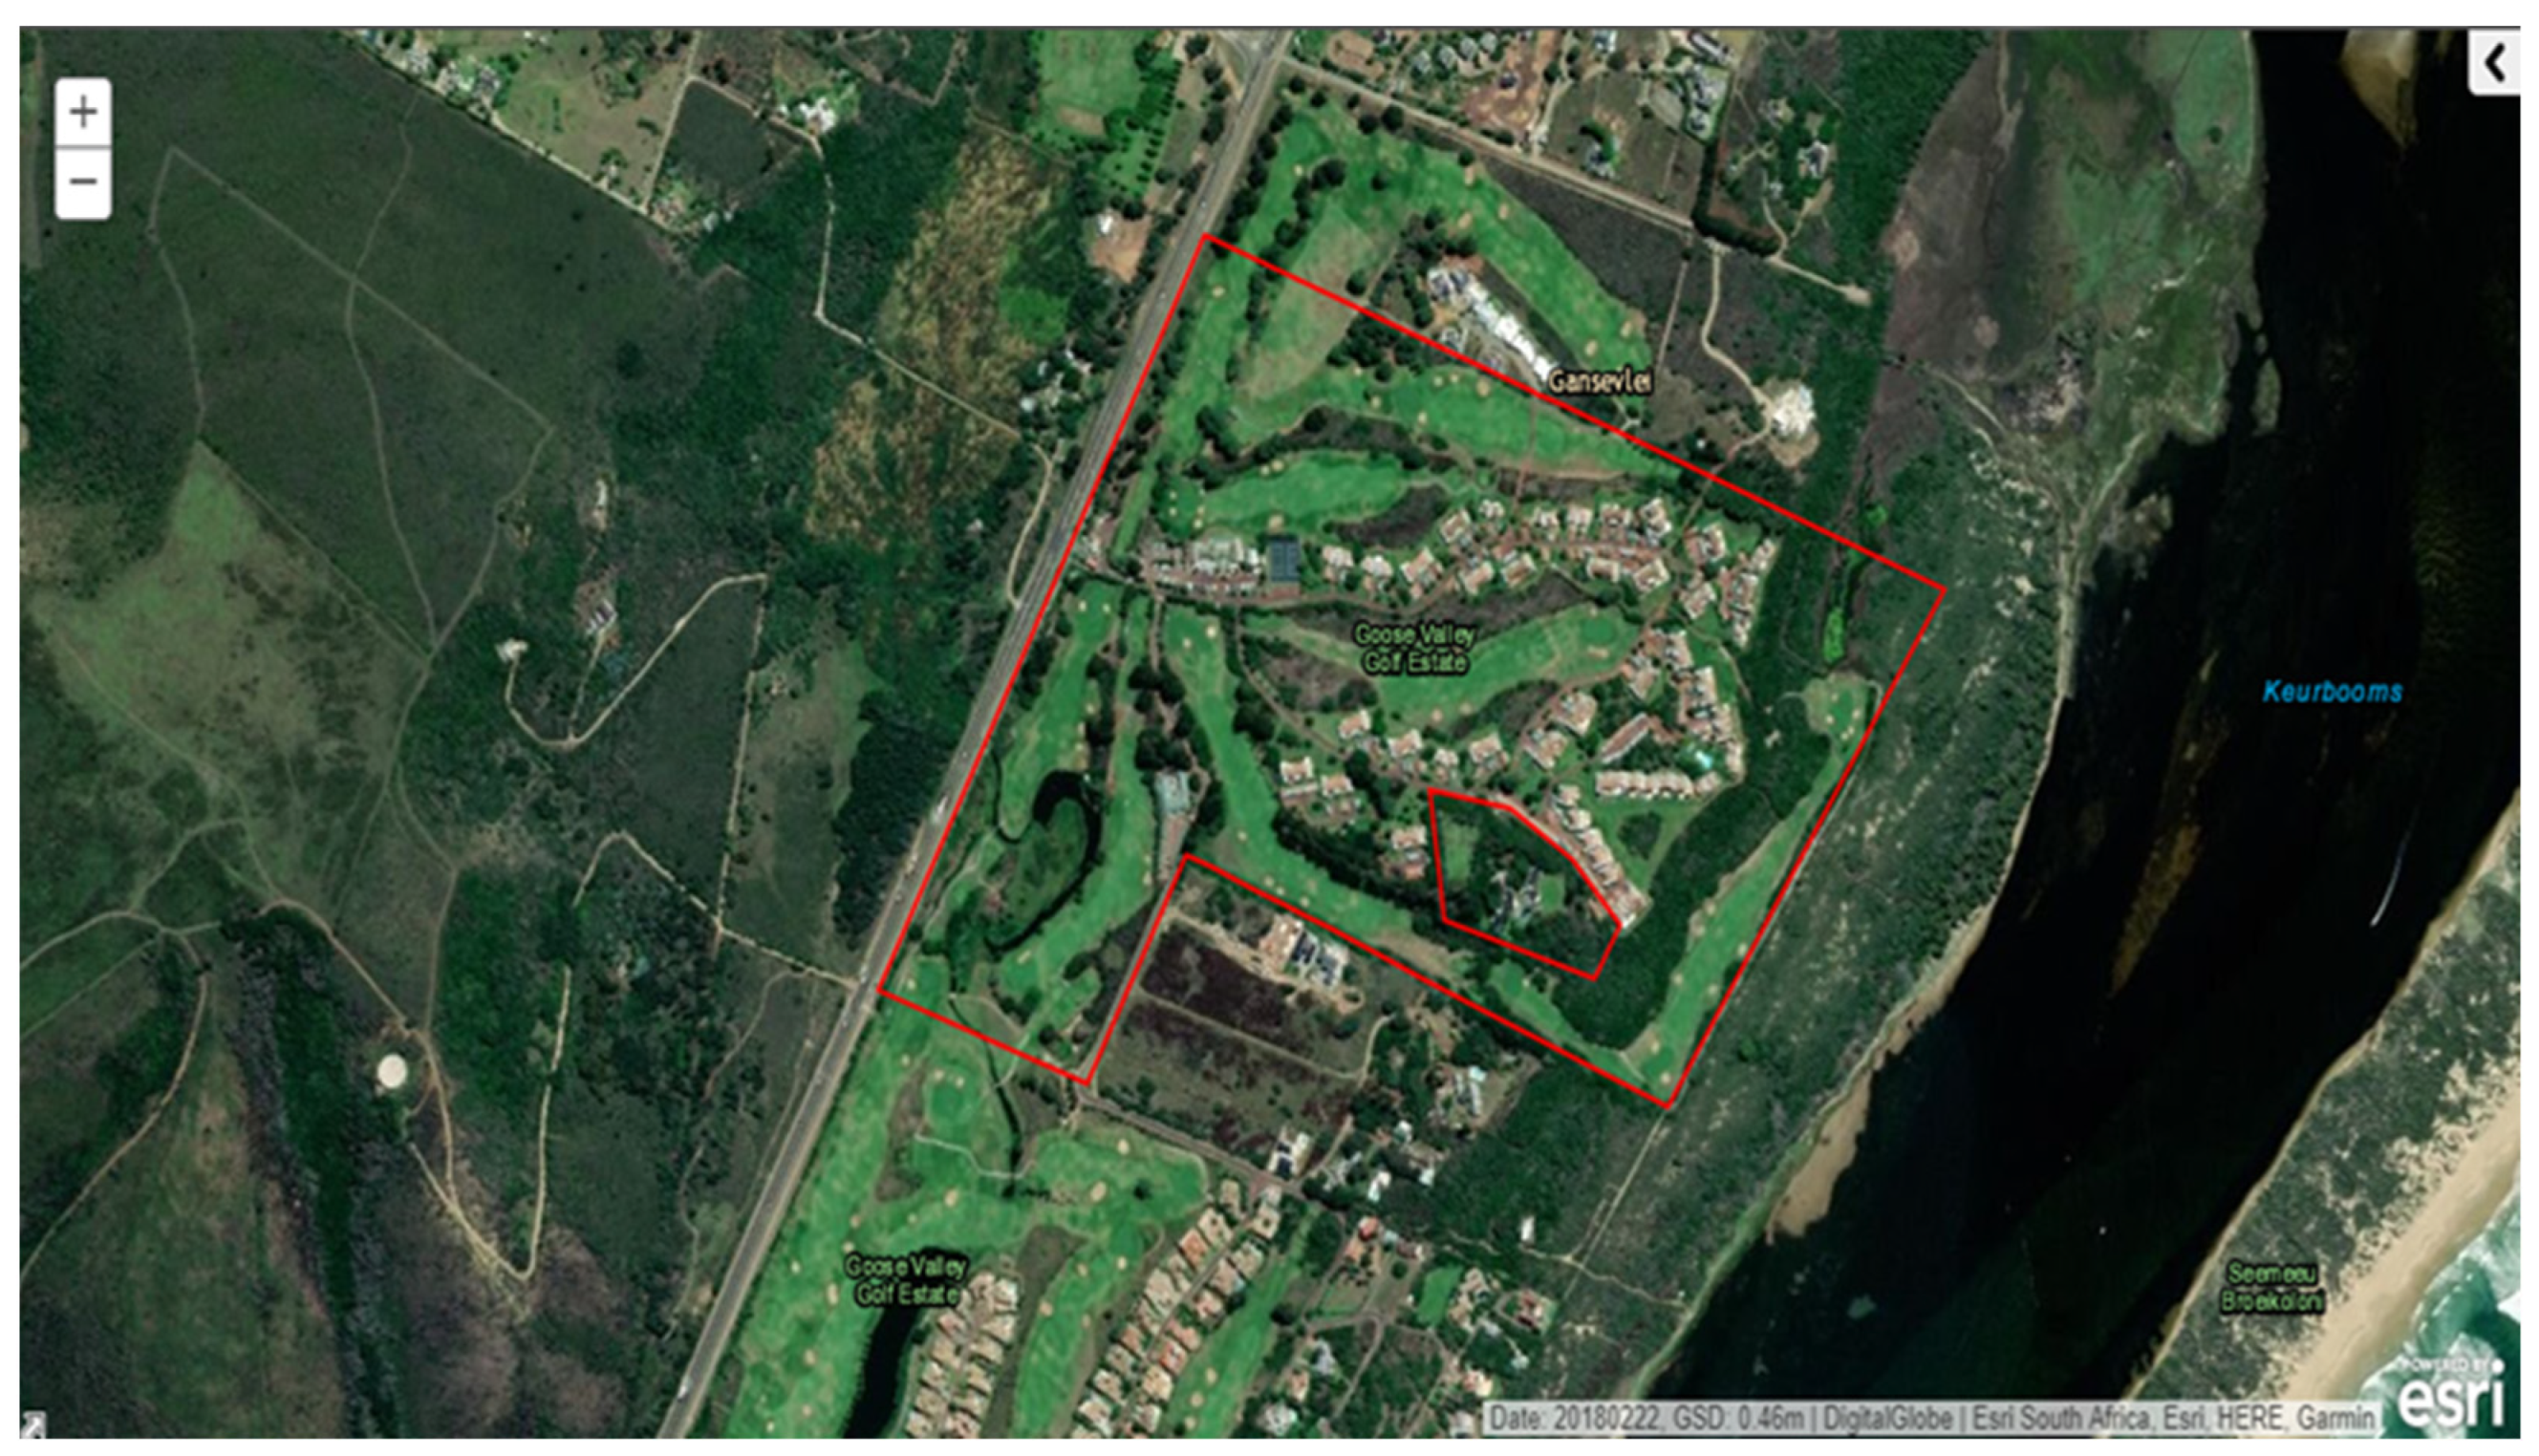
The municipality’s waterworks department collects samples from five various points within the Plettenberg Bay area. Two samples are collected at the water purification plants, sample one is collected from the raw wastewater before treatment and sample two is collected from the final effluent post-treatment. Sample three is collected from The Old Nick which serves as a market and shopping area. Sample four is collected from The Goose Valley Golf Estate which serves as a residential area and sample five is collected from The Gans River which is where the final effluent is discharged after treatment.
Figure 3.
Old Nick sites.
Figure 3.
Old Nick sites.
Figure 4.
The Goose Valley Golf Estate sampling site.
Figure 4.
The Goose Valley Golf Estate sampling site.
A total of 100 samples were collected using 500 ml glass storage container bottles that have been sterilised in an autoclave were used in collecting the water samples. Samples were transported in an ice cooler box to the municipal lab and immediately underwent a bacteriological analysis for any bacteria that may be present.
Water quality analysis
In this study, data on water quality in the Plettenberg Bay region obtained from the Bitou municipality’s waterworks department are analysed against the guidelines for drinking water. The Department of Water Affairs and Forestry (1996) explains there are no recommended universal indicator organisms for recreational water quality as too many variables are involved. While the focus of this study is on recreational water, water used for all human purposes must protect health. Therefore, this research used the guidelines for drinking water to assess the water quality in the study area based on the highest standards of drinking water quality. This choice is also motivated by recreational water users who often ingest or come in full contact with water. The SANS 241: 2015 standards for drinking water adopted to analyse data in this study is shown in
Table 1. It describes each parameter, unit of measurement, risk, and standard limit for water quality.
According to the World Health Organisation (2006), the pH is very important in determining the corrosivity of water, a high pH value will result in high levels of corrosion. Humans exposed to waters with high pH values will result in eyes, skin, and gastrointestinal irritation.
3. Results
This chapter presents and discusses water quality data obtained from the analysis of water samples taken in the greater Plettenberg Bay area by the Bitou Municipality’s water works department. Presentation and discussion of obtained data will result in identifying any patterns or trends that may arise over a five-year period (2016-2020) in the water quality of recreational water in the greater Plettenberg Bay area.
3.1. Ammonia
Table 2 shows the ammonia concentrations that were measured every month for five years (2016-2020). In table 2, each month has a total of five entries, representing the average concentration of ammonia for each year. An overall yearly average of these entries was calculated and used to
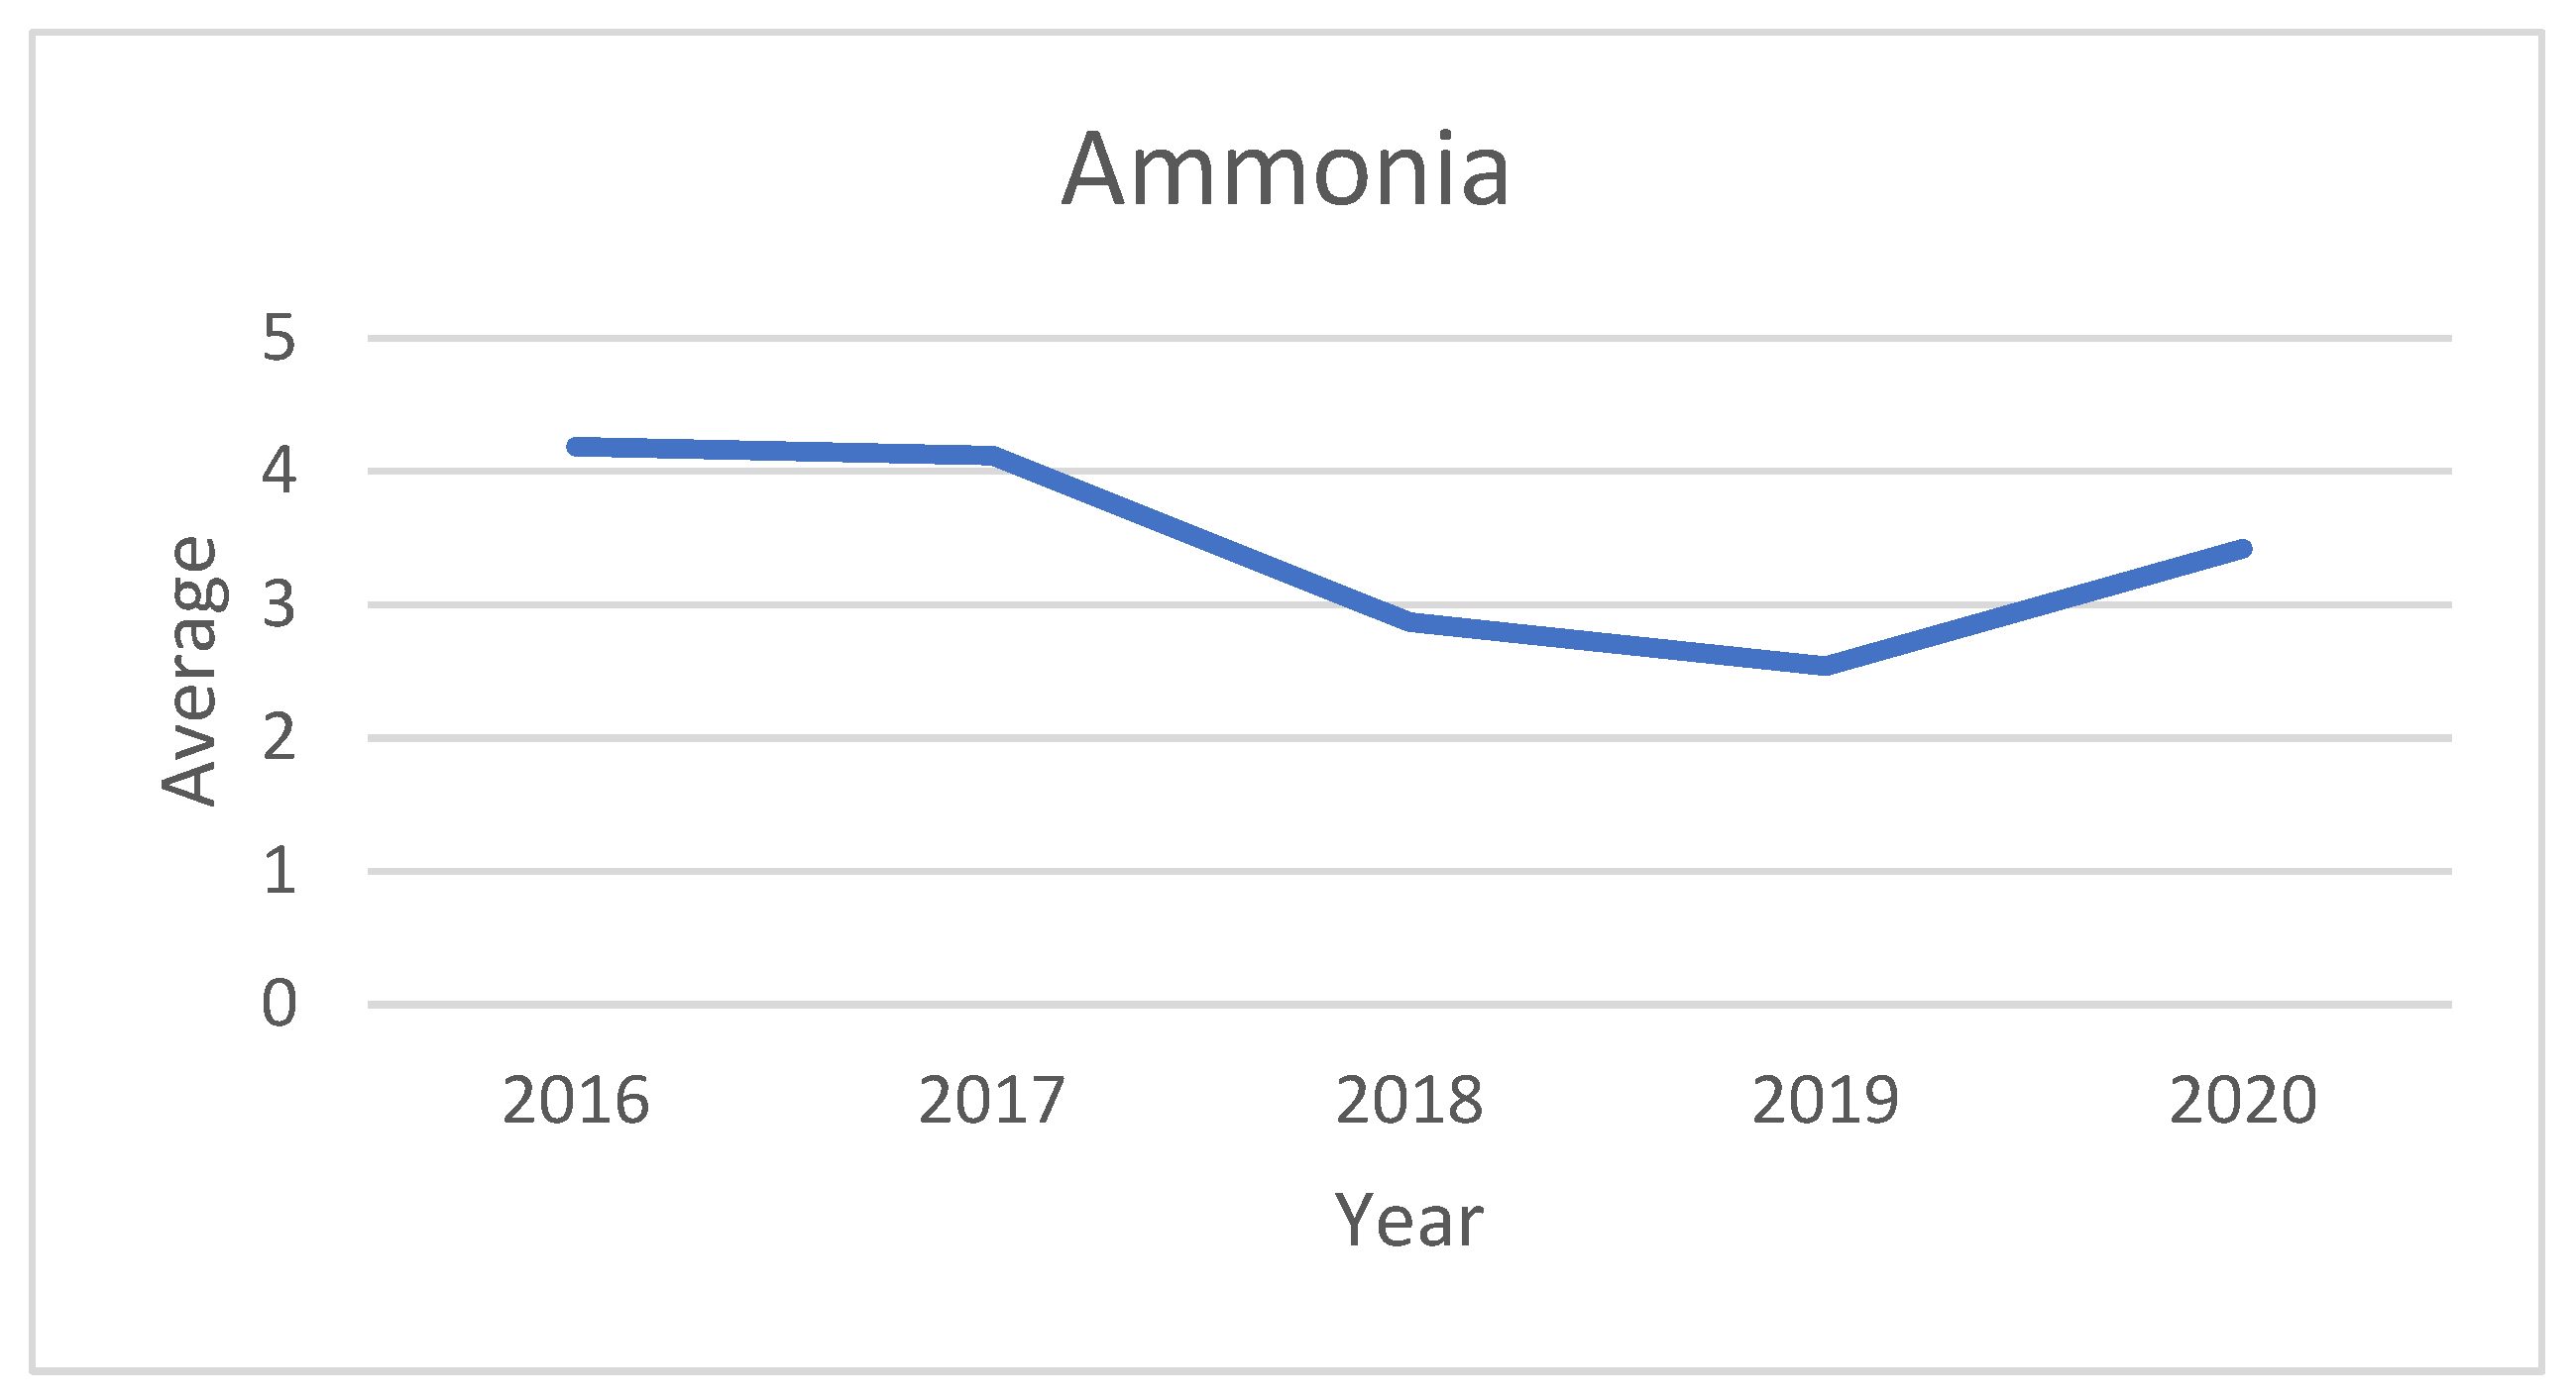
Figure 5. The bar chart gives a clearer visual depiction of the overall trend of ammonia over the five-year period, with the plotting of the overall yearly averages on the y-axis and the years on the x-axis. From observing Table 2 and
Figure 5, one can see the general trend that ammonia follows, where in 2016 the concentration measured slightly above 4 mg/L and between 2017 and 2019 the concentration decreases to exactly 2.54 mg/L. It is worth noting that in September of 2017, there was a significant increase of up to 8.80 mg/L in the concentration of ammonia, this was almost four times August’s concentration and at least eight times October’s concentration, making it a significant anomaly. This anomaly can be attributed to the presence of residual nitrogen compounds post-purification as stated by (Della Rocca et al., 2007). Ammonia concentrations were steadily decreasing until the year 2020 when there was a slight increase of exactly 0.88 mg/L from the year 2019. Humans are less sensitive to ammonia in water, but long-term exposure to water containing more than 1 mg/L can cause internal organ damage and any solution with a concentration greater than 1000 mg/L can cause severe burns and scarring to sensitive skin. (Oregon Department of Human Services, 2000). Ammonia's impact on recreational activities
| Month |
Determinant |
2016 |
2017 |
2018 |
2019 |
2020 |
| Jan |
Ammonia |
4,35 |
4,32 |
0,37 |
2,44 |
4,07 |
| Feb |
Ammonia |
5,07 |
4,57 |
2,46 |
2,71 |
3,44 |
| Mar |
Ammonia |
2,07 |
3,92 |
3,00 |
3,22 |
2,79 |
| Apr |
Ammonia |
0,95 |
5,30 |
0,78 |
1,61 |
4,31 |
| May |
Ammonia |
5,62 |
4,16 |
2,65 |
4,29 |
4,38 |
| Jun |
Ammonia |
5,28 |
3,68 |
2,41 |
2,20 |
2,95 |
| Jul |
Ammonia |
3,83 |
3,89 |
3,47 |
1,38 |
3,90 |
| Aug |
Ammonia |
4,01 |
2,15 |
3,42 |
0,76 |
2,46 |
| Sep |
Ammonia |
3,68 |
8,80 |
4,83 |
1,34 |
1,34 |
| Oct |
Ammonia |
5,56 |
1,29 |
4,45 |
2,80 |
2,80 |
| Nov |
Ammonia |
4,77 |
3,81 |
2,28 |
2,65 |
3,78 |
| Dec |
Ammonia |
5,15 |
3,50 |
4,32 |
5,07 |
4,80 |
| Year Avg. |
Ammonia |
4,19 |
4,12 |
2,87 |
2,54 |
3,42 |
3.2. Total Suspended Solids (TSS)
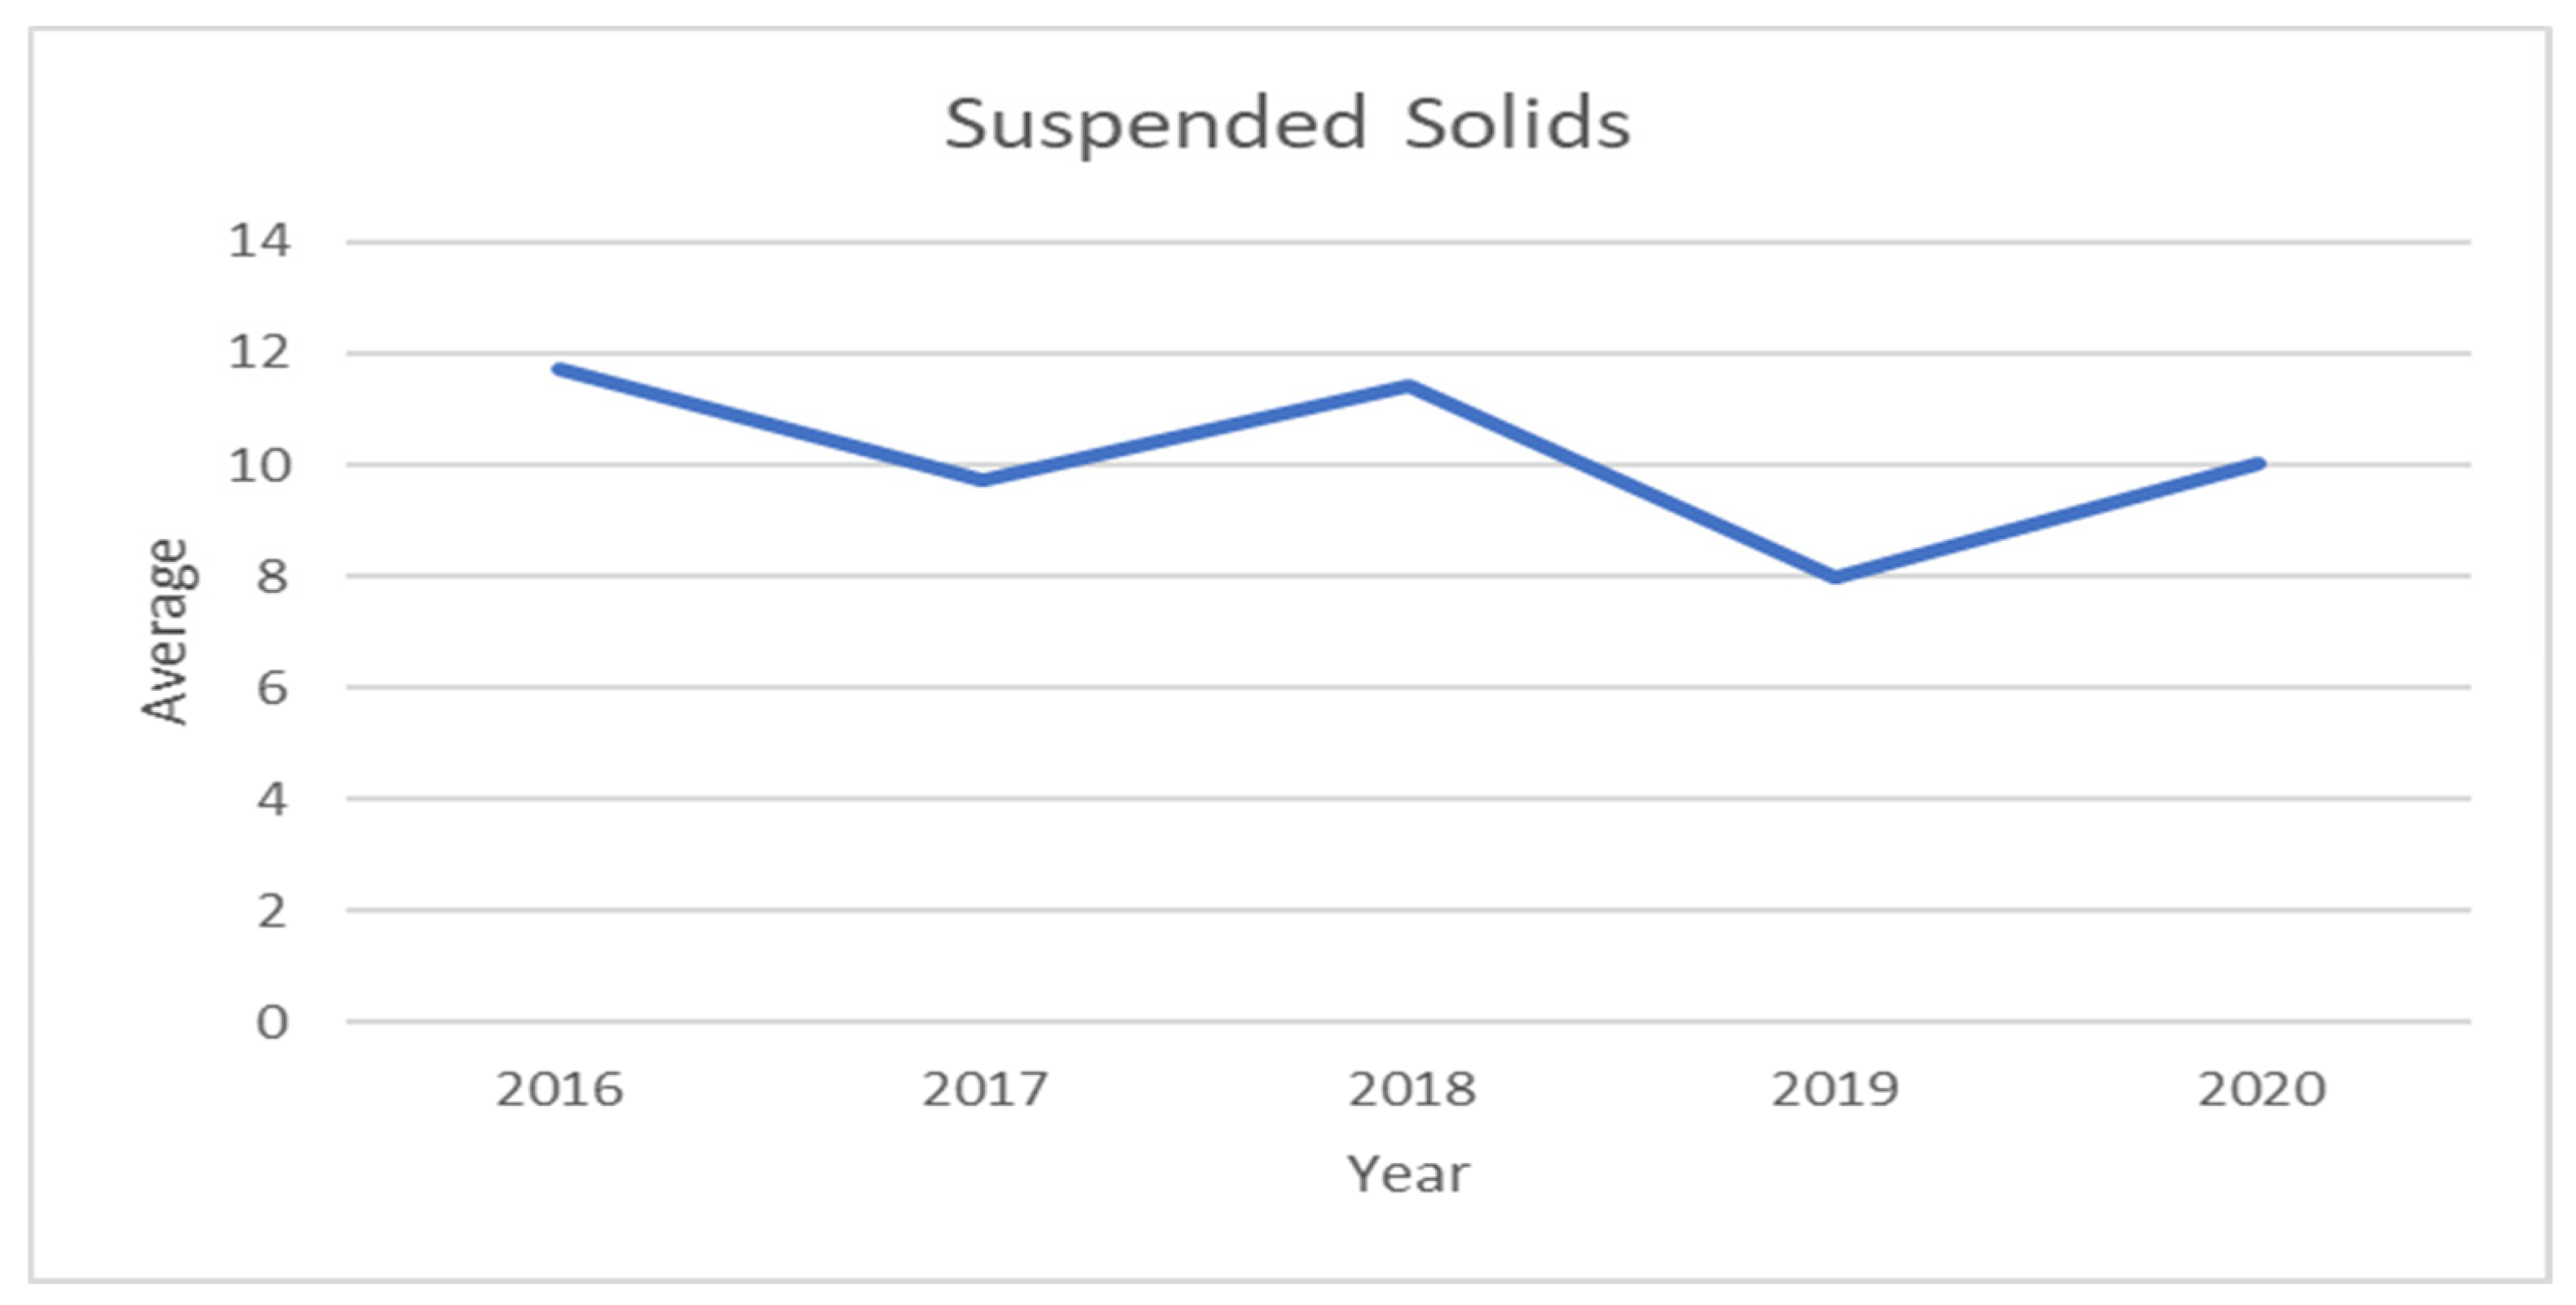
Table 3 shows the suspended solids concentrations that were measured every month for five years (2016-2020). In table 3, each month has a total of five entries, representing the average concentration of suspended solids for each year. An overall yearly average of these entries was calculated and used to produce the graph in
Figure 6. The graph gives a clearer visual depiction of the overall trend of suspended solids over the five-year period, with the plotting of the overall yearly averages on the y-axis and the years on the x-axis.
Table 3 shows the highest ever measured concentration of suspended solids in the final effluent was 24.42 mg/L and that was in April of 2018. This was a significant increase in concentration compared to March and May 2018, according to Hudson-Edwards (2003) this anomaly can be attributed to various factors and some of the leading factors may be the aggregation of dissolved organic matter or chemical precipitation of inorganic solids within the water column. Lin
et al. (2022) detail how various chemical substances behave once they enter a waterbody, some of them may undergo chemical reactions with other elements or minerals to form new less toxic or more toxic substances (Gupta, 2020).
3.3. Electrical conductivity (EC)
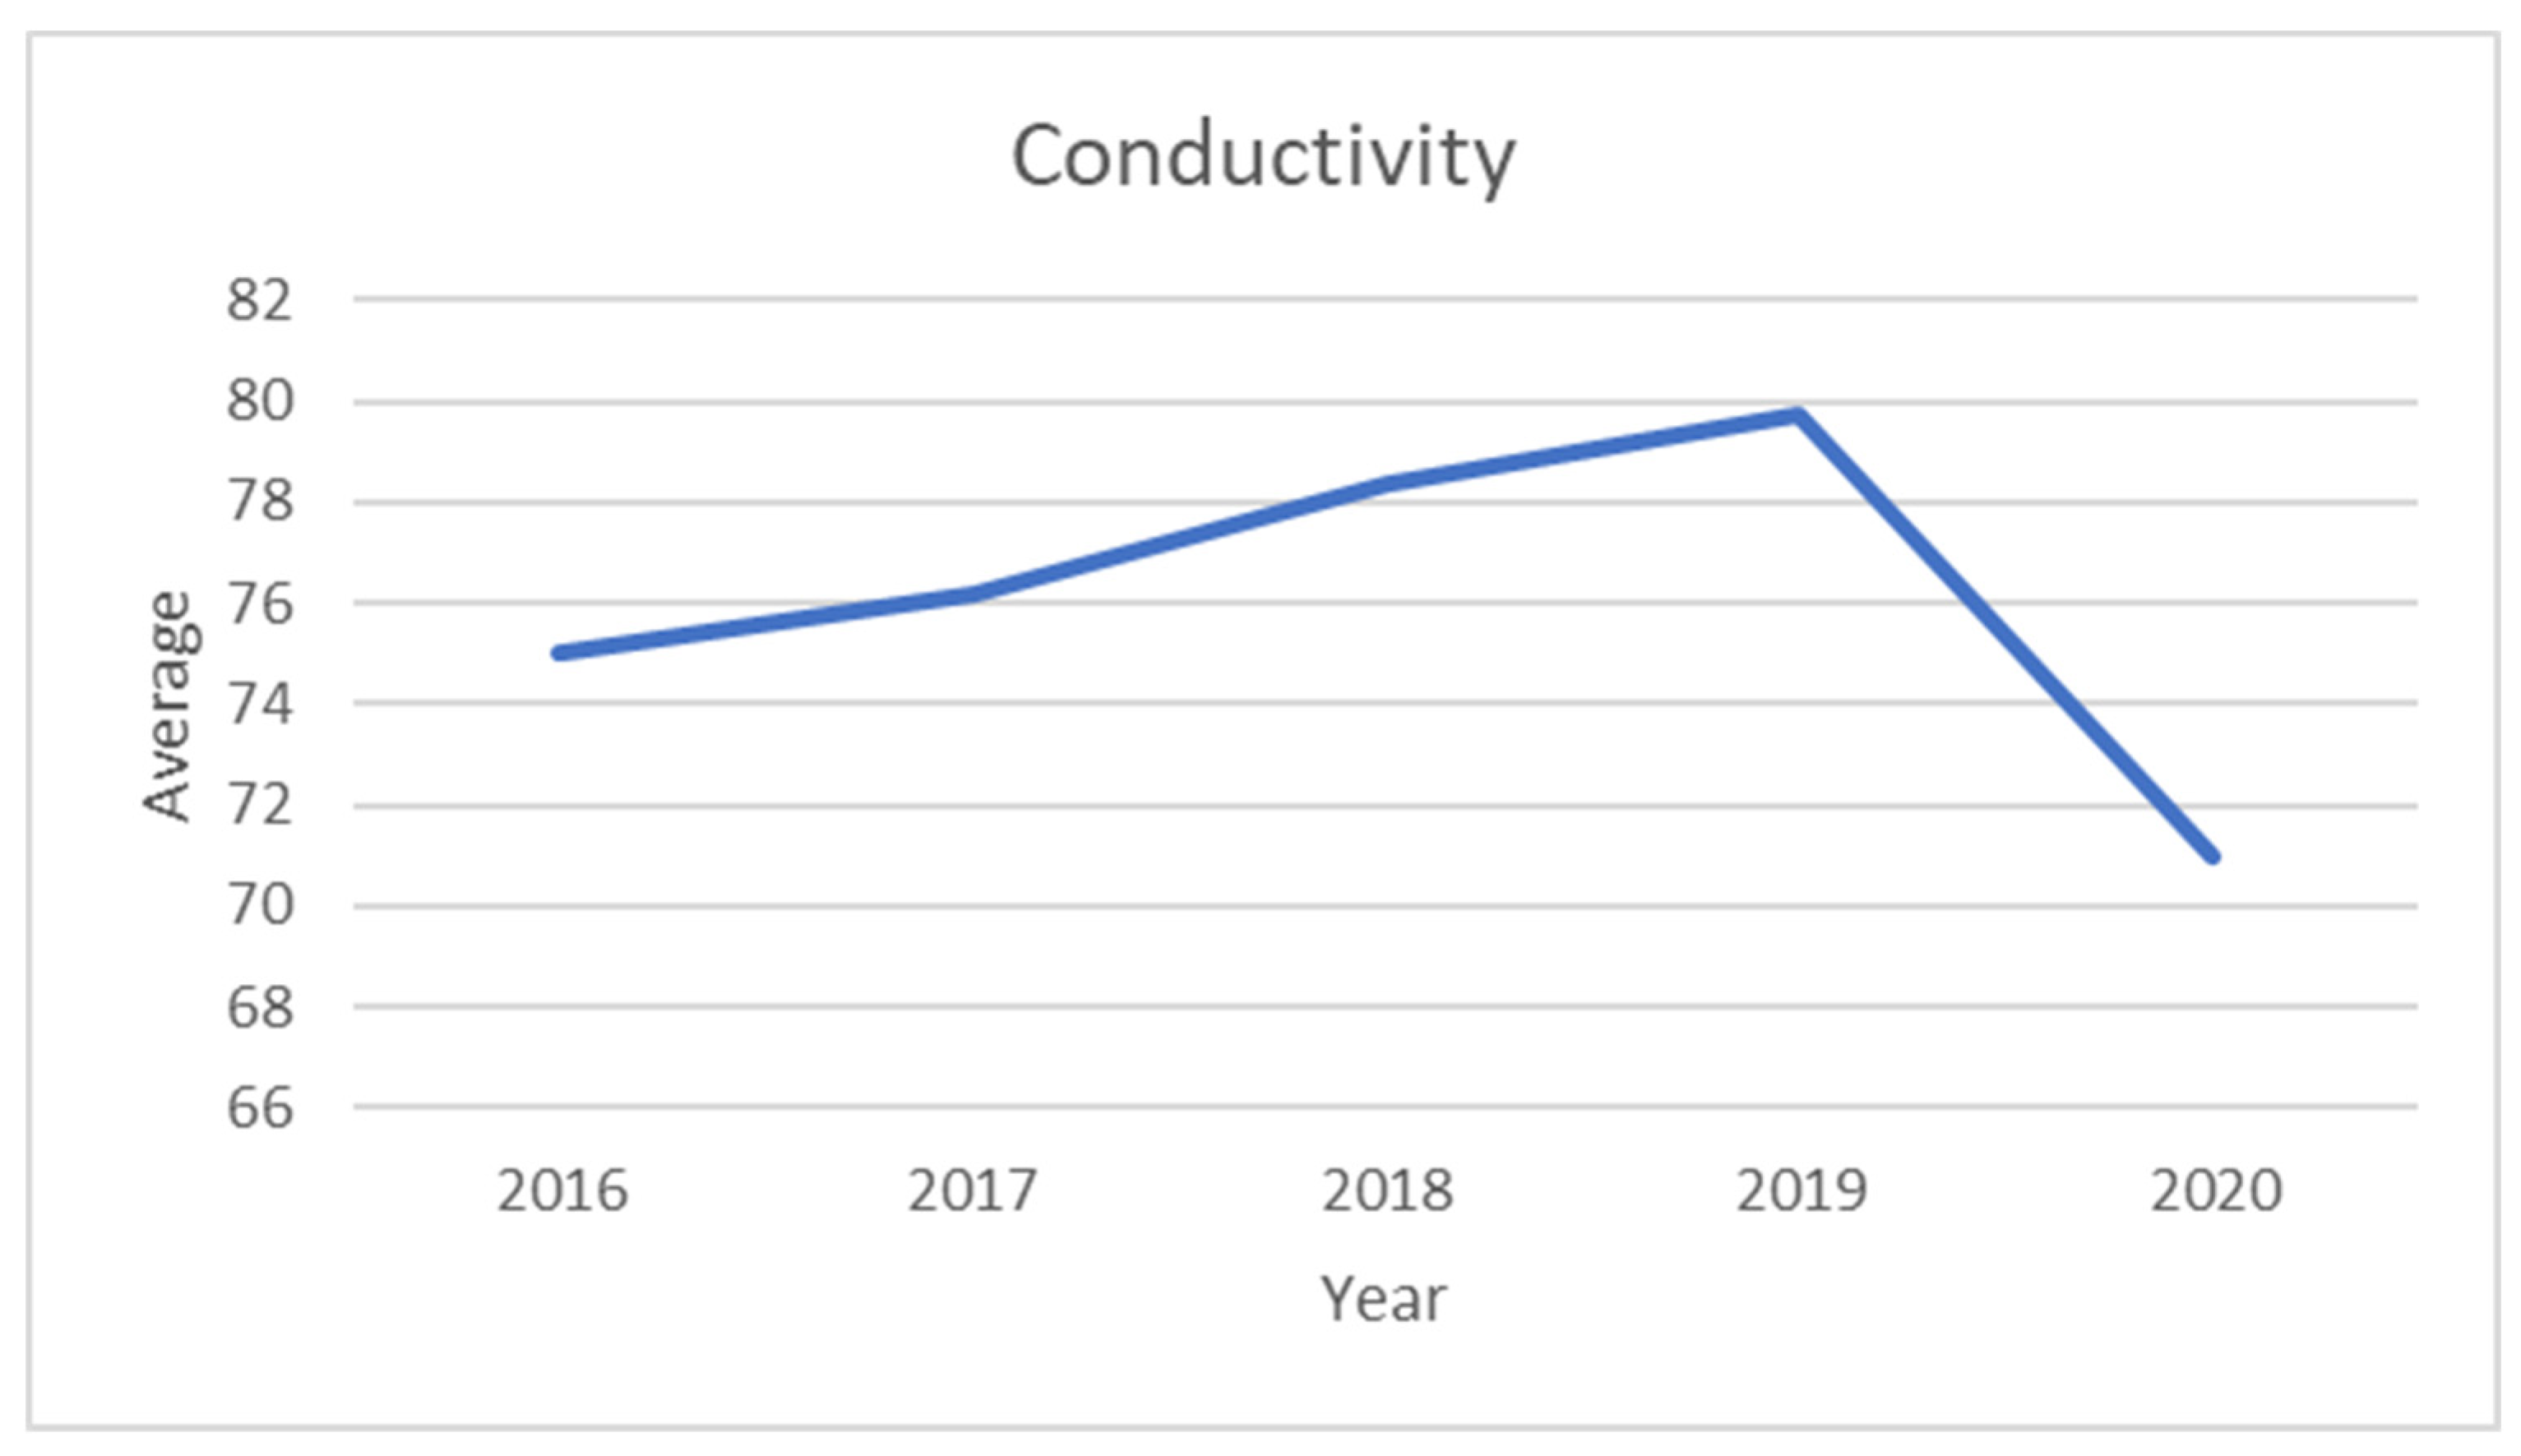
Table 4 shows the measurement of conductivity that was measured every month for five years (2016-2020). In table 4, each month has a total of five entries, representing the average measurement of conductivity for each year. An overall yearly average of these entries was calculated and used to produce the graph in
Figure 7. The graph gives a clearer visual depiction of the overall trend of conductivity over the five-year period, with the plotting of the overall yearly averages on the y-axis and the years on the x-axis.
According to Rusydi (2018), the total amount of dissolved ions in a body of water influences the water’s overall EC, drawing a relationship between ion concentration and conductivity.
Table 4 shows the increase in the measurement of conductivity starting in 2017, 2018 and 2019. This trend is also expressed in the yearly averages in
Figure 7 and this further proves the existing relationship pointed out by Rusydi (2018) in the literature review section, as one can observe how the increased suspended solids concentration of 2018 in
Table 3 and
Figure 6 resulted in an increase in the conductivity measurement in
Table 4 and
Figure 7 expressed as a yearly average.
3.4. Nitrates
Figure 3 shows the concentration of Nitrates/Nitrites that was measured every month for five years (2016-2020). In
Table 5, each month has a total of five entries, representing the average concentration of nitrates/nitrites for each year. An overall yearly average of these entries was calculated and used to produce the graph in Figure 14. The graph gives a clearer visual depiction of the overall trend of the concentration of nitrates/nitrites over the five-year period, with the plotting of the overall yearly averages on the y-axis and the years on the x-axis. The concentration for nitrates and nitrites presented a more erratic trend, where the concentration decreased from 2.24 mg/L in 2016 to 1.58 mg/L in 2017 and in 2018 the concentration of nitrates and nitrites in the effluent doubled and was measured at an all-time high of 3.18 mg/L.
Figure 8.
Graph depicting trends in Nitrates/Nitrites concentrations 2016-2020.
Figure 8.
Graph depicting trends in Nitrates/Nitrites concentrations 2016-2020.
However, from 2019 to 2020 the concentration decreased, as can be seen in Figure 14. Aldous (2018) argues that the accumulation of nitrogen compounds such as nitrates and nitrites in waterbodies may be a result of anthropogenic activities such as wastewater treatment facilities. Concurrently, Della Rocca et al. (2007) argues that wastewater effluents always contain residual quantities of nitrogen compounds.
3.5. pH
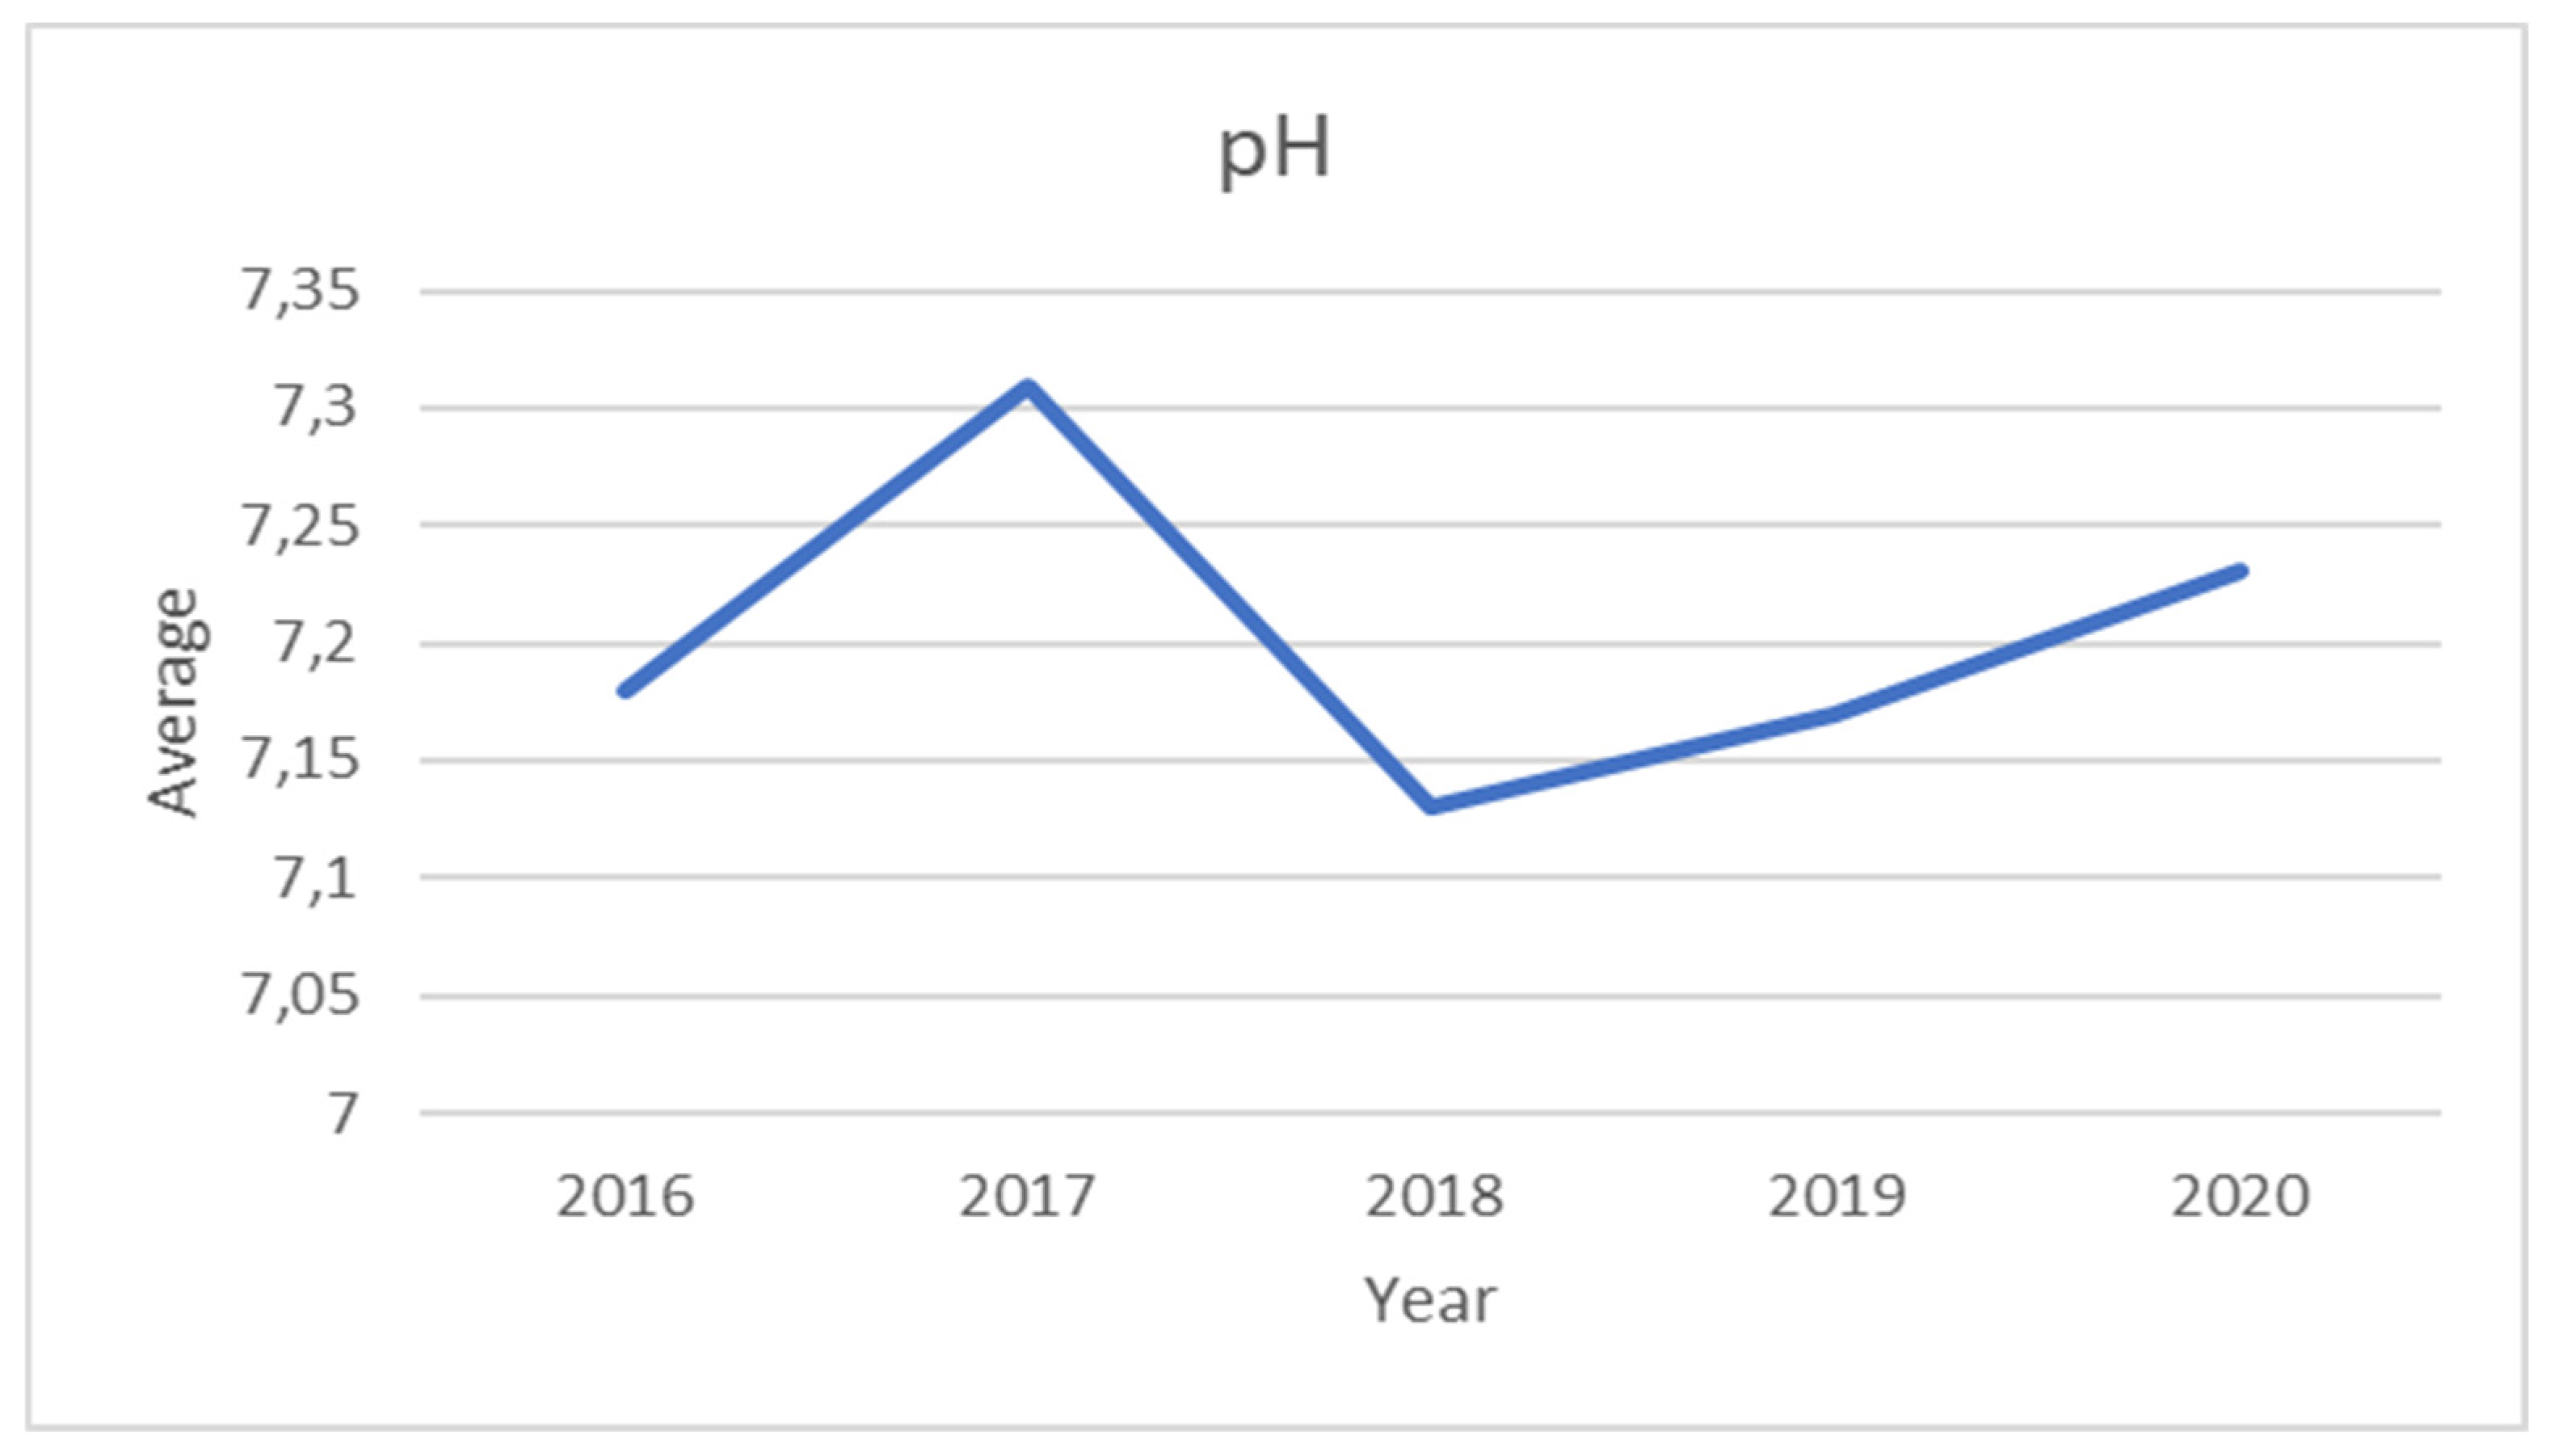
Table 6 shows the pH levels that were measured every month for five years (2016-2020). In
Table 6, each month has a total of five entries, representing the average measurement of pH for each year. An overall yearly average of these entries was calculated and used to produce
Figure 9. The graph gives a clearer visual depiction of the overall trend of pH over the five-year period, with the plotting of the overall yearly averages on the y-axis and the years on the x-axis.
Figure 9 shows all the fluctuations in pH levels over the five-year period and according to The Department of Water Affairs and Forestry (1996) pH has a target water quality range of 6.5-8.5 units and Radke (2006) argues that any measurements that lies outside of this range will result in the disruption in the optimal activity of various biological processes. Furthermore, pH levels below desired ranges may cause fish to become susceptible to fungal infections, and physical damage to their gills, eyes, and skin. This threat to aquatic biodiversity will in turn affect the tourism sector of Plettenberg Bay, as tourists and scientists travel from all over the world to come and observe and study certain aquatic species. This water quality target range is the same for full contact recreational water use, if pH levels are outside of this range, The Department of Water Affairs and Forestry (1996) argues that it may result in discomfort and irritation to the eyes, ears, skin and mucous membranes of the nose and mouth.
Tourists that visit Plettenberg Bay usually enjoy water activities and for that reason, it is imperative to constantly monitor the fluctuations in pH levels and to ensure that the final effluent discharged into the environment meets the specified regulations such that it will not alter nor damage the environment once discharged and it will not pose as a potential health risk for humans and aquatic life. From closely observing
Table 6 and
Figure 9 one can see that all the pH measurements over the five years fall within the target water quality range, meaning that the final effluent discharged into the environment was compliant with full contact recreational water use regulations.
3.6. E. Coli
Table 7 shows the concentration of
E. coli that was measured every month for five years (2016-2020). In
Table 7, each month has a total of five entries, representing the average concentration of
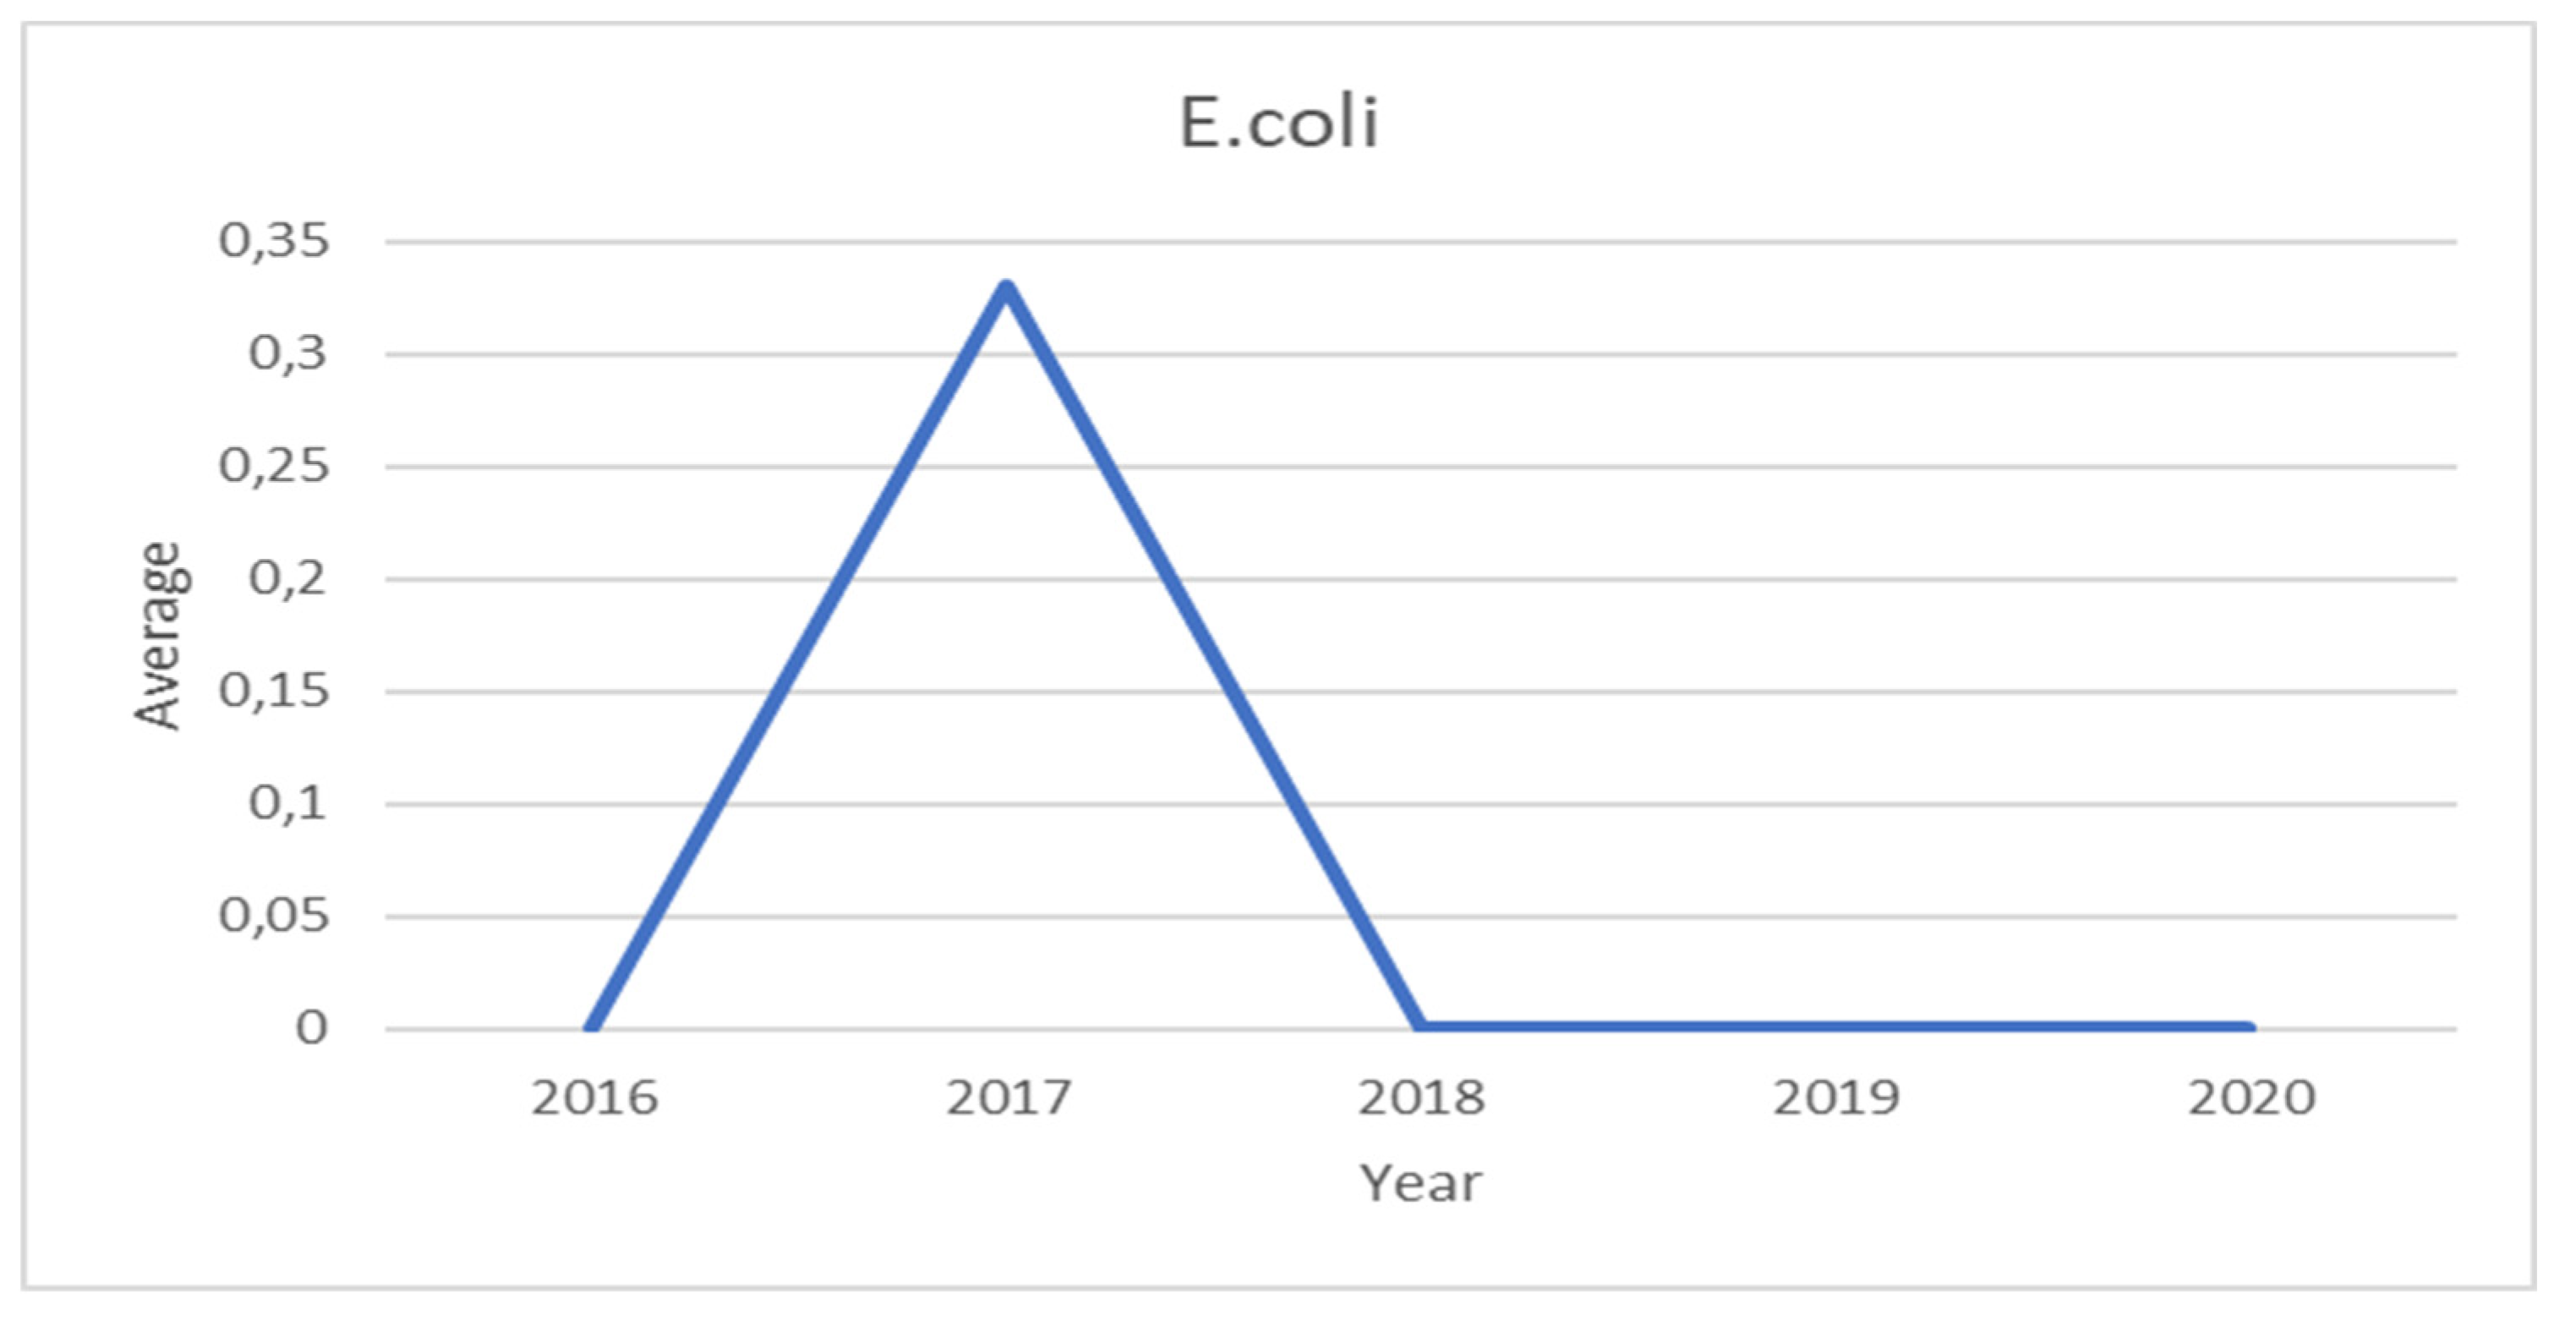
E. coli for each year. An overall yearly average of these entries was calculated and used to produce the graph in
Figure 10. The graph gives a clearer visual depiction of the overall trend of the concentration of
E. coli over the five years, with the plotting of the overall yearly averages on the y-axis and the years on the x-axis.
E. coli according to Eden (2014) is used as an indicator organism to show the quality or hygienic status of water. Furthermore, The Department of Water Affairs and Forestry (1996) states that the target water quality range for
E. coli is 0-130 counts per 100 mL for full contact recreational water use. However,
Table 7 indicates that in September of 2017, there was a sudden detection of
E. coli in the effluent, and it was measured at exactly 3.18 counts per 100 mL in the following month this concentration decreased to exactly 0.83 counts per 100 mL and this brought the overall year average for 2017 to 0.33 counts per 100 mL. This observed fluctuation in concentration was significant because this was the only anomaly during the five years as all the other monthly measurements had no detections of
E. coli. However, the detected amount of
E. coli still fell within the target water quality range and was not in significant amounts to cause gastrointestinal illnesses in humans as pointed out by The Department of Water Affairs and Forestry (1996).
4. Conclusions
The study focused on six water quality parameters which were sampled from five sampling points in the greater Plettenberg Bay area. However, for this study, only the samples obtained from the final effluent were analysed and discussed in this study. This was due to the fact that the final effluent is discharged into The Gans River (
Figure 4) post-treatment. Plettenberg Bay is a vibrant tourist destination where tourists and residents use the Gans River for various water activities, it is imperative to ensure that the final effluent meets prescribed water quality standards so that it does not pose a health risk or environmental degradation once released into the environment.
Phungela (2022) discusses the impact of discharging poorly treated wastewater into the environment, the author further elaborates that this discharge has an overall negative impact on global water resource systems. The author further states that there is evidence of water resource quality deterioration in natural environments caused by effluent discharges. Therefore, it is important to examine the final effluent as it will have an impact on the overall surface water quality of the Gans River.
Physiochemical and microbiological parameters such as Ammonia, Suspended Solids, Conductivity, Nitrates, pH, and E. coli were examined to indicate the water quality of the Gans River. The overall water quality of the Gans River is deemed to be of good quality even though there were a few non-compliances with some of the prescribed standards. Various factors may influence the quality of water, with some factors being natural and/or anthropogenic. In Table 2 the amount of ammonia present in the water is not considered to be excessive. Therefore, the ammonia levels can be described as compliant. However, there are a few noticeable surges in ammonia presence, and this can be attributed to the residual ammonia present in water after purification, as the Gans River is a final effluent discharge area. The Department of Water Affairs and Forestry (1996) states that chemical compounds in the case of full-contact recreational water should not be in such concentrations as to be toxic to humans if small quantities of water are ingested or absorbed through the skin. Furthermore, the Oregon Department of Human Services (2000) argues that any solution with a concentration greater than 1000 mg/L can cause severe burns and scarring to sensitive skin.
Table 3 and
Figure 6 are visual representations of suspended solids as a physiochemical indicator. Over the five-year period, the concentration of suspended solids has been deemed as compliant with standards prescribed by the South African Water Quality Guidelines, Volume 2: Recreational Use.
Table 4 and
Figure 7 represent the conductivity measured over five years. The measurements obtained were found to be compliant with Volume 2 of the South African Water Quality Guidelines. Due to the existing relationship between suspended solids and conductivity.
According to the Department of Water Affairs and Forestry (1996) chemical compounds in the case of full-contact recreational water should not be in such concentrations as to be toxic to humans if small quantities of water are ingested or absorbed through the skin, taking this into account, when observing
Table 5 and
Figure 8 one can see that the concentration of Nitrates/Nitrites was completely compliant with the Department of Water Affairs and Forestry guidelines.
Table 6 and
Figure 9 are visual representations of pH as a physiochemical indicator of water quality, according to the Department of Water Affairs and Forestry (1996) pH has a target water quality range of 6.5-8.5 units. One can see in
Figure 9 that the fluctuations in pH levels never exceed 8.5 units and never go below 6.5 units. The lowest pH reading is 6.83 units, and the highest level was 7.98 units. Therefore, pH was completely compliant with the Department of Water Affairs and Forestry guidelines.
E. coli is considered to be a microbiological indicator of water quality,
Table 6 shows all the changes in
E. coli levels in five years and one can observe and conclude that
E. coli has been one of the most compliant indicators. However, this is except for levels recorded in the year 2017. This can be observed in the spike in 2017 in
Figure 9. As stated, before the quality of water can be influenced by natural and/or anthropogenic activities. Even with this apparent fluctuation in recorded levels, one can still deem
E. coli to be compliant as the Department of Water Affairs and Forestry’s prescribed target water quality range for
E. coli is 0-130 counts per 100 mL for full contact recreational water use. The study has provided a better understanding of the composition and water quality of the Gans River, which is where the final effluent is discharged. Based on the assessment of the presented data and information obtained the following recommendations are proposed:
Seeing that the water is of good quality, the water quality monitoring program has been an effective tool for water quality assessment and should continue. However, more frequent sampling should take place.
The Gans River area should be monitored closely and access to it should be more restricted. Unsupervised access to the river has created a leeway for people to pollute the river by discarding refuse nearby or into the river.
The municipality should conduct environmental awareness programs in all the Plettenberg Bay communities and educate people about the importance of water conservation and protection.
The municipality should conduct an integrated risk assessment and management plan for all the sampling sites to ensure that there may be no room for pollution.
The Bitou Municipality may do better by, obtaining more samples much more frequently, hiring more people to assist with the required workload and the analysis of the samples, and more environmental education and awareness needs to take place so that all residents and tourists are aware of the importance of environmental protection and conservation.
Moreover, the study recommends further research to investigate the occurrence of specific hazardous chemical compounds and biological contaminants such as endocrine disruptors and viruses resulting from anthropogenic activities in Plettenberg Bay in order to generate significantly more data and improve surveillance of viral contamination and physicochemical profile of recreational water.
Furthermore, the study suggests that there is a need to conduct a study to shed light on the possible statistical association between recreational demand and water quality status in different sites at Plettenberg Bay. Understanding how the quality of recreational water influences tourists’ choices in Plettenberg Bay would provide evidence to support the improvement of sustainable tourism.
Author Contributions
Conceptualisation, Z.K.; methodology, Z.K; validation, K.S, S.E.U.; formal analysis, Z.K.; investigation, Z.K.; resources, Z.K. K.S, S.E.U; data curation, S.E.U; writing—original draft preparation, Z.K; writing—review and editing, Z.K. K.S, S.E.U; supervision, K.S, S.E.U.; project administration, K.S.; All authors have read and agreed to the published version of the manuscript.
Acknowledgments
In this section, you can acknowledge any support given which is not covered by the author contribution or funding sections. This may include administrative and technical support, or donations in kind (e.g., materials used for experiments).
Conflicts of Interest
The authors declare no conflict of interest.
References
- Meride,Y. and Ayenew, B. 2016. drinking water quality assessment and its effects on residents health in Wondo genet campus, Ethiopia. Environmental Systems Research, 5, (1).
- Kılıç, Z. 2020. The importance of water and conscious use of water. International Journal of Hydrology, 4(5), pp. 239–241. [CrossRef]
- Department of Water Affairs and Forestry. 1996. South African water quality guidelines (second edition), Volume 2: Recreational Use. Pretoria: CSIR Environmental Services.
- Yigitcanlar, T. and Kamruzzaman, M. 2015. Planning, development and management of Sustainable Cities: A commentary from the guest editors. Sustainability, 7(11), pp. 14677–14688. [CrossRef]
- Jorgenson, A.K. and Kick, E.L. 2006. Globalization and the environment: An introduction. Globalization and the Environment, pp. 1–11. [CrossRef]
- Opere, W.M., John, M. and Ombori, O. 2020. Occurrence of enteric viruses in surface water and the relationship with changes in season and Physical Water Quality Dynamics. Advances in Virology, 2020, pp. 1–11. [CrossRef]
- King, E. 2021. Plettenberg Bay nominated as Africa's leading beach destination, for 12th consecutive year, News24. Available at: https://www.news24.com/news24/southafrica/news/plettenberg-bay-nominated-as-africas-leading-beach-destination-for-12th-consecutive-year-20210428 [Accessed: January 31, 2023].
- Lück Michael. 2009. Environmentalism and tourists' experiences on swim-with Dolphins Tours: A case study of new zealand. Germany: VDM Verlag Dr Müller.
- Edokpayi, J.N., Odiyo, J.O. and Durowoju, O.S. 2017. Impact of wastewater on surface water quality in developing countries: A case study of south afric. Water Quality [Preprint]. [CrossRef]
- Cornelissen, S. 2005. Tourism impact, distribution and development: The Spatial Structure of tourism in the Western Cape Province of South Africa. Development Southern Africa, 22(2), pp. 163–185. [CrossRef]
- Pakasi, L.S. 2018. Health risks associated with recreational water activities. IOP Conference Series: Materials Science and Engineering, 434, p. 012329. [CrossRef]
- Jang, J., Hur, H.G., Sadowsky, M. J., Byappanahalli, M.N., Yan, T. and Ishii, S. 2017. Environmental escherichia coli: Ecology and public health implications-A Review. Journal of Applied Microbiology, 123(3), pp. 570–581. [CrossRef]
- Hassan Omer, N. 2020. Water quality parameters. Water Quality - Science, Assessments and Policy [Preprint]. [CrossRef]
- Saalidong, B.M. et al. 2022. Examining the dynamics of the relationship between water ph and other water quality parameters in ground and surface water systems. PLOS ONE, 17(1). [CrossRef]
- World Health Organization. 2006. Guidelines for drinking-water quality. Geneva: World Health Organization.
- Della Rocca, C., Belgiorno, V. and Meriç, S. 2007. Cotton-supported heterotrophic denitrification of nitrate-rich drinking water with a sand filtration post-treatment. Water SA, 31(2), p. 229. [CrossRef]
- Oregon Department of Human Services. 2000. health effects information: ammonia. Portland, Oregon: Office of Environmental Public Health. United States of America.
- Hudson-Edwards, K. A. 2003. Sources, mineralogy, chemistry and fate of heavy metal-bearing particles in mining-affected river systems. Mineralogical Magazine, 205-217.
- Lin, L., Yang, H. and Xu, X. 2022. Effects of water pollution on human health and disease heterogeneity: A Review. Frontiers in Environmental Science, 10. [CrossRef]
- Gupta, R.C. (ed.) (2020) Handbook of Toxicology of Chemical Warfare Agents. Elsevier Academic Press.
- Rusydi, A. F. 2018. correlation between conductivity and total dissolved solid in various type of water: A review. IOP Conf. Series: Earth and Environmental Science, 2-7.
- Aldous, S. P. 2018. freshwater pollution: ecological impact assessment and remediation. United Kingdom: Foundation for Water Research.
- Radke, L. 2006. pH of coastal waterways https://ozcoasts.org.au/indicators/biophysical-indicators/ph_coastal_waterways/ [accessed on 10July 2022].
- Eden, R. 2014. enterobacteriaceae, coliforms and E. Coli - Classical and Modern Methods for Detection and Enumeration. Encyclopedia of Food Microbiology (Second Edition), 667-673.
- Phungela, T. M. 2022. The impact of wastewater treatment effluent on Crocodile River quality in Ehlanzeni District, Mpumalanga Province, South Africa. South African Journal of Science, 1-8.
|
Disclaimer/Publisher’s Note: The statements, opinions and data contained in all publications are solely those of the individual author(s) and contributor(s) and not of MDPI and/or the editor(s). MDPI and/or the editor(s) disclaim responsibility for any injury to people or property resulting from any ideas, methods, instructions or products referred to in the content. |
© 2023 by the authors. Licensee MDPI, Basel, Switzerland. This article is an open access article distributed under the terms and conditions of the Creative Commons Attribution (CC BY) license (http://creativecommons.org/licenses/by/4.0/).
