1. Introduction
The mechanism of light localization in hollow –
core fibers with a negative curvature of the core – cladding boundary has been
investigated for over ten years [1–3]. By now,
several models have been proposed to explain strong light localization in the
air core, which enables radiation transmission at high losses of the fiber
material [4] and high – power radiation [5]. In this paper, we will examine the problem of
light localization from a slightly different angle which could give impetus to
a new understanding of the processes in hollow – core fibers with a rather
simple design.
To date, the ARROW (antiresonant optical waveguide)
model is considered to be the main model by most authors working in this field [6,7]. This model was originally developed to
explain the appearance of transmission bands and low losses in planar
waveguides, and was then transferred to the field of micro – structured fibers
to explain light localization in them. From the point of view of calculating
transmission bands edges, this model yields good results which closely
correspond to experimental data. Yet if we consider the mechanism of low losses
formation in the centers of the transmission bands of the hollow – core fibers,
there are facts that do not allow us to interpret the cladding capillary walls
of the hollow – core fibers simply as planar Fabry – Perrot resonators.
Therefore, there have appeared several alternative views on this problem, such
as the inhibited coupling model [8], vortex –
supported waveguiding model [9] and azimuthal
confinement model [10].
In this work, we propose to introduce a concept of
the local energy velocity of air – core modes and, on its basis, to compare
mechanisms of energy leakage from a silica glass capillary and silica glass
hollow – core fibers with a cladding consisting of capillaries (a negative
curvature of the core – cladding boundary). While in the former case we have
obtained the expected results for the local energy velocity at the inner
capillary boundary, in the latter case we have obtained a more interesting and
complex picture of the air – core mode energy leakage process at the outer
boundary of cladding capillaries. Firstly, in some areas of the cladding
capillary boundary, the local energy velocity drops by four orders of magnitude
in the radial direction compared to the speed of light in vacuum. In addition,
in these regions, the behavior of the local energy velocity of the fundamental
air – core mode also changes along the fiber axis. These phenomena were earlier
observed in planar waveguide structures made of left – handed metamaterials and
epsilon – negative materials (sandwich structures consisting of epsilon –
negative/left – handed/epsilon negative metamaterials ) [11,12]. They are associated with radiation power
flows moving in opposite directions along the boundaries of such planar
waveguide structures and emerging vortices of electromagnetic fields and power
flows at these boundaries. As a result, the power flows between two
metamaterials cancel each other out and the total power flow tends to zero. We
demonstrate that this phenomenon can also occur in the cladding of hollow –
core fibers with a negative curvature of the core – cladding boundary.
The paper is structured as follows: the first part
examines the behavior of the local energy velocity in a single silica glass
capillary, the second part analyzes the distribution of the local energy
velocity at the outer boundaries of the cladding capillaries of hollow – core
fibers with one layer of capillaries in the cladding and nested hollow – core
fiber, and the final part contains the discussion of the findings.
2. Local Energy Velocity of the Fundamental Air – Core Mode for a Silica Glass Capillary
In this Section, we analyze the behavior of the
local energy velocity of the fundamental air – core mode in different regions
of the cross – section of a silica glass capillary. Let us consider a capillary
with an air – core diameter of
Dcore = 50 μm and a wall
thickness of
t = 750 nm, which, according to the ARROW model [6], approximately corresponds to the center of the
second transmission band at a wavelength of λ = 1.06 μm. According to the
waveguide theory, the electric and magnetic fields of the fundamental air –
core mode (HE
11 hybrid mode) can be represented in cylindrical
coordinates
as:
where in (1) the dependence on time and axial
coordinate in the form of is omitted. In formulas (1), the following
notations are introduces: , where (i= 1, 2) are refractive indices of air
and glass in the capillary cross – section, ω is circular frequency and , where is an effective refractive index of the fundamental
air – core mode and c is the speed of light. Function is the Bessel function of the first kind in ther capillary core, the sum of two Hankel
functions in the capillary wall and simply the Hankel
function outside the capillary. A and B are
amplitude coefficients.
Based on formulas (1), it is possible to calculate
the power flux and the energy density of the fundamental air – core mode
averaged over the oscillation period. The formulas for them are as follows:
Knowing these two quantaties, one can calculate a local value characterizing the rate and direction of the air – core mode energy flow in the vicinity of a certain points of the capillary cross – section. This value has a similar expression as the value of the energy velocity of the plane wave [
13]:
It can be seen from (3) that does not depend on the z – coordinate, since the power flow and energy density have the same dependence on the axial coordinate in the form of. As it will be seen below, the study of the distribution of the local energy velocity of the air – core modes can be specifically useful for fibers with a complex shape of the core – cladding boundary.
In the case of a simple waveguide, which is a silica glass capillary, this value along its inner boundary has a simple distribution that can be easily calculated using formulas (1) – (3). All terms in expressions for
and
W (2) of the
,
,
,
etc. type have an angular dependence of
. It is clear that all terms obtained by multiplying projections of the electric and magnetic fields of the fundamental air – core mode in (2) can be functions of either the radial coordinate or have an azimuthal angle dependence in the form of
. In general, the dependences on the azimuthal angle for the projections of
and the mode energy density
W can be expressed as:
where
j = (
x,
y,
z),
,
are constants obtained by multiplying expressions (1) while
and
are functions of the radial coordinate (
i = 1, 2). The calculated distributions for the axial
and radial
projections of
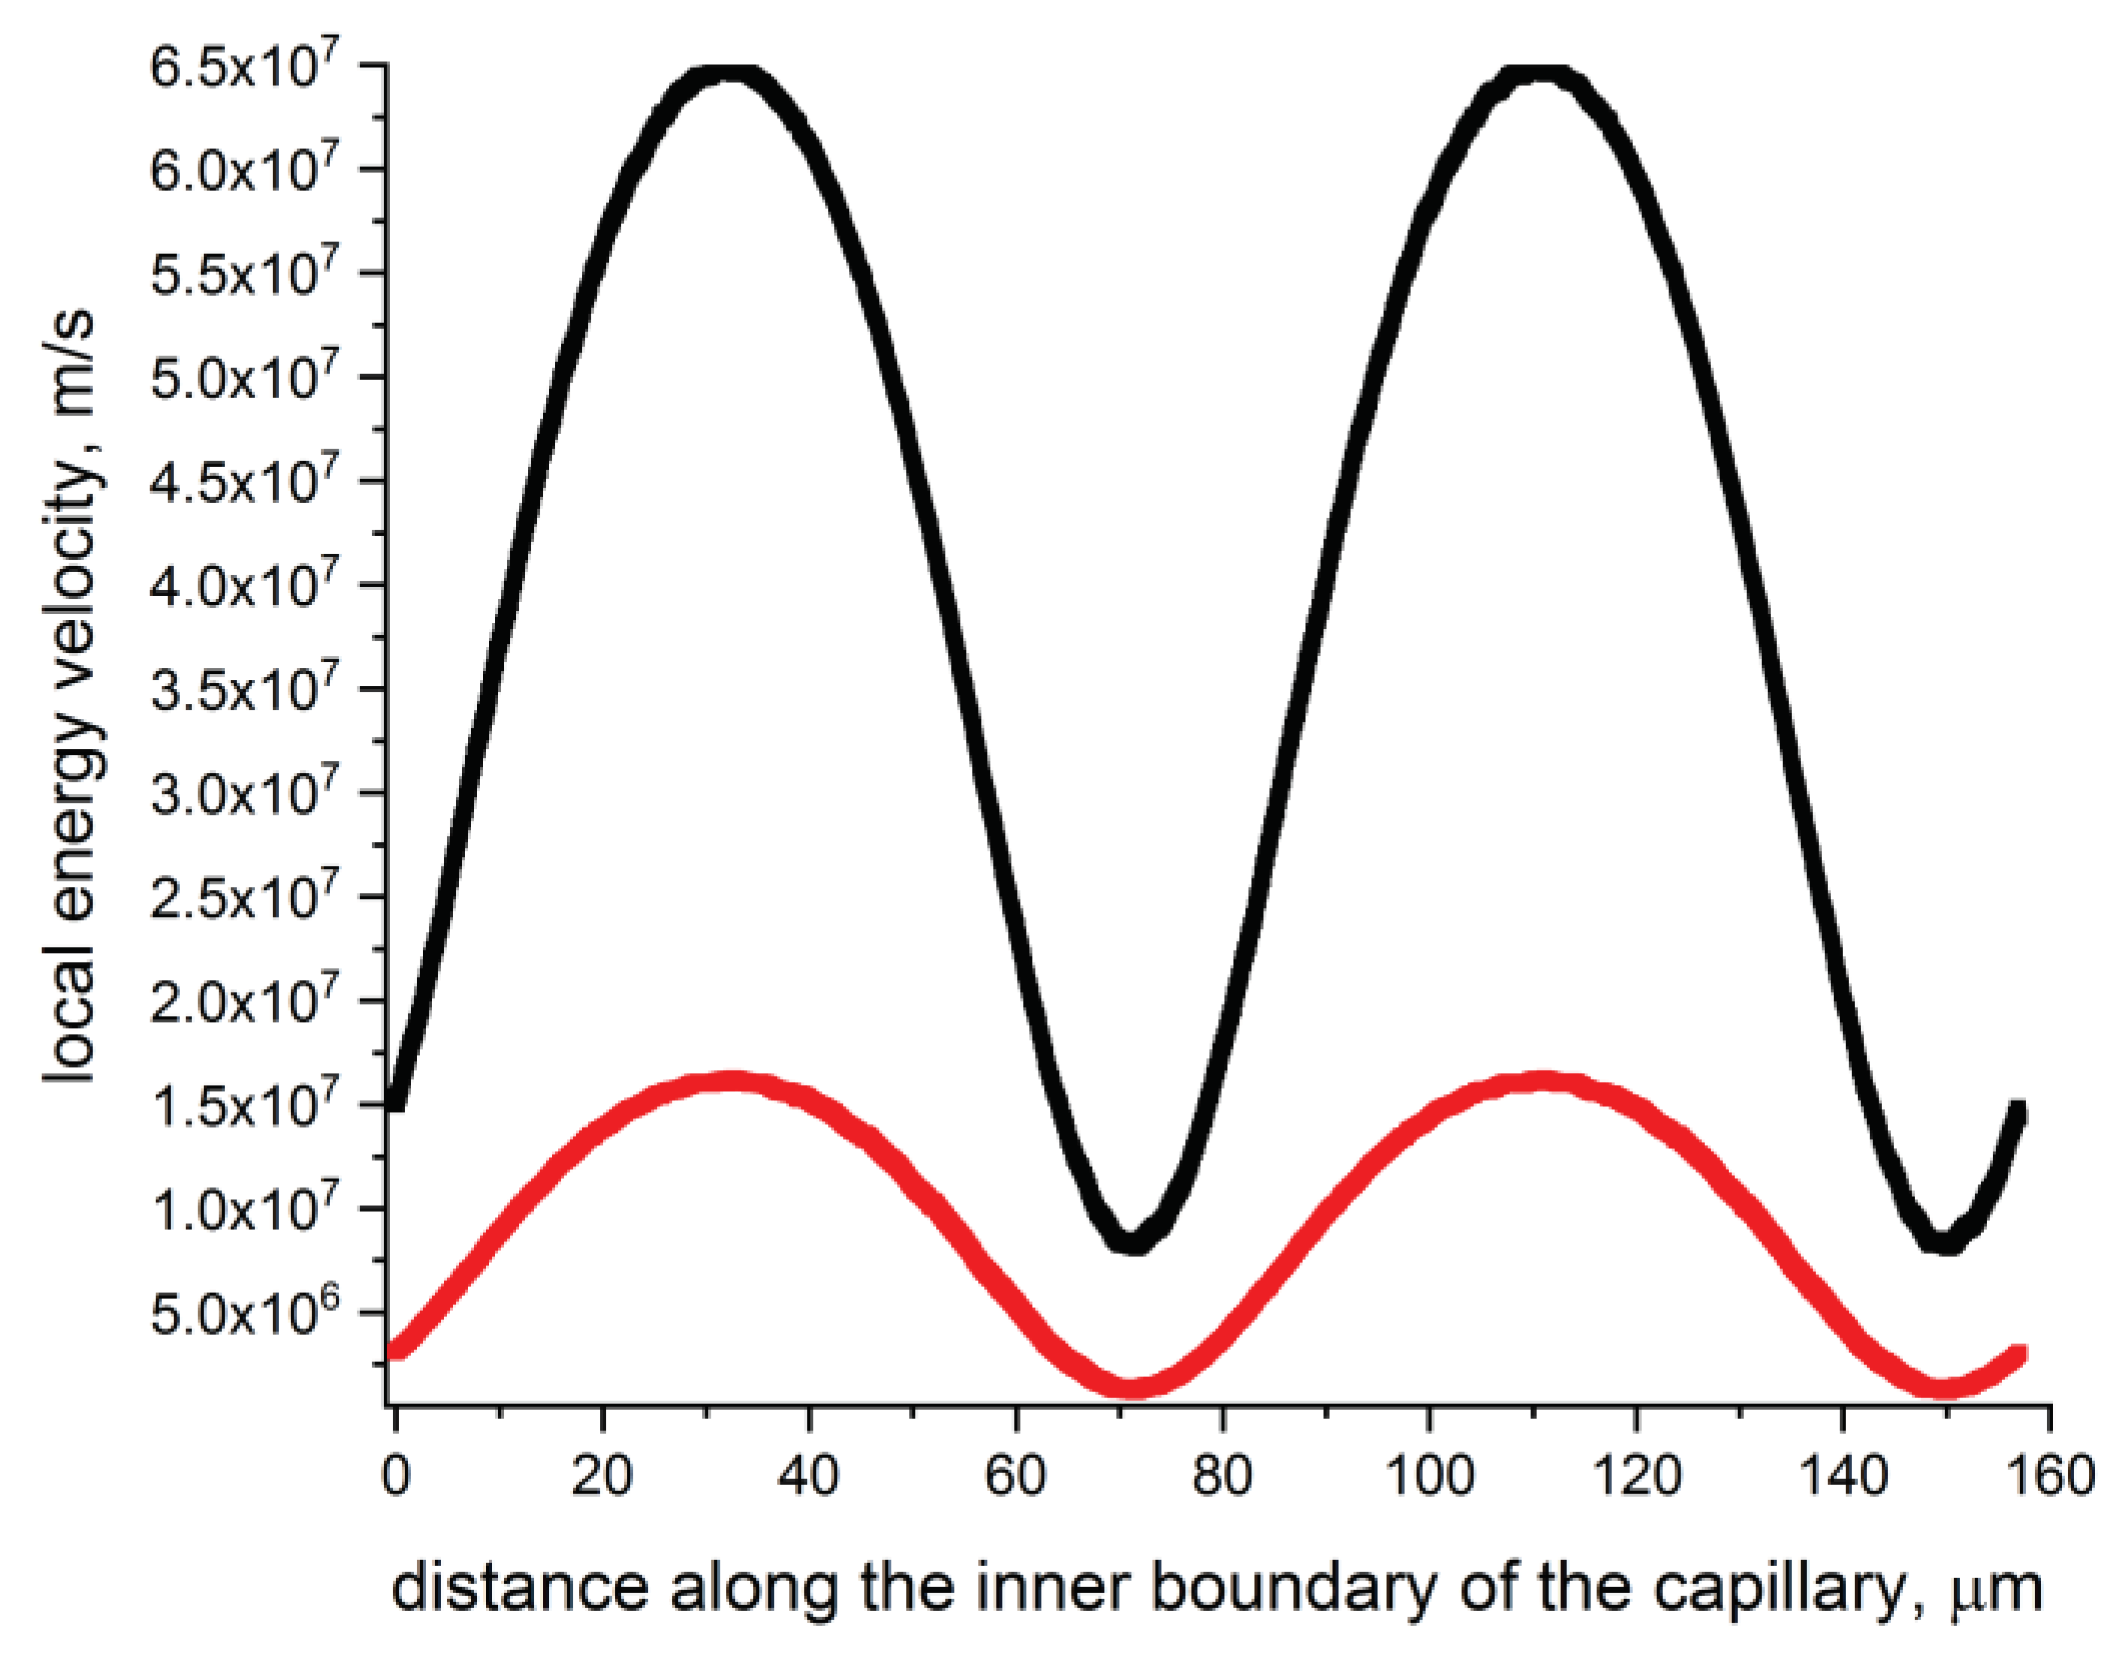
along the inner boundary of the capillary described at the beginning of this Section are shown in
Figure 1. These distributions confirm the dependence on the azimuthal angle in the form of (4). The values of the projections of
are positive along the entire inner boundary of the capillary and have values that are approximately an order of magnitude less than the speed of light in vacuum. The values of the projections of
are also positive along the entire inner boundary of the capillary and have values that are approximately two orders of magnitude smaller than the speed of light in vacuum. The losses at wavelength of 1.06 μm were 12 dB/m. Thus, the local energy velocity for the fundamental air – core mode is determined at the boundary of the capillary core by fairly simple relations and the radiation localization in its core is determined by the well – known ARROW model.
3. Local Energy Velocity of the Fundamental Air – Core Mode for Silica Glass Hollow – Core Fibers with a Negative Curvature of the Core – Cladding Boundary
In this Section, we consider the behavior of the local energy velocity of the fundamental air – core mode for two types of silica glass hollow – core fibers shown in
Figure 2. To demonstrate the behavior of the projections of
for the fibers shown in
Figure 2, it is sufficient to determine the distribution of the local energy velocity for the fundamental air – core mode (HE
11 hybrid mode) at the outer boundary of one of the cladding capillaries. The distribution is very similar for all the cladding capillaries.
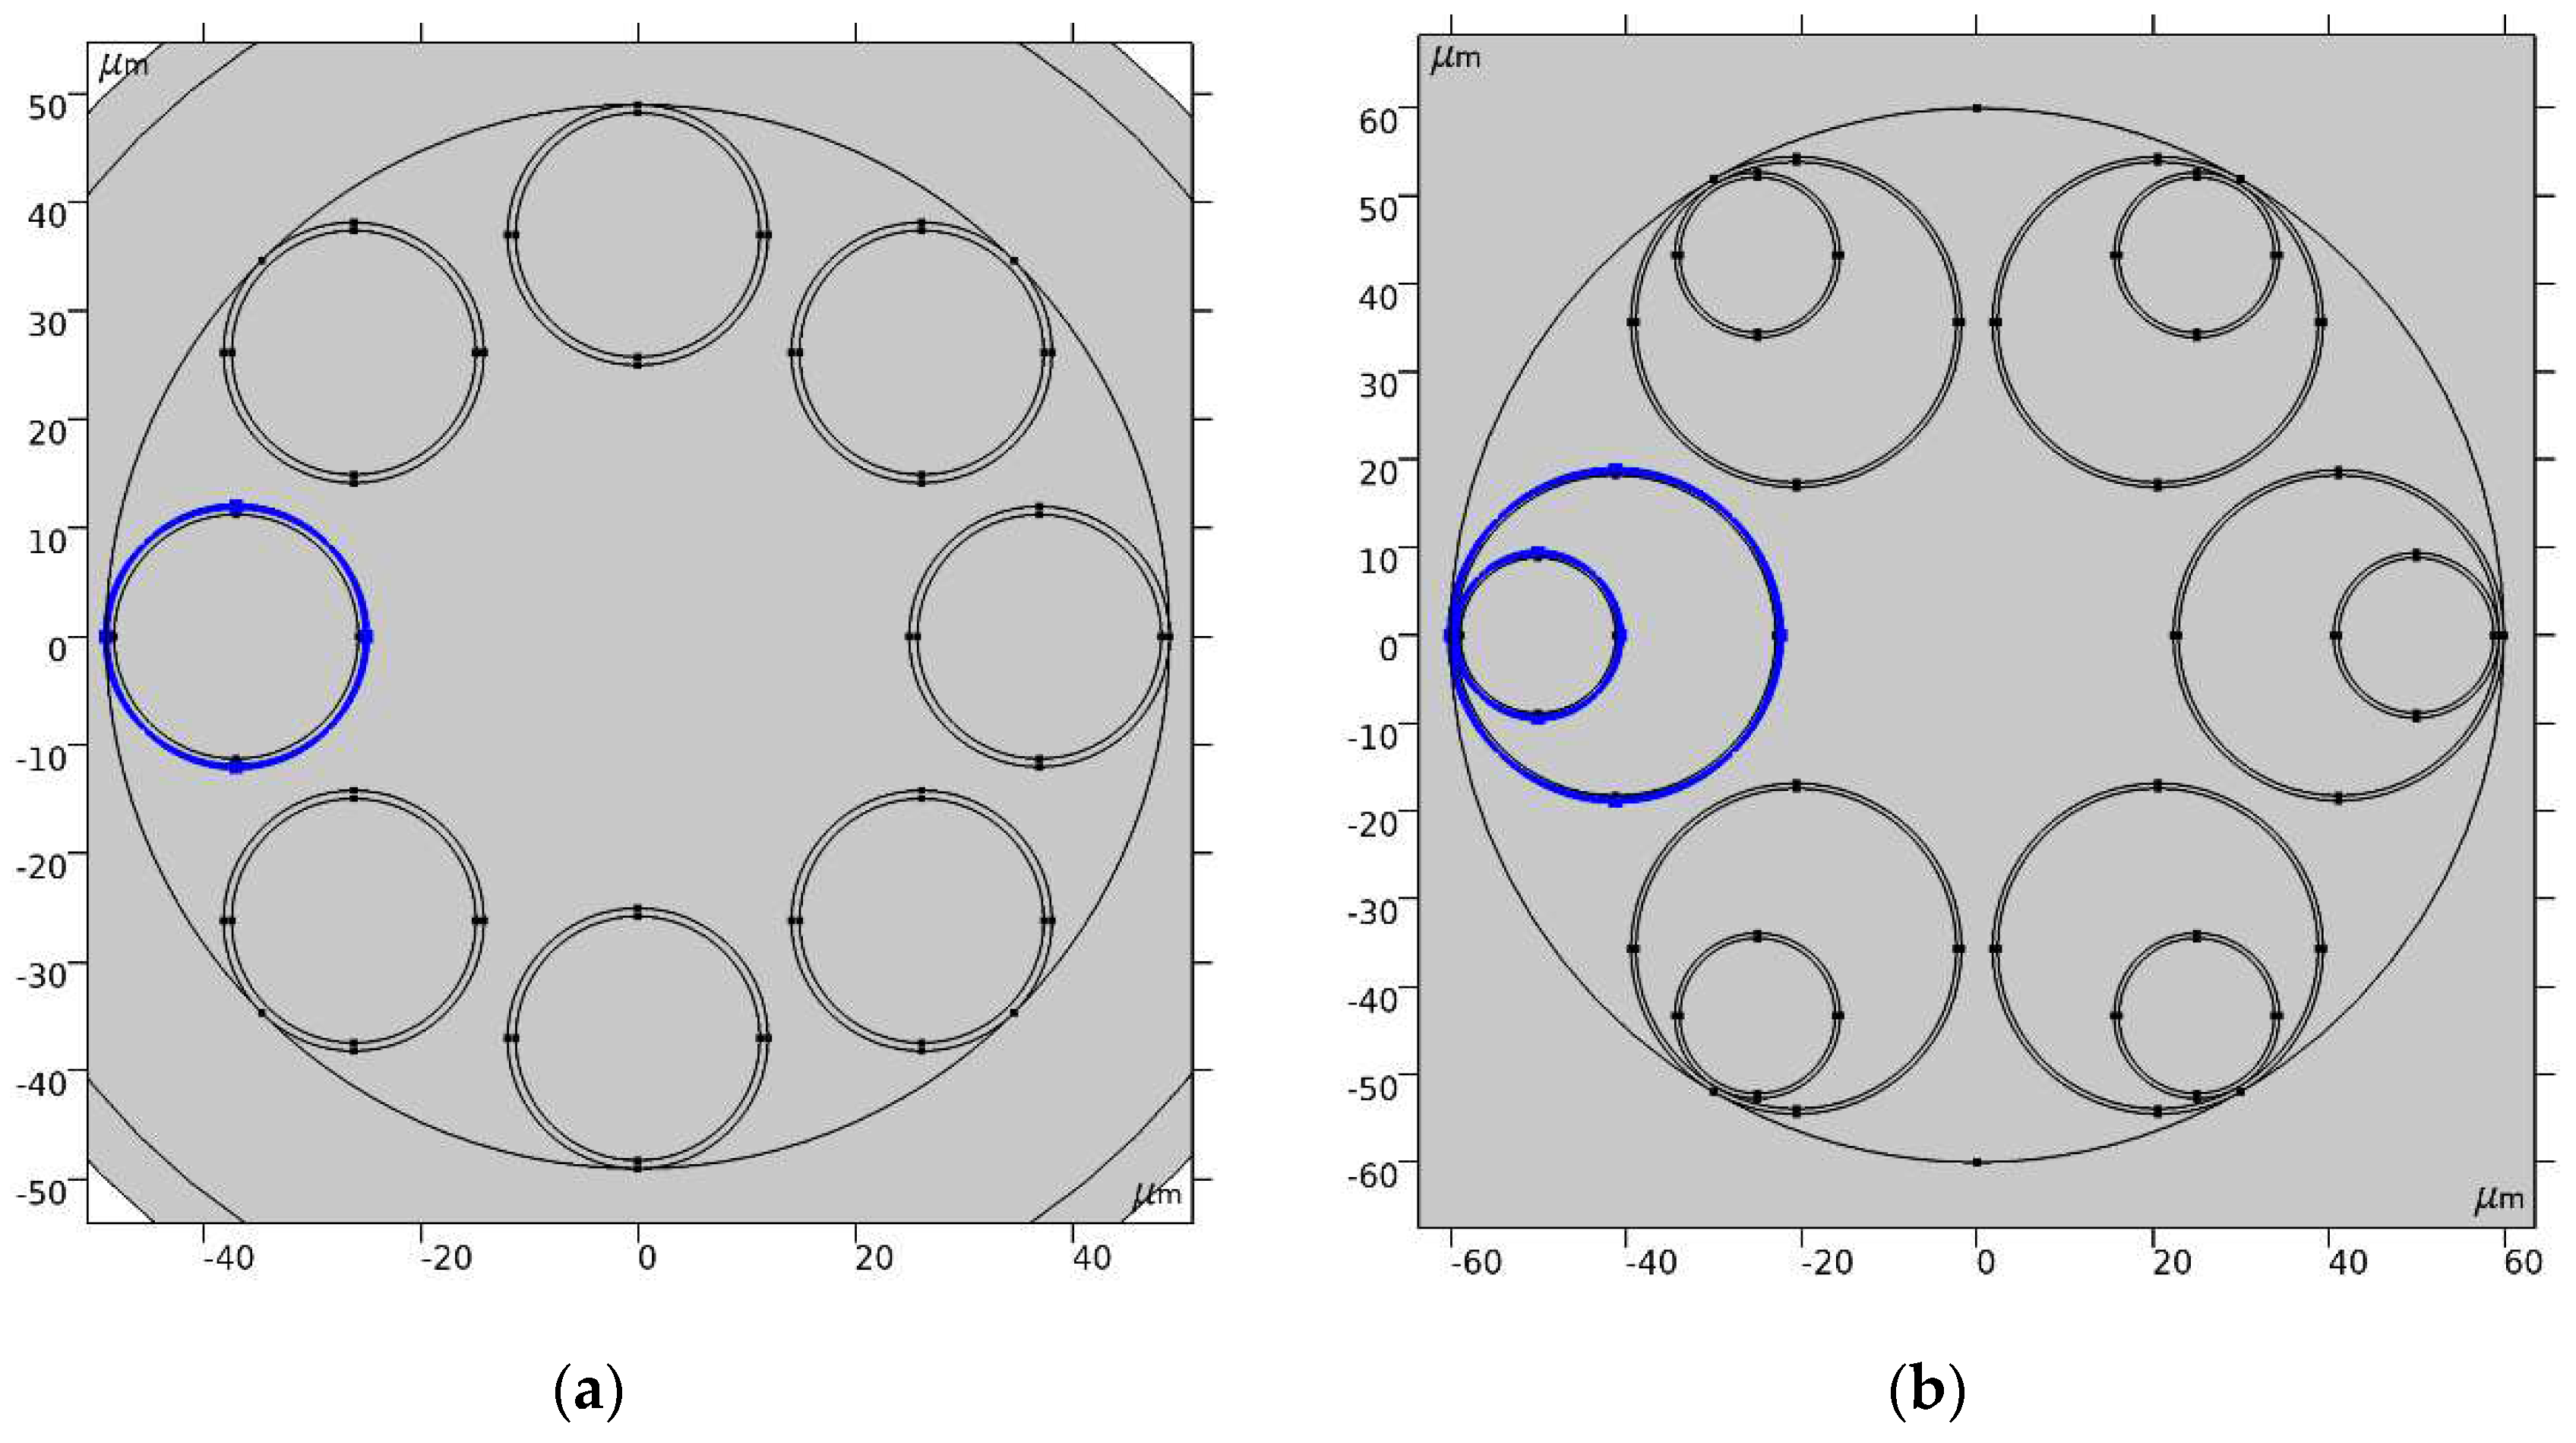
The first of these (
Figure 2a) is a hollow – core fiber with a negative curvature of the core – cladding boundary and an air – core diameter of
= 50 μm, a cladding capillary wall thickness of
t = 750 nm and an outer diameter of the cladding capillary of
= 24 μm. The second is the well – known nested hollow - core fiber, which is considered as the hollow – core fiber with real prospects for applications in telecommunications [
14]. Its geometric parameters are an air – core diameter of
= 44 μm, a capillary wall thickness of
t = 490 nm and an outer diameter of the cladding capillary of
= 37.6 μm, with the outer diameter of the inner capillary being exactly a half of the cladding capillary diameter. The wall thickness of the inner capillary is the same as that of the outer cladding capillary. All numerical calculations in this Section were performed using Comsol.
Let us calculate the distribution of projections of
and
of the local energy velocity (3) for the fundamental air – core mode of the hollow – core fiber shown in
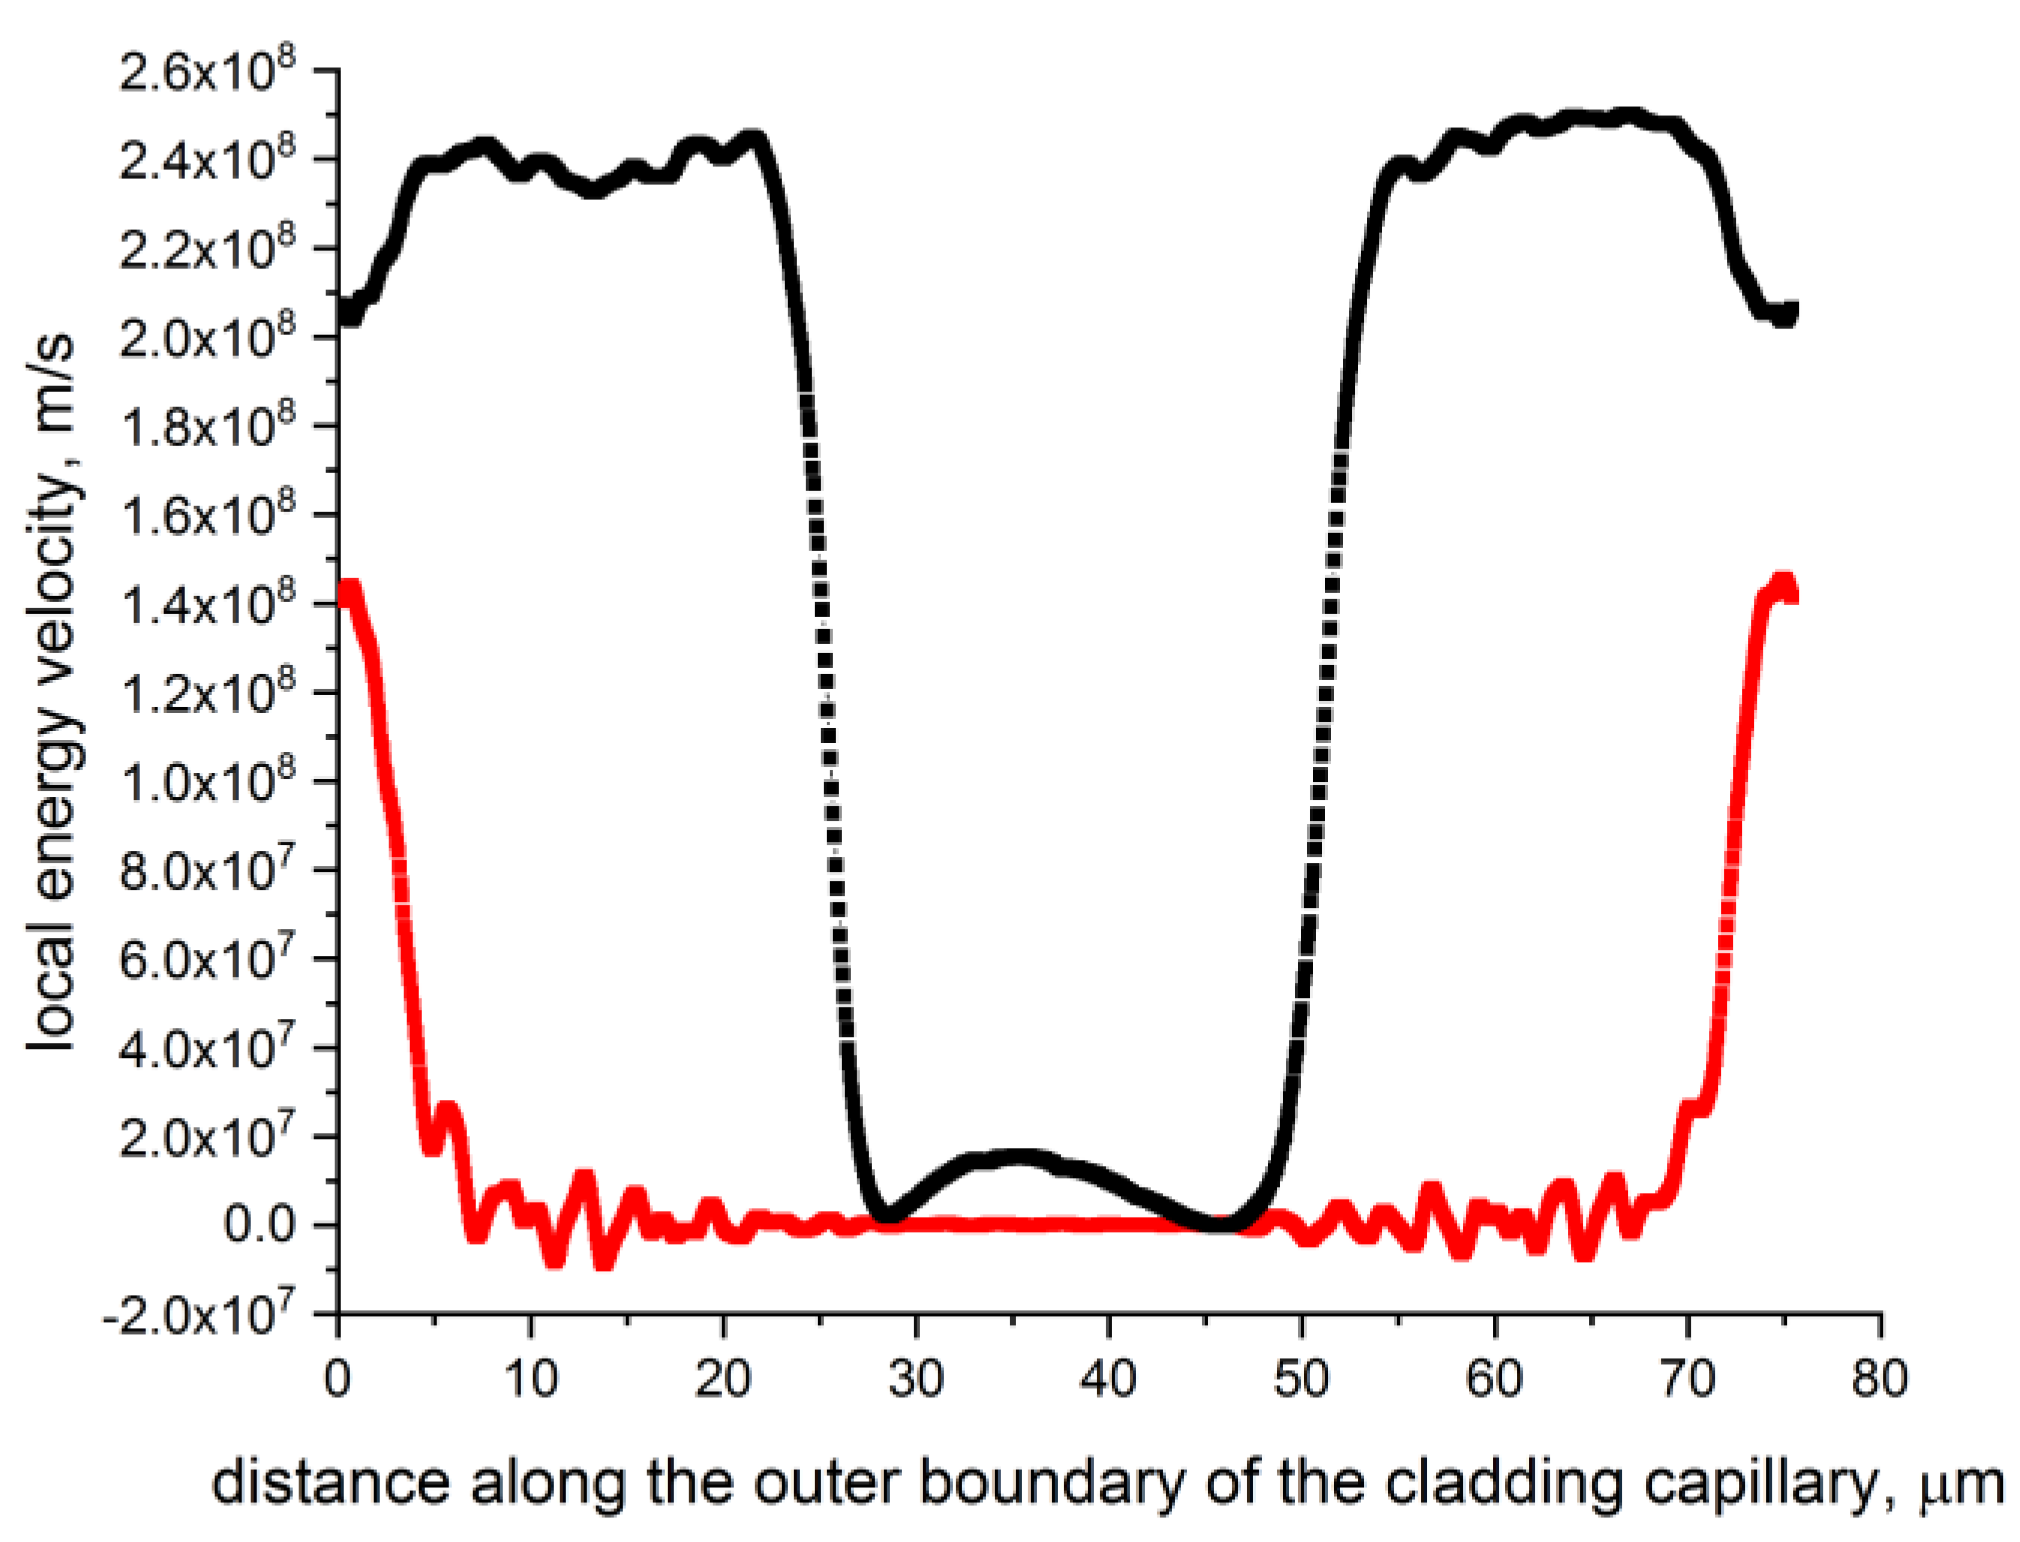
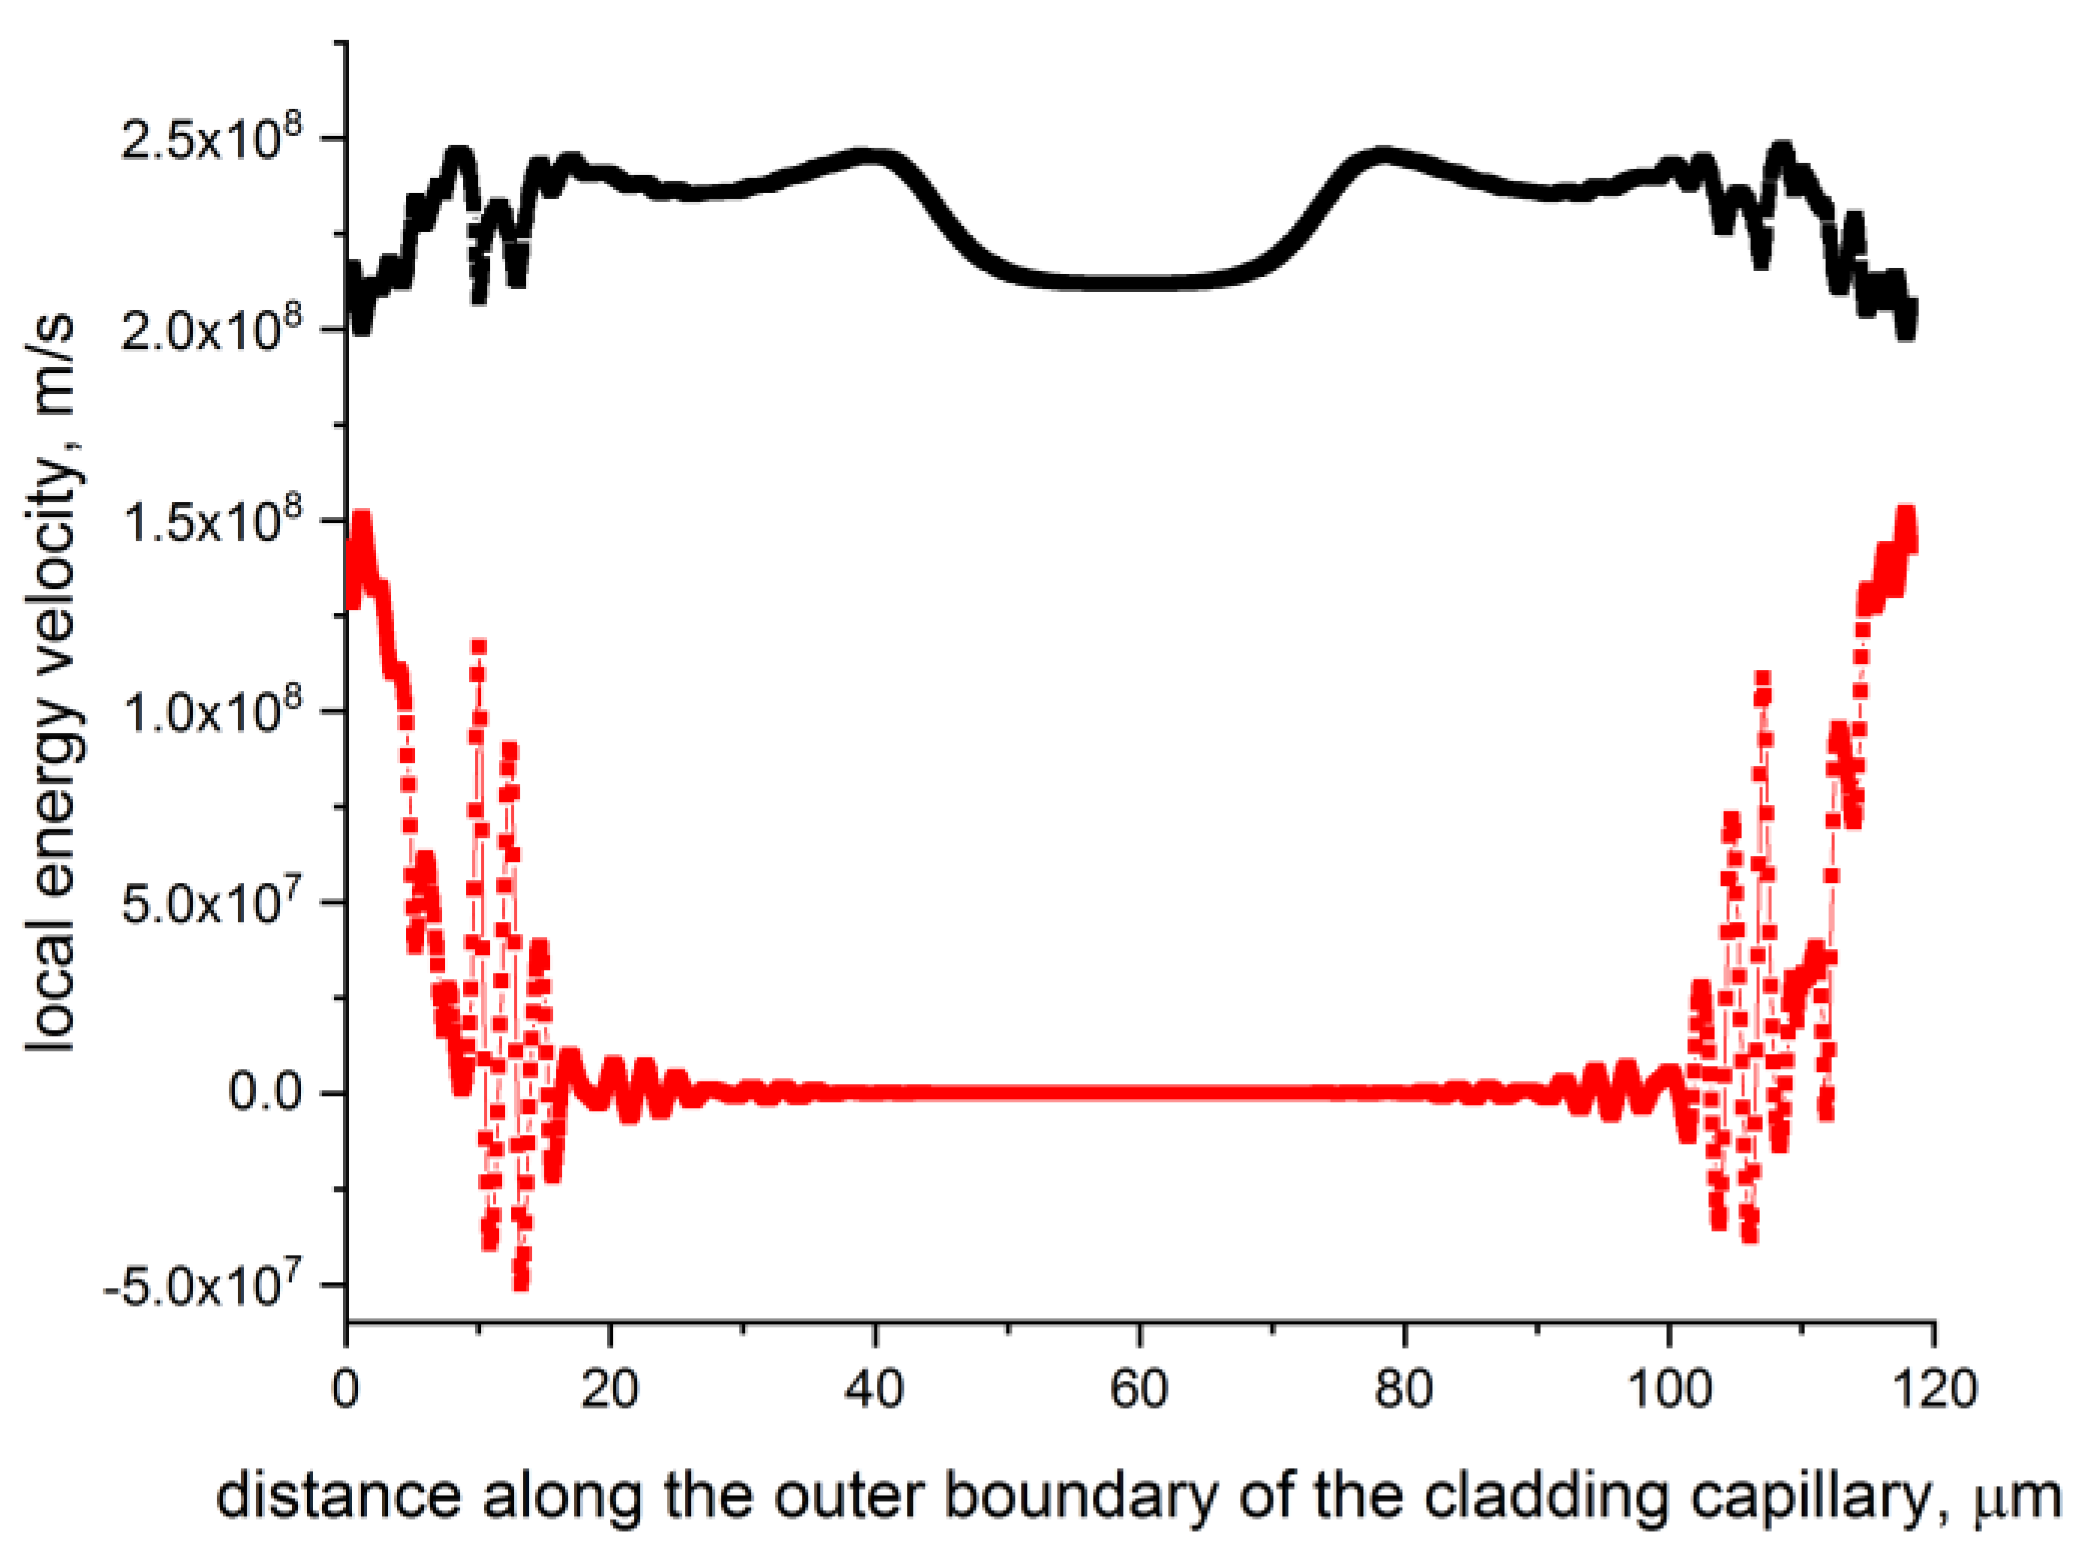
Figure 2a. The wavelength is 1.06 μm, which means that, according to the ARROW model, it corresponds approximately to the center of the second transmission band. The distribution of the axial and radial projections of the local energy velocity of the fundamental air – core mode along the outer boundary of the cladding capillary highlighted in blue in
Figure 2a is shown in
Figure 3.
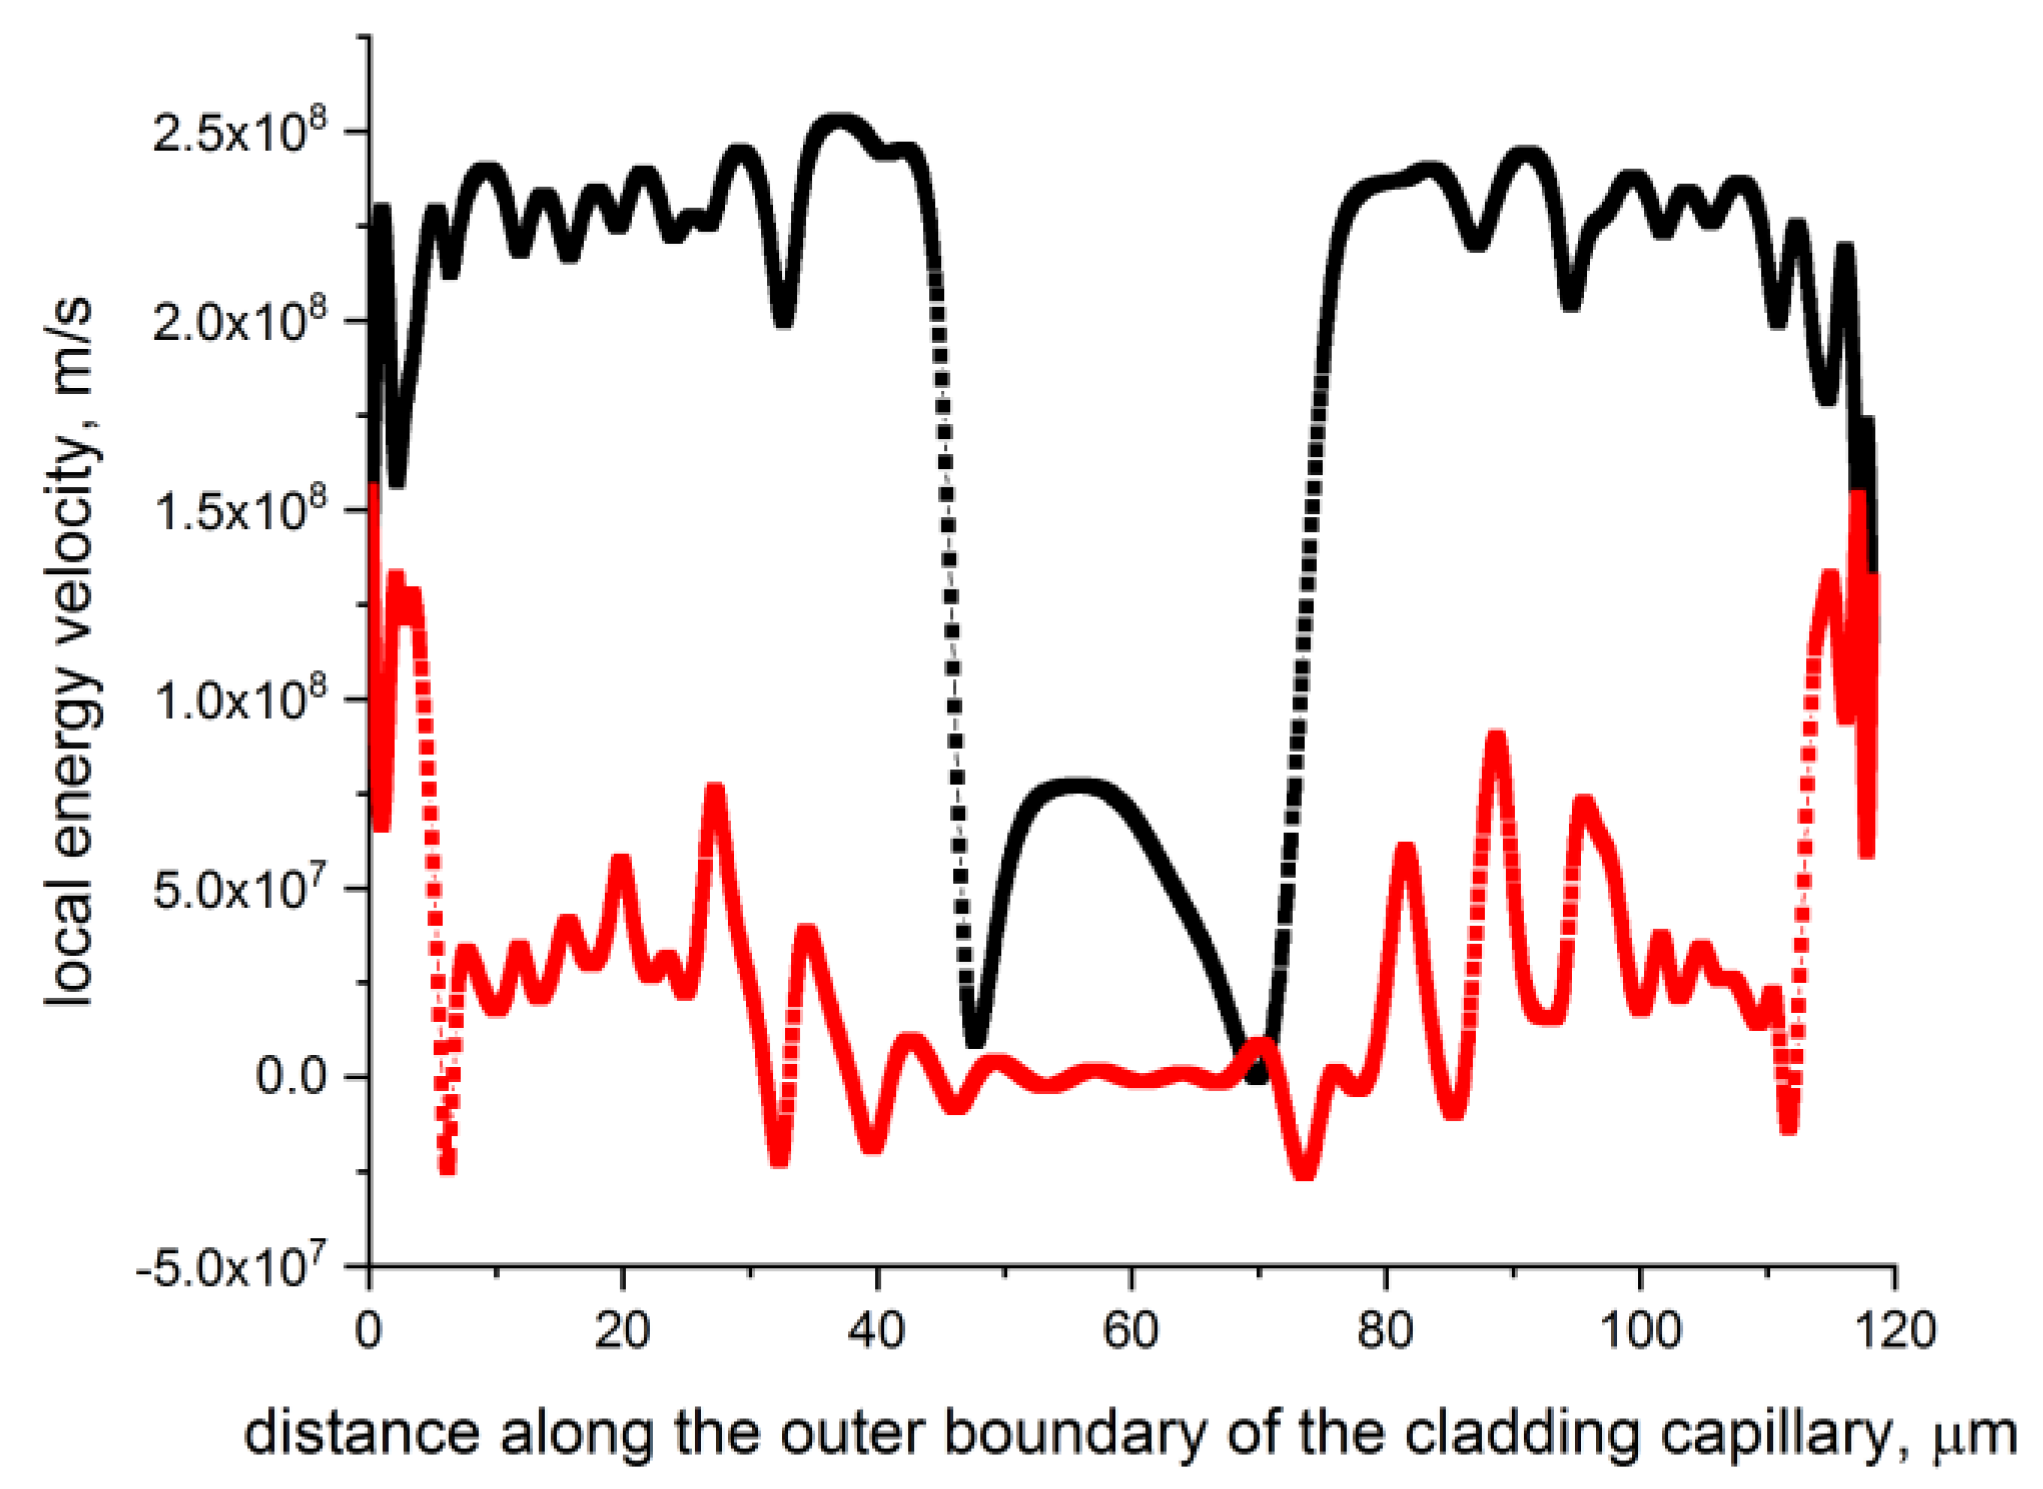
Figure 3 shows that the distribution of the local values of the energy velocity of the fundamental air – core mode at the core- cladding boundary with a negative curvature is qualitatively different from the case of the silica glass capillary considered above (
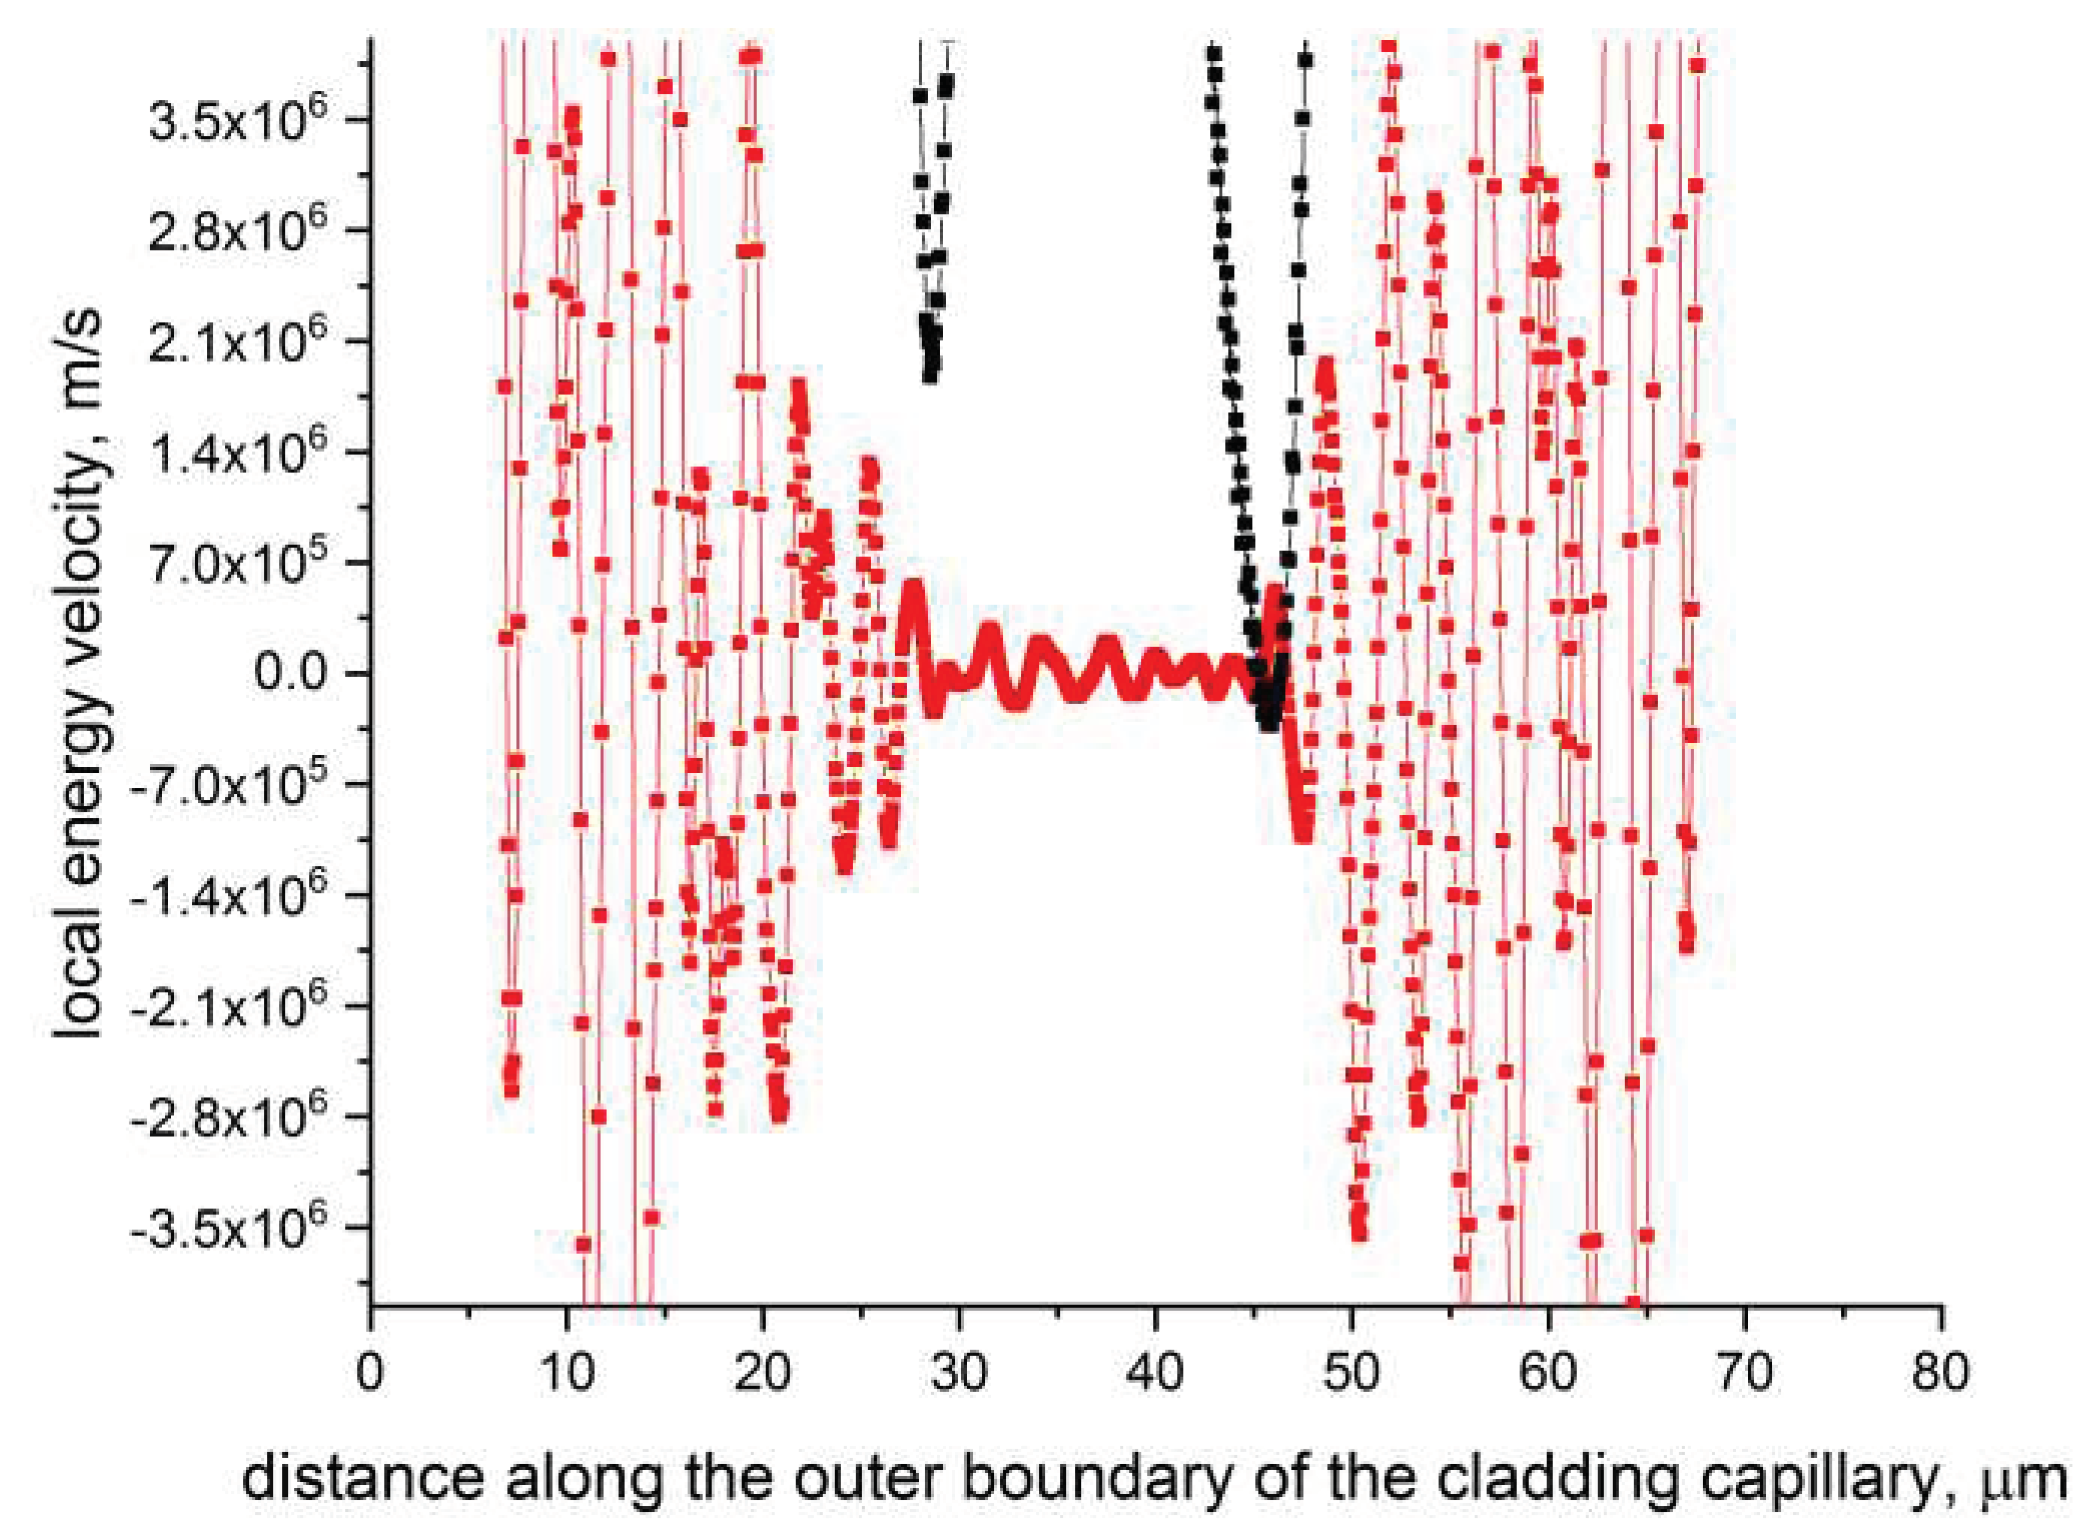
Figure 1). To make this difference even more noticeable, we depicted the same dependencies as in
Figure 3, but on a smaller section of the outer boundary of the cladding capillary (along the abscissa). These distributions are shown in
Figure 4.
In
Figure 3 and
Figure 4, the lowest values of the local energy velocity of the fundamental air – core mode are located on the part of the outer boundary of the cladding capillary closest to the center of the hollow – core fiber. Here, the radial projection of
of the local energy velocity is of the order of 10
4 m/s and is sign – alternating when passing through zero values. At the same time, the greatest increase in the values of the radial projection of the local energy velocity is in the area of the cladding capillary attachment to the supporting tube (
Figure 2 and
Figure 3). It should be noted that the loss of the fundamental air – core mode at a wavelength of λ = 1.06 μm is 1.2 dB/km. This is almost four orders of magnitude less than the losses for an individual capillary considered in the previous Section. Obviously, in the case of the hollow – core fiber shown in
Figure 2a, the energy flow of the fundamental air – core mode performs complex motions in the various regions of the cladding capillary wall. This, among other things, leads to a significant decrease in the rate of the air – core mode energy movement in the region of the capillary wall closest to the fiber center (
Figure 3). There is even a reverse flow of the air – core mode energy along the z – axis (
Figure 4). We will consider the issues related to this movement of the air – core mode energy in future publication.
Let us consider in more detail the behavior of the radial projection of
of the fundamental air – core mode and, correspondingly, the behavior of the radial projections of the Poynting vector (3). It is clear that the locations of the capillary wall regions where
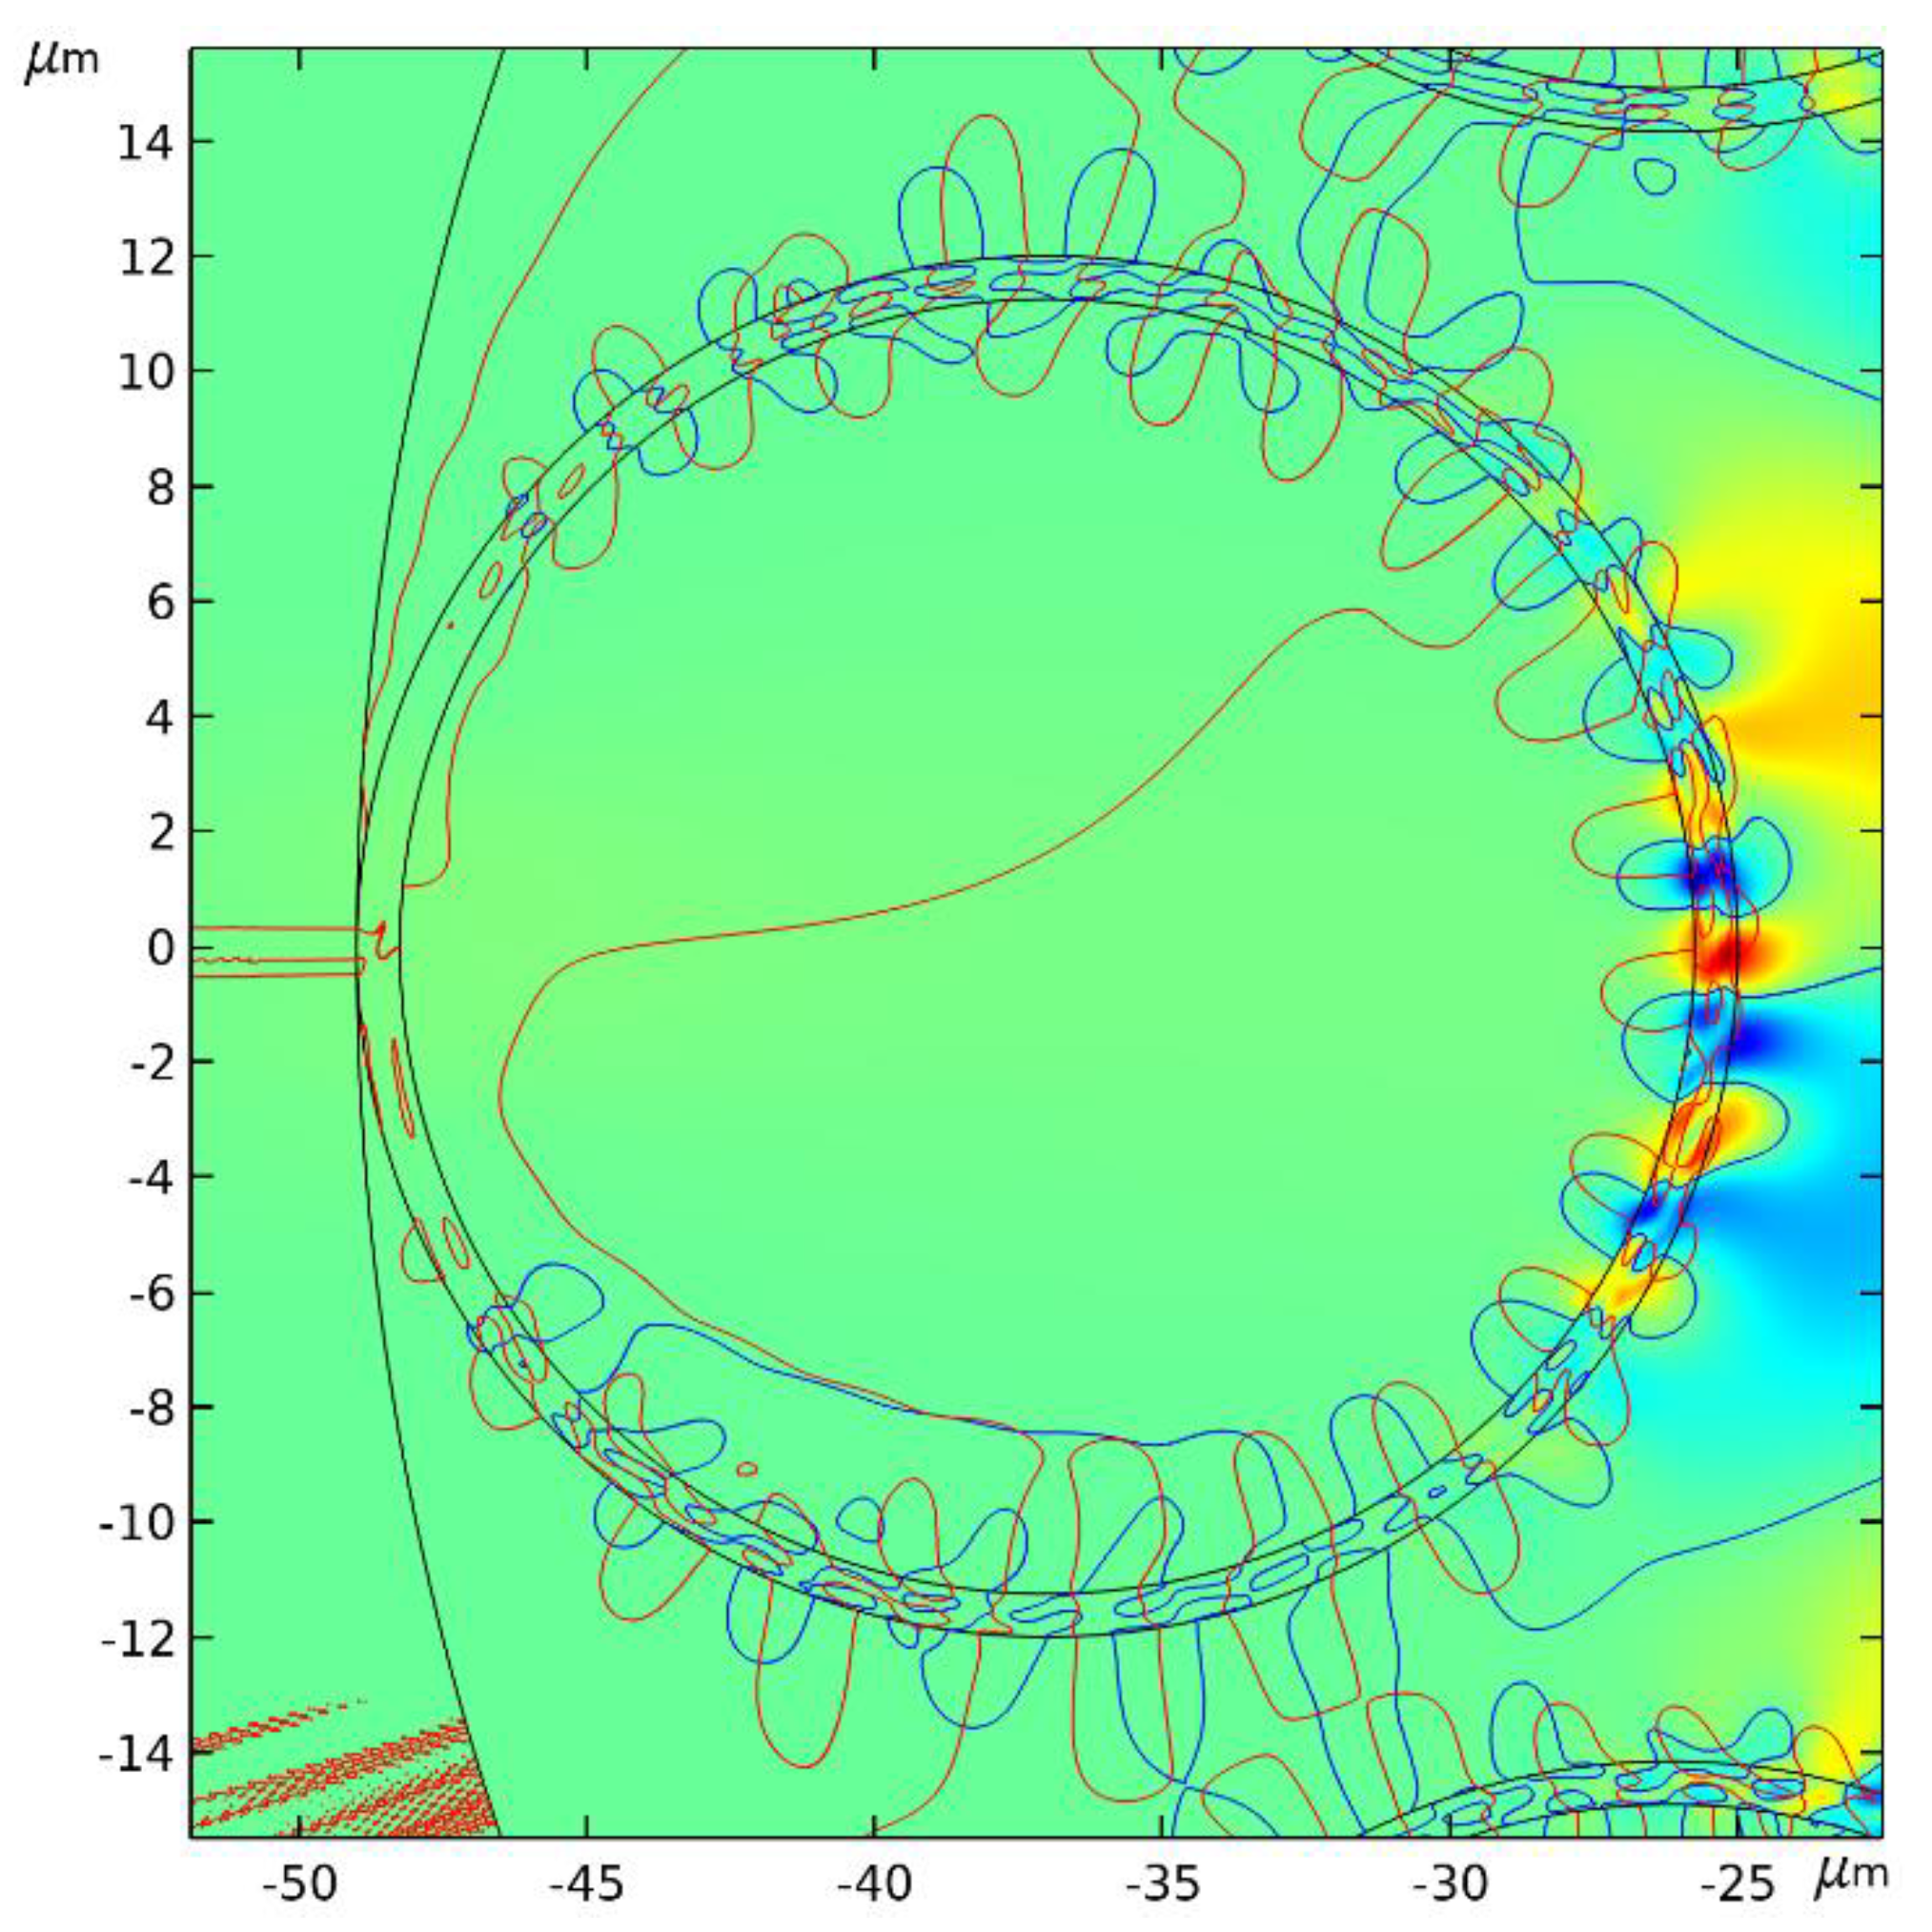
changes its sign should correlate with the locations of the points of the capillary cross – section where the vortex motions of the transverse component of the Poynting vector of the air – core mode occur. The positions of singularities of the transverse component of the Poynting vector
of the fundamental air – core mode in the cladding capillary wall are determined by the equation of
, since the streamlines of the transverse component are determined by the following equation:
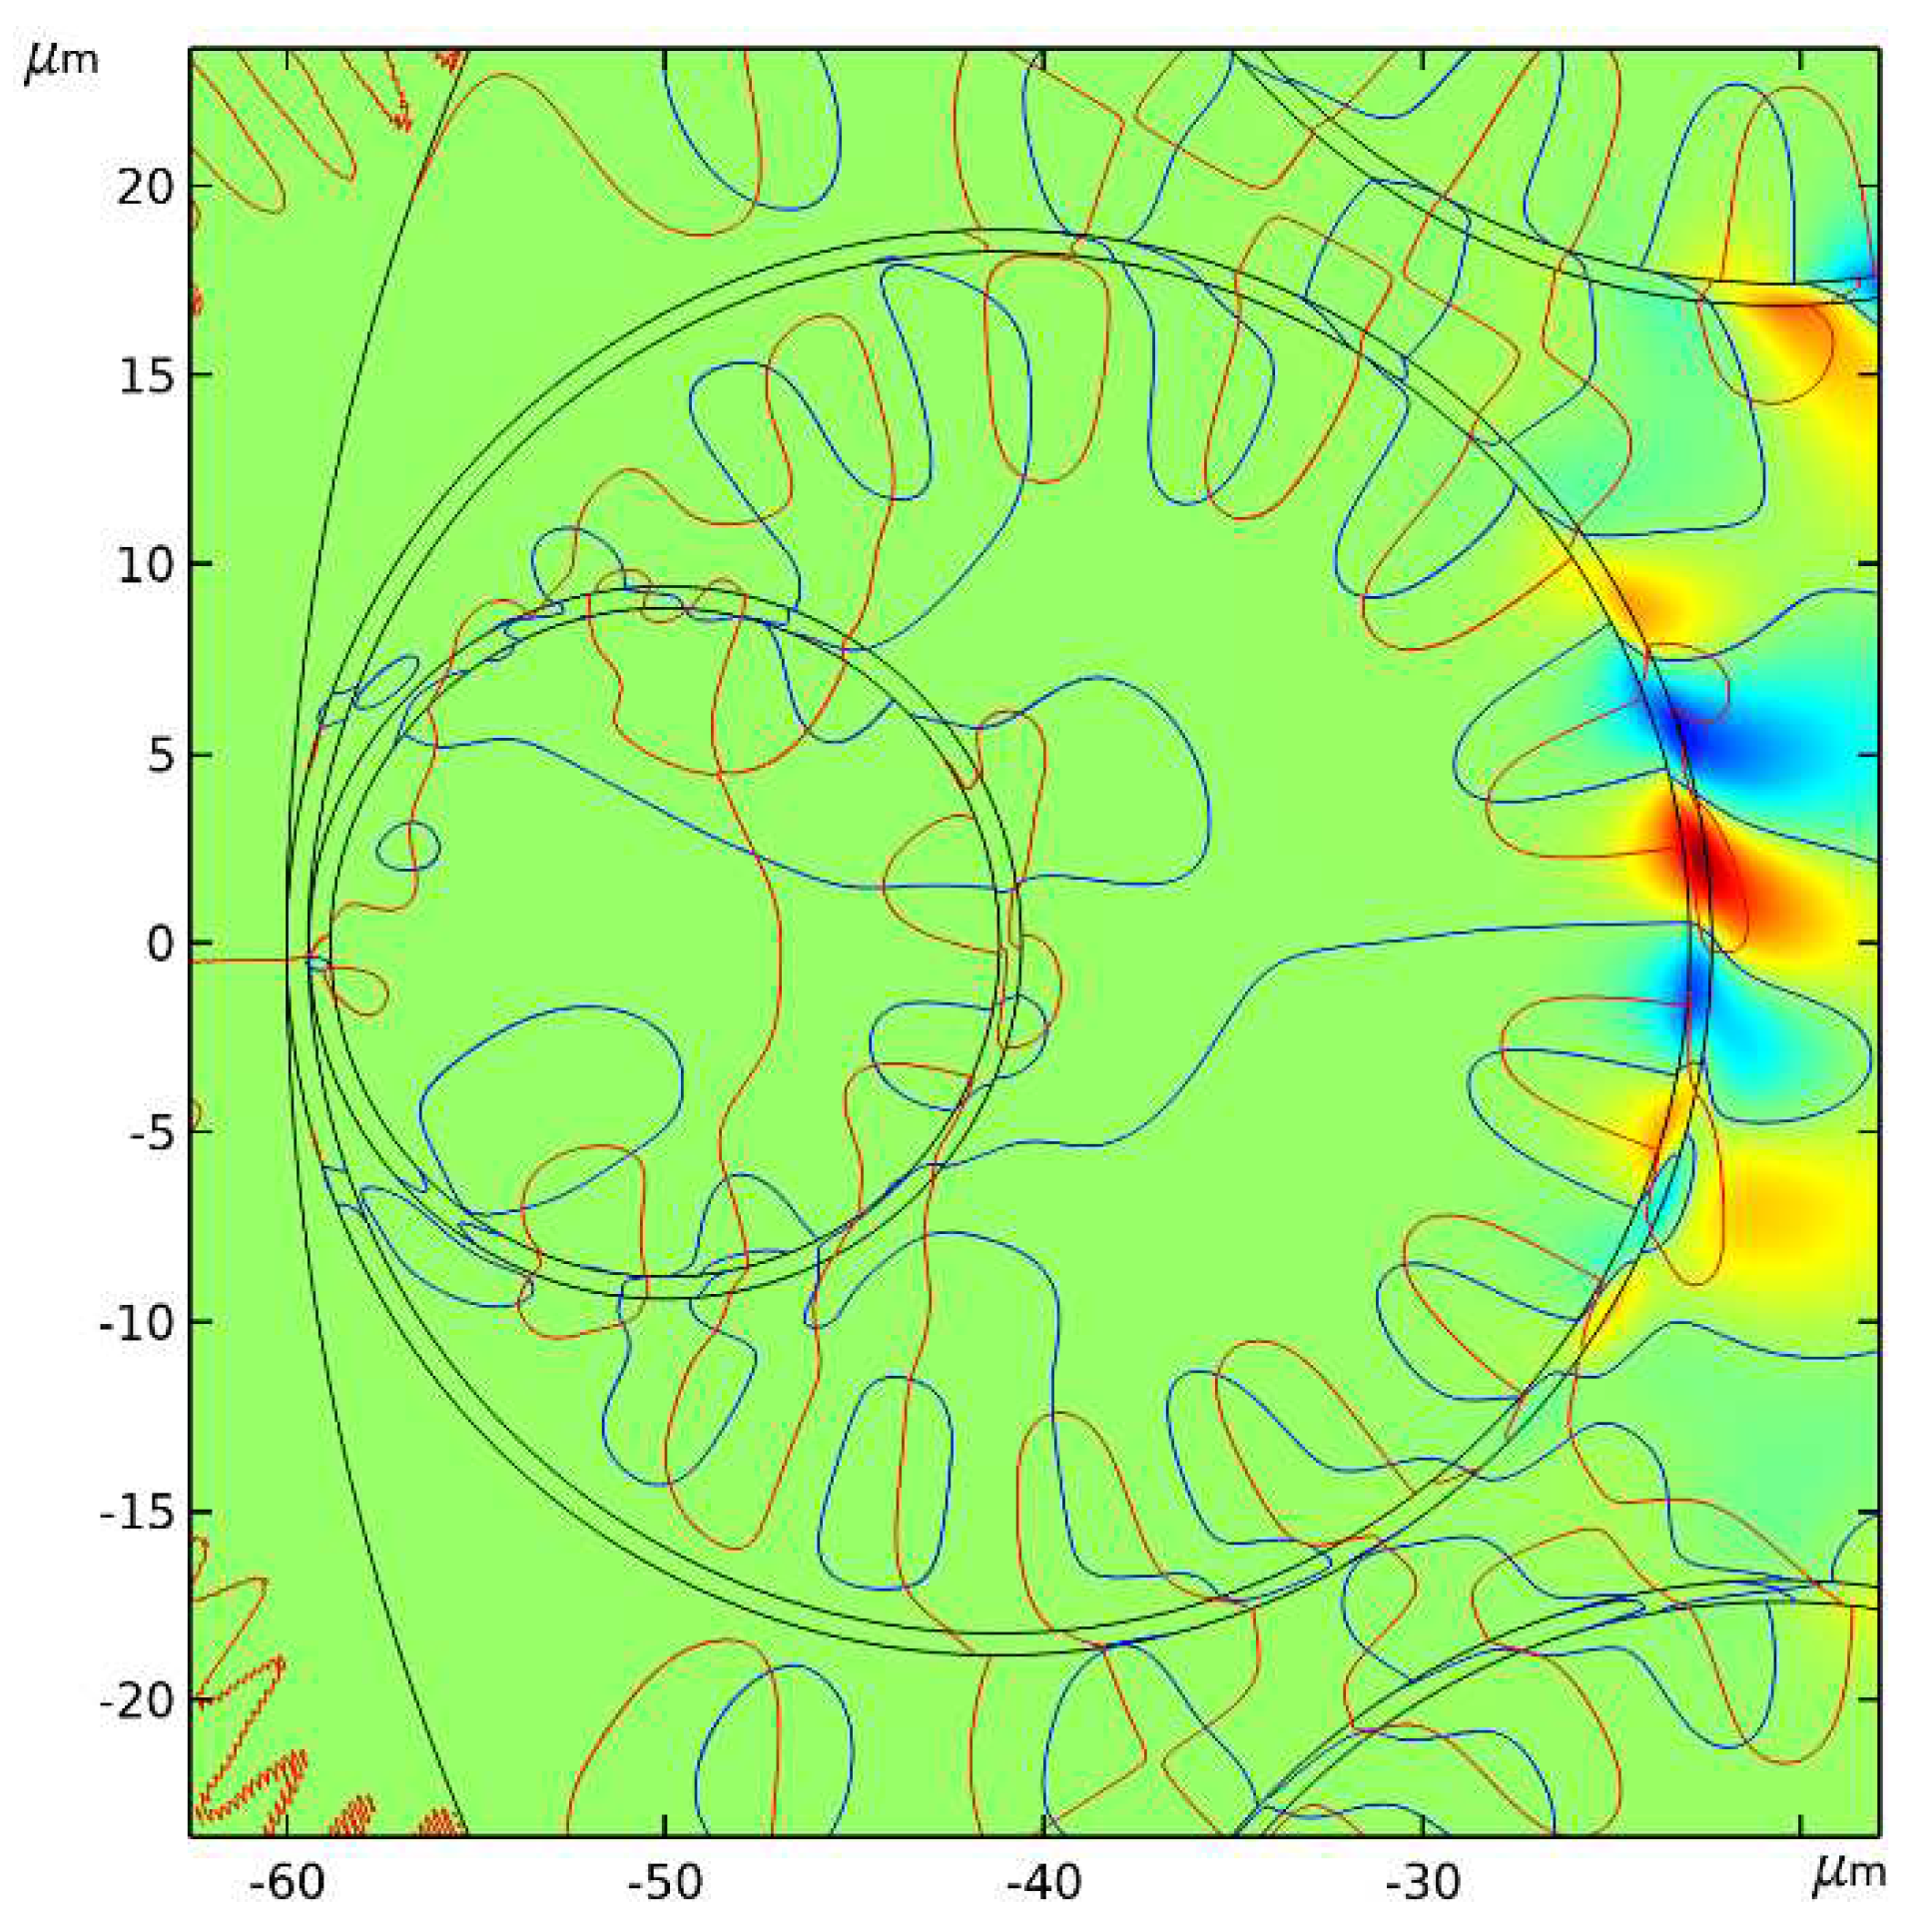
The corresponding curves are shown in
Figure 5 in blue and red for the cladding capillary discussed above (
Figure 2a).
Figure 5 shows that the curves
have a more ordered and periodic structure in the region of the cladding capillary wall closest to the center of the hollow – core fiber. The structure of the curves is not ordered and disappears in the region where the cladding capillary is attached to the supporting tube. Thus, in the regions of the cladding capillary wall where there is an ordered distribution of singularities of the transverse component of the Poynting vector of the fundamental air – core mode, the local energy velocity of the mode reaches the minimum values and, therefore, leads to the minimum leakage of the air – core mode energy. In the regions of the cladding capillary wall where there is no such structure of singularities of the Poynting vector, the radial projection of the local energy velocity and the outflow of the air – core mode energy is maximal.
This effect can be greatly enhanced for nested hollow – core fibers (
Figure 2b). Let us consider than the analogous behavior of the local energy velocity of the fundamental air – core mode at the cladding capillary boundaries of the nested hollow – core fiber (
Figure 2b). The distribution of
and
will be examined for two wavelengths of 1.55 μm and 2.7 μm in the longest wavelength transmission band. The air – core mode losses at these wavelengths are 0.05 dB/km and 5.7 dB/km, respectively. The distribution of the axial
and radial
projections of the local energy velocity of the fundamental air – core mode at the outer boundary of the large cladding capillary at wavelength of 1.55 μm are shown in
Figure 6.
As we can see from
Figure 6, the segment of the boundary of the big cladding capillary wall, in which the radial projection of the local energy velocity
falls, comes close to the region where the cladding capillary is attached to the supporting tube. In this case,
decreases on average up to 10
4 m/s in the region nearest to the center of the nested hollow – core fiber. The corresponding distribution of the curves
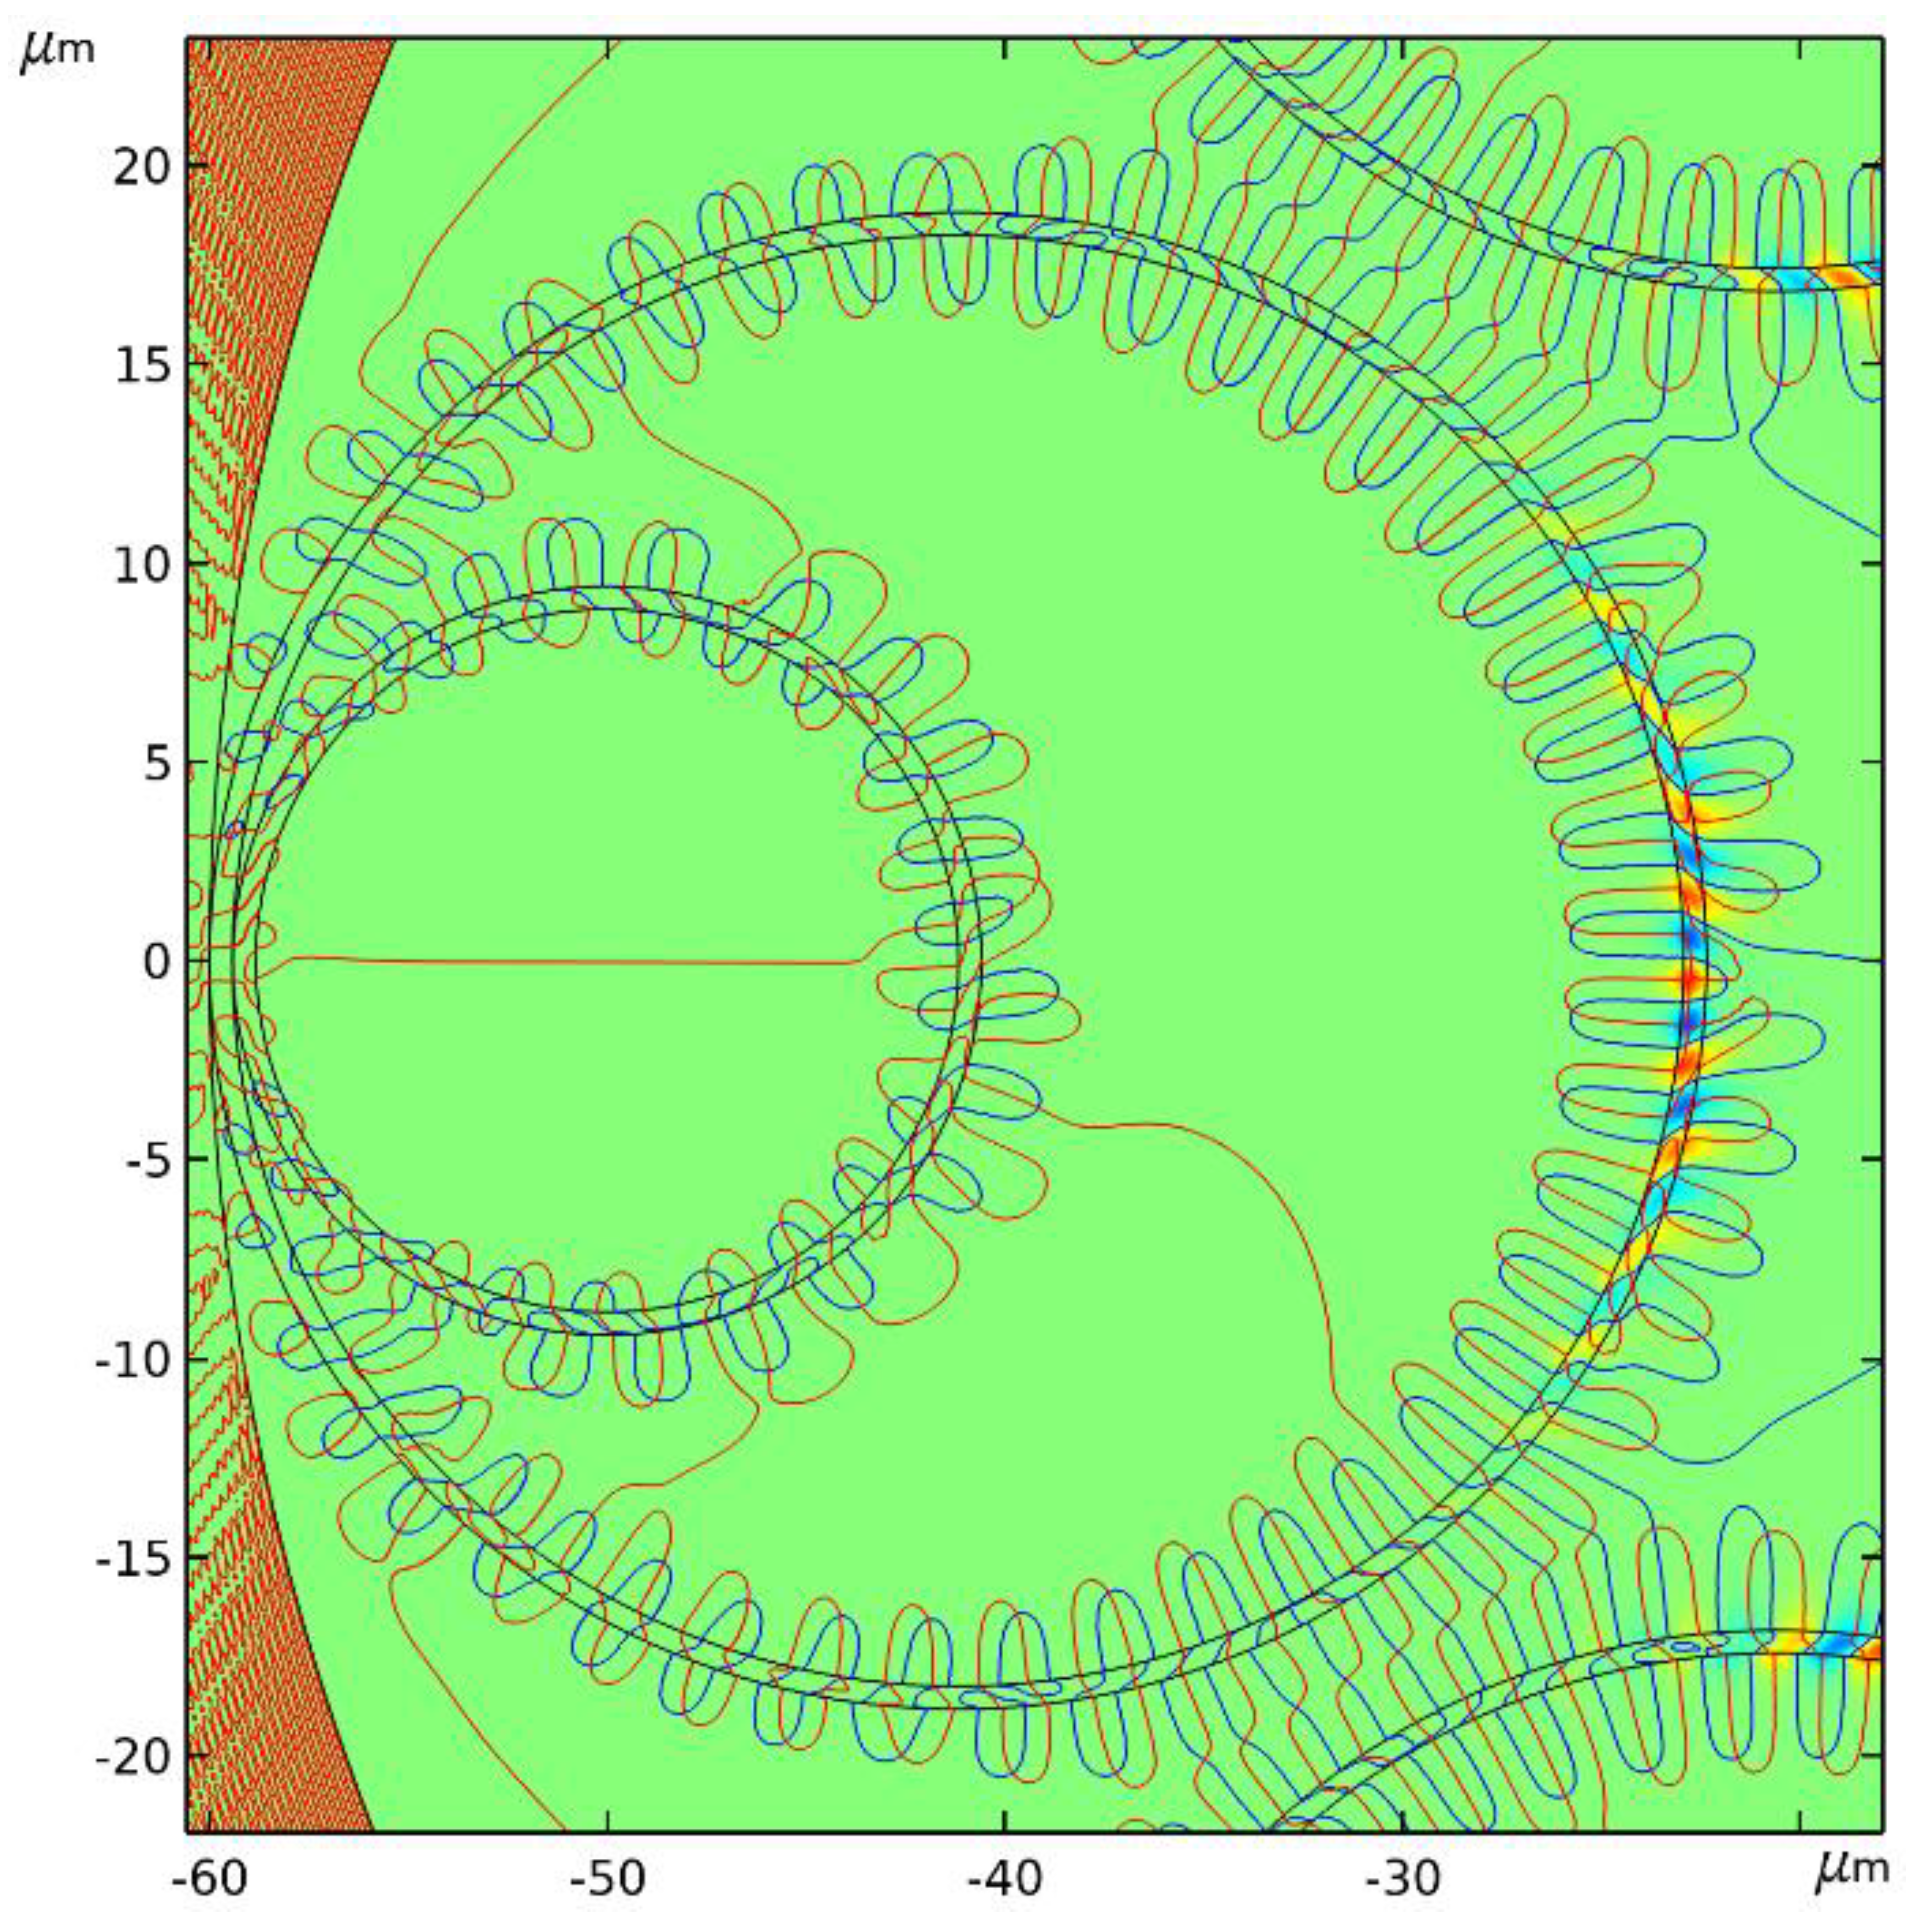
in the large cladding capillary wall for the fundamental air – core mode is shown in
Figure 7.
It can be seen from
Figure 7 that there is an ordered distribution of singularities of the transverse component of the Poynting vector of the fundamental air – core mode along virtually the entire wall of large and small cladding capillaries. This correlates well with the position of the large cladding capillary wall region in which the radial projection of the local energy velocity decreases (
Figure 6) and, as a result, the outflow of the fundamental air – core mode energy decreases. The axial projection of the local energy velocity does not have negative values in the case of small losses in the nested hollow – core fiber (
Figure 6). It can be demonstrated that similar behavior of
and
is also observed for a small cladding capillary in the nested hollow – core fiber.
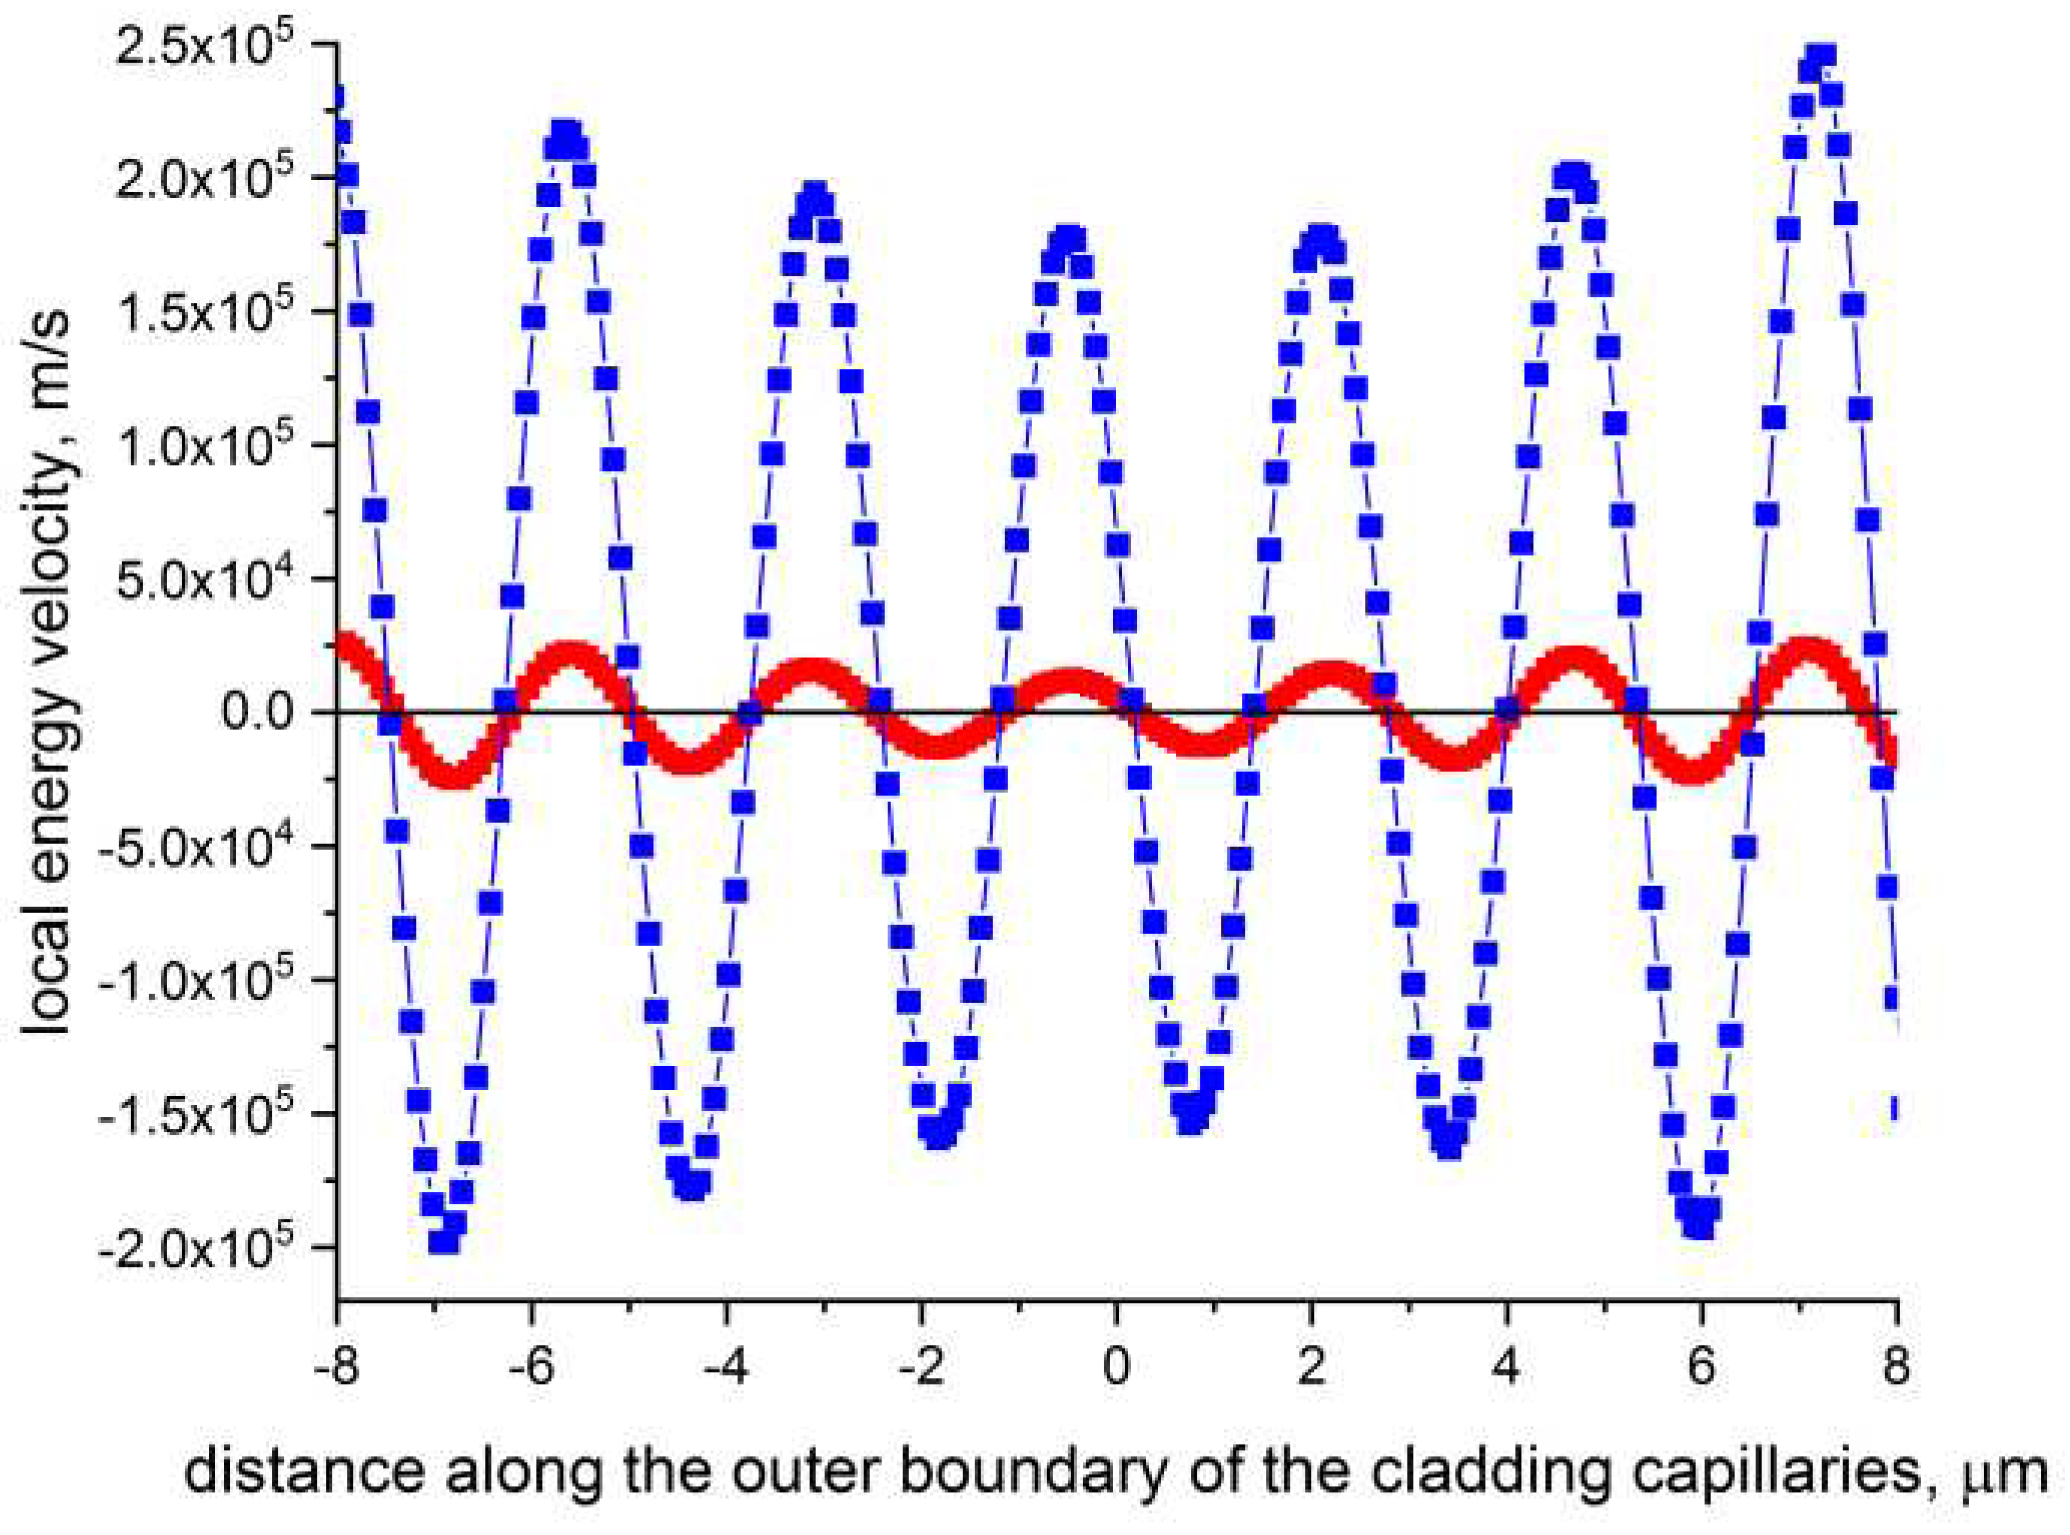
To better demonstrate the alternating behavior dynamics of the radial projection of the local energy velocity of the fundamental air – core mode on the outer boundaries of the small and large cladding capillaries (
Figure 2b), we showed the distribution of
in the same segment of the outer boundary of both cladding capillaries (
Figure 8). Counting in the negative and positive directions was carried out for the cladding capillaries marked in blue in
Figure 2b from the y – axis = 0.
Figure 8 shows that the radial projection of the local energy velocity oscillates with strict periodicity along the outer boundaries of both cladding capillaries and has zero values for the same values of the azimuthal angle. In addition, the amplitude value of the radial projection of
increases by about one order of magnitude at the outer boundary of the small cladding capillary. It can also be seen that by averaging the values of
along the given segment of the outer boundaries of both cladding capillaries, we obtain a value close to zero. This means that the power flow of the fundamental air – core mode is blocked in the radial direction in this segment of the cladding capillaries boundaries, in the same way as in planar waveguides made of metamaterials [
12].
In conclusion, let us consider the behavior of the local energy velocity of the fundamental air – core mode of the nested hollow – core fiber and its distribution of the transverse component of the Poynting vector in the case of an increase in the losses in the longest wavelength transmission band at a wavelength of 2.7 μm. The distribution of the axial
and radial
projections of the local energy velocity of the fundamental air – core mode at the outer boundaries of a large cladding cladding capillary at wavelength of 2.7 μm are shown in
Figure 9.
The projections distribution of the local energy velocity of the fundamental air – core mode of a nested hollow – core fiber at increased losses are qualitatively similar to the distribution of these projections for a hollow – core fiber with a cladding consisting of eight capillaries (
Figure 3). Oscillations of the values of the radial projections of the local energy velocity with a large amplitude occur along a much larger segment of the cladding capillary wall than in the case of small losses (
Figure 6). In addition, the segment of the capillary wall on which a significant decrease in the radial projection of the local energy velocity occurs, is much smaller than in the case of small losses. All this suggests that a significant rearrangement of the structure of the singularities of the transverse component of the Poynting vector of the fundamental air – core mode should take place. This can be seen from
Figure 10.
The number of singularities of the transverse component of the Poynting vector of the fundamental air – core mode along the capillary wall has significantly decreased, and so did the order of their arrangement. The periodicity of the arrangement of singularities on a small capillary wall, observed for small losses, has, in fact, disappeared. All this points out to a direct connection between the occurrence and location of the singularities of the Poynting vector of the air – core mode and the behavior of leakage losses in hollow – core fibers.
4. Discussion
In this paper, we have considered two types of most commonly used hollow – core fibers, namely, a single silica glass capillary and a hollow – core fiber with a negative curvature of the core – cladding boundary. Until recently, there have been extensive discussions about which model best describes light localization in the second type of the hollow – core fibers. In the case of light localization in a glass capillary, the situation is quite clear, since the radial projection of the Poynting vector of the fundamental air – core mode does not change sign in the capillary wall, the curves do not intersect each other and do not wind along the core – cladding boundary. In this case, we can say that the ARROW model proposed for planar waveguides, to a good approximation, describe the process of antiresonant reflection from the capillary wall despite its curved boundary. This is especially true for capillaries with core diameters which are large compared to the wavelength. The local energy velocity of the air – core mode can be expressed analytically and has a periodic distribution along the azimuthal direction. Its radial projection of has values approximately an order of magnitude smaller than the axial projection of. In addition, as mentioned above, the radial projection has positive values along the entire wall of a single capillary. Therefore, the leakage losses in the silica glass capillary are always high in the near and mid IR spectral range. Thus, the curvature of the core –cladding boundary in the case of a silica glass capillary plays an implicit role, and the degree of light localization in the air – core is determined mainly by the capillary wall thickness and its ratio with a wavelength used in each case.
However, a hollow – core fiber with a negative curvature of the core – cladding boundary manifests a very different behavior. In this case, the values of the radial projection of the local energy velocity of the fundamental air – core mode drop by several orders of magnitude compared to the speed of light in air over most of the cladding capillary wall boundary. In addition, it periodically vanishes and changes sign along the cladding capillary wall. The air – core mode energy does not move in the radial direction at points of zero values of the radial projection of the local energy velocity. This happens because singularities of the transverse component of the Poynting vector of the fundamental air – core mode appear along the cladding capillary wall, in the vicinity of which the power flow of the air –core mode has both positive and negative values in the radial direction. This leads to a mutual cancellation of the power flows of the air – core mode in the singularity region. Similar areas of singularities for the transverse component of the Poynting vector of the fundamental air – core mode are also observed between the cladding capillaries, which leads to additional blocking of the air – core mode energy in the air – core of the hollow – core fiber and to a further decrease in its losses. As already mentioned in the Introduction, similar phenomena occur in a planar sandwich waveguide structure consisting of epsilon – negative/left – handed/epsilon – negative metamaterials, when the power flows of vortex guided mode are cancelled almost totally between the core and the cladding.
In conclusion, we would like to hope that the ideas expressed in this work can help to better understand the mechanism of radiation leakage in hollow – core fibers with a complex shape of the core – cladding boundary.
