1. Introduction
The global energy market is experiencing, in recent years, a considerable growth of request. This is accompanied by a significant increase in the sale and supply price and it is very likely that this trend will continue in the next years. The growing need for energy is manifested in its most striking form in the industrial field, where it is very frequent the execution of processes, of a different nature, with high or very high energy content. The more the power required by a process is high, the more important becomes the optimal selection of the drive technology of the machine used to perform the task. Typically, hydraulic technology is characterized by a high power density, much higher than that obtainable with pneumatic or electric drives. Therefore, the hydraulic technique is the preferential choice when the power involved in an industrial plant is high. In such circumstances, the economic savings deriving from the pursuit of high energy efficiency objectives is a corporate priority. Energy dissipation in hydraulic systems can be significant. The distributed pressure drops that can occur in the piping network or in the components of the hydraulic circuit determine upstream a pressure higher than that actually required by the actuators with a consequent increase in the absorbed power.
Furthermore, the chosen architecture for power generation has a very significant influence on the energy efficiency of the system. For example, in many systems a considerable amount of oil-hydraulic energy is dissipated between the inlet and outlet ports of the pressure relief valve, when dissipative speed adjustments of the actuators are obtained. This peculiarity of hydraulic technology clearly represents a factor that contributes to a fair degree of intrinsic inefficiency, but also determines a significant margin of potential for improvement that can be obtained through innovation. Therefore, hydraulic technology dedicated to the implementation and control of industrial machinery is a fertile ground in which to cultivate and develop design solutions characterized by an ever-increasing level of energy efficiency.
For hydraulic applications in the industrial field or in the mobile applications, low energy consumption control systems and architectures that optimize overall efficiency have been studied and developed. Many auxiliary energy recovery circuits been investigated for hydraulic equipment. The most studied energy recovery circuits are based on accumulators, gas cylinder, gravitational potential energy, flywheel, generator super capacitor or generator-battery circuits. The hydraulic energy regeneration system (ERS) with the accumulator is excellent for machines that need to start and stop often, according to Tianliang et al. [
1], who discussed several forms of ERS used in hydraulic construction gear.
Ho and Le in [
2] presented a hydraulic system with high efficiency, which saves about 20% energy compared with systems without energy recovering. A high pressure hydraulic accumulator, a relief valve, an AC servo-motor, a fix displacement hydraulic pump, a hydraulic cylinder, seven directional controlled valves, a tank are the main components of the system. The method uses check valve to boost the pump using a low pressure accumulator as a tank. The flow direction to the pump is controlled by two check valves and the hydraulic cylinder velocity is regulated through the motor speed regulation. The high pressure accumulator boosts the pump and is used to store recovery energy. Due to the shifting algorithm of the valves, this system may operate in different configurations, allowing it to be flexibly modified to meet the desired operating requirements, such as high velocity, or torque but also high effectiveness of energy recovery from the load.
Niu et al. in [
3] propose an innovative multifunctional energy-saving electro-hydraulic servo system. A servo-motor actuated the pump with a pressure regulation, two proportional valves and four switches, whose tuning allows to select three different control modes: single-valve independent control (SI), separate meter in and separate meter out control (SMISMO) and dual valve parallel control (DP). The supply pressure is controlled through a disturbance observer and the supply flow is controlled with a grey predictor. The experiments demonstrated supply pressure and flow loss reduction, and consequently an energy saving result.
In [
4] Schmidt and Hansen introduce the concept of multi-cylinder/motor drives connection as a variable-speed drive network. Electrical and hydraulic interconnected variable-speed displacement units allow for the complete avoidance of throttle elements, while also for the sharing of auxiliary functions and fluid reservoirs, as well as hydraulic and electric power.
Xu et al. in [
5] presented an analytical technique based on the mathematical energy dissipation model of hydraulic components in order to calculate the system energy dissipation by creating a high precision simulation model. They applied the method to a 10000 kN fine blanking press.
Similarly, in order to identify the cause of the low energy efficiency in large and medium-sized hydraulic presses, Zhao et al. [
6] suggested an analytical method for quantifying energy flow in the system. Starting from the basic formula of energy consumption, they identified a limited number of unknown coefficients, whose values can be estimated through experiments.
Based on an investigation of the energy flow characteristics of the hydraulic system, Li et al. [
7] proposes an energy-saving strategy by balancing the load of press operations. The method involves sharing the drive system’s motor pumps at different times with a unit made up of two hydraulic presses in order to minimize energy loss during unloading activities. These two presses are also coupled, and during some operations the extra energy from one press can be used as the input energy for the other one to increase the efficiency of the drive system. Additionally, the potential energy can also be used directly. To provide energy for both hydraulic presses, the drive systems of two of them are merged into one (combined drive system, CDS). Presses 1 and 2 get energy at certain times from each motor-pump in the combined drive system, and each motor-pump is separately controlled.
A Direct Driven Pump-controlled hydraulic system (DCP), characterized by a closed circuit type, a speed-controlled electric servomotor and a fixed displacement pump, was studied by Koitto et al. [
8] for a stationary industrial material-handling application that consecutively lifts and lowers a fixed mass. The energy savings ranged from 53 to 87% when compared to a conventional valve-controlled approach. Although the actuator tended to vibrate when it reached the desired position and the system pressures oscillated strongly during the movement of the cylinder, the dynamics of the system did not quite fulfil the stated requirements.
Remaining in the industrial field, studies aimed at increasing energy efficiency have also been conducted for hydraulic injection molding machines (HIMMs). The clamping force control (FC) demands high pressure but low volume flow, requiring just a little amount of power. The widespread hydraulic valve-controlled cylinder systems, which set the maximum supply pressure with a relief valve and constant displacement pumps, offer good servo control response but poor energy efficiency. To increase the energy efficiency, energy-saving control methods based on an electro-hydraulic variable-displacement pump system (EHVDPS), such as load-sensing control (LSC) and constant supply pressure control (CSPC) are used. From the studies of Chiang et al. [
9] emerged that the energy consumptions of (FC + LSC) and (FC + CSP) are 17.9 and 67.4% of the input energy of the EHVDPS method, respectively.
System power consumption can also be an indicator of operating conditions. In particular, application-independent variations in energy consumption can be related to malfunctions in the hydraulic system [
10,
11,
12,
13,
14]. Condition monitoring techniques based on artificial intelligence algorithms can be used to prevent any system malfunctions.
There are many solutions investigated at the research level, but these are rarely used in the industrial field. However, there are some solutions that are typically applied in the industrial field, some historical and some much more recent, for which, however, comparative studies in energy terms are not reported in the literature.
Analytical modelling of all the phenomena involved in the operation of an oil-hydraulic drive architecture to estimate the overall efficiency is complex [
15]. Distributed and concentrated pressure drop, fluid viscosity fluctuations due to temperature variations, influence of fluid viscosity, pressure and rotational speed on the pump volumetric and the hydro mechanical efficiencies, valve switching delay, active and reactive electric current components absorbed by the power supply (influenced by the rotational speed), dynamic friction between the piston and the cylinder body are some of the multiple factors which affect functioning and efficiency of an hydraulic system.
An estimate of the energy efficiency and of the impact of energy consumption on operating costs for different plant architectures is information of significant use in the design of these plants. In the present discussion a comparative study is carried out in terms of energy efficiency among different architectural solutions for the power part of a hydraulic blanking press with variable speed and force, a very common industrial process, e.g. in the production for semi-finished brass products. The volumetric flow rate and pressure of a fluid change over time in a process with varying speed and force, and it is under these operating conditions that the various technological solutions that can be used for the power part are distinguished by significantly different levels of energy efficiency.
The energy dissipations that distinguish one solution from another were examined in the analysis, while ignoring the contributions that are shared by all solutions.
The analysis is applied to a specific industrial process, in detail pressing of semi-finished brass products. Different hydraulic architectures will be presented, all equally capable of meeting the required performance, discriminated, however, by a progressively higher level of energy efficiency. The different configurations analyzed, starting from a traditional hydraulic architecture of low energy efficiency, are characterized by the introduction of the regenerative technique and variations in the unit for converting electrical energy into hydraulic energy carried by the fluid under pressure.
Five configurations, whose architecture is described below and summarized in
Table 1, have been analyzed and compared.
- 1.
Standard configuration: traditional architecture consisting of a round-case induction electric motor, a fixed displacement vane pump, a pressure relief valve, and a standard directional control valve (DCV);
- 2.
Regenerative configuration: standard configuration with DCV with regeneration A – Hybrid;
- 3.
High - Low configuration: regenerative A – Hybrid configuration in which the single fixed-displacement vane pump is replaced by two pumps of the same type, one with high flow rates and low maximum pressures, one with low flow rates and high maximum pressures;
- 4.
VDP (Variable Displacement Pump) configuration: regenerative A – Hybrid configuration in which the single fixed displacement vane pump is replaced by a variable displacement axial piston pump;
- 5.
DCP (Drive Controlled Pump) configuration: regenerative A – Hybrid configuration in which rotational speed of the asynchronous motor is continuously adjustable through an AC frequency converter.
For a quantitative comparison of the energy efficiency performance of the examined configurations, it is necessary, for each of them, to carry out the selection an optimized sizing of the main components.
For configurations 1 to 4, the sizing can be done by neglecting the angular acceleration or deceleration ramps that characterize the transition from one speed regime to another, because in architectures that adopt an asynchronous motor powered directly from the power grid, the inertial torques resulting from the acceleration or deceleration ramps can in first approximation be neglected. On the other hand, the contribution of inertial torques becomes more relevant when the motor is fed through a frequency converter, because in this mode of operation the motor is subject to excursions in speed of very large amplitude even in very short times, resulting in non-negligible inertia torques. For architecture 5, both an approximate sizing, neglecting the inertial contribution, and a more accurate sizing, also taking into account the inertial contribution, was carried out.
4. Discussion
From the analysis conducted on the basis of the system modeling, the difference in active power absorbed in the case of DCP architecture neglecting dynamic aspects is underestimated of 1.63 kW compared with the case taking into account dynamic effects. The difference is significant, hence the considerations that follow consider the DCP dynamic architecture.
The adoption of regeneration in the direct control valve results in a reduction of the average active power input of 50.5%. In architectures 3, 4 and 5 regeneration is retained as a common element, so the differences that occur in the absorbed active power are determined only by the differences in the configurations.
From the results resumed in
Table 12, it emerges that the High - Low, VDP and DCP solutions realize higher energy efficiency for the plant than the simply Regenerative architecture. In fact, in all three cases, there is a more or less pronounced decrease in the active electrical power absorbed from the power grid.
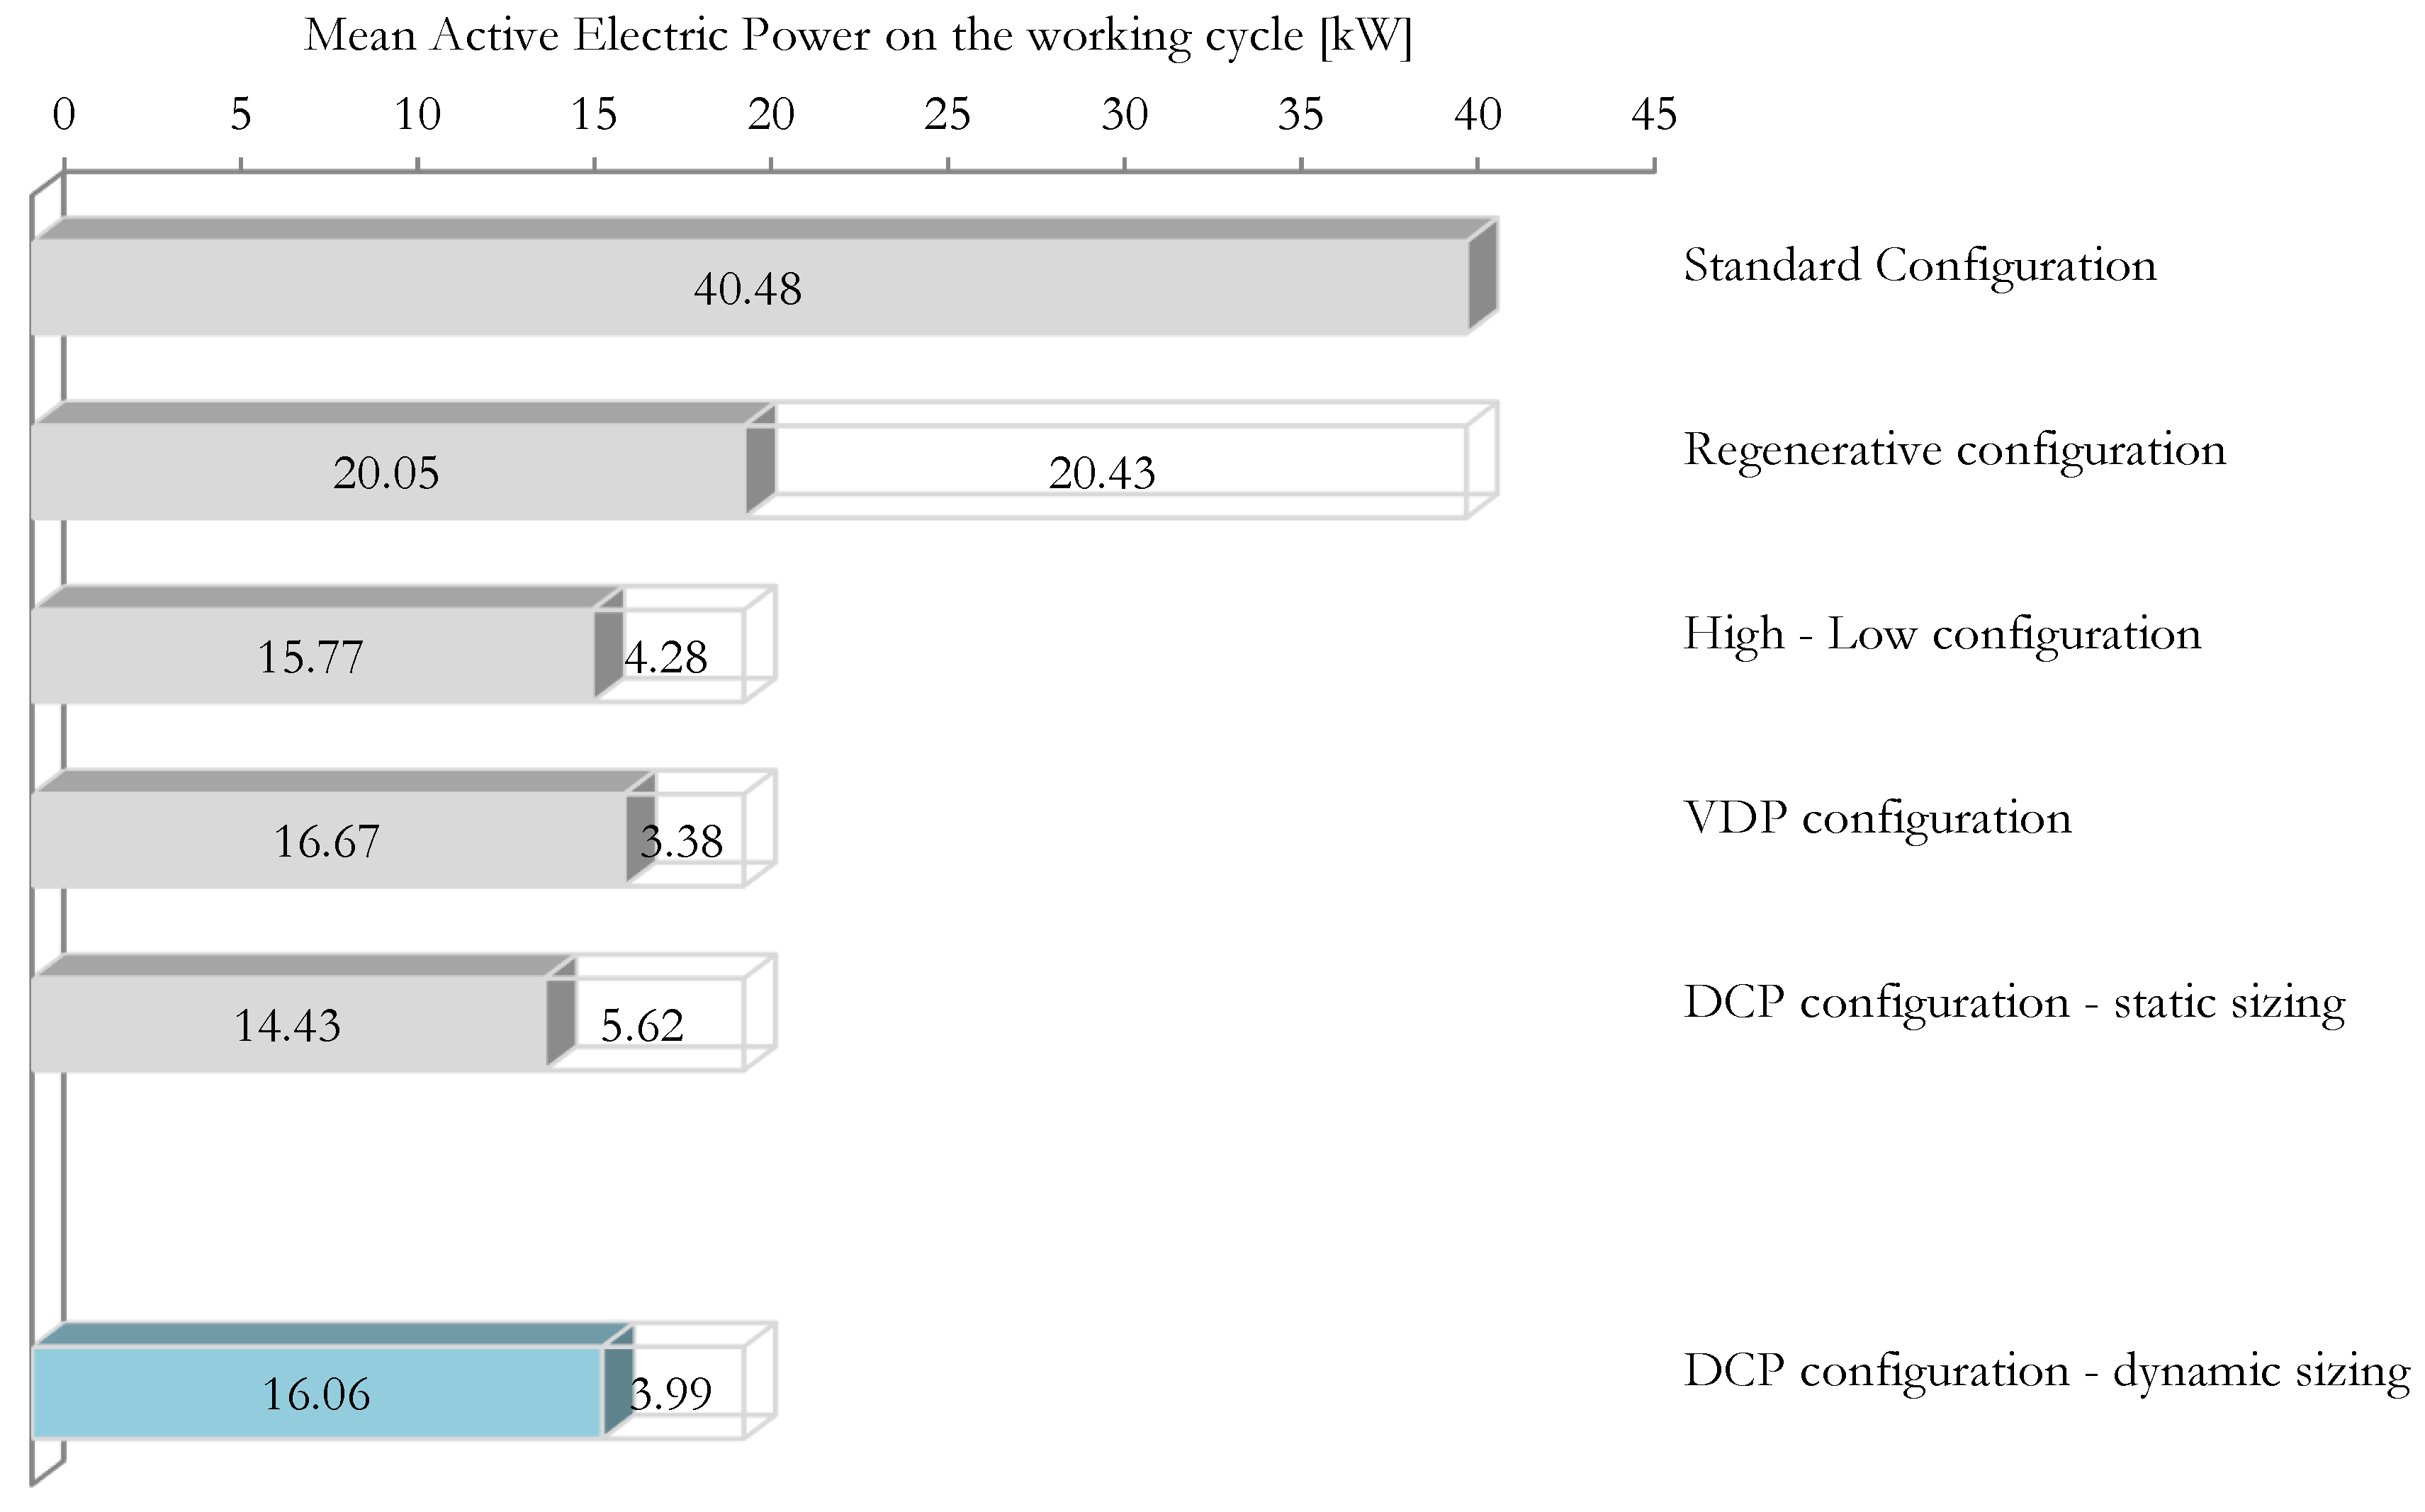
The solutions that achieve the greatest savings in terms of active power consumption are in order the High - Low configuration, followed by DCP, and finally VDP. The difference between the Hig-Low configuration and the DCP is very small (1.8%).
The particular efficiency of the High - Low architecture for this application is attributable to the nature of the variable-speed considered industrial process. As a matter of fact, the High-Low architecture is particularly well suited to operation with stages characterized by high oil flow rates at low pressures alternating with phases with low fluid flow rates at high pressures. Typically, this is the case of stamping. The lower energy efficiency of the solution with VDP is caused by the additional pilot oil flow rates, which must be continuously ensured to maintain the displacement regulation of the axial piston pump.
Comparing, the VDP configuration and the DCP, the latter realizes savings in terms of electrical power consumption, even if the saving is small for the considered case. Therefore, we can conclude that, from the point of view of the absorption of average active electric power during the work cycle, the DCP solution stands as slightly more advantageous than the VDP one, or that certainly the VDP solution does not emerge as better than the DCP one.
From data referred to the active electrical power parameter (Figure
Table 12 and
Table 12), the solution with DCP realized a marked advantage over the Standard architecture, a slight advantage over the VDP configuration, and a comparable, or even slightly lower, result than the High - Low solution.
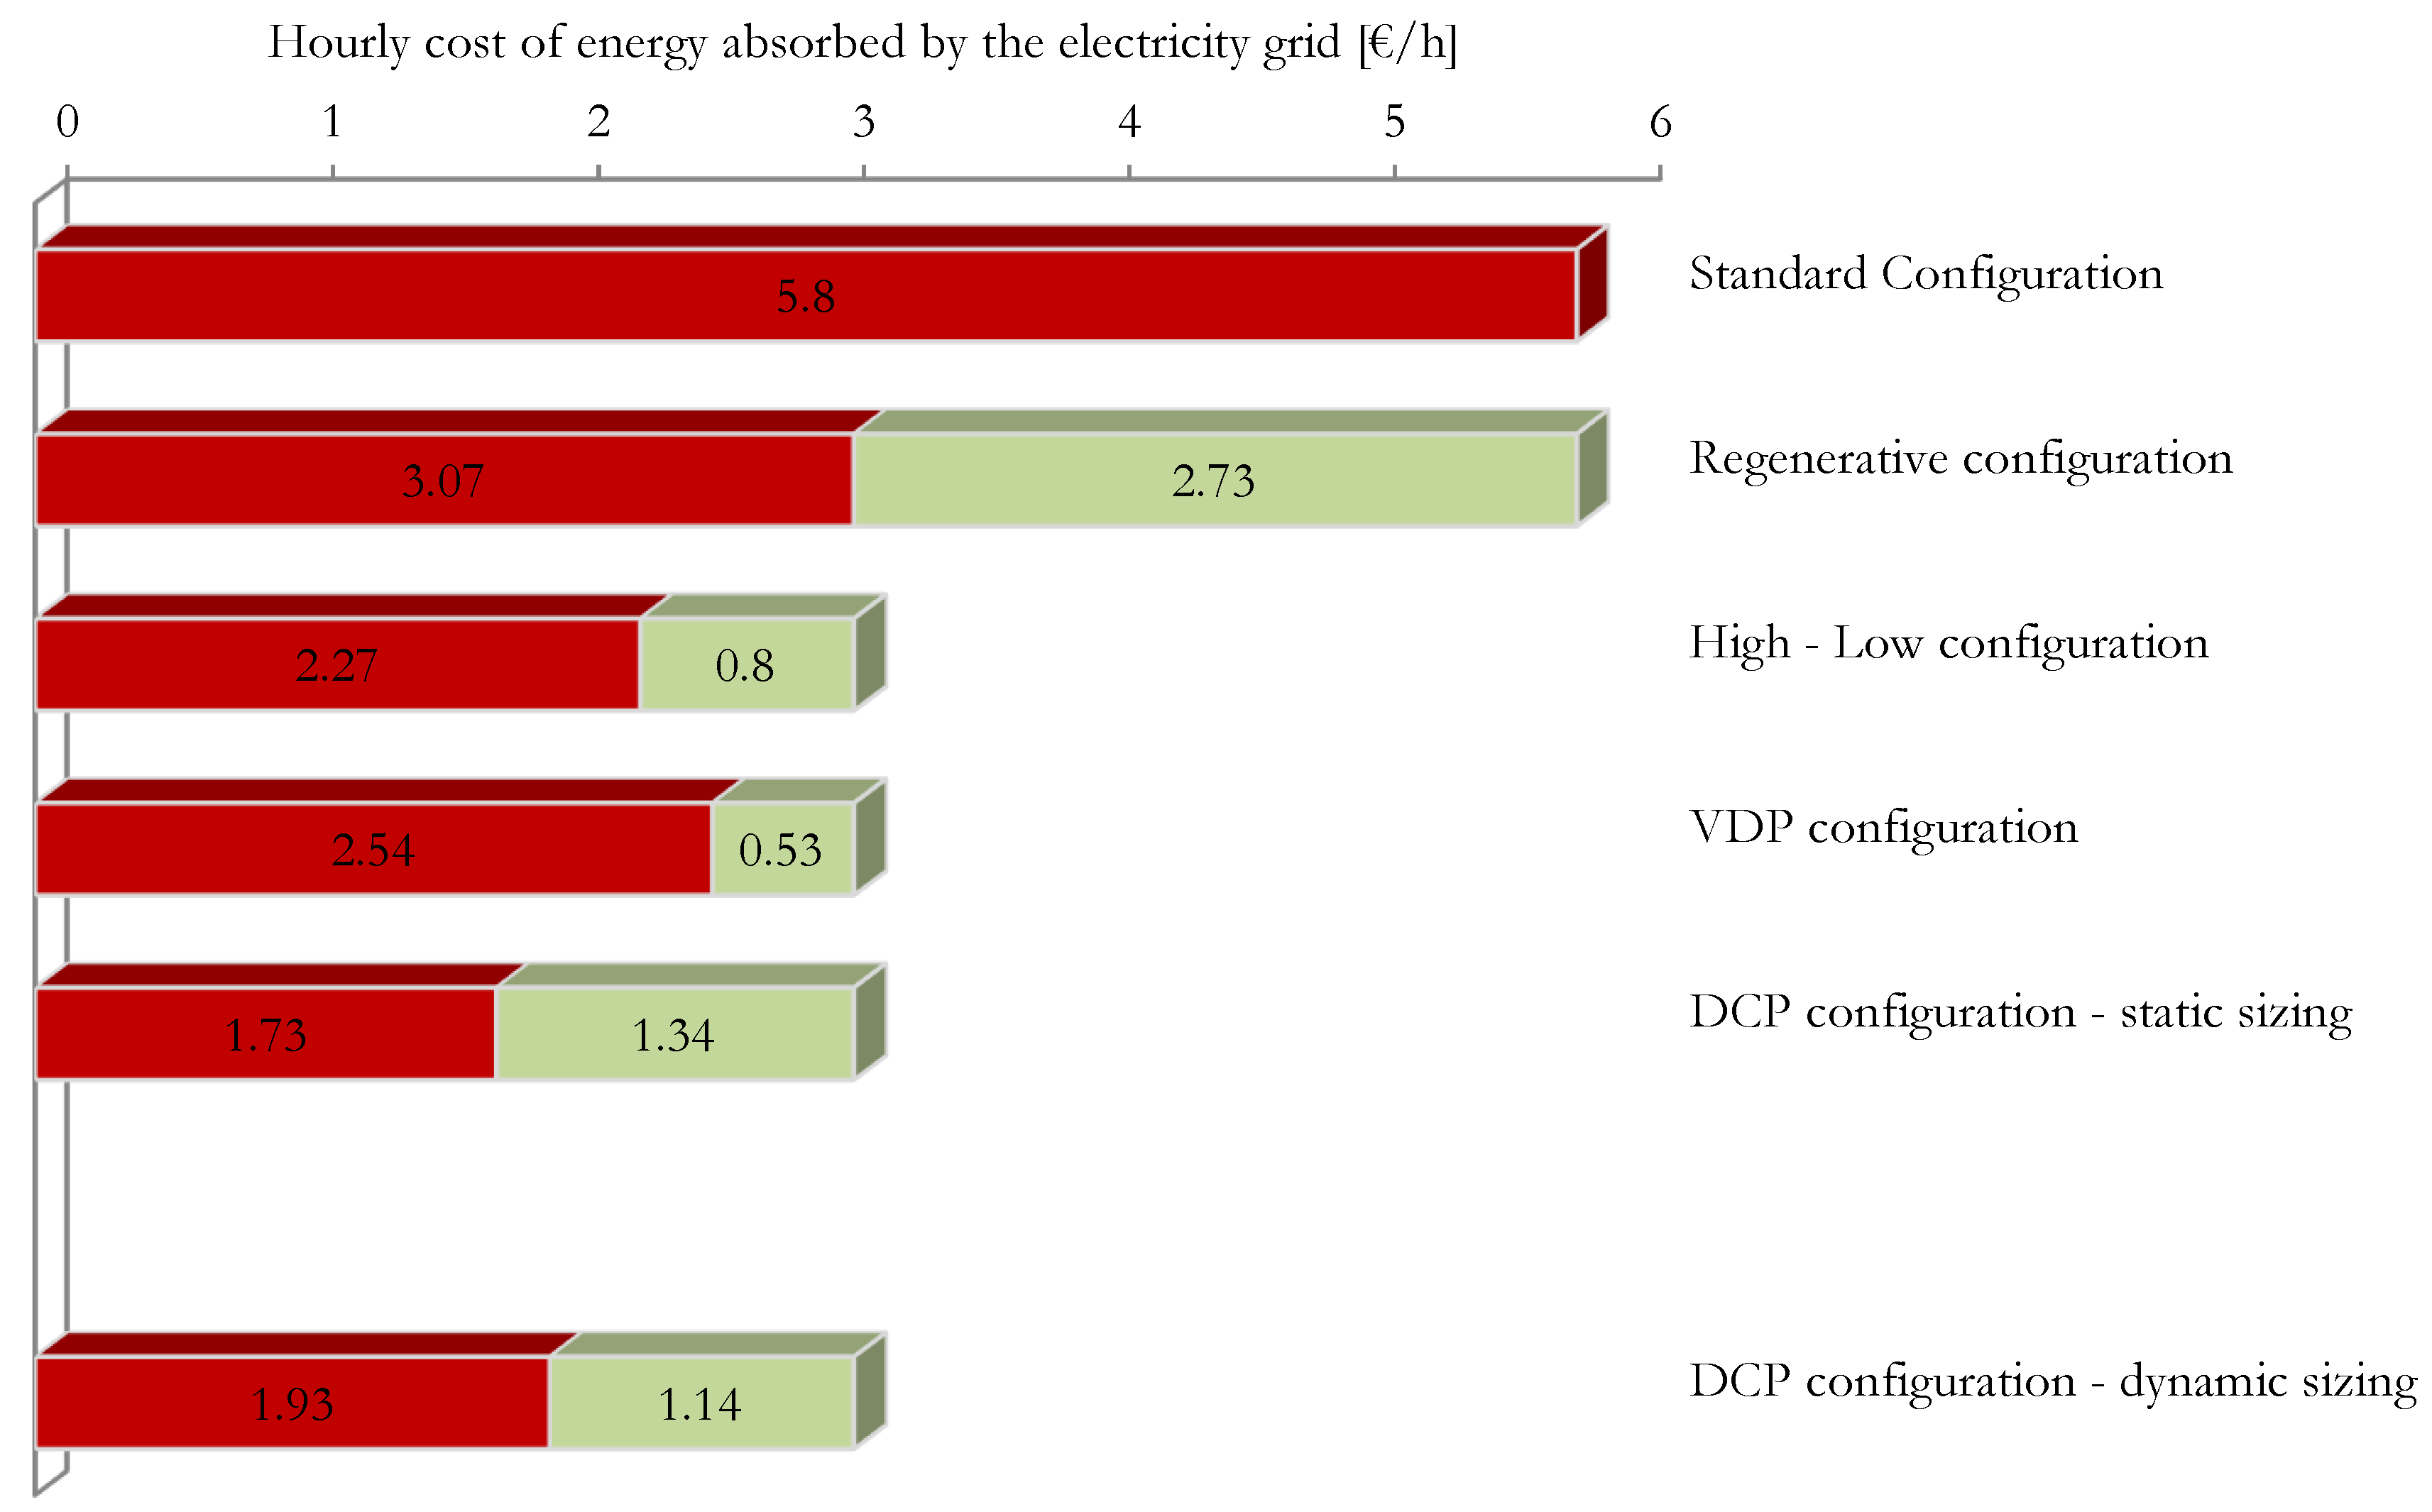
If, on the other hand, the comparison is conducted on the cost parameter of electric power (based on the italian energy pricing), the DCP architecture comes out as clearly cheaper even against the High - Low and VDP solutions. This is due to the reactive component of the electric power (
Table 13), for which economic penalties occur, in cases of high absorption of reactive electric power from the power grid. For the DCP architecture the economic penalties are not present. This is ensured by the action of the capacitor bank present in the drive, which brings the reactive (inductive) electrical energy absorbed below 50% of the active one or, equivalently, reduce the power factor above the value of 0.9. Therefore, taking into account the contributions of both active and reactive power, the most advantageous solution (among those analyzed) from the point of view of energy operating costs is the DCP, which also compared to the Hig-Low architecture results in a savings of 15%.
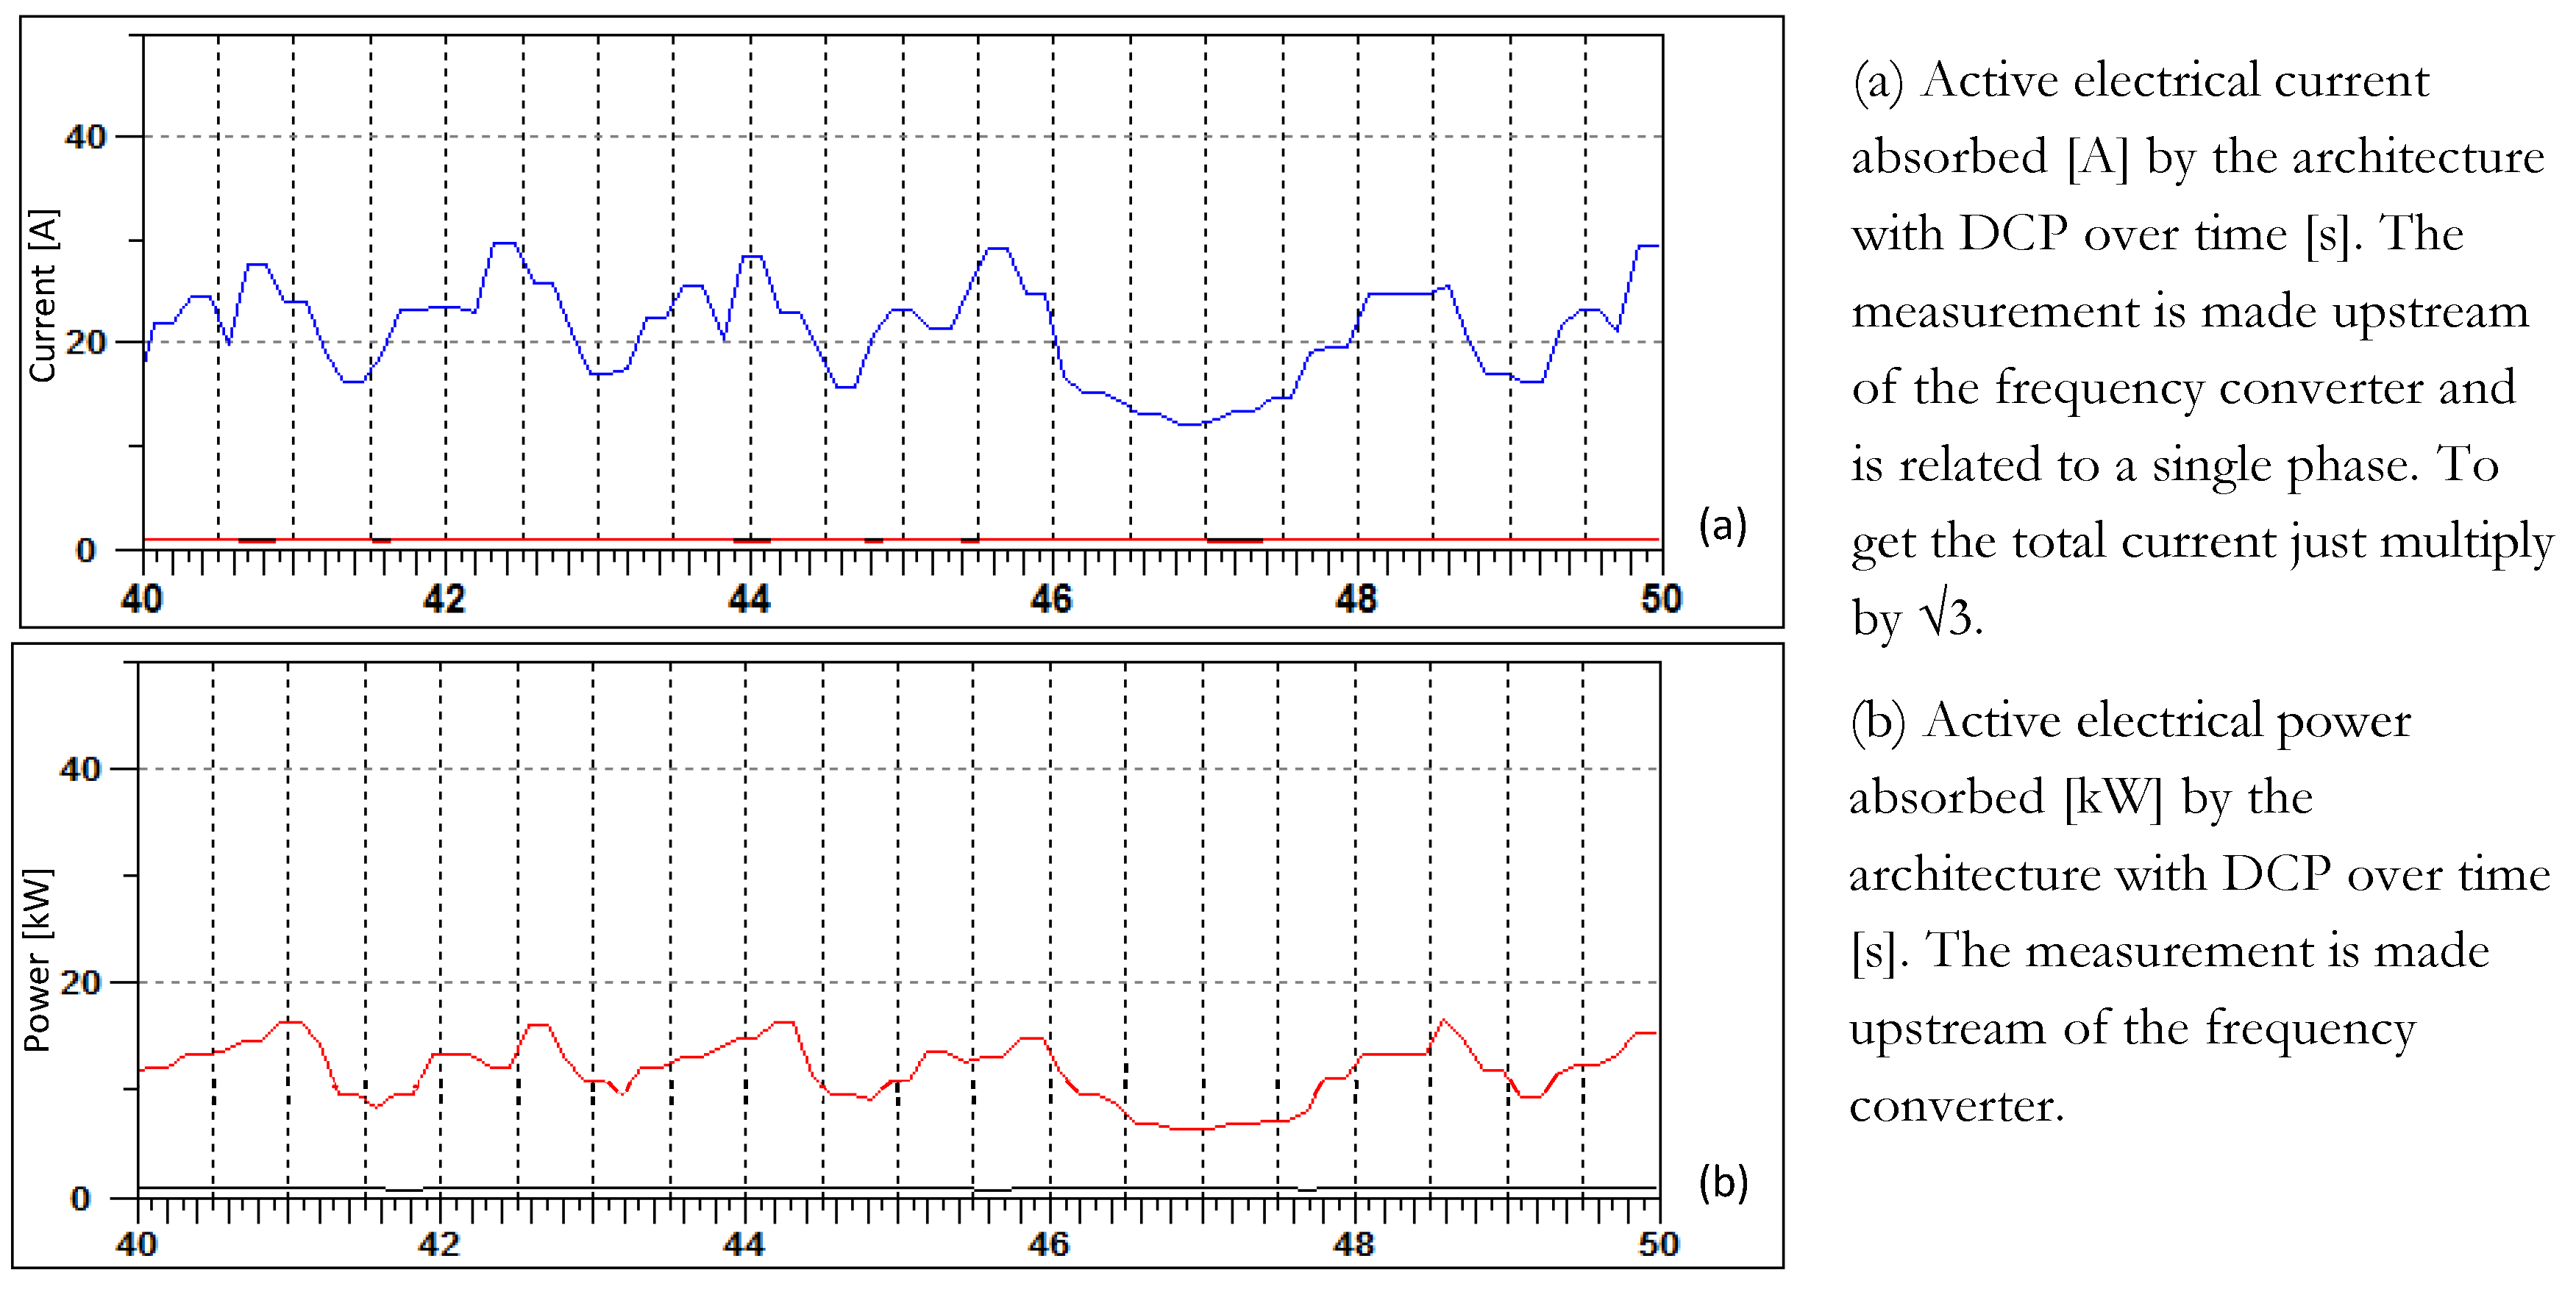
For the case of architecture with DCP, a comparison between the theoretical absorption of active electrical power input (16.06 kW) and the absorption actually measured on the system in a cycle (14.85 kW) is possible. An overestimation of the real figure of about 8% is observed. This value is quite small. Therefore, it can be considered that the analysis conducted reflects reality sufficiently well.
5. Conclusions
The choice of power generation architecture of a hydraulic system has a very significant impact on energy efficiency and operating costs. The comparative study of the most common hydraulic architectures, used in the driving of an industrial process with time-varying speeds and work force, highlighted the differences between the various solutions in quantitative terms, providing objective comparison data that were not available in the literature.
The modern hydraulic architecture with Drive Controlled Pump and DCV with Regeneration - A Hybrid, is, limited to the category of industrial processes exemplified, a very efficient solutions in terms of energy absorption and cost-effectiveness.
It has been verified that the dynamic phenomena, which are often overlooked during sizing, have a significant impact on overall energy absorption.
The oleo-hydraulic architectures reviewed constitute a significant part of the state of the art in the field of hydraulic technology dedicated to the actuation of industrial machines, but not its entirety. Other solutions, characterized by high levels of energy efficiency, are architecture that uses high efficiency asynchronous square-case motors, or architectures with a brushless synchronous electric motor and a pump with internal gears.
Another oleo-hydraulic architecture that could be studied, but which poorly fits the exemplified industrial process, involves the use of an accumulator installed in parallel with a fixed-displacement pump.
Furthermore, the analysis could be completed from an economic point of view by considering the analysis of the initial investment costs necessary for each considered architecture.
However, it can be concluded that energy-conscious choices for the power architecture of a hydraulic axis can benefit from the presented analysis.
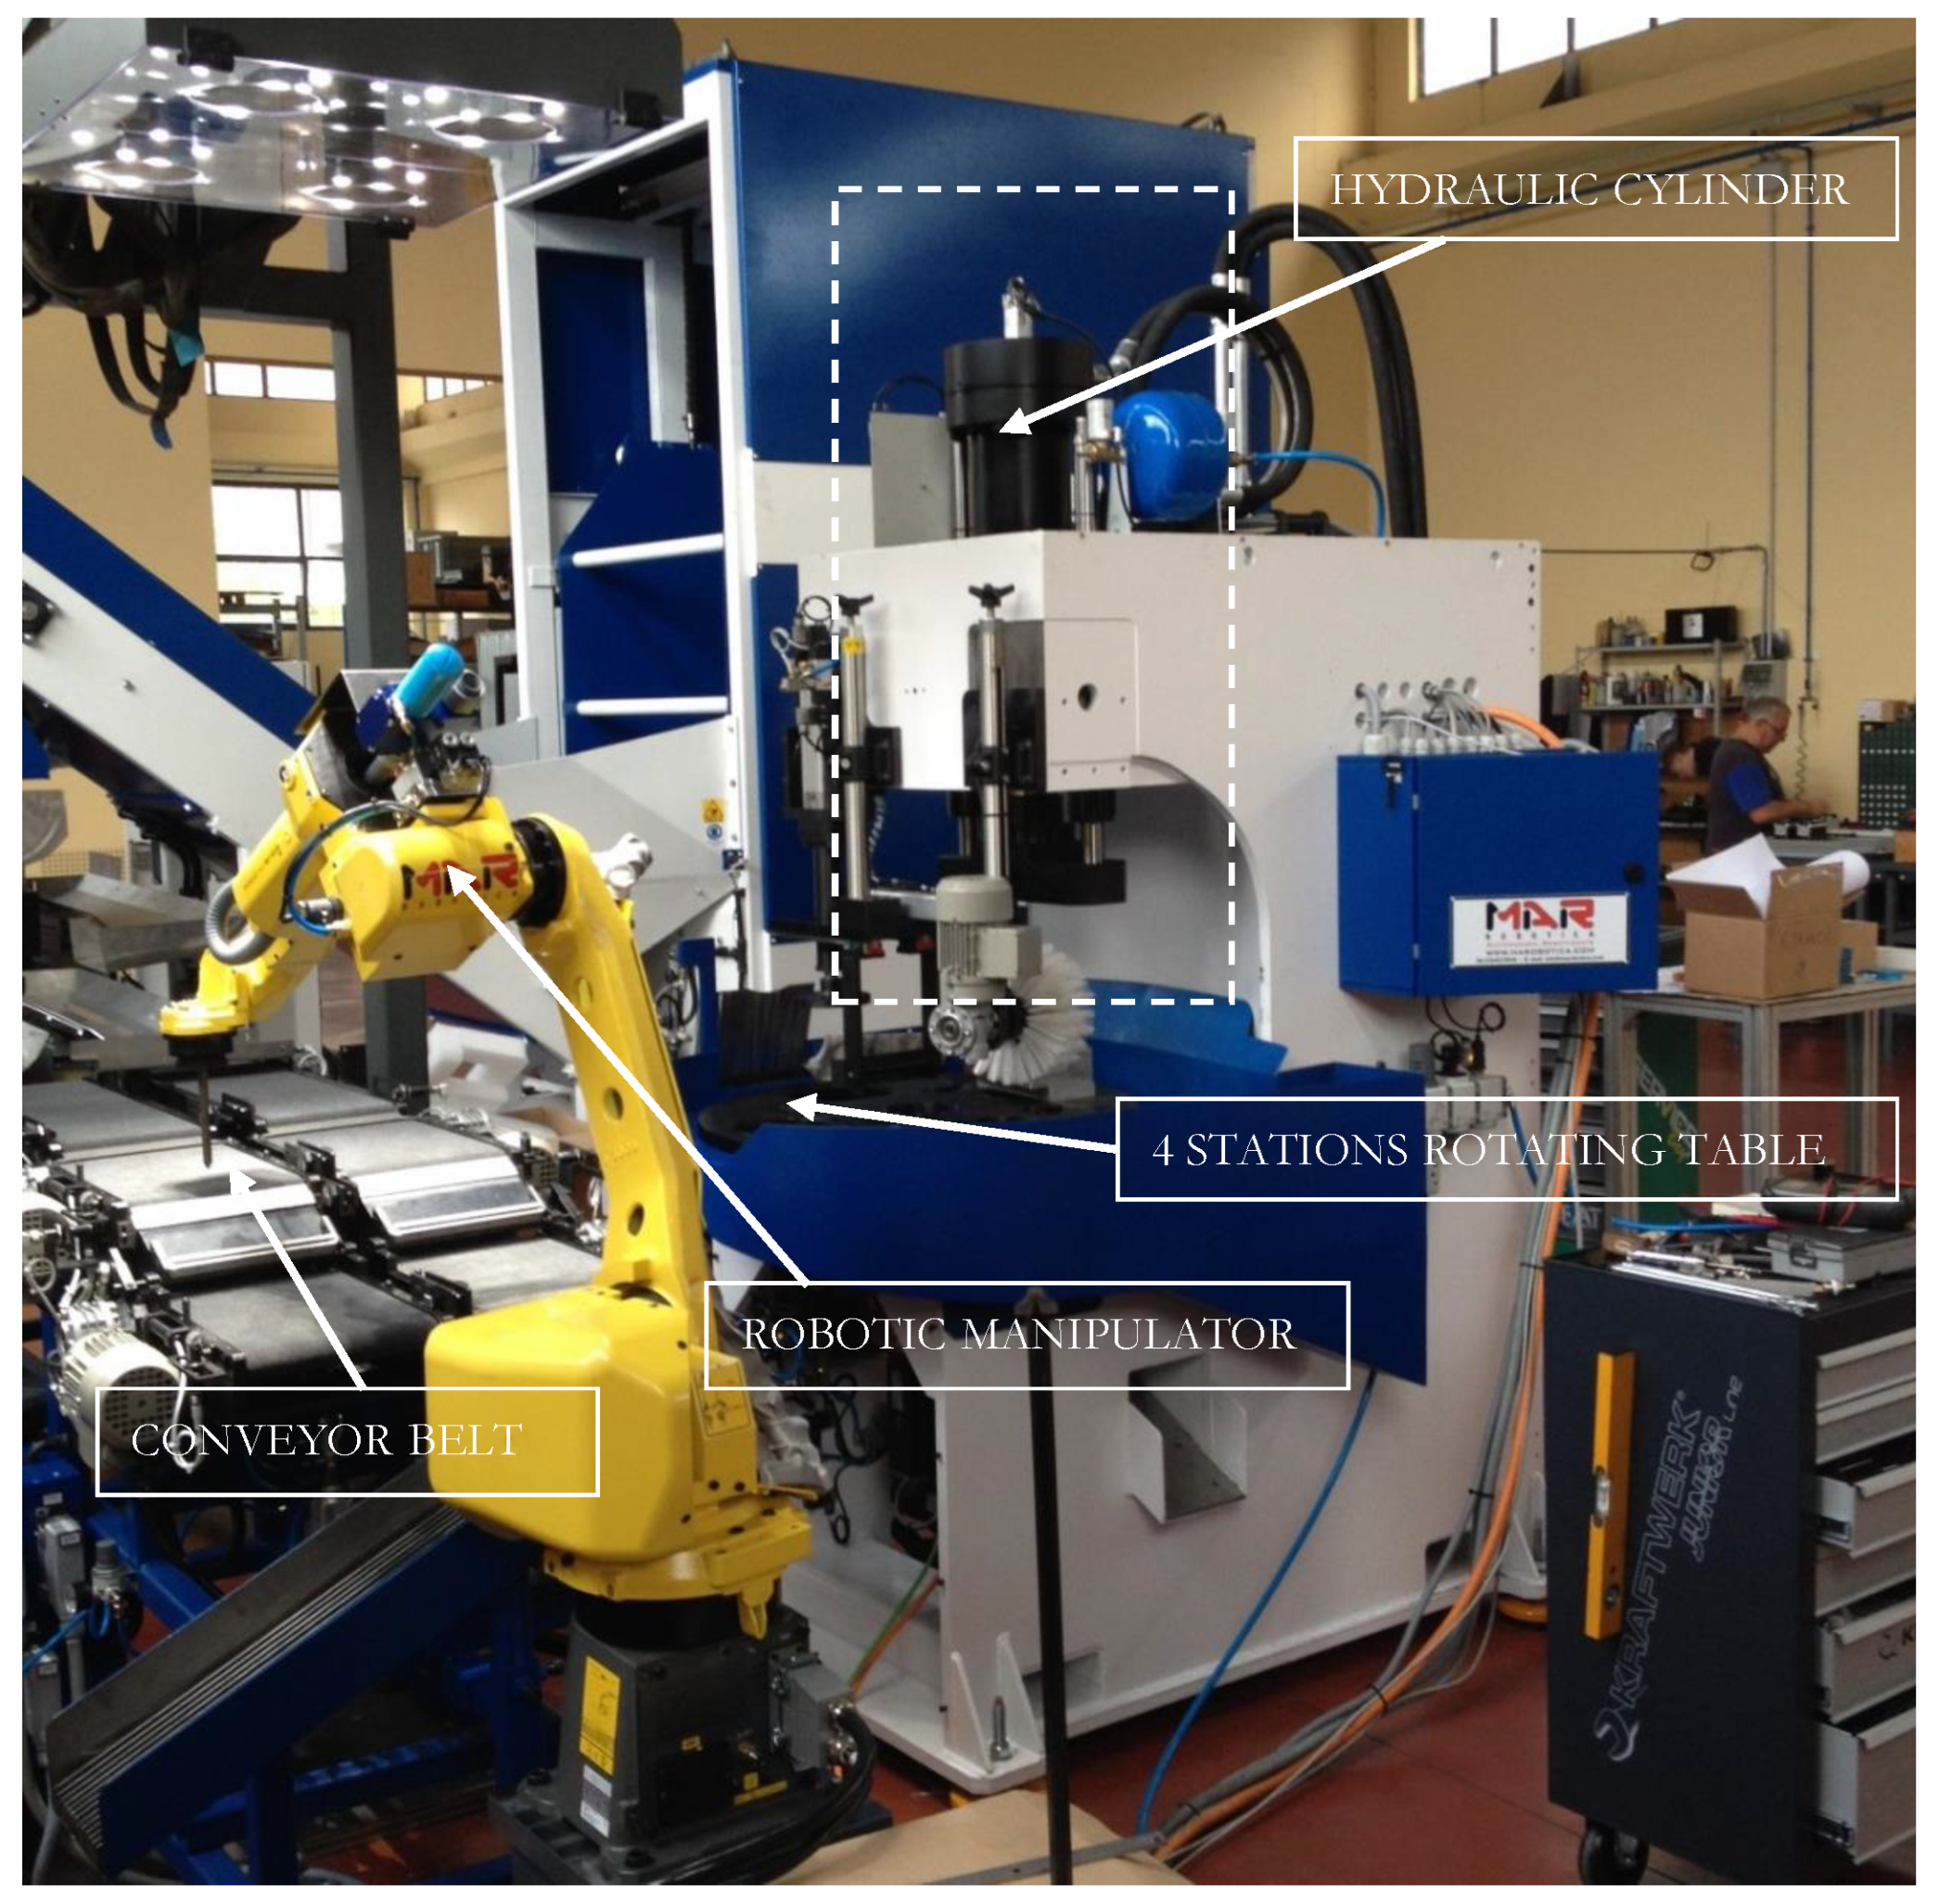
Figure 1.
Pressing system considered as a case study and main constituent elements.
Figure 1.
Pressing system considered as a case study and main constituent elements.
Figure 2.
Cyclogram with periodic cyclic loading at negligible dynamics.
Figure 2.
Cyclogram with periodic cyclic loading at negligible dynamics.
Figure 3.
Flow-chart of cylinder sizing.
Figure 3.
Flow-chart of cylinder sizing.
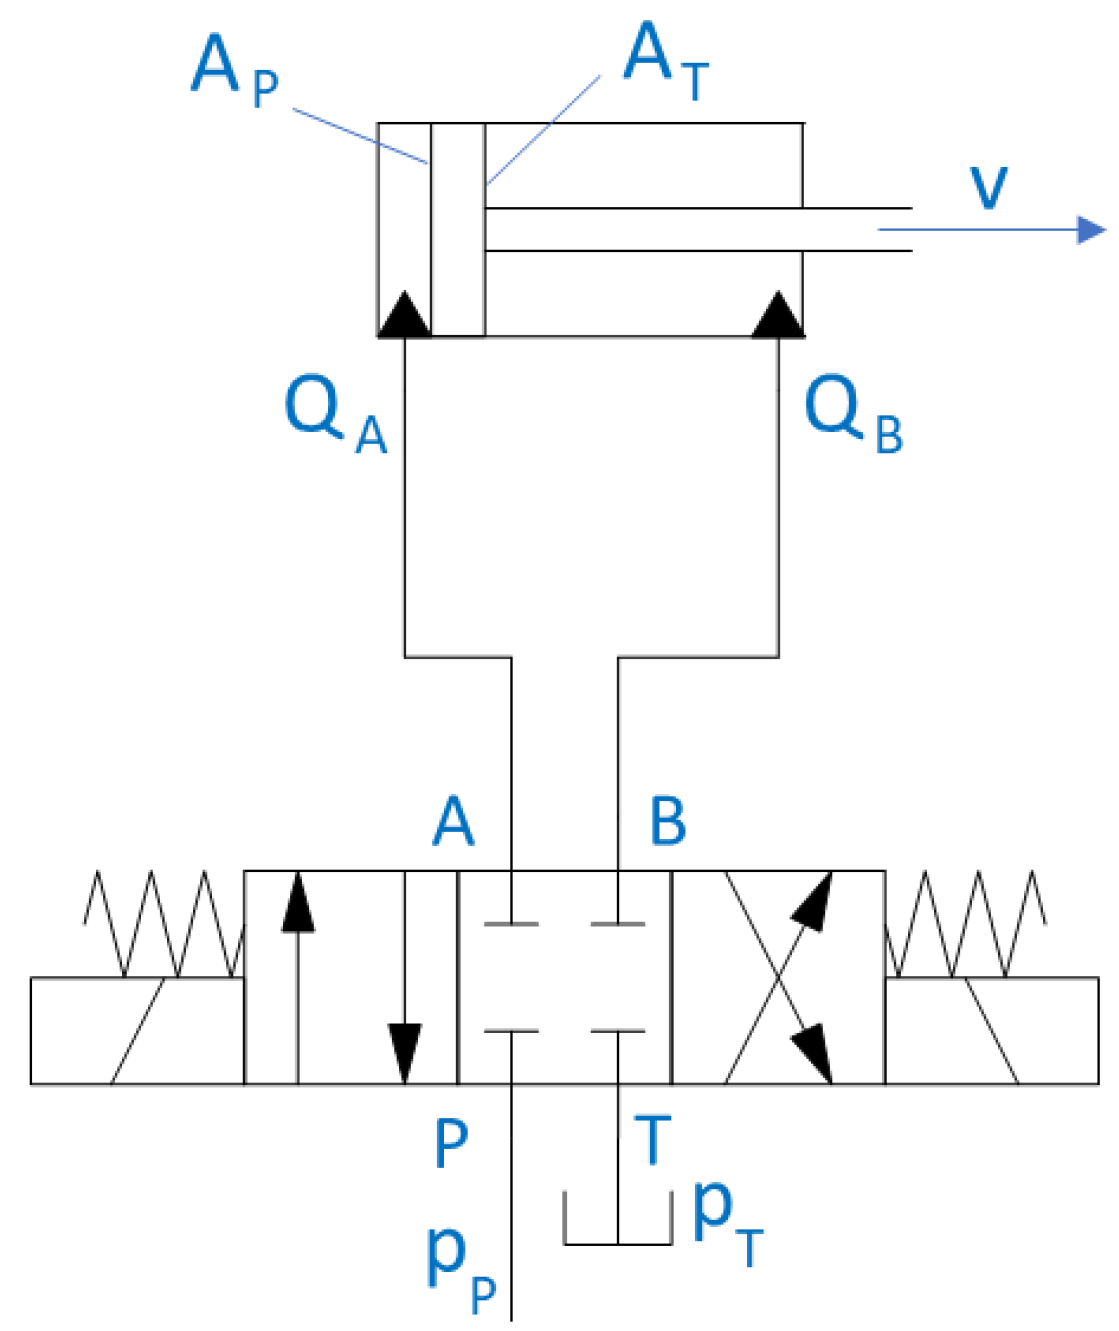
Figure 4.
Symbols for theoretical analysis of the system.
Figure 4.
Symbols for theoretical analysis of the system.
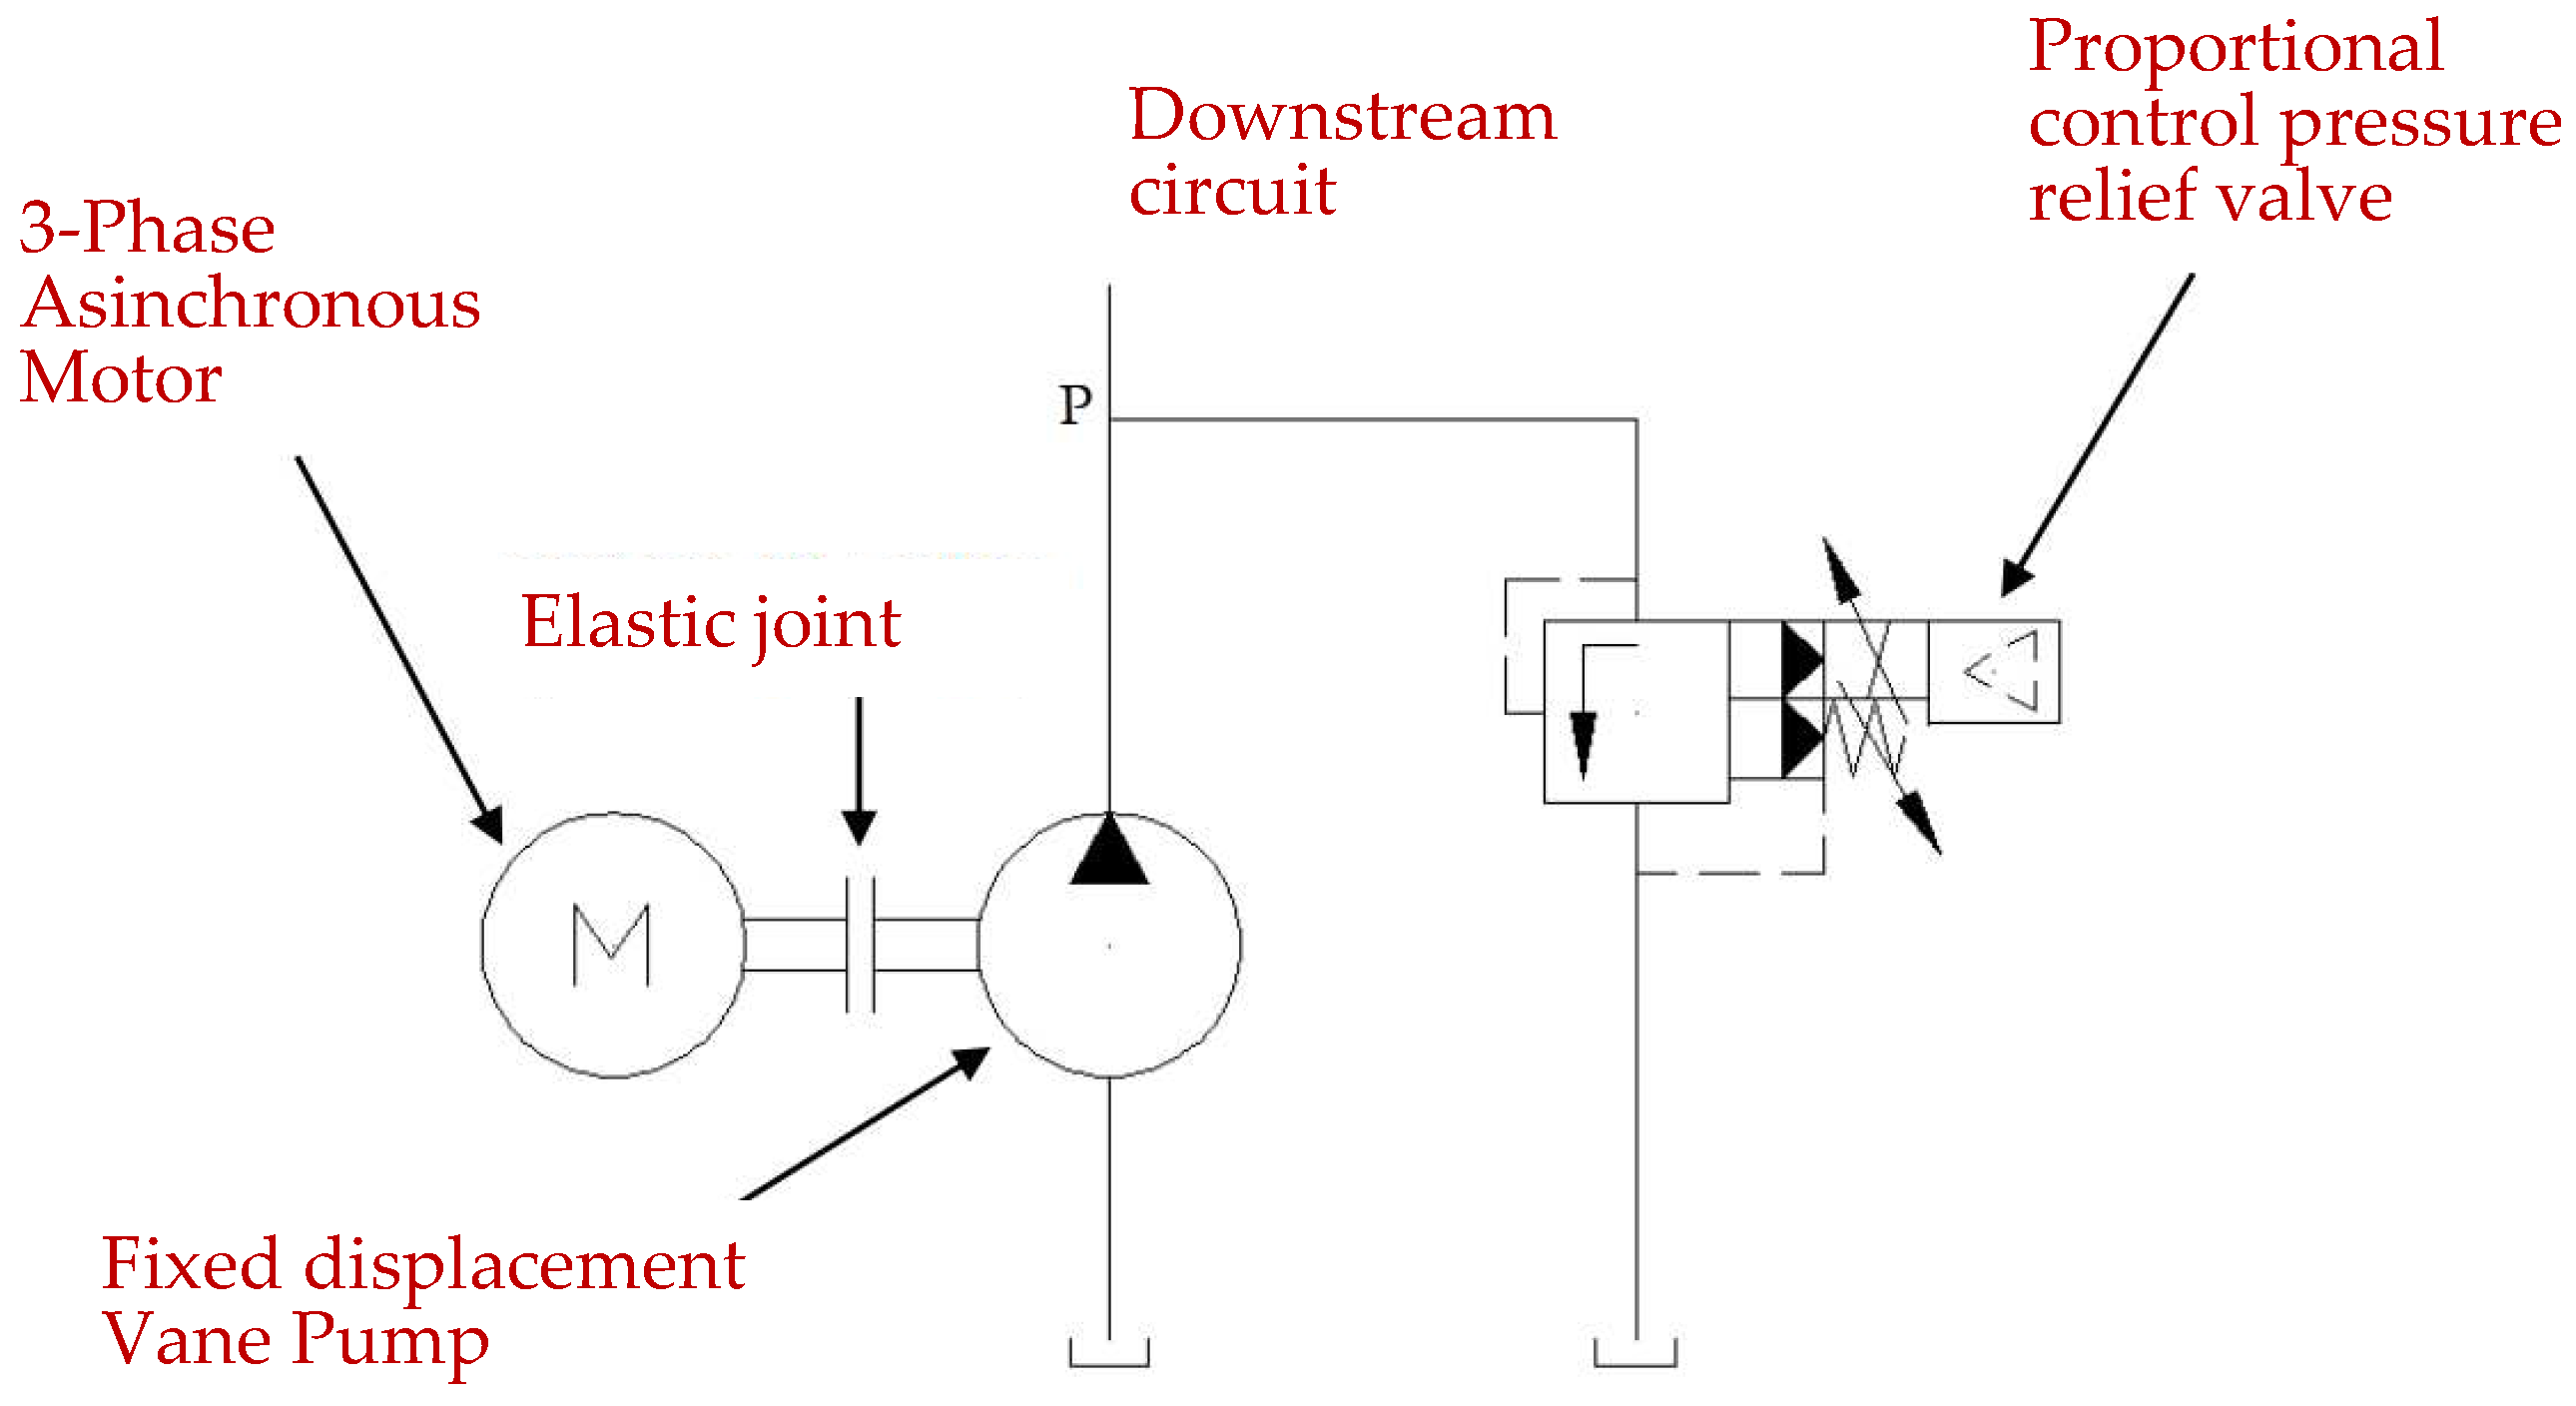
Figure 5.
Standard Architecture power source scheme.
Figure 5.
Standard Architecture power source scheme.
Figure 6.
Standard Architecture: system sizing flow chart.
Figure 6.
Standard Architecture: system sizing flow chart.
Figure 7.
Main components of the Standard Configuration.
Figure 7.
Main components of the Standard Configuration.
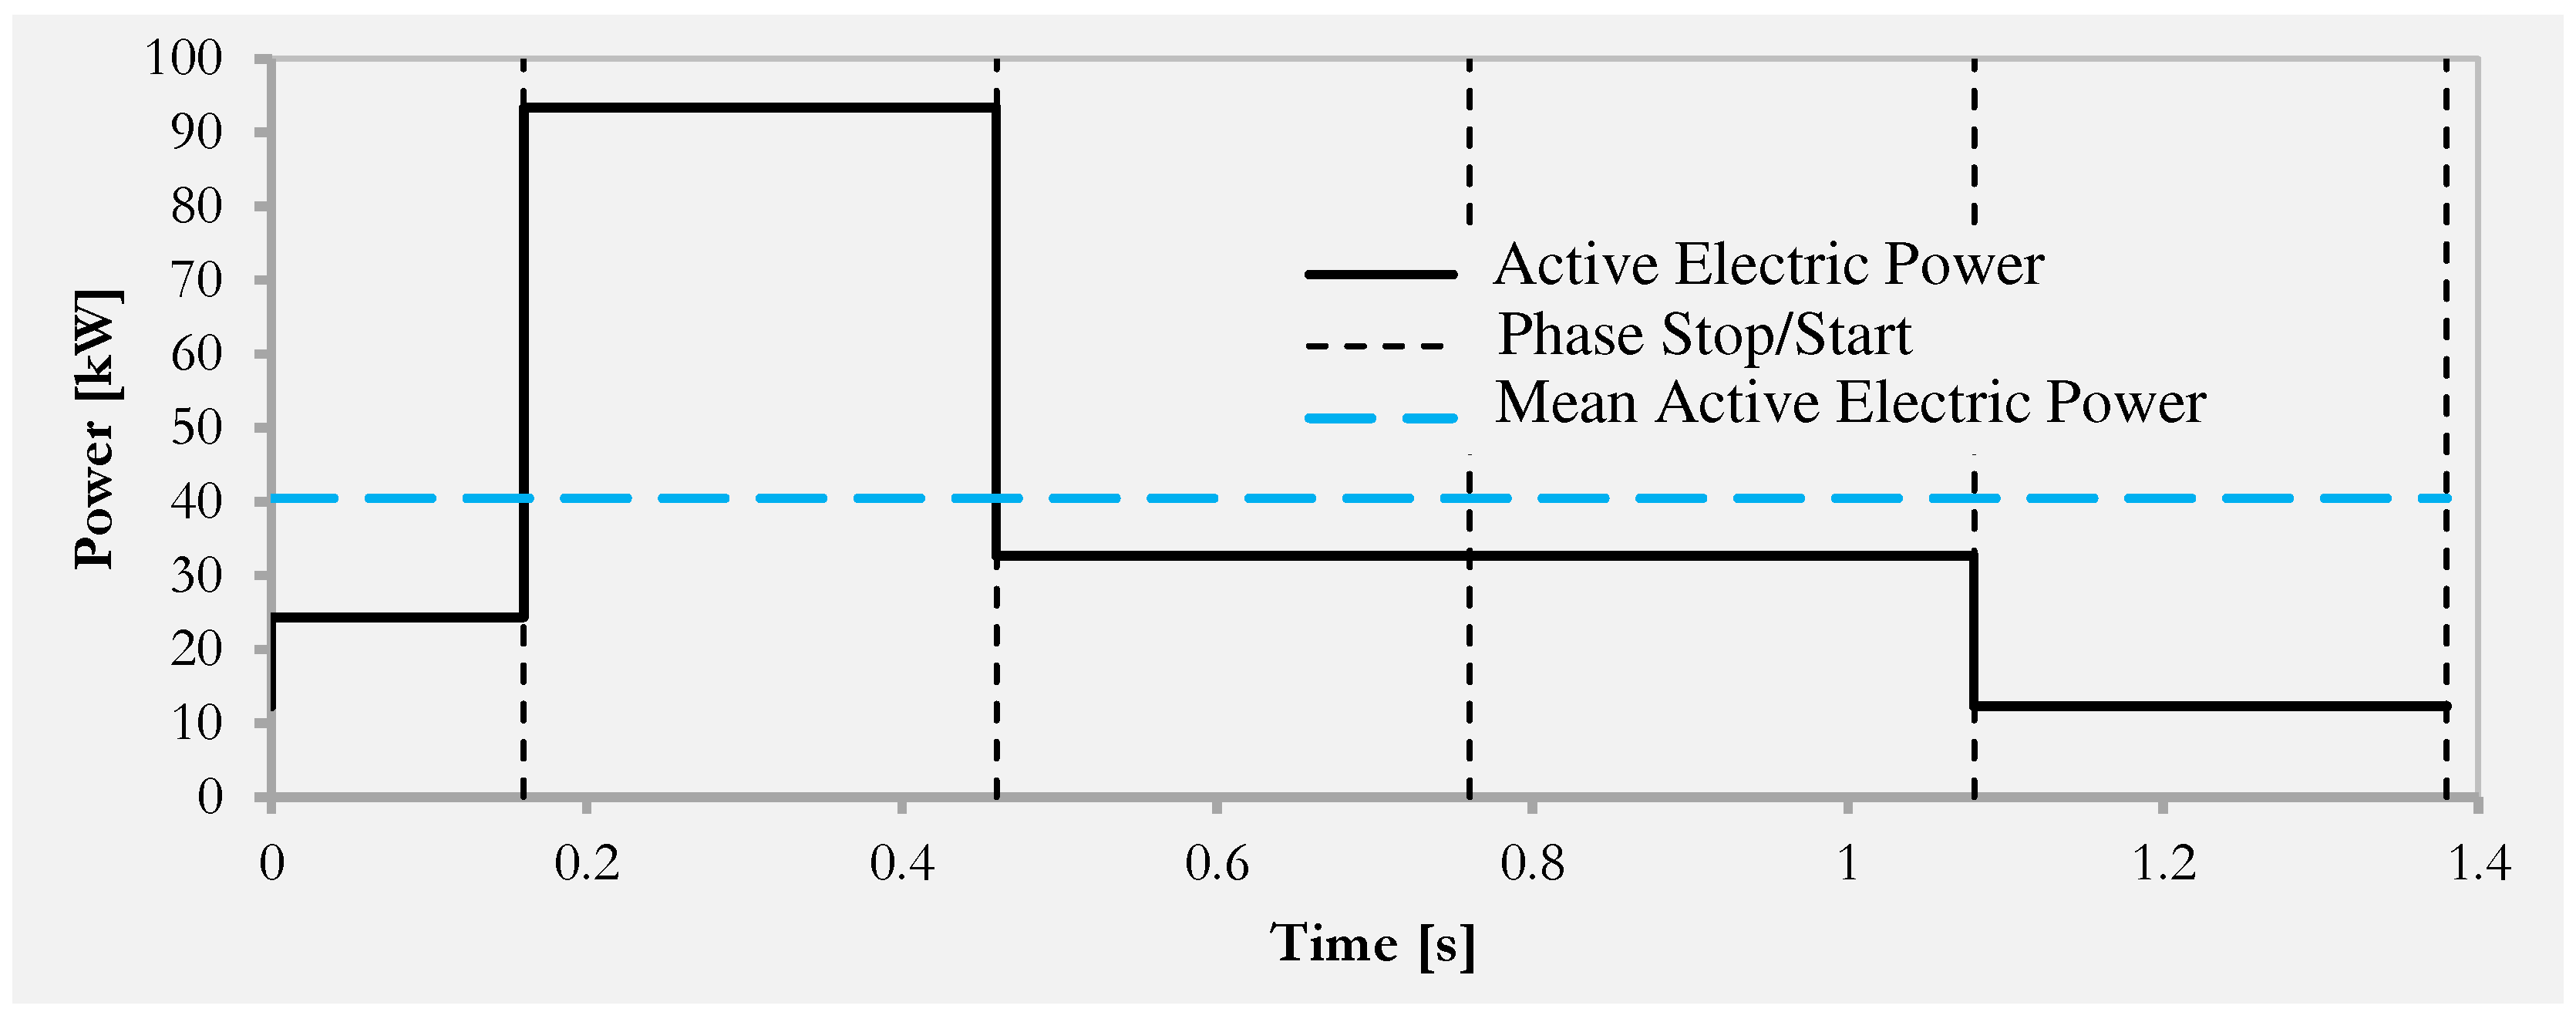
Figure 8.
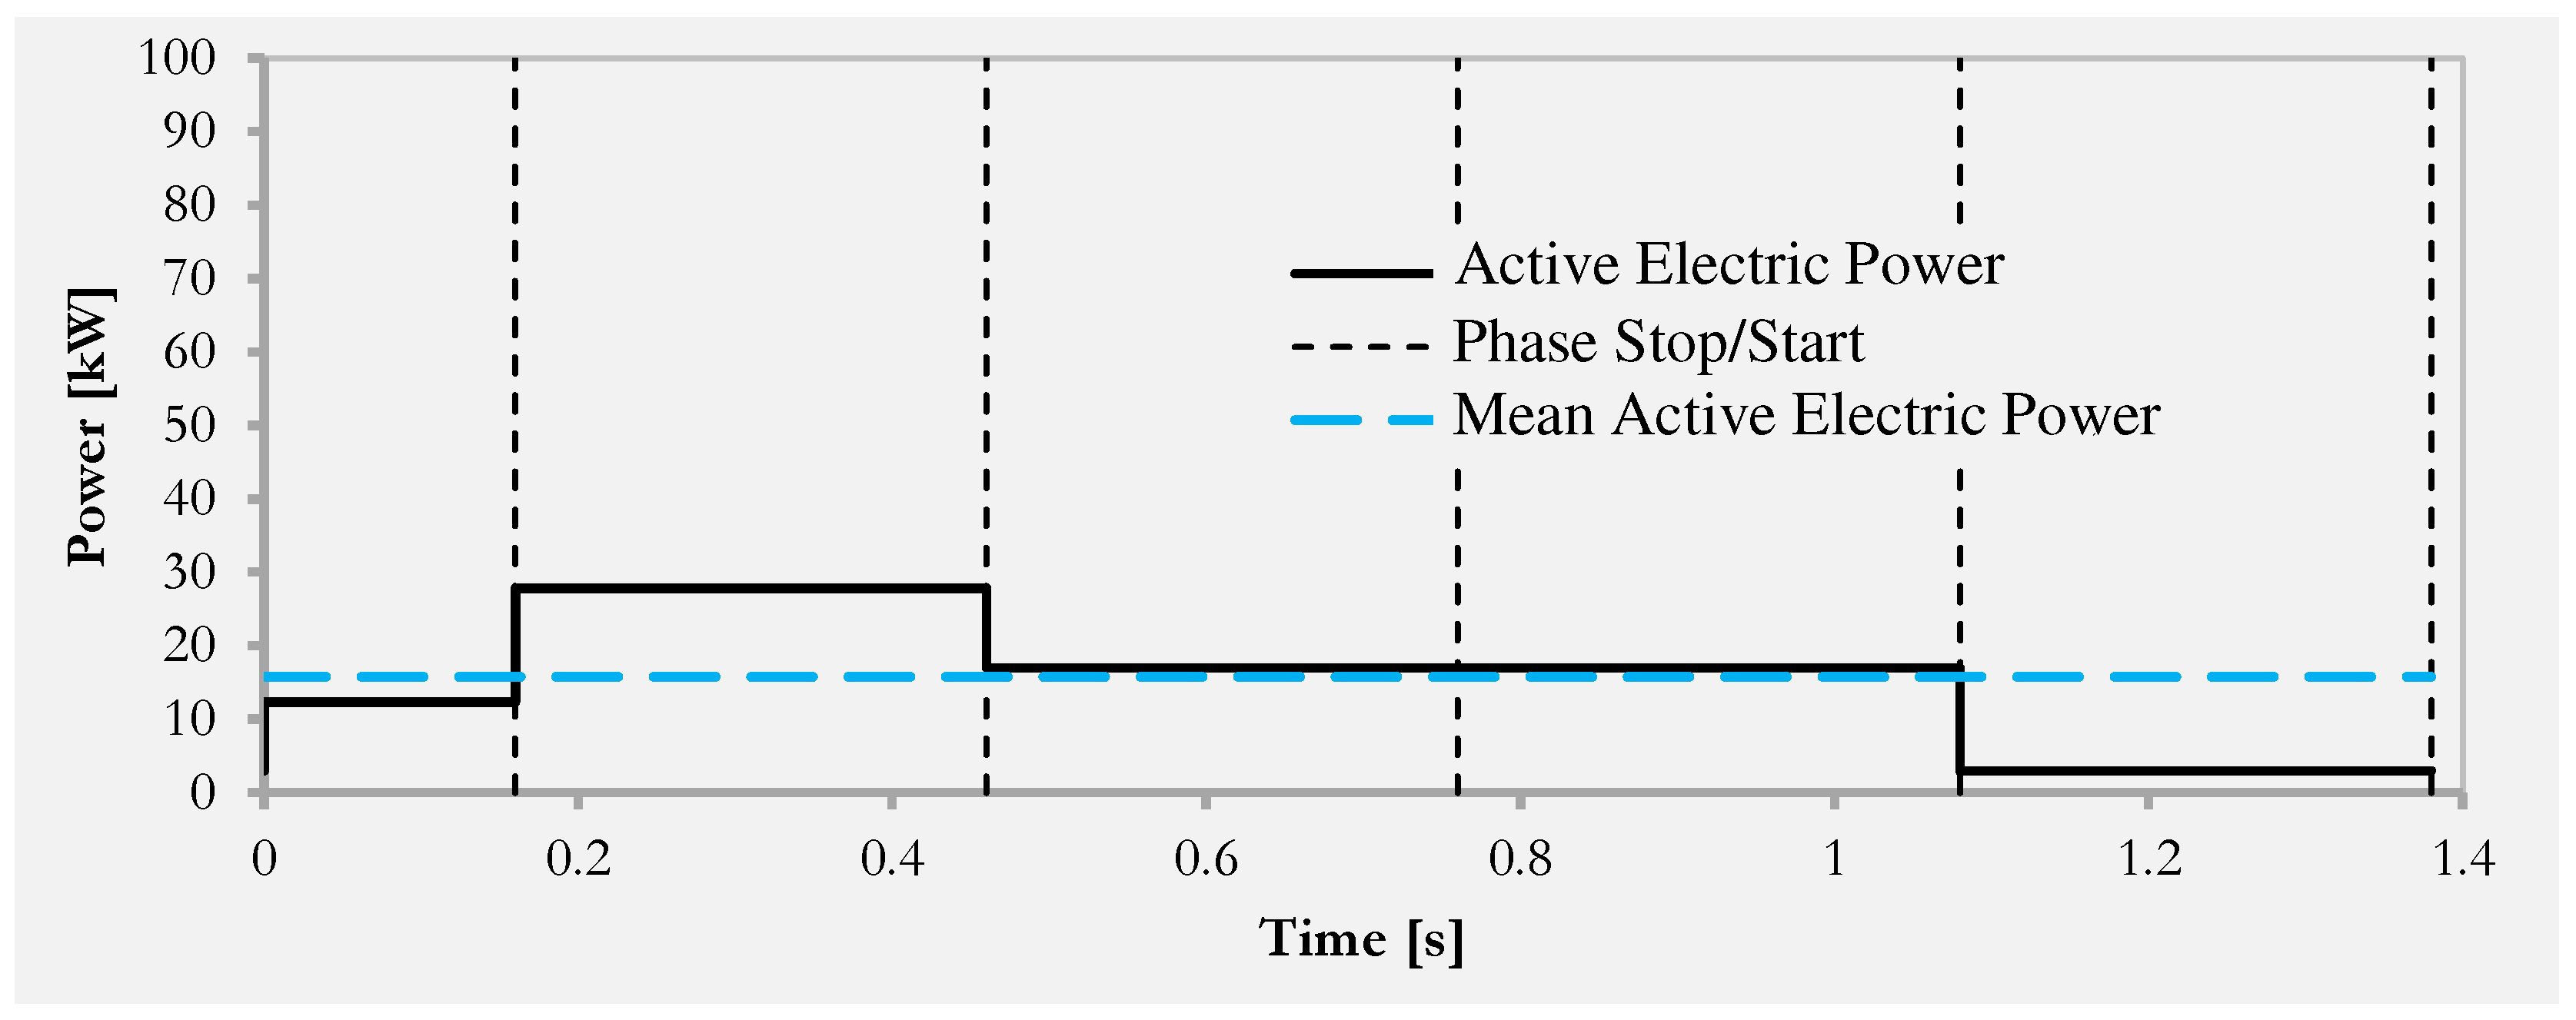
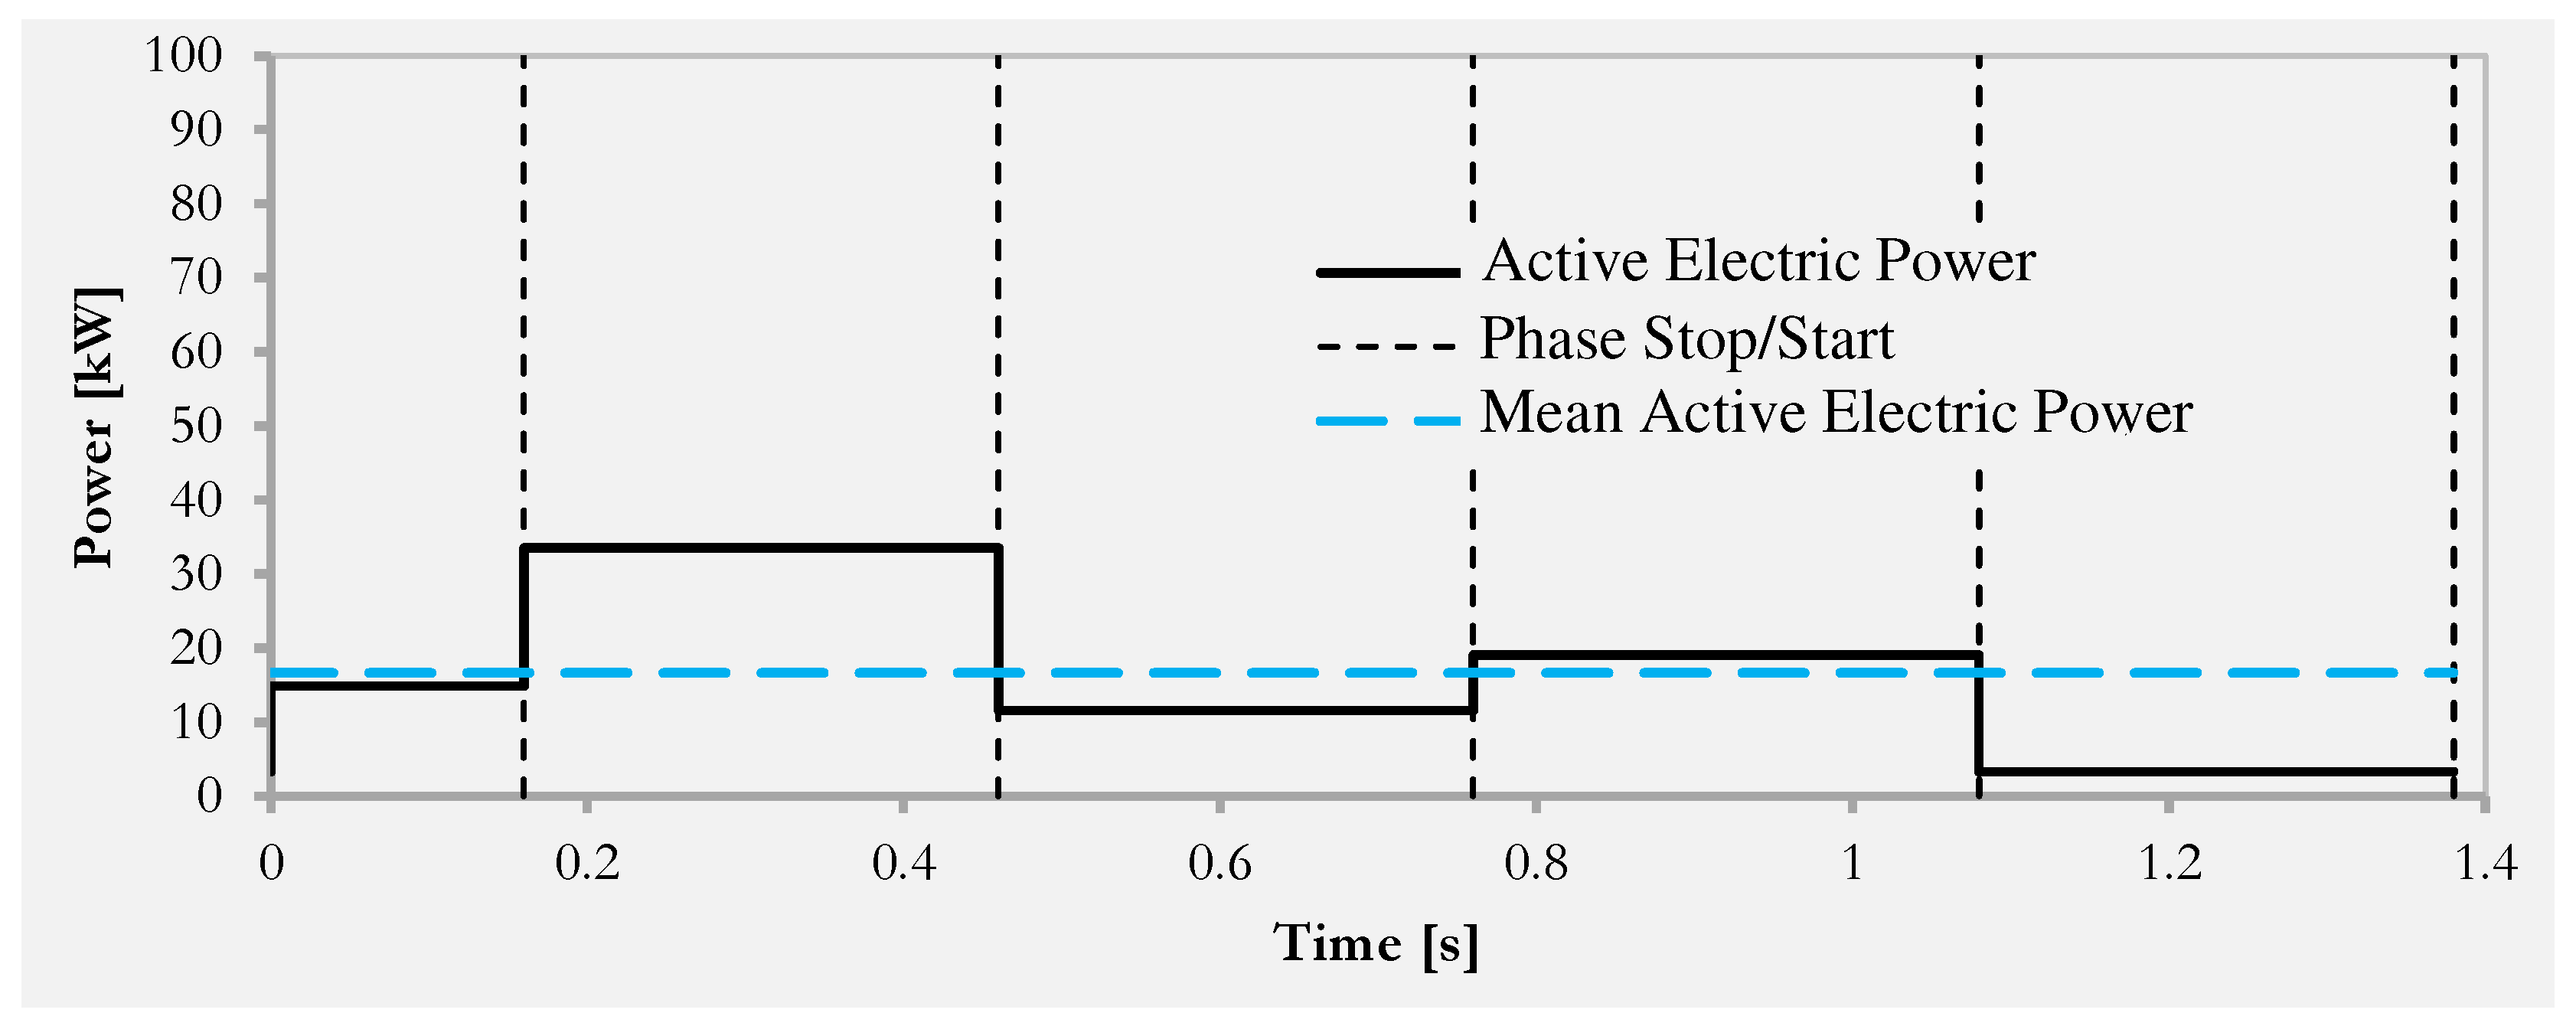
Standard Configuration - Active electrical power absorbed over the work cycle: instantaneous value and average value.
Figure 8.
Standard Configuration - Active electrical power absorbed over the work cycle: instantaneous value and average value.
Figure 9.
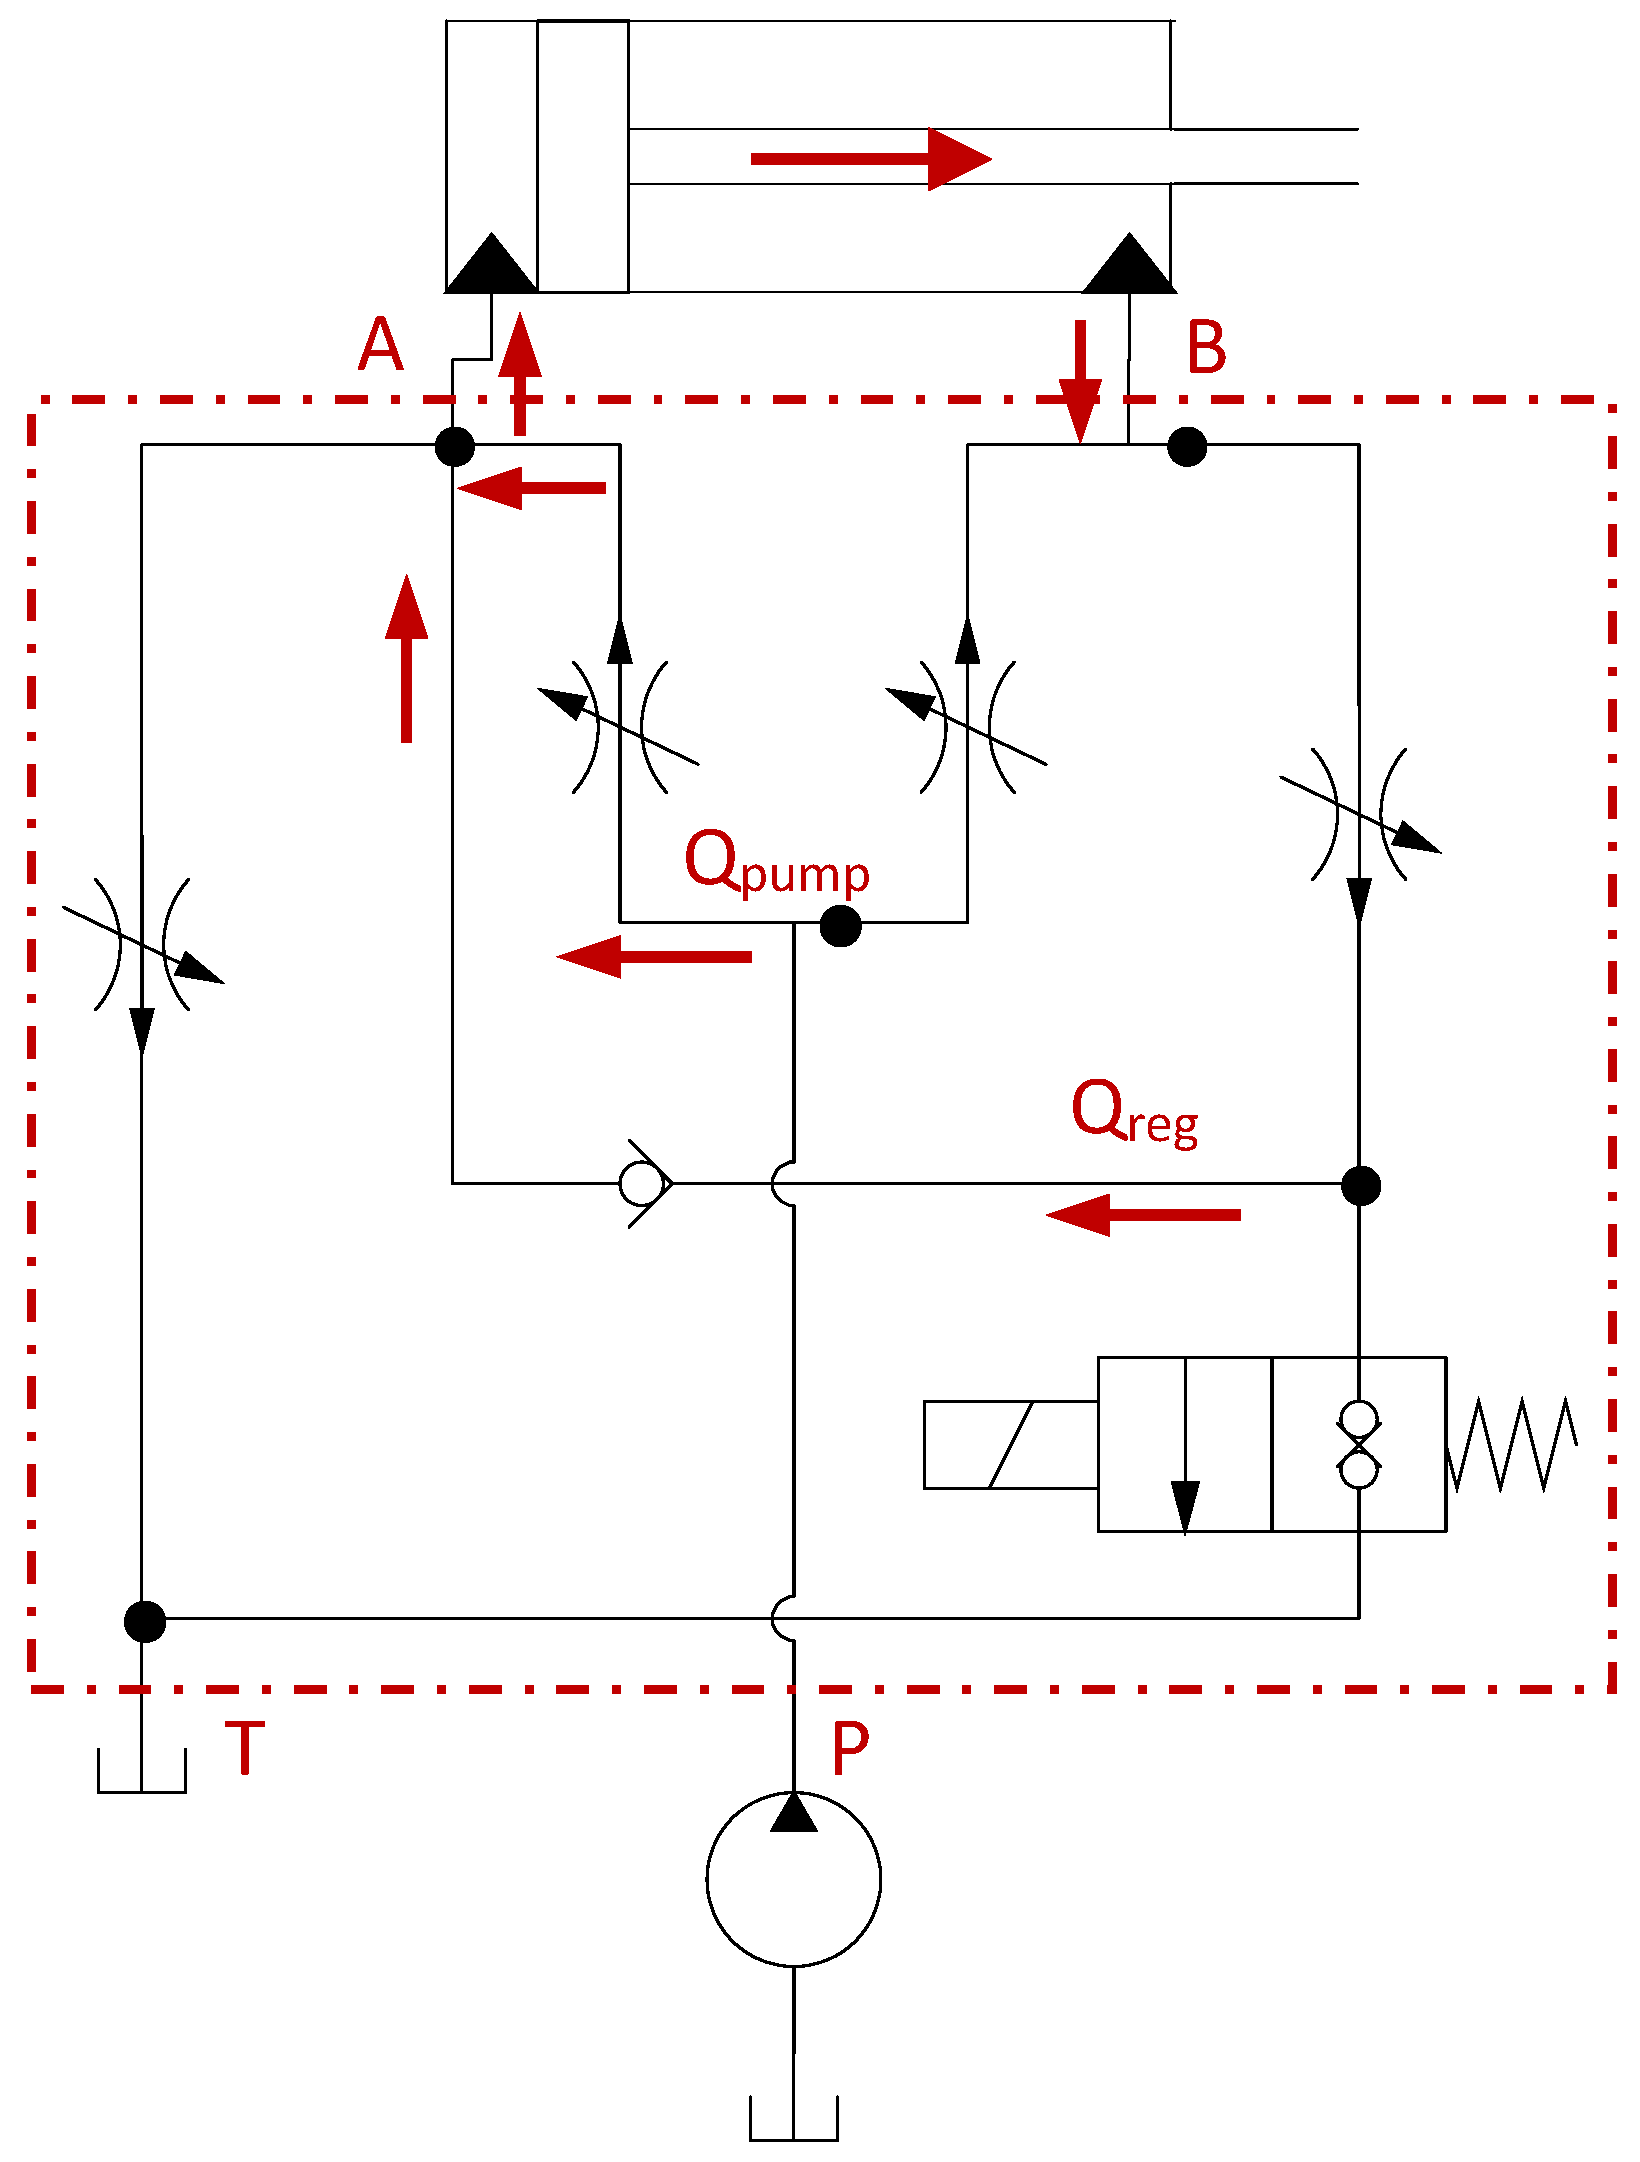
Active regeneration for high-speed movement.
Figure 9.
Active regeneration for high-speed movement.
Figure 10.
Main components of the Regenerative A - Hybrid Configuration.
Figure 10.
Main components of the Regenerative A - Hybrid Configuration.
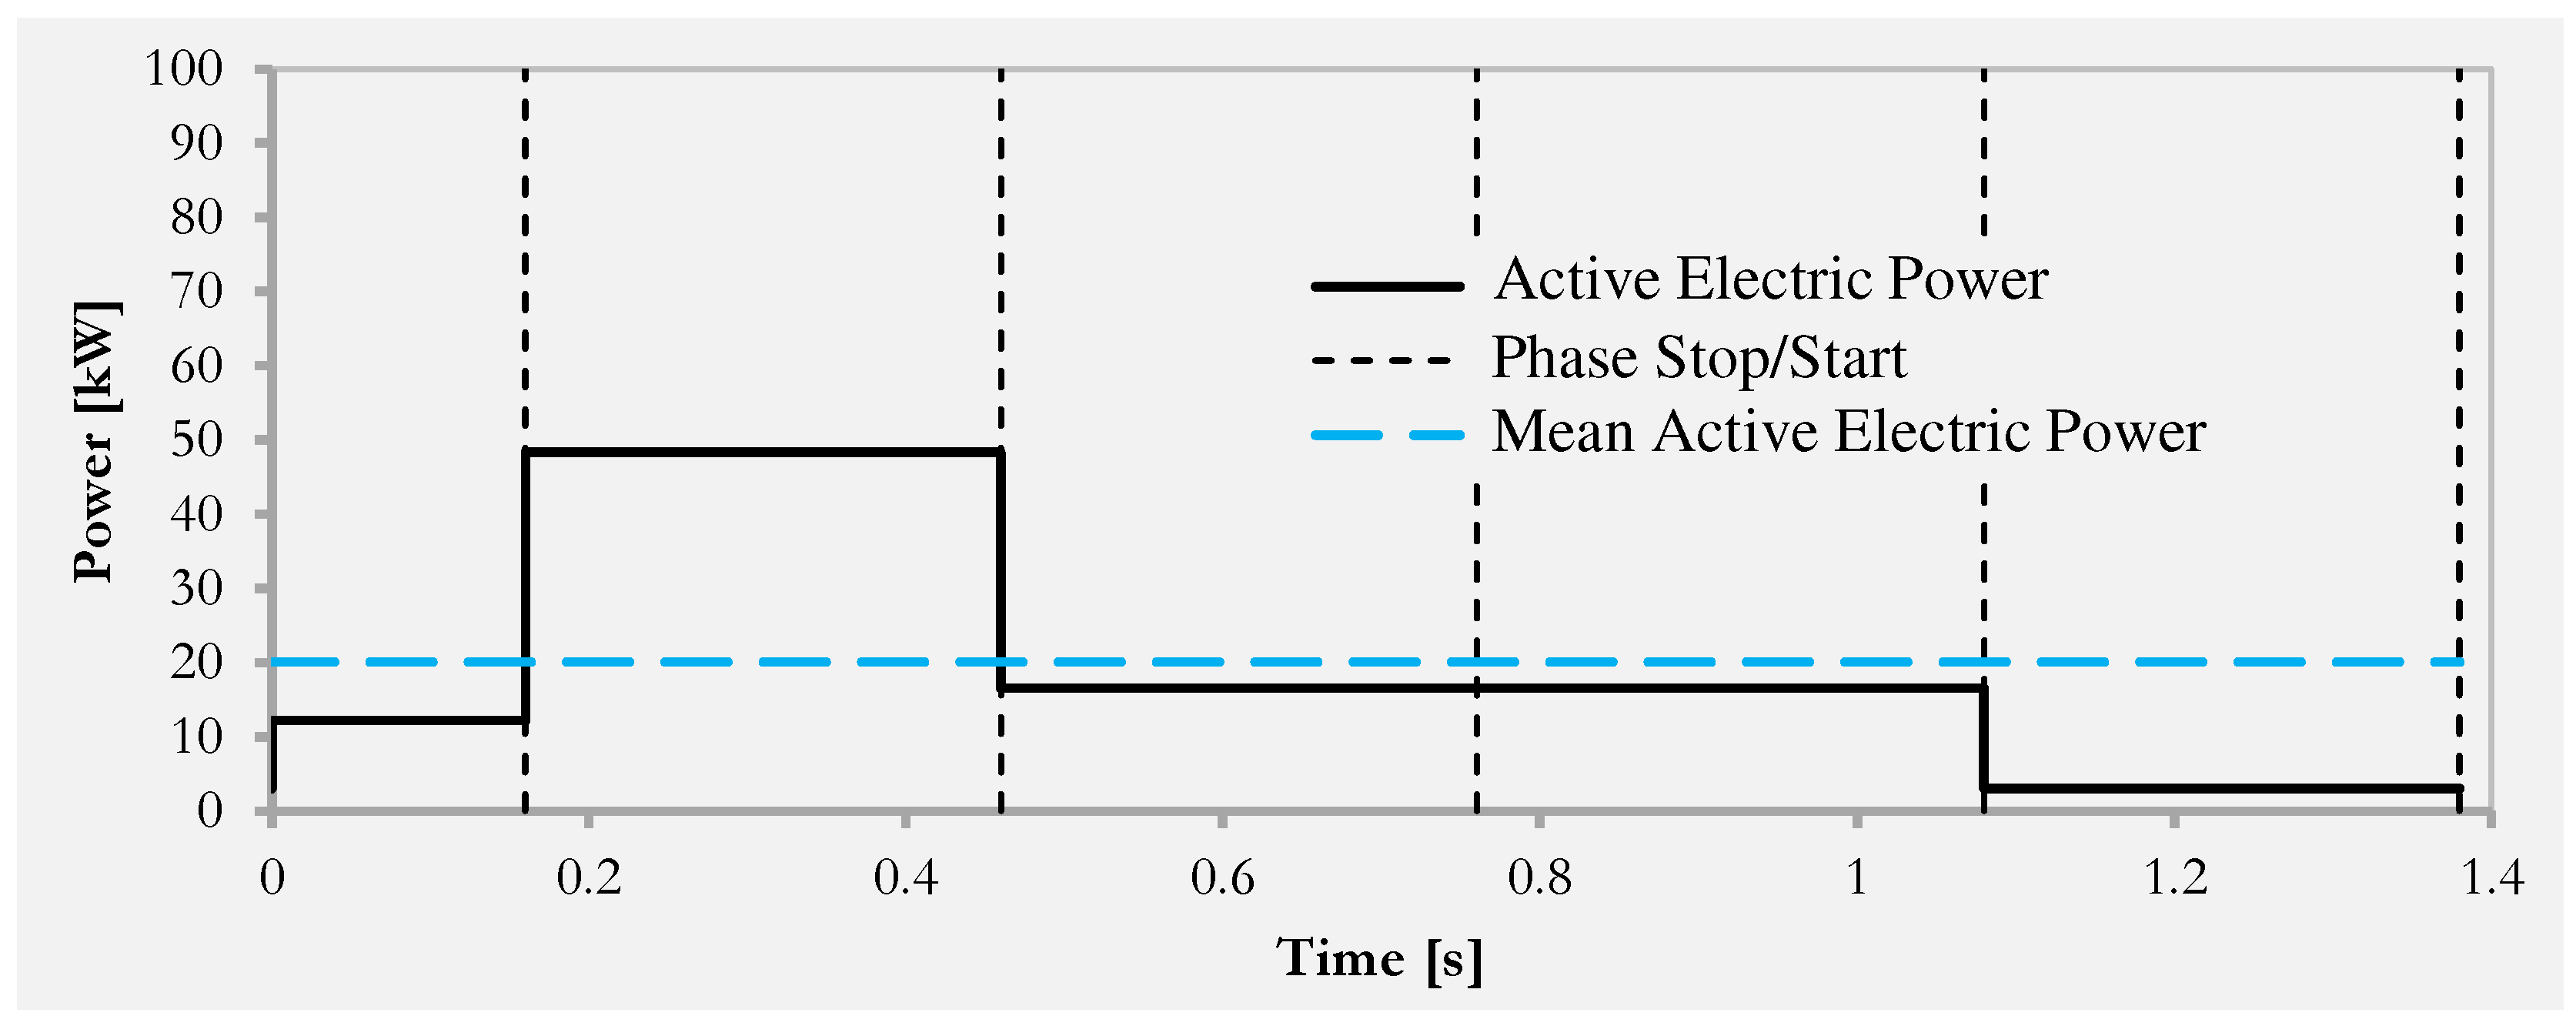
Figure 11.
Regenerative A - Hybrid Configuration - Active electrical power absorbed over the work cycle: instantaneous value and average value.
Figure 11.
Regenerative A - Hybrid Configuration - Active electrical power absorbed over the work cycle: instantaneous value and average value.
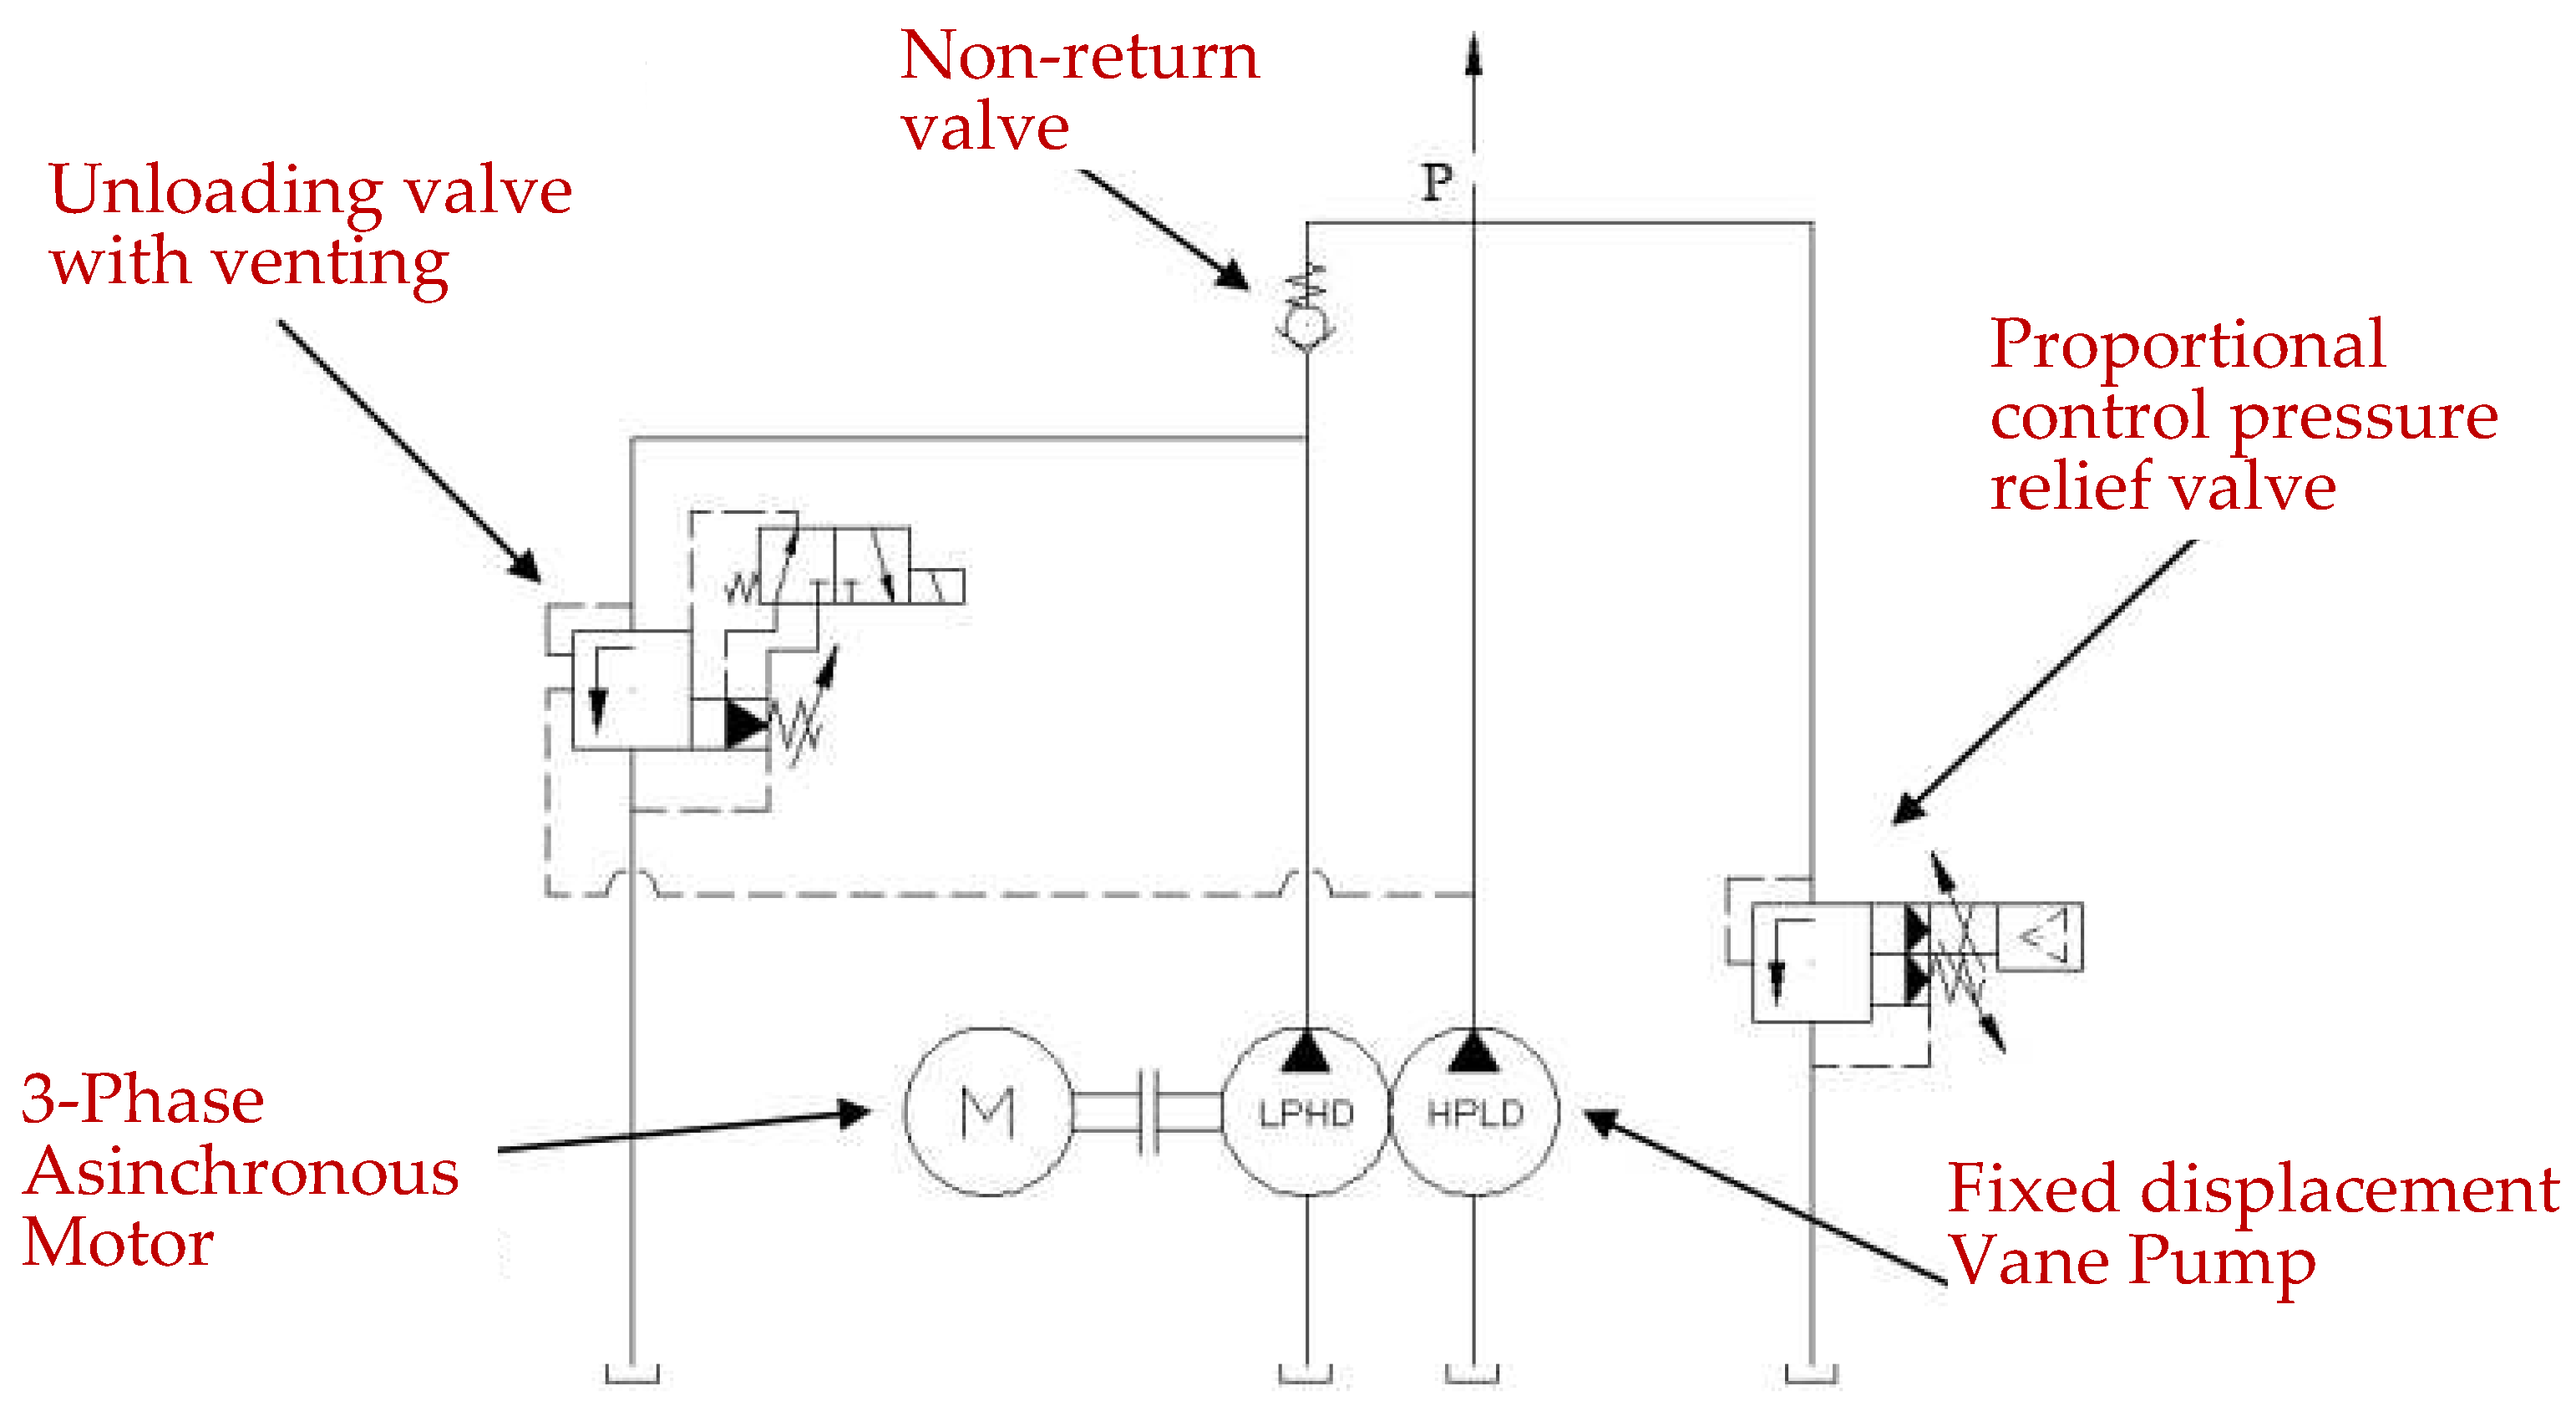
Figure 12.
Circuit of the Actuation Architecture for the High-Low configuration.
Figure 12.
Circuit of the Actuation Architecture for the High-Low configuration.
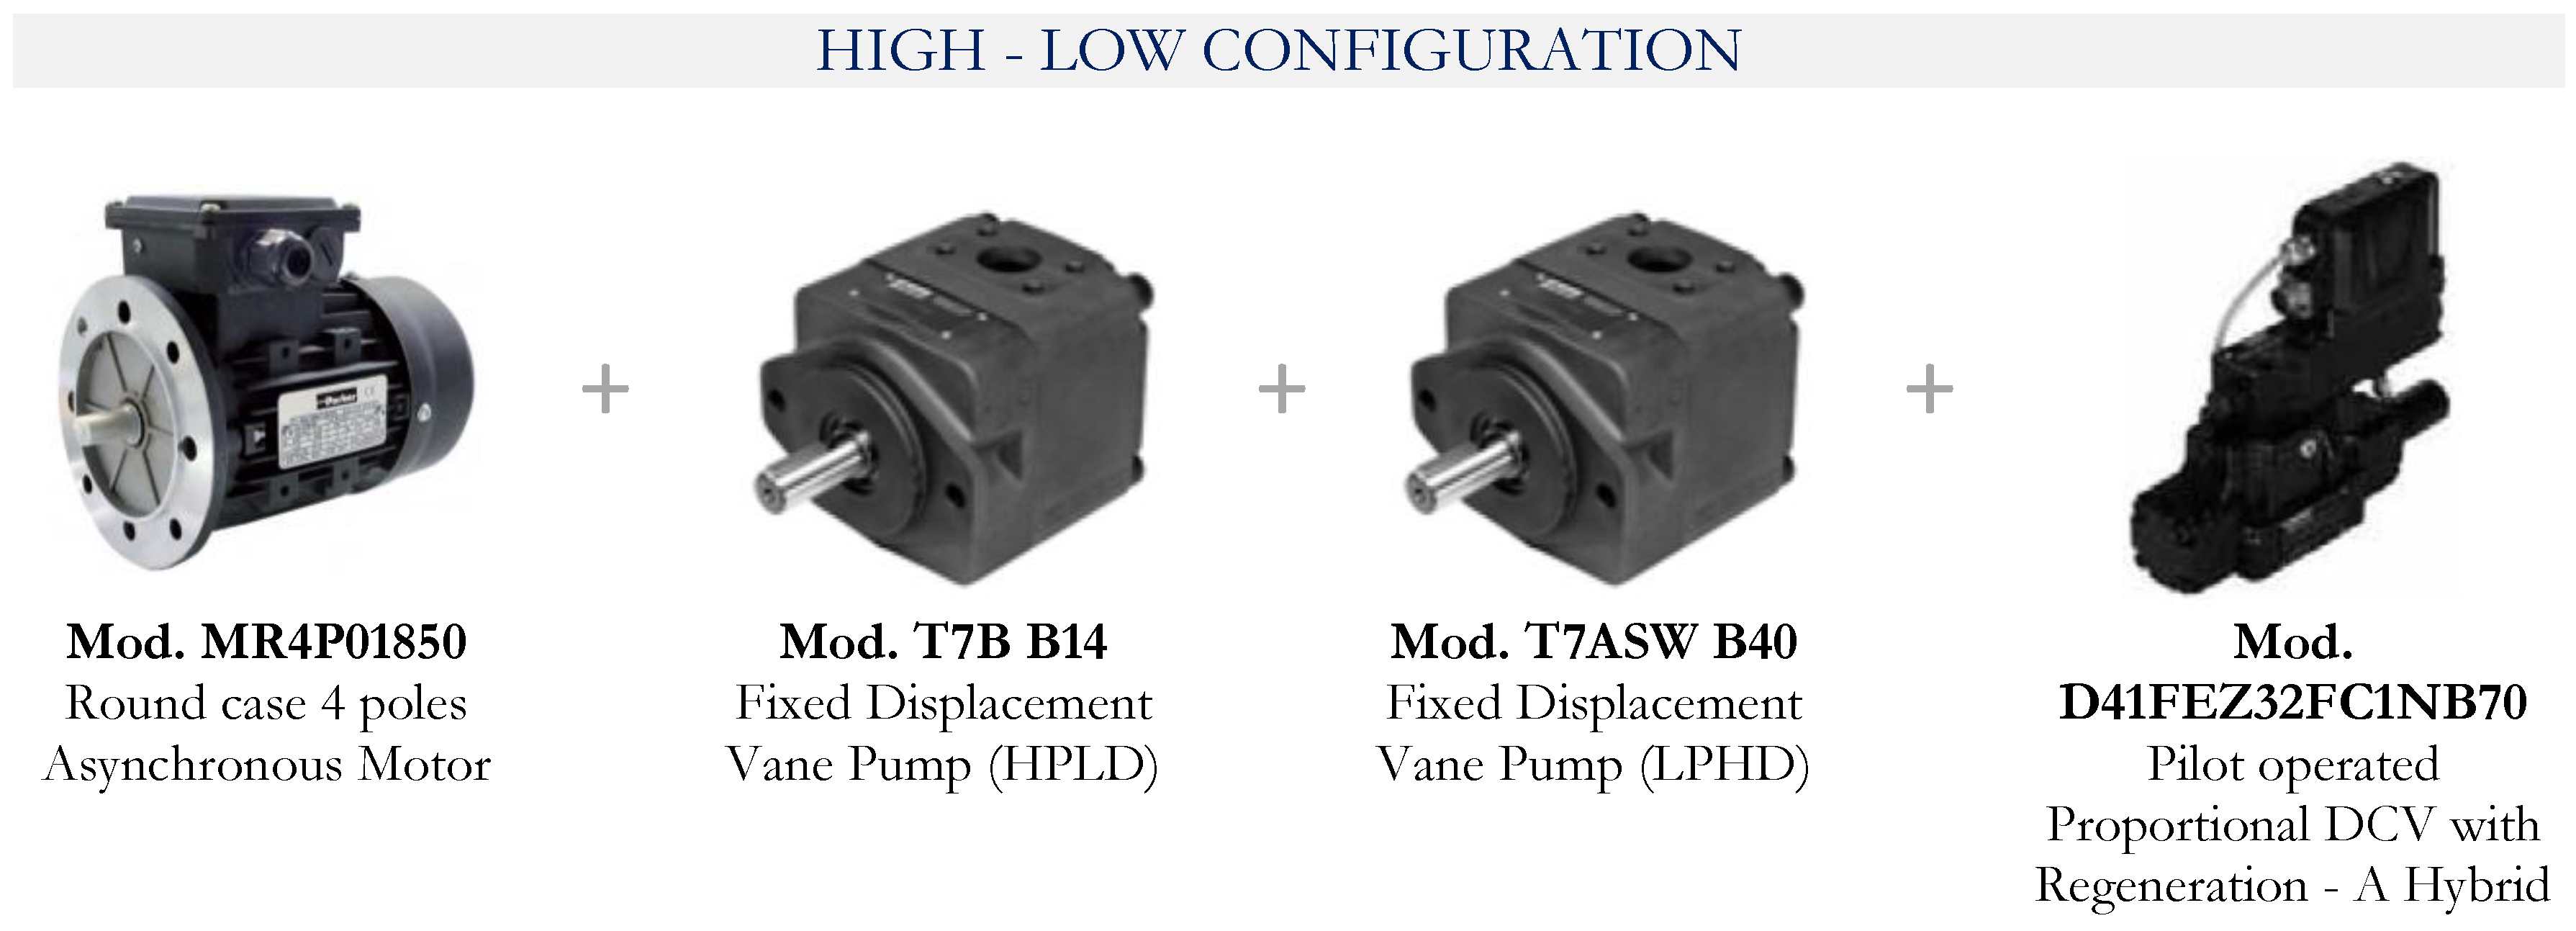
Figure 13.
Main components of High - Low Configuration.
Figure 13.
Main components of High - Low Configuration.
Figure 14.
High Low Configuration - Active electrical power absorbed over the work cycle: instantaneous value and average value.
Figure 14.
High Low Configuration - Active electrical power absorbed over the work cycle: instantaneous value and average value.
Figure 15.
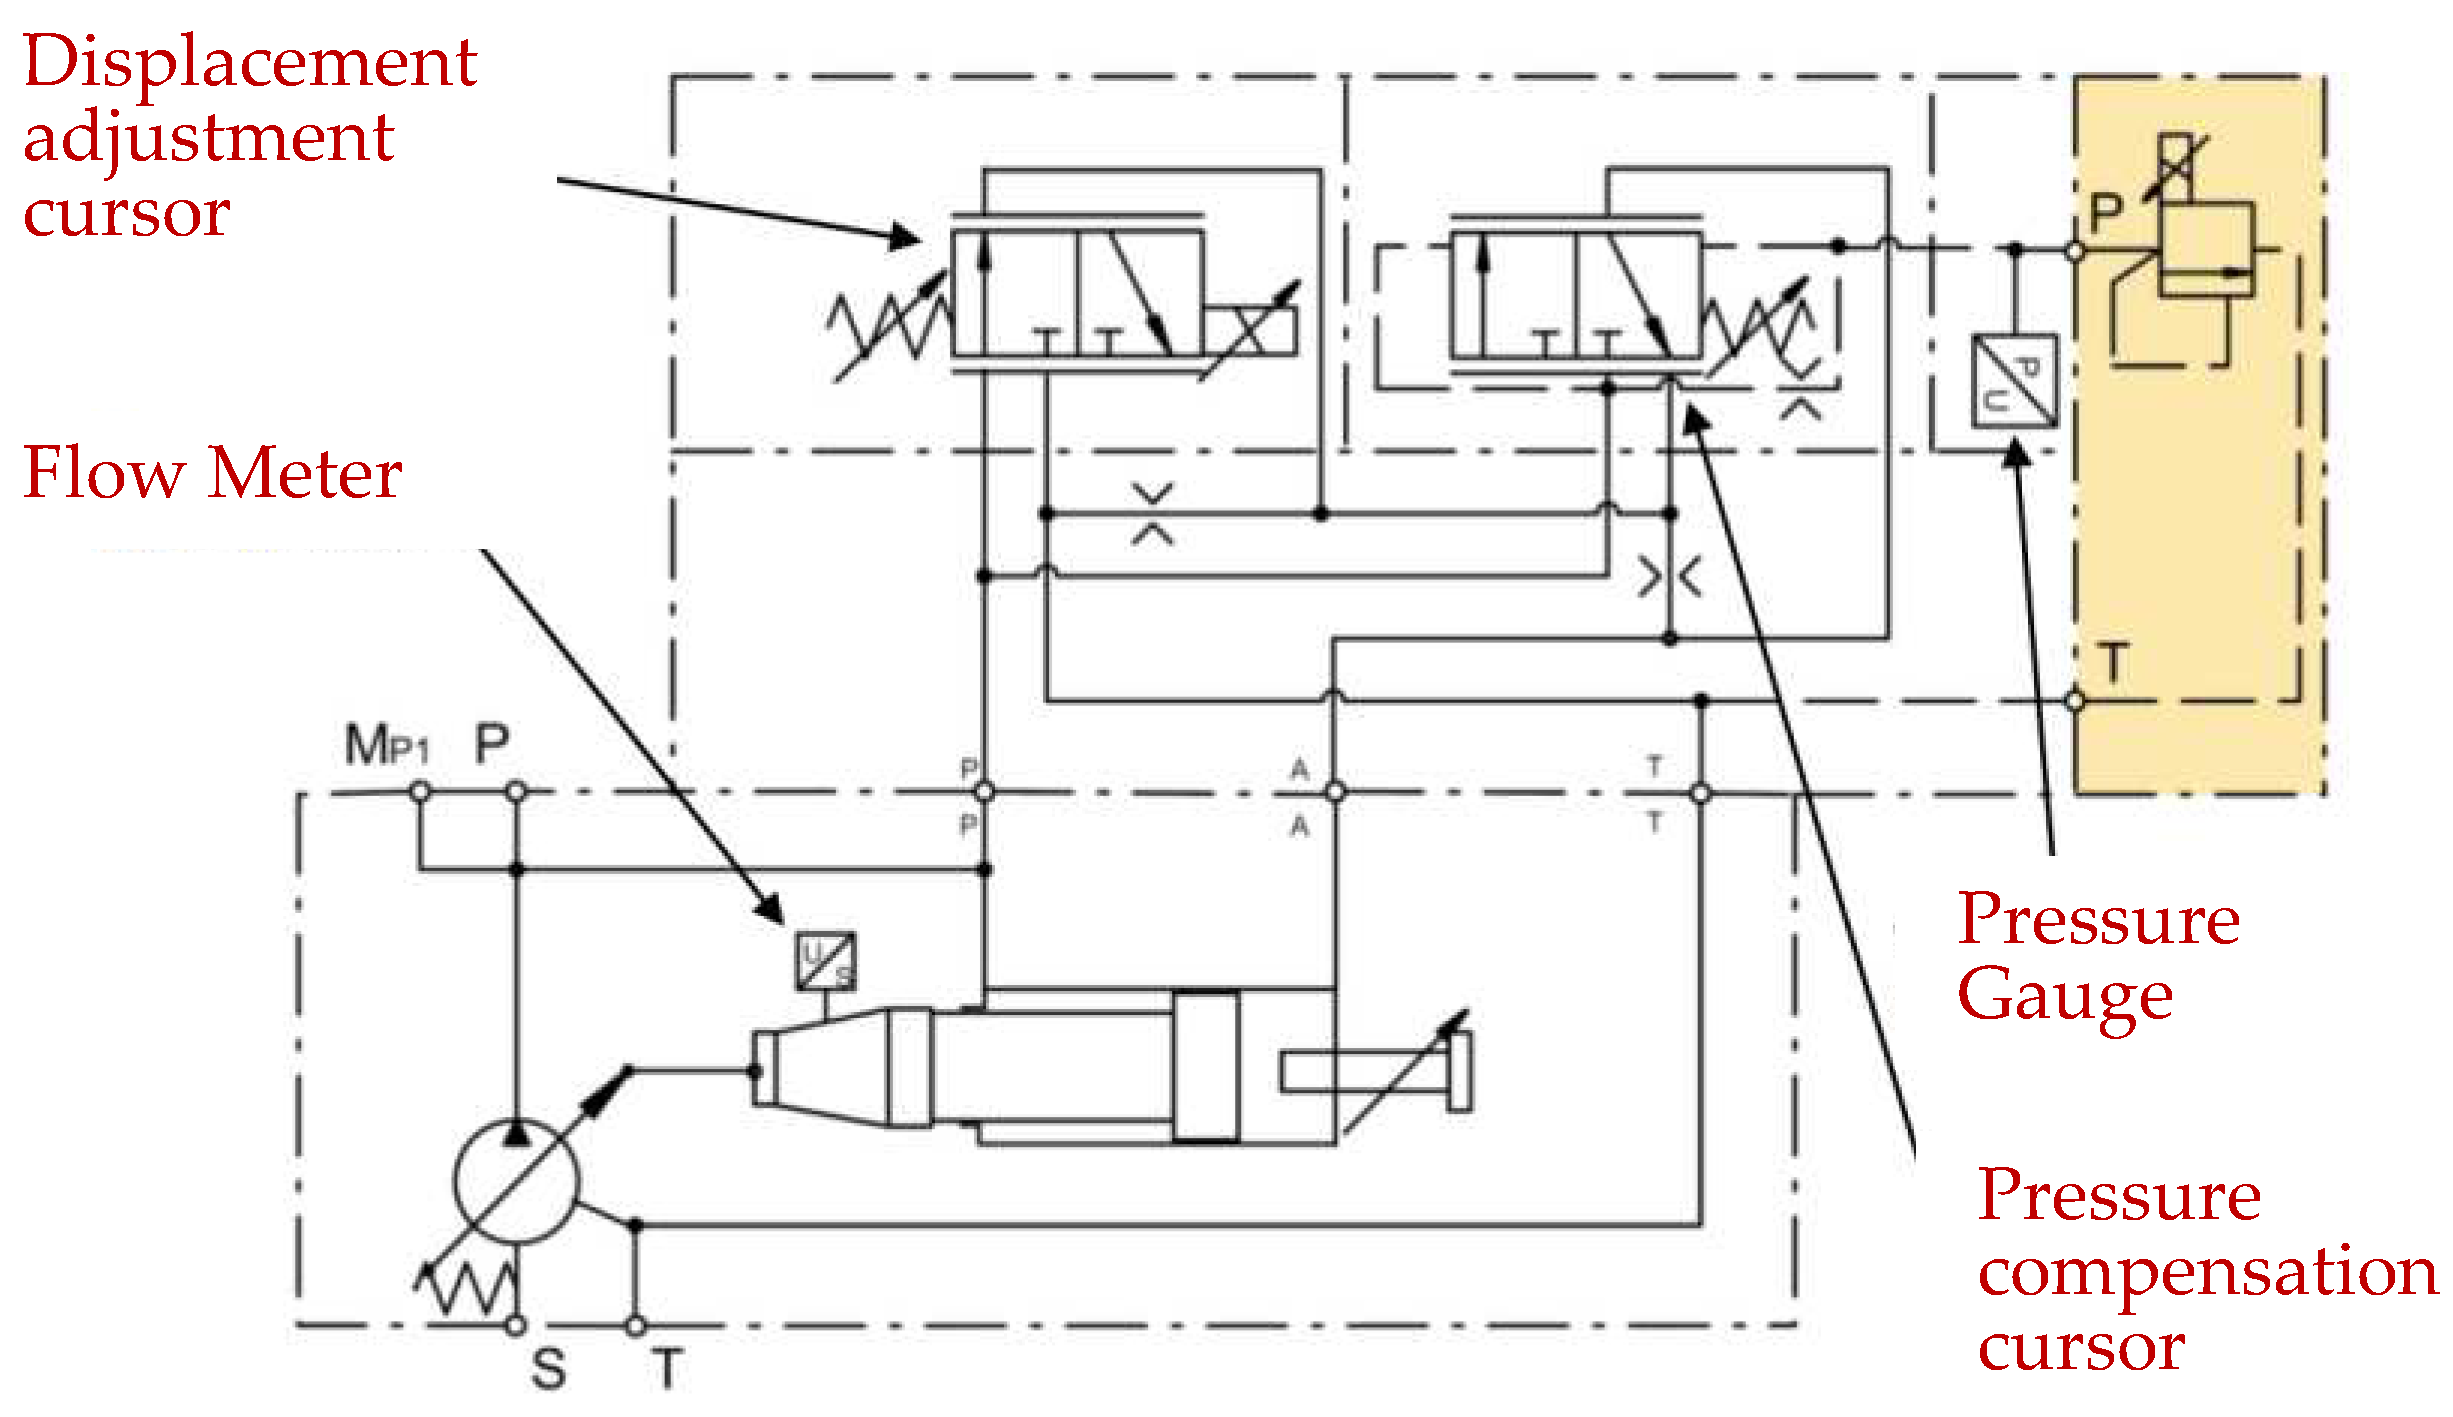
VDP configuration: Proportional Displacement Control with Closed Loop Pressure Control.
Figure 15.
VDP configuration: Proportional Displacement Control with Closed Loop Pressure Control.
Figure 16.
Main components of VDP Configuration.
Figure 16.
Main components of VDP Configuration.
Figure 17.
VDP Configuration - Active electrical power absorbed over the work cycle: instantaneous value and average value.
Figure 17.
VDP Configuration - Active electrical power absorbed over the work cycle: instantaneous value and average value.
Figure 18.
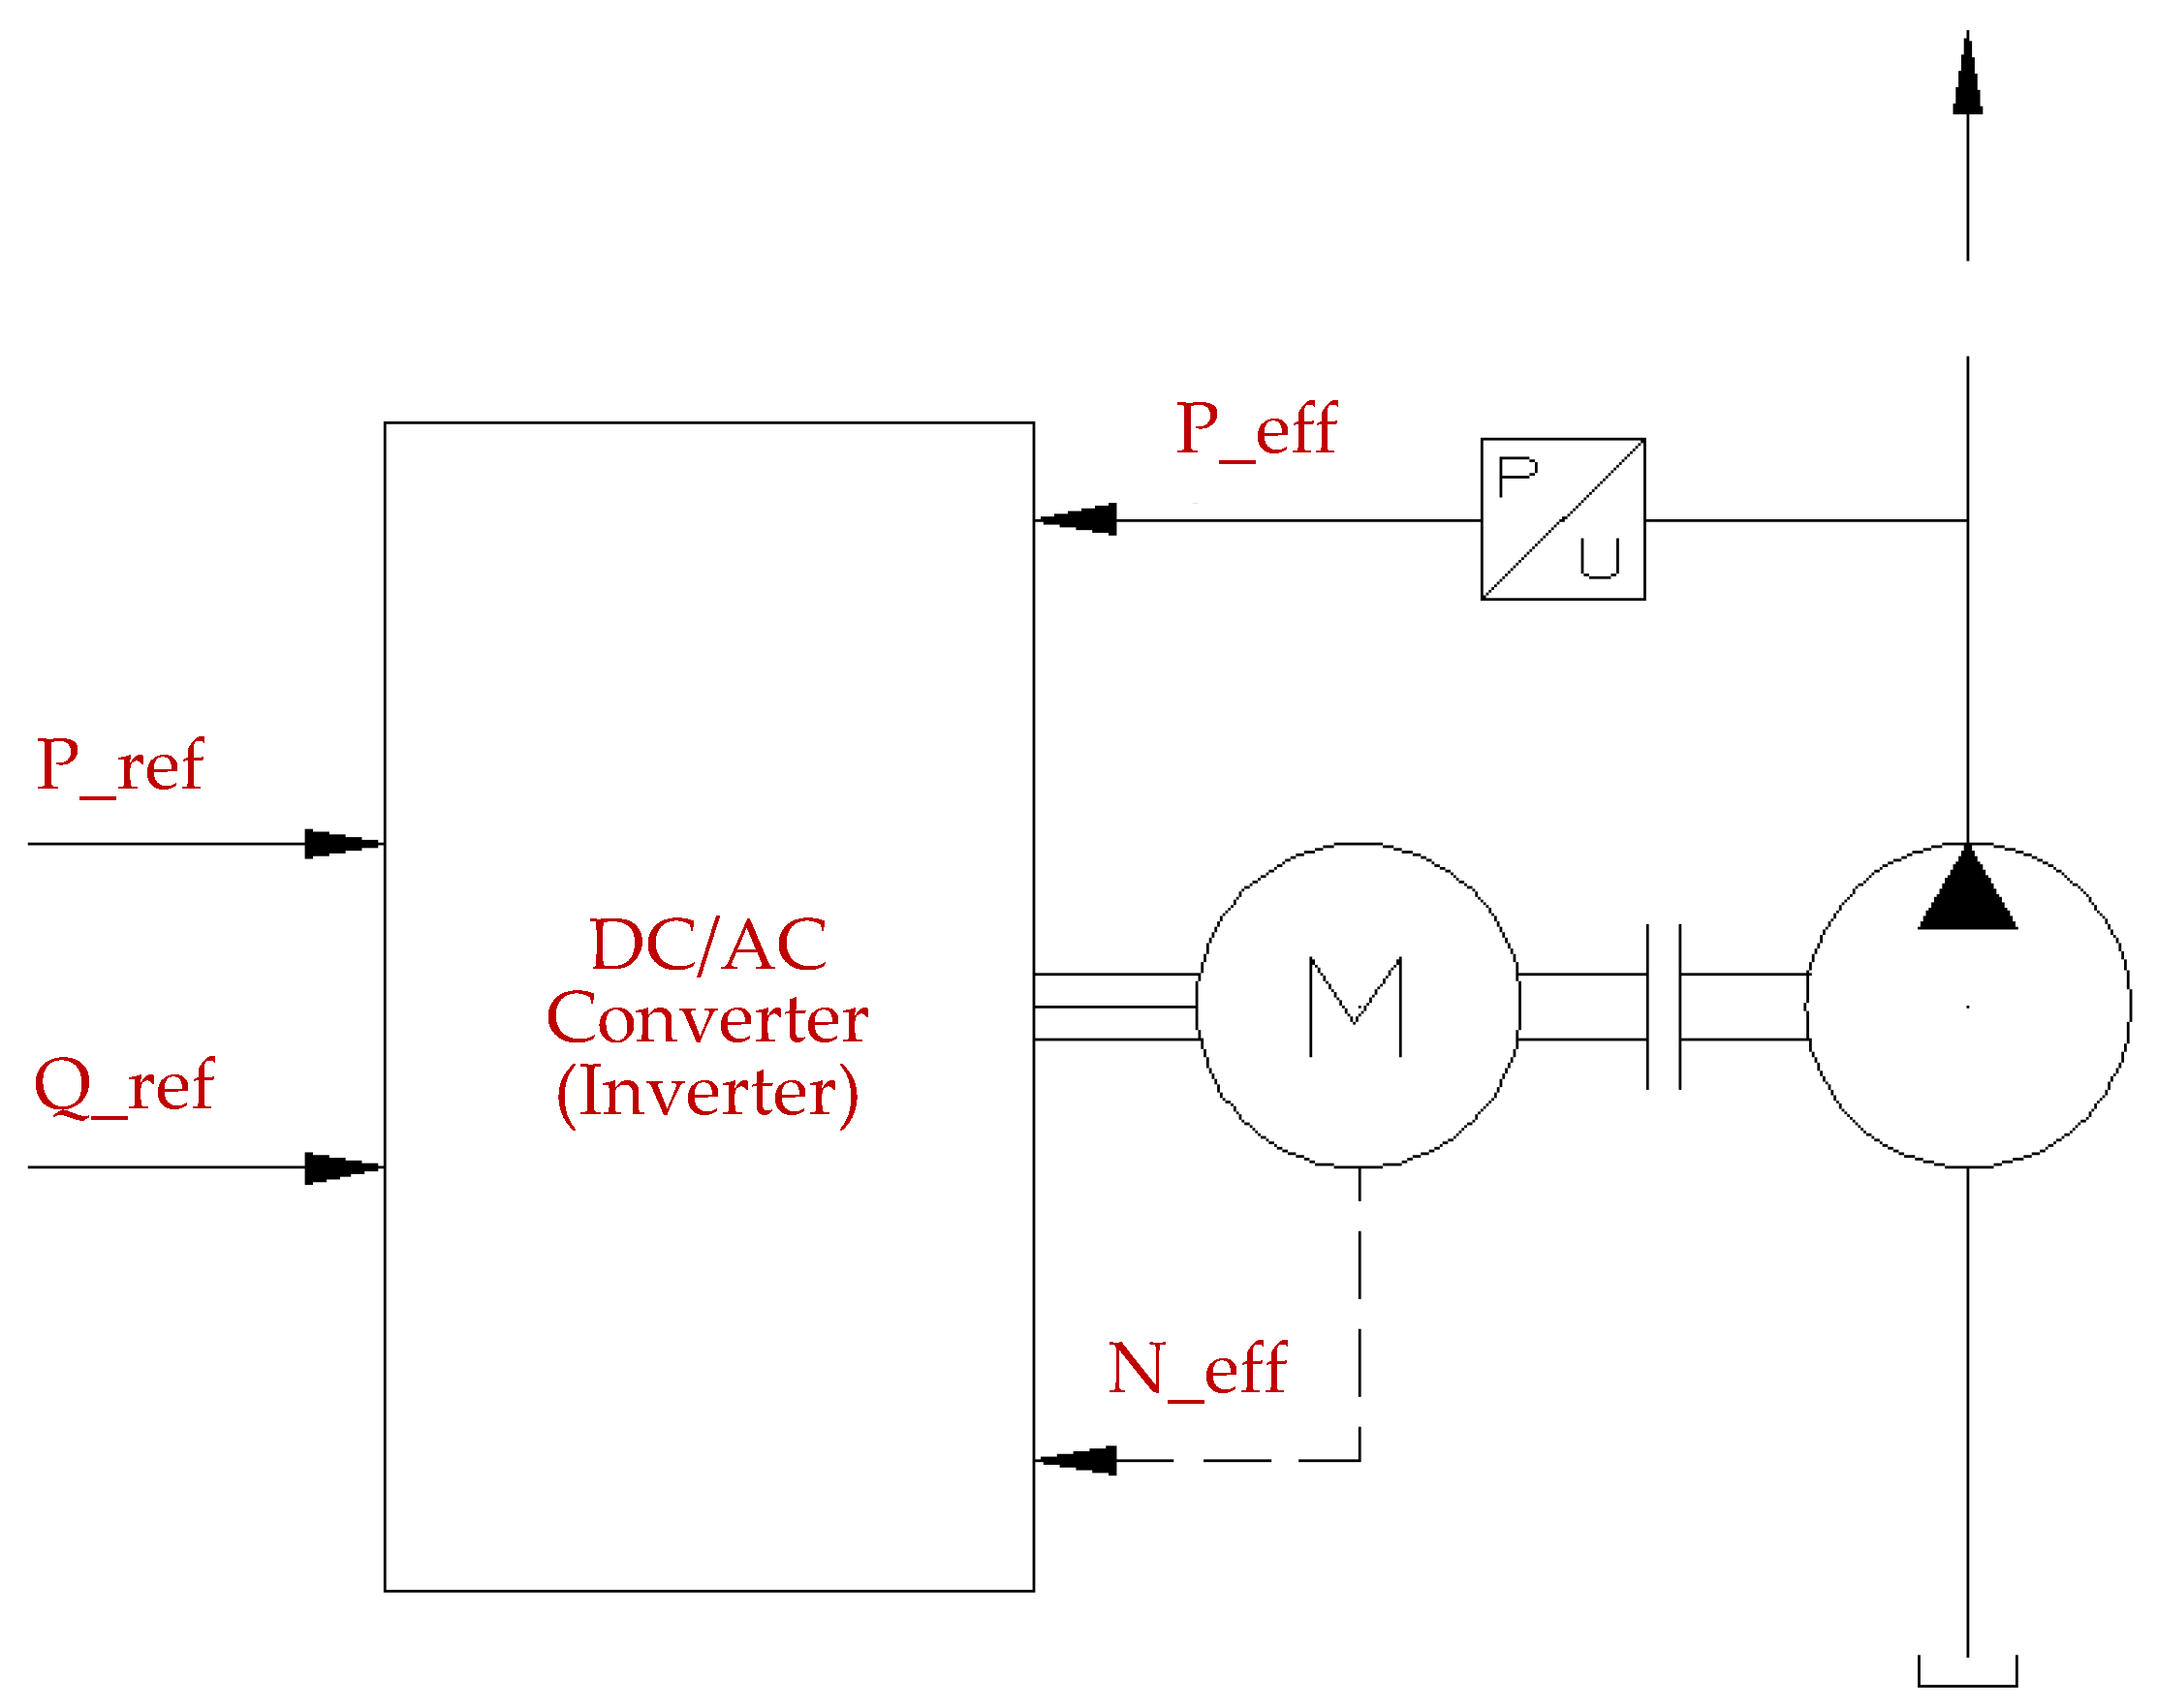
Direct Pump Control Architecture: power source scheme.
Figure 18.
Direct Pump Control Architecture: power source scheme.
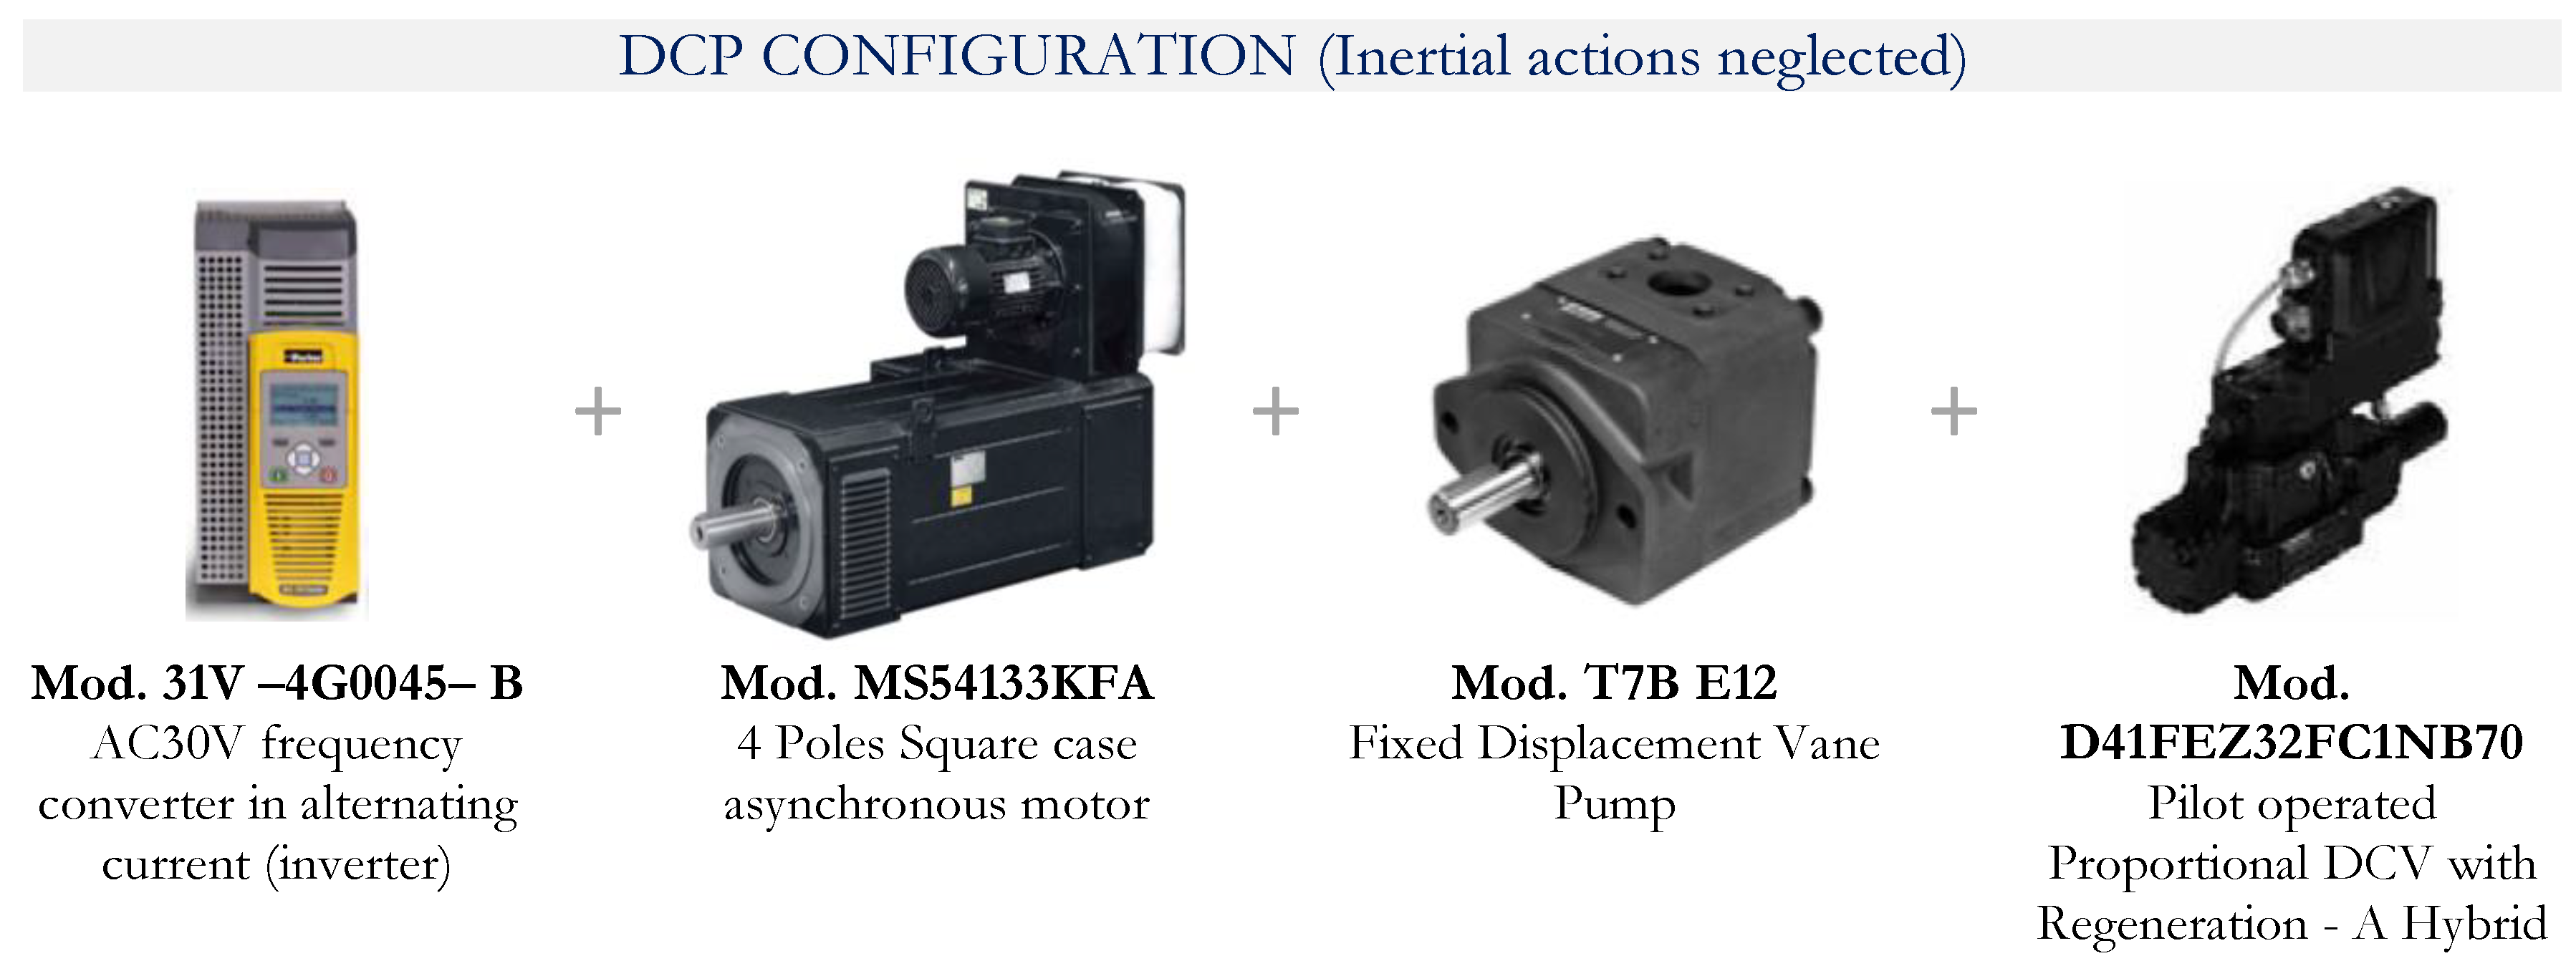
Figure 19.
Main components of DCP Static Configuration.
Figure 19.
Main components of DCP Static Configuration.
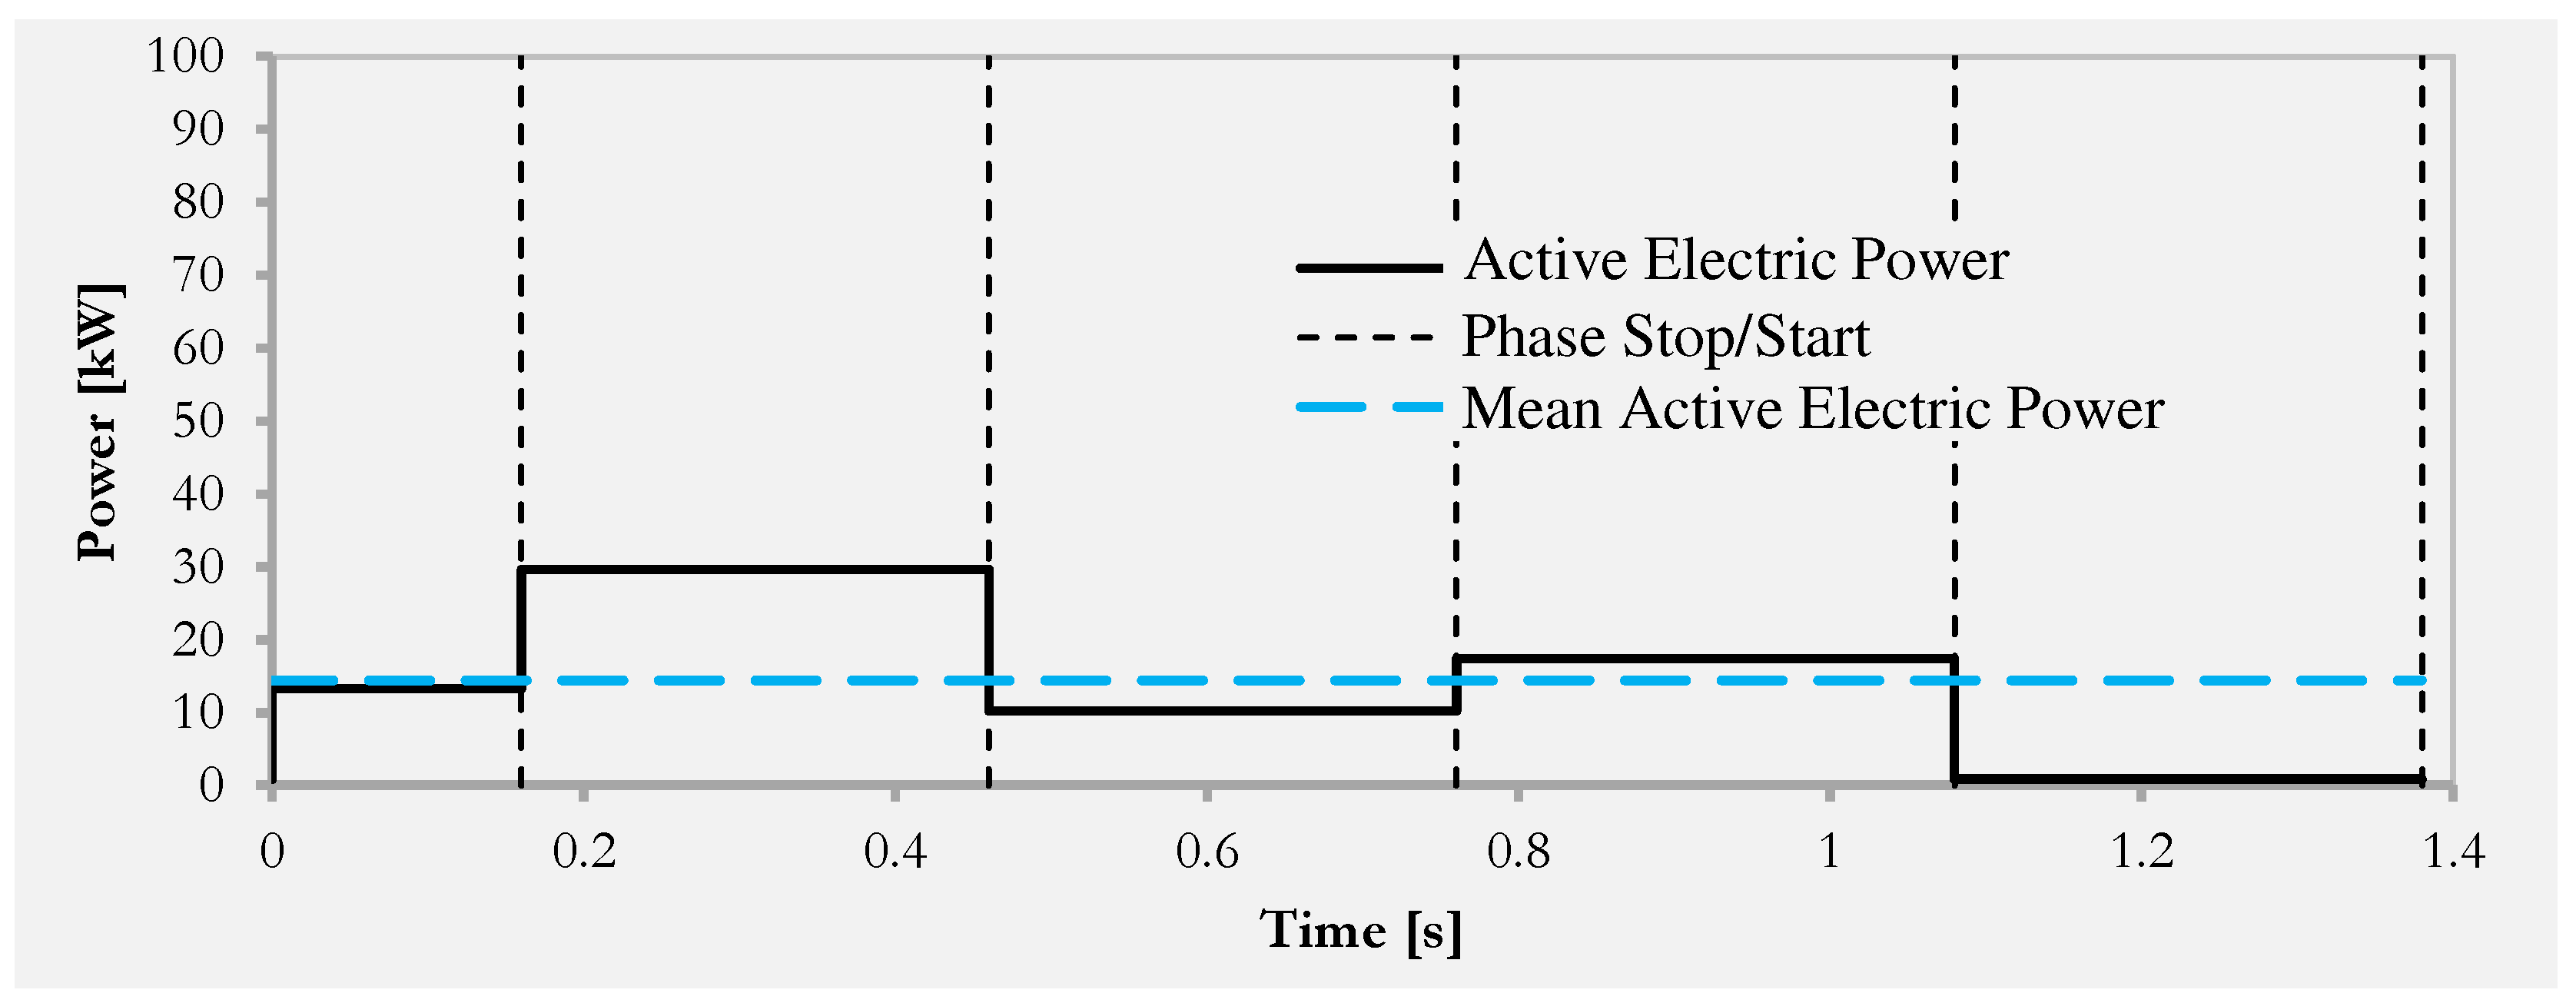
Figure 20.
DCP Static Configuration- Active electrical power absorbed over the work cycle: instantaneous value and average value.
Figure 20.
DCP Static Configuration- Active electrical power absorbed over the work cycle: instantaneous value and average value.
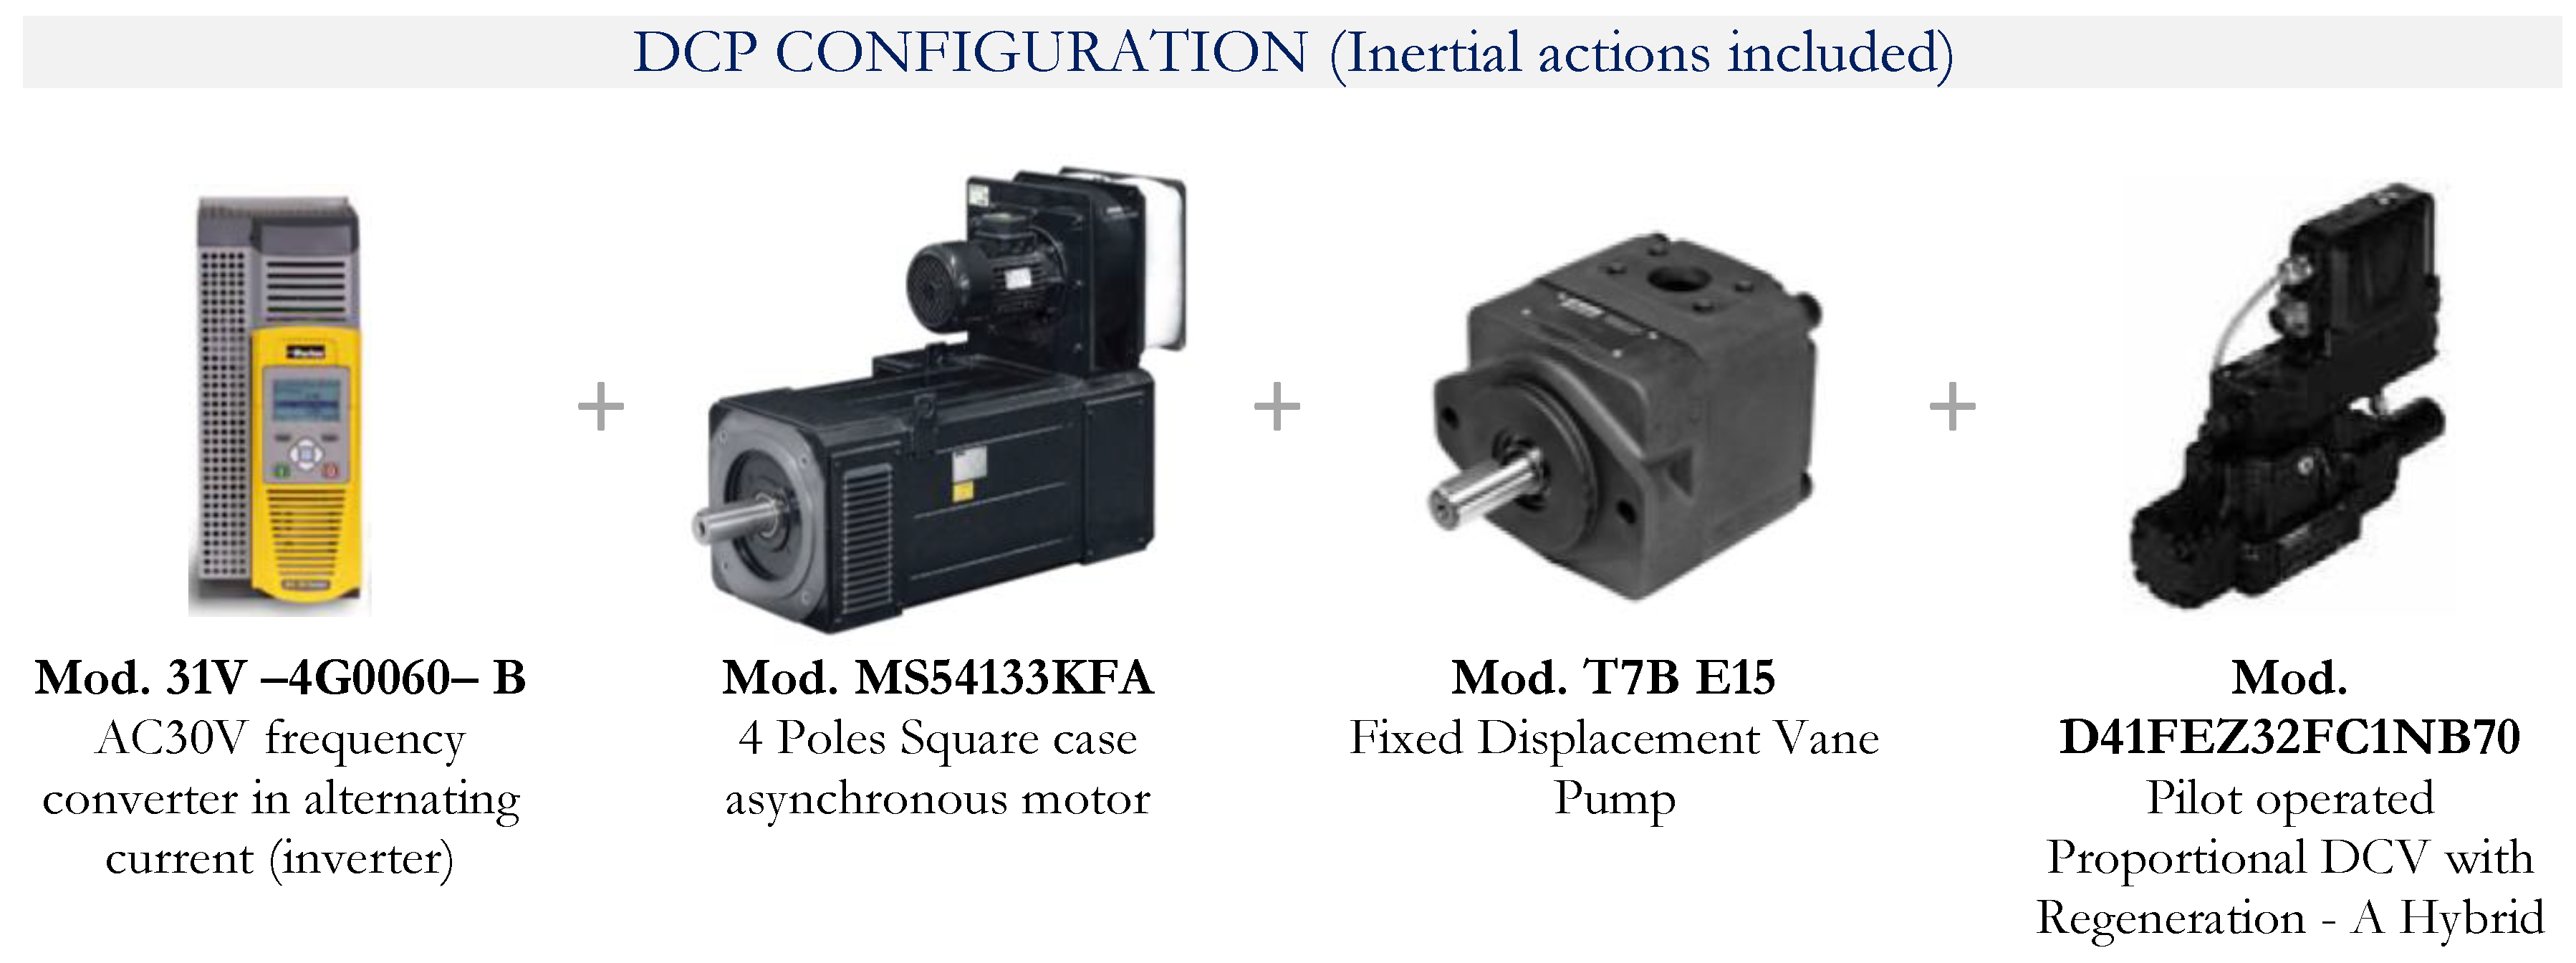
Figure 21.
Main components of DCP dynamic Configuration.
Figure 21.
Main components of DCP dynamic Configuration.
Figure 22.
DCP dynamic Configuration- Active electrical power absorbed over the work cycle: instantaneous value and average value.
Figure 22.
DCP dynamic Configuration- Active electrical power absorbed over the work cycle: instantaneous value and average value.
Figure 23.
Comparison between the different plant architectures in terms of average active electrical power absorption during the work cycle.
Figure 23.
Comparison between the different plant architectures in terms of average active electrical power absorption during the work cycle.
Figure 24.
Comparison between the different system architectures in terms of the hourly cost of electricity absorbed (active and reactive) during the work cycle.
Figure 24.
Comparison between the different system architectures in terms of the hourly cost of electricity absorbed (active and reactive) during the work cycle.
Figure 25.
Active current and active electrical power absorbed by the real blanking press with DCP power architecture.
Figure 25.
Active current and active electrical power absorbed by the real blanking press with DCP power architecture.
Table 1.
Considered and compared power drive architectures for a press for semi-finished brass products.
Table 1.
Considered and compared power drive architectures for a press for semi-finished brass products.
| Configuration |
Electric Drive |
Pump |
Directional Valve |
| Standard |
round-case induction electric motor |
fixed displacement vane pump |
standard DCV |
| Regenerative |
round-case induction electric motor |
fixed displacement vane pump |
DCV with regeneration A – Hybrid |
| High - Low |
round-case induction electric motor |
two fixed-displacement vane pumps |
DCV with regeneration A – Hybrid |
| VDP |
round-case induction electric motor |
variable displacement axial piston pump |
DCV with regeneration A – Hybrid |
| DCP |
AC frequency converter + round-case induction electric motor |
fixed displacement vane pump |
DCV with regeneration A – Hybrid |
Table 2.
Technical requirements for the hydraulic system.
Table 2.
Technical requirements for the hydraulic system.
| Parameter |
Value |
Unit |
| Minimum blanking force |
294300 |
[N] |
| Rotation phase duration for the rotary table |
0.3 |
[s] |
| Maximum duration of the entire processing cycle |
1.4 |
[s] |
| Maximum duration of operation for the actuator |
1.1 |
[s] |
| Maximum mass of the tooling anchored to the rod |
80 |
[kg] |
Table 3.
Rod stroke, piston translation speed, maximum pressure and maximum flow rate in the processing cycle phases.
Table 3.
Rod stroke, piston translation speed, maximum pressure and maximum flow rate in the processing cycle phases.
| Parameter |
Unit |
Quick Descent - QD |
Blanking - B |
Expulsion - E |
Quick Rise - QR |
Table Rotation - TR |
| stroke (s) |
[mm] |
40 |
20 |
20 |
80 |
- |
| velocity (v) |
[mm/s] |
250 |
67 |
67 |
250 |
- |
| max. pressure (P) |
[bar] |
50 |
200 |
70 |
70 |
10 |
| max. flow rate (Q) |
[l/min] |
230.8 |
61.9 |
61.9 |
13 |
10 |
Table 4.
Fluid and cylinder: designations and technical data.
Table 4.
Fluid and cylinder: designations and technical data.
| Circuit Element |
Parameter |
Value |
| Fluid |
Code |
Castrol serie HYSPIN ZZ 46 |
| |
Fluid Type |
Mineral Oil |
| |
Viscosity |
ISO VG 46 |
| Cylinder |
Code |
Parker 140MF3MMAXRN23M300M1133AOAO |
| |
Type |
Double Acting |
| |
Bore |
140 [mm] |
| |
Rod Diameter |
100 [mm] |
| |
Stroke |
300 [mm] |
| |
Fixing |
Front flange with feet and fixed load with rigid guide |
| |
Area Ratio |
1.96 |
Table 5.
Designations and technical data of the main elements of the standard architecture.
Table 5.
Designations and technical data of the main elements of the standard architecture.
| Circuit Element |
Parameter |
Value |
| Electric motor |
Code |
Parker Mod. MR4P05500 |
| |
Type |
4 poles - round case |
| |
Nominal Power |
55 [kW] |
| |
Nominal Speed |
1480 [RPM] |
| |
Nominal Torque |
354.87 [Nm] |
| |
Efficiency |
0.935 |
| Pump |
Code |
Parker Mod. T7E 050 |
| |
Type |
Fixed Displacement Vane Pump |
| |
Nominal Displacement |
158.5 [ml/min] |
| |
Speed Range |
600 - 2200 [RPM] |
| |
Max continuous pressure |
210 [bar] |
| Directional Valve |
Code |
Parker Mod. D41FEE02FC1NB70 |
| |
Type |
Pilot operated Proportional DCV 1:1:1:1 |
| |
Nominal flow rate |
200 [l/min] |
| |
Nominal pressure drop |
5 [bar] |
| Pressure Relief Valve |
Code |
Parker Mod. R4V03535P0PM10VA1 |
| |
Type |
Pilot operated proportional pressure relief valve |
| |
Nominal flow rate |
250 [l/min] |
| |
Maximum Pressure |
350 [bar] |
Table 6.
Designations and technical data of the main elements of the regenerative architecture.
Table 6.
Designations and technical data of the main elements of the regenerative architecture.
| Circuit Element |
Parameter |
Value |
| Electric motor |
Code |
Parker Mod. MR4P03000 |
| |
Type |
4 poles - round case |
| |
Nominal Power |
30 [kW] |
| |
Nominal Speed |
1460 [RPM] |
| |
Nominal Torque |
196.22 [Nm] |
| |
Efficiency |
0.923 |
| Pump |
Code |
Parker Mod. Mod. T7D B24 |
| |
Type |
Fixed Displacement Vane Pump |
| |
Nominal Displacement |
81.1 [ml/min] |
| |
Speed Range |
600 - 3000 [RPM] |
| |
Max continuous pressure |
250 [bar] |
| Directional Valve |
Code |
Parker Mod. D41FEZ32FC1NB70 |
| |
Type |
Pilot operated Proportional DDCV with Regeneration - A Hybrid |
| |
Nominal flow rate |
200 [l/min] |
| |
Nominal pressure drop |
5 [bar] |
| Pressure Relief Valve |
Code |
Parker Mod. R4V03535P0PM10VA1 |
| |
Type |
Pilot operated proportional pressure relief valve |
| |
Nominal flow rate |
250 [l/min] |
| |
Maximum Pressure |
350 [bar] |
Table 7.
Designations and technical data of the main elements of the regenerative architecture.
Table 7.
Designations and technical data of the main elements of the regenerative architecture.
| Circuit Element |
Parameter |
Value |
| Electric motor |
Code |
Parker Mod. MR4P01850 |
| |
Type |
4 poles - round case |
| |
Nominal Power |
18.5 [kW] |
| |
Nominal Speed |
1460 [RPM] |
| |
Nominal Torque |
121.32 [Nm] |
| |
Efficiency |
0.914 |
| HPLD Pump |
Code |
Parker Mod. T7B B14 |
| |
Type |
Fixed Displacement Vane Pump |
| |
Nominal Displacement |
45 [ml/min] |
| |
Speed Range |
600 - 3000 [RPM] |
| |
Max continuous pressure |
275 [bar] |
| LPHD Pump |
Code |
Parker Mod. T7ASW B40 |
| |
Type |
Fixed Displacement Vane Pump |
| |
Nominal Displacement |
40 [ml/min] |
| |
Speed Range |
600 - 3000 [RPM] |
| |
Max continuous pressure |
240 [bar] |
| Directional Valve |
Code |
Parker Mod. D41FEZ32FC1NB70 |
| |
Type |
Pilot operated Proportional DCV with Regeneration - A Hybrid |
| |
Nominal flow rate |
200 [l/min] |
| |
Nominal pressure drop |
5 [bar] |
| Pressure Relief Valve |
Code |
Parker Mod. R4V03535P0PM10VA1 |
| |
Type |
Pilot operated proportional pressure relief valve |
| |
Nominal flow rate |
250 [l/min] |
| |
Maximum Pressure |
350 [bar] |
| Unloading Valve |
Code |
Parker Mod. R4U03 – 533 |
| |
Type |
Pilot operated Unloading Valve with venting |
| |
Nominal flow rate |
150 [l/min] |
| |
Nominal Open-Close pressure drop |
28% of the setting pressure |
Table 8.
Designations and technical data of the main elements of the regenerative architecture.
Table 8.
Designations and technical data of the main elements of the regenerative architecture.
| Circuit Element |
Parameter |
Value |
| Electric motor |
Code |
Parker Mod. MR4P01850 |
| |
Type |
4 poles - round case |
| |
Nominal Power |
18.5 [kW] |
| |
Nominal Speed |
1460 [RPM] |
| |
Nominal Torque |
121.32 [Nm] |
| |
Efficiency |
0.914 |
| Pump |
Code |
Parker Mod. PV 092 |
| |
Type |
Axial Piston Pump - variable displacement |
| |
Max Displacement |
92 [ml/min] |
| |
Speed Range |
400 - 2500 [RPM] |
| |
Nominal pressure |
350 [bar] |
| Directional Valve |
Code |
Parker Mod. D41FEZ32FC1NB70 |
| |
Type |
Pilot operated Proportional DCV with Regeneration - A Hybrid |
| |
Nominal flow rate |
200 [l/min] |
| |
Nominal pressure drop |
5 [bar] |
| Pressure Relief Valve |
Code |
Parker Mod. R4V03535P0PM10VA1 |
| |
Type |
Pilot operated proportional pressure relief valve |
| |
Nominal flow rate |
250 [l/min] |
| |
Maximum Pressure |
350 [bar] |
Table 9.
Designations and technical data of the main elements of the regenerative architecture.
Table 9.
Designations and technical data of the main elements of the regenerative architecture.
| Circuit Element |
Parameter |
Value |
| Electric motor |
Code |
Parker Mod. MS54133KFA |
| |
Type |
4 poles - square case |
| |
Nominal Power |
16 [kW] |
| |
Nominal Speed |
1500 [RPM] |
| |
Nominal Torque |
102 [Nm] |
| |
Efficiency |
0.85 |
| Frequency converter |
Code |
Parker Mod. 31V - 4G0045 |
| |
Nominal Electric Power |
22 [kW] |
| |
Nominal Current |
45 [A] |
| |
Maximum Current |
49.5 [A] |
| |
Efficiency |
0.98 |
| Pump |
Code |
Parker Mod. T7B E12 |
| |
Type |
Fixed Displacement Vane Pump for variable speed drives |
| |
Max Displacement |
41 [ml/min] |
| |
Speed Range |
300 - 3000 [RPM] |
| |
Nominal pressure |
275 [bar] |
| Directional Valve |
Code |
Parker Mod. D41FEZ32FC1NB70 |
| |
Type |
Pilot operated Proportional DCV with Regeneration - A Hybrid |
| |
Nominal flow rate |
200 [l/min] |
| |
Nominal pressure drop |
5 [bar] |
| Pressure Relief Valve |
Code |
Parker Mod. R4V03535P0PM10VA1 |
| |
Type |
Pilot operated proportional pressure relief valve |
| |
Nominal flow rate |
250 [l/min] |
| |
Maximum Pressure |
350 [bar] |
Table 10.
Designations and technical data of the main elements of the regenerative architecture.
Table 10.
Designations and technical data of the main elements of the regenerative architecture.
| Circuit Element |
Parameter |
Value |
| Electric motor |
Code |
Parker Mod. MS54133KFA |
| |
Type |
4 poles - square case |
| |
Nominal Power |
16 [kW] |
| |
Nominal Speed |
1500 [RPM] |
| |
Nominal Torque |
102 [Nm] |
| |
Efficiency |
0.85 |
| Frequency converter |
Code |
Parker Mod. 31V – 4G0060 |
| |
Nominal Electric Power |
30 [kW] |
| |
Nominal Current |
60 [A] |
| |
Maximum Current |
66 [A] |
| |
Efficiency |
0.98 |
| Pump |
Code |
Parker Mod. Mod. T7B E15 |
| |
Type |
Fixed Displacement Vane Pump for variable speed drives |
| |
Max Displacement |
50 [ml/min] |
| |
Speed Range |
300 - 2700 [RPM] |
| |
Nominal pressure |
240 [bar] |
| Directional Valve |
Code |
Parker Mod. D41FEZ32FC1NB70 |
| |
Type |
Pilot operated Proportional DCV with Regeneration - A Hybrid |
| |
Nominal flow rate |
200 [l/min] |
| |
Nominal pressure drop |
5 [bar] |
| Pressure Relief Valve |
Code |
Parker Mod. R4V03535P0PM10VA1 |
| |
Type |
Pilot operated proportional pressure relief valve |
| |
Nominal flow rate |
250 [l/min] |
| |
Maximum Pressure |
350 [bar] |
Table 11.
Active and reactive power absorbed in the cycle phases.
Table 11.
Active and reactive power absorbed in the cycle phases.
| Configuration |
Cycle phase |
Active Power [kW] |
Reactive Power [VAr] |
Mean Active Power [kW] |
Mean Reactive Power [VAr] |
| Standard |
QD |
24.32 |
21.92 |
40.48 |
29.06 |
| |
B |
93.36 |
52.92 |
|
|
| |
E |
32.69 |
23.44 |
|
|
| |
QR |
32.69 |
23.44 |
|
|
| |
TR |
12.33 |
20.63 |
|
|
| Regenerative |
QD |
12.4 |
12.44 |
20.05 |
15.60 |
| |
B |
48.39 |
26.14 |
|
|
| |
E |
16.59 |
13.07 |
|
|
| |
QR |
16.59 |
13.07 |
|
|
| |
TR |
3.07 |
11.97 |
|
|
| High-Low |
QD |
12.37 |
9.81 |
15.77 |
11.72 |
| |
B |
27.82 |
16.97 |
|
|
| |
E |
16.99 |
11.23 |
|
|
| |
QR |
16.99 |
11.23 |
|
|
| |
TR |
2.99 |
8.52 |
|
|
| VDP |
QD |
14.85 |
10.5 |
16.67 |
12.71 |
| |
B |
33.56 |
21.87 |
|
|
| |
E |
11.53 |
9.62 |
|
|
| |
QR |
19.04 |
12.03 |
|
|
| |
TR |
3.35 |
8.55 |
|
|
| DCP Static |
QD |
12.86 |
24.54 |
14.43 |
16.49 |
| |
B |
29.18 |
22.29 |
|
|
| |
E |
9.83 |
9.29 |
|
|
| |
QR |
16.91 |
28.05 |
|
|
| |
TR |
0.44 |
1.27 |
|
|
| DCP Dynamic |
QD Acc1 |
2.34 |
1.6 |
16.06 |
21.26 |
| |
QD Acc2 |
35.25 |
48.47 |
|
|
| |
QD Unif |
12.9 |
20.63 |
|
|
| |
QD Dec1 |
-25 |
41.62 |
|
|
| |
QD Dec2 |
11.44 |
11.58 |
|
|
| |
QD Acc2 |
35.25 |
48.47 |
|
|
| |
B |
37.58 |
46.75 |
|
|
| |
E |
12.41 |
11.74 |
|
|
| |
QR Acc1 |
21.66 |
16.89 |
|
|
| |
QR Acc2 |
29.9 |
44.49 |
|
|
| |
QR Unif |
16.91 |
22.76 |
|
|
| |
QR Dec1 |
-24.22 |
34.42 |
|
|
| |
QR Dec2 |
-3.19 |
2.15 |
|
|
| |
TR |
0.44 |
1.05 |
|
|
Table 12.
Comparison in percentage terms of active power absorbed with the different configurations.
Table 12.
Comparison in percentage terms of active power absorbed with the different configurations.
| |
Standard |
Regenerative |
High-Low |
VDP |
DCP-static |
| Regenerative |
-50.5% |
|
|
|
|
| High - Low |
-61.1% |
-21.3% |
|
|
|
| VDP |
-58.8% |
-16.8% |
+5.7% |
|
|
| DCP-static |
-64.3% |
-28.1% |
-8.4% |
-13.4% |
|
| DCP-dynamic |
-60.3% |
-19.9% |
+1.8% |
-3.6% |
+11.2% |
Table 13.
Comparison in percentage terms of reactive power absorbed with the different configurations.
Table 13.
Comparison in percentage terms of reactive power absorbed with the different configurations.
| |
Standard |
Regenerative |
High-Low |
VDP |
DCP-static |
| Regenerative |
-46.3% |
|
|
|
|
| High - Low |
-59.7% |
-24.8% |
|
|
|
| VDP |
-56.3% |
-18.5% |
+8.4% |
|
|
| DCP-static |
-43.2% |
+5.7% |
+40.6% |
+29.6% |
|
| DCP-dynamic |
-26.8% |
+36.2% |
+81.3% |
+67.1% |
+28.9% |
Table 14.
Comparison in percentage terms of the hourly cost of absorbing electricity from the power supply grid between the different configurations (based on Italian energy market rules).
Table 14.
Comparison in percentage terms of the hourly cost of absorbing electricity from the power supply grid between the different configurations (based on Italian energy market rules).
| |
Standard |
Regenerative |
High-Low |
VDP |
DCP-static |
| Regenerative |
-47.1% |
|
|
|
|
| High - Low |
-60.8% |
-26.1% |
|
|
|
| VDP |
-56.2% |
-17.3% |
+11.9% |
|
|
| DCP-static |
-70.1% |
-43.7% |
-23.8% |
-31.9% |
|
| DCP-dynamic |
-66.7% |
-37.1% |
-15.1% |
-24% |
+11.5% |
