Preprint
Article

Mapping Quantitative Trait Locus (QTLs) for Hundred Pod and Seed Weight under Seven Environments in a RIL Cultivated Peanut (Arachis hypogaea L.) Population

Altmetrics

Downloads

115

Views

50

Comments

0

A peer-reviewed article of this preprint also exists.

Submitted:

18 August 2023

Posted:

18 August 2023

You are already at the latest version

Alerts
Abstract
Cultivated Peanut (Arachis hypogaea L.) is an important oil and cash crop in worldwide. Hundred pod and seed weight are important components for peanut yield. In order to dissect the genetic control of hundred pod weight (HPW) and hundred seed weight (HSW), a RIL population containing 188 individuals was developed from a cross between Jihua 5 (JH5, large pod and seed size) and M130 (small pod and seed size). An integrated genetic linkage map was constructed by using SSR, AhTE, SRAP, TRAP and SNP markers. The map contained 3,130 genetic markers which were assigned to 20 chromosomes and covered 1,998.95 cM with an average distance 0.64 cM. Based on the genetic map, a total of 31 QTLs for HPW and HSW were identified on 7 chromosomes, explaining 3.7-10.8% of the phenotypic variation by each QTL. Among these, seven QTLs were detected under more than two environments, two major QTLs were found on B04 and B08, respectively. A QTL hotspot containing seven QTLs was detected on chromosome A08 spanning a 2.74 cM genetic interval with 0.36 Mb physical map which included 18 candidate genes. Among these, Arahy.D52S1Z, Arahy.IBM9RL, Arahy.W18Y25, Arahy.CPLC2W and Arahy.14EF4H may be involved in regulating peanut pod and seed weight. These results may help further analysis of genetic mechanisms for pod and seed size in cultivated peanut.
Keywords: 
Subject: Biology and Life Sciences  -   Plant Sciences

1. Introduction

Cultivated peanut (Arachis hypogaea L.), an allotetraploid (2n=4x=40) crop is the most important oil crop in worldwide and provides high-quality edible oil and protein for humans [1]. Global annual peanut production is on a rapid upward trend from 2015 (45 million tons) to 2021 (53.9 million tons) (https://www.fao.org/faostat/en/#data/QCL/visualize, 2021), but still cannot satisfy demand of the growing global population. Increasing peanut yield per unit area remains a tremendous challenge for peanut breeders. Peanut yield is influenced by various agronomic traits, such as total branch numbers (TBN), lateral branch angle (LBA), and the pod and seed size [2,3,4]. Among them, HPW and HSW, which are mainly determined by pod and seed weight and size, are important components of peanut yield and typical quantitative traits, but the underlying genetic mechanism has not been well studied [5]. By constructor high-density genetic map (HDGM) and mapping quantitative trait loci (QTL) for HPW and HSW, and mining molecular markers closely associated with yield traits, it would lay a theoretical foundation for further revealing the genetic mechanism of yield traits and improving peanut production.
Up to date, various molecular markers have been developed to construct genetic linkage maps in peanut, such as random amplified polymorphic DNA (RAPD) [7], restriction fragment length polymorphisms (RFLP) [8,9]and SSR [10,11,12,13,14,15]. Since peanut is an interspecific hybrid, the narrow genetic diversity has led to a relatively low density of genetic maps from previous studies [16]. With the completion of sequencing of the peanut genome and the advent of next-generation sequencing (NGS), thousands of single nucleotide polymorphisms (SNPs) were successfully discovered constitutionality to enable genetic mapping with sufficient density [17,18,19,20,21,22]. In recent years, some high-density genetic maps have been developed using SNP marker in diploid and allotetraploid peanut genome [5,23,24]. Li et al. constructed a SNP-base HDGM including 2,808 SNPs covering 1,308.2 cM [25]; The other HDGMs were constructed, which including 2,334 markers with 68 SSRs and 2,266 SNPs [26]. and 2,996 SNPs and 330 SSRs [27]. HDGM provides important information for accurately mining quantitative trait loci associated with traits [14,28].
Quantitative trait loci for yield-related traits were identified using bi-parental mapping populations in peanut, such as height of main stem (HMS), length of the lateral branch (LLB), total number of branches (TNB), pod weight (PW), seed weight (SW), pod length (PL), pod width (PW), seed length (SL), seed width (SW), hundred pod weight (HPW), hundred seed weight (HSW) and other traits [24,29,30,31,32]. Nevertheless, as two key investigation traits of pod and seed weight and size, the majority QTLs for two traits were small effect with a phenotypic variation explained (PVE) of less than 10%. Up to now, Luo et al. [33] identified 16 QTLs for HPW on chromosomes A05, A06, A09, B04, B05 and B10, which employed a RIL population from a cross between Yuanza 9102 and Xuzhou 68-4 in four environments. Nevertheless, the main effect QTLs only accounted for 18.75% (3/16). Wang et al. [23] constructed a RIL from a bi-parental of ZH16 and sd-H1, which detected two QTLs for HPW and six QTLs for HSW in three environments, and explaining 5.86-14.46 and 5.17-17.95 phenotypic variation. Mondal et al. [34]used a RIL from a cross between VG 9514 and TAG 24, which detected nine QTLs for HSW in six environments, and explaining 6.71-23.88% phenotypic variation. Kunta et al. [24] cross bi-parental of Hanoch and Harariused develop a RIL and a total of 30 QTLs were detected in two years, identifying eight QTLs for 50 pod weight and 50 seed weight, Only three main effect QTLs among the eight QTLs, the range of explaining phenotypic variation from 6.2 to 13.9%. Gangurde et al. [35] using the bi-parental (Chico×ICGV 02251) develop a RIL and seven QTLs of HSW were detected in three seasons with PVE from 6.69 to 21.29. Guo et al. [36] used Zhonghua 5 and ICGV 86699, which differed significantly in seed weight and size, as parents and detected 15 QTLs related to HSW in six environments, explaining 4.08-17.89 of the phenotypic variation. Among these, only three main effect QTLs were found. Nevertheless, most QTLs cannot be detected repeatedly in multiple environments and the number of QTLs showing stable expression is still relatively rare. Stable QTLs are those that have been consistently detected across multiple years in multiple environments. Obviously, there were still lack of main-effect QTLs for stable expression in multiple environments.
Stable expression of QTLs in multiple environments is important for revealing the genetic mechanisms of crop growth and development. In the present study, to further elucidate the genomic regions of peanut pod and seed weight and size, a RIL population with 188 lines was constructed from a cross between two cultivated peanut species, “JH5” and “M130”. The male parent, “M130” is a small-seed variety with prostrate plant type. The female parent, “JH5” is a large-seed variety with erect plant type. HPW and HSW were significant difference between two parents, and presented plentiful variations in RIL generation, suitable for QTL localization. Here, we collected genotype data of SSR, AhTE, SRAP, TRAP and SNP markers to construct a novel HDGM. To test the practicability of the map, QTLs for the HPW and HSW were mapped across seven environments of four years. Finally, a QTL hotspot on chromosome A08 were found, which may contribute to the breeding of peanut pod and seed traits.

2. Materials and Methods

2.1. Plant Materials and Multiple Environment Trials

A recombination inbred line (RIL) population in F8:11 generation was developed from a cross between “JH5” and “M130” using single seed decent (SSD) method to construct a high-density genetic linkage map and conducting QTLs analysis for HPW and HSW. The female parent, JH5, was a cultivar with large pods and seeds. M130 as a male parent, was a peanut germplasm with small pods and seeds. The 188 RILs and its parents were planted under seven environments of four years, including Qingyuan experimental field (QY, N38º40ʹ and E115º30ʹ) in years 2017, 2018 and 2020, Daming (DM, N35º57ʹand E115º09ʹ) in years 2017 and 2018, Qian’an (QA, N39º99ʹ and E118º70ʹ) in 2018, and Xinle (XL, N38º15ʹ and E114º30ʹ) in 2019, which were referred to as 17QY, 17DM, 18QY, 18DM, 18QA, 19XL and 20QY, respectively. In each environment, the two parents and 188 RILs were plant. The 188 lines were arranged in a randomized block design with two replications, and crop field management followed local requirements. Each plot with 10 plants was grown in one row, with a row length of 1.8 m, a row spacing of 0.5 m, and a plant spacing of 0.2 m. The parental lines were planted after every 20 rows as controls. The seeds were planted in May and harvested in September of each experiment.

2.2. Traits Measurement and Statistical Analysis
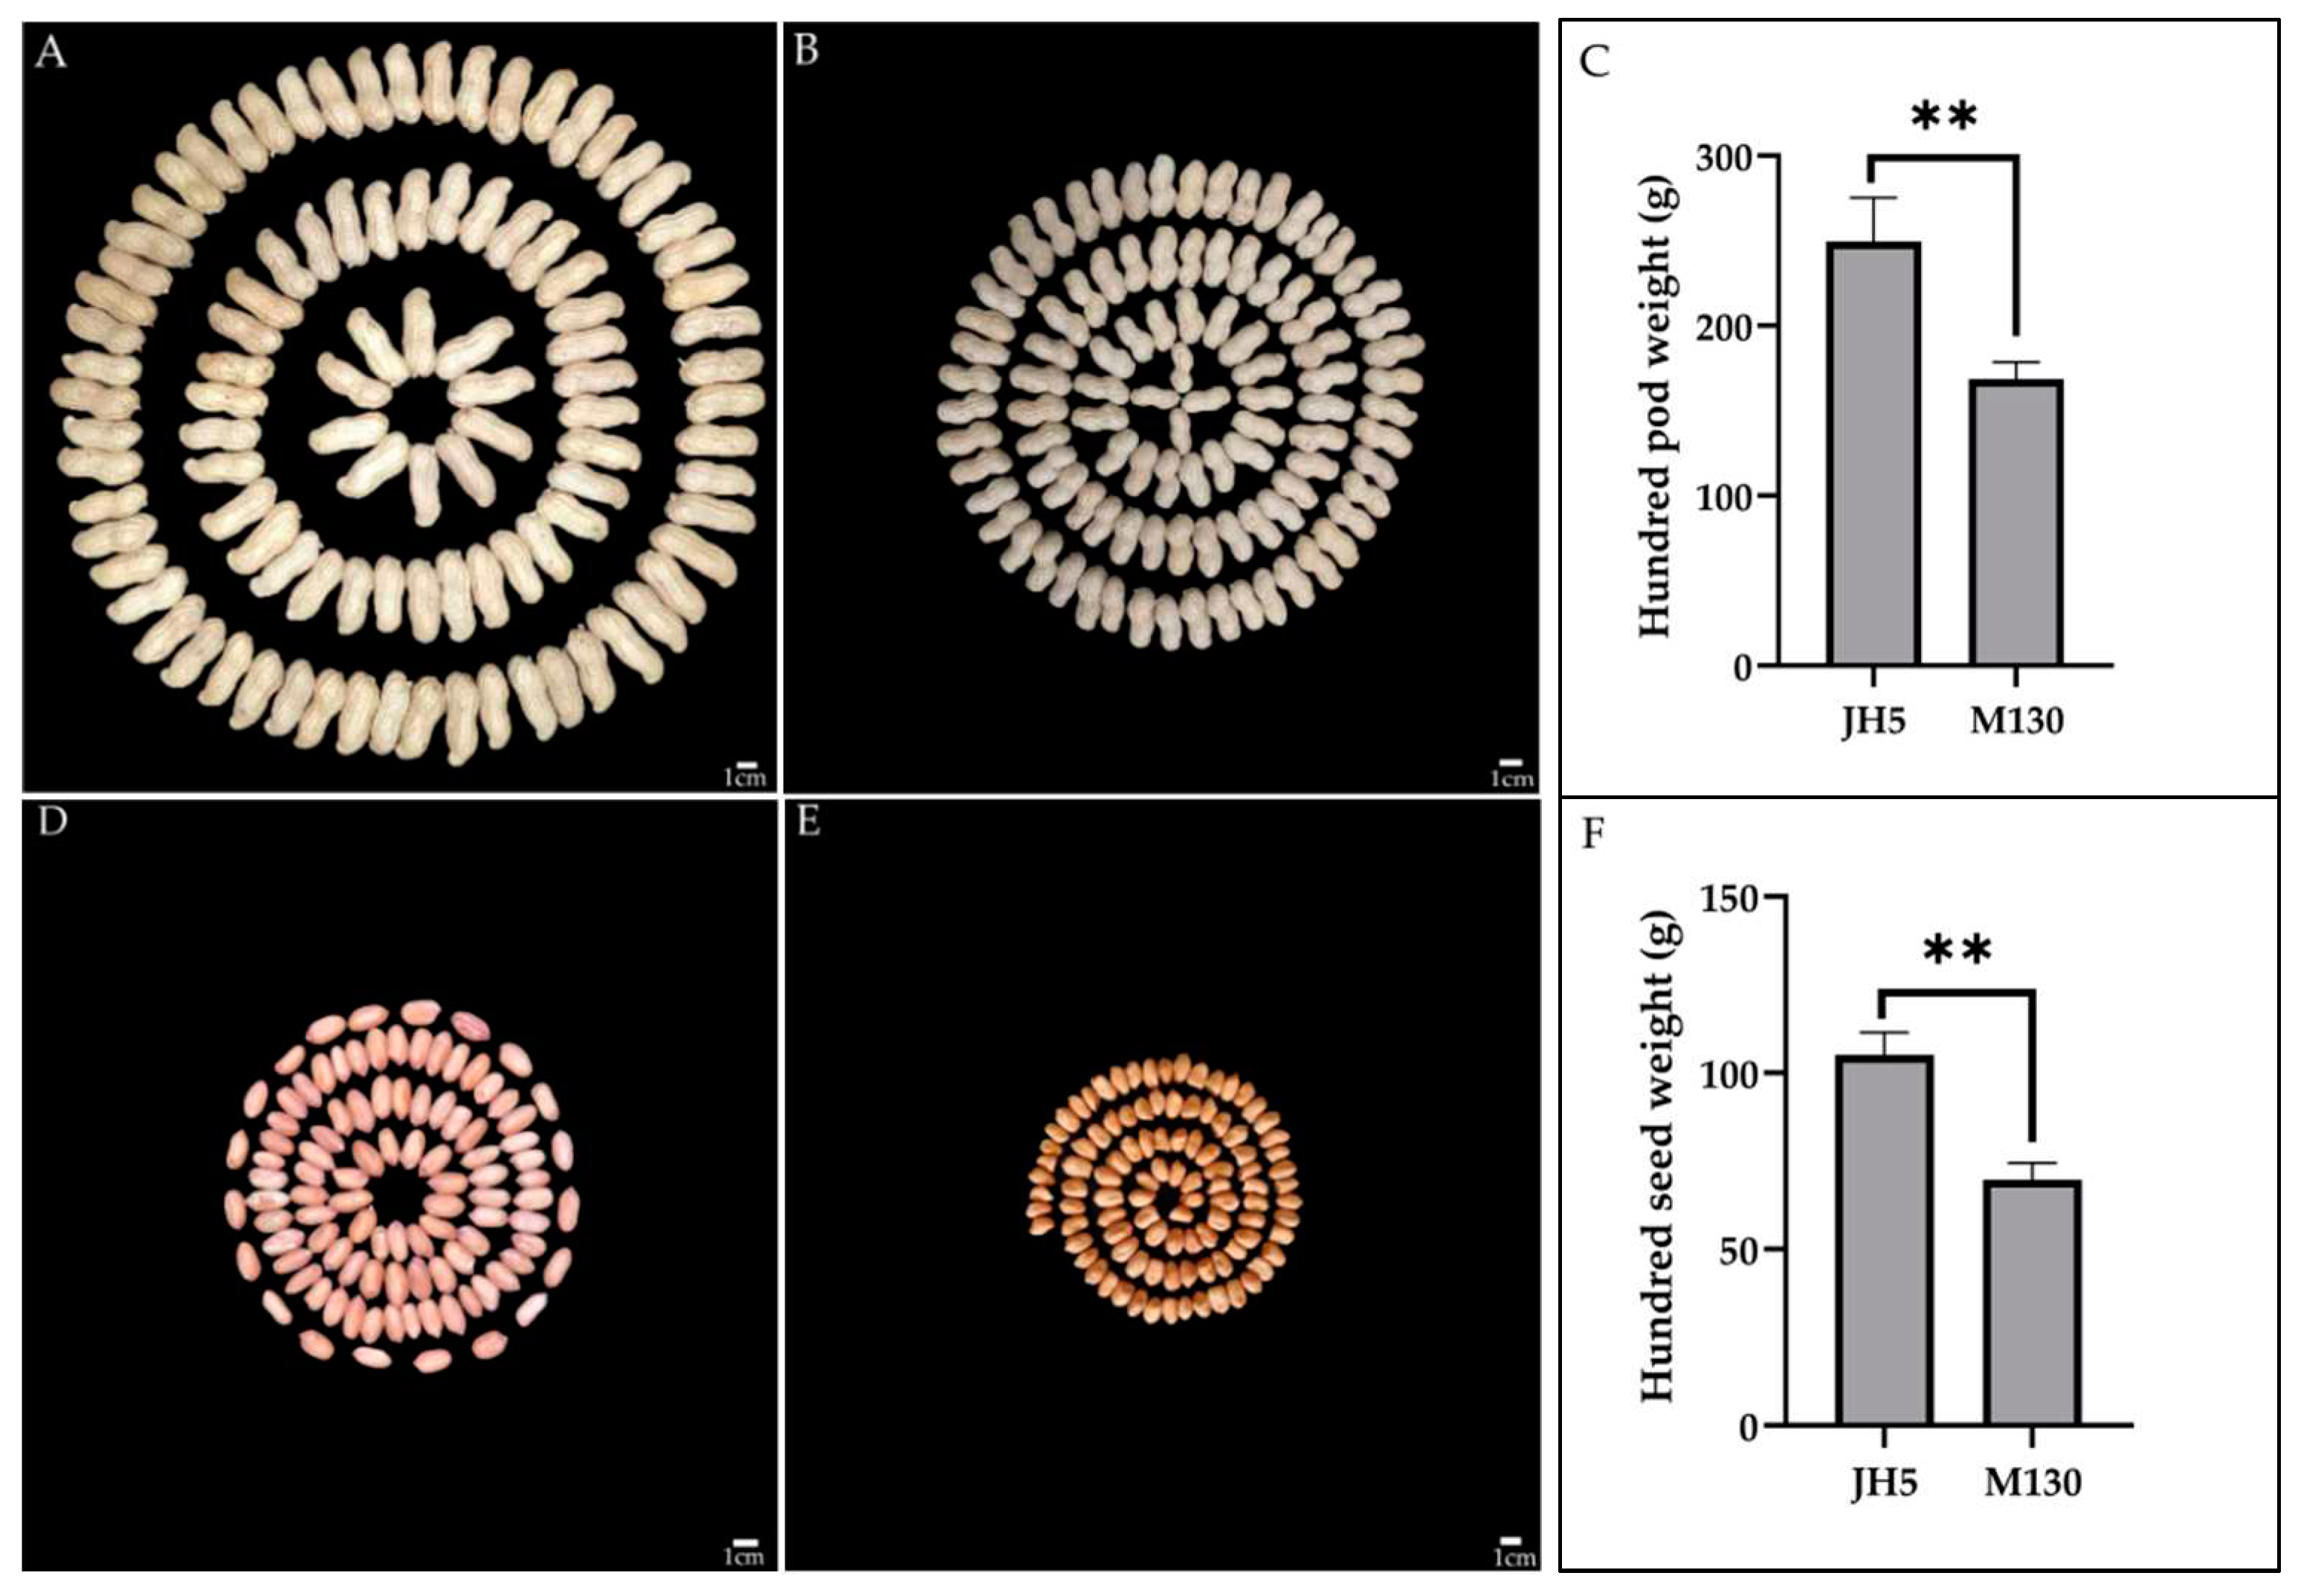
Eight typical plants from each plot were harvested and picked ripe and plum pod at the mature stage. HPW and HSW were measured using an electronic balance with three replicates. GraphPad prism 8.0 (https://www.graphpad-prism.cn) software was used for the analysis of descriptive statistics, variance components. Similarly, the Pearson’s correlation coefficient between HPW and HSW was obtained utilizing the GraphPad prism 8.0. To determine whether our data for two traits were normally distributed, we applied Shapiro–Wilk test (w-test) to estimate normality of the phenotypic data. The broad-sense heritability (hB2) for HPW and HSW in seven environments was calculated by the following formula: hB2 = σg2 /(σg2 +σge2/n+ σe2/ nr), where σg2, σge2 and σe2 represent the genetic variance component, genotype–environment interaction (G×E) variance component, and the random error variance component, respectively. The “n” was defined as the number of environments and the “r” as the number of replications in each field experiment.
Figure 1. Phenotypic characterization of pods and seeds from Jihua 5 and M130. (A) HPW of Jihua5. (B) HPW of M130. (C) t test for HPW of Jihua5 and M130. (D) HSW of Jihua 5. (E) HSW of M130. (F) t test for HSW of Jihua5 and M130. Scale of A, B, D and E is 1cm.
Preprints 82778 g001

2.3. Marker Polymorphism and Analysis

Genomic DNA was extracted from young leaves of RILs and two parents as described by Wang et al. [23]. A total of 8,091 markers were obtained to screen the polymorphism of two parents. Among these, 2,808 polymorphic SNP markers from our previous research [25], 3,964 pairs of SSR and 926 transposon element markers (AhTE) (https://peanutbase.org/), 238 pairs of SRAP primers [37] and 155 pairs of TRAP primers [38]. Primer pairs were synthesized by Suzhou Genewiz Co., Ltd. (Suzhou, China). Polymerase chain reaction (PCR) amplification of SSR was conducted in a 10 μL mixture, including 5 μL of 2×Es Taq Master Mix (Taizhou, Cwbio Co., Ltd., China), 1 μL of 10 ng peanut DNA, 1 μL of each primer (10 μM μL-1), and 2 μL ddH2O. The PCR amplification procedure was as follows: 95 ℃ for 5 min, then 30 cycles of 94 ℃/40 s, 55 ℃/40 s, and 72 ℃/1 min, followed by 72 ℃ for 10 min and final extension at 4 ℃. In addition, SRAP and TRAP PCR amplification procedure were performed as described in Li and Quiro [37]and Hu and Vick [38]. The PCR products were separated on 10% denaturing polyacrylamide gels. Silver staining was performed as described by Yang et al. [39]. Subsequently, the polymorphic markers were used to screen all the lines of RIL population.

2.4. Construction of Integrated Genetic Linkage Map

Combined SSR, AhTE, SRAP, TRAP in the present study and the previous SNP marker report [25], an integrated genetic linkage map was constructed using JoinMap® 4 [40] with a logarithm of odds (LOD) threshold of 3.0 and a maximal distance of 50 cM. The segregation distort loci were identified using a chi-square (χ2) test for goodness of fit to the expected 1:1 ratio (p<0.01) in the RIL population. Genetic linkage map distances were calculated via Kosambi function [41] which recombination frequency was 0.45. The genetic linkage groups was graphically presented using Mapchart 2.32 [42].

2.5. QTL Identification and Candidate Genes Prediction for QTL Hotspot

QTL IciMapping V4.2 [43] (statistical model: ICIM-ADD) was employed to identify QTLs for HPW and HSW. For each trait, a walk step of 0.5 cM and LOD threshold were estimated by permutation test with 1,000 runs to declare a significant QTL. The QTL nomenclature was adopted according to Tanksley and McCouch (1997) [44], starting with the italic letter “q”, followed by an abbreviation of the trait name, the code number of chromosome, and the serial number. A major QTL has more than 10% phenotypic variation explained (PVE) [34]. QTLs in the same location or overlapping region on the same chromosome are defined as a QTL hotspot. Subsequently, according to the genome sequence of cultivated peanut (https://peanutbase.org/), the candidate genes were identified based on the selection of the QTL confidence interval of markers flanking co-localization in different environments. Then, flanking marker sequences are mapped to the reference genome and physical locations are obtained. Sequences within these regions are then used to investigate candidate genes for QTL hotspots. Candidate genes within the confidence interval were analyzed for GO and KEGG enrichment.

3. Results

3.1. Phenotypic Variation of Parents and RIL Population

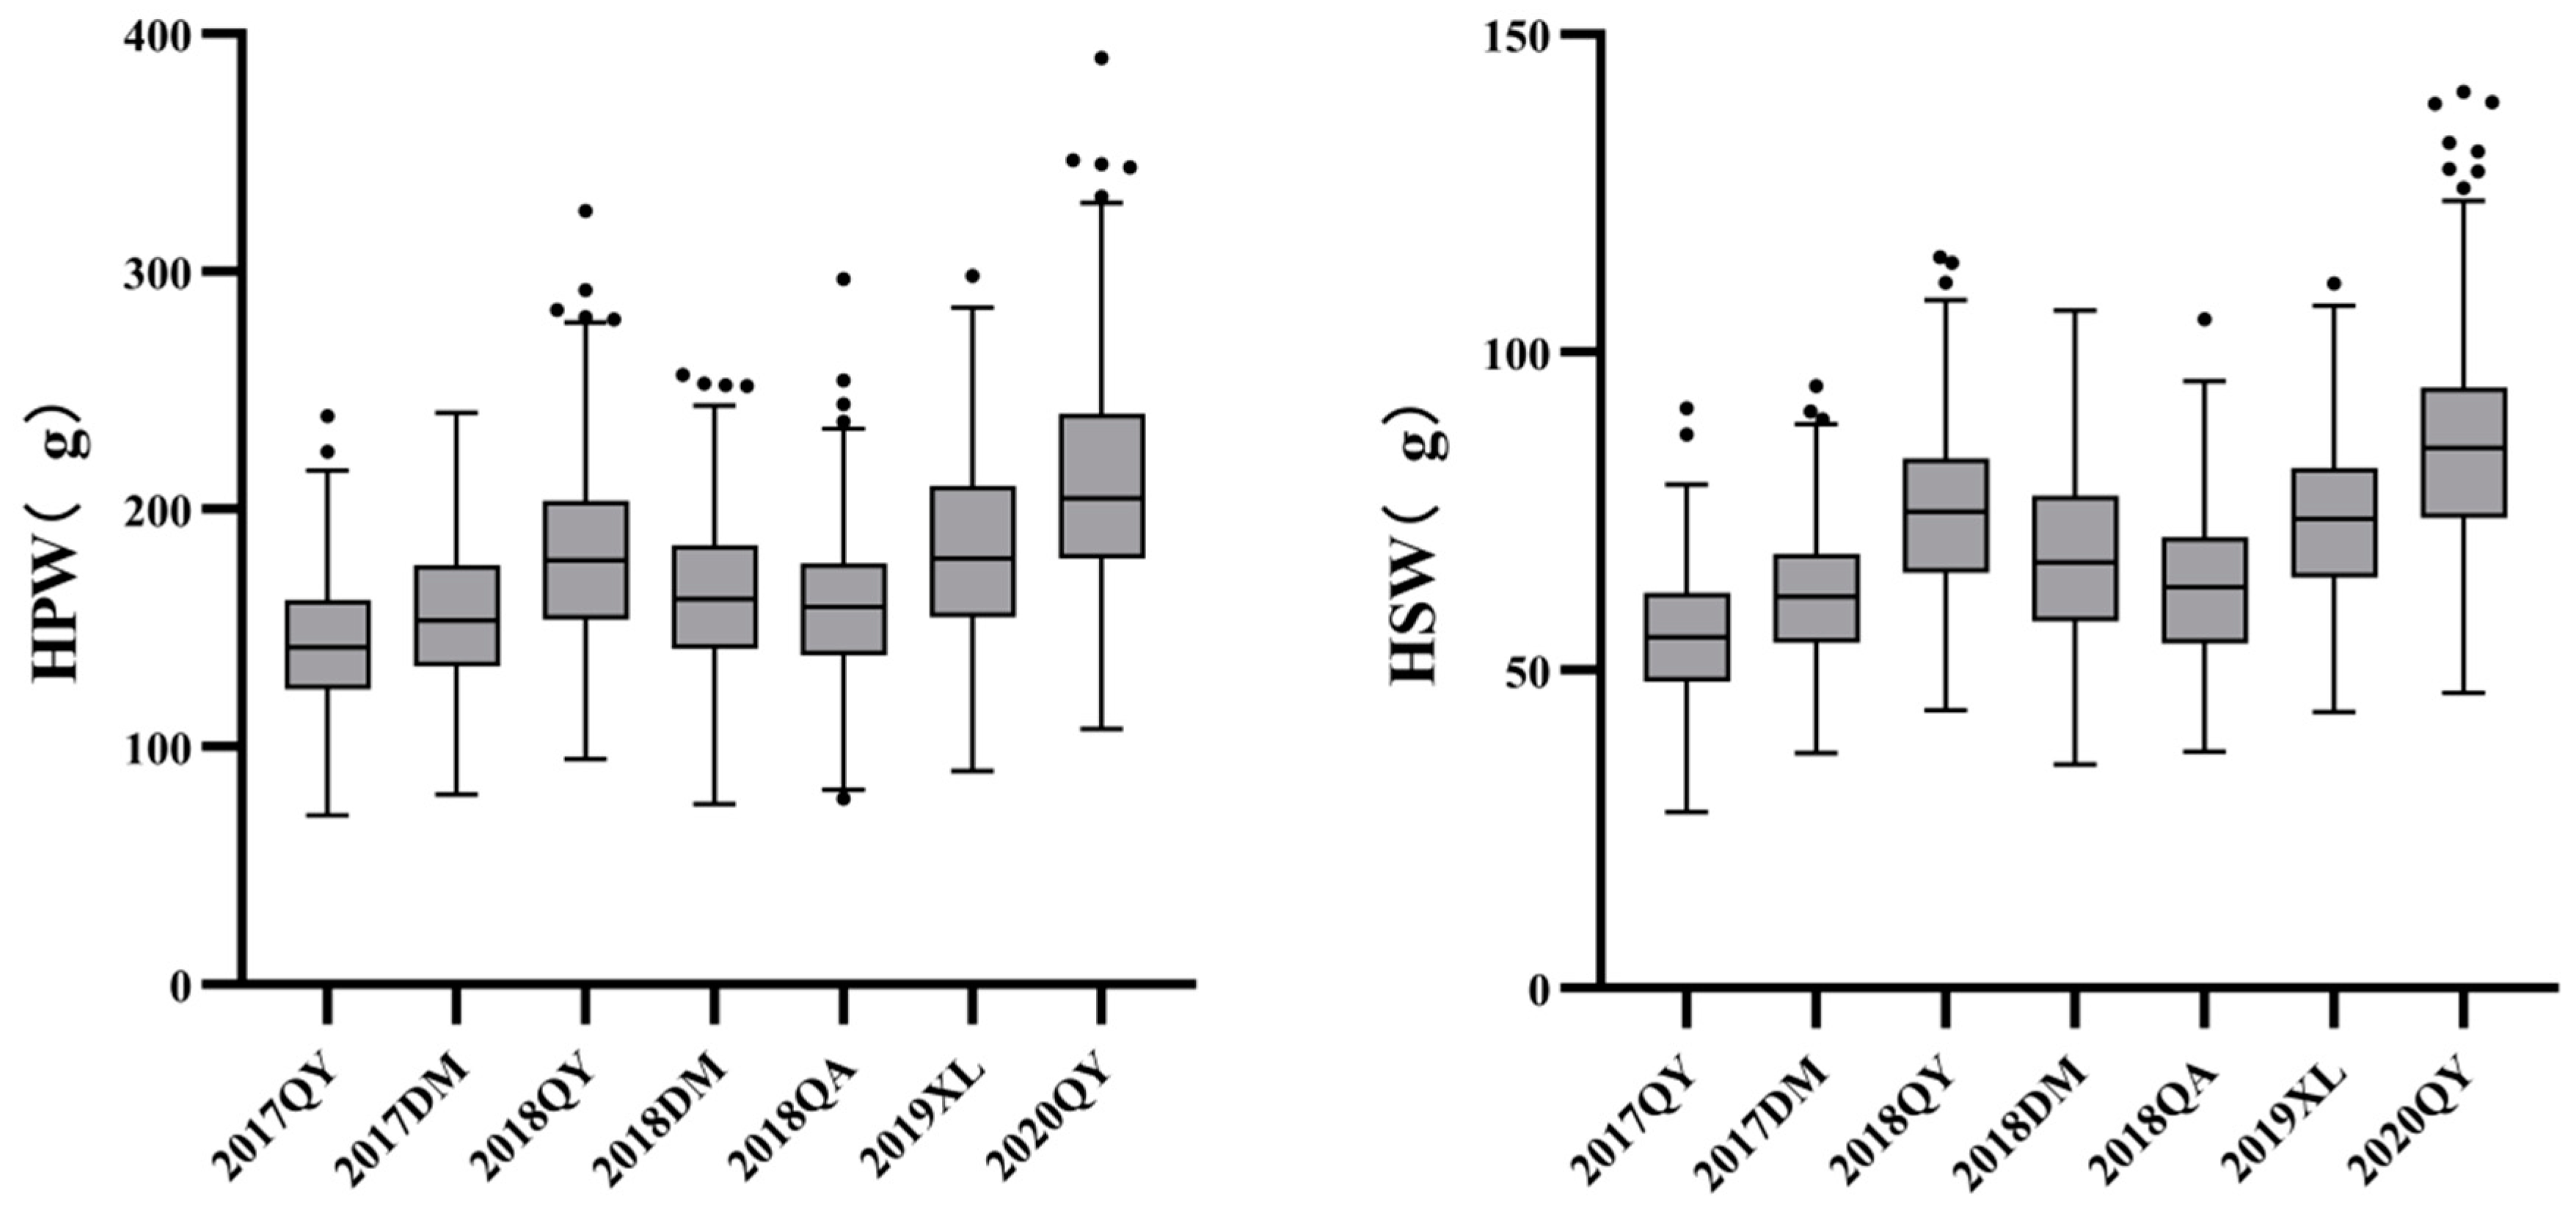
The female parent JH5 exhibited higher HPW, HSW and larger pod and seed size than that of the male parent M130 under all seven environments (Table 1). Large phenotypic variation of HPW and HSW was observed between the parents as well as in RIL population. The median and dispersion of HPW and HSW vary slightly for each environment, with a right skewed distribution (Figure 2 and Figure 3). Continuous distributions were observed and the Shapiro-Wilk (w) test indicated that the phenotypic data of HPW and HSW for RIL were normally distributed (Figure 3). The HPW and HSW of female parent JH5 varied from 213.2 to 291.31 g and from 96.12 to 114.32 g while the HPW and HSW of male parent M130 varied from 155.79 to 177.85 g and from 63.88 to 76.2 g in the seven environments, respectively (Table 1). The traits for HPW and HSW were significant positive correlated in all seven environments with correlation coefficient from 0.844 to 0.962 (Table 2). There were high phenotypic variations of HPW and HSW with ranges of 71.04-239.22 g, 79.86-240.61 g, 94.85-325.53 g, 75.99-256.43 g, 78.28-296.87 g, 89.71-298.00 g and 107.61-389.97 g and 27.73-91.24 g, 36.93-94.67 g, 43.73-114.88 g, 35.13-106.51 g, 37.21-105.51 g, 43.44-110.75 g and 46.39-140.89 g during 17QY, 17DM, 18QY, 18DM, 18QA, 19XL and 20QY, respectively. The broad-sense heritability of HPW and HSW were estimated to be 0.64 and 0.52. Analysis of variance (ANOVA) revealed that genetic, environmental effects and genotype by environment interaction significantly influenced HPW and HSW (Table 3).

3.2. Integrated Genetic Map Construction and Marker Distribution

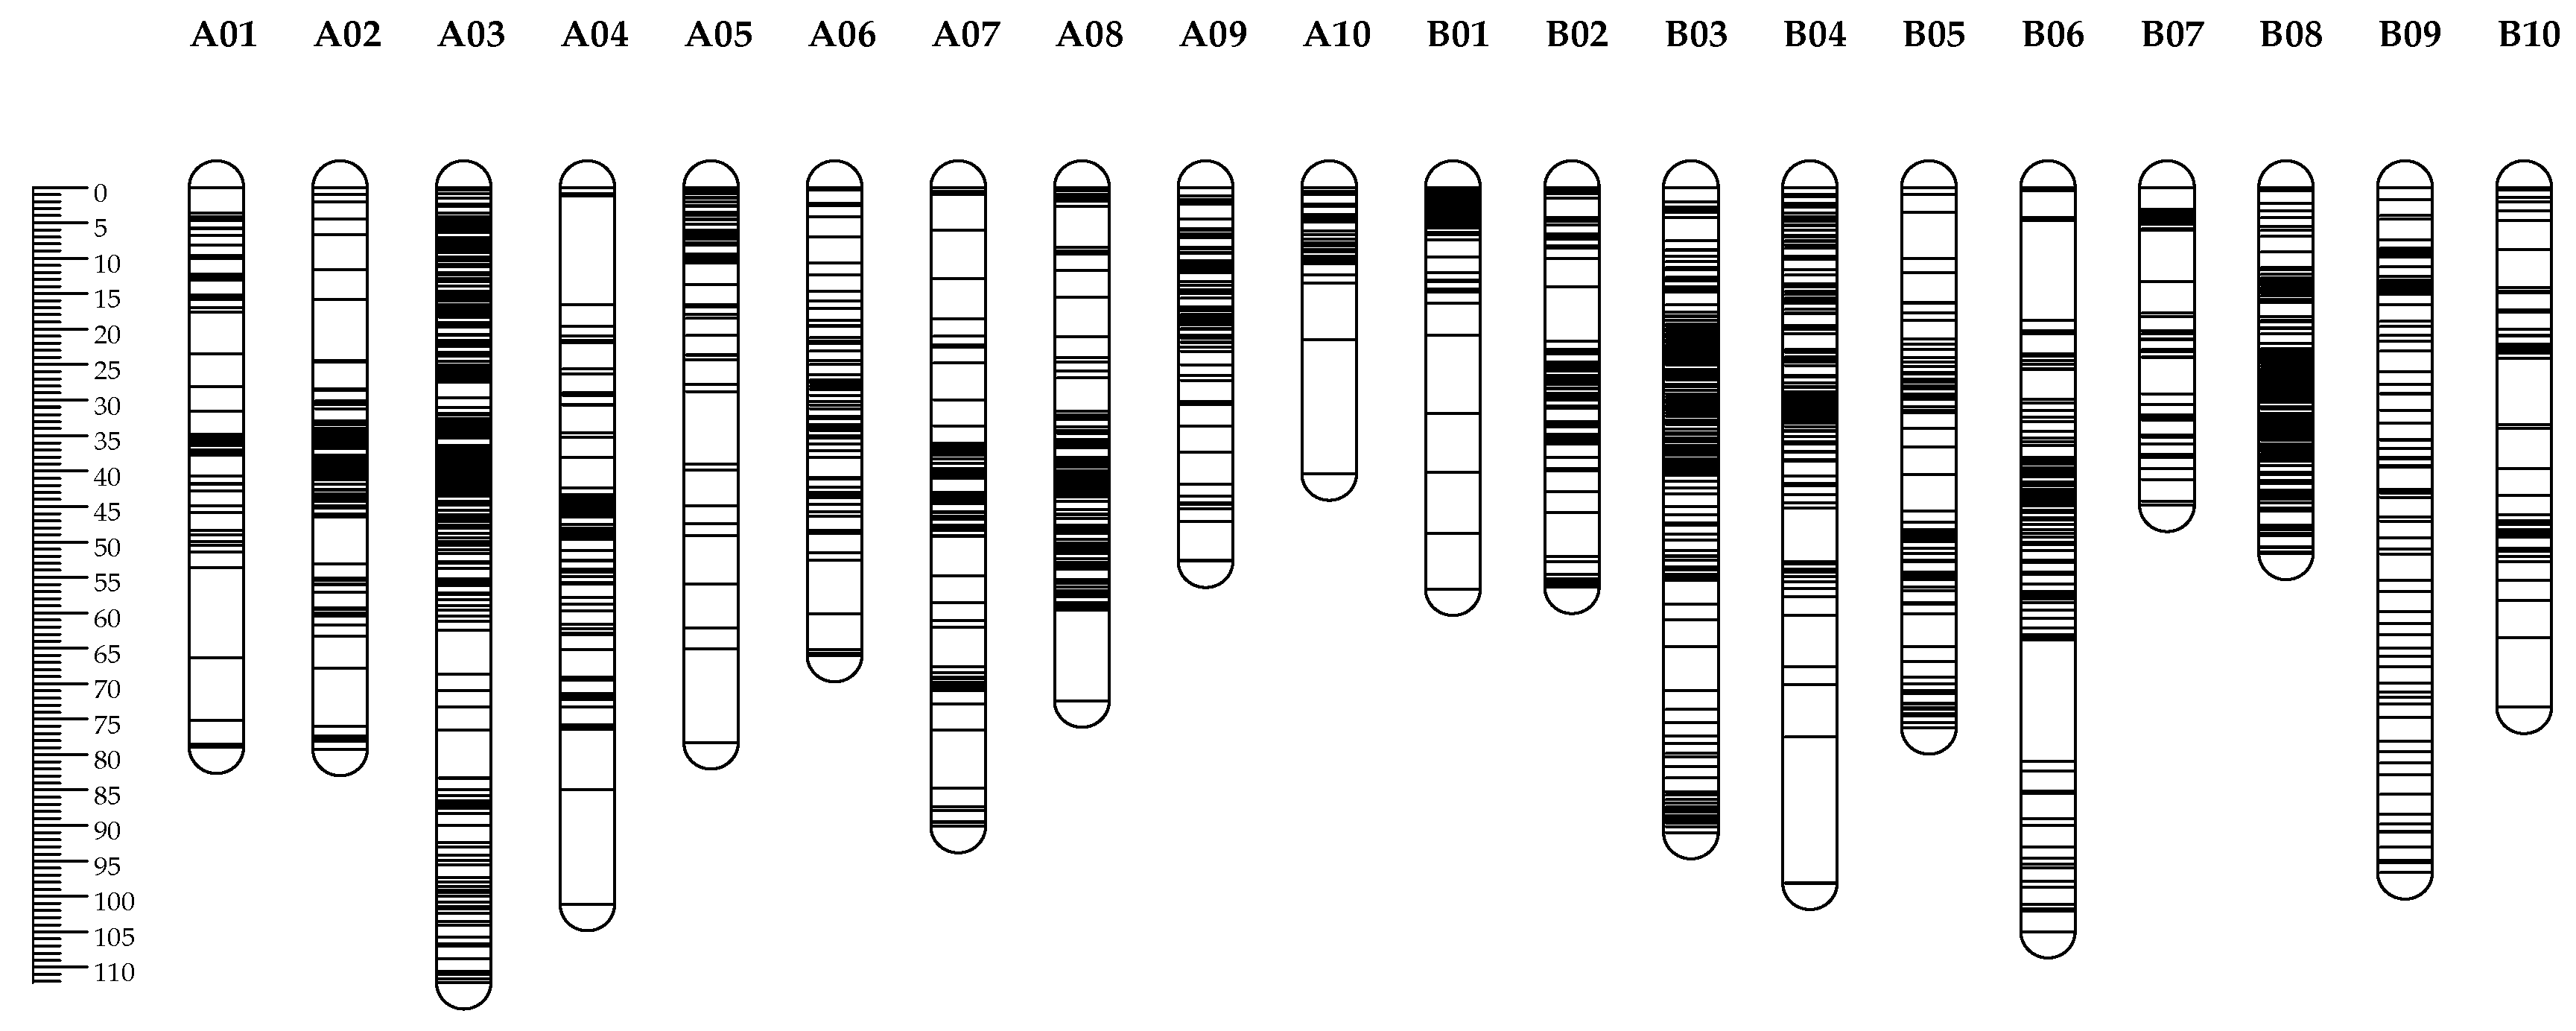
A total of 377 SSRs (9.51%), 131 AhTEs (14.15%), 90 SRAP primer pairs (37.81%) and 42 TRAP primer pairs (27.09%) had clear bands and good polymorphism between JH5 and M130. These polymorphism primers were used to obtain genotype data in RIL population. In addition, 2,808 SNP genotype data of the same population were also employed to construct a linkage map. Finally, an integrated genetic linkage map was constructed using 2,796 SNPs, 229 SSRs, 30 AhTEs, 56 SRAPs and 19 TRAPs. The map contained 3,130 marker loci, and the length of a single linkage group is 50.2-192 cM. The average distance between markers is 0.64 cM, and the maximum interval between markers is 20.58 cM (Table 4, Figure 4). The “A” subgenome spanned 1,083.87 cM with 1,536 loci, and the “B” subgenome spanned 960.05 cM with 1,536 loci. The average distance between markers was greater for the A subgenome (0.68 cM) than for the B subgenome (0.63 cM).

3.3. QTL Identification

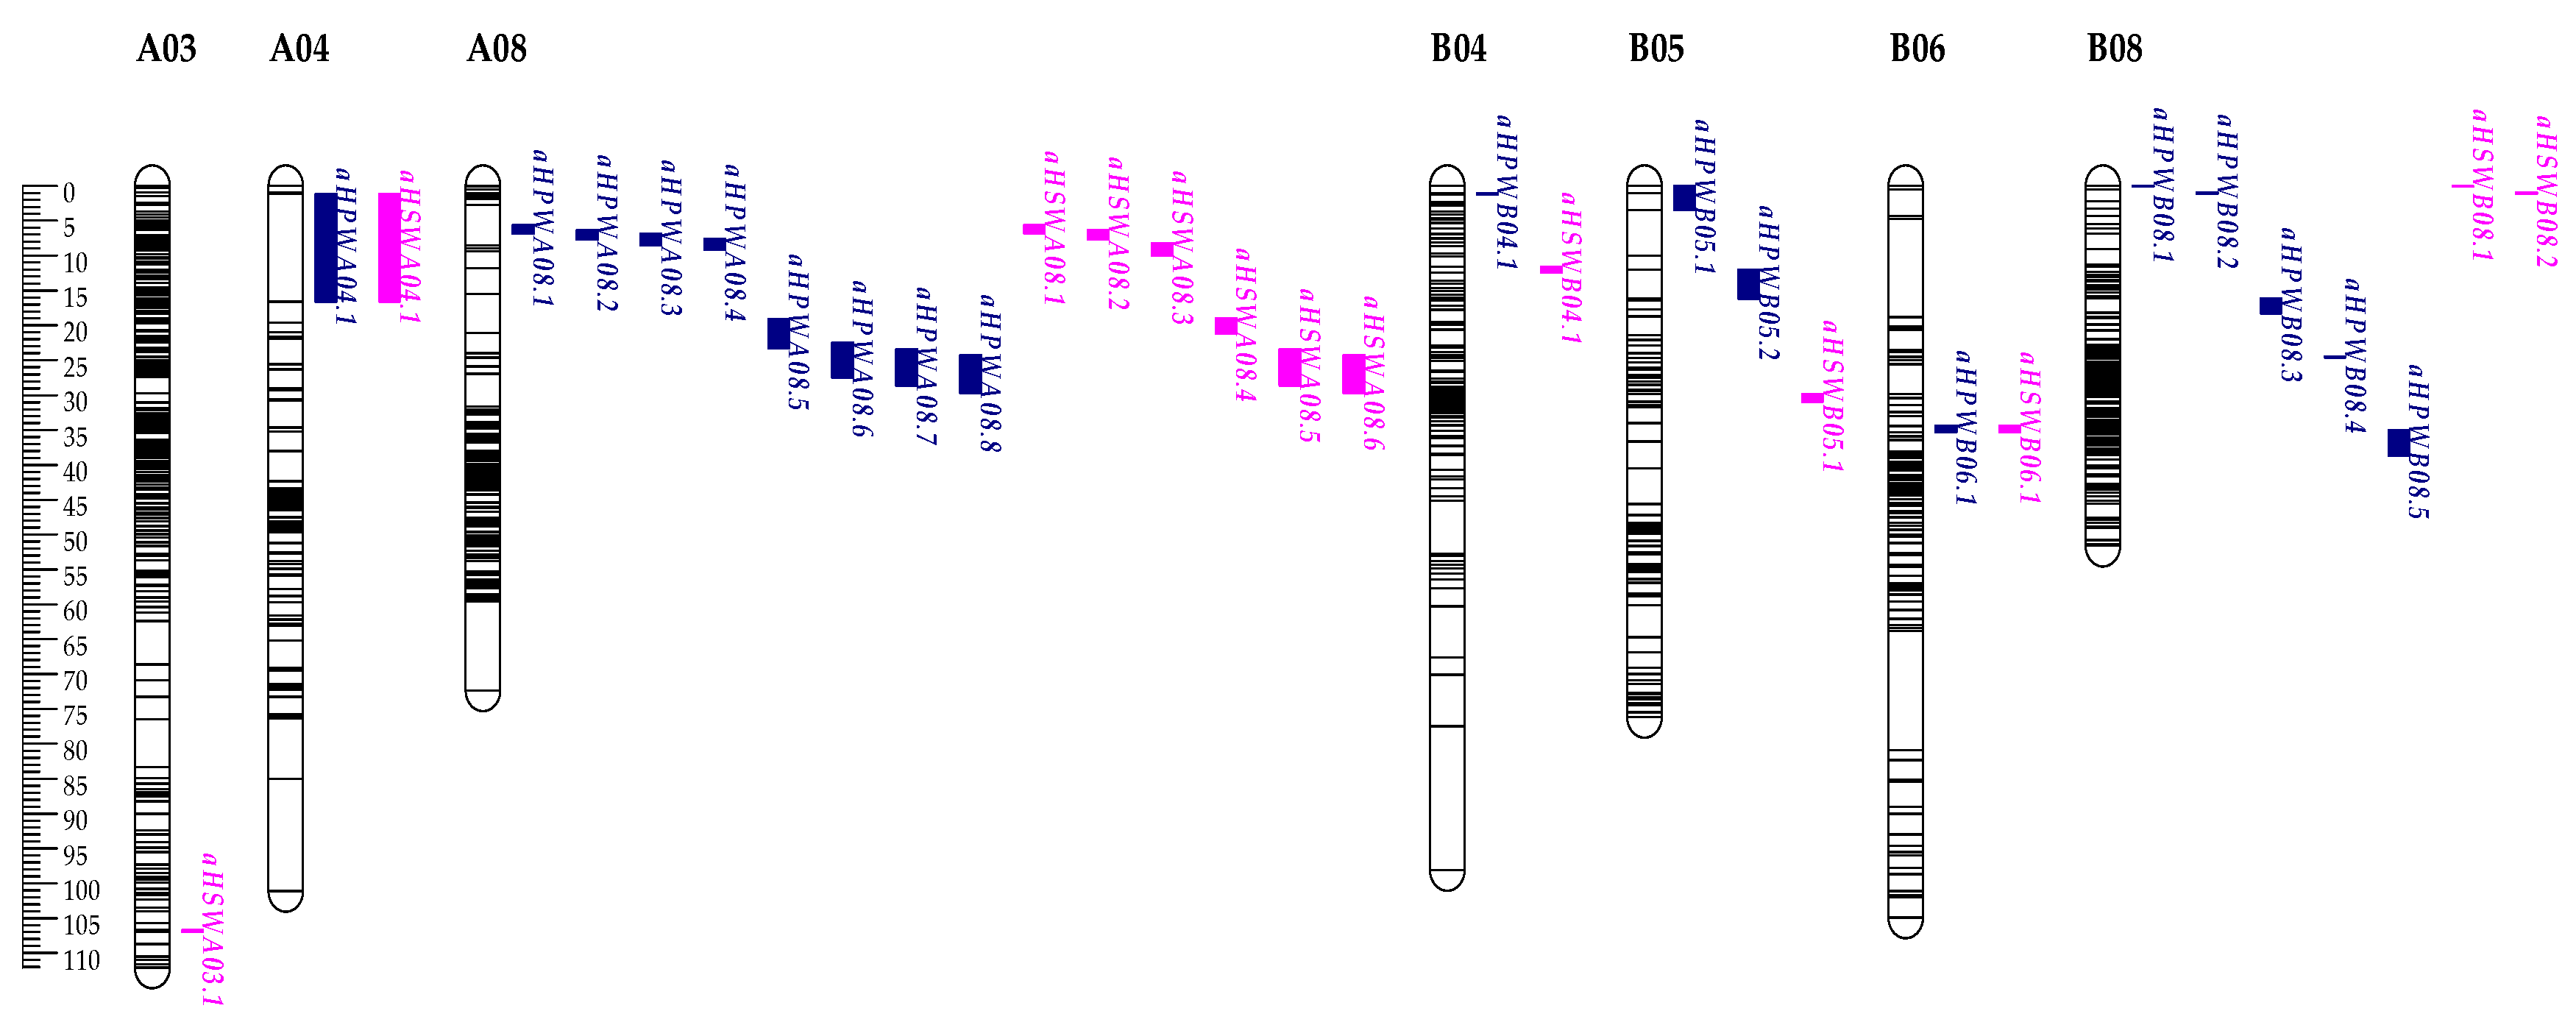
A total of 18 QTLs for HPW were detected in seven environments of four years (Table 5, Figure 5). They are distributed on chromosomes A04, A08, B04, B05, B06 and B08. Of these, nine QTLs are located in the A subgenome and nine QTLs are located in the B subgenome. The phenotypic variation explained ranged from 3.662% to 10.826%, and the LOD value ranged from 2.569 to 7.307. Twelve QTLs showed positive additive effects, and six QTLs showed negative additive effects. Among them, qHPWA08.3 was repeatedly detected in three environments (17QY, 18DM and 19XL), and was located in the AhTE0658-TC22C01 interval of A08 chromosome. The LOD values were 3.600, 7.307 and 5.436, and the PVE values were 4.407%, 8.893% and 6.788%, respectively. The qHPWA08.8 was repeatedly detected in two environments (18DM and 20QY), and was located in the Ah4-4-Ah2TC09B08 interval of A08 chromosome. The LOD values were 4.602 and 3.291, and the PVE values were 3.731% and 5.316%, respectively. The qHPWB06.1 was repeatedly detected in two environments (17QY and 17DM). It was located on the SMK2106-SMK2107 interval of chromosome B06, with LOD values were 2.840 and 4.052, and PVE values of 5.993 and 8.481, respectively. The qHPWB08.1 was repeatedly detected in three environments (17DM, 18QA and 19XL), and was located in the AHGS1286-Ah3TC20B05 interval of B08 chromosome. The LOD values were 5.473, 3.218 and 3.505, and the PVE values were 6.199%, 3.662% and 3.728%, respectively. The qHPWB08.2 was repeatedly detected in three environments (17QY, 18DM and 20QY), AHGS1286-Ah3TC2 on chromosome B08. The LOD values were 3.972, 5.904 and 4.790, and the PVE values were 4.416, 6.574 and 5.108, respectively.
A total of 13 QTLs for HSW were detected in seven environments of four years (Table 5, Figure 5), which were distributed on chromosomes A03, A04, A08, B04, B05, B06 and B08. Among them, eight QTLs were located on the A subgenome, and five QTLs were located on the B subgenome. The phenotypic variation explained ranged from 4.138% to 10.425%, and LOD values ranged from 2.545 to 6.662. Ten QTLs showed positive additive effects, and three QTLs showed negative additive effects. Among them, qHSWA03.1 was repeatedly detected in two environments (17DM and 17QY), located in the SMK539-SMK540 interval of A03 chromosome, with LOD values of 4.039 and 2.671, and PVE values of 8.544 and 5.865, respectively. The qHSWA08.5 was repeatedly detected in two environments (18QY and 19XL), and was located in the Ah4-4-Ah2TC09B08 interval of A08 chromosome. The LOD values were 6.662 and 5.739, and the PVE values were 9.197% and 6.594%, respectively. The qHSWA08.6 was repeatedly detected in three environments (17QY, 18DM and 20QY), and was located in the Ah4-4-Ah2TC09B08 interval of A08 chromosome. The LOD values were 3.494, 3.491 and 3.996, and the PVE values were 4.868%, 4.849% and 4.627%, respectively.

3.4. Co-localized Intervals and Putative Candidate Genes on Chromosomes A08

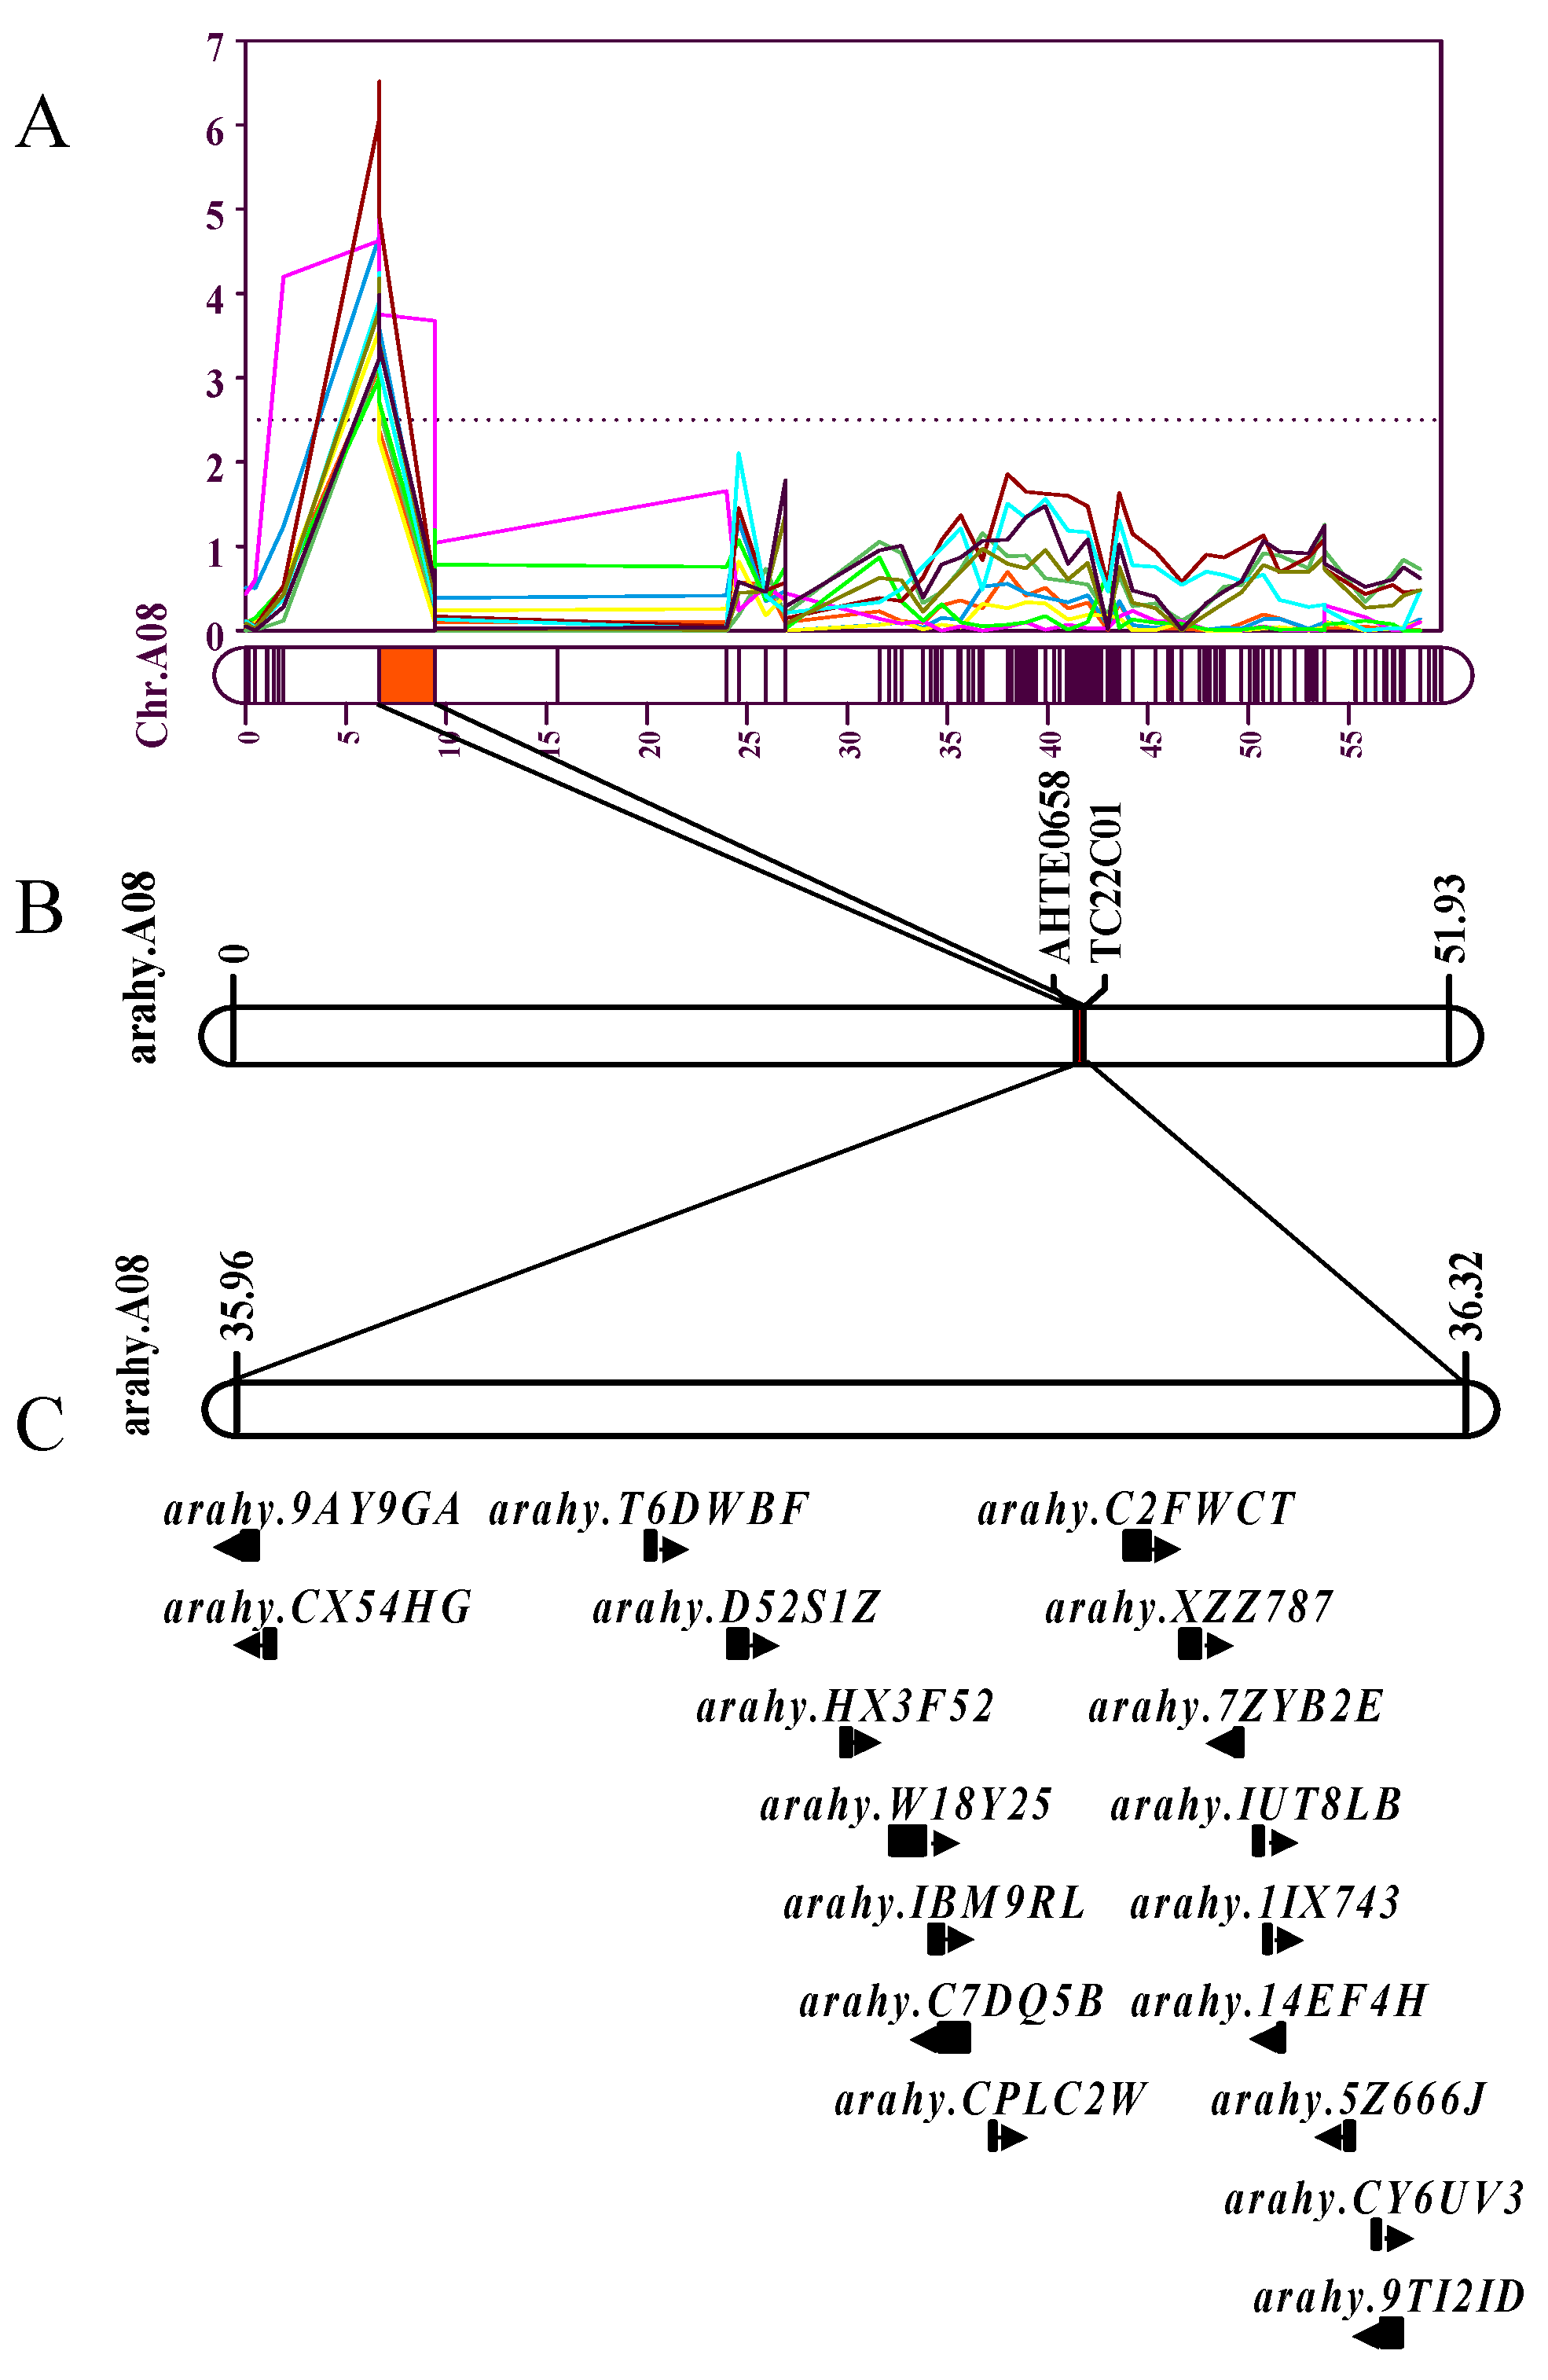
Based on multi-environment QTL co-localization analysis, high LOD intervals for HPW and HSW were detected in multiple environments. A total of 10 QTLs (HPW for 17QY, 17DM, 18DM, 18QA, 19XL and 20QY, HSW for 18DM, 18QA, 19XL and 20QY) associated with peanut traits of HPW and HSW on chromosome A08 were mapped the flanking markers AhTE0658 and TC22C01 (Figure 6), covering genetic distance of 2.75 cM. The physical locations of markers AhTE0658 and TC22C01 are 35,963,966 bp and 36,328,872 bp respectively, spanning a physical interval of 0.36 Mb on chromosome A08.
The co-localized interval on linkage group A08 was located at on 6.67-9.42 cM in the genetic map. This interval was mapping at 35,963,966-36,328,872 bp in the chromosome A08 by the flanking markers AhTE0658 and TC22C01 (Figure 6). The 0.36 Mb interval contained 18 putative genes (https://peanutbase.org/gbrowse_peanut2.0). Two genes were novel and encoded unknown proteins, while homologs were identified for the other 18 genes (Table 6). Among them, the Arahy.W18Y25 and Arahy.CPLC2W encode a PPR superfamily and PPR-like superfamily, respectively. The Arahy.IBM9RL, Arahy.14EF4H and Arahy.D52S1Z encode FERTILIZATION-INDEPENDENT ENDOSPERM-like (FIE), Sugar transporter 11 and 2-oxoglutarate/Fe(II)-dependent dioxygenase-like, respectively. Twelve of eighteen genes were assigned at least one GO term. These 18 genes are divided into three GO categories, cellular components with 3, molecular functions with 11 and biological processes with 9. Enrichment analysis indicated that 4 candidated genes were enriched, including translational initiation, cell redox homeostasis, extrinsic component of membrane, transferase activity and transferring glycosyl groups. Through KEGG enrich analyses, 4 genes of 18 candidated genes were involve Fatty acid elongation, Diterpenoid biosynthesis, Photosynthesis and Fatty acid metabolism biosynthesis.

4. Discussion

Previously, many studies have used different single molecular markers to construct genetic linkage maps to detect QTLs [24,37,45]. Two continuous studies used two and three RIL, respectively, to construct a consensus map for mapping QTL in cultivated peanut [46,47]. In this study, a RIL was constructed using two large divergent parents in pod and seed weight. A high-density genetic map was constructed for fine genetic mapping of HPW and HSW traits. The completion of whole genome sequencing of tetraploid cultivated peanut and whole genome resequencing of multiple cultivated varieties reduced the probability of marker position mismatch and improved the accuracy of QTL/gene mapping [20,48].
Pod and seed weight and size are crucial indicators of crop yield and have been extensively studied in various crops [49,50,51]. However, the genetic mechanism underlying these traits in peanut seeds remains unclear and requires further investigation. Up to date, several quantitative trait loci (QTLs) associated with peanut seed traits have been identified on multiple chromosomes [52,53]. In this study, we detected 31 QTLs for two seed-related traits on chromosomes A03, A04, A08, B04, B05, B06, and B08, explaining phenotypic variation ranging from 3.662% to 10.826%. Notably, qHPWA08.3, qHPWB08.1, qHPWB08.2, and qHSWA08.6 were consistently detected in at least three environments, indicating stable genetic effects across different conditions. Moreover, our findings are highly consistent with those reported by Zhou et al. [54], who identified five stable QTLs for pod weight and size on chromosomes A03, A05, B04, B05, B06, and B08. Luo et al. [55] developed a RIL with 187 lines successfully mapped major and stable QTLs for pod weight and size on chromosomes A05 and A07 in four environments of three years, respectively. These results provide valuable insights into the genetic basis of seed weight and size traits in peanut and enhance our confidence in the accuracy of QTLs identified on other chromosomes.
In recent years, QTLs for seed weight and size identified on chromosomes A05 and B06 have been repeatedly reported [34,56,57]. Similarly, in this study, QTLs for HPW and HSW were identified on chromosome B06 (qHPWB06.1, qHSWB06.1). In addition, two QTL clusters for HPW and HPW were found on chromosome A08. It is worth noting that qHPWA08.1, qHPWA08.2, qHPWA08.3, qHPWA08.4, qHSWA08.1, qHSWA08.2 and qHSWA08.3 are located in the 0.36 Mb interval. In this study, the QTLs detected for HPW and HSW were mainly distributed on chromosomes A08 and B08. Based on the comprehensive analysis of the above QTL mapping results, it was found that the QTLs for seed size and weight were located on chromosome A08 and B08. The genetic location may be different, which may be related to the different materials and environments planted in the institute. In previous studies, there were no reports of seed weight and size on chromosome A08. Therefore, we believe that the QTL mapped in this study is a novel QTL.
In this study, a total of 18 candidate genes were identified on a co-localized genome on chromosome A08, which spanning 0.36 Mb physical intervals. Among them, Arahy.D52S1Z (2-oxoglutarate/Fe(II)-dependent dioxygenase-like) have established roles in DNA repair, epigenetics, post-translational modification, and plant growth regulator activation and catabolism, and it also regulates the production and catabolism of many plant hormones [58], such as gibberellins (GAs), ethylene, auxin (IAA) and salicylic acid (SA). The FIE protein functions as a core structural component of the three putative PRC2 complexes, fertilization independent seed (FIS), embryonic flower (EMF), and vernalization (VRN), which function in seed development, vegetative phase transition and the vernalization response, respectively [59]. The PPR family of proteins is an important family of genes involved in a number of growth and developmental processes in plants. PPR proteins are RNA-binding proteins involved in a variety of post-transcriptional regulatory processes, including intracellular RNA splicing, editing, stabilization and translation, and play important roles in plant leaf development, cytoplasmic male sterility, seed development and response [60]. In this study, genes Arahy.W18Y25 and Arahy.CPLC2W encode PPR superfamily and PPR-like proteins superfamily, respectively. Their combined effects have profound implications for organelle biogenesis and function, as well as for photosynthesis, respiration, plant development and environmental responses [61]. Studies on the direct regulation of peanut pod and seed development by PPR have not been reported and further research is needed on its functional mechanisms. Sugar transporter proteins are essential for cereal development and offer potential avenues for genetic improvement of seed filling and yield in maize and other cereal crops [62]. The sugar transporter protein encoded by Arahy.14EF4H will be a candidate gene for further studies on seed size in peanut. The remaining 12 genes within the genetic region of the co-location interval that regulate seed development have not been reported in the papers, but are involved in multiple pathways and metabolic processes, and these genes may also be involved in regulating pod and seed size and weight.

5. Conclusions

In the present study, a RIL population was constructed using female parent Jihua 5 and male parent M130. A HDGM was constructed including a total of 3,130 marker loci and spanning 1,998.92 cM genetic distance. Totally 31 QTLs for HPW and HSW were identified on chromosomes A03, A04, A08, B04, B05, B06 and B08. A QTL hotspot was identified on chromosome A08, which is across a 0.36 Mb physical interval and includes 18 candidate genes. This research will provide favorable information for researchers to breed high yield cultivars and analysis the genetic mechanisms for pod and seed weight and size in cultivated peanut.

Supplementary files

Table S1 Marker position information of the integrated high-density genetic map. Table S2 GO annotation of candidate regions. Table S3 KEGG annotation of candidate regions.

Author Contributions

XY designed research. XM, PM, ZL and SS performed the HPW and HSW traits measurements of the plant materials. XM and PM constructed the genetic linkage map and performed QTL analysis. PM analyzed the result and wrote the manuscript. XY and CC revised the manuscript. All authors contributed to the manuscript and approved the final version of the manuscript to be published.

Funding

This study was supported by the National Natural Science Foundation of China (31701459); the Support Program for the Top Young Talents of Hebei Province (0602015); the Science and Technology Research Programs of Higher Education of Hebei Province (ZD2022069); the Study was funded by State Key Laboratory of North China for Crop Improvement and Regulation (NCCIR2022zz-6).

Data Availability Statement

The data generated and analyzed in this study are included in the manuscript and supplementary files.
Conflict of interest On behalf of all the authors, the corresponding author states that there is no conflict of interest.
Ethical standards The authors state that all experiments in the study comply with ethical standards.

References

  1. Ding, Y.; Qiu, X.; Luo, H.; Huang, L.; Guo, J.; Yu, B.; Sudini, H.; Pandey, M.; Kang, Y.; Liu, N.; et al. Comprehensive evaluation of Chinese peanut mini-mini core collection and QTL mapping for aflatoxin resistance. Bmc Plant Biol 2022, 22, 207. [Google Scholar] [CrossRef] [PubMed]
  2. Chen, Y.; Ren, X.; Zheng, Y.; Zhou, X.; Huang, L.; Yan, L.; Jiao, Y.; Chen, W.; Huang, S.; Wan, L. , et al. Genetic mapping of yield traits using RIL population derived from Fuchuan Dahuasheng and ICG6375 of peanut (Arachis hypogaea L.). Mol Breeding 2017, 37, 17. [Google Scholar] [CrossRef] [PubMed]
  3. Zeng, R.; Chen, T.; Wang, X.; Cao, J.; Li, X.; Xu, X.; Chen, L.; Xia, Q.; Dong, Y.; Huang, L. , et al. Physiological and Expressional Regulation on Photosynthesis, Starch and Sucrose Metabolism Response to Waterlogging Stress in Peanut. Front Plant Sci 2021, 12. [Google Scholar]
  4. Han, Y.; Dong, Q.; Zhang, K.; Sha, D.; Jiang, C.; Yang, X.; Liu, X.; Zhang, H.; Wang, X.; Guo, F. , et al. Maize-peanut rotational strip intercropping improves peanut growth and soil properties by optimizing microbial community diversity. Peerj 2022, 10, e13777. [Google Scholar] [CrossRef]
  5. Zhao, H.; Tian, R.; Xia, H.; Li, C.; Li, G.; Li, A.; Zhang, X.; Zhou, X.; Ma, J.; Huang, H. , et al. High-Density Genetic Variation Map Reveals Key Candidate Loci and Genes Associated With Important Agronomic Traits in Peanut. Front Genet 2022, 13, 845602. [Google Scholar] [CrossRef]
  6. Wan, L.; Ren, W.; Miao, H.; Zhang, J.; Fang, J. Genome-wide identification, expression, and association analysis of the monosaccharide transporter (MST) gene family in peanut (Arachis hypogaea L.). 3 Biotech 2020, 10, 130. [Google Scholar] [CrossRef]
  7. Hilu, K.W.; Stalker, H.T. Genetic relationships between peanut and wild species of Arachis sect. Arachis (Fabaceae): evidence from RAPDs. Plant Syst Evol 1995, 198, 167–178. [Google Scholar] [CrossRef]
  8. Halward, T.M.; Stalker, H.T.; Larue, E.A.; Kochert, G. Genetic variation detectable with molecular markers among unadapted germ-plasm resources of cultivated peanut and related wild species. Genome 1991, 34, 1013–1020. [Google Scholar] [CrossRef]
  9. Halward, T.G.U.A.; Stalker, H.T.; Kochert, G. Development of an RFLP linkage map in diploid peanut species. Theor Appl Genet 1993, 87, 379–384. [Google Scholar] [CrossRef]
  10. Varshney, R.K.; Bertioli, D.J.; Moretzsohn, M.C.; Vadez, V.; Krishnamurthy, L.; Aruna, R.; Nigam, S.N.; Moss, B.J.; Seetha, K.; Ravi, K. , et al. The first SSR-based genetic linkage map for cultivated groundnut (Arachis hypogaea L.). Theor Appl Genet 2009, 118, 729–739. [Google Scholar] [CrossRef]
  11. Hong, Y.; Chen, X.; Liang, X.; Liu, H.; Zhou, G.; Li, S.; Wen, S.; Holbrook, C.C.; Guo, B. SSR-based composite genetic linkage map for the cultivated peanut (Arachis hypogaea L.) genome. Bmc Plant Biol 2010, 10, 17. [Google Scholar] [CrossRef] [PubMed]
  12. Shirasawa, K.; Koilkonda, P.; Aoki, K.; Hirakawa, H.; Tabata, S.; Watanabe, M.; Hasegawa, M.; Kiyoshima, H.; Suzuki, S.; Kuwata, C. , et al. In silico polymorphism analysis for the development of simple sequence repeat and transposon markers and construction of linkage map in cultivated peanut. Bmc Plant Biol 2012, 12, 80. [Google Scholar] [CrossRef]
  13. Huang, L.; Ren, X.; Wu, B.; Li, X.; Chen, W.; Zhou, X.; Chen, Y.; Pandey, M.K.; Jiao, Y.; Luo, H. , et al. Development and deployment of a high-density linkage map identified quantitative trait loci for plant height in peanut (Arachis hypogaea L.). Sci Rep-Uk 2016, 6, 39478. [Google Scholar] [CrossRef]
  14. Zhang, S.; Hu, X.; Miao, H.; Chu, Y.; Cui, F.; Yang, W.; Wang, C.; Shen, Y.; Xu, T.; Zhao, L. , et al. QTL identification for seed weight and size based on a high-density SLAF-seq genetic map in peanut (Arachis hypogaea L.). Bmc Plant Biol 2019, 19, 537. [Google Scholar] [CrossRef] [PubMed]
  15. Jadhav, M.P.; Gangurde, S.S.; Hake, A.A.; Yadawad, A.; Mahadevaiah, S.S.; Pattanashetti, S.K.; Gowda, M.; Shirasawa, K.; Varshney, R.K.; Pandey, M.K. , et al. Genotyping-by-Sequencing Based Genetic Mapping Identified Major and Consistent Genomic Regions for Productivity and Quality Traits in Peanut. Front Plant Sci 2021, 12, 668020. [Google Scholar] [CrossRef] [PubMed]
  16. Varshney, R.K.; Mohan, S.M.; Gaur, P.M.; Gangarao, N.V.P.R.; Pandey, M.K.; Bohra, A.; Sawargaonkar, S.L.; Chitikineni, A.; Kimurto, P.K.; Janila, P. , et al. Achievements and prospects of genomics-assisted breeding in three legume crops of the semi-arid tropics. Biotechnol Adv 2013, 31, 1120–1134. [Google Scholar] [CrossRef]
  17. Bertioli, D.J.; Cannon, S.B.; Froenicke, L.; Huang, G.; Farmer, A.D.; Cannon, E.K.S.; Liu, X.; Gao, D.; Clevenger, J.; Dash, S. , et al. The genome sequences of Arachis duranensis and Arachis ipaensis, the diploid ancestors of cultivated peanut. Nat Genet 2016, 48, 438–446. [Google Scholar] [CrossRef]
  18. Bertioli, D.J.; Jenkins, J.; Clevenger, J.; Dudchenko, O.; Gao, D.; Seijo, G.; Leal-Bertioli, S.C.M.; Ren, L.; Farmer, A.D.; Pandey, M.K. , et al. The genome sequence of segmental allotetraploid peanut Arachis hypogaea. Nat Genet 2019, 51, 877–884. [Google Scholar] [CrossRef]
  19. Chen, W.; Jiao, Y.; Cheng, L.; Huang, L.; Liao, B.; Tang, M.; Ren, X.; Zhou, X.; Chen, Y.; Jiang, H. Quantitative trait locus analysis for pod- and kernel-related traits in the cultivated peanut (Arachis hypogaea L.). Bmc Genet 2016, 17, 25. [Google Scholar] [CrossRef]
  20. Chen, X.; Lu, Q.; Liu, H.; Zhang, J.; Hong, Y.; Lan, H.; Li, H.; Wang, J.; Liu, H.; Li, S. , et al. Sequencing of Cultivated Peanut, Arachis hypogaea, Yields Insights into Genome Evolution and Oil Improvement. Mol Plant 2019, 12, 920–934. [Google Scholar] [CrossRef]
  21. Yin, D.; Ji, C.; Ma, X.; Li, H.; Zhang, W.; Li, S.; Liu, F.; Zhao, K.; Li, F.; Li, K. , et al. Genome of an allotetraploid wild peanut Arachis monticola: a de novo assembly. Gigascience 2018, 7. [Google Scholar] [CrossRef] [PubMed]
  22. Zhuang, W.; Chen, H.; Yang, M.; Wang, J.; Pandey, M.K.; Zhang, C.; Chang, W.; Zhang, L.; Zhang, X.; Tang, R. , et al. The genome of cultivated peanut provides insight into legume karyotypes, polyploid evolution and crop domestication. Nat Genet 2019, 51, 865–876. [Google Scholar] [CrossRef] [PubMed]
  23. Wang, Z.; Huai, D.; Zhang, Z.; Cheng, K.; Kang, Y.; Wan, L.; Yan, L.; Jiang, H.; Lei, Y.; Liao, B. Development of a High-Density Genetic Map Based on Specific Length Amplified Fragment Sequencing and Its Application in Quantitative Trait Loci Analysis for Yield-Related Traits in Cultivated Peanut. Front Plant Sci 2018, 9, 827. [Google Scholar] [CrossRef] [PubMed]
  24. Kunta, S.; Agmon, S.; Chedvat, I.; Levy, Y.; Chu, Y.; Ozias-Akins, P.; Hovav, R. Identification of consistent QTL for time to maturation in Virginia-type Peanut (Arachis hypogaea L.). Bmc Plant Biol 2021, 21, 186. [Google Scholar] [CrossRef] [PubMed]
  25. Li, L.; Yang, X.; Cui, S.; Meng, X.; Mu, G.; Hou, M.; He, M.; Zhang, H.; Liu, L.; Chen, C.Y. Construction of High-Density Genetic Map and Mapping Quantitative Trait Loci for Growth Habit-Related Traits of Peanut (Arachis hypogaea L.). Front Plant Sci 2019, 10, 745. [Google Scholar] [CrossRef]
  26. Hu, X.H.; Zhang, S.Z.; Miao, H.R.; Cui, F.G.; Shen, Y.; Yang, W.Q.; Xu, T.T.; Chen, N.; Chi, X.Y.; Zhang, Z.M. , et al. High-Density Genetic Map Construction and Identification of QTLs Controlling Oleic and Linoleic Acid in Peanut using SLAF-seq and SSRs. Sci Rep-Uk 2018, 8, 5479. [Google Scholar] [CrossRef]
  27. Wang, L.; Yang, X.; Cui, S.; Zhao, N.; Li, L.; Hou, M.; Mu, G.; Liu, L.; Li, Z. High-density genetic map development and QTL mapping for concentration degree of floret flowering date in cultivated peanut (Arachis hypogaea L.). Mol Breeding 2020, 40. [Google Scholar] [CrossRef]
  28. Wang, L.; Zhou, X.; Ren, X.; Huang, L.; Luo, H.; Chen, Y.; Chen, W.; Liu, N.; Liao, B.; Lei, Y. , et al. A Major and Stable QTL for Bacterial Wilt Resistance on Chromosome B02 Identified Using a High-Density SNP-Based Genetic Linkage Map in Cultivated Peanut Yuanza 9102 Derived Population. Front Genet 2018, 9, 652. [Google Scholar] [CrossRef]
  29. Zhou, X.; Xia, Y.; Liao, J.; Liu, K.; Li, Q.; Dong, Y.; Ren, X.; Chen, Y.; Huang, L.; Liao, B. , et al. Quantitative Trait Locus Analysis of Late Leaf Spot Resistance and Plant-Type-Related Traits in Cultivated Peanut (Arachis hypogaea L.) under Multi-Environments. Plos One 2016, 11, e166873. [Google Scholar] [CrossRef]
  30. Chen, X.; Li, H.; Pandey, M.K.; Yang, Q.; Wang, X.; Garg, V.; Li, H.; Chi, X.; Doddamani, D.; Hong, Y. , et al. Draft genome of the peanut A-genome progenitor (Arachis duranensis) provides insights into geocarpy, oil biosynthesis, and allergens. P Natl Acad Sci Usa 2016, 113, 6785–6790. [Google Scholar] [CrossRef]
  31. Gangurde, S.S.; Khan, A.W.; Janila, P.; Variath, M.T.; Manohar, S.S.; Singam, P.; Chitikineni, A.; Varshney, R.K.; Pandey, M.K. Whole-genome sequencing based discovery of candidate genes and diagnostic markers for seed weight in groundnut. Plant Genome-Us 2022, e20265. [Google Scholar] [CrossRef] [PubMed]
  32. Qi, F.; Sun, Z.; Liu, H.; Zheng, Z.; Qin, L.; Shi, L.; Chen, Q.; Liu, H.; Lin, X.; Miao, L. , et al. QTL identification, fine mapping, and marker development for breeding peanut (Arachis hypogaea L.) resistant to bacterial wilt. Theor Appl Genet 2022, 135, 1319–1330. [Google Scholar] [CrossRef] [PubMed]
  33. Luo, H.; Ren, X.; Li, Z.; Xu, Z.; Li, X.; Huang, L.; Zhou, X.; Chen, Y.; Chen, W.; Lei, Y. , et al. Co-localization of major quantitative trait loci for pod size and weight to a 3.7 cM interval on chromosome A05 in cultivated peanut (Arachis hypogaea L.). Bmc Genomics 2017, 18, 58. [Google Scholar] [CrossRef]
  34. Mondal, S.; Badigannavar, A.M. Identification of major consensus QTLs for seed size and minor QTLs for pod traits in cultivated groundnut (Arachis hypogaea L.). 3 Biotech 2019, 9, 347. [Google Scholar] [CrossRef]
  35. Gangurde, S.S.; Pasupuleti, J.; Parmar, S.; Variath, M.T.; Bomireddy, D.; Manohar, S.S.; Varshney, R.K.; Singam, P.; Guo, B.; Pandey, M.K. Genetic mapping identifies genomic regions and candidate genes for seed weight and shelling percentage in groundnut. Front Genet 2023, 14, 1128182. [Google Scholar] [CrossRef] [PubMed]
  36. Guo, J.; Qi, F.; Qin, L.; Zhang, M.; Sun, Z.; Li, H.; Cui, M.; Zhang, M.; Li, C.; Li, X. , et al. Mapping of a QTL associated with sucrose content in peanut kernels using BSA-seq. Front Genet 2022, 13, 1089389. [Google Scholar] [CrossRef]
  37. Quiros, G.L.C.F. Sequence-related amplified polymorphism (SRAP), a new marker system based on a simple PCR reaction: its application to mapping and gene tagging in Brassica. Theor Appl Genet 2001. [Google Scholar]
  38. Hu, J.; Vick, B.A. Target region amplification polymorphism: A novel marker technique for plant genotyping. Plant Mol Biol Rep 2003, 21, 289–294. [Google Scholar] [CrossRef]
  39. Yang, X.; Zhou, X.; Wang, X.; Li, Z.; Zhang, Y.; Liu, H.; Wu, L.; Zhang, G.; Yan, G.; Ma, Z. Mapping QTL for cotton fiber quality traits using simple sequence repeat markers, conserved intron-scanning primers, and transcript-derived fragments. Euphytica 2015, 201, 215–230. [Google Scholar] [CrossRef]
  40. Ooijen, J. W. van, J. W. van Ooijen, JW van ’t Verlaat, J. W. van Ooijen, Jolien Tol, Johan Dalén, Jessie B Van Buren, J.W.M. van der Meer, J. Han van Krieken, J. W. van Ooijen, J. S. Van Kessel, Ooijen Van, Roeland E. Voorrips and Lambert P. Heuvel. “JoinMap® 4, Software for the calculation of genetic linkage maps in experimental populations.” (2006).
  41. Kosambi, D.D. The estimation of map distance from recombination values. Annals of Eugenics 1944. [Google Scholar]
  42. Voorrips, R.E. MapChart: software for the graphical presentation of linkage maps and QTLs. J Hered 2002, 93, 77–78. [Google Scholar] [CrossRef] [PubMed]
  43. Meng, L.; Li, H.; Zhang, L.; Wang, J. QTL IciMapping:Integrated software for genetic linkage map construction and quantitative trait locus mapping in biparental populations. The Crop Journal 2015, 3, 269–283. [Google Scholar] [CrossRef]
  44. Tanksley, S.D.; McCouch, S.R. Seed banks and molecular maps: unlocking genetic potential from the wild. Science 1997, 277, 1063–1066. [Google Scholar] [CrossRef] [PubMed]
  45. Lu, Q.; Liu, H.; Hong, Y.; Li, H.; Liu, H.; Li, X.; Wen, S.; Zhou, G.; Li, S.; Chen, X. , et al. Consensus map integration and QTL meta-analysis narrowed a locus for yield traits to 0.7 cM and refined a region for late leaf spot resistance traits to 0.38 cM on linkage group A05 in peanut (Arachis hypogaea L.). Bmc Genomics 2018, 19. [Google Scholar] [CrossRef]
  46. Sujay, V.; Gowda, M.V.; Pandey, M.K.; Bhat, R.S.; Khedikar, Y.P.; Nadaf, H.L.; Gautami, B.; Sarvamangala, C.; Lingaraju, S.; Radhakrishan, T. , et al. Quantitative trait locus analysis and construction of consensus genetic map for foliar disease resistance based on two recombinant inbred line populations in cultivated groundnut (Arachis hypogaea L.). Mol Breeding 2012, 30, 773–788. [Google Scholar] [CrossRef]
  47. Gautami, B.; Pandey, M.K.; Vadez, V.; Nigam, S.N.; Ratnakumar, P.; Krishnamurthy, L.; Radhakrishnan, T.; Gowda, M.V.; Narasu, M.L.; Hoisington, D.A. , et al. Quantitative trait locus analysis and construction of consensus genetic map for drought tolerance traits based on three recombinant inbred line populations in cultivated groundnut (Arachis hypogaea L.). Mol Breeding 2012, 30, 757–772. [Google Scholar] [CrossRef]
  48. Liu, Y.; Shao, L.; Zhou, J.; Li, R.; Pandey, M.K.; Han, Y.; Cui, F.; Zhang, J.; Guo, F.; Chen, J. , et al. Genomic insights into the genetic signatures of selection and seed trait loci in cultivated peanut. J Adv Res 2022, 42, 237–248. [Google Scholar] [CrossRef]
  49. Sun, C.; Wang, Y.; Yang, X.; Tang, L.; Wan, C.; Liu, J.; Chen, C.; Zhang, H.; He, C.; Liu, C. , et al. MATE transporter GFD1 cooperates with sugar transporters, mediates carbohydrate partitioning and controls grain-filling duration, grain size and number in rice. Plant Biotechnol J 2022. [Google Scholar]
  50. Luo, S.; Jia, J.; Liu, R.; Wei, R.; Guo, Z.; Cai, Z.; Chen, B.; Liang, F.; Xia, Q.; Nian, H. , et al. Identification of major QTLs for soybean seed size and seed weight traits using a RIL population in different environments. Front Plant Sci 2022, 13, 1094112. [Google Scholar] [CrossRef]
  51. Zhang, M.; Zheng, H.; Jin, L.; Xing, L.; Zou, J.; Zhang, L.; Liu, C.; Chu, J.; Xu, M.; Wang, L. miR169o and ZmNF-YA13 act in concert to coordinate the expression of ZmYUC1 that determines seed size and weight in maize kernels. New Phytol 2022, 235, 2270–2284. [Google Scholar] [CrossRef]
  52. Alyr, M.H.; Pallu, J.; Sambou, A.; Nguepjop, J.R.; Seye, M.; Tossim, H.A.; Djiboune, Y.R.; Sane, D.; Rami, J.F.; Fonceka, D. Fine-Mapping of a Wild Genomic Region Involved in Pod and Seed Size Reduction on Chromosome A07 in Peanut (Arachis hypogaea L.). Genes-Basel 2020, 11. [Google Scholar] [CrossRef] [PubMed]
  53. Wu, Y.; Sun, Z.; Qi, F.; Tian, M.; Wang, J.; Zhao, R.; Wang, X.; Wu, X.; Shi, X.; Liu, H. , et al. Comparative transcriptomics analysis of developing peanut (Arachis hypogaea L.) pods reveals candidate genes affecting peanut seed size. Front Plant Sci 2022, 13, 958808. [Google Scholar] [CrossRef] [PubMed]
  54. Xiao-jing, Z.; Yong, L.; You-lin, X.; Yan, Q.I.; Li-ying, Y.; Xiao-ping, R.; Li, H.; Huai-yong, L.; Nian, L.; Wei-gang, C. , et al. QTL mapping for traits of pod size and weight in cultivated peanut (Arachis hypogaea L.). Chinese Journal of Oil Crop Sciences 2019, 41, 869–877. [Google Scholar]
  55. Luo, H.; Guo, J.; Ren, X.; Chen, W.; Huang, L.; Zhou, X.; Chen, Y.; Liu, N.; Xiong, F.; Lei, Y. , et al. Chromosomes A07 and A05 associated with stable and major QTLs for pod weight and size in cultivated peanut (Arachis hypogaea L.). Theor Appl Genet 2018, 131, 267–282. [Google Scholar] [CrossRef]
  56. Wang, Z.; Yan, L.; Chen, Y.; Wang, X.; Huai, D.; Kang, Y.; Jiang, H.; Liu, K.; Lei, Y.; Liao, B. Detection of a major QTL and development of KASP markers for seed weight by combining QTL-seq, QTL-mapping and RNA-seq in peanut. Theor Appl Genet 2022, 135, 1779–1795. [Google Scholar] [CrossRef]
  57. Li, H.; Yu-Ning, C.; Huai-Yong, L.; Xiao-Jing, Z.; Nian, L.; Wei-Gang, C.; Yong, L.; Bo-Shou, L.; Hui-Fang, J. Advances of QTL mapping for seed size related traits in peanut. Acta Agronomica.
  58. Farrow, S.C.; Facchini, P.J. Functional diversity of 2-oxoglutarate/Fe(II)-dependent dioxygenases in plant metabolism. Front Plant Sci 2014, 5, 524. [Google Scholar] [CrossRef]
  59. Zeng, J.; Ding, Q.; Fukuda, H.; He, X.Q. Fertilization Independent Endosperm genes repress NbGH3.6 and regulate the auxin level during shoot development in Nicotiana benthamiana. J Exp Bot 2016, 67, 2207–2217. [Google Scholar] [CrossRef]
  60. Chen, R.; Wei, Q.; Liu, Y.; Li, J.; Du, X.; Chen, Y.; Wang, J.; Liu, Y. The pentatricopeptide repeat protein EMP601 functions in maize seed development by affecting RNA editing of mitochondrial transcript ccmC. The Crop Journal 2023. [Google Scholar] [CrossRef]
  61. Barkan, A.; Small, I. Pentatricopeptide Repeat Proteins in Plants. Annu Rev Plant Biol 2014, 65, 415–442. [Google Scholar] [CrossRef]
  62. Yang, B.; Wang, J.; Yu, M.; Zhang, M.; Zhong, Y.; Wang, T.; Liu, P.; Song, W.; Zhao, H.; Fastner, A. , et al. The sugar transporter ZmSUGCAR1 of the nitrate transporter 1/peptide transporter family is critical for maize grain filling. Plant Cell 2022, 34, 4232–4254. [Google Scholar] [CrossRef] [PubMed]
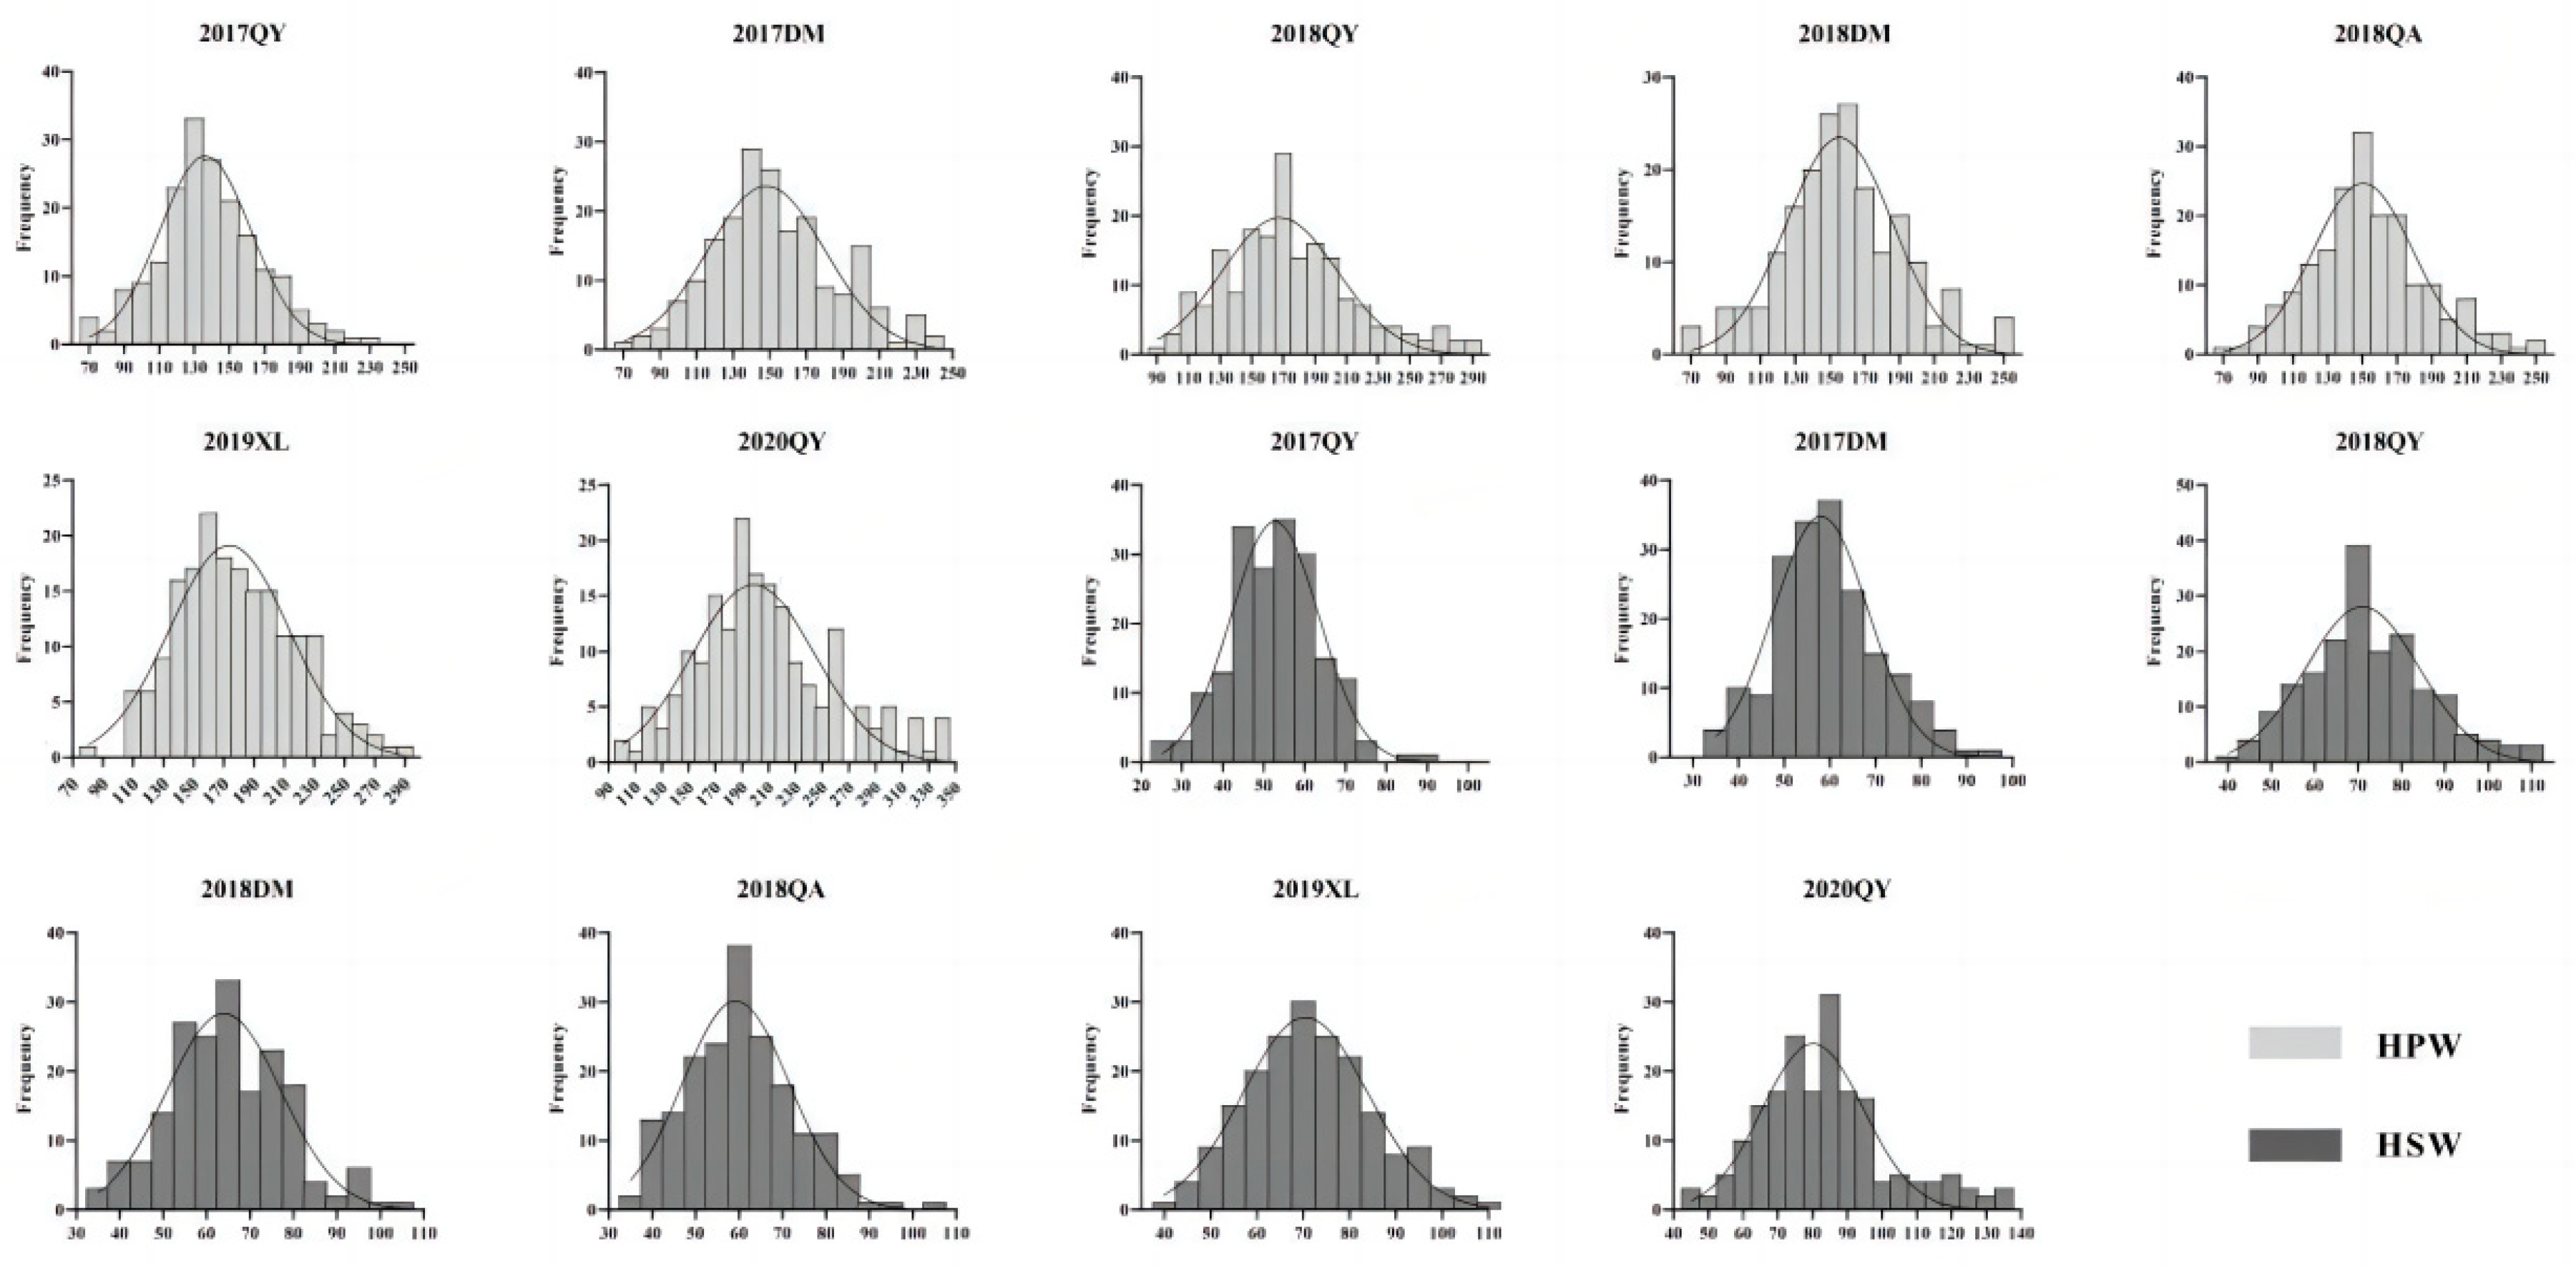
Figure 2. Phenotypic distribution of HPW and HSW for the RIL population, The x-axis shows the range of HPW and HSW in seven environments (17QY, 17DM, 18QY, 18DM, 18QA, 19XL and 20QY). The y-axis shows the number of individuals of the RIL population.
Preprints 82778 g002
Figure 3. Box plots of HSW (left) and HPW (right) of RIL population under seven environments.
Preprints 82778 g003
Figure 4. High density genetic map of the RIL population using SNP and SSR markers, the markers were indicated by black bars.
Preprints 82778 g004
Figure 5. The distribution of QTLs for HPW (blue indicator) and HSW (pink indicator) on the genetic linkage map.
Preprints 82778 g005
Figure 6. Prediction of candidate genes for the co-localization interval of HPW and HSW. (A) Co-localization interval LOD map on chromosome A08. (B) Candidate intervals corresponding to the physical location of chromosome A08. (C) Distribution of candidate genes in the interval on chromosome A08.
Preprints 82778 g006
Table 1. Descriptive Statistics of HPW and HSW for Parents and RIL Populations.
Traits Env. Parents RIL population
JH5 M130 Min Max Mean SD CV (%) Shapiro–Wilk (w-test) Skew Kurt
HPW(g) 17QY 254.03±6.84** 170.13±0.91 71.04 239.22 143.55 30.37 21.16 0.99 0.23 0.21
17DM 247.18±2.30** 164.64±3.78 79.86 240.61 156.36 33.06 21.14 0.99 * 0.36 -0.11
18QY 271.28±8.80** 184.48±2.45 94.85 325.53 179.42 42.91 23.91 0.98 ** 0.62 0.36
18DM 236.77±6.46** 155.79±3.57 75.99 256.43 162.68 35.68 21.93 0.99 0.18 0.09
18QA 233.38±1.89** 159.70±5.95 78.28 296.87 159.36 35.14 22.05 0.98 * 0.51 0.86
19XL 213.20±1.74** 167.76±10.46 89.71 298.00 183.19 38.75 21.15 0.99 0.39 -0.17
20QY 291.31±1.41** 177.85±0.92 107.61 389.97 212.66 52.48 24.68 0.97 ** 0.66 0.36
HSW(g) 17QY 105.22±2.17** 70.04±0.69 27.73 91.24 55.42 11.17 20.16 0.99 0.19 0.30
17DM 100.82±1.49** 68.83±1.14 36.93 94.67 62.00 11.60 18.71 0.99 0.32 -0.10
18QY 114.32±2.73** 76.20±3.11 43.73 114.88 74.99 14.47 19.29 0.99 0.33 -0.14
18DM 96.12±2.48 ** 63.88±1.06 35.13 106.51 67.30 13.70 20.35 0.99 0.25 -0.06
18QA 100.24±1.44** 63.90±1.65 37.21 105.15 63.18 13.04 20.64 0.98 0.39 -0.05
19XL 109.07±0.61** 74.07±2.7 43.44 110.75 73.99 13.40 18.10 1.00 0.26 -0.14
20QY 109.57±1.05** 71.01±1.34 46.39 140.89 85.87 18.73 21.81 0.96 ** 0.68 0.53
* and** represent significant differences at the 0.05 and 0.01 levels, respectively. Environments, 17DM, 17QY, 18DM, 18QY, 18QA, 19XL and 20QY represent sampling from 2017 to 2020 at Daming (DM), Qingyuan (QY), Qian’an (QA) and Xinle (XL).
Table 2. Simple correlation coefficients between HPW and HSW under seven environments.
Env. Traits HPW HSW
17QY HPW 1 0.844**
HSW 0.844** 1
17DM HPW 1 0.848**
HSW 0.848** 1
18QY HPW 1 0.881**
HSW 0.881** 1
18DM HPW 1 0.908**
HSW 0.908** 1
18QA HPW 1 0.858**
HSW 0.858** 1
19XL HPW 1 0.881**
HSW 0.881** 1
20QY HPW 1 0.962**
HSW 0.962** 1
**, significant correlation at 0.01 level.
Table 3. Results of ANVOA and broad heritability of HPW and HSW.
Traits Variables df MS F-value P-value hB2
HPW Geno. 187 20956.938 314.2 P<0.001 0.64
Env. 6 289675.957 4343.012 P<0.001
G×E 1122 1828.708 27.417 P<0.001
HSW Geno. 187 2566.214 182.797 P<0.001 0.52
Env. 6 56659.777 4035.995 P<0.001
G×E 1122 249.054 17.741 P<0.001
Geno., Env. and G×E were abbreviation of Genotype, Environment and G×E interaction.
Table 4. Integrated Genetic Map Information.
Linkage Marker_number Length (cM) Average interval (cM) Maximum gap (cM)
A01 65 110.60 1.70 12.85
A02 256 92.49 0.36 8.18
A03 259 104.09 0.40 6.76
A04 99 105.20 1.06 16.03
A05 238 131.83 0.55 13.20
A06 264 72.80 0.28 7.51
A07 119 182.98 1.54 8.14
A08 159 117.05 0.74 12.74
A09 91 63.74 0.70 5.39
A10 44 58.09 1.32 18.93
A subgenome 1594 1038.87 0.68
B01 203 50.20 0.25 11.12
B02 84 90.38 1.08 6.21
B03 153 76.53 0.50 6.21
B04 196 65.14 0.33 20.59
B05 96 72.62 0.76 6.58
B06 247 192.61 0.78 17.14
B07 48 59.51 1.24 7.25
B8 313 138.82 0.44 2.23
B09 104 54.89 0.53 3.63
B10 92 159.35 1.73 9.87
B subgenome 1536 960.05 0.63
Whole genome 3130 1998.92 0.64
Table 5. QTL mapping results of HPW and HSW.
Traits QTLs Env.a Chr.b Position(cM) Marker interval LODc PVEd (%) Adde Dirf
HPW qHPWA04.1 18QY A04 2.21 SMK547-SMK549 3.42 8.11 12.27 Jihua 5
qHPWA08.1 20QY A08 6.26 AhTE0658-TC22C01 6.69 8.07 16.38 Jihua 5
qHPWA08.2 17DM A08 6.97 AhTE0658-TC22C01 3.38 4.55 7.93 Jihua 5
qHPWA08.3 17QY A08 7.69 AhTE0658-TC22C01 3.60 4.41 7.64 Jihua 5
18DM A08 7.69 AhTE0658-TC22C01 7.31 8.89 11.85 Jihua 5
19XL A08 7.69 AhTE0658-TC22C01 5.44 6.79 11.23 Jihua 5
qHPWA08.4 18QA A08 8.40 AhTE0658-TC22C01 6.07 7.83 10.34 Jihua 5
qHPWA08.5 18QY A08 21.20 me3em14-196-Ah4-4 4.32 6.21 12.02 Jihua 5
qHPWA08.6 19XL A08 25.00 Ah4-4-Ah2TC09B08 4.92 5.54 10.09 Jihua 5
qHPWA08.7 18QA A08 26.00 Ah4-4-Ah2TC09B08 3.60 4.55 7.85 Jihua 5
qHPWA08.8 18DM A08 27.00 Ah4-4-Ah2TC09B08 4.60 5.32 9.13 Jihua 5
20QY A08 27.00 Ah4-4-Ah2TC09B08 3.29 3.73 11.08 Jihua 5
qHPWB04.1 17QY B04 1.11 SMK1996-SMK1995 3.20 6.77 -9.71 M130
qHPWB05.1 19XL B05 3.01 SMK2087-SMK2088 2.60 5.72 -10.30 M130
qHPWB05.2 19XL B05 16.01 SMK2085-SMK2084 3.19 6.70 -13.45 M130
qHPWB06.1 17QY B06 34.51 SMK2106-SMK2107 2.84 5.99 7.51 Jihua 5
17DM B06 34.51 SMK2106-SMK2107 4.05 8.48 9.92 Jihua 5
qHPWB08.1 17DM B08 0.00 AHGS1286-Ah3TC20B05 5.47 6.20 -9.30 M130
18QA B08 0.00 AHGS1286-Ah3TC20B05 3.22 3.66 -7.07 M130
19XL B08 0.00 AHGS1286-Ah3TC20B05 3.51 3.73 -8.34 M130
qHPWB08.2 17QY B08 1.00 AHGS1286-Ah3TC20B05 3.97 4.42 -7.66 M130
18DM B08 1.00 AHGS1286-Ah3TC20B05 5.90 6.57 -10.21 M130
20QY B08 1.00 AHGS1286-Ah3TC20B05 4.79 5.11 -13.05 M130
qHPWB08.3 20QY B08 17.21 SMK2658-SMK2393 2.65 10.83 20.94 Jihua 5
qHPWB08.4 20QY B08 24.51 SMK2406-SMK2423 2.57 5.56 16.27 Jihua 5
qHPWB08.5 18QA B08 36.81 SMK2628-SMK2626 3.65 8.09 -12.85 M130
HSW qHSWA03.1 17DM A03 106.81 SMK539-SMK540 4.04 8.54 -3.88 M130
18QY A03 106.81 SMK539-SMK540 2.67 5.87 -3.74 M130
qHSWA04.1 17DM A04 1.21 SMK547-SMK549 2.75 5.79 2.84 Jihua 5
qHSWA08.1 20QY A08 6.23 AhTE0658-TC22C01 5.65 6.93 5.32 Jihua 5
qHSWA08.2 19XL A08 6.97 AhTE0658-TC22C01 3.75 4.47 3.30 Jihua 5
qHSWA08.3 18DM A08 9.12 AhTE0658-TC22C01 5.00 6.00 3.52 Jihua 5
qHSWA08.4 18QA A08 19.00 Ah1TC06H03-AhTE0477 3.91 6.37 3.59 Jihua 5
qHSWA08.5 18QY A08 26.00 Ah4-4-Ah2TC09B08 6.66 9.20 4.52 Jihua 5
19XL A08 26.00 Ah4-4-Ah2TC09B08 5.74 6.59 3.99 Jihua 5
qHSWA08.6 17QY A08 27.00 Ah4-4-Ah2TC09B08 3.49 4.87 2.62 Jihua 5
18DM A08 27.00 Ah4-4-Ah2TC09B08 3.49 4.85 3.16 Jihua 5
20QY A08 27.00 Ah4-4-Ah2TC09B08 4.00 4.63 4.32 Jihua 5
qHSWB04.1 18QA B04 11.61 SMK1978-SMK1848 4.39 10.43 5.84 Jihua 5
qHSWB05.1 20QY B05 29.91 SMK2063-SMK2062 2.55 5.61 6.31 Jihua 5
qHSWB06.1 17QY B06 34.51 SMK2106-SMK2107 3.89 8.52 3.26 Jihua 5
qHSWB08.1 18DM B08 0.00 AHGS1286-Ah3TC20B08 4.73 5.50 -3.38 M130
qHSWB08.2 20QY B08 1.00 AHGS1286-Ah3TC20B08 3.86 4.14 -4.11 M130
a Env. environment; b Chr. chromosome; c LOD logarithm of the odds; d PVE phenotypic variation explained; e Add additive effect; f Dir direction.
Table 6. Gene annotation in candidate regions.
Chr. Gene Names Physical Position (bp) Nr_annotation
A08 Arahy.9AY9GA 35,966,338~35,970,068 DDRGK domain-containing protein 1-like [Glycine max]
A08 Arahy.CX54HG 35,973,257~35,975,499 Translation initiation factor SUI1 family protein
A08 Arahy.T6DWBF 36,090,499~36,092,669 Trafficking protein particle complex subunit-like protein
A08 Arahy.D52S1Z 36,116,001~36,121,083 Probable 2-oxoglutarate/Fe(II)-dependent dioxygenase-like [Glycine max]
A08 Arahy.HX3F52 36,151,497~36,153,080 Calcium-dependent lipid-binding (CaLB domain) family protein
A08 Arahy.IBM9RL 36,178,370~36,181,596 Polycomb group protein FERTILIZATION-INDEPENDENT ENDOSPERM-like [Glycine max]
A08 Arahy.W18Y25 36,166,807~36,175,891 Pentatricopeptide repeat (PPR) superfamily protein
A08 Arahy.C7DQ5B 36,181,753~36,189,459 Uncharacterized protein LOC100782617 isoform X9 [Glycine max]
A08 Arahy.CPLC2W 36,196,903~36,197,724 Pentatricopeptide repeat (PPR-like) superfamily protein
A08 Arahy.C2FWCT 36,238,299~36,245,344 Breast carcinoma amplified sequence 3 protein
A08 Arahy.XZZ787 36,255,496~36,260,840 Probable galacturonosyltransferase 12-like [Glycine max]
A08 Arahy.7ZYB2E 36,272,312~36,273,769 Thioredoxin 2
A08 Arahy.IUT8LB 36,278,268~36,280,173 Oxygen-evolving enhancer protein
A08 Arahy.1IX743 36,281,314~36,282,631 Papain family cysteine protease
A08 Arahy.14EF4H 36,285,790~36,286,678 Sugar transporter 11
A08 Arahy.CY6UV3 36,314,963~36,316,298 Papain family cysteine protease n=3 Tax=Leptospira RepID=M6CXX2_9LEPT
A08 Arahy.5Z666J 36,306,402~36,308,262 Unknown protein
A08 Arahy.9TI2ID 36,317,379~36,323,108 Papain family cysteine protease n=2 Tax=Leptospira RepID=N1U715_9LEPT
Chr. chromosome.
Disclaimer/Publisher’s Note: The statements, opinions and data contained in all publications are solely those of the individual author(s) and contributor(s) and not of MDPI and/or the editor(s). MDPI and/or the editor(s) disclaim responsibility for any injury to people or property resulting from any ideas, methods, instructions or products referred to in the content.
Copyright: This open access article is published under a Creative Commons CC BY 4.0 license, which permit the free download, distribution, and reuse, provided that the author and preprint are cited in any reuse.
Prerpints.org logo

Preprints.org is a free preprint server supported by MDPI in Basel, Switzerland.

Subscribe

© 2024 MDPI (Basel, Switzerland) unless otherwise stated