Preprint
Article
E_Apriori: An Efficient Machine Learning Algorithm for the Control of Malaria
Altmetrics
Downloads
112
Views
47
Comments
0
This version is not peer-reviewed
Submitted:
17 August 2023
Posted:
21 August 2023
You are already at the latest version
Alerts
Abstract
The discovery of interesting inter-relationships between the different malaria epidemiological parameters is essential towards the disease control. However, existing associative rule-based machine learning algorithms for pattern discovery are slow while working on high-dimensional Malaria Indicator Survey (MIS) data, with the further challenge of data under fitting and inadequate result visualization. Hence, this work proposed a novel and efficient associative rule-based machine-learning algorithm with enhanced graphical visualization capacity for rigorous and confident biological result interpretation for malaria control. Through empirical and asymptotic comparative time-complexity performance evaluations, the proposed algorithm scaled better than other existing associative rule-based machine learning algorithms while maintaining its accuracy. The algorithm was applied to two real MIS data sets obtained from the Demographic and Health Survey repository and other supplementary literature source using Nigeria as a case study. The resulting interesting malaria epidemiological discovered novel trends were: a) the malaria disease might not be associated with the anemia symptom; b) there was no significant association between the anemia symptom and the wealth indices of individuals; c) there were other parameters associated with the insecticide resistance capacity of the malaria vector asides the knock down resistance alleles; d) the population dynamics of the malaria vector was not associated with the malaria disease endemicity. In conclusion, this work developed a computationally efficient and user-friendly associative rule-based machine-learning algorithm called E_Apriori for the control of the malaria disease.
Keywords:
Subject: Computer Science and Mathematics - Artificial Intelligence and Machine Learning
Introduction
Malaria is often endemic in tropical Sub Saharan Africa [1,2,3,4]. However, children and pregnant women are more susceptible to malaria than other class of individuals [5,6,7,8,9]. This is due to an underdeveloped and suppressed immune system for children (0–4 years), and pregnant women, respectively [10,11]. Hence, malaria epidemiologists and control program formulators preferentially prioritize these groups of individuals (children and pregnant women) during Malaria Indicator Survey (MIS), and its implementation, respectively [10,12,13,14,15].
MIS is a field-data collection study, which is often targeted towards the malaria endemicity peak periods in a country [10,12,13,14,16]. However, the malaria endemicity peak periods are often associated with rainfall and temperature climatic factors [8]. Moderately high rainfall boosts the prevalence of malarial mosquito breeding reservoirs and sites, leading to the imminent malaria endemicity during this period [17,18,19]. Often, moderately high temperature increases the malaria transmission rate by enhancing the Plasmodium parasite development into the infective sporozoite stage in the malarial vector, at a faster rate [19,20]. Hence, experimental biologists have established and supported the hypothetical inference that the high prevalence of mosquitoes in a region, contributes to the endemicity of malaria in that region, which this study sought to investigate.
Insecticide resistance as an important MIS data field, provides information about the rate at which the malarial vector develop resistance to insecticides such as pyrethroids which can be used to treat mosquito net towards malaria control [21]. Further, the knock down resistant (kdr) allele describes the presence of an abnormal genetic make-up in the malarial vector caused by mutations in the nervous system of the vector, which has being biologically validated to enhance the insecticide resistance capability of the vector [22,23]. However, this study further sought to investigate these two variable relationships.
Anemia is the major symptom associated with malaria in Tropical Sub-Saharan Africa when a mosquito infected with any of the Plasmodium species (P. falciparum, P. ovale, P. vivax and P. malariae) bites a susceptible human, to reduce the level of Red Blood Cells [24]. Hence there have being an existing hypothetical inference that most individuals with the anemia symptom are expected to successfully accept malaria treatment [24] which this study investigated. Further, the prevalence of the anemia symptom among low-income individuals [21,25] was a research question that this study sought to answer.
Sporozoite rate is useful to determine the rate of malarial Plasmodium parasite infection in the female Anopheles vector host blood cells [26,27]. It is expected that the number of susceptible mosquitoes in a region will determine the sporozoite rate in any given geo-referenced location and vice-versa [26,27]; which might not be a consistent hypothetical inference.
Hence, there is the need to develop computationally efficient algorithms to discover and deduce novel malaria epidemiological trends from clinical MIS data towards proposing malaria control interventions. In furtherance of this research attempt, this study performed a critical computational appraisal of existing machine learning algorithms. However, the Apriori rule-mining machine-learning algorithm [28] was of primary interest because of its existing known utility in associative rule mining and interesting pattern discovery while working on biological and clinical data.
However, the major challenge with the Apriori algorithm [28] is that it is computationally slow while working on high-dimensional biological data towards generating associative patterns and may truncate the process of pattern discovery before completion [29]. In addition, there is the challenge of data under fitting and inadequate biological result visualization [29,30]. Hence, this work proposed an improved computationally efficient but cost-effective machine-learning algorithm called E_Apriori that will be useful in generating accurate but simple to interpret associative patterns, from high-dimensional biological and clinical data towards malaria control.
Methods
This work was based on extending the existing Apriori association rule-based machine-learning algorithm towards achieving better computational efficiency. We first describe the conventional Apriori association rule-based machine-learning algorithm by presenting its procedure in the next section. An extended Apriori algorithm (E_Apriori) was then presented in the subsequent section.
Basic Model
The basic model for this study was the Apriori associative rule-based machine-learning algorithm [28]. The problem that the Apriori algorithm sought to solve was stated mathematically using biological conceptualizations as follows. Given that B is a set of MIS biological data representations (Bk∞) such that k is the number of subset representations contained in every unique parent data field. Hence, the association rule is generated for B1 and B2 (B1 → B2) when it is assigned a unique Biological combination ID (BID) given that B1 ∩ B2 ≠ 0 with a user defined minimum support for a confident biological result generation.
Hence, the detailed pseudocode for the conventional Apriori Algorithm [28] was given as follows.
- Input B = {Bk∞}
- For (k=2; Bk-1 ≠ 0; k++) do begin
- Ck = apriori-gen (Bk-1) // Ck : biological candidates
- For all biological combinations CBID = subset (Ck, BID)
- For all biological candidate Bc € CBID
- Bc.count++
- Bk = {Bc £ Ck | Bc.count ≥ min_support}
- Output Uk Bk
The E_Apriori Machine Learning Algorithm
From the biological emphatic point of view, the novel E_Apriori was proposed to work on high-dimensional MIS data towards overcoming the challenge of data under fitting, visualization and slowness. Hence, the procedure of the proposed novel E_Apriori algorithm was formally described to prove its correctness as follows.
Given a high-dimensional Biological MIS data input (B) of size D, with N∞ ≤ 10000 given that N is the number of data fields and Bk∞ is used to represent the number of possible subsets in every given data field such that k∞ ≤ 9 for k > 0 & k = 10; then find the frequent associative value representations (f) of a unique candidate biological data field using the set union representation (Bk∞ {k1 U k2…k9}) with a user-defined minimum support (recommended min_support ≥ 70) stored in an array output file (LF) of Index: 11. Repeat for the next unique biological candidate data input of Mk∞ to find the frequent associative value representations (f), by using the set union Mk∞({ k1 U k2…k9}) with a user-defined minimum support (recommended min_support ≥ 70) stored in an array output file (MF) of Index: 12. Then find the frequent associative value representations between a unique biological candidate input (LF) and another unique biological candidate input (MF) by using the set union given as MF U LF with a user-defined minimum support(recommended min_support ≥ 70) to be stored in a matrix data structure of Index IRIC. The association between MF and LF mathematically as Bk (LF →MF) such that min_support ((LF U MF)/LF) which is stored in a Ct data file as the output. Further, a graphical visualization is provided for the resulting associative output as a graph (set x-axis: LF $ set y-axis: MF).
The pseudocode for the Novel E_Apriori algorithm was given further as follows.
Problem: arg mint (Bk (LF→MF))
arg maxa (Bk (LF→MF))
Bk: The total number of subset representations contained in every unique MIS data field.
LF: A unique candidate MIS data field
MF: Another unique candidate MIS data field
mint: minimize computational time
maxa: maximize computational accuracy
arg: argument
→: association
Input: B∞ {D, N, k}
B∞: MIS data
D: size of the MIS data
N: number of unique data field representations in the MIS
k: number of subset representations in any given candidate data field.
Output
Bk(LF→MF)
Plot_graph (set x-axis: LF $ set y-axis: MF)
function E_Apriori (B∞ {D, N, k})
Given that data field (Bk∞ € N such that N∞ ≤ 10000)
For (k=10, Bk-1 ≠ ∅, k++) {
Prune (BK-1)
Find frequent (f) biologically correlated values for a candidate biological data field (L)
LF = (Bk∞ {k1 U k2…k9}) ≥ min_sup
//Repeat step 3,4,5,6 for the next data field M
Given that Mk∞ € N such that N∞ ≤ 10000
For (k=10, Mk-1 ≠ ∅, k++) {
Prune (MK-1)
Find frequent (f) biologically correlated values for a candidate biological data field (M)
MF = (Mk∞ {K1 U K2…K9}) ≥ min_sup
IRIC = find frequent association (LF U MF)
Bk (LF→MF) = min_support ((LF U MF)/LF)}} //Output of Bk (LF→MF) saved in Ct.
Output Plot_graph (set x-axis: LF $ set y-axis: MF)
Output IRIC, Bk
Repeat all steps for all new Bk candidates contained in B∞
End
Figure 1 shows the basic flow chart of the proposed E_Apriori Algorithm.
Comparative Performance Evaluation of the E_Apriori Algorithm
The comparative asymptotic time complexity analysis of the novel E_Apriori algorithm was done against the existing Apriori algorithms [28,31,32,33,34,35,36,37] to assess its computational efficiency. The average empirical time-complexity comparative performance evaluation of the proposed E_Apriori algorithm against the existing Apriori algorithms [28,38] was done on a conventional sequence-based computer of Core i5 Processor, 8GB RAM and Windows 10 Operating System specification using the high-dimensional Nigerian-georeferenced MIS 2015 data.
To further confirm the associative pattern discovery accuracy of the proposed algorithm, the empirical comparative performance analysis of the E_Apriori algorithm against other existing Apriori algorithms was done on a parallel computing facility with ten (10) Central Processing Units (CPUs) using the same high-dimensional Nigerian georeferenced MIS 2015 data.
Implementation of the E_Apriori Algorithm towards Associative Pattern Discovery
The E_Apriori algorithm was applied extensively to the MIS data sets, which were described as follows. The MIS dataset for Nigeria used in this study, are from two major secondary sources: the Demographic and Health Survey (DHS) Repository and other supplementary academic publication [39].
This work assessed the MIS 2015 high-dimensional Nigerian geo-referenced dataset from the DHS Repository. The MIS 2015 data comprises of Seven Thousand, Seven Hundred and Forty-Five (7745) observations for every corresponding variable of Two Thousand, Six Hundred and Forty-nine (2649) representations. In addition, there is a minimum subset of nine representations for every unique variable. Further, this study assessed other Nigerian geo-referenced dataset from supplementary literature source [39]. The supplementary literature-sourced data comprises of Six Hundred and Thirty-three (633) observations with thirty-four (34) unique variables. However, this study reported only the MIS variable observations where the novel malaria epidemiological trends were discovered.
The following numerical value-labeled codes and its respective semantics were used to represent the different variant categorical observations of anemia: 1- severe anemia, 2- moderate anemia, 3- mild and 4- not anemic. Further, the following numerical value-labeled codes and its respective semantics were used to represent the different variant categorical observations of wealth index: 1-poorest, 2-poorer, 3-middle, 4- richer, and 5-richest. Also, the following numerical value-labeled codes and its respective semantics, were used to represent the different variant categorical observations of malaria treatment acceptance: 1- accepted malaria treatment, 2- refused malaria treatment, and 6- other treatment acceptance.
Binary logistic variable observations of 0 and 1 were used as program codes to represent susceptible and resistant kdr alleles, respectively; which was same for the insecticide resistance data field. Further, the sporozoite rate were represented as percentile variables while the number of mosquitoes were of discrete data observation type.
This study followed the data preprocessing de-facto pipeline of outlier detection and removal of null values [40] before the further analytics of discovering novel associative malaria epidemiological patterns using the novel E_Apriori machine-learning algorithm proposed in this study.
3. Results of the E_Apriori Algorithm Comparative Performance Evaluation
The asymptotic time-complexity analysis of the novel E_Apriori algorithm was expressed mathematically as follows when it is given that k is the number of subset representations contained in all the parent MIS data field variables.
f(k) = (3k2 + 5k + 1)−1
f(k) ≥ 3k−2
g = k−2
f(k) ≥ 3g for all values of k > 0
Hence, the asymptotic time complexity of the novel E_Apriori algorithm was O (g) = O (k−2), which was better than other existing Apriori algorithms when discovering interesting association patterns as shown in Table 1.
The average sequential empirical running time of the proposed E_Apriori, T_Apriori, and the conventional Apriori algorithms, were 60s, 360s and 560s, respectively as shown in Figure 2. Further, the E_Apriori successfully finished generating the association patterns without truncating before completion to overcome the challenge with the T_Apriori and the conventional Apriori algorithm during the sequential computing experimentation.
To confirm the associative pattern discovery accuracy of the proposed algorithm, the E_Apriori algorithm generated the same associative pattern results as the conventional Apriori and T_Apriori algorithms during experimentation on parallel systems. During the parallel system experimentation, all the machine-learning algorithms (E_Apriori, T_Apriori and the conventional Apriori) successfully completed the associative pattern generation.
The Novel Malaria Epidemiological Trends and Patterns
Majority (75%) of the poorest individuals (1) were anemic which was the same for the poorer (2), middle (3), richer (4), and richest (5) individuals. Further, minority (25%) of the poorest individuals (1) were not anemic which was same for the poorer (2), middle (3), richer (4), and richest (5) individuals. Confidently, there was no significant difference in the anemia and non-anemia cases when the wealth indices of the sample individuals were at the poorest (1), poorer (2), middle (3), richer (4), and richest (5) levels as visualized using a scatterplot diagram shown in Figure 3. This emphasized that there was no evidence of randomness and linearity in the wealth indices to anemia distribution ratio.
Figure 4 shows the associative relationship between the anemia and accepted malaria treatment data fields. 40% of sampled individuals with mild and moderate variants of anemia successfully accepted malaria treatment whereas 20% refused the malaria treatment and other forms of treatment, despite being anemic. Also, 20% of those that are not anemic, accepted the malaria treatment while another 20% of anemic sampled individuals accepted different forms of treatment against other diseases but refused the malaria treatment..Hence, the anemia to malaria treatment followed a random distribution.
Further, the results of the relationship between insecticide resistance level of the malarial vector and the kdr alleles present in its genetic makeup showed that there was a weak positive association between these variables based on the linear-regression deductive method. From the results shown in Figure 5, it was also evident that 33.3333% of the malarial vector were not resistant (susceptible) and lack the kdr alleles. Further, 33.3333% of the malarial vector were resistant to insecticides while exhibiting the kdr alleles’ presence. Further, another 33.3% of the malaria vector were resistant to insecticides but lack any known kdr alleles.
The investigated association between the sporozoite rate and number of mosquitoes is shown in Figure 6. However, there was no significant association between the sporozoite rate and the population dynamics of mosquitoes. However, the sporozoite to the population dynamics of the malarial mosquitoes’ ratio is in line with the random sampling de-facto distribution Hence, this could be explained that increase in the number of mosquitoes in a georeferenced MIS location, do not determine the increase in the sporozoite rate, and vice versa.
4. Discussion
This work developed a computationally efficient novel E_Apriori algorithm that was faster theoretically and empirically in terms of its running time compared to existing Apriori algorithms. Further, it was simple to implement, cost-effective and specifically useful to generate accurate and graphically interpretable associative patterns on high-dimensional clinical and biological MIS data for the control of malaria.
This study found that there was no significant association between the wealth indices of the individuals and their respective anemia levels, which contradicted the existing hypothetical research inference [10,13,21,24,25]. Hence, this study suggested that confirmed malaria disease cases expressed through an anemic symptom, is not significantly associated with low-income individuals.
The findings from this study further contradicted the existing clinical hypothetical research inference, that most anemia symptomatic patients are expected to successfully accept malaria treatment [10,13,24]. However, this study found that there were other individuals, with no anemic symptom but were successfully treated of the malaria disease. Hence, this study hypothetically inferred that the malaria disease in an individual might not necessarily be expressed through an anemic symptom, which is useful for clinicians during malaria case evaluation.
This study suggests that there are other factors responsible for the insecticide resistance of the malarial mosquito asides kdr alleles present in the mosquito genetic make-up. This was because the study found a weak positive association between insecticide resistance and kdr alleles. Hence, the flight behavior, specific specie-strain of the malarial mosquitoes, which might be other contributing factors to its insecticide resistance capability, are recommended research niches for computational and experimental biologists.
This study further established a novel epidemiological trend that the sporozoite rate is not dependent on the population dynamics of the malarial vector. Hence, this suggests that the number of mosquitoes in a region do not determine the endemicity of the malaria disease in that region. Hence, this study recommended that malaria control-program formulators and clinicians should adopt a country-specific intervention and treatment approach, respectively towards the control of malaria.
Data Availability Statement
The Nigerian geo-referenced MIS 2015 data used for this study is downloadable on https://www.dhsprogram.com/data/. The supplementary literature-sourced Nigerian MIS data used for this study is downloadable on https://doi.org/10.1371/journal.pone.0028347.s001.
Acknowledgements
The author thank Prof. Jason Rasgon of the Department of Entomology, Center for Infectious Disease Dynamics, Pennsylvania State University, United States of America; for hosting him at his Lab during the period of carrying out this study between December 3, 2019.
Conflicts of Interest
None declared.
References
- Karnad, D.R.; Nor, M.B.; Richards, G.A.; Baker, T.; Amin, P. Intensive care in severe malaria: Report from the task force on tropical diseases by the World Federation of Societies of Intensive and Critical Care Medicine. J. Crit. Care. 2018, 43, 356–360. [Google Scholar] [CrossRef] [PubMed]
- Gyapong, J.; Boatin, B. Neglected tropical diseases-sub-Saharan Africa. Neglected Tropical Diseases. 2016, 87–112. [Google Scholar]
- Onyishi, G.C.; Aguzie, I.O.; Nwani, C.D.; Obiezue, R.N.; Okoye, I.C. Malaria-Vector Dynamics in a Tropical Urban Metropolis, Nigeria. Pak. J. Zoology. 2018, 50, 1035. [Google Scholar] [CrossRef]
- Parker, M. Neglected Tropical Diseases. In The International Encyclopedia of Anthropology; 2018; pp. 1–2.
- van Eijk, A.M.; Hill, J.; Noor, A.M.; Snow, R.W.; ter Kuile, F.O. Prevalence of malaria infection in pregnant women compared with children for tracking malaria transmission in sub-Saharan Africa: A systematic review and meta-analysis. Lancet Global Health 2015, 3, e617–e628. [Google Scholar] [CrossRef] [PubMed]
- Damen, J.G.; Daminabo, V.M. Prevalence of Malaria Parasitaemia in Pregnant Women WHO Attended General Hospital Shendam, Plateau State, Nigeria. Nat. Sci. 2017, 15, 10–17. [Google Scholar]
- Rogerson, S.J. Management of malaria in pregnancy. Indian J. Med. Res. 2017, 146, 328. [Google Scholar]
- Gunda, R.; Chimbari, M.J.; Shamu, S.; Sartorius, B.; Mukaratirwa, S. Malaria incidence trends and their association with climatic variables in rural Gwanda, Zimbabwe, 2005–2015. Malaria Journal. 2017, 16, 393. [Google Scholar] [CrossRef]
- Aregbeshola, B.S.; Khan, S.M. Impact of health facilities on malaria control interventions among children under five years of age and pregnant women in Nigeria. South East Asia. J. Public Health 2017, 7, 35–41. [Google Scholar] [CrossRef]
- Simbauranga, R.H.; Kamugisha, E.; Hokororo, A.; Kidenya, B.R.; Makani, J. Prevalence and factors associated with severe anaemia amongst under-five children hospitalized at Bugando Medical Centre, Mwanza, Tanzania. BMC Hematol. 2015, 15, 13. [Google Scholar] [CrossRef]
- Sherer, M.L.; Posillico, C.K.; Schwarz, J.M. The psychoneuroimmunology of pregnancy. Front. Neuroendocrinol. 2018, 51, 25–35. [Google Scholar] [CrossRef]
- Willilo, R.A. Pregnant women and infants as sentinel populations to monitor prevalence of malaria: Results of pilot study in Lake Zone of Tanzania. Malar. J. 2016, 15, 392. [Google Scholar] [CrossRef] [PubMed]
- Morakinyo, O.M.; Balogun, F.M.; Fagbamigbe, A.F. Housing type and risk of malaria among under-five children in Nigeria: Evidence from the malaria indicator survey. Malar. J. 2018, 17, 311. [Google Scholar] [CrossRef] [PubMed]
- Dube, B.; Mberikunashe, J.; Dhliwayo, P.; Tangwena, A.; Shambira, G.; Chimusoro, A.; Madinga, M.; Gambinga, B. How far is the journey before malaria is knocked out in Zimbabwe: Results of the malaria indicator survey 2016. Malar. J. 2019, 18, 171. [Google Scholar] [CrossRef] [PubMed]
- Builder, M.I.; Anzaku, S.A.; Joseph, S.O. Effectiveness of intermittent preventive treatment in pregnancy with sulphadoxine-pyrimethamine against malaria in Northern Nigeria. Int. J. Recent Sci. Res. 2019, 10, 32295–32299. [Google Scholar]
- Okethwangu, D.; Opigo, J.; Atugonza, S.; Kizza, C.T.; Nabatanzi, M.; Biribawa, C.; Kyabayinze, D.; Ario, A.R. Factors associated with uptake of optimal doses of intermittent preventive treatment for malaria among pregnant women in Uganda: Analysis of data from the Uganda Demographic and Health Survey, 2016. Malar. J. 2019, 18, 250. [Google Scholar] [CrossRef] [PubMed]
- Adeola, A.; Ncongwane, K.; Abiodun, G.; Makgoale, T.; Rautenbach, H.; Botai, J.; Adisa, O.; Botai, C. Rainfall Trends and Malaria Occurrences in Limpopo Province, South Africa. Int. J. Environ. Res. Public Health. 2019, 16, 5156. [Google Scholar] [CrossRef] [PubMed]
- Shimaponda-Mataa, N.M.; Tembo-Mwase, E.; Gebreslasie, M.; Achia, T.N.; Mukaratirwa, S. Modelling the influence of temperature and rainfall on malaria incidence in four endemic provinces of Zambia using semiparametric Poisson regression. Acta Trop. 2017, 166, 81–91. [Google Scholar] [CrossRef]
- Okunlola, O.A.; Oyeyemi, O.T. Spatio-temporal analysis of association between incidence of malaria and environmental predictors of malaria transmission in Nigeria. Sci. Rep. 2019, 9, 1–11. [Google Scholar] [CrossRef]
- Rouamba, T.; Nakanabo-Diallo, S.; Derra, K.; Rouamba, E.; Kazienga, A.; Inoue, Y.; Ouedraogo, E.K.; Waongo, M.; Dieng, S.; Guindo, A.; Ouédraogo, B. Socioeconomic and environmental factors associated with malaria hotspots in the Nanoro demographic surveillance area, Burkina Faso. BMC Public Health 2019, 19, 249. [Google Scholar] [CrossRef]
- Yunta, C.; Hemmings, K.; Stevenson, B.; Koekemoer, L.L.; Matambo, T.; Pignatelli, P.; Voice, M.; Nász, S.; Paine, M.J. Cross-resistance profiles of malaria mosquito P450s associated with pyrethroid resistance against WHO insecticides. Pestic. Biochem. Physiol. 2019, 161, 61–67. [Google Scholar] [CrossRef]
- Thiaw, O.; Doucoure, S.; Sougoufara, S.; Bouganali, C.; Konate, L.; Diagne, N.; Faye, O.; Sokhna, C. Investigating insecticide resistance and knock-down resistance (kdr) mutation in Dielmo, Senegal, an area under long lasting insecticidal-treated nets universal coverage for 10 years. Malar. J. 2018, 17, 123. [Google Scholar] [CrossRef] [PubMed]
- Lynd, A.; Oruni, A.; van’t Hof, A.E.; Morgan, J.C.; Naego, L.B.; Pipini, D.; O’Kines, K.A.; Bobanga, T.L.; Donnelly, M.J.; Weetman, D. Insecticide resistance in Anopheles gambiae from the northern Democratic Republic of Congo, with extreme knockdown resistance (kdr) mutation frequencies revealed by a new diagnostic assay. Malar. J. 2018, 17, 1–8. [Google Scholar] [CrossRef] [PubMed]
- White, N.J. Anaemia and malaria. Malar. J. 2018, 17, 371. [Google Scholar] [CrossRef] [PubMed]
- Jasani, S. Using a one health approach can foster collaboration through transdisciplinary teaching. Med. Teach. 2019, 41, 839–841. [Google Scholar] [CrossRef]
- Burkot, T.R.; Bugoro, H.; Apairamo, A.; Cooper, R.D.; Echeverry, D.F.; Odabasi, D.; Beebe, N.W.; Makuru, V.; Xiao, H.; Davidson, J.R.; Deason, N.A. Spatial-temporal heterogeneity in malaria receptivity is best estimated by vector biting rates in areas nearing elimination. Parasites Vectors. 2018, 11, 606. [Google Scholar] [CrossRef]
- Getachew, D.; Gebre-Michael, T.; Balkew, M.; Tekie, H. Species composition, blood meal hosts and Plasmodium infection rates of Anopheles mosquitoes in Ghibe River Basin, southwestern Ethiopia. Parasites Vectors 2019, 12, 257. [Google Scholar] [CrossRef]
- Agrawal, R.; Srikant, R. Fast algorithms for mining association rules in large databases. VLDB’94: Proceedings of the 20th International Conference on Very Large Data Bases. San Francisco, CA, USA. 1994; pp. 487–499.
- Ai, D.; Pan, H.; Li, X.; Gao, Y.; He, D. Association rule mining algorithms on high-dimensional datasets. Artif. Life Robotics. 2018, 23, 420–427. [Google Scholar] [CrossRef]
- Zhang, C.; Chen, Y.; Yang, J.; Yin, Z. An association rule based approach to reducing visual clutter in parallel sets. Vis. Informatics. 2019, 3, 48–57. [Google Scholar] [CrossRef]
- Hegland, M. The Apriori algorithm–a tutorial. Mathematics and computation in imaging science and information processing;
- Baffour, K.A.; Osei-Bonsu, C.; Adekoya, A.F. A modified apriori algorithm for fast and accurate generation of frequent item sets. Int. J. Sci. Technol. Research. 2017, 6, 169–173. [Google Scholar]
- Huang, L.; Chen, H.; Wang, X.; Chen, G. A fast algorithm for mining association rules. J. Comput. Sci. Technol. 2000, 15, 619–624. [Google Scholar] [CrossRef]
- Yu, H.; Wen, J.; Wang, H.; Jun, L. An improved Apriori algorithm based on the Boolean matrix and Hadoop. Procedia Eng. 2011, 15, 1827–1831. [Google Scholar] [CrossRef]
- Niu, K.; Jiao, H.; Gao, Z.; Chen, C.; Zhang, H. A developed apriori algorithm based on frequent matrix. In Proceedings of the 5th international conference on bioinformatics and computational biology. 2017, 5, 55–58. [Google Scholar]
- Li, J. , Sun, F., Hu, X., Wei, W. A multi-GPU implementation of apriori algorithm for mining association rules in medical data. ICIC Express Letters. 2015, 9, 1303–1310. [Google Scholar]
- Liu, X.; Zhao, Y.; Sun, M. An improved Apriori algorithm based on an evolution-communication tissue-like P system with promoters and inhibitors. Discret. Dyn. Nat. Society. 2017, 6978146, 1–12. [Google Scholar] [CrossRef]
- Yuan, X. An improved Apriori algorithm for mining association rules. AIP Conf. Proc. 2017, 1820, 080005. [Google Scholar]
- Okorie, P.N.; McKenzie, F.E.; Ademowo, O.G.; Bockarie, M.; Kelly-Hope, L. Nigeria Anopheles vector database: An overview of 100 years’ research. PLoS ONE 2011, 6, 1–16. [Google Scholar] [CrossRef] [PubMed]
- Sunderland, K.M.; Beaton, D.; Fraser, J.; Kwan, D.; McLaughlin, P.M.; Montero-Odasso, M.; Peltsch, A.J.; Pieruccini-Faria, F.; Sahlas, D.J.; Swartz, R.H.; Strother, S.C. The utility of multivariate outlier detection techniques for data quality evaluation in large studies: An application within the ONDRI project. BMC Med. Res. Methodol. 2019, 19, 102. [Google Scholar] [CrossRef] [PubMed]
Figure 1.
The Basic Flow Chart of the Proposed E_Apriori Algorithm.
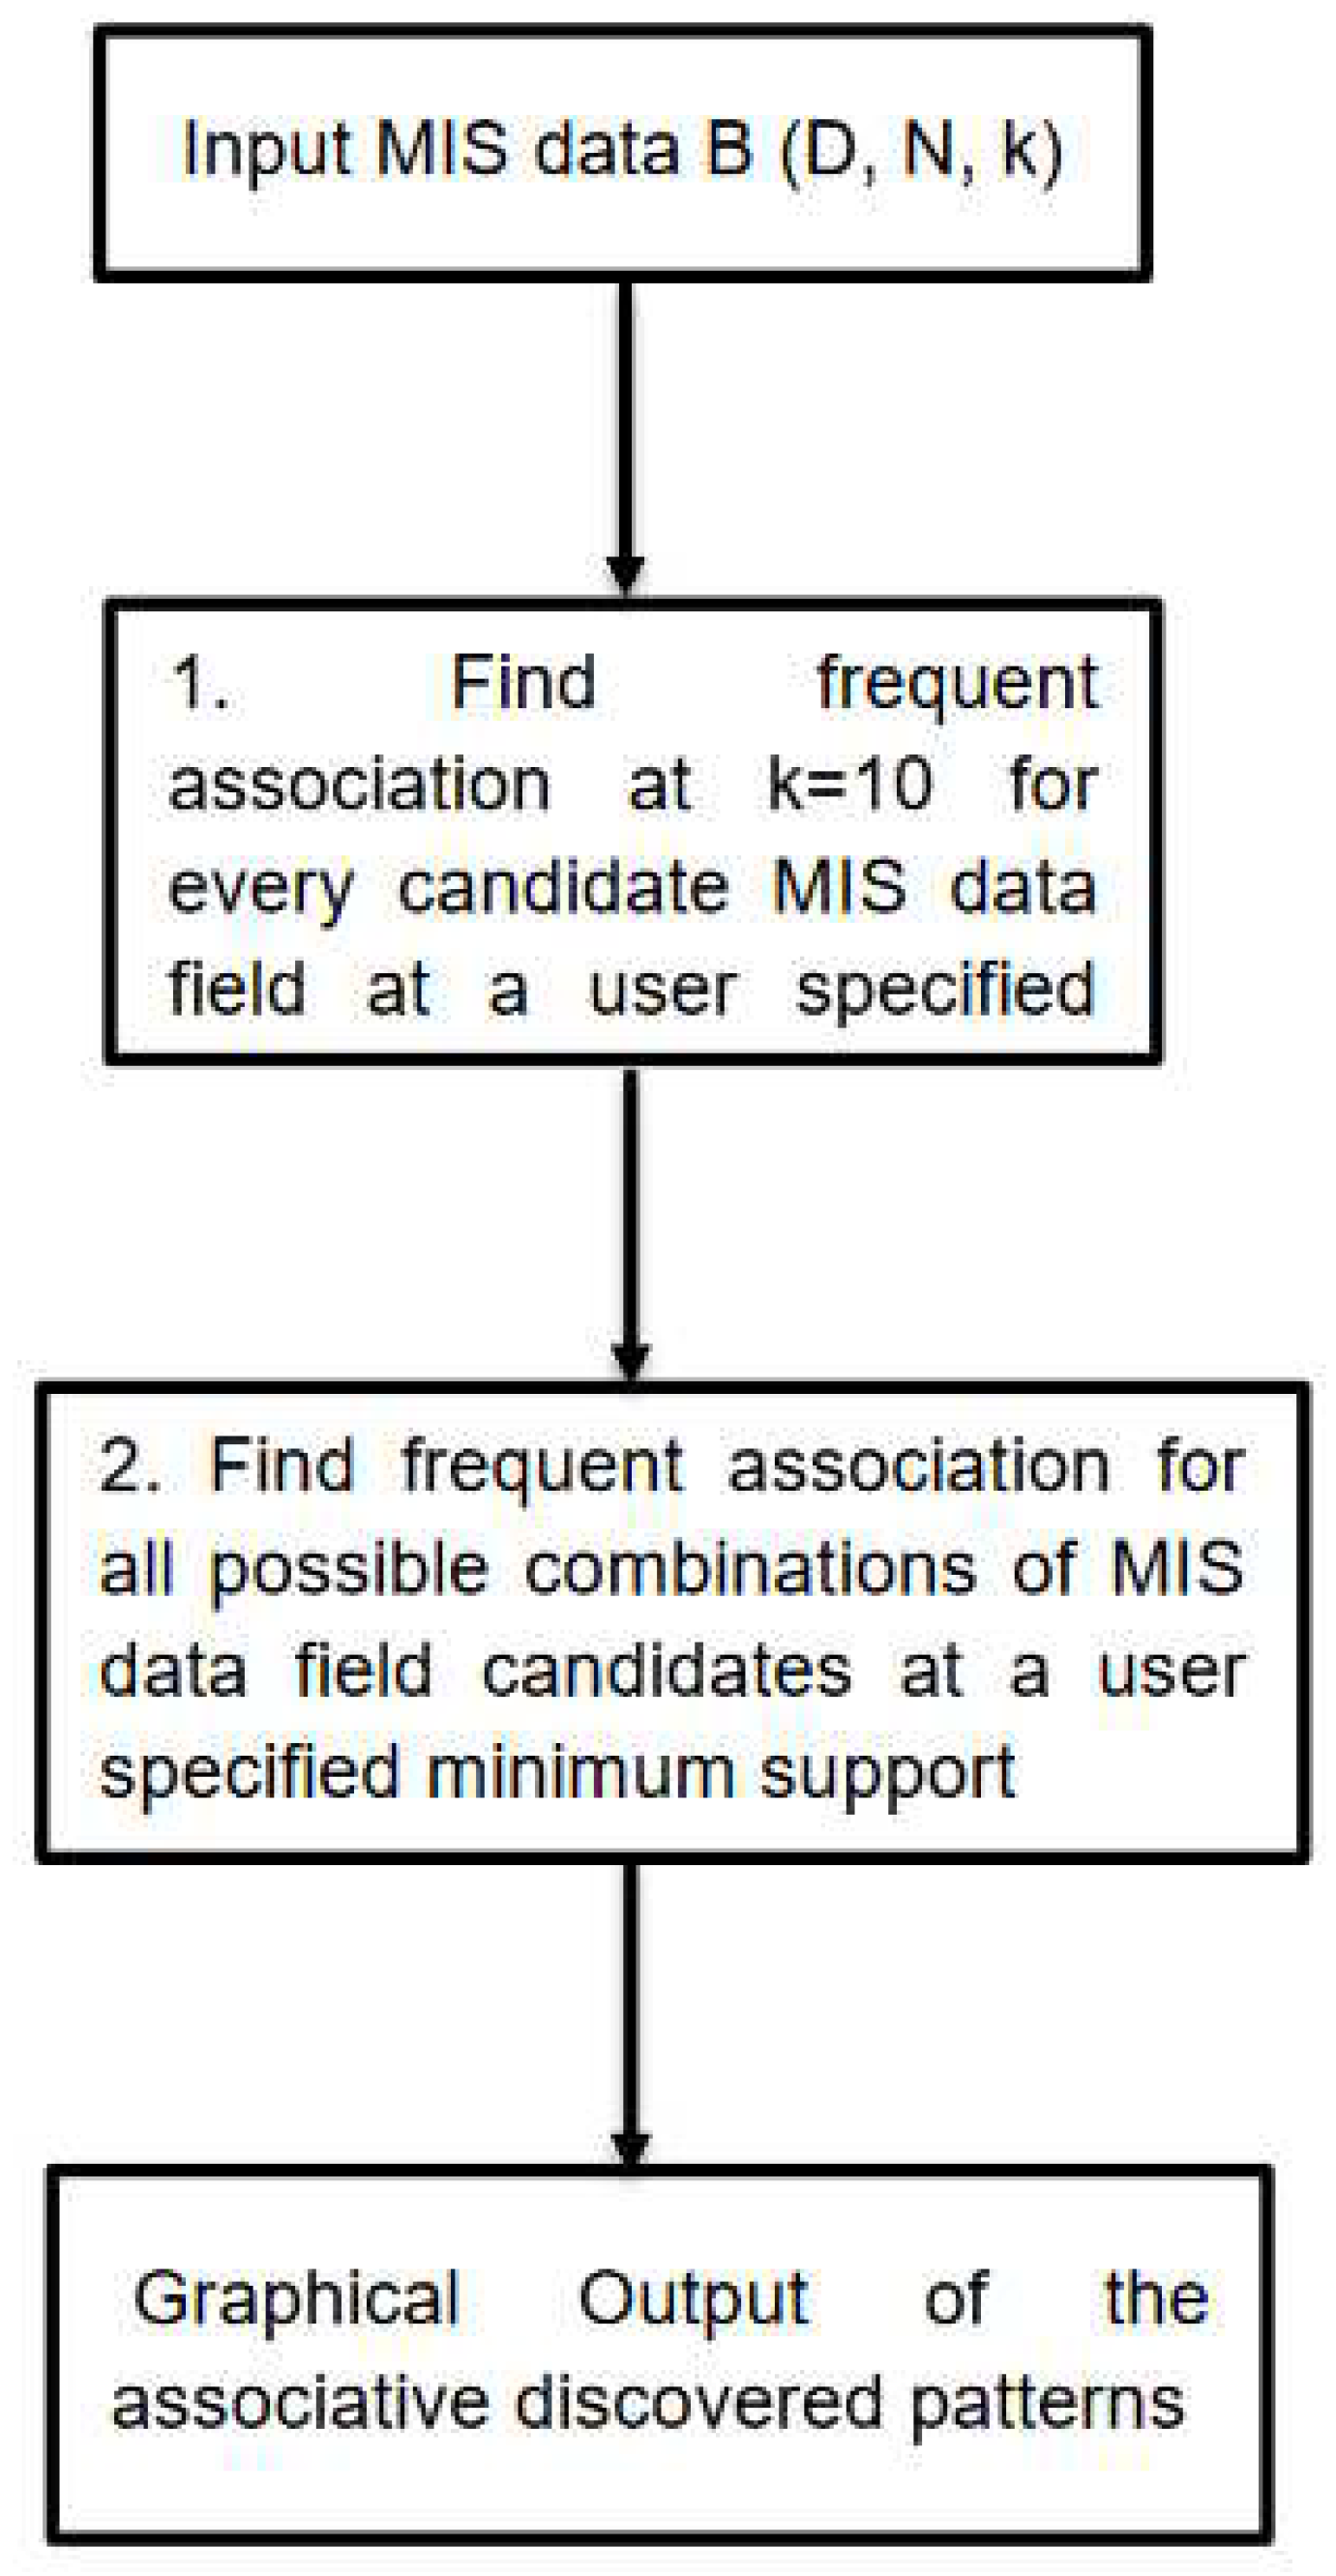
Figure 2.
Average algorithmic time-complexity comparative performance evaluation.
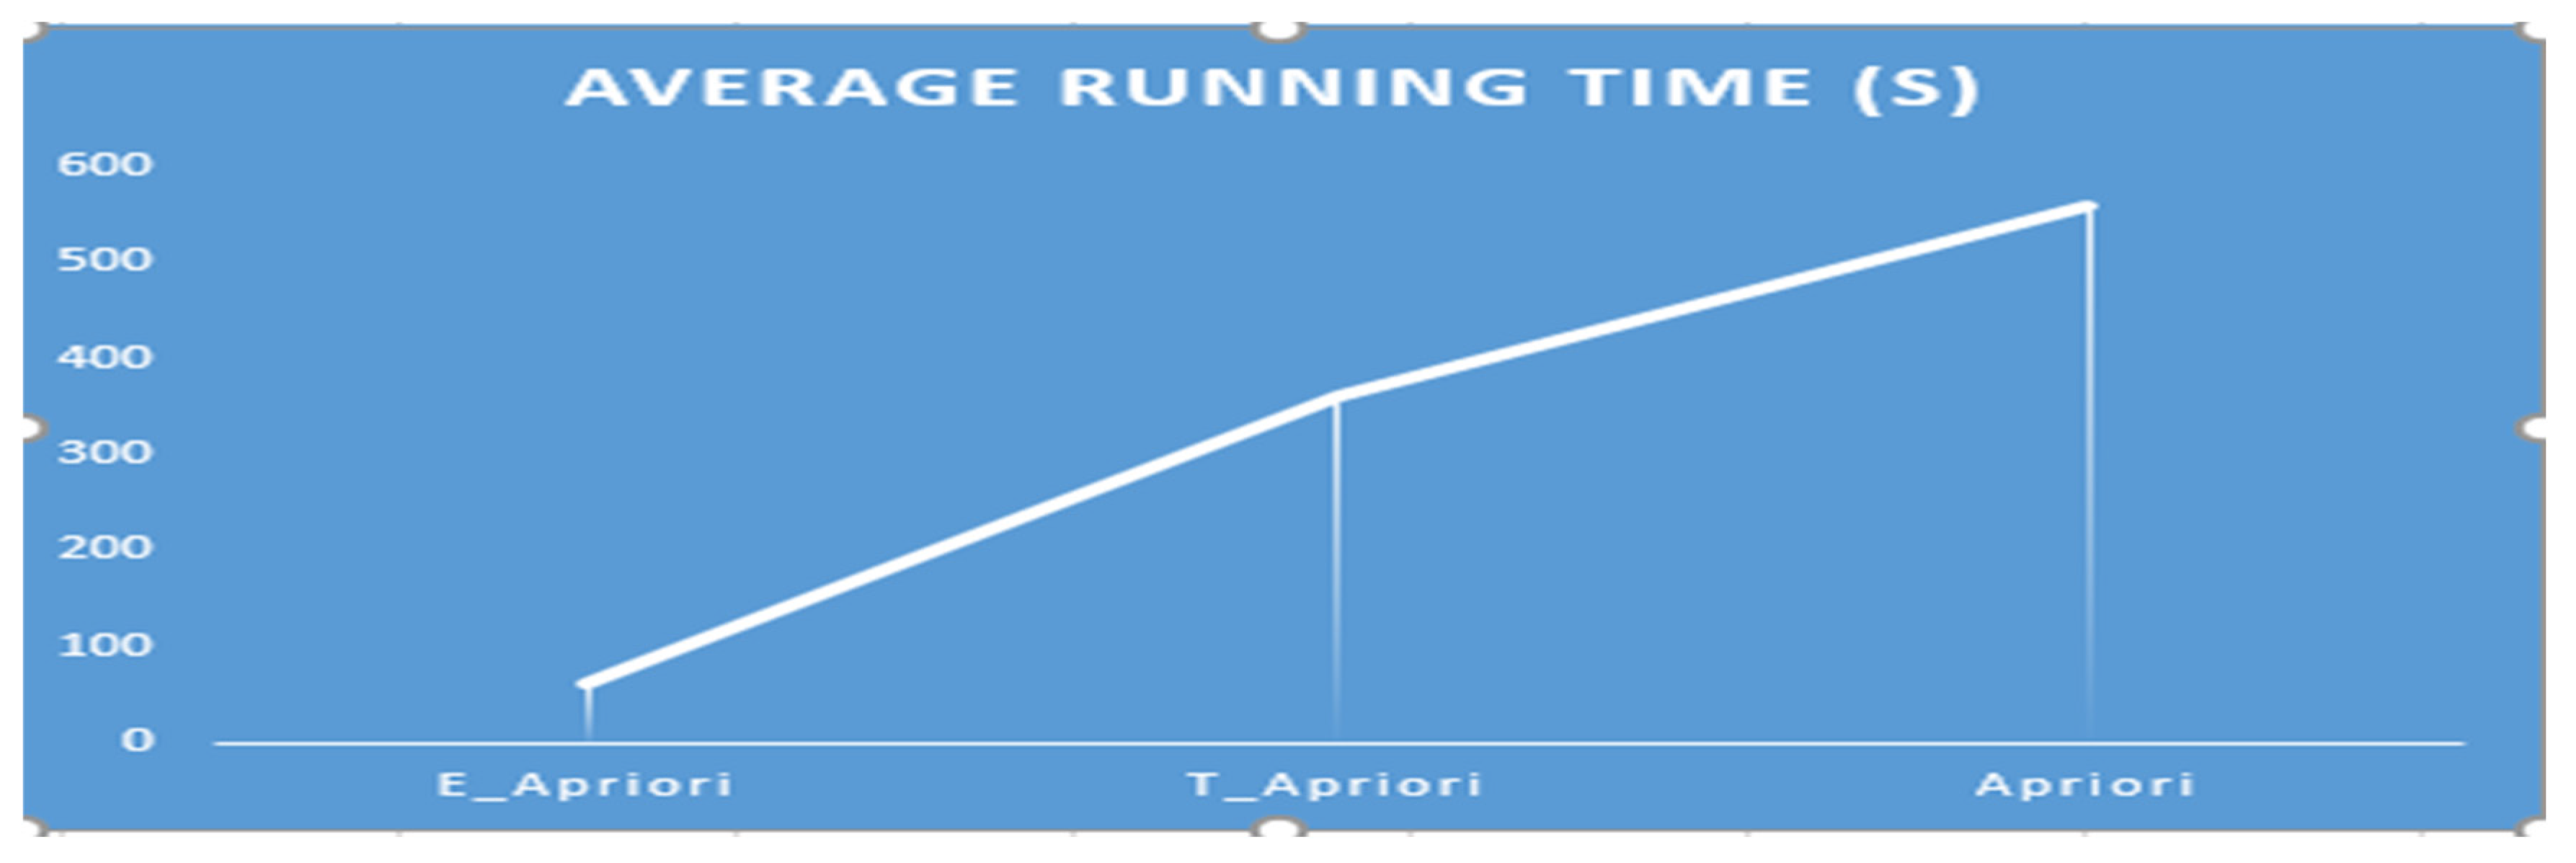
Figure 3.
Association between the Anemia and Wealth Indices.
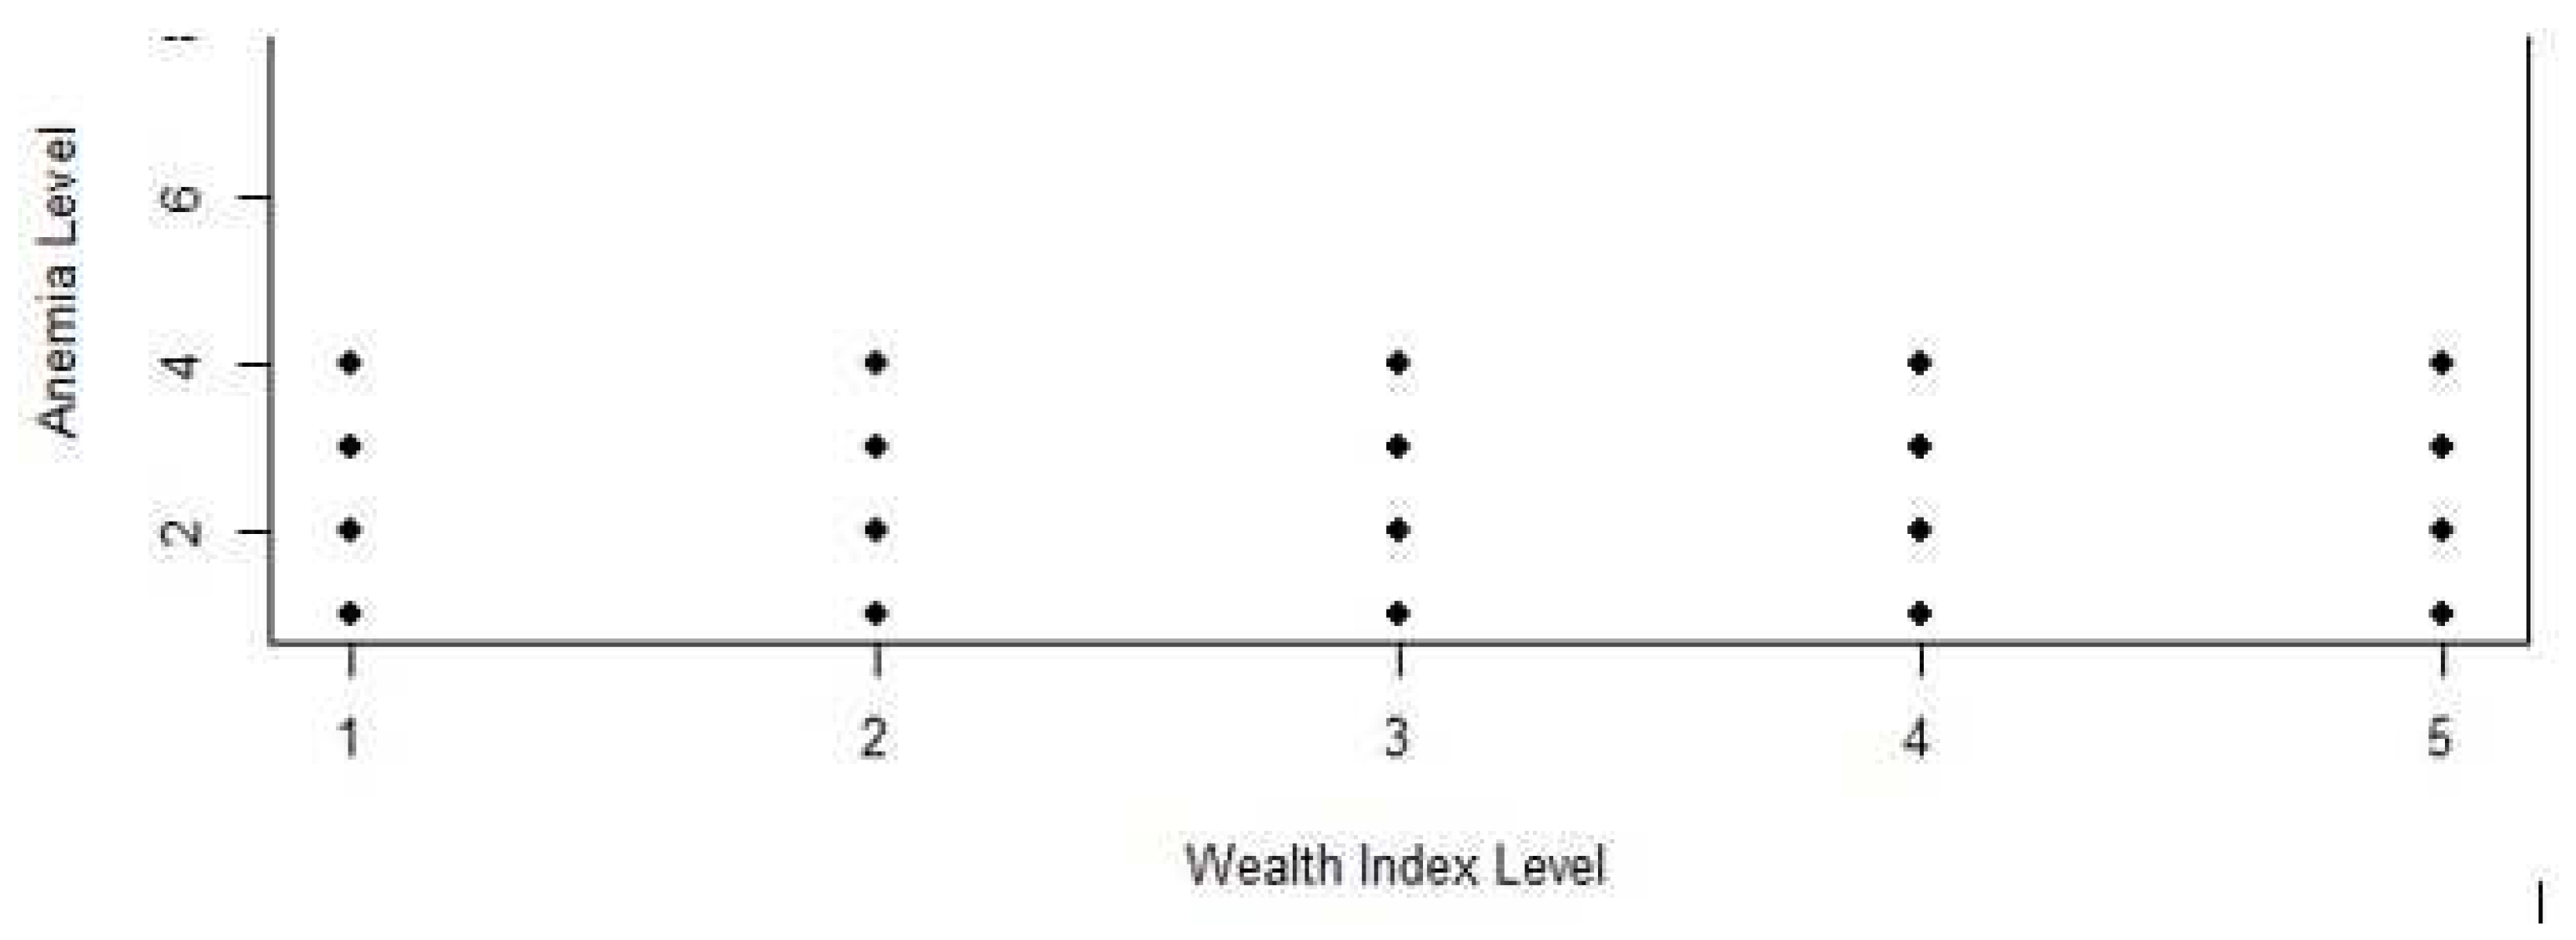
Figure 4.
Association between Anemia Level and Accepted Malaria Treatment.
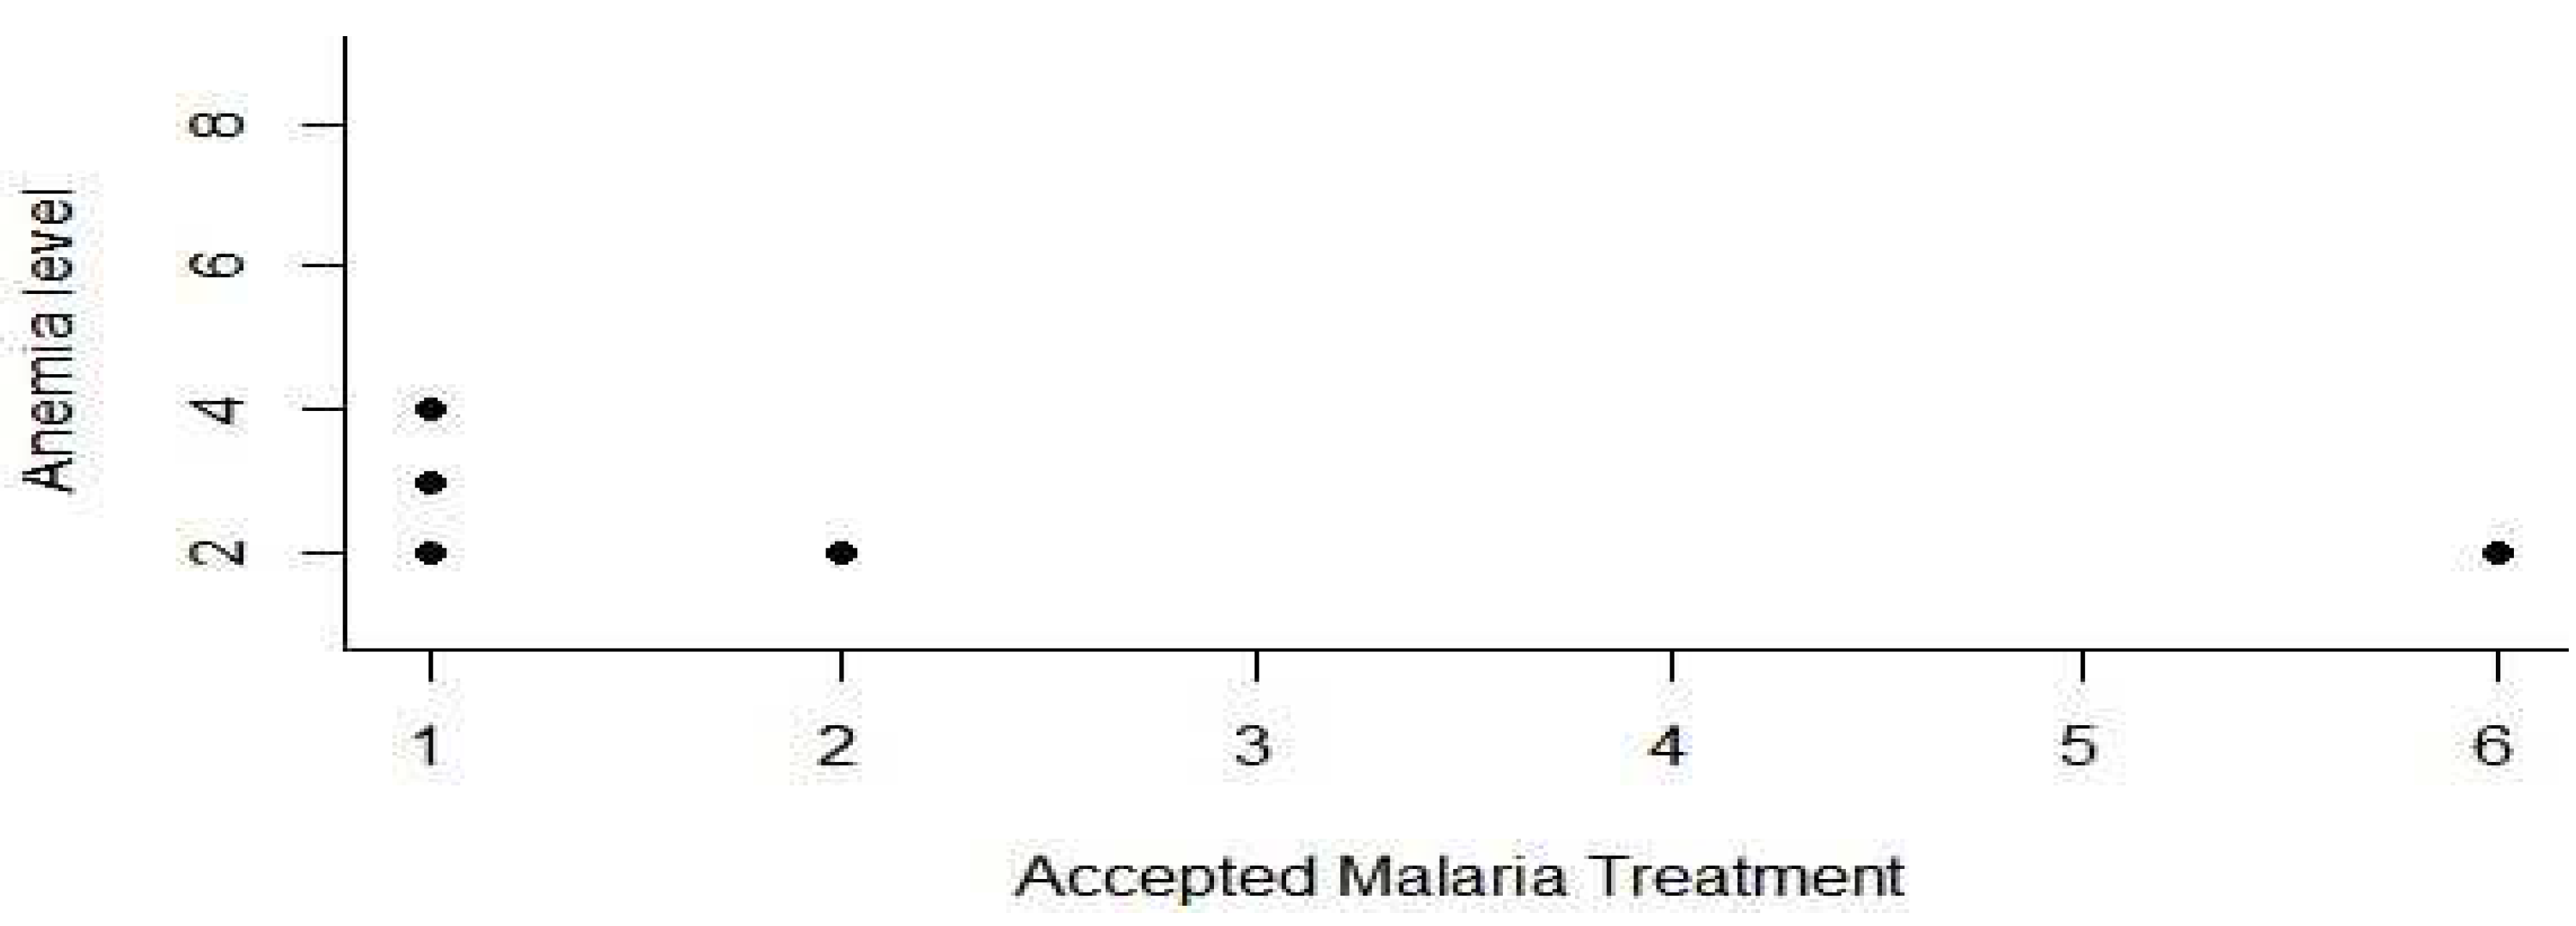
Figure 5.
Association between insecticide resistance and kdr allele presence.
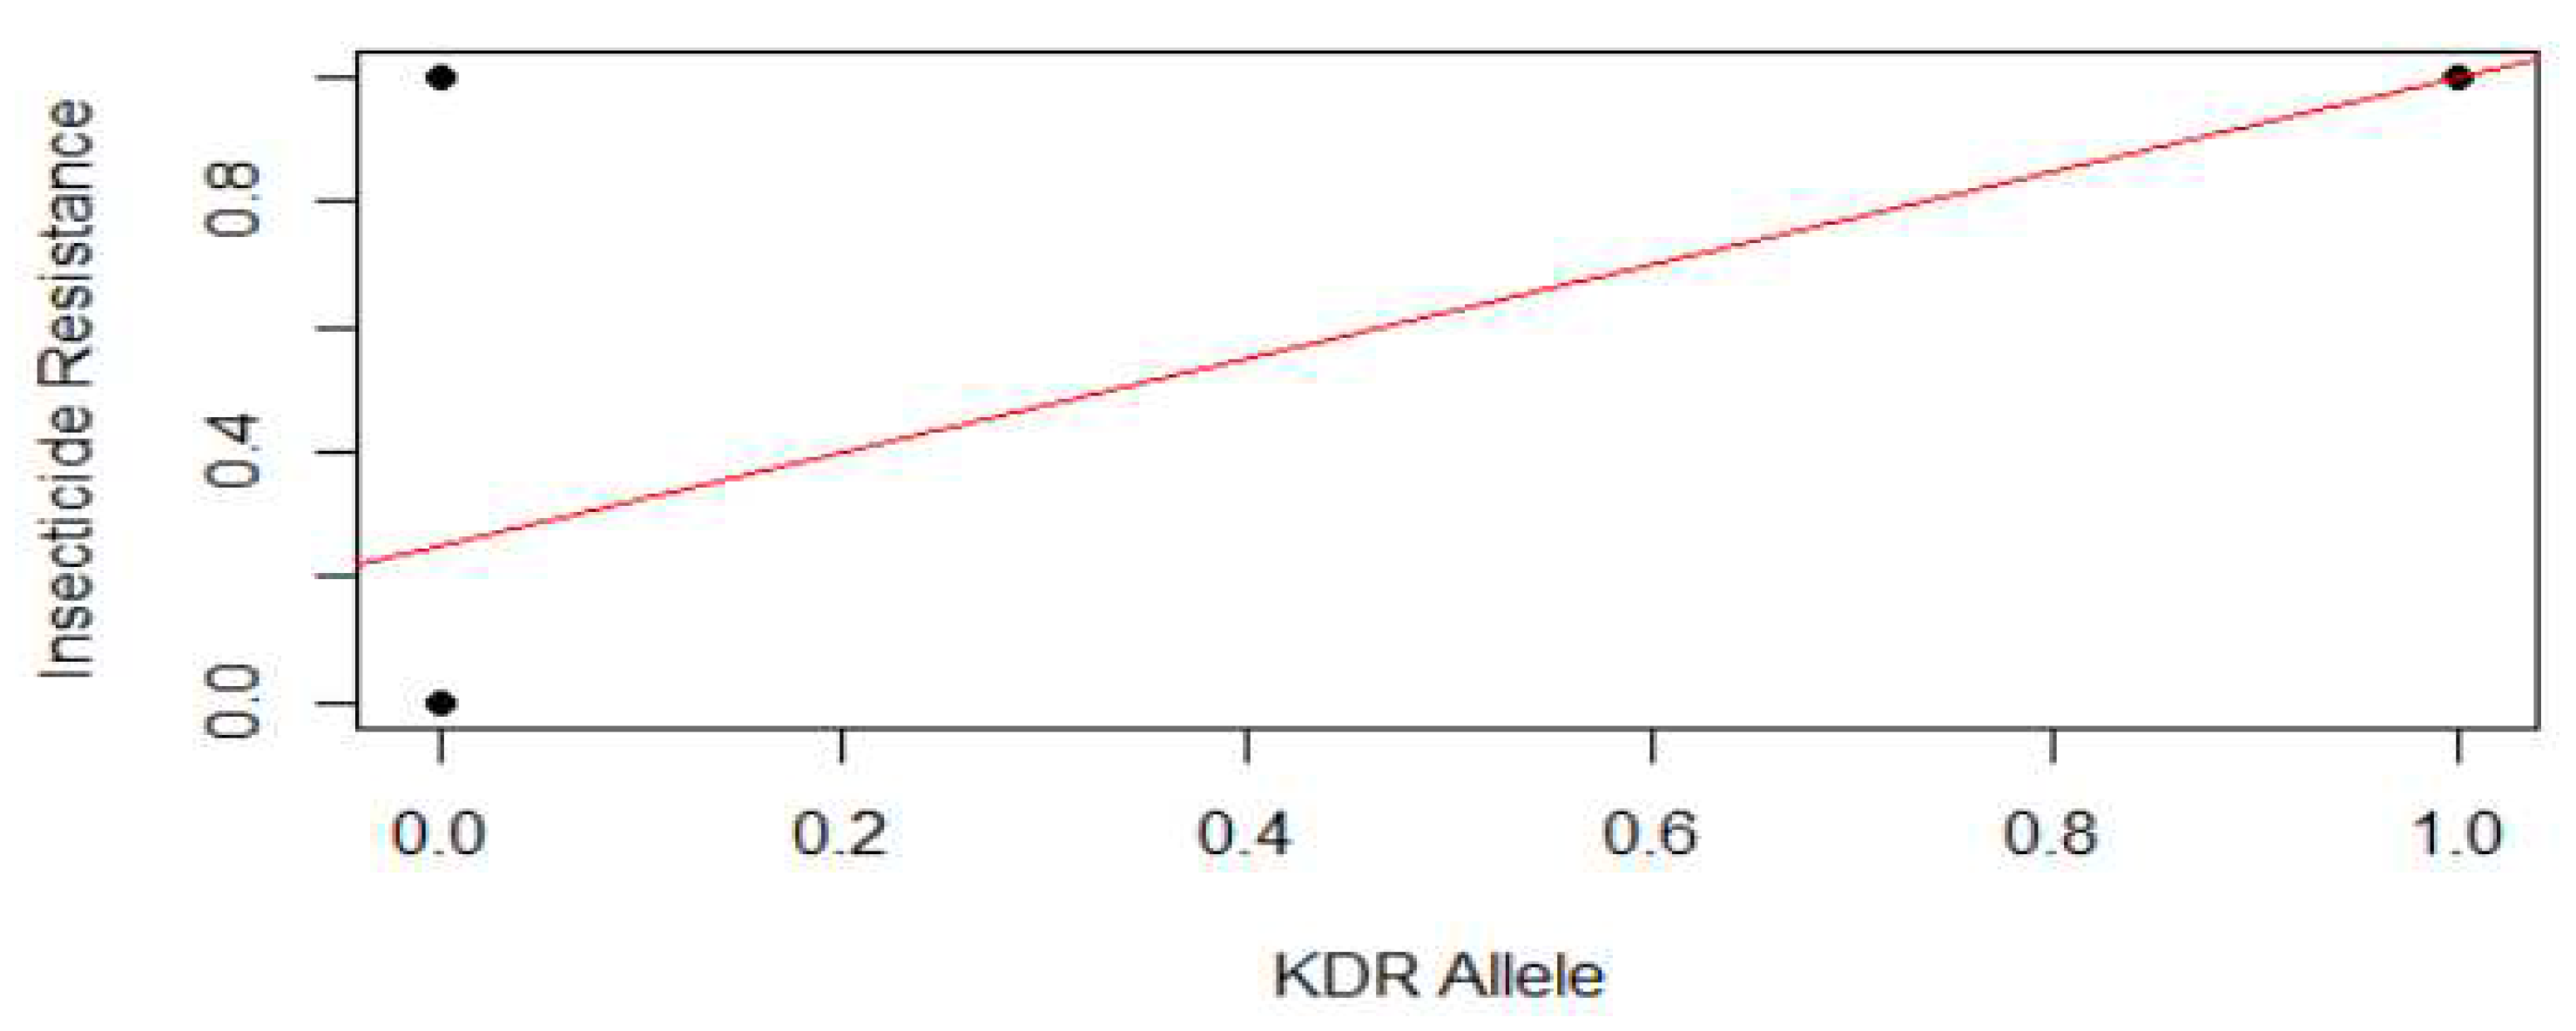
Figure 6.
Association between the Sporozoite rate and the number of Malarial Mosquitoes.

Table 1.
Asymptotic Time Complexity Comparative Performance Evaluation of E_Apriori Algorithms against existing Apriori Algorithms.
Table 1.
Asymptotic Time Complexity Comparative Performance Evaluation of E_Apriori Algorithms against existing Apriori Algorithms.
| Time Taken by Other Known Apriori Algorithms | Time Taken by the Novel E_Apriori Algorithm | References |
|---|---|---|
| O(Dk2) | O(k−2) | [31,32] |
| O(Dk) | O(k−2) | [33,34] |
| O (Dk|𝐶𝑘| + t |𝐿𝑘−1||𝐿𝑘−1|) | O(k−2) | [28] |
| O(D-k2) | O(k−2) | [35] |
| O(k|𝐿𝑘−1||𝐿𝑘−1|) | O(k−2) | [36] |
| O(k) | O(k−2) | [37] |
Disclaimer/Publisher’s Note: The statements, opinions and data contained in all publications are solely those of the individual author(s) and contributor(s) and not of MDPI and/or the editor(s). MDPI and/or the editor(s) disclaim responsibility for any injury to people or property resulting from any ideas, methods, instructions or products referred to in the content. |
© 2023 by the authors. Licensee MDPI, Basel, Switzerland. This article is an open access article distributed under the terms and conditions of the Creative Commons Attribution (CC BY) license (http://creativecommons.org/licenses/by/4.0/).
Copyright: This open access article is published under a Creative Commons CC BY 4.0 license, which permit the free download, distribution, and reuse, provided that the author and preprint are cited in any reuse.
MDPI Initiatives
Important Links
© 2024 MDPI (Basel, Switzerland) unless otherwise stated


