1. Introduction
As of 2022, the total length of China’s expressways has reached 177,300 kilometers. However, many sections have varying degrees of rutting damage, especially on special sections. Modified asphalt has been used since the 1990s and is now widely used. However, there is no complete standard for the use of modified asphalt. In actual engineering, it is often based on engineering experience [
1]. Using one modified mode for the entire section will result in significant differences in rutting control for different road conditions. Therefore, it is necessary to conduct research on rutting balance control to better play the role of modified asphalt, effectively improve the mechanical response of special road sections and reduce rutting damage [
2]. The ultimate goal is to achieve rutting balance control for the entire section.
Foreign research on modified asphalt started earlier. However, in developed countries abroad, there are more small cars and less overloading. Therefore, early premature damage rarely occurs [
3]. However, there is little research on special sections (such as small radius curves, large longitudinal slopes, harsh temperatures and overloading), which are prone to early damage due to their severe mechanical response. According to the research conducted by Raab [
4], a Swiss scholar, the interlayer condition is significantly influenced by various factors, with temperature and load having a substantial impact. It was observed that the shear strength, as an indicator, experiences a sharp decline due to these factors. Yang Jun et al[
5] analyzed the distribution law of interlayer shear stress under axial load and different slope degrees based on Abaqus and found that the surface layer has the largest shear stress and is most prone to rutting. Cao Yang [
6] used viscoelastic theory to establish a three-dimensional model using Ansys to analyze the mechanical response of different slope degrees and radius combinations. The results showed that as the slope degree increased or the radius of horizontal curves decreased, bending deformation and shear stress at the surface layer and bottom layer increased Li Fuhai et al. [
7] conducted an analysis of coarse aggregates in recycled concrete and established an evaluation model based on the combination weight-extensibility theory to classify the recycled aggregates.. However, domestic research mainly focuses on material comparison. There are no mature methods or systematic design specifications for modified asphalt design methods and special section design [
8,
9]. Therefore, it is necessary to study the mechanical response of special road sections [
10], propose reasonable modification methods to guide actual engineering design, balance control road surface diseases and improve overall service life [
11].
Therefore, this paper uses Abaqus to establish a three-dimensional model to systematically calculate the mechanical response of each layer for different working conditions. It analyzes the mechanical response of road surfaces under different working conditions and proposes modification suggestions for different working conditions. It establishes a matching relationship between reasonable modified asphalt pavement and different force conditions in actual engineering design to lay a foundation for providing scientific and reasonable modified asphalt methods for different road sections under different force conditions in actual engineering design.
2. Methods
2.1. Calculation Model Establishment
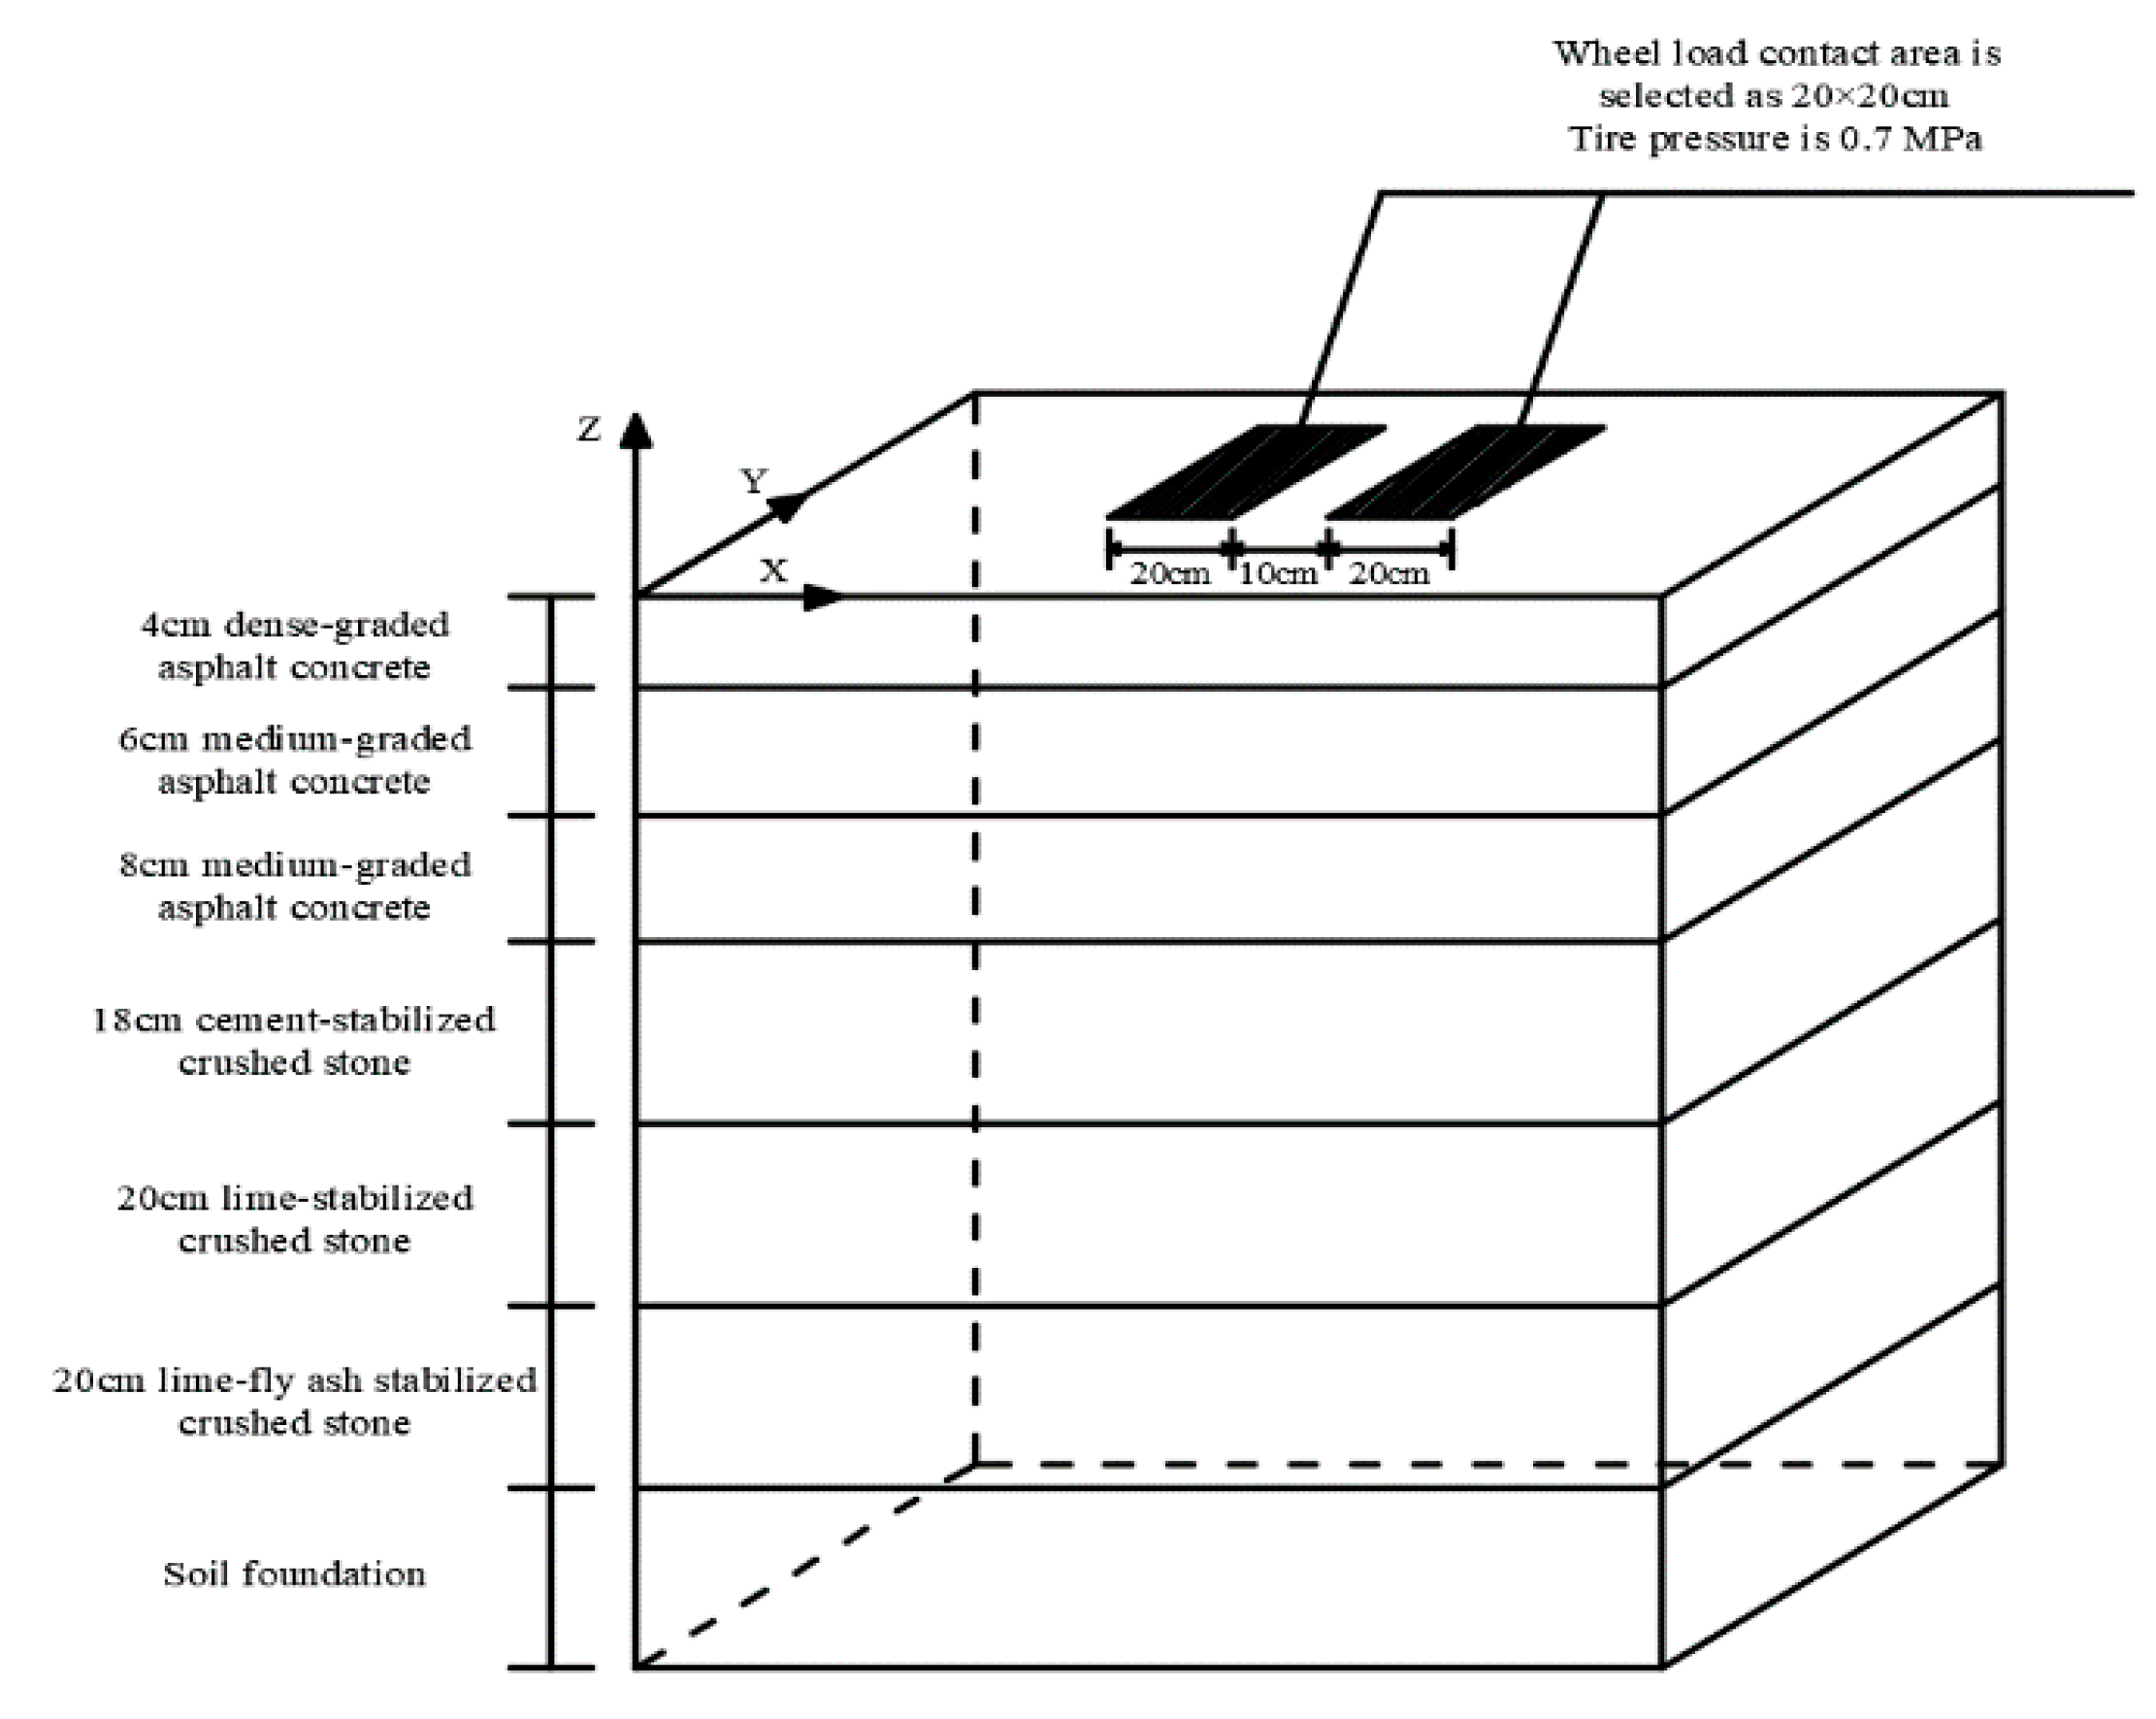
According to the project on which this paper is based, the thickness of the upper, middle and lower layers of the asphalt pavement structure is 4cm+6cm+8cm. The specific material calculation parameters are shown in
Table 1. The Poisson’s ratio of the material is 0.25. The calculation model is established according to the design parameters of the high-speed road section on which it is based, as shown in
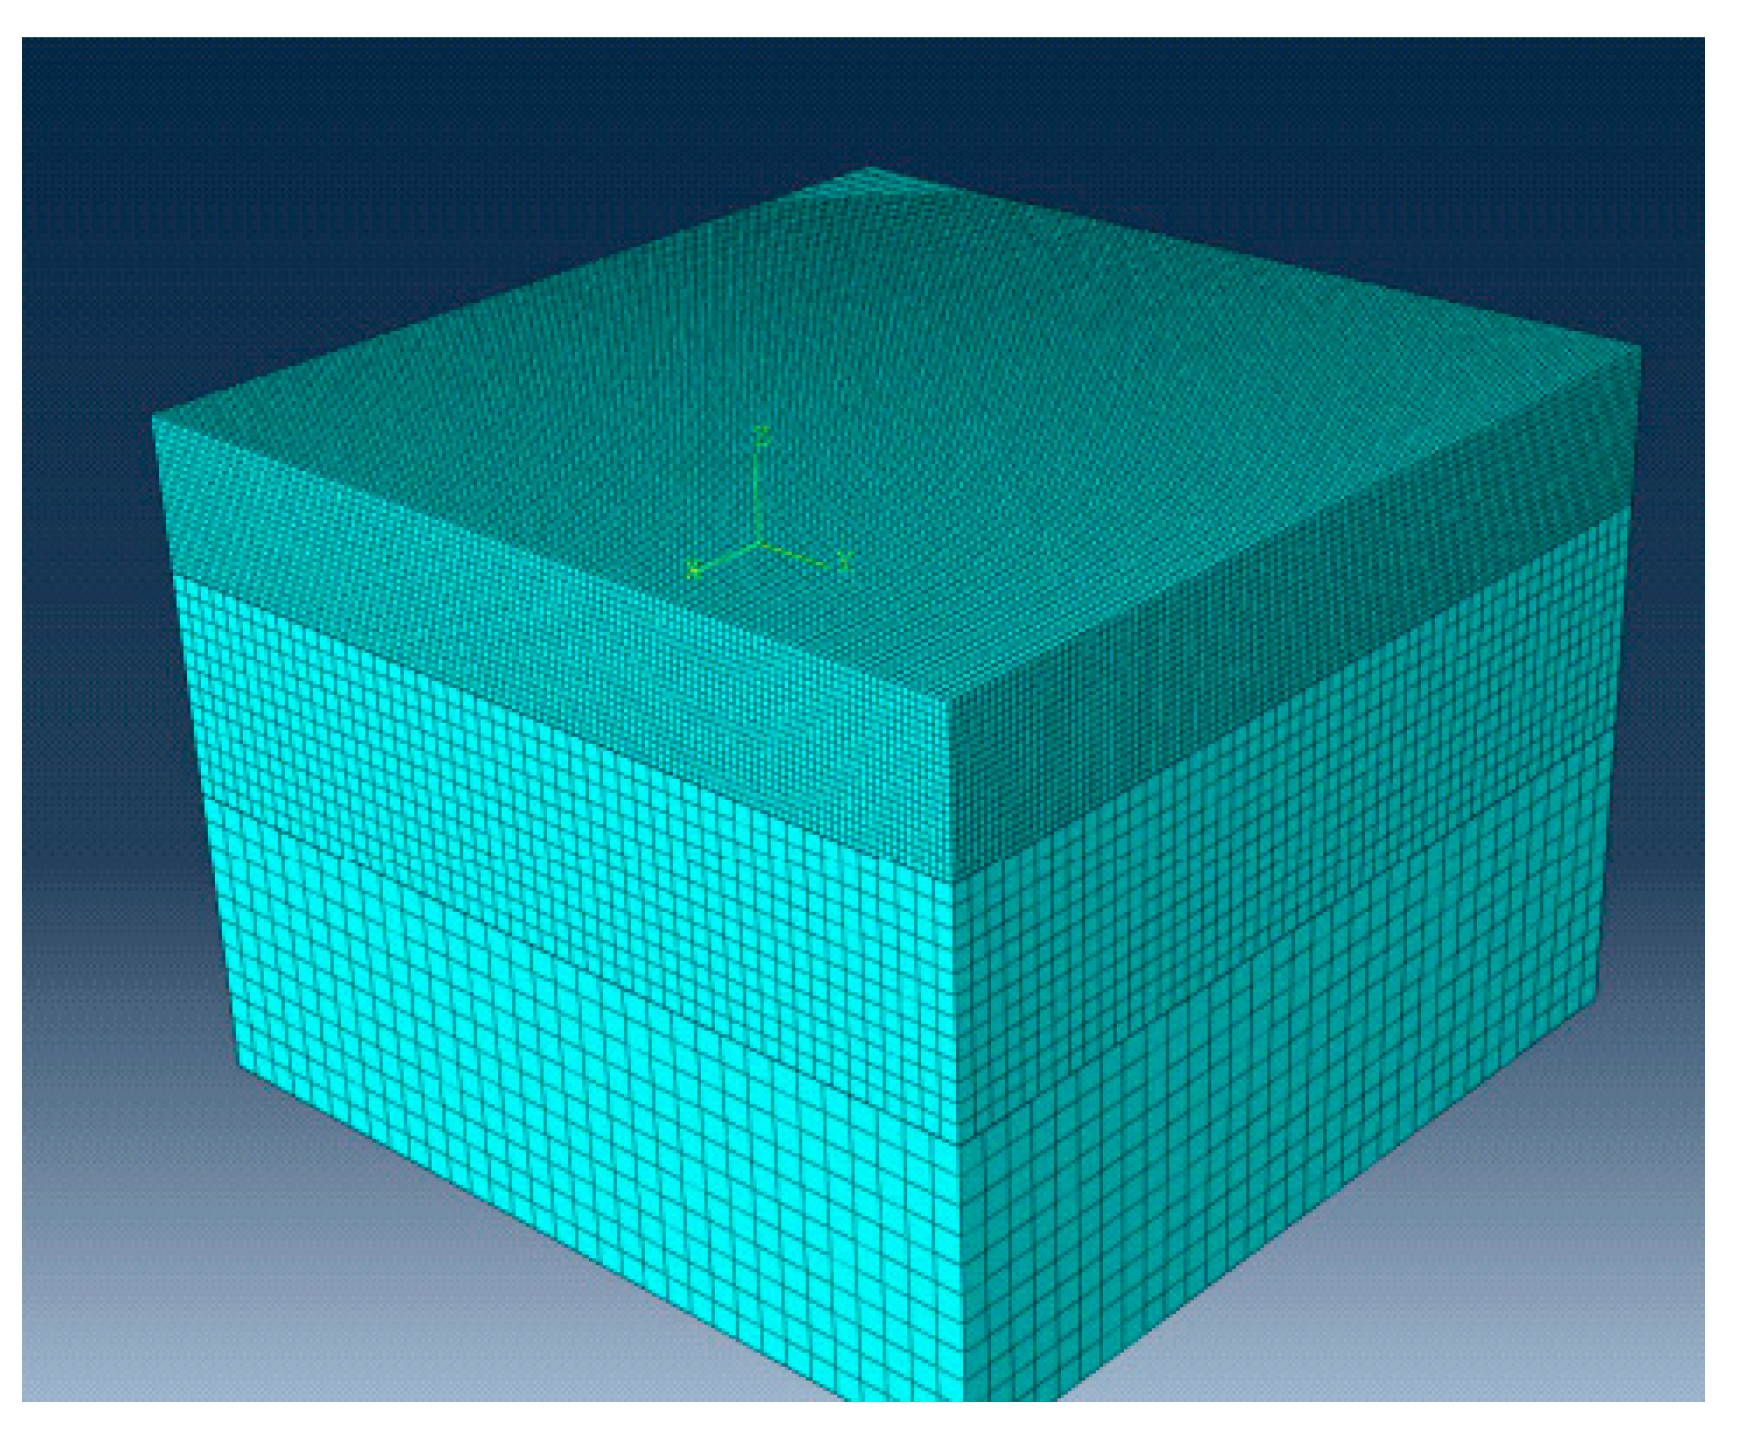
Figure 1. In order to make the calculation converge and meet the calculation requirements, the model is based on the three axes X, Y and Z of the spatial rectangular coordinate system. Since there is basically no mechanical response at both ends, they are set as free ends. At the same time, the horizontal displacement in the longitudinal direction is constrained , and all displacements are constrained for the roadbed bottom part[
12,
13]. When analyzing stress, BZZ-100 standard axis load is used, and the double-circle uniformly distributed load acting area is equivalent to a rectangle with a size of 19.2cm×18.6cm. The distance between the centers of the double wheels is 31.4cm.
Figure 2 shows the finite element form used in the calculation, with a grid size of 0.04m and a maximum grid size of 0.4m at both ends. The grid of the loading part is densified. The uppermost layer bears the vehicle load, and the grid size gradually increases from top to bottom. The trial calculation results show that the accuracy of the results will be reduced compared with the infinite displacement of the elastic layered system, but it is closer to the actual deformation state of the road surface under stress. Therefore, this form is used to establish a three-dimensional model of the road surface using finite element software as shown in
Figure 2.
2.2. K-clustering analysis
Clustering analysis is a statistical method that classifies the research objects according to the characteristics of multiple aspects. In order to facilitate the description of the improved K-means algorithm, the data set to be clustered is set to equation (1)[
14]:
Z1,Z2,……,Zn are K clustering centers respectively; Wj(j=1,2,……,k) represents the K categories of the cluster. There are the following definitions :
Definition 1 :The Euclidean distance between two data is :
=()and =() are two n-dimensional data objects.
Definition 2 : The center point of the same class is:
In equation (3), nj is the number of the same kind of data.
Definition 3 : The objective function is:
Define 4 pairs of variables R and z to give specific values respectively. With any data point as the center, the point where the number of data contained in the hypersphere with R as the radius is greater than the value z is a high-density point, otherwise it is a low-density point.
The flow chart of the K-means algorithm is shown as follows :
Figure 3.
K-means clustering algorithm flow.
Figure 3.
K-means clustering algorithm flow.
K-means clustering analysis is used to evaluate the modification effect of asphalt mixture and analyze the modification effect of high-temperature stability and anti-fatigue performance of modified asphalt mixture. The classification process is implemented by K-means clustering in PASW Statistics18.0 software (formerly SPSS software) according to the current specification indicators for modified asphalt mixture and the investigation and analysis of different performance indicators of modified asphalt mixture.
3. Results and discussion
3.1. Mechanical response of asphalt pavement surface under different working conditions
3.1.1. Longitudinal slope
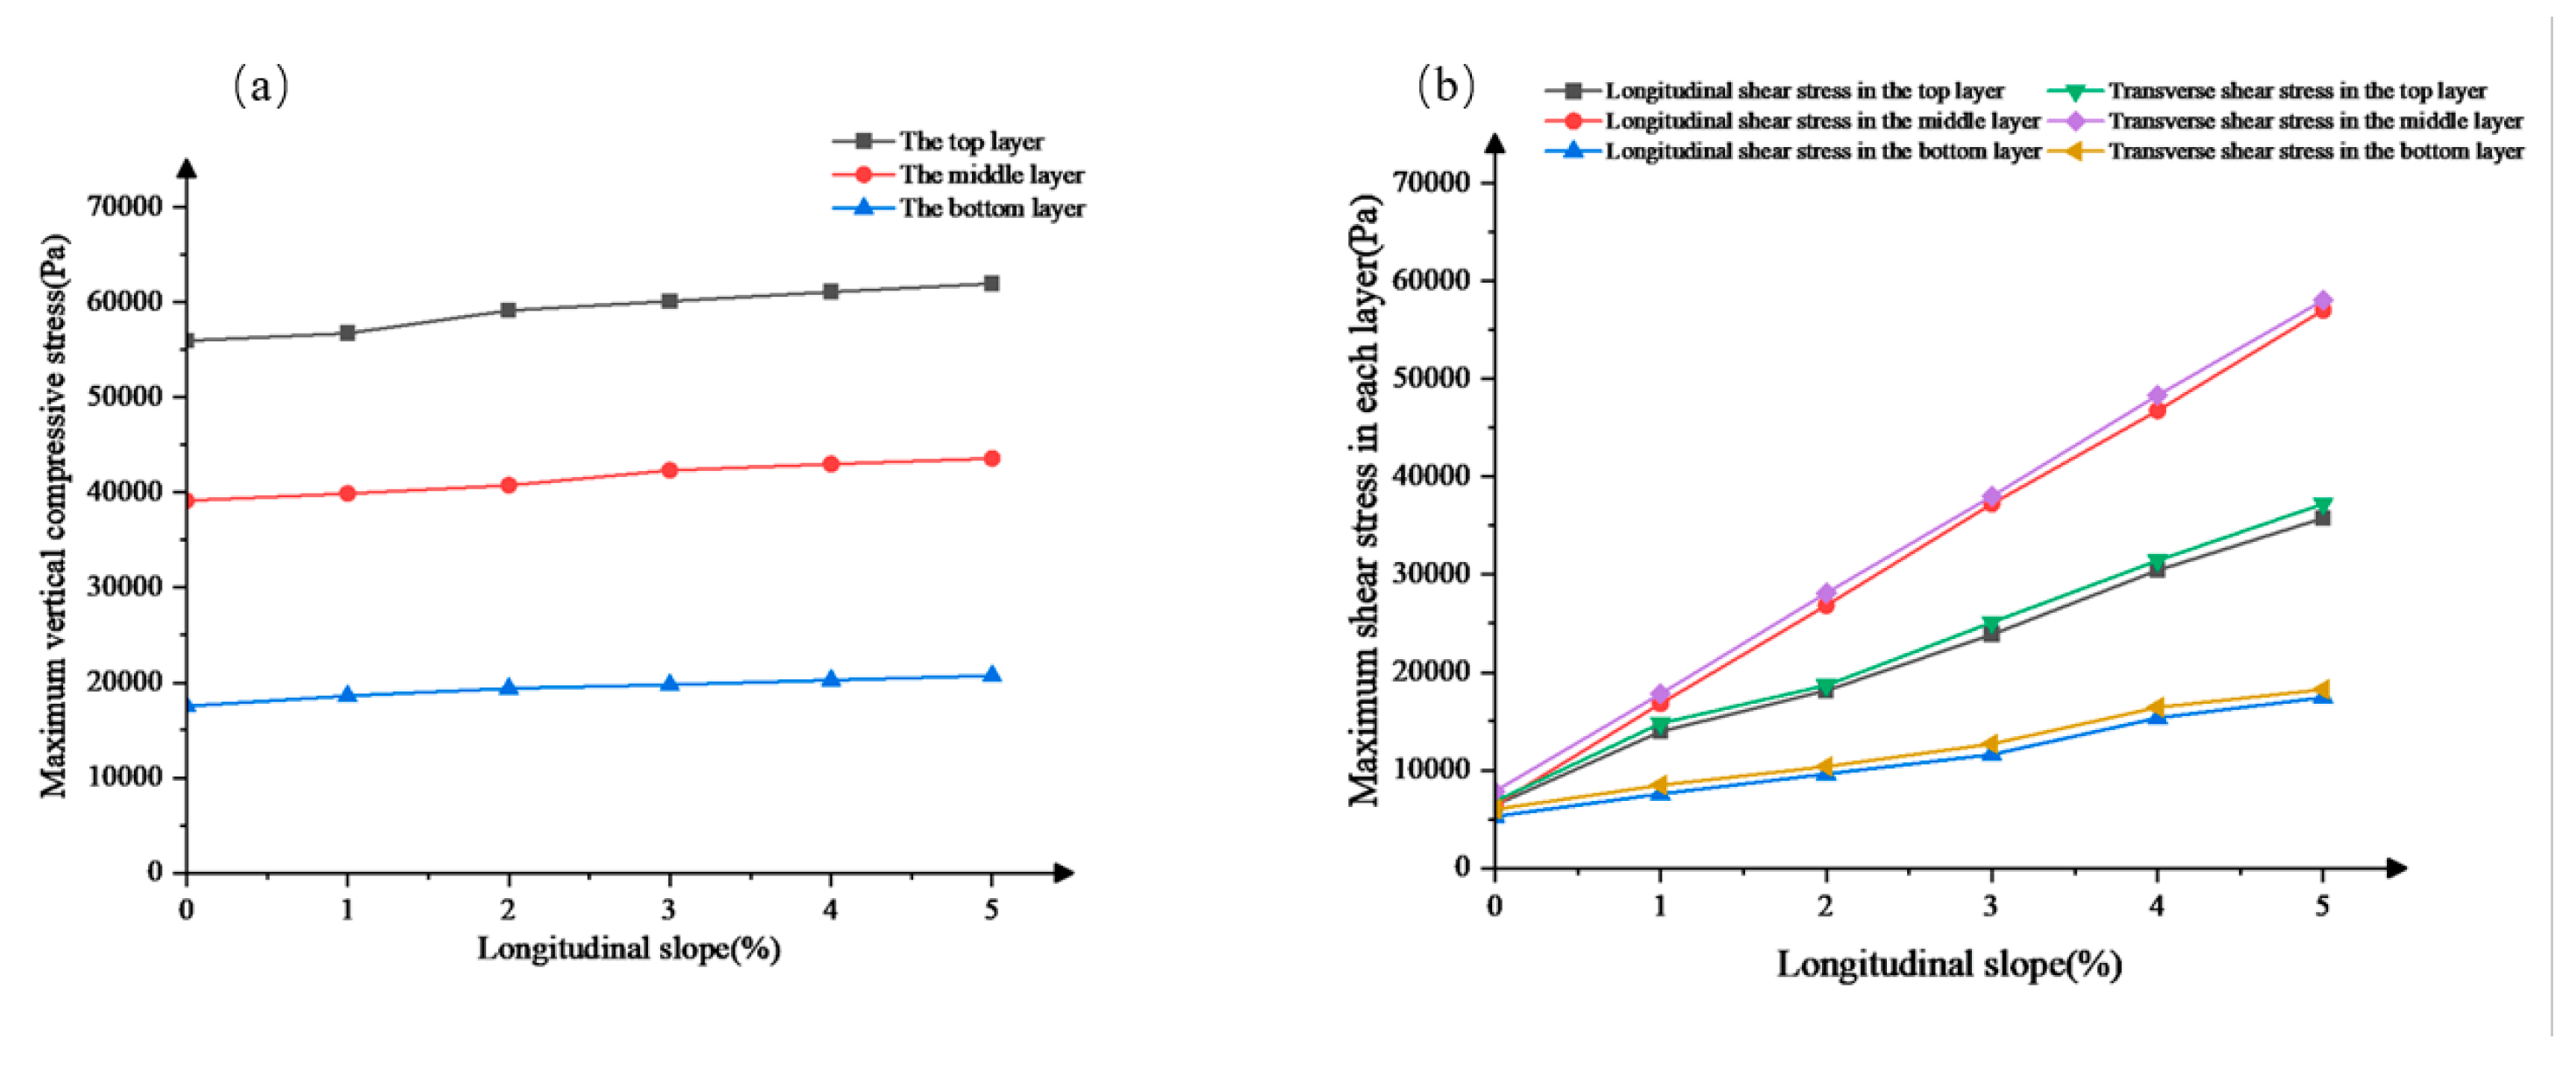
According to the “Technical Standards for Highway Engineering”, the maximum design longitudinal slope of expressways is 3% to 5%. To explore the impact of longitudinal slope on asphalt pavement rutting, we calculated the maximum vertical compressive stress of the lower structure and the maximum shear stress of each layer under five different slopes of 1%, 2%, 3%, 4%, and 5%. The results are shown in
Figure 4.
From the figure above, it can be seen that when the longitudinal slope changes, the vertical compressive stress of each layer of the pavement increases slightly, and the maximum vertical compressive stress occurs in the upper layer. When the longitudinal slope increases from 1% to 5%, the shear stress of each layer of the pavement shows an increasing trend, and the maximum longitudinal shear stress and maximum transverse shear stress occur in the middle layer. However, as the longitudinal slope increases, the difference between the shear stresses of each layer of the pavement also increases. It is evident that changing the longitudinal slope has the most significant impact on the middle layer. Improving the shear strength of the middle layer of asphalt pavement is essential for improving its overall shear strength. Chen Xiaobing et al. [
15] investigated the influence of longitudinal slope on the mechanical response of bridge deck pavement layers and reached the same conclusion: under the condition of vehicles traveling at a constant speed, the maximum transverse shear stress at the bottom of the layers is always greater than the maximum longitudinal shear stress at the bottom. Chen Huaxin et al. [
16] utilized Abaqus to construct a semi-rigid base asphalt pavement model and found that the longitudinal slope and load have a greater impact on the longitudinal shear stress between pavement layers compared to the transverse shear stress. Xun Yongli et al. [
17] established a bridge deck pavement model using Abaqus and analyzed the interlayer stress under four different loading conditions: uphill, downhill, emergency braking, and repeated loading, yielding similar results.
3.1.2. Pavement temperature
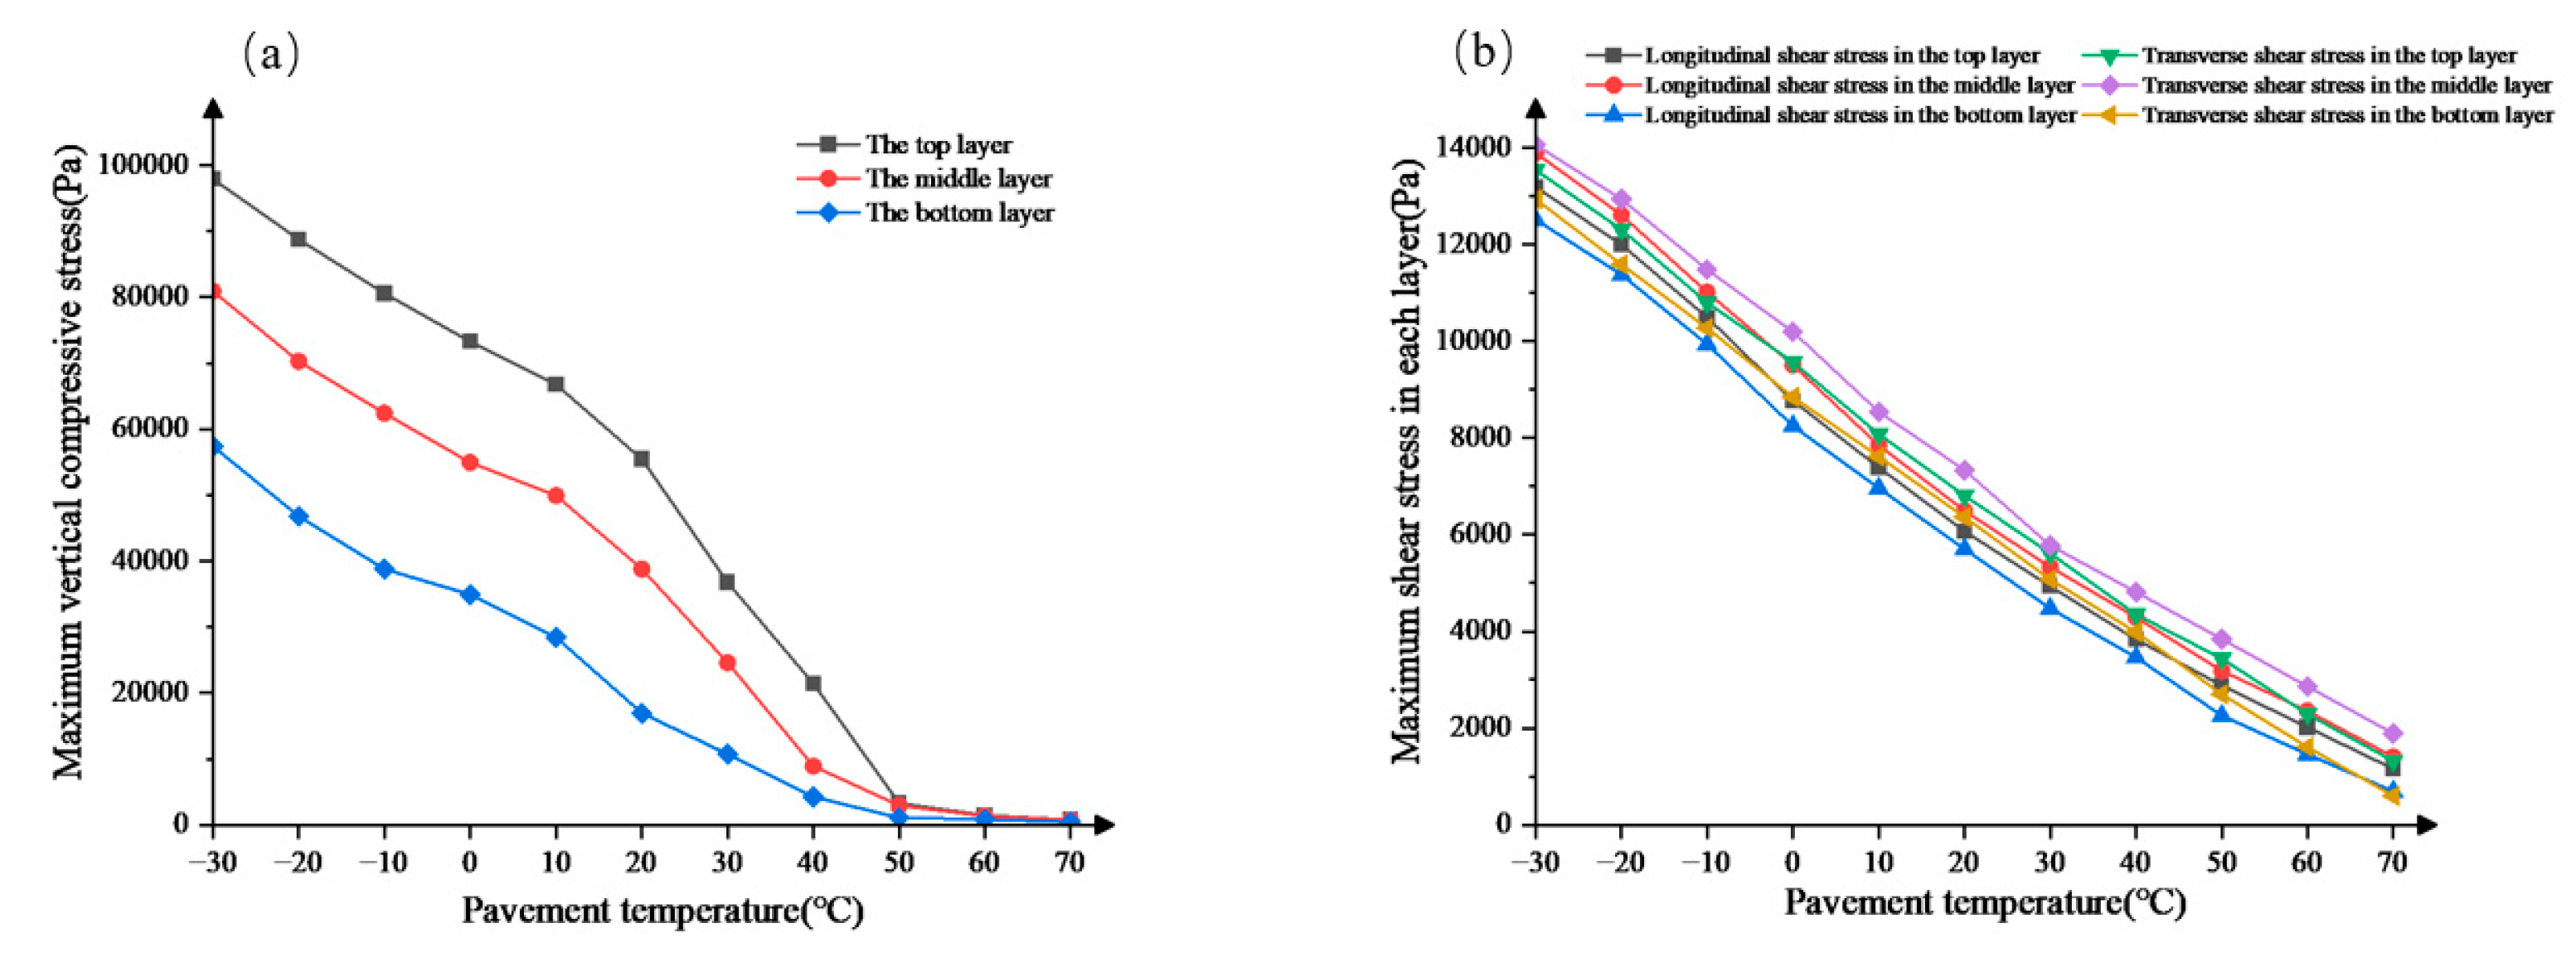
Asphalt has viscoelastic properties that change with temperature. Therefore, we studied changes in shear stress of each layer of asphalt pavement at different temperatures (-30°C, -20°C, -10°C, 0°C, 10°C, 20°C, 30°C, 40°C, 50°C, 60°C, and 70°C) [
18,
19]. The extreme highest temperature in the engineering area is 45℃, and the monthly average highest temperature is 33℃; The extreme lowest temperature is -17℃, and the monthly average lowest temperature is -4℃. Considering actual pavement temperature conditions, this paper selects different surface temperatures to study mechanical responses of each layer of pavement as shown in
Figure 5:
Analysis of the figure reveals that with increasing temperature, the shear stress and vertical compressive stress of each layer in the surface layer gradually decrease. Among them, the upper layer has the highest maximum vertical compressive stress, followed by the middle layer, and the lower layer has the lowest. When the temperature increases from -30°C to 70°C, the maximum vertical compressive stress in the upper layer experiences the greatest reduction. Furthermore, when the temperature reaches 70°C, the maximum shear stress in each layer of the pavement becomes relatively close. Due to the increased ductility of asphalt at higher temperatures, displacement is more likely to occur under high-temperature loads, resulting in a gradual decrease in measured shear stress. Cao Phu Cuong et al. [
20] found that asphalt exhibits lower elasticity and viscosity at higher temperatures, making it prone to rutting. Additionally, as the pavement temperature increases, the shear stress in each layer of the pavement decreases linearly, with the middle layer still experiencing the highest shear stress. Moreover, the shear stress and maximum vertical compressive stress in the lower layer are both minimal. Therefore, the design of modified pavement should focus on the upper and middle layers. Hou Gui et al. [
21] investigated the impact of different working conditions on the interlayer behavior of bridge deck pavement in cold regions and found that temperature has the greatest influence on interlayer shear stress.
3.1.3. Overload degree
During operation, overloading can seriously reduce the service life of the pavement. Therefore, this paper studies the mechanical response of pavement under different overload degrees. The “Highway Asphalt Pavement Design Specification” (JTG D50-2017) stipulates the traffic volume of each traffic level as shown in
Table 2:
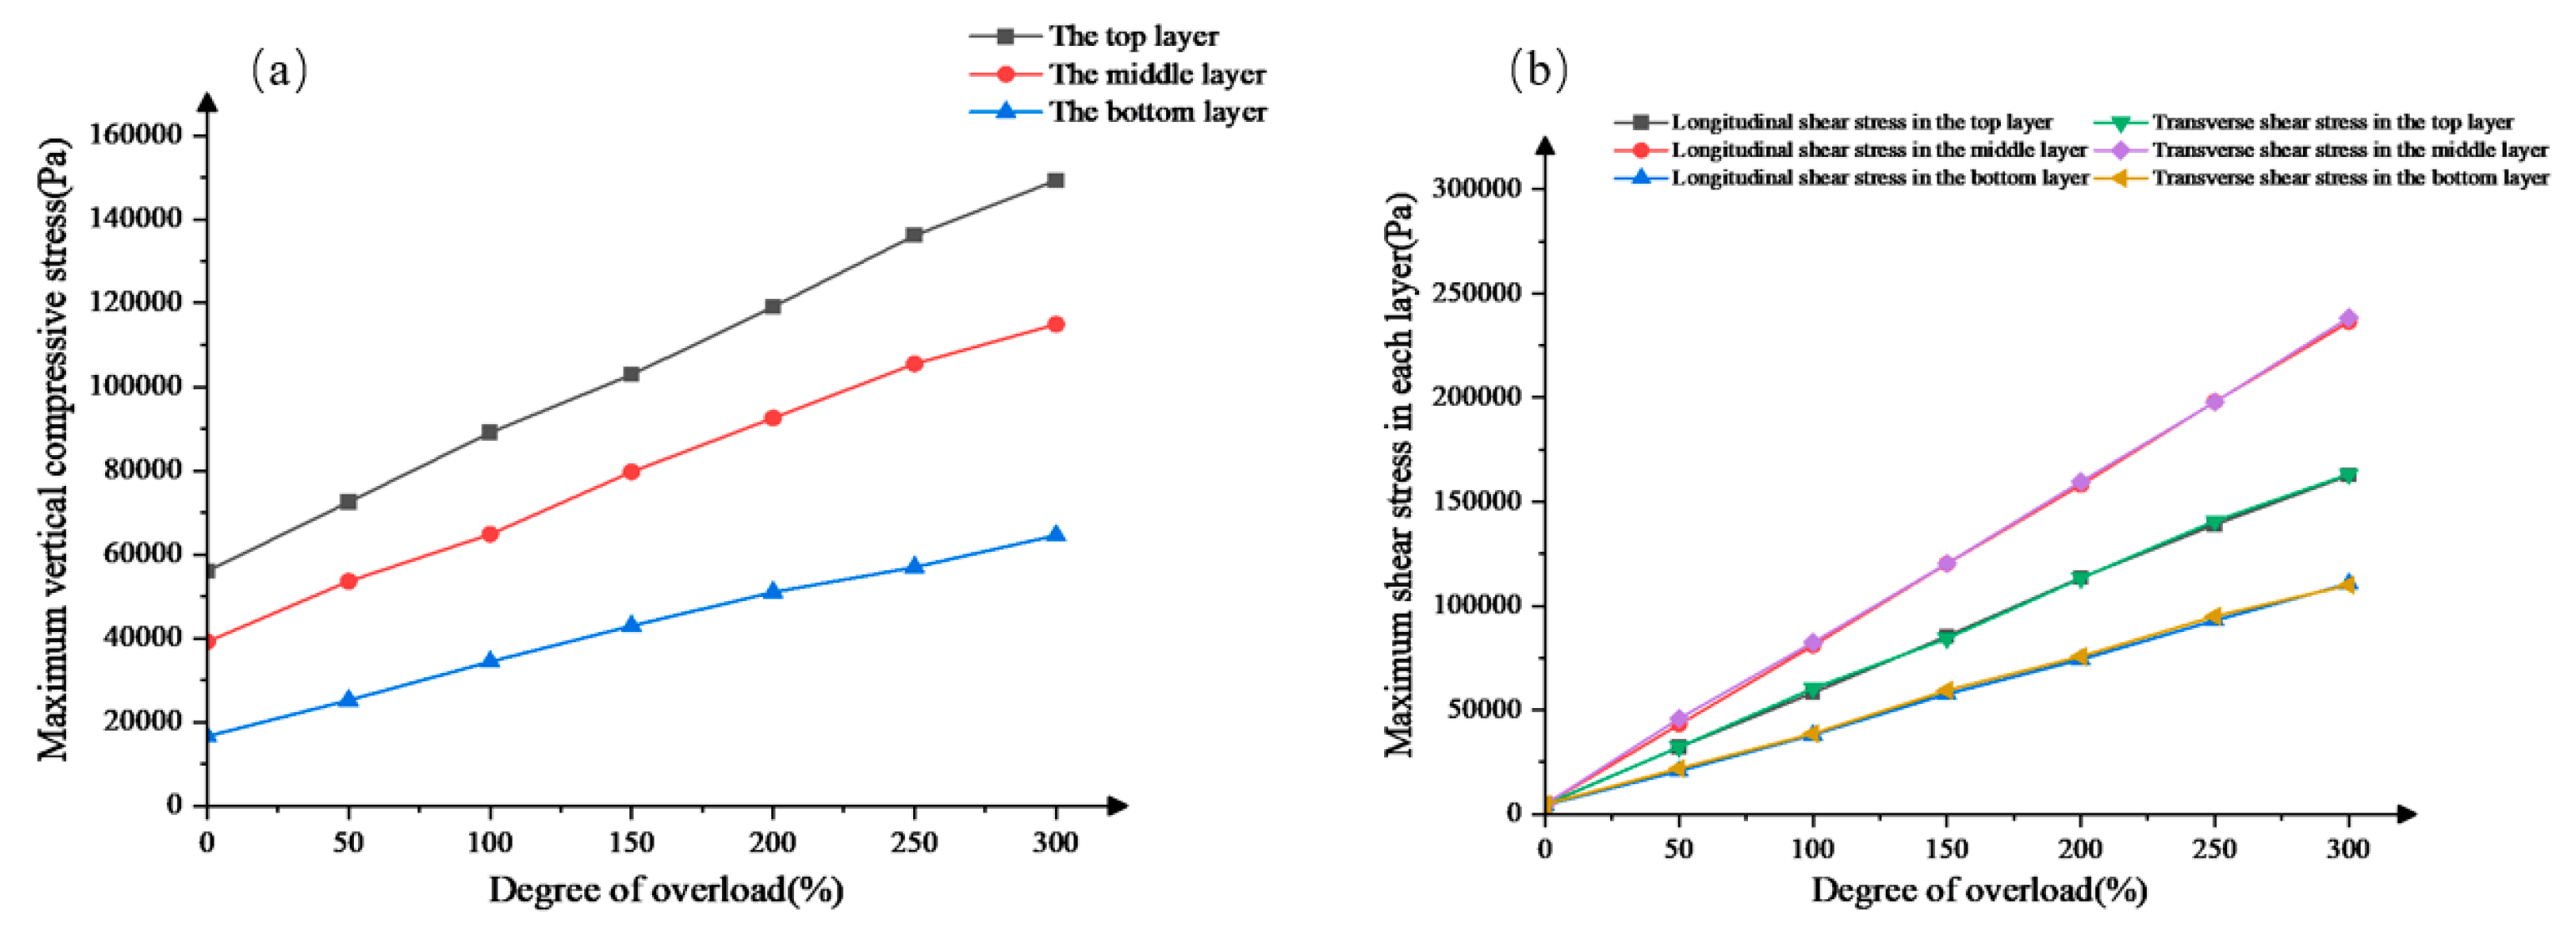
Different overload degrees (0%, 50%, 100%, 150%, 200%, 250%, 300%) were selected to study the impact of overload on the mechanical response of the surface structure. The mechanical response of each surface layer under different overload degrees is shown as in
Figure 6 :
Analysis of the figure reveals that as the degree of overloading increases, the maximum vertical compressive stress, interlayer vertical and shear stresses, and transverse shear stress all increase. The upper layer experiences the highest compressive stress, followed by the middle layer, and the lower layer experiences the lowest vertical compressive stress. As the degree of overloading increases, the upper layer exhibits the greatest increase in maximum vertical compressive stress, with a growth rate of 54.3%. For the surface layer of the pavement, the middle layer experiences the highest shear stress, followed by the upper layer, and the lower layer experiences the lowest shear stress. Furthermore, under different degrees of overloading, the longitudinal and transverse shear stresses experienced by each layer of the pavement are almost equal. As the degree of overloading increases to 300%, the middle layer experiences the greatest increase in shear stress, with a 54.7% increase in longitudinal shear stress and a 54.6% increase in transverse shear stress. Therefore, the upper and middle layers exhibit the most significant mechanical response to overloading. Luo Yaofei et al. [
22] utilized the Bisar 3.0 software and orthogonal experimental method to analyze the sensitivity of different factors to interlayer shear stress and found that vehicle overloading has a significant impact on interlayer shear stress.
3.1.4. Flat Curve Radius
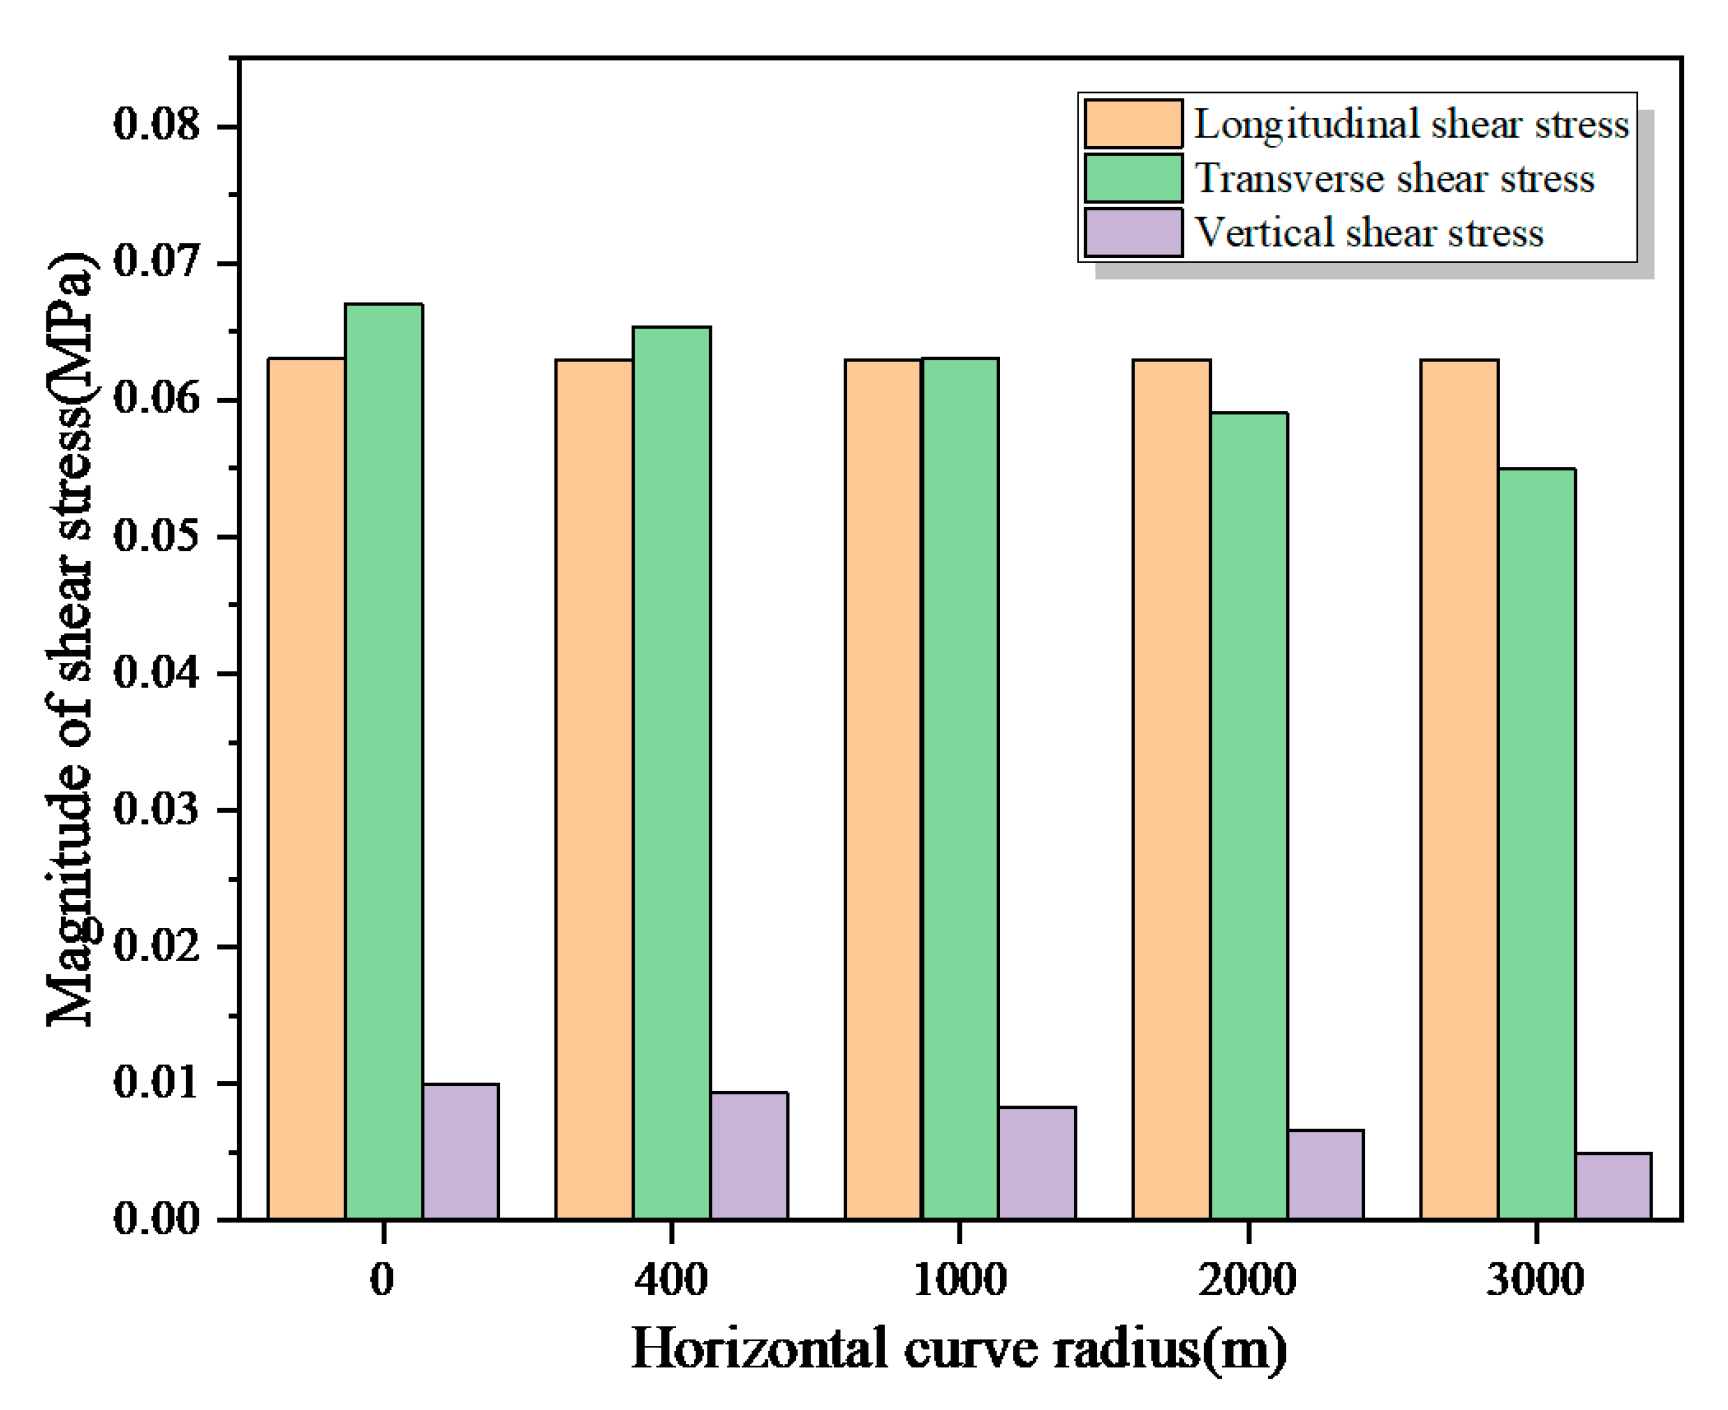
When a vehicle travels on a flat curve of a road, the road surface is subjected to shear force due to lateral force, which can cause adverse effects and even premature damage. Therefore, this paper studies the mechanical response of each layer of the road surface under different flat curve radii (400m, 1000m, 2000m, 3000m) according to “Technical Standards for Highway Engineering” (JTBB01-2014). The maximum longitudinal, transverse and vertical shear stress at the bottom of the surface layer are shown in the figure as in
Figure 7:
From the above figure, it can be seen that as the flat curve radius increases, the change in longitudinal shear stress at the bottom of the asphalt pavement surface layer is not significant; the horizontal shear stress at the bottom of the asphalt pavement surface layer decreases as the radius increases. When the flat curve radius changes from 0m to 3000m, the maximum horizontal shear stress at the bottom of the surface layer decreases by 17.9%. With the increase of flat curve radius, the vertical shear stress of the road gradually decreases. When the flat curve radius changes from 0m to 3000m, the maximum vertical shear stress at the bottom of the surface layer decreases by 51%. Therefore, changing the flat curve radius has a more significant effect on horizontal shear stress and vertical shear stress.
3.2. Comprehensive Working Condition Analysis
After considering the actual construction and use of asphalt pavement, it is found that the pavement is not only affected by a single factor but by multiple factors. This leads to different degrees of mechanical response of the asphalt pavement and ultimately causes early rutting of the asphalt pavement, which seriously reduces the service life of the asphalt pavement. Therefore, this section calculates the mechanical response of the surface layer of asphalt pavement under the combination of longitudinal slope and overload degree and temperature.
3.2.1. Combination of different longitudinal slopes and overload levels
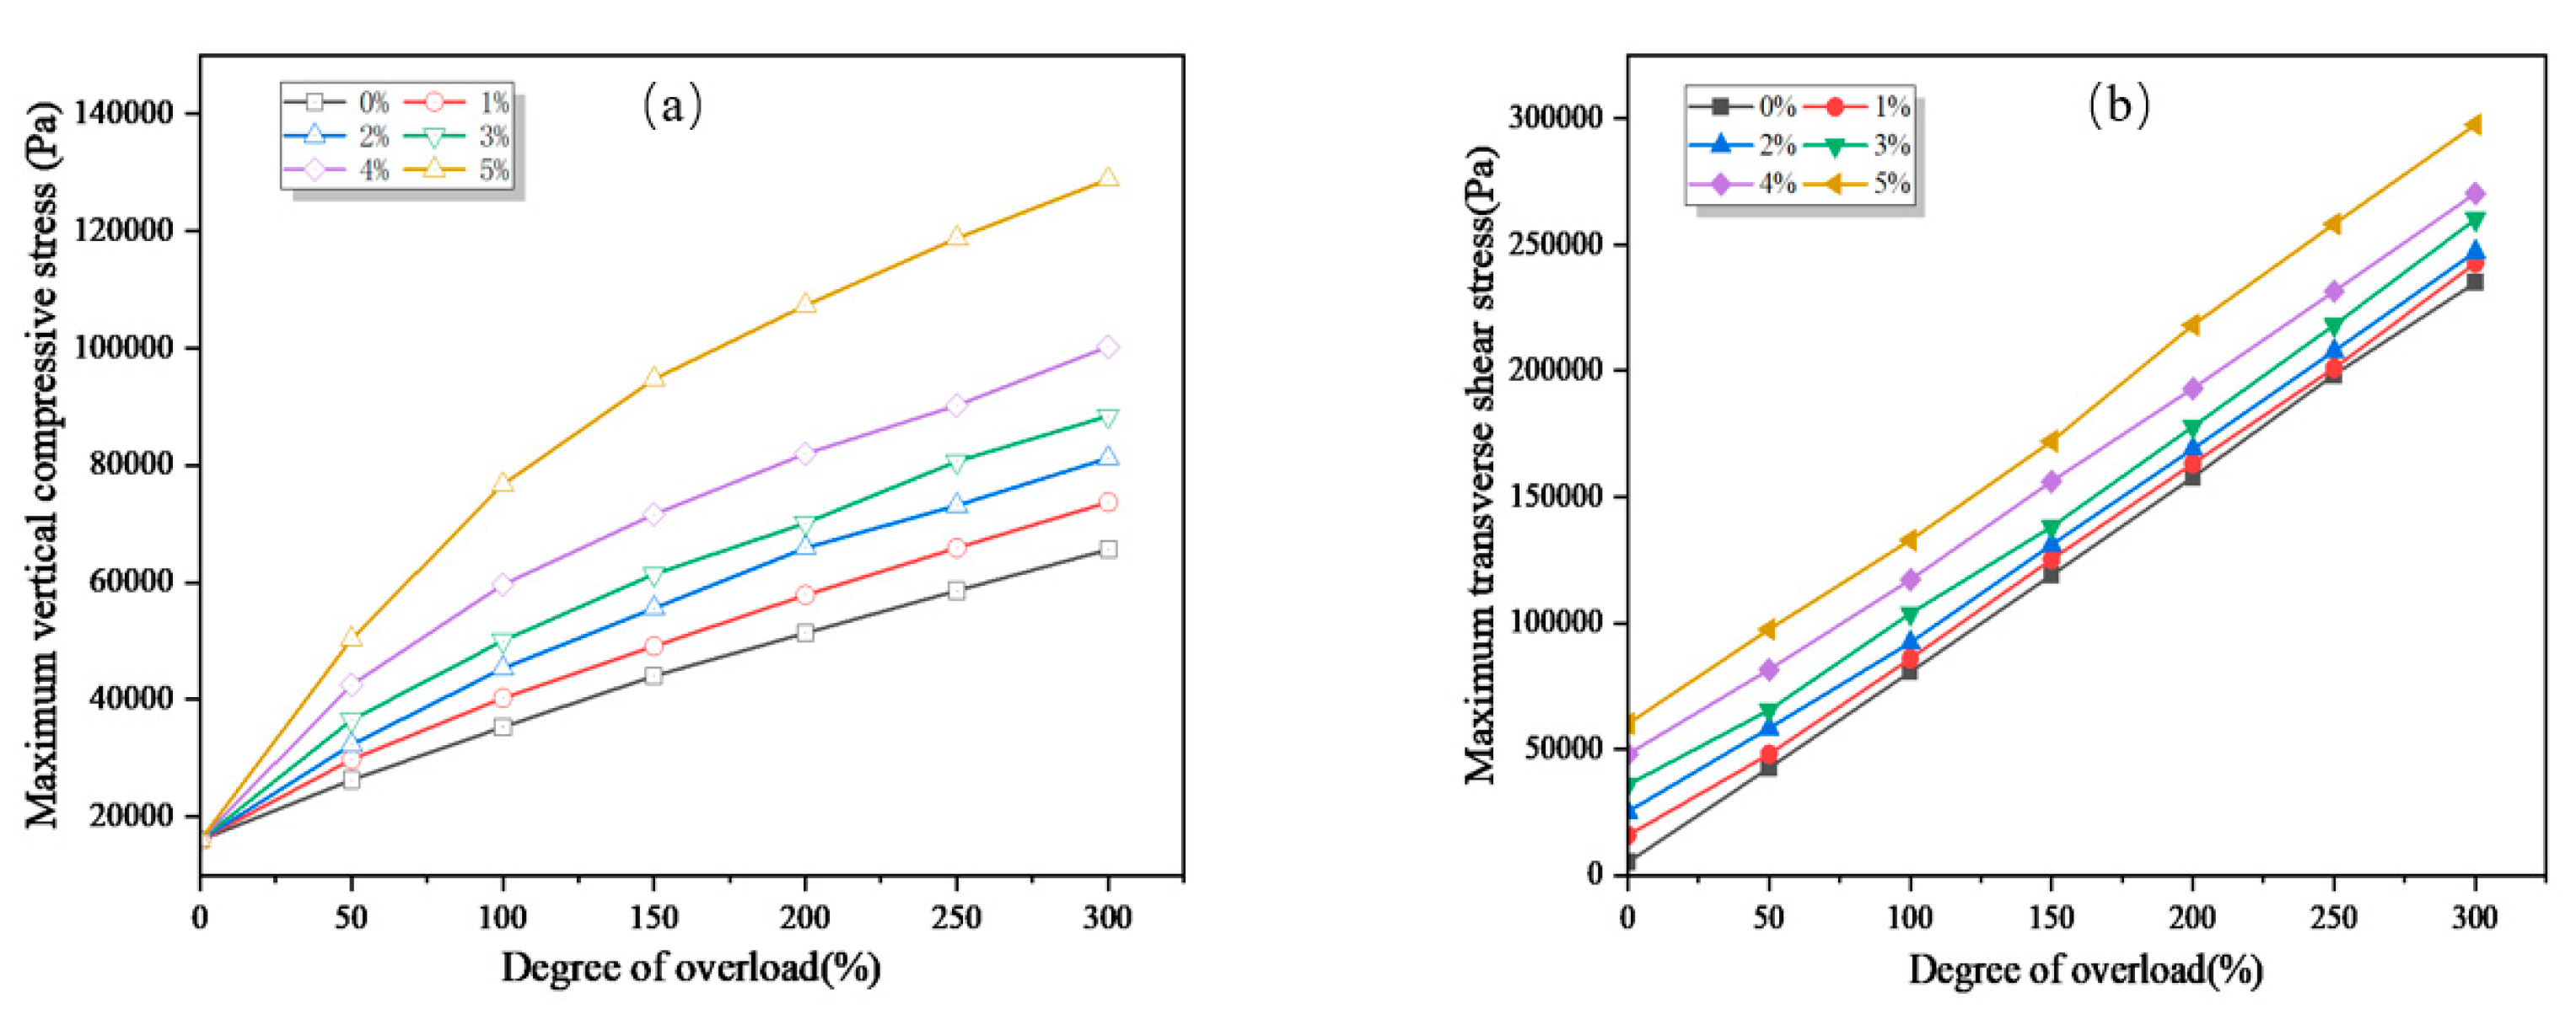
From
Figure 7, it can be seen that the maximum vertical compressive stress of the lower layer of the pavement increases with the increase of overload rate; in addition, the vertical compressive stress also increases as the longitudinal slope increases by 1%. The maximum vertical compressive stress does not change significantly when the longitudinal slope changes from 0% to 1%. With the continuous increase of longitudinal slope, the maximum stress difference between adjacent longitudinal slopes gradually increases. The difference between the maximum shear stress value of 4% and 5% longitudinal slopes and that of other slopes is very large. Therefore, it is necessary to strictly control the size of road longitudinal slope.
In addition, the middle layer of the pavement bears the maximum shear stress. Therefore, only the numerical value of the middle layer shear stress is extracted. Under the same longitudinal slope condition, the maximum horizontal shear stress of the middle layer increases linearly with the increase of overload level. Under the same overload level, as the longitudinal slope increases, the maximum shear stress of the middle layer gradually increases. When the longitudinal slope is between 0% and 3%, there is little difference in maximum shear stress when the longitudinal slope increases by 1%. When the longitudinal slope is between 4% and 5%, there is a large difference between the maximum shear stress value and that of adjacent longitudinal slopes. According to the mechanical response of pavement surface under different longitudinal slopes and overloads, analyze its impact on pavement surface. When conducting working condition classification, consider its vertical compressive stress and shear stress size. The influence of pavement shear stress should be given priority.
3.2.2. Combination of different longitudinal slopes and temperatures
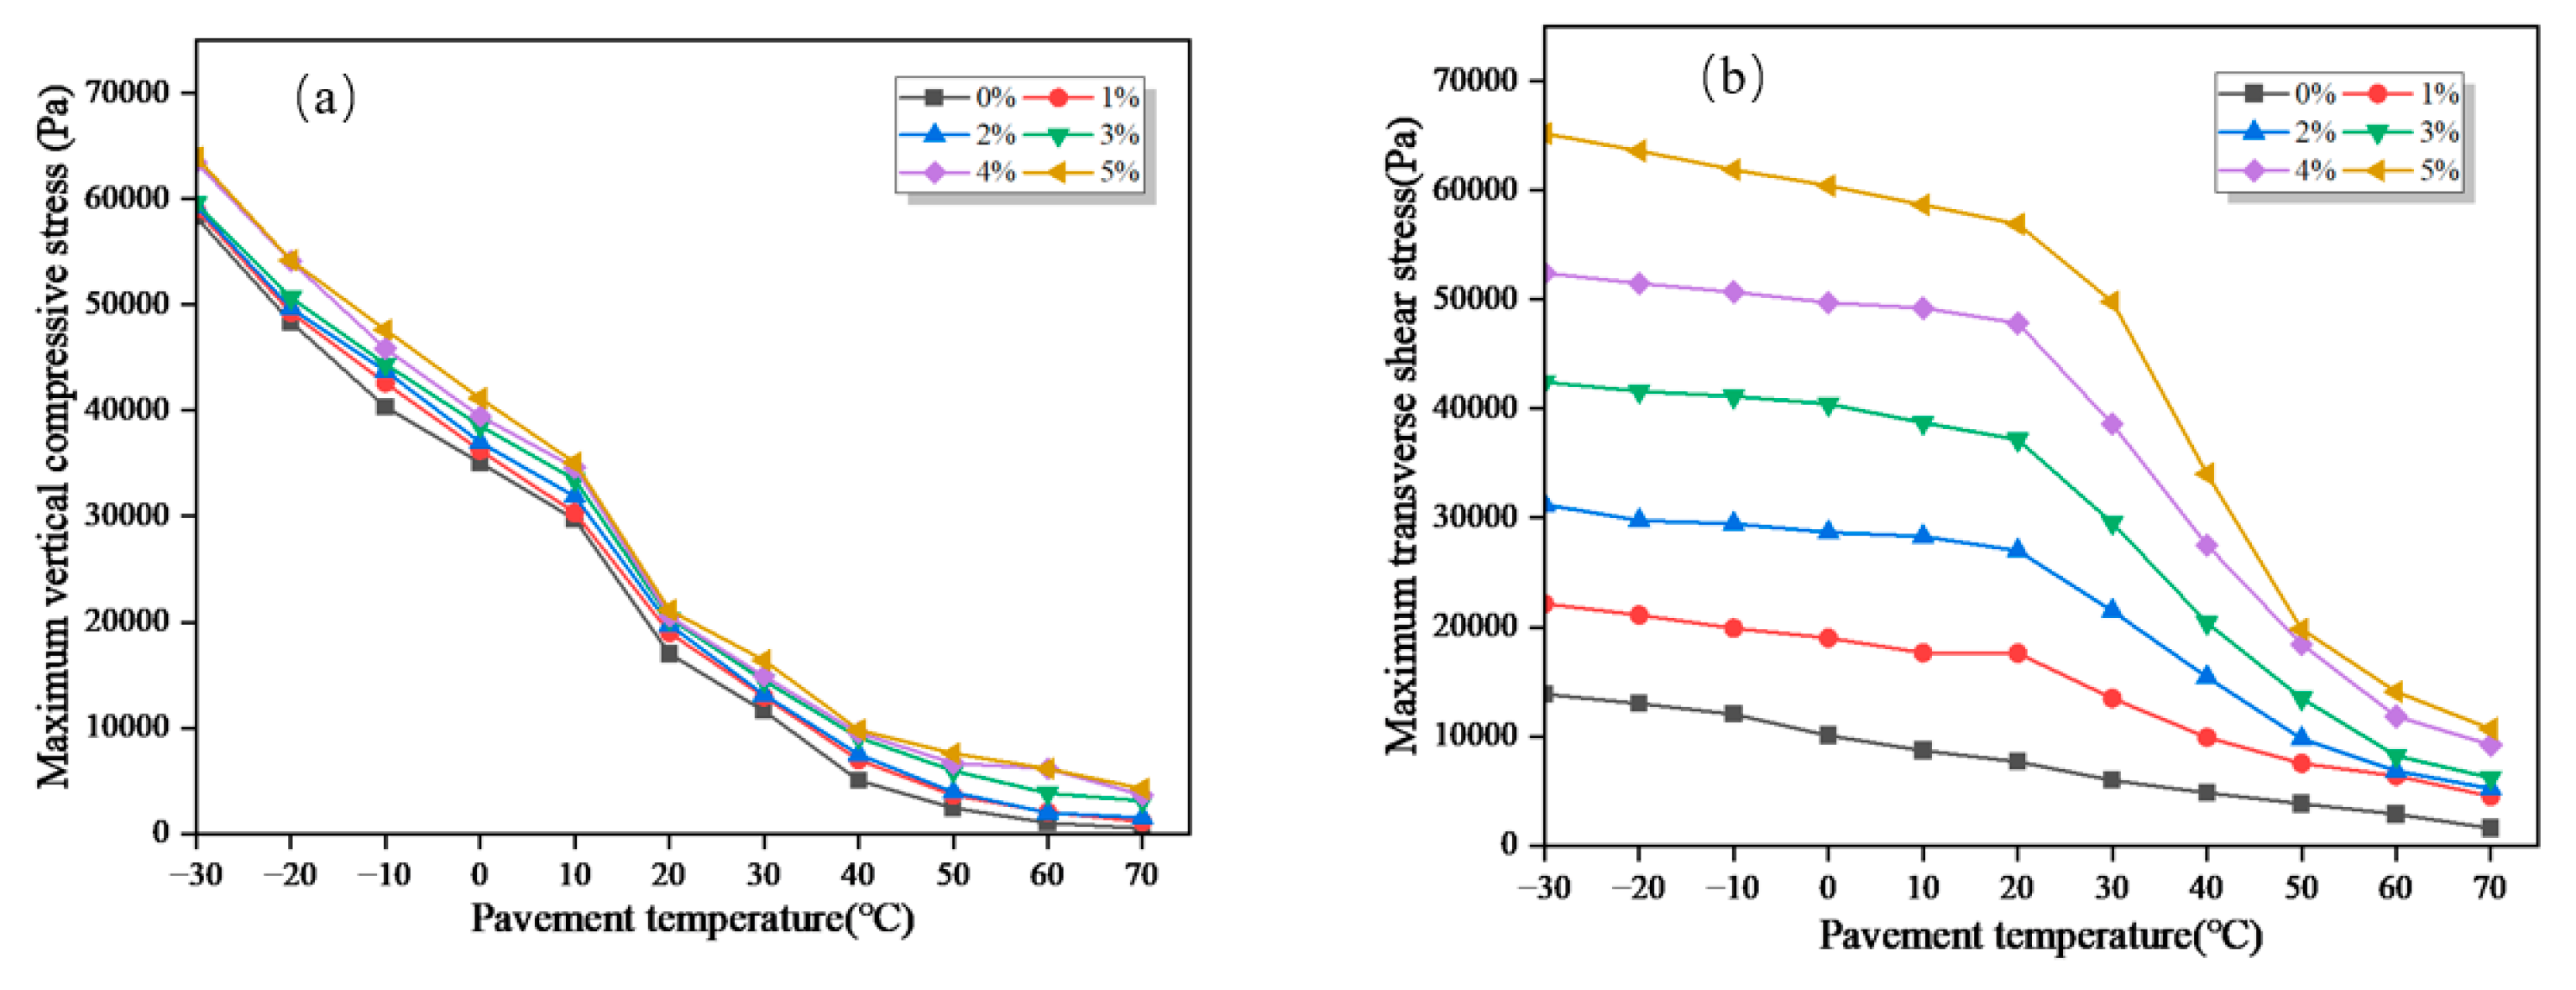
According to
Figure 8, it can be seen that under the same longitudinal slope condition, the maximum vertical compressive stress of the surface layer gradually decreases with the increase of road surface temperature; under the same temperature condition, the maximum vertical compressive stress of the lower layer increases with the increase of longitudinal slope. Under the same longitudinal slope, during the process of road surface temperature decreasing from -10℃ to 40℃, the maximum vertical compressive stress of the road surface changes greatly. The maximum vertical compressive stress decreases most rapidly when the road surface temperature decreases from 10℃ to 30℃. Under the same temperature condition, when the longitudinal slope of the road surface is between 0% and 4%, the maximum vertical compressive stress gradually increases but with a small increase range. However, when the longitudinal slope reaches 5%, there is a large difference between the maximum vertical compressive stress and that of adjacent total slopes.
Figure 8.
The mechanical response of the surface layer under the combined conditions of different longitudinal slope and overload degree; (a) vertical compressive stress of the lower layer;(b) maximum shear stress of the middle layer.
Figure 8.
The mechanical response of the surface layer under the combined conditions of different longitudinal slope and overload degree; (a) vertical compressive stress of the lower layer;(b) maximum shear stress of the middle layer.
Figure 9.
The mechanical response of the surface layer under different longitudinal slope and temperature combination conditions;(a) vertical compressive stress of the lower layer;(b) maximum shear stress of the middle layer.
Figure 9.
The mechanical response of the surface layer under different longitudinal slope and temperature combination conditions;(a) vertical compressive stress of the lower layer;(b) maximum shear stress of the middle layer.
Under the same longitudinal slope condition, as the road surface temperature increases, both the maximum shear stress of the middle layer and that of the lower layer gradually decrease. The maximum shear stress changes very rapidly when temperature decreases from 20℃ to 20℃. Then, as temperature increases, shear stress decreases more slowly. This phenomenon becomes more obvious as longitudinal slope increases. For different longitudinal slopes under the same temperature condition, both the maximum shear stress of middle layer and that of lower layer increase with increasing longitudinal slope. When temperature is lower, there is a larger difference in maximum shear stress between different longitudinal slopes. However, as temperature increases, this difference decreases.
3.3. Comprehensive factor working condition classification
Currently, most highways are three-layer pavement structures. According to numerical simulation results of unfavorable working conditions such as temperature, axle load, road longitudinal slope and flat curve radius and combinations of two unfavorable working conditions mentioned above, mechanical responses of maximum vertical compressive stress and horizontal and vertical shear stresses of pavement surface under different unfavorable factors are analyzed. Based on the analysis of various factors affecting the stress on the asphalt pavement surface layer, a significance analysis was conducted to identify the main influencing factors and eliminate the minor ones. A comprehensive working condition classification based on the stress impact on the pavement surface layer structure is proposed [
23]. Therefore, by considering the adverse factors and the mechanical response of each pavement layer, a pavement working classification table is obtained as shown in
Table 5. If different sections of the road belong to different working condition levels, the higher level of adverse working conditions is considered [
24]. Xie Xiangbing et al. [
25] conducted a study on asphalt mixtures and classified the recycled coarse aggregates based on an improved grey entropy correlation analysis theory. The application levels of recycled coarse aggregates in road engineering were divided into three categories.
Table 3.
Comprehensive factor working condition classification.
Table 3.
Comprehensive factor working condition classification.
| Working condition |
Longitudinal slope |
Flat curve radius |
High temperature |
low temperature |
cumulative standard axis Ne(ten thousand times / lane) |
| Ⅰ |
[4,5) |
≤400 |
>50 |
<-30 |
>2500 |
| Ⅱ |
[2,4) |
(400,3000) |
[20,50] |
[-30,-10] |
[1200,2500] |
| Ⅲ |
(0,2) |
≥3000 |
<20 |
>-10 |
<1200 |
3.4. Modification effect classification
Based on the analysis of the current specification index of modified asphalt mixture and the investigation and analysis of the performance index of different modified asphalt mixture, the classification standard of modified effect of different types of modified asphalt mixture is put forward as
Table 4.
Table 5.
AC-16 modified asphalt mixture of different grades corresponding to the amount of modified materials.
Table 5.
AC-16 modified asphalt mixture of different grades corresponding to the amount of modified materials.
Table 6.
AC-20 modified asphalt mixture of different grades corresponding to the amount of modified materials.
Table 6.
AC-20 modified asphalt mixture of different grades corresponding to the amount of modified materials.
Table 7.
SMA-13 modified asphalt mixture with different grades corresponding to the amount of modified materials.
Table 7.
SMA-13 modified asphalt mixture with different grades corresponding to the amount of modified materials.
Dong Weizhi et al. [
26] employed the Analytic Hierarchy Process (AHP) to comprehensively assess various evaluation indicators, with the goal of determining the suitability and performance levels of asphalt mixtures in road engineering. This approach offers assistance to engineers and decision-makers in evaluating the quality and applicability of asphalt mixtures, enabling the development of appropriate design and maintenance strategies to ensure the safety and reliability of roads.
4. Case analysis
To evaluate the modification effect more intuitively, it is necessary to evaluate the modification effect. Based on the actual road sections of the project, reasonable modification will be carried out. The rutting depth of the road surface will be calculated systematically to evaluate the reasonable modification proposed in this study.
4.1. Recommendation for reasonable modification of asphalt pavement
Analyze the mechanical response of each layer of pavement surface under unfavorable working conditions and recommend suitable modification methods for this road section to achieve balanced control of ruts and improve the overall service life of the road section.
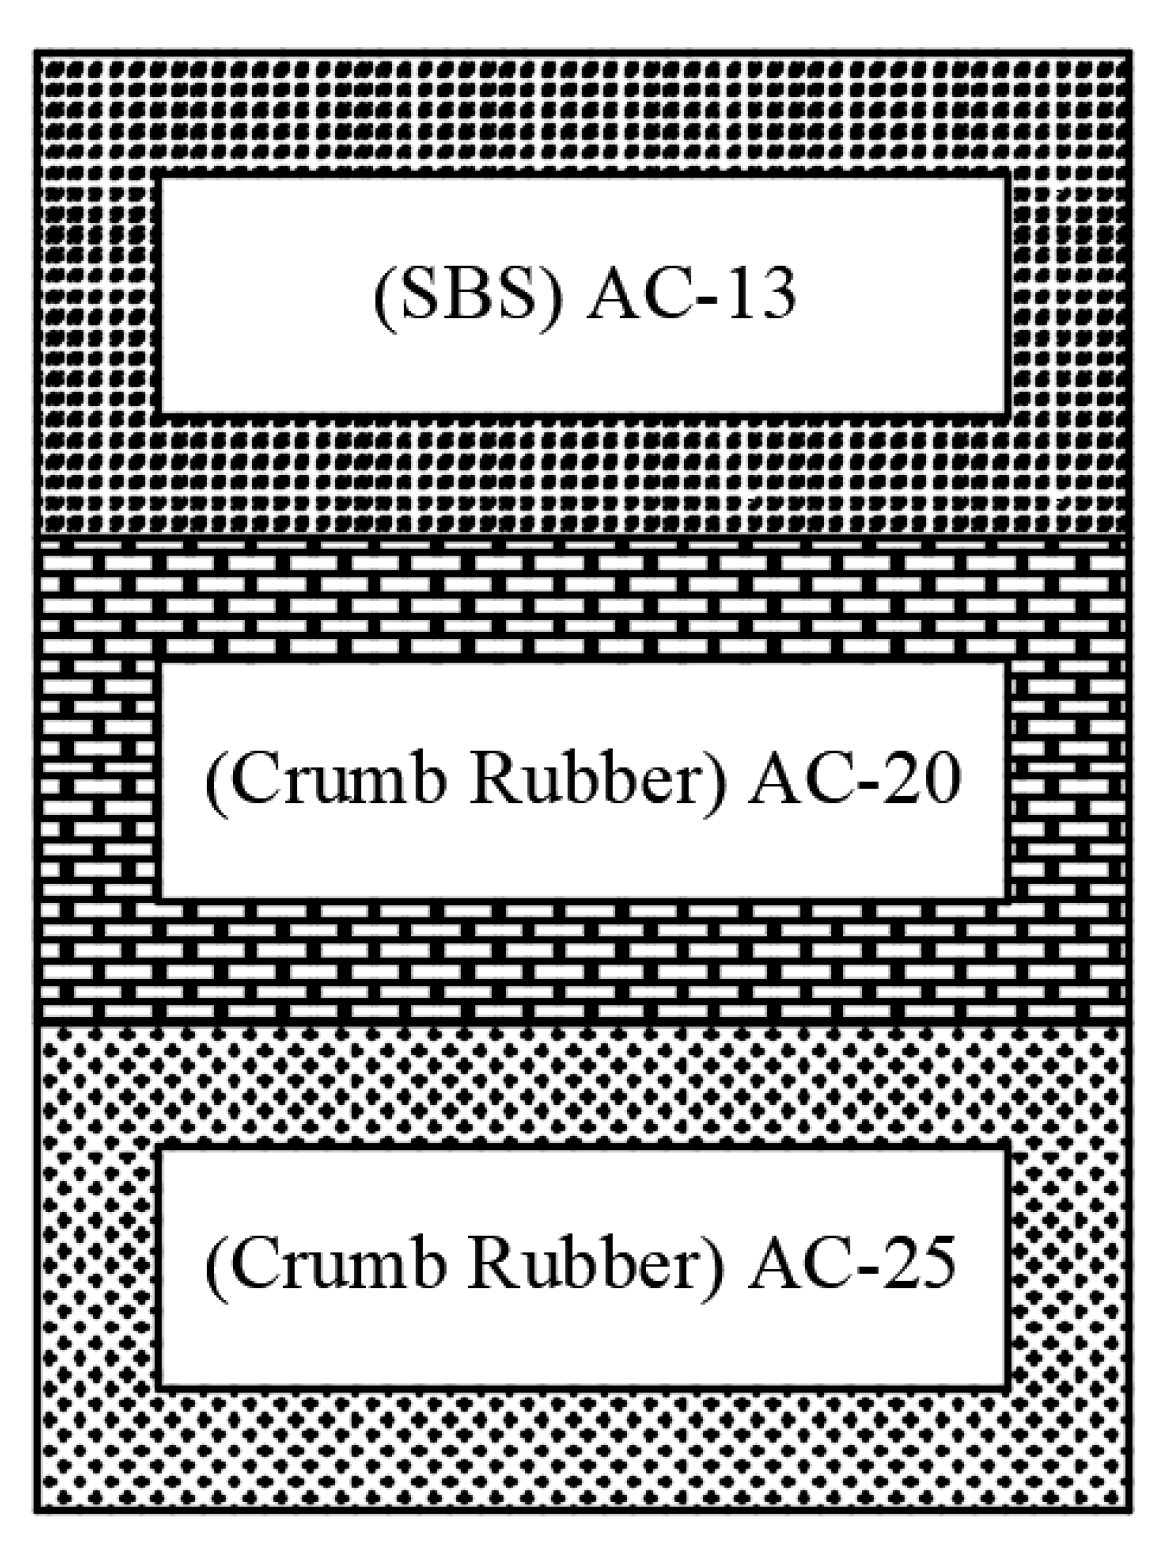
4.1.1. Surface layer recommendation under working condition I
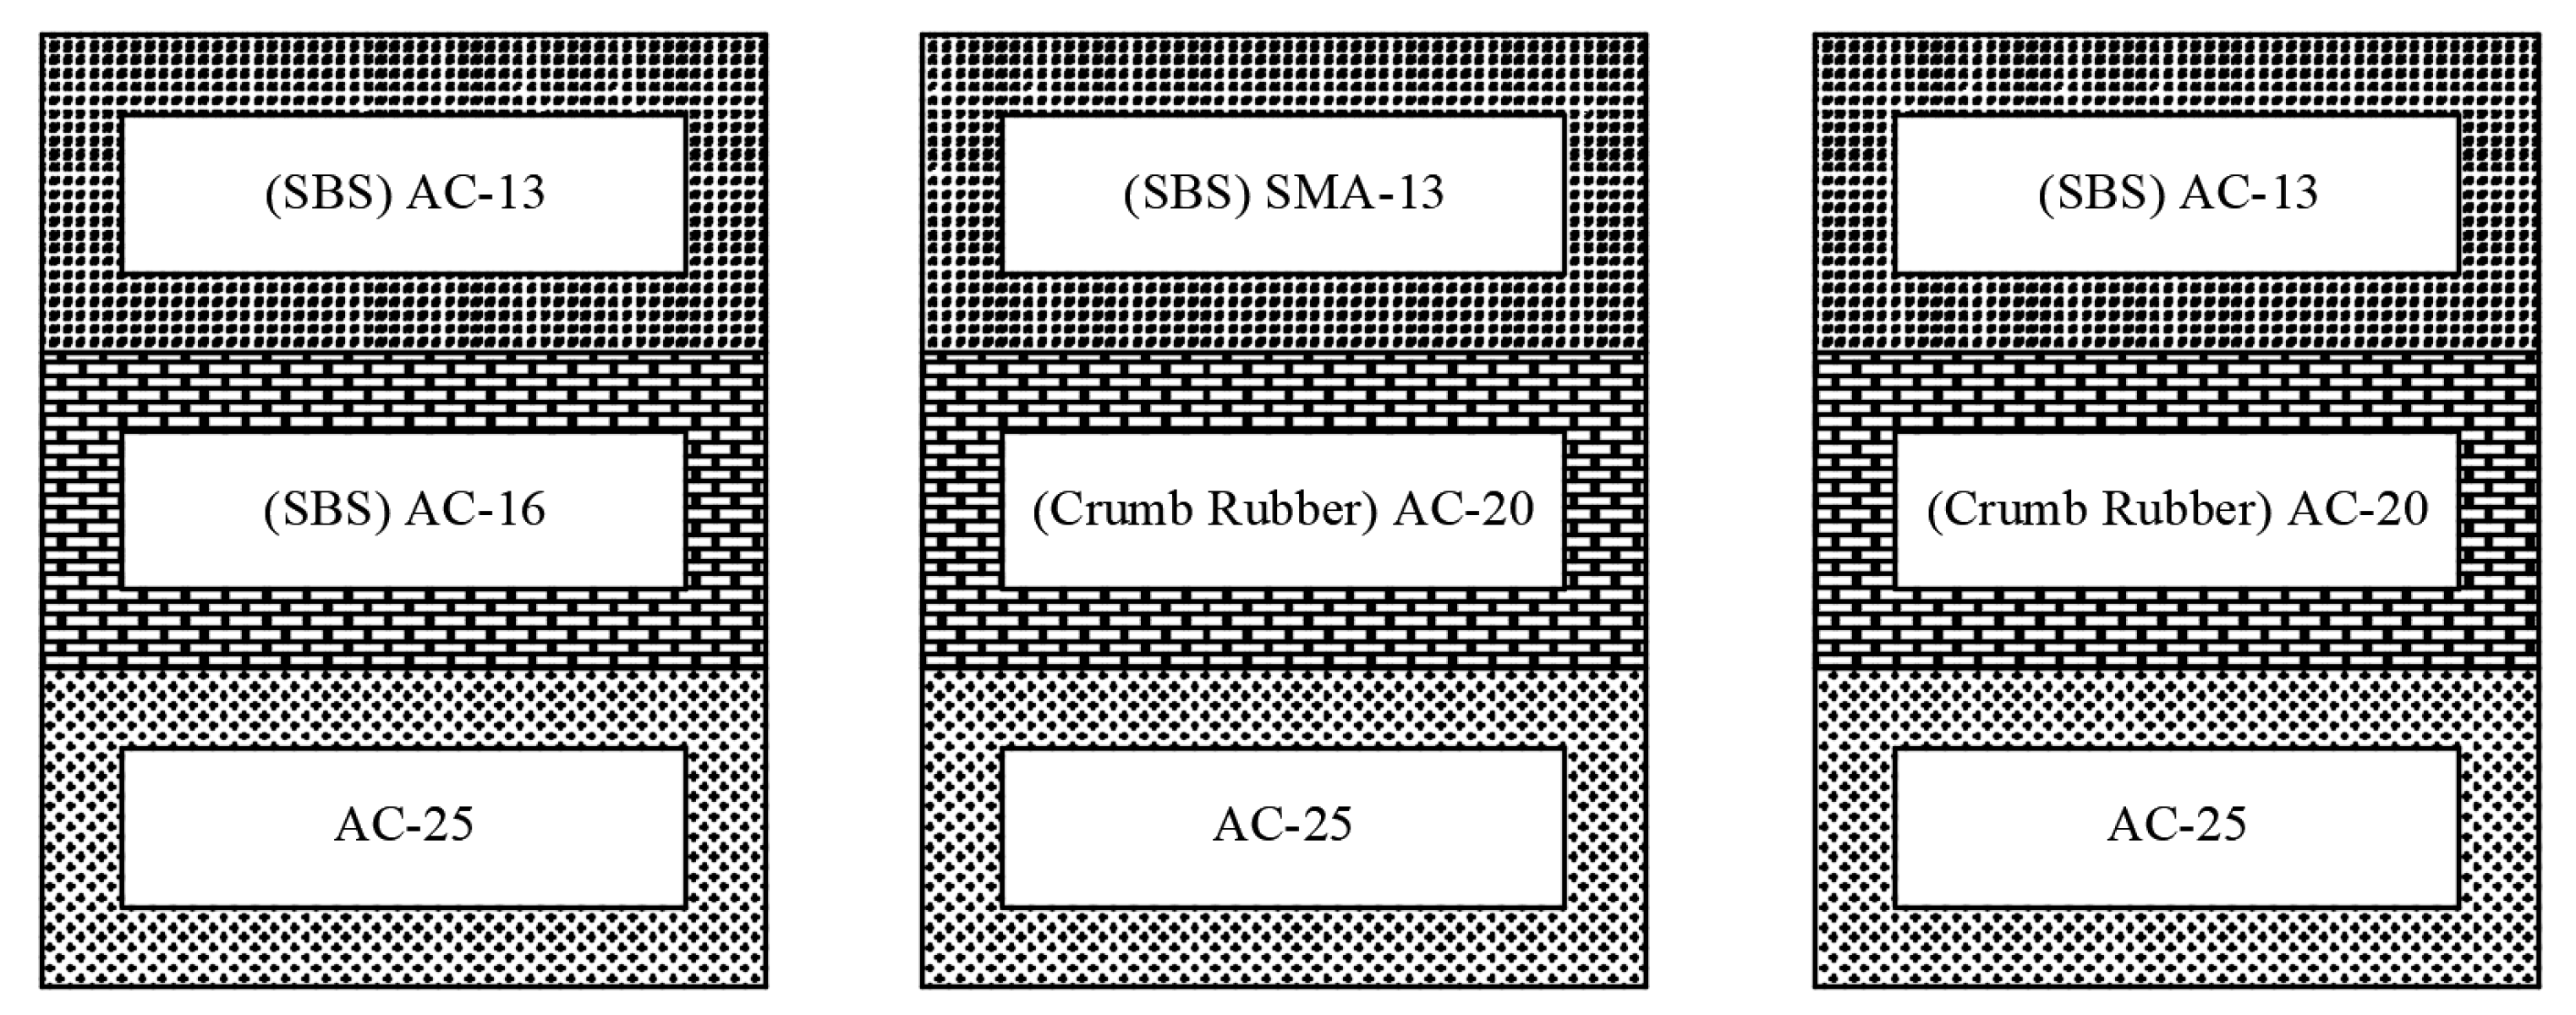
Working condition I is the most unfavorable situation. When the asphalt pavement is in this working condition, each layer of the asphalt pavement will bear large vertical compressive stress, horizontal shear stress and vertical shear stress, which is prone to ruts and reduces the service life of the road. Therefore, it is recommended that the asphalt pavement on this road section can use three-layer modification, especially for sections with large longitudinal slopes and overloads. For other sections, it is recommended to consider whether to use modified asphalt for the lower layer as appropriate. The specific recommended pavement structure combination for this road section is shown in
Figure 10:
4.1.2. Surface layer recommendation under working condition II
Working condition II is less unfavorable than working condition I. When the asphalt pavement is in this working condition, each layer of the asphalt pavement will bear vertical compressive stress, horizontal shear stress and vertical shear stress that are relatively smaller than those under working condition I. At this time, the road surface is prone to ruts and causes diseases that affect the use of the road. Therefore, it is recommended that the asphalt pavement on this road section can use two-layer modification, especially for sections with severe longitudinal slopes and overloads. SBS, rubber powder and lake asphalt can be selected as modified materials. The specific recommended pavement structure combination for this road section is shown below:
Figure 11.
Working condition 2 Recommended structure.
Figure 11.
Working condition 2 Recommended structure.
4.1.2. Surface layer recommendation under working condition Ⅲ
When the asphalt pavement is in working condition III, the mechanical response of each layer of the asphalt pavement to vertical compressive stress, horizontal shear stress and vertical shear stress is relatively small, and ruts are not easily formed. Therefore, it is recommended that the asphalt pavement on this road section can use single-layer modification. SBS, rubber powder and other modified materials can be selected. The specific recommended pavement structure combination for this road section is shown below:
Figure 12.
Working condition 3 Recommended structure.
Figure 12.
Working condition 3 Recommended structure.
4.2. Evaluation of Modification Effects
According to the proposed reasonable matching relationship between asphalt pavement modification and working conditions [
27], a reasonable modification scheme for highways was proposed. Based on the working condition classification, the working conditions of a certain section of the highway were classified, and the purpose of achieving balanced control of vehicle ruts was achieved by reasonably modifying this section of the road. The upper part shows the original modified road surface, and the lower horizontal line shows the adjusted reasonable modification scheme. It can be seen that different modification suggestions were proposed for different working conditions of this section of the road and were optimized. This ensured that the performance of this section met the requirements while achieving construction convenience and economy.
Figure 13.
Road modified road schematic diagram.
Figure 13.
Road modified road schematic diagram.
The permanent deformation of the project section is calculated by using the layered summation method :
In the formula, Δh represents the total deformation of the calculated pavement structure; hi represents the thickness of the i-th layer; represents the stress value of the i-th layer; represents the complex modulus of the i-th layer asphalt mixture.
Due to the difference between actual stress and triaxial test conducted in the laboratory [
28], a correction coefficient Kp is introduced. Therefore, the rutting prediction model is:
In the formula, RD represents the rut depth; KP represents the load correction coefficient, and when the tire pressure P = 0.7 MPa, KP is 1; Kl represents the hump coefficient, which is 0.5.
Using the above formula to calculate the ruts on this section of the road, the results show that the calculated ruts before modification were 6.23 mm, and after modification, they were reduced to 2.45 mm, which is close to the average rut depth of this section of road (2.36 mm). This indicates that reasonable modification for different working conditions is important for controlling rut balance on asphalt pavement.
5. Conclusions
By simulating and calculating the mechanical response of each layer of the engineering road section and classifying the mechanical response between layers under different working conditions into different levels, a reasonable modification scheme was proposed for different working conditions using clustering analysis. The effect of modification was evaluated based on actual working conditions of a certain highway. The conclusions are as follows:
(1) By using Abaqus to establish a three-dimensional model and combining it with actual engineering simulation calculations to obtain the mechanical response change chart of shear stress and compressive stress for each layer of asphalt pavement under different working conditions, different working conditions were classified into three levels based on different stress conditions.
(2) Based on an investigation and analysis of current specifications for modified asphalt mixtures and performance indicators for different modified asphalt mixtures, a classification standard for modified asphalt mixture effects was proposed using K-clustering analysis. Based on this standard, reasonable matching between modification methods and different working conditions was proposed, and recommended modification methods were proposed for different working condition levels.
(3) Based on an engineering road section, a reasonable modification method for asphalt pavement was proposed in this paper and evaluated by calculating ruts. The results show that the modification effect is good and can improve the overall life of the pavement while controlling rut balance.
Author Contributions
“Conceptualization, L.Y.L. and W.X.C.; methodology, J.A.Q.; software, L.Y.L; validation, L.Y.L and W.X.C..; formal analysis, J.A.Q.; investigation, L.Y.L.; data curation, L.Y.L.; writing—original draft preparation, J.A.Q.; writing—review and editing, J.A.Q; supervision, S.L.P and L.M; project administration, W.X.C.
Funding
This research received no external funding.
Institutional Review Board Statement
Not applicable.
Informed Consent Statement
Not applicable.
Data Availability Statement
All data used during the study appear in the published article.
Conflicts of Interest
The authors declare no conflict of interest.
References
- WANG Xuan-cang, HOU Guo-rong. Structure Design of Long-life Pavement[J]. Journal of Traffic and Transportation Engineering 2007, 7, 46–49. [Google Scholar]
- He Hai,WANG Chao-hui,LIU Zhi-sheng,et al. Study on Preparation Road Performance of New Inorganic Fire retardant Modified Asphalt[J]. Journal of Highway and Transportation Research and Development 2014, 31, 45–52. [Google Scholar]
- PARK DY, BUCH N, CHATTIK, et al. Development of Effective Layer Temperature Prediction Model and Temperature Correction Using FWD Deflection[J]. Transportation Research Record 2001, 1764, 97–111. [CrossRef]
- RAAB C, PARTL M N. investigation into a long term interlayer bonding of asphalt pavements [J]. Baltic Journal of Road and Bridge Enginering 2008, 3, 65–70. [Google Scholar] [CrossRef]
- YANG Jun,LI Wei-nong, CHEN Zhi-wei, et al. Finite Element Analysis of Asphalt Pavement on Long-steep Longitudinal Slope[J]. Journal of Traffic and Transportation Engineering 2010, 10, 20–24. [Google Scholar]
- Cao, Y. Mechanical Response and Design Method of Asphalt Pavement on Steep Slope and Sharp Turning Section[D]. Chongqing Jiaotong University: Chongqing, China, 2010.
- Li Fuhai, Jin Hesong, Yu Yongjiang and so on. Quality grading optimization evaluation of recycled concrete coarse aggregate [J]. Journal of Southwest Jiaotong University 2019, 54, 793–800. [Google Scholar]
- ERES Division of ARA Inc. Guide for Mechanistic empirical Design of New and Rehabilitated Pavement Structures [R]. Transportation Research Board: Washington, DC, USA, 2004.
- CAO Gao-shang, XU Zhen-zhen, WANH Xuan-cang, et al. Laboratory Experimental Research on Road Performance of Rubber Particles Asphalt Mixture [J]. Engineering Journal of Wuhan University 2014, 34, 38–44. [Google Scholar]
- ZENG Yong-wang, SU Zi-yuan, SUN Xiao-wen, et al. Treatment of Bridge Deck Based on Actual Working Conditions and Effect[J]. Road Machinery&Construction Mechanization 2017, 34, 76–81. [Google Scholar]
- MA Xiao-ning, WANG Xuan-cang, ZHU Jin-peng. Study of Inter-laminar Treatment between Surface Layer and Base Layer for Asphalt Pavement in Xin jiang Region[J]. Engineering Journal of Wuhan University 2016, 49, 407–410. [Google Scholar]
- MONTANELLI E F, SRL I. Fiber/Polymeric Compound for High Modulus Polymer Modified Asphalt(PMA)[J]. Procedia—Social and Behavioral Sciences 2013, 104, 39–48. [Google Scholar] [CrossRef]
- PENG Yong, SONG Li-jun, SHI Yong-jiu, et al. Influence Factors of Shear Resistance of Asphalt Mixture[J]. Journal of Southeast University: Natural Science Edition 2007, 37, 330–333. [Google Scholar]
- Zhao Yongzhen, Li Meng, Wang Xuancang, etc. Study on performance classification of modified asphalt mixture based on cluster analysis [J]. Journal of Building Materials 2014, 17, 437–445. [Google Scholar]
- Chen Xiaobing, Xu Libin, Luo Ruilin, etc. Effect of longitudinal slope on mechanical response of steel bridge deck pavement [J]. Journal of Southeast University (English Edition) 2018, 34, 71–77. [Google Scholar]
- Chen Huaxin, Ma Lu, Song Lifang. Influence of vehicle driving state on mechanical response of asphalt concrete pavement structure [J]. Highway 2015, 60, 24–29. [Google Scholar]
- Xu Yongli, Sun Zhiming, Lei Mingchen. Mechanical Behavior of Cement Concrete Bridge Deck Pavement on Long Longitudinal Slope [J]. Highway 2013, 1–5.
- J. Zhao, X. Wang, L. Xin, J. Ren, Y. Cao, Y. Tian, Concrete pavement with microwave heating enhancement functional layer for efficient de-icing: Design and case study. Cold Reg. Sci. Technol. 2023, 210, 103846. [CrossRef]
- HERMANSSON, A. Simulation model for calculating pavement temperature including maximum temperature[J]. Journal of the Transportation Research Board 2000, 1699, 134–141. [Google Scholar] [CrossRef]
- Hou Gui, Wang Xuancang, Zhao Lun, etc. The inter-layer working state of bridge deck pavement in cold regions [J]. Journal of Chang 'an University (Natural Science Edition) 2018, 38, 39–47. [Google Scholar]
- P.C. Cao, Z.Y. Guo, Y.S. Yang, Z.C. Xue, Analysis of effects of high temperature and shear stress on asphalt binder. Appl. Mech. Mater. 2013, 281, 603–606. [CrossRef]
- Luo Yaofei, Zhang Zhengqi, Zhang Kao. Sensitivity analysis of influencing factors of shear stress of asphalt pavement under high temperature conditions [J]. Journal of Wuhan University (Engineering Edition) 2018, 51, 895–900. [Google Scholar] [CrossRef]
- Saaty T L, Zhang L. The need for adding judgment in bayesian prediction[J]. International Journal of Information Technology & Decision Making 2016, 15, 733–761. [Google Scholar]
- LI Xi, WANG Xuan cang, YE Hong yu, et al. Study on matching relationship of asphalt pavement rational modification based on actual working conditions[J]. Journal of Highway and Transportation Research and Development 2018, 35, 26–35. [Google Scholar]
- Xie Xiangbing, Bao Meng, Li Guanghui, etc. Evaluation index and classification of mixed recycled coarse aggregate based on improved grey entropy correlation analysis [J]. Silicate Bulletin 2022, 41, 354–362. [Google Scholar] [CrossRef]
- Dong Weizhi, Zhang Shuang, Zhu Fu. Pavement performance evaluation of asphalt mixture based on extension analytic hierarchy process [J]. Journal of Jilin University (Engineering Edition) 2021, 51, 2137–2143. [Google Scholar] [CrossRef]
- Wang X, Zhao J, Li Q, Fang N, Wang P, Ding L, Li S. A hybrid model for prediction in asphalt pavement performance based on support vector machine and grey relation analysis. J Adv Transp 2020. [Google Scholar] [CrossRef]
- Ye Hongyu, Wang Xuancang, Fang Naren, etc. Study on the classification and treatment measures of interlayer working conditions of airport asphalt pavement overlay in hot and humid areas [J]. Journal of Wuhan University (Engineering Edition) 2020, 53, 123–131. [Google Scholar] [CrossRef]
|
Disclaimer/Publisher’s Note: The statements, opinions and data contained in all publications are solely those of the individual author(s) and contributor(s) and not of MDPI and/or the editor(s). MDPI and/or the editor(s) disclaim responsibility for any injury to people or property resulting from any ideas, methods, instructions or products referred to in the content. |
© 2023 by the authors. Licensee MDPI, Basel, Switzerland. This article is an open access article distributed under the terms and conditions of the Creative Commons Attribution (CC BY) license (http://creativecommons.org/licenses/by/4.0/).


