Submitted:
18 August 2023
Posted:
21 August 2023
You are already at the latest version
Abstract
Keywords:
1. Introduction
2. Materials and Methods
2.1. Cell culture
2.2. Mercury compounds
2.3. Cell viability
2.4. Determination of gene expression
2.4.1. RNA Isolation
2.4.2. RNA quantification and cDNA synthesis
2.4.3. qRT-PCR
| Gene | Forward sequence | Reverse sequence |
|---|---|---|
| GAPDH | 5´GGA GAG TGT TTC CTC GTC CC 3´ | 5´ATG AAG GGG TCG TTG ATG GC 3´ |
| iNOS | 5´GTT CTC AGC CCA ACA ATA CAA GA 3´ | 5´GTG GAC GGG TCG ATG TCA C 3´ |
| TNF-α | 5´TAG CCC ACG TCG TAG CAA AC 3´ | 5´GCA GCC TTG TCC CTT GAA GA 3´ |
| IL-1β | 5´TGC CAC CTT TTG ACA GTG ATG 3´ | 5´ATG TGC TGC TGC GAG ATT TG 3´ |
2.5. Determination of microglia autophagy
2.6. Assessment of microglia Senescence
2.7. Statistical analysis
3. Results
3.1. Cytotoxicity effects of TmHg and EtHg on N9 cell line
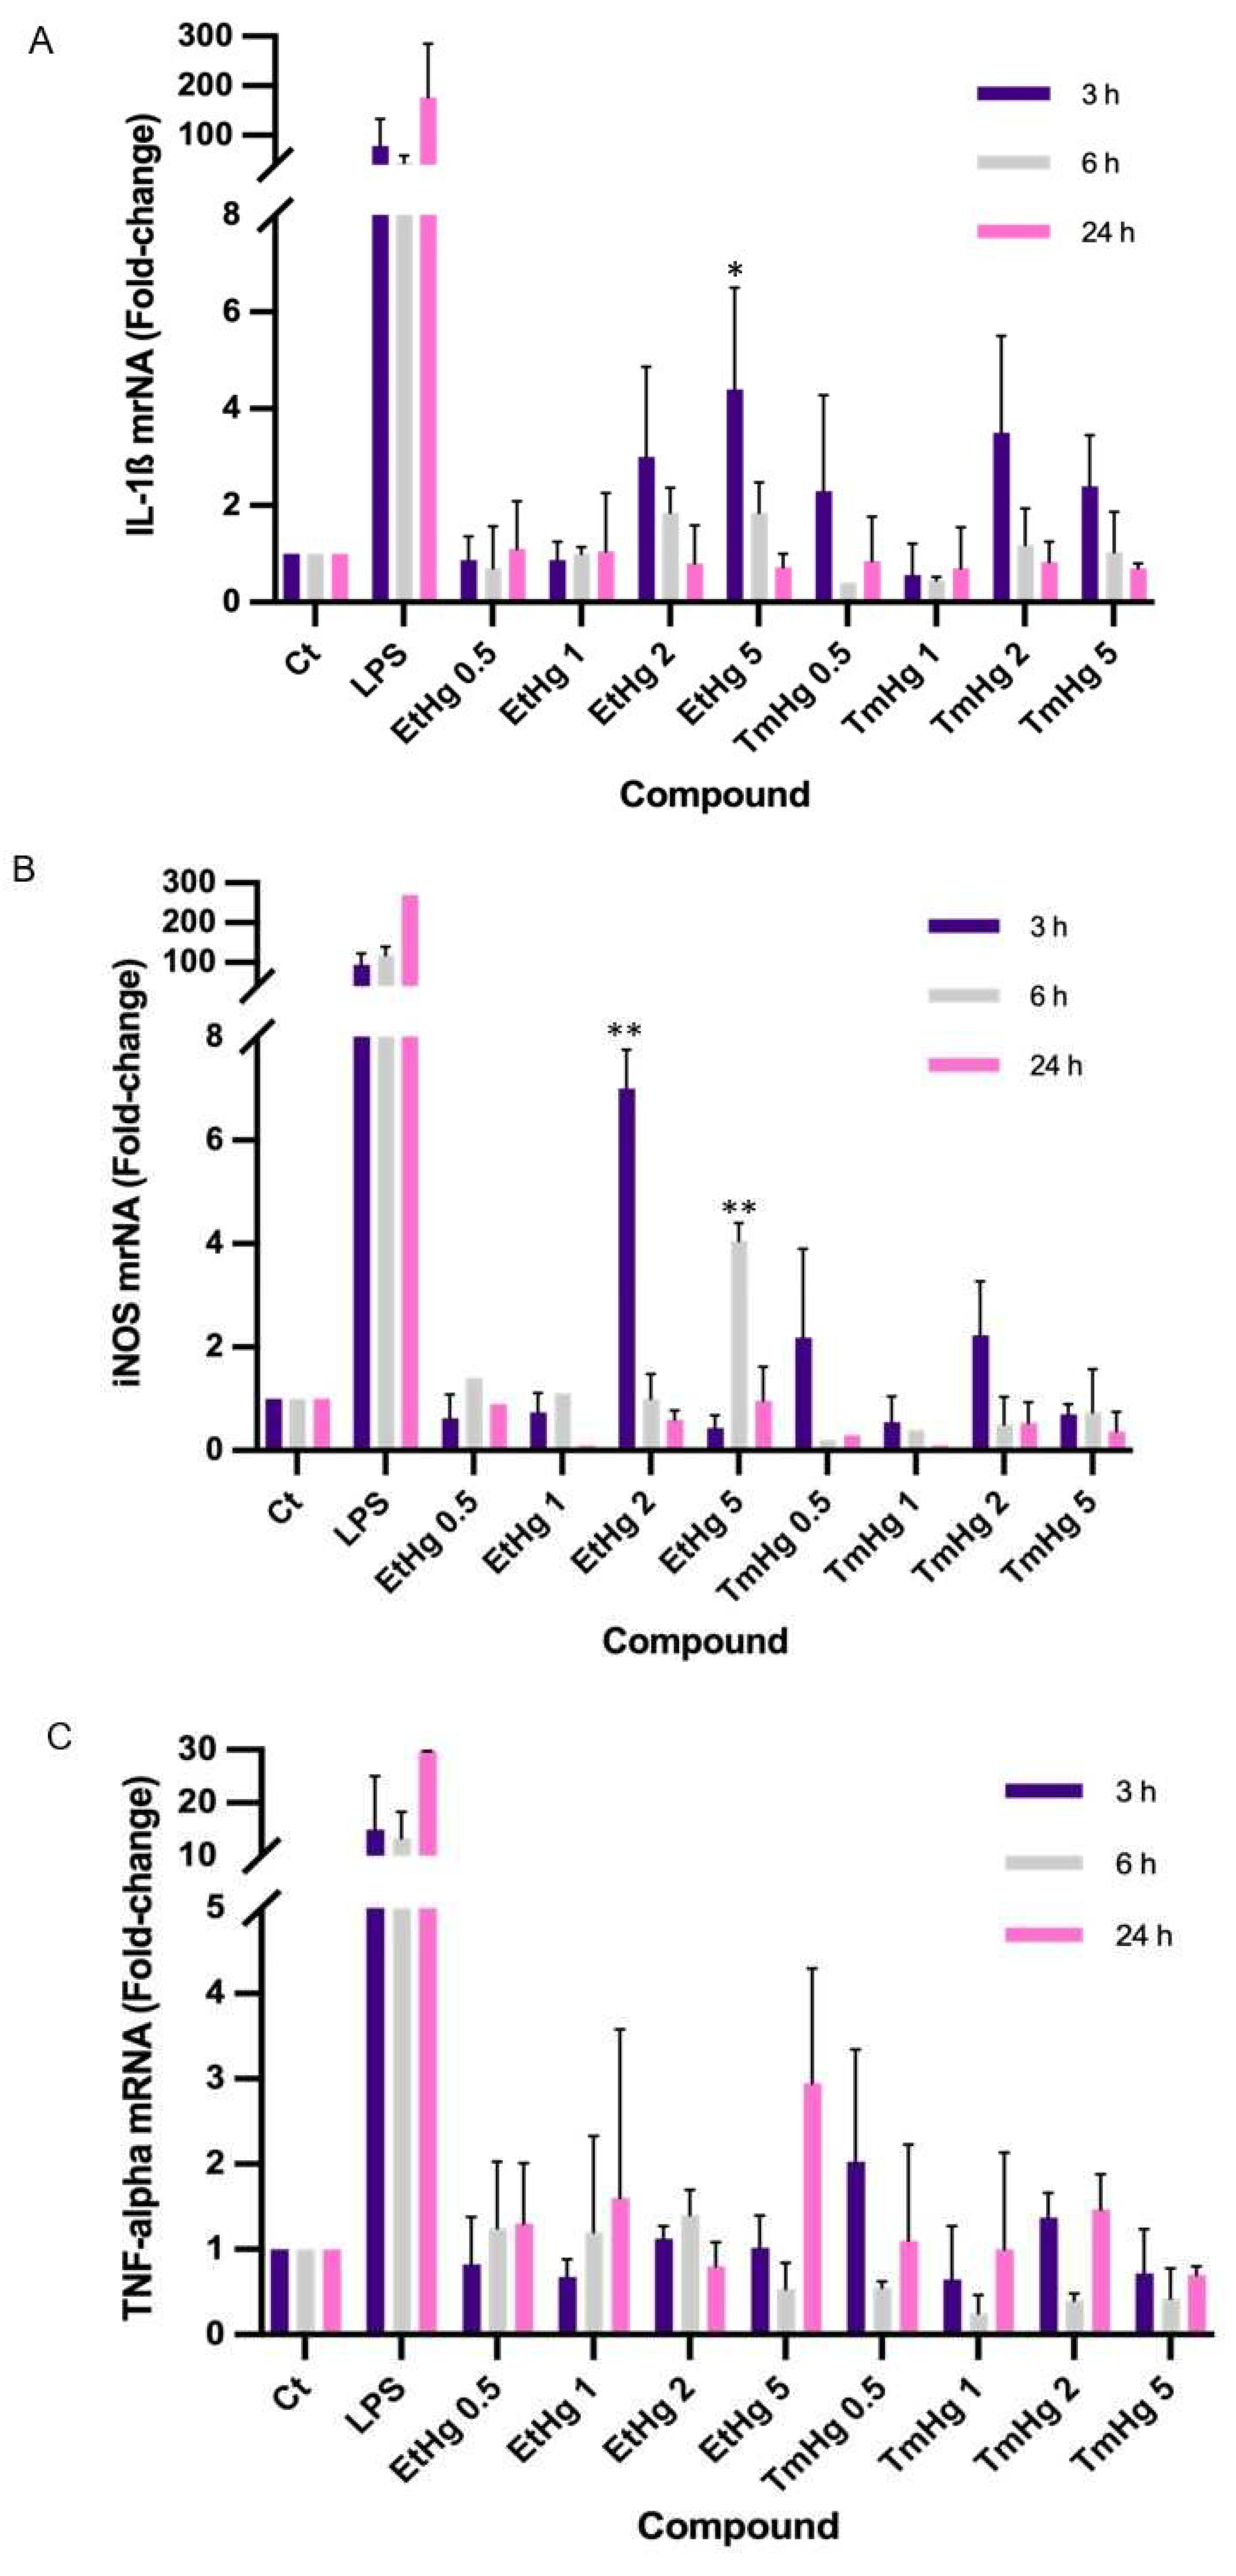
3.2. Effects of TmHg/EtHg at pro-inflammatory markers
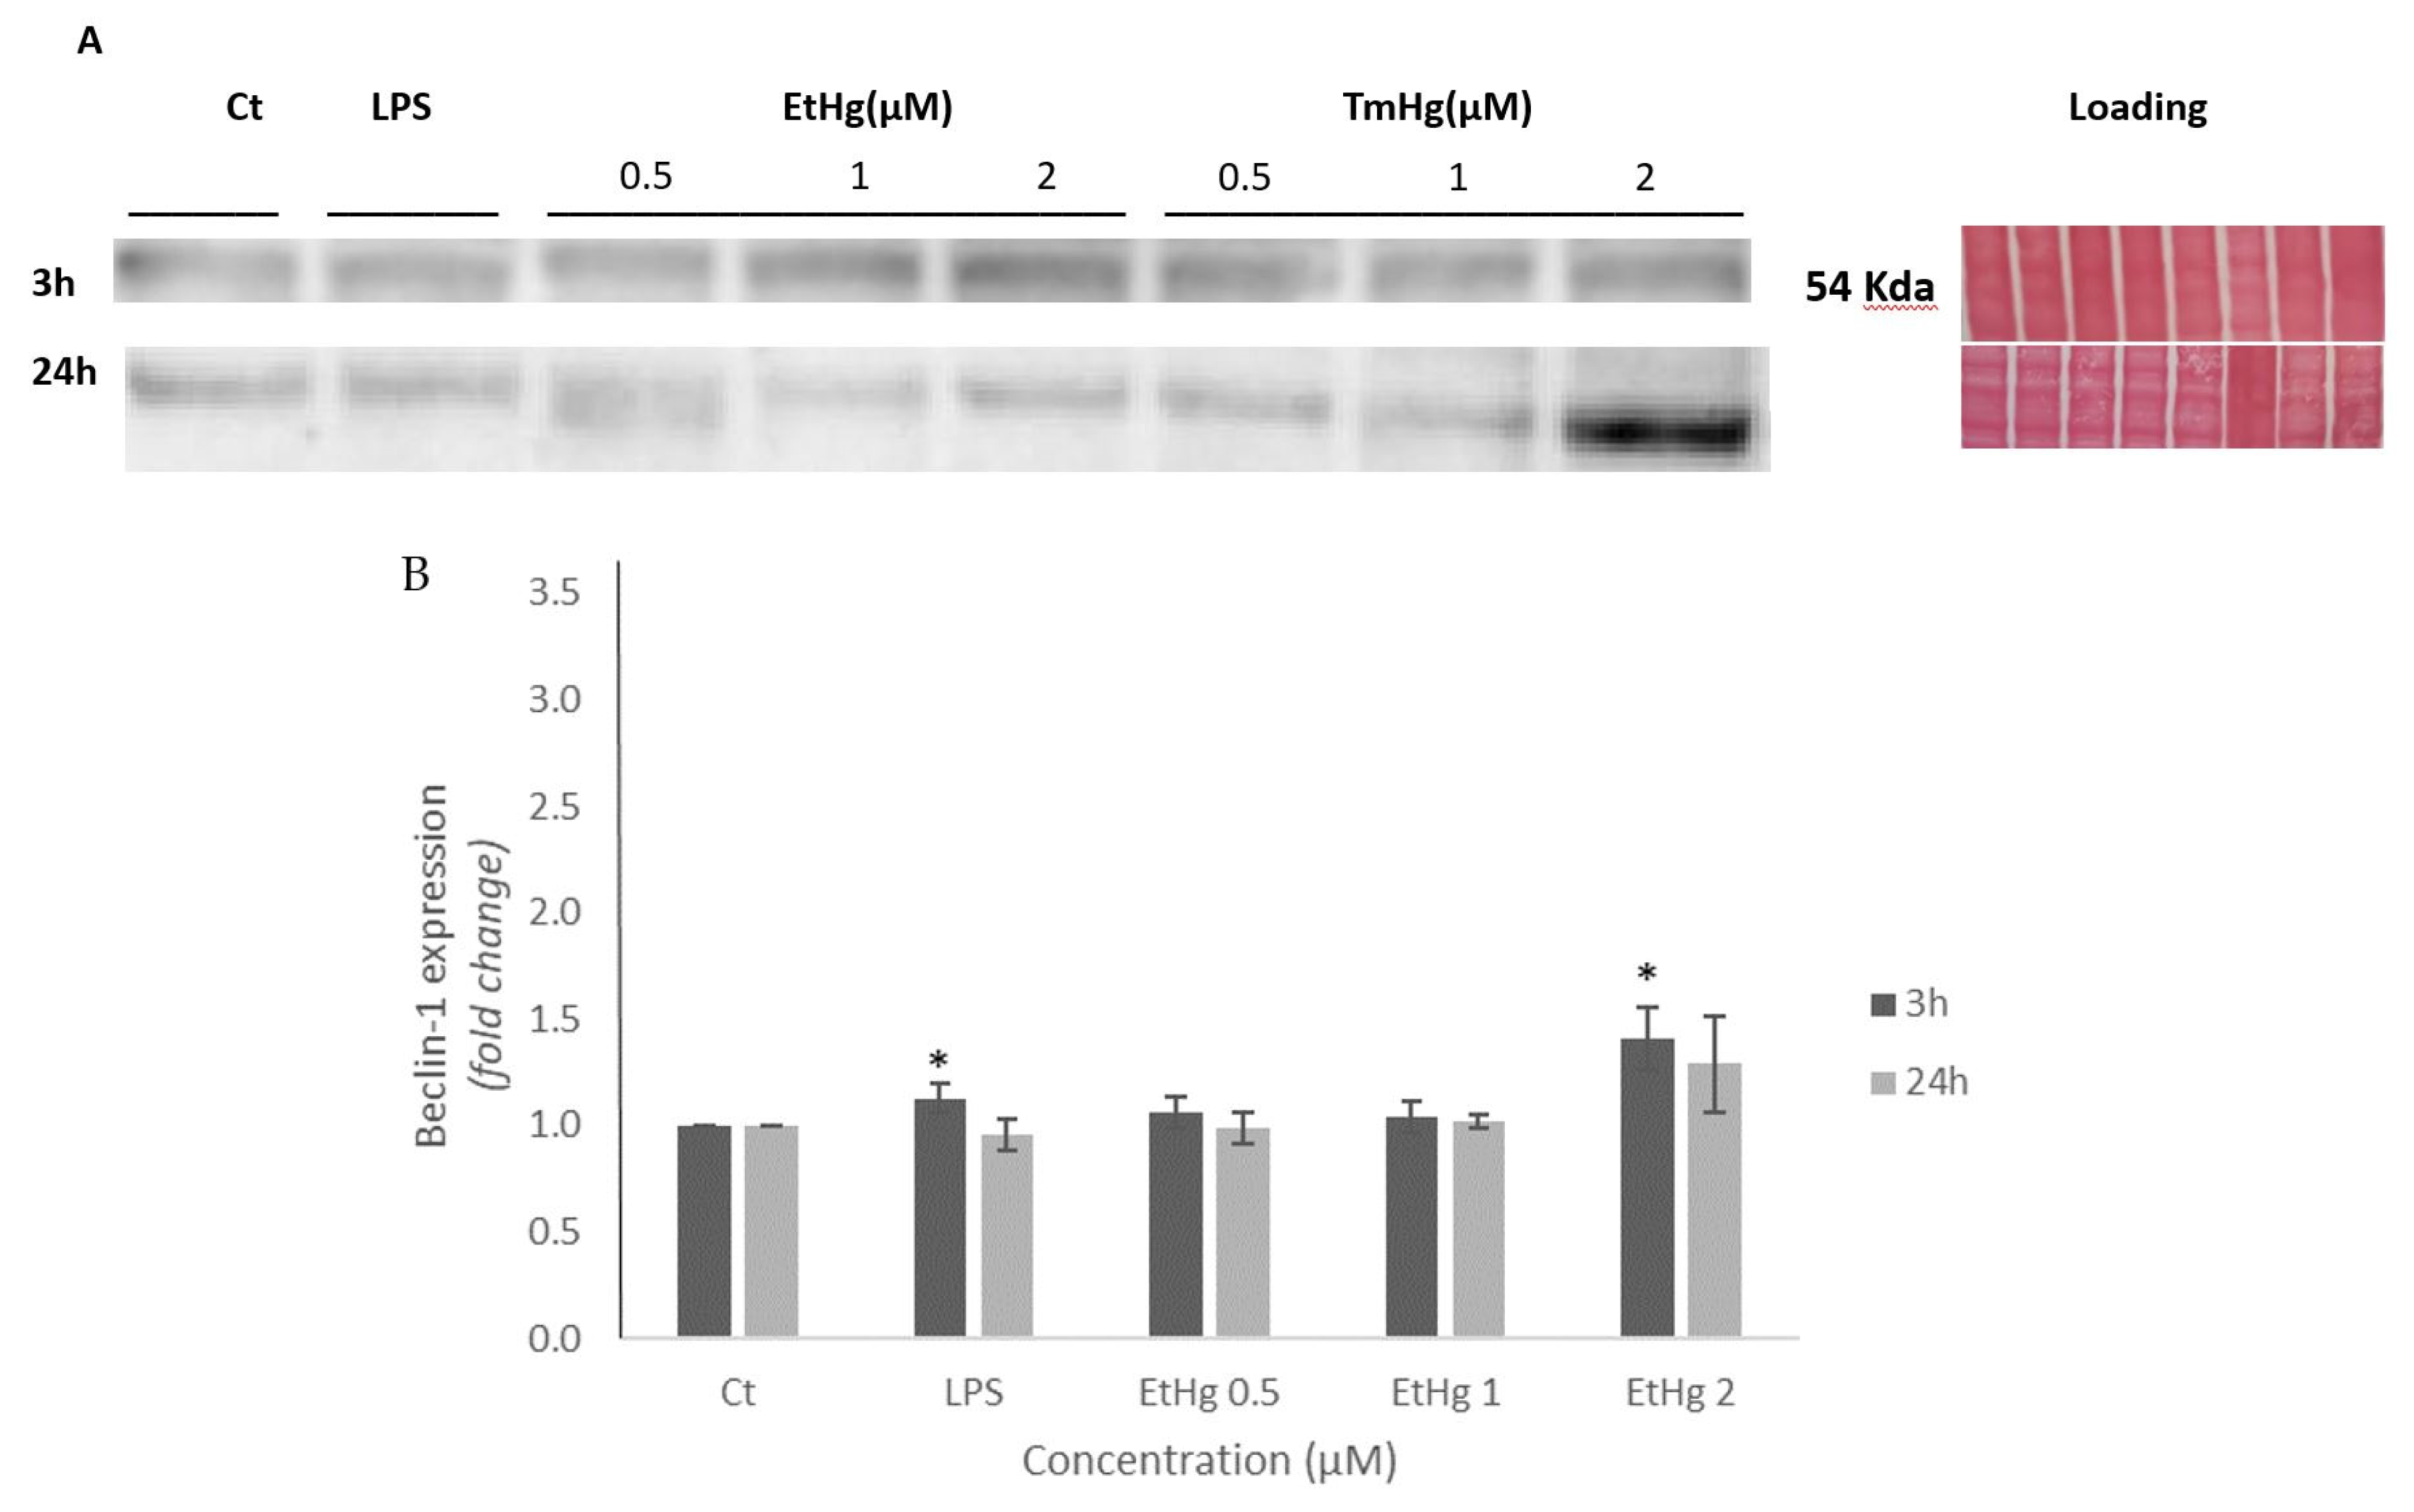
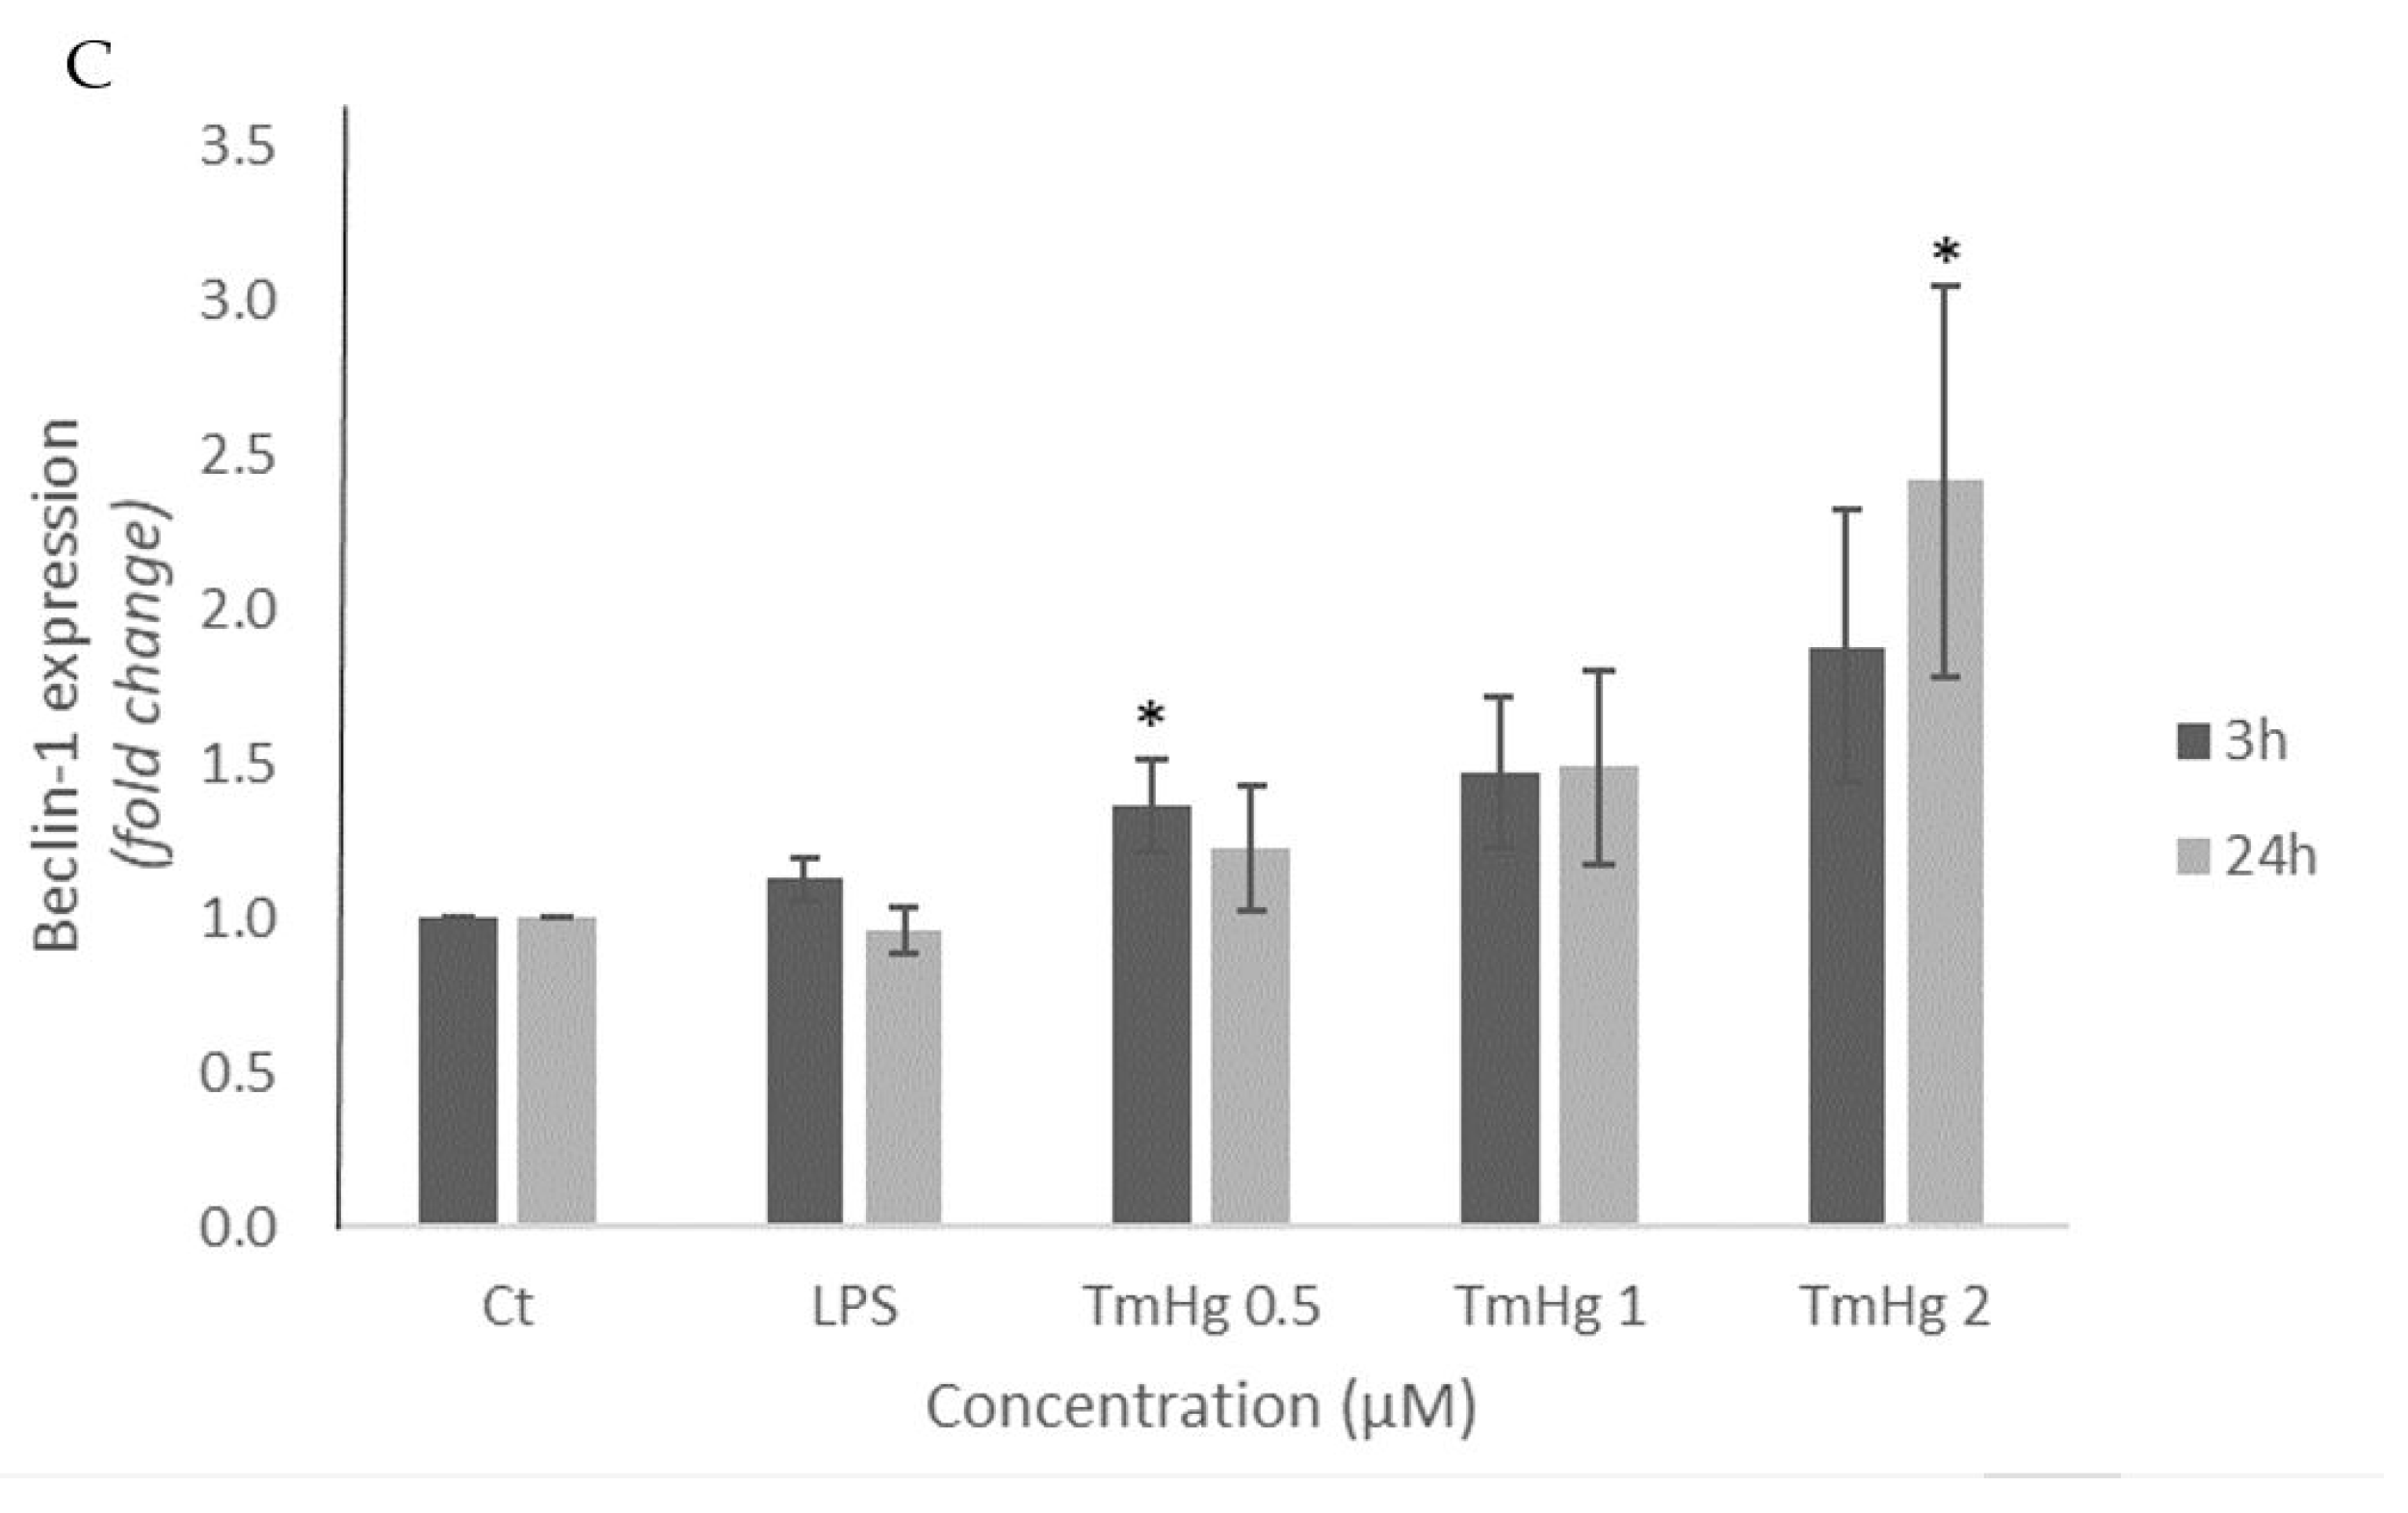
3.3. Autophagy evaluation: Beclin-1 expression
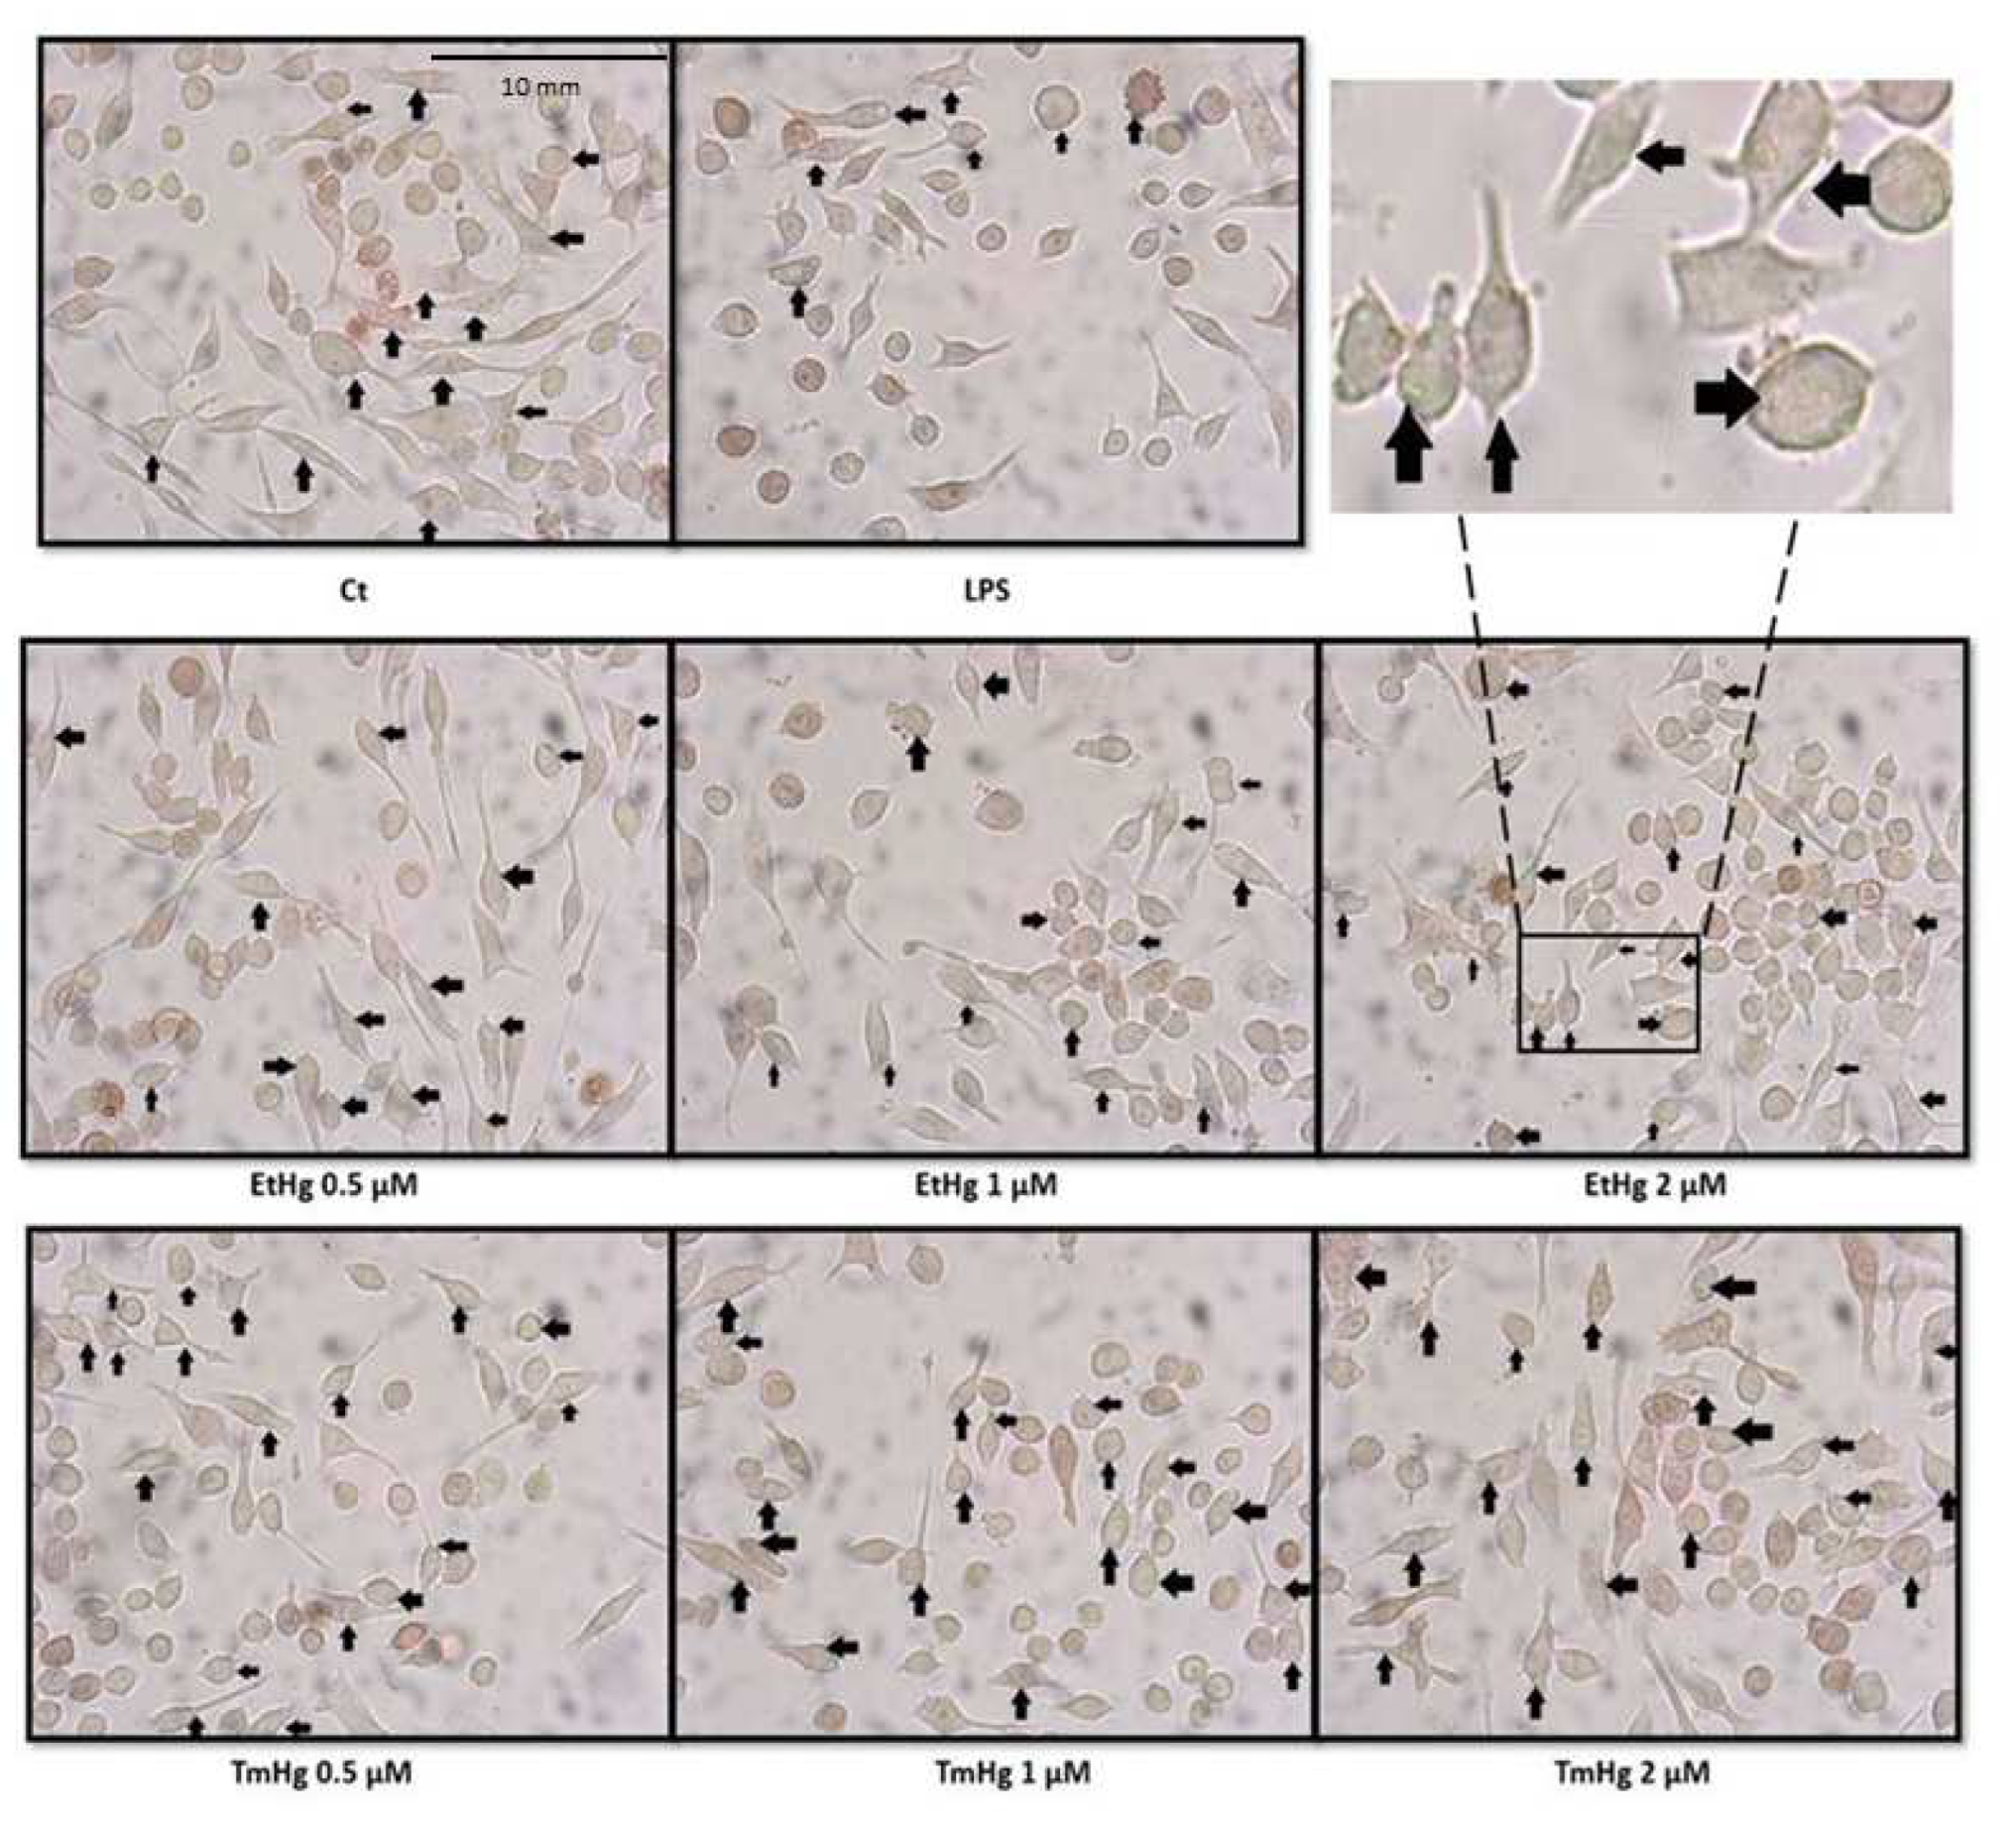
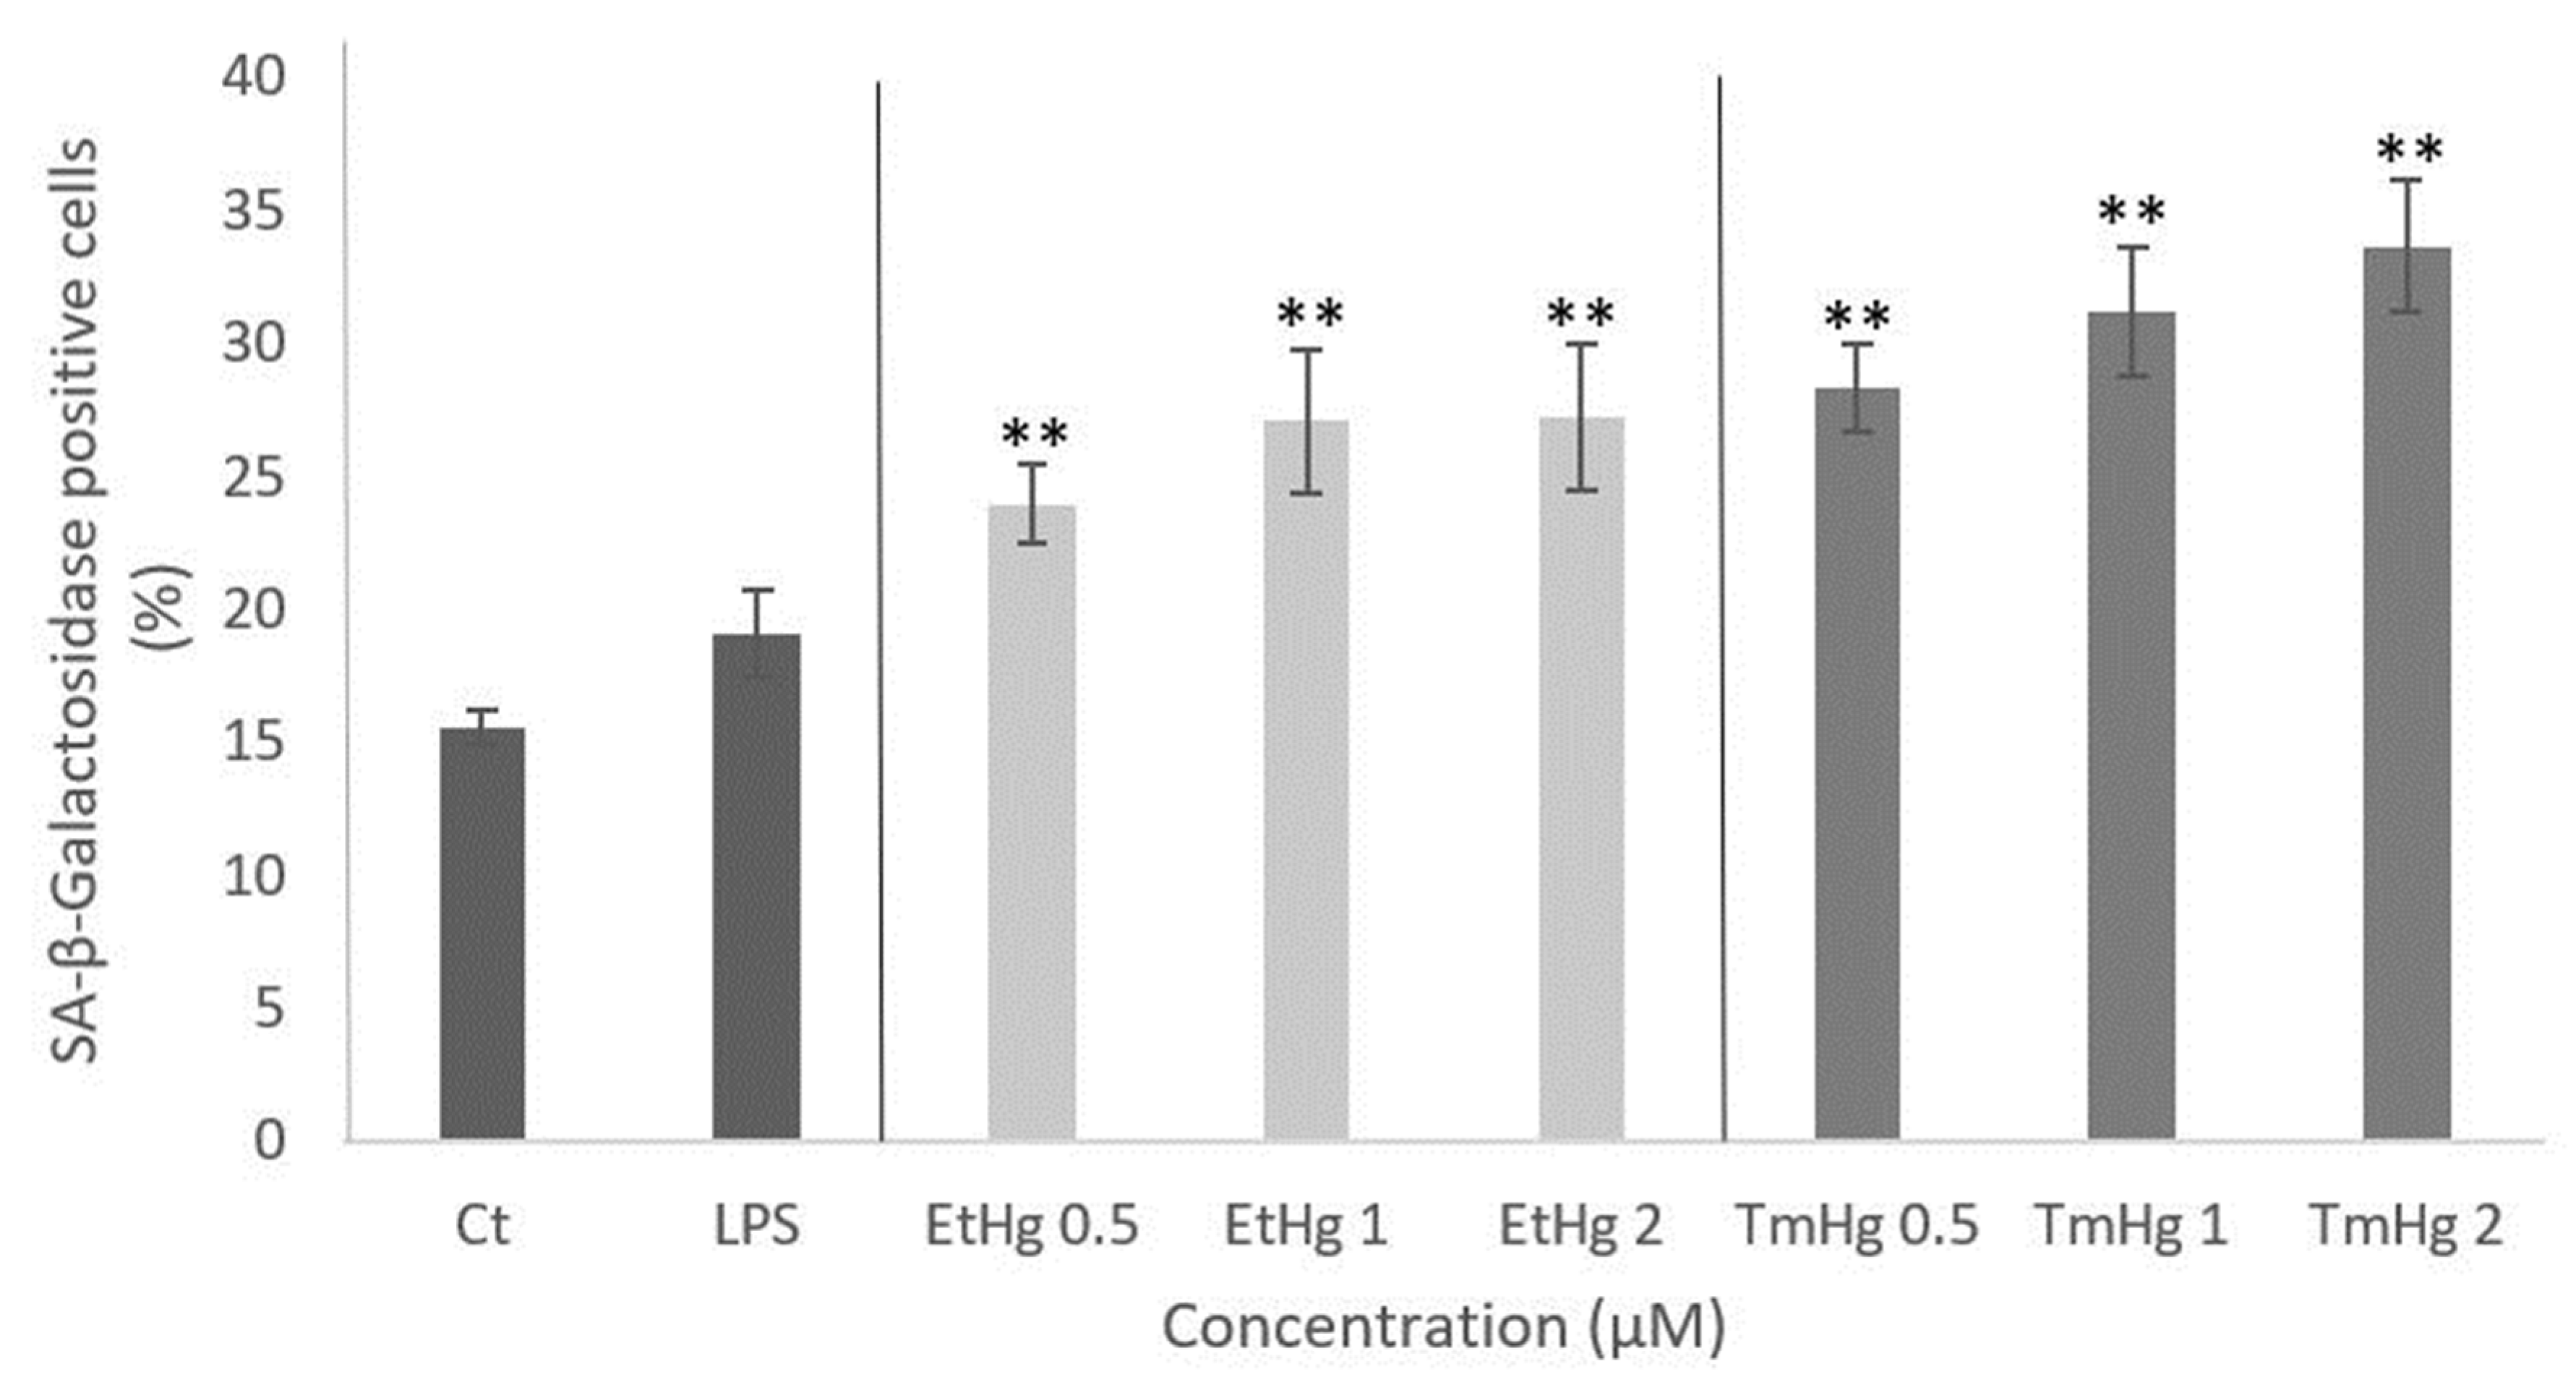
3.4. Senescence evaluation
4. Discussion
5. Conclusions
Author Contributions
Funding
Institutional Review Board Statement
Informed Consent Statement
Data Availability Statement
Conflicts of Interest
References
- Figueiredo, N.L.; Canário, J.; O’Driscoll, N.J.; Duarte, A.; Carvalho, C. Aerobic Mercury-resistant bacteria alter Mercury speciation and retention in the Tagus Estuary (Portugal). Ecotoxicol Environ Saf. 2016, 124, 60–67. [Google Scholar] [CrossRef] [PubMed]
- Carocci, A.; Catalano, A.; Lauria, G.; Sinicropi, M.S.; Genchi, G. Brief History of the Development of the Transfusion Service, How to Recruit Voluntary Donors in the Third World? 2015, 238, 22–28. [Google Scholar] [CrossRef]
- Bernhoft, R.A. Mercury toxicity and treatment: A review of the literature. J Environ Public Health. 2012, 2012. [Google Scholar] [CrossRef] [PubMed]
- Caetano, T.; Branco, V.; Cavaco, A.; Carvalho, C. Risk assessment of methylmercury in pregnant women and newborns in the island of Madeira (Portugal) using exposure biomarkers and food-frequency questionnaires. Journal of Toxicology and Environmental Health - Part A: Current Issues. 2019, 82, 833–844. [Google Scholar] [CrossRef] [PubMed]
- Watson, G.E.; Brewer, R.; Zareba, G.; Eto, K.; Takahashi, H.; Marumoto, M.; Love, T.; Gary, J.; Neurology, C.; City, M.; Section, P.; Disease, M.; City, M.; Biology, C. HHS Public Access, 2021, 88–98. [CrossRef]
- Sharpe, M.A.; Livingston, A.D.; Baskin, D.S. Thimerosal-derived ethylmercury is a mitochondrial toxin in human astrocytes: Possible role of fenton chemistry in the oxidation and breakage of mtDNA. J Toxicol. 2012. [Google Scholar] [CrossRef] [PubMed]
- Cinca, I.; Dumitrescu, I.; Onaca, P.; Serbanescu, A.; Nestorescu, B. Accidental ethyl mercury poisoning with nervous system, skeletal muscle, and myocardium injury. J of Neurology, Neurosurgery, and Psychiatry 1979. [Google Scholar] [CrossRef]
- Migdal, C.; Tailhardat, M.; Courtellemont, P.; Haftek, M.; Serres, M. Responsiveness of human monocyte-derived dendritic cells to thimerosal and mercury derivatives. Toxicol Appl Pharmacol. 2010, 246, 66–73. [Google Scholar] [CrossRef]
- Migdal, C.; Foggia, L.; Tailhardat, M.; Courtellemont, P.; Haftek, M.; Serres, M. Sensitization effect of thimerosal is mediated in vitro via reactive oxygen species and calcium signaling. Toxicology. 2010, 274, 1–9. [Google Scholar] [CrossRef]
- Ida-Eto, M.; Oyabu, A.; Ohkawara, T.; Tashiro, Y.; Narita, N.; Narita, M. Prenatal exposure to organomercury, thimerosal, persistently impairs the serotonergic and dopaminergic systems in the rat brain: Implications for association with developmental disorders. Brain Dev. 2013, 35, 261–264. [Google Scholar] [CrossRef]
- FDA (Food and drug administration), Questions about vaccine safety. 2018. Available online: https://www.fda.gov/vaccines-blood-biologics/vaccines/thimerosal-vaccines-questions-and-answers (accessed on 16 August 2023).
- Norris, G.T.; Kipnis, J. Immune cells and CNS physiology: Microglia and beyond. Journal of Experimental Medicine. 2019, 216, 60–70. [Google Scholar] [CrossRef]
- Poon, C.C.; Sarkar, S.; Yong, V.W.; Kelly, J.J.P. Glioblastoma-associated microglia and macrophages: Targets for therapies to improve prognosis. Brain. 2017, 140, 1548–1560. [Google Scholar] [CrossRef] [PubMed]
- Colonna, M.; Butovsky, O. Microglia function in the central nervous system during health and neurodegeneration. Annu Rev Immunol. 2017, 35, 441–468. [Google Scholar] [CrossRef] [PubMed]
- Soares, N.L.; Vieira, H.L.A. Microglia at the Centre of Brain Research: Accomplishments and Challenges for the Future. Neurochem Res. 2022, 47, 218–233. [Google Scholar] [CrossRef] [PubMed]
- Colonna, M.; Butovsky, O. Microglia function in the central nervous system during health and neurodegeneration. Annu Rev Immunol. 2017, 35, 441–468. [Google Scholar] [CrossRef]
- Kan, L.K.; Williams, D.; Drummond, K.; O’Brien, T.; Monif, M. The role of microglia and P2X7 receptors in gliomas. J Neuroimmunol. 2019, 332, 138–146. [Google Scholar] [CrossRef]
- Wolf, S.A.; Boddeke, H.W.G.M.; Kettenmann, H. Microglia in Physiology and Disease. Annu Rev Physiol. 2017, 79, 619–643. [Google Scholar] [CrossRef]
- Greenwood, E.K.; Brown, D.R. Senescent microglia: The key to the ageing brain? Int J Mol Sci. 2021, 22. [Google Scholar] [CrossRef]
- Martínez-Zamudio, R.I.; Dewald, H.K.; Vasilopoulos, T.; Gittens-Williams, L.; Fitzgerald-Bocarsly, P.; Herbig, U. Senescence-associated β-galactosidase reveals the abundance of senescent CD8+ T cells in aging humans. Aging Cell. 2021, 20, 1–15. [Google Scholar] [CrossRef]
- He, C.; Levine, B. The Beclin 1 interactome. Curr Opin Cell Biol. 2010, 22, 140–149. [Google Scholar] [CrossRef]
- Aman, Y.; Schmauck-Medina, T.; Hansen, M.; Morimoto, R.I.; Simon, A.K.; Bjedov, I.; Palikaras, K.; Simonsen, A.; Johansen, T.; Tavernarakis, N.; Rubinsztein, D.C.; Partridge, L.; Kroemer, G.; Labbadia, J.; Fang, E.F. Autophagy in healthy aging and disease. Nat Aging. 2021, 1, 634–650. [Google Scholar] [CrossRef]
- Young, A.R.J.; Narita, M.; Ferreira, M.; Kirschner, K.; Sadaie, M.; Darot, J.F.J.; Tavaré, S.; Arakawa, S.; Shimizu, S.; Watt, F.M.; Narita, M. Autophagy mediates the mitotic senescence transition. Genes Dev. 2009, 23, 798–803. [Google Scholar] [CrossRef] [PubMed]
- Caldeira, C.; Cunha, C.; Vaz, A.R.; Falcão, A.S.; Barateiro, A.; Seixas, E.; Fernandes, A.; Brites, D. Key aging-associated alterations in primary microglia response to beta-amyloid stimulation. Front Aging Neurosci. 2017, 9, 1–23. [Google Scholar] [CrossRef] [PubMed]
- Badie, B.; Schartner, J. Role of microglia in glioma biology. Microsc Res Tech. 2001, 54, 106–113. [Google Scholar] [CrossRef] [PubMed]
- Watters, J.J.; Schartner, J.M.; Badie, B. Microglia function in brain tumors. J Neurosci Res. 2005, 81, 447–455. [Google Scholar] [CrossRef]
- Vaz, A.R.; Pinto, S.; Ezequiel, C.; Cunha, C.; Carvalho, L.A.; Moreira, R.; Brites, D. Phenotypic effects of wild-type and mutant SOD1 expression in n9 murine microglia at steady state, inflammatory and immunomodulatory conditions. Front Cell Neurosci. 2019, 13, 1–15. [Google Scholar] [CrossRef] [PubMed]
- Kumar, P.; Nagarajan, A.; Uchil, P.D. Analysis of cell viability by the MTT assay. Cold Spring Harb Protoc. 2018, 2018, 469–471. [Google Scholar] [CrossRef]
- Oda, Y.; Sadakane, K.; Yoshikawa, Y.; Imanaka, T.; Takiguchi, K.; Hayashi, M.; Kenmotsu, T.; Yoshikawa, K. Highly Concentrated Ethanol Solutions: Good Solvents for DNA as Revealed by Single-Molecule Observation. ChemPhysChem. 2016, 17, 471–473. [Google Scholar] [CrossRef]
- Renaud, J.; Martinoli, M.G. Development of an insert co-culture system of two cellular types in the absence of cell-cell contact. Journal of Visualized Experiments. 2016, 2016, 1–12. [Google Scholar] [CrossRef]
- Itahana, K.; Campisi, J.; Dimri, G.P. Methods to detect biomarkers of cellular senescence: The senescence-associated β-galactosidase assay. Methods in Molecular Biology. 2007, 371, 21–31. [Google Scholar] [CrossRef]
- Brites, D.; Vaz, A.R. Microglia centered pathogenesis in ALS: Insights in cell interconnectivity. Front Cell Neurosci. 2014, 8, 1–24. [Google Scholar] [CrossRef]
- Nishioku, T.; Takai, N.; Miyamoto, K.I.; Murao, K.; Hara, C.; Yamamoto, K.; Nakanishi, H. Involvement of caspase 3-like protease in methylmercury-induced apoptosis of primary cultured rat cerebral microglia. Brain Res. 2000, 871, 160–164. [Google Scholar] [CrossRef] [PubMed]
- Branco, V.; Coppo, L.; Aschner, M.; Carvalho, C. N-Acetylcysteine or Sodium Selenite Prevent the p38-Mediated Production of Proinflammatory Cytokines by Microglia during Exposure to Mercury (II). Toxics. 2022, 10. [Google Scholar] [CrossRef] [PubMed]
- Kaur, P.; Aschner, M.; Syversen, T. Glutathione modulation influences methyl mercury induced neurotoxicity in primary cell cultures of neurons and astrocytes. Neurotoxicology. 2006, 27, 492–500. [Google Scholar] [CrossRef] [PubMed]
- Rodrigues, J.; Branco, V.; Lu, J.; Holmgren, A.; Carvalho, C. Toxicological effects of thiomersal and ethylmercury: Inhibition of the thioredoxin system and NADP+-dependent dehydrogenases of the pentose phosphate pathway. Toxicol Appl Pharmacol. 2015, 286, 216–223. [Google Scholar] [CrossRef] [PubMed]
- Ni, M.; Li, X.; Yin, Z.; Sidoryk-Weogonekgrzynowicz, M.; Jiang, H.; Farina, M.; Rocha, J.B.T.; Syversen, T.; Aschner, M. Comparative study on the response of rat primary astrocytes and microglia to methylmercury toxicity. Glia. 2011, 59, 810–820. [Google Scholar] [CrossRef]
- Bassett, T.; Bach, P.; Chan, H.M. Effects of methylmercury on the secretion of pro-inflammatory cytokines from primary microglial cells and astrocytes. Neurotoxicology. 2012, 33, 229–234. [Google Scholar] [CrossRef]
- Chen, L.; Deng, H.; Cui, H.; Fang, J.; Zuo, Z.; Deng, J.; Li, Y.; Wang, X.; Zhao, L. Inflammatory responses and inflammation-associated diseases in organs. 2018. Available online: www.impactjournals.com/oncotarget/.
- Su, P.; Zhang, J.; Wang, D.; Zhao, F.; Cao, Z.; Aschner, M.; Luo, W. The role of autophagy in modulation of neuroinflammation in microglia. Neuroscience. 2016, 319, 155–167. [Google Scholar] [CrossRef]
- Wang, R.C.; Wei, Y.; An, Z.; Zou, Z.; Xiao, G.; Bhagat, G.; White, M.; Reichelt, J.; Levine, B. Akt-mediated regulation of autophagy and tumorigenesis through Beclin 1 phosphorylation. Science (1979) 2012, 338, 956–959. [Google Scholar] [CrossRef]
- Ye, X.; Zhu, M.; Che, X.; Wang, H.; Liang, X.J.; Wu, C.; Xue, X.; Yang, J. Lipopolysaccharide induces neuroinflammation in microglia by activating the MTOR pathway and downregulating Vps34 to inhibit autophagosome formation. J Neuroinflammation. 2020, 17, 1–17. [Google Scholar] [CrossRef]
- Rajendran, P.; Alzahrani, A.M.; Hanieh, H.N.; Kumar, S.A.; Ammar, R.B.; Rengarajan, T.; Alhoot, M.A. Autophagy and senescence: A new insight in selected human diseases. J Cell Physiol. 2019, 234, 21485–21492. [Google Scholar] [CrossRef]
- Hanahan, D.; Weinberg, R.A. Hallmarks of cancer: The next generation. Cell. 2011, 144, 646–674. [Google Scholar] [CrossRef] [PubMed]
- Pires, V.; Bramatti, I.; Aschner, M.; Branco, V.; Carvalho, C. Thioredoxin Reductase Inhibitors as Potential Antitumors: Mercury Compounds Efficacy in Glioma Cells. Front Mol Biosci. 2022, 9, 1–11. [Google Scholar] [CrossRef] [PubMed]
- Bramatti, I.; Aschner, M.; Branco, V.; Carvalho, C. Co-exposure of human glioblastoma cells to Thimerosal and Temozolamide inhibits the thioredoxin system, HIF-1α, VEGF, and STAT3 phosphorylation. 2023. In Submission.
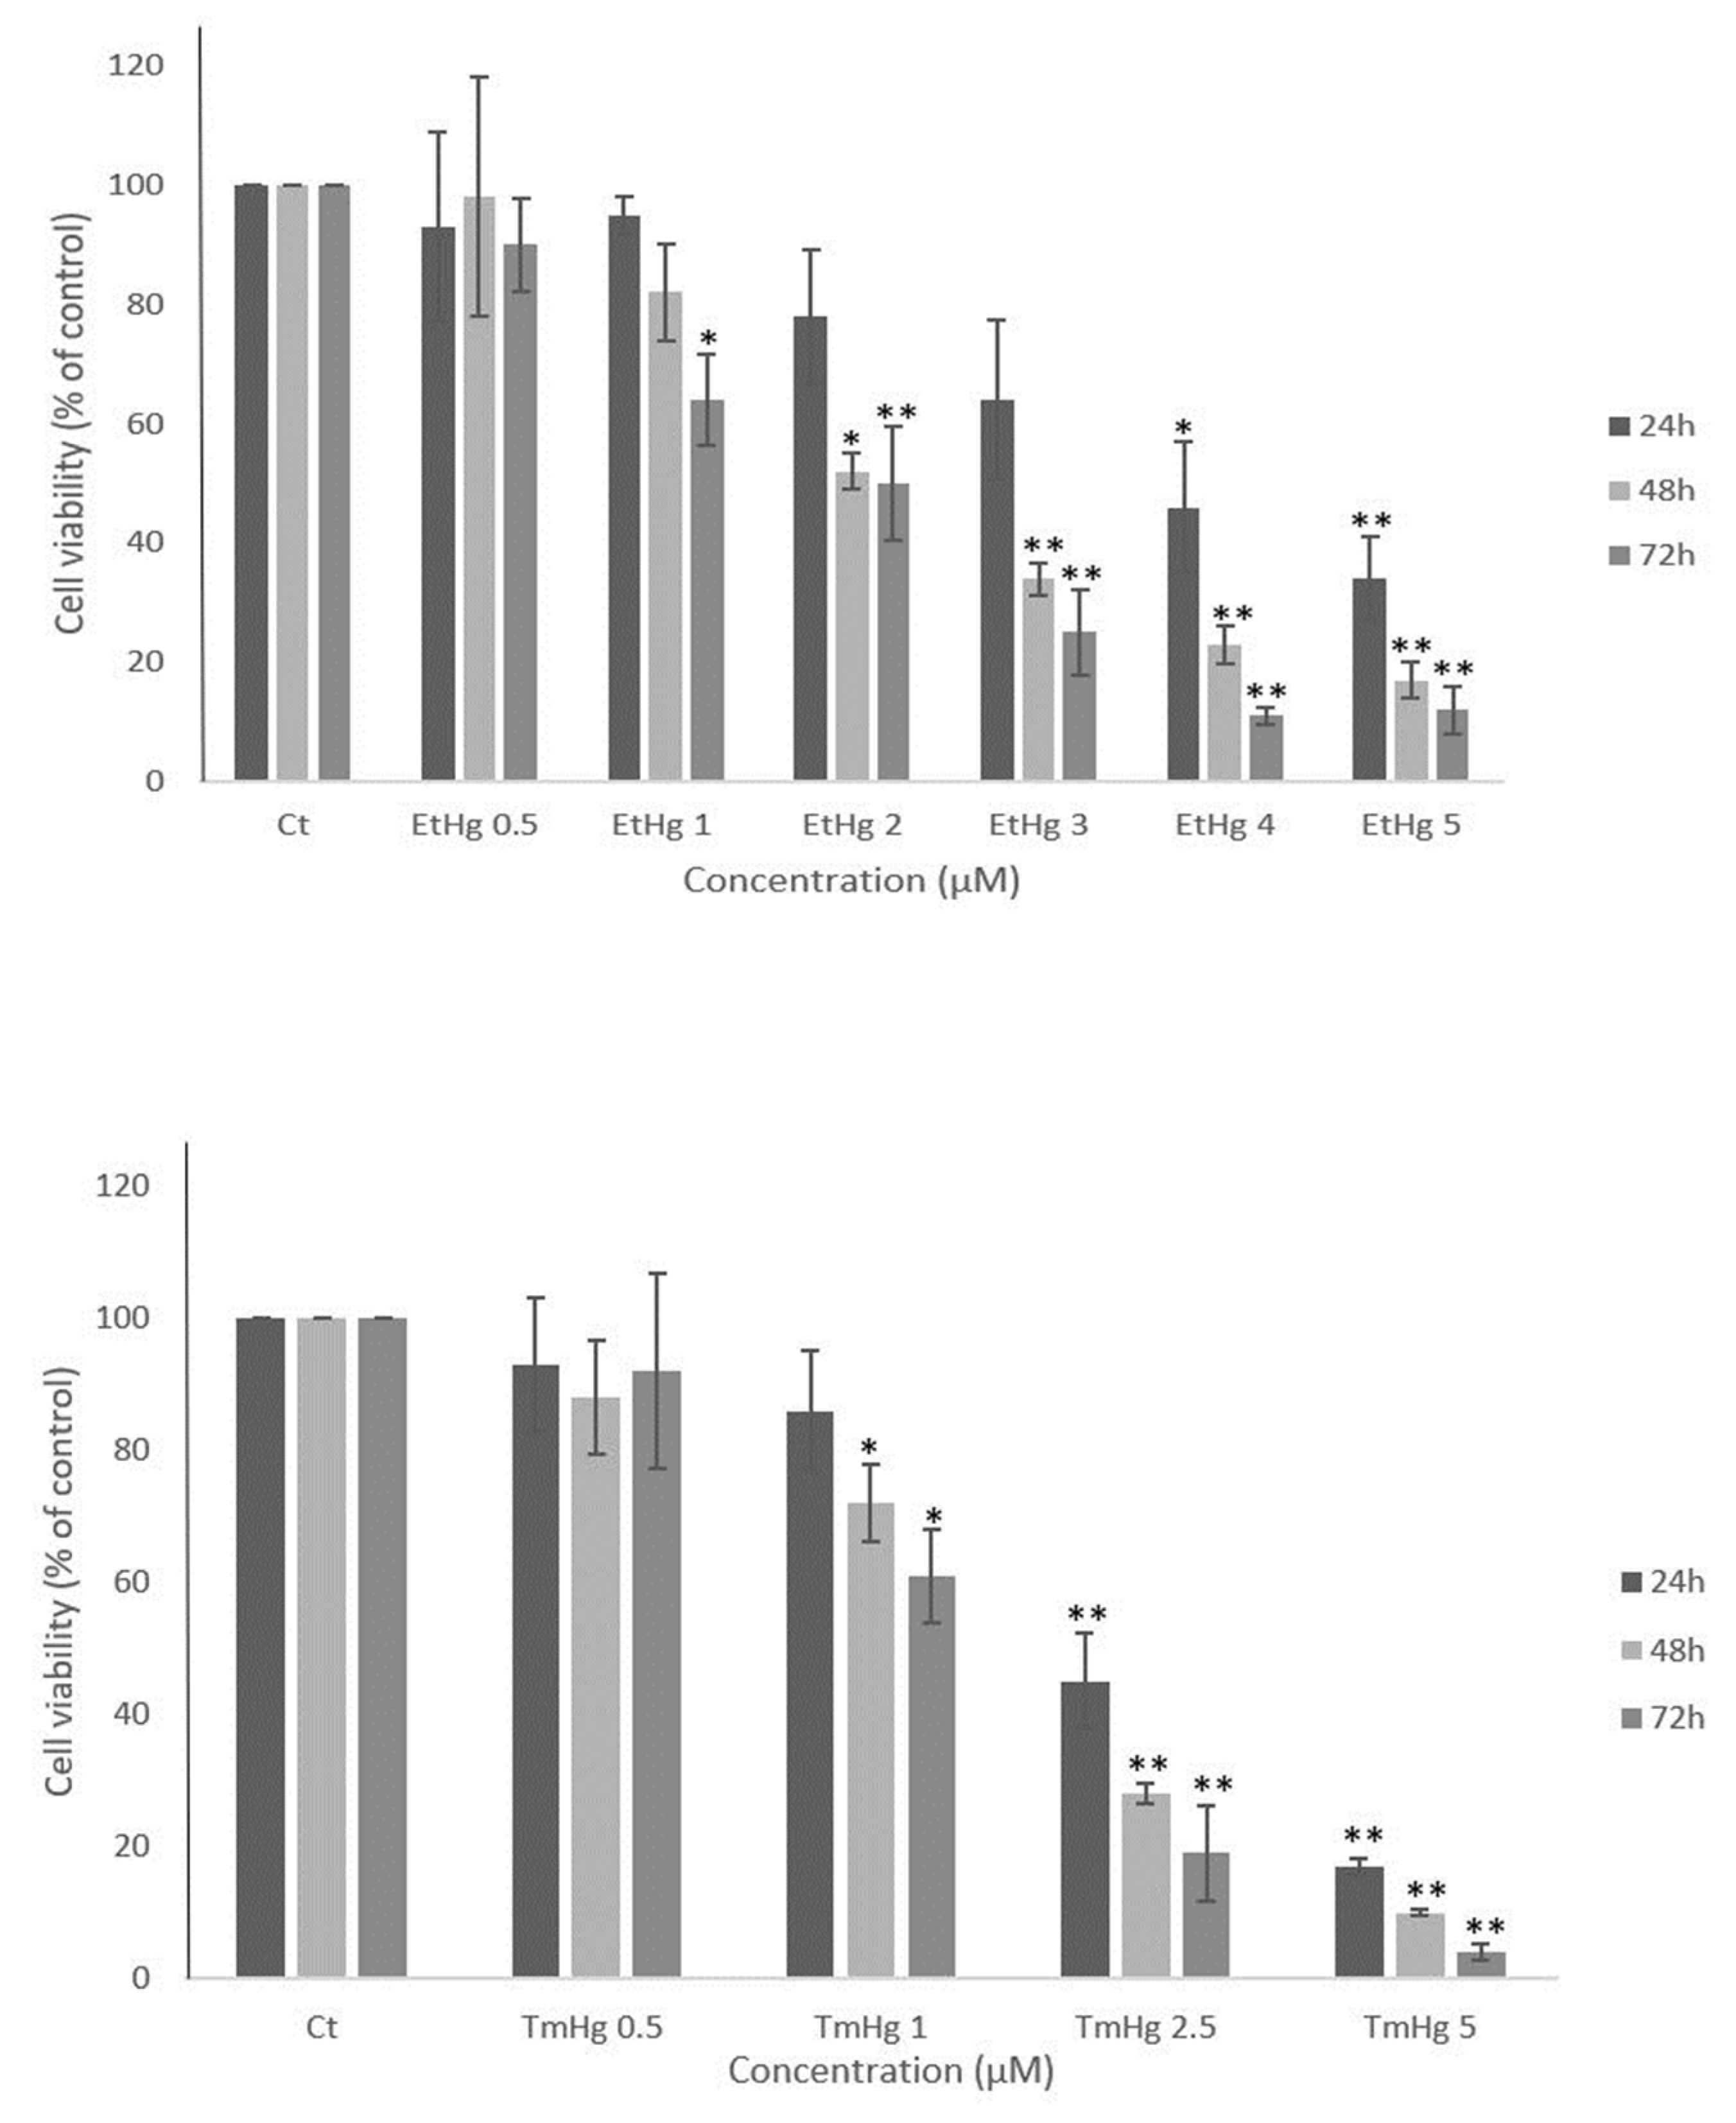
| Performed Assays | Reference | |||||
| Cell line | Compound | EC50 (μM) | LC50 (μM) | |||
| 24h | 48h | 72h | 24h | |||
| N9 | EtHg | 2.3 ± 0.9 | 1.5 ± 0.2 | 1.4 ± 0.5 | --------- | Presentdengfeistudy |
| TmHg | 1.4 ± 0.4 | 1.2 ± 0.1 | 1.0 ± 0.2 | --------- | ||
| MeHg | ------ | ------ | ----- | 2.6 | [33] | |
| Hg2+ | 42.1 ± 3.7 | ------ | ------ | ------ | [34] | |
| Cerebellar astrocytes | MeHg | 1.32 | ------ | ------ | ------ | [35] |
| SHSY5Y | EtHg | 2.38 ± 0.28 | 1.49 ± 0.57 | 2.05 ± 0.64 | ------ | [36] |
| TmHg | 4.67 ± 0.14 | 4.21 ± 0.79 | 2.70 ± 0.34 | ------ | ||
Disclaimer/Publisher’s Note: The statements, opinions and data contained in all publications are solely those of the individual author(s) and contributor(s) and not of MDPI and/or the editor(s). MDPI and/or the editor(s) disclaim responsibility for any injury to people or property resulting from any ideas, methods, instructions or products referred to in the content. |
© 2023 by the authors. Licensee MDPI, Basel, Switzerland. This article is an open access article distributed under the terms and conditions of the Creative Commons Attribution (CC BY) license (http://creativecommons.org/licenses/by/4.0/).


