Preprint
Article

The Coal-Forming Environment at the End of the Late Permian and Its Control on Trace Elements: A Case Study of the C3 Coal Seam of the Xuanwei Formation in Eastern Yunnan, China

Altmetrics

Downloads

112

Views

31

Comments

0

A peer-reviewed article of this preprint also exists.

This version is not peer-reviewed

Submitted:

21 August 2023

Posted:

22 August 2023

You are already at the latest version

Alerts
Abstract
Paleopeat-forming environments have an important effect on the dispersion and enrichment of trace elements in coal. The C3 coal seam of the Xuanwei Formation in eastern Yunnan was used as a case study to reconstruct the paleopeat-forming environment based on the coal facies parameters and geochemical characteristics, and its influence on trace element (including rare earth elements and yttrium, REY) enrichment was investigated. The C3 coal was classified as medium rank coking coal with an ultra-low moisture content, medium-high-ash yield, and low-medium volatile content. Compared to the average values for Chinese coals, Cu and V were enriched and Co was slightly enriched in the C3 coal. Compared with the average values for world coals, Cu and V were enriched, while several other trace elements were slightly enriched, including Co, Hf, Nb, Sc, Ta, Zn, and Zr in the C3 coal. The C3 coal was deposited in a low peat mainly limno-telmatic swamp, with deep water, weak hydrodynamic conditions, brackish to salty water, and reducing conditions. Trace elements, including Cu, V, Hf, Nb, Sc, Ta, Zr, and REY, are typically enriched in a limno-telmatic environment with fresh water, and reducing and weak hydrodynamic conditions. Additionally, REY and V are also significantly enriched in brackish water limno-telmatic conditions with the same depositional environment.
Keywords: 
Subject: Environmental and Earth Sciences  -   Geochemistry and Petrology

1. Introduction

The Late Permian was the most important coal-forming period in South China and represents a critical turning period in geological history, during which a series of geological events occurred culminating in the large Permian-Triassic mass extinction (Shao et al., 2013; Benton et al., 2014). As a product of the death and accumulation of paleoplants and the special organic sedimentary rock, coal is an important carrier of paleoecological and paleoenvironmental information in geological history, containing records of the paleoclimate and paleoenvironment information during the peat deposition period (Shao et al., 2017). Several paleoenvironmental studies have conducted by geochemical analyses of the elemental contents(Wu et al., 2013; Williams et al., 2012; Lu et al., 2017; Wang et al., 2022; Liu et al., 2023). However, the dispersion and enrichment of elements are affected by many factors and have multiple interpretations (Dai et al., 2014; Oboirienet al., 2016; Fu et al., 2016; Ling et al., 2019; Liu et al., 2023). The paleoenvironment of the coal-forming period can be reconstructed by coal facies, mineral composition, and element geochemistry, but it is more informative to consider the influence of the sedimentary microenvironment on trace element migration and transformation during the coal formation process. Wang et al. (2022) reconstructed the depositional environment of Carboniferous paleopeat in the Ningwu Coalfield and identified the types of element assemblage enriched in different depositional microenvironments. To identify the cause of the large mass extinction, this study attempted to restore the Late Permian coal-forming peatland environment with various pieces of geological evidence, especially the contents of toxic and harmful heavy metals in the original environment.

2. Geological setting

During the Late Permian, the study area of Xuanwei County in eastern Yunnan Province, was located at the southwest passive continental margin of the South China Plate, with an equatorial paleolatitude (Figure 1a) (Shao et al., 2015). Siliciclastic sediments in this area were supplied predominantly from the Khangdian Oldland to the west. This is a large area of ancient crystalline rocks reduced to a low relief by lengthy erosion through the Late Paleozoic, which was significantly affected by Emeishan mantle plume activity (He et al., 2006; Wang et al., 2022; Shao et al., 2023). Controlled by a transgression from the east throughout the Late Permian and Early Triassic, the depositional environments in eastern Yunnan and western Guizhou during the Late Permian vary from marine, transitional to terrestrial facies from east to west (Figure 1b) ( Wang et al., 2012; Wang et al., 2023; Shao et al., 2023). The continental Late Permian-Early Triassic strata in southwest China are subdivided into the Xuanwei and Kayitou Formations in ascending order (Figure 1c) (Shen et al., 2011; Shao et al., 2013; Zhang et al., 2016). The Xuanwei Formation consists mainly of fine-grained sandstone, siltstone, and shale, some parting beds, and numerous coal seams, including the C3 coal seam, which is dominated by terrestrial fluvial facies (Wang et al., 2011; Bercovici et al., 2015; Shao et al., 2023). The Xuanwei Formation unconformably overlies the Emeishan Basalt, and is conformably overlain by the Kayitou Formation of the Lower Triassic (Figure 1c).

3. Materials and methods

Samples were collected from the Late Permian C3 coal seam of the Lefeng Mine about 40 km NE of Xuanwei City, which is the main seam exploited and measures about 1.4 m in thickness with two approximately 5 cm thick tonstein layers (Figure 1c). According to the Chinese Standard GB/T 482-2008, a total of 14 samples including 10 coal samples, two roof and floor samples, and two parting samples were cut from the seam underground, with samples collected at approximately 10 cm vertical spacing intervals. The mass of each sample collected was ≥ 2 kg and all samples were immediately stored in plastic bags to ensure as little contamination as possible.
A partial proximate analysis was conducted at the Chongqing Station of Coal Quality Supervision and Inspection according to the Chinese Standard GB/T 212-2008. Vitrinite reflectance and quantitative coal maceral statistics were determined at Henan Polytechnic University. Vitrinite reflectance was conducted under oil at 500× magnification using a reflected light microscope (Axioskop 40, Zeiss, Jena, Germany) with an MSP UV-VIS 2000 microphotometer following the Chinese Standard GB/T 40485-2021. Quantitative coal maceral statistics were determined with a polarizing microscope (Axioskop 40, Zeiss) according to the Chinese Standard GB/T 15588-2013. Trace and earth element analyses were performed at the Analytical Laboratory of Beijing Research Institute of Uranium Geology. The samples were preprocessed by low-temperature airproof acid digestion. The procedure has been described in detail by Wang et al. (2023). The prepared samples were then analyzed using inductively coupled-plasma mass spectrometry) (Finnigan MAT, Thermo Fisher Scientific, Waltham, MA, USA), with a relative analysis error of ± 5%, according to the Chinese Standard GB/T 14506.30-2010.

4. Results

4.1. Coal chemistry and vitrinite reflectance

The vitrinite reflectances of the C3 coals ranged from 1.05 to 1.77 with an average value of 1.33 (Table 1), indicating a medium rank coking coal according to the Chinese Standard MT/T 1158-2011. Coals with a moisture content of 0.84%~1.49% are classified as ultra-low moisture coals according to the Chinese Standard MT/T850-2000. Coals with an ash yield of 11.30%~43.36% are medium-high-ash coals according to the Chinese Standard GB/T 15224.1-2004. Coals with a volatile matter yield of 15.98%~22.69% have a low-medium volatile content according to the Chinese Standard MT/T 849-2000.

4.2. Maceral compositions

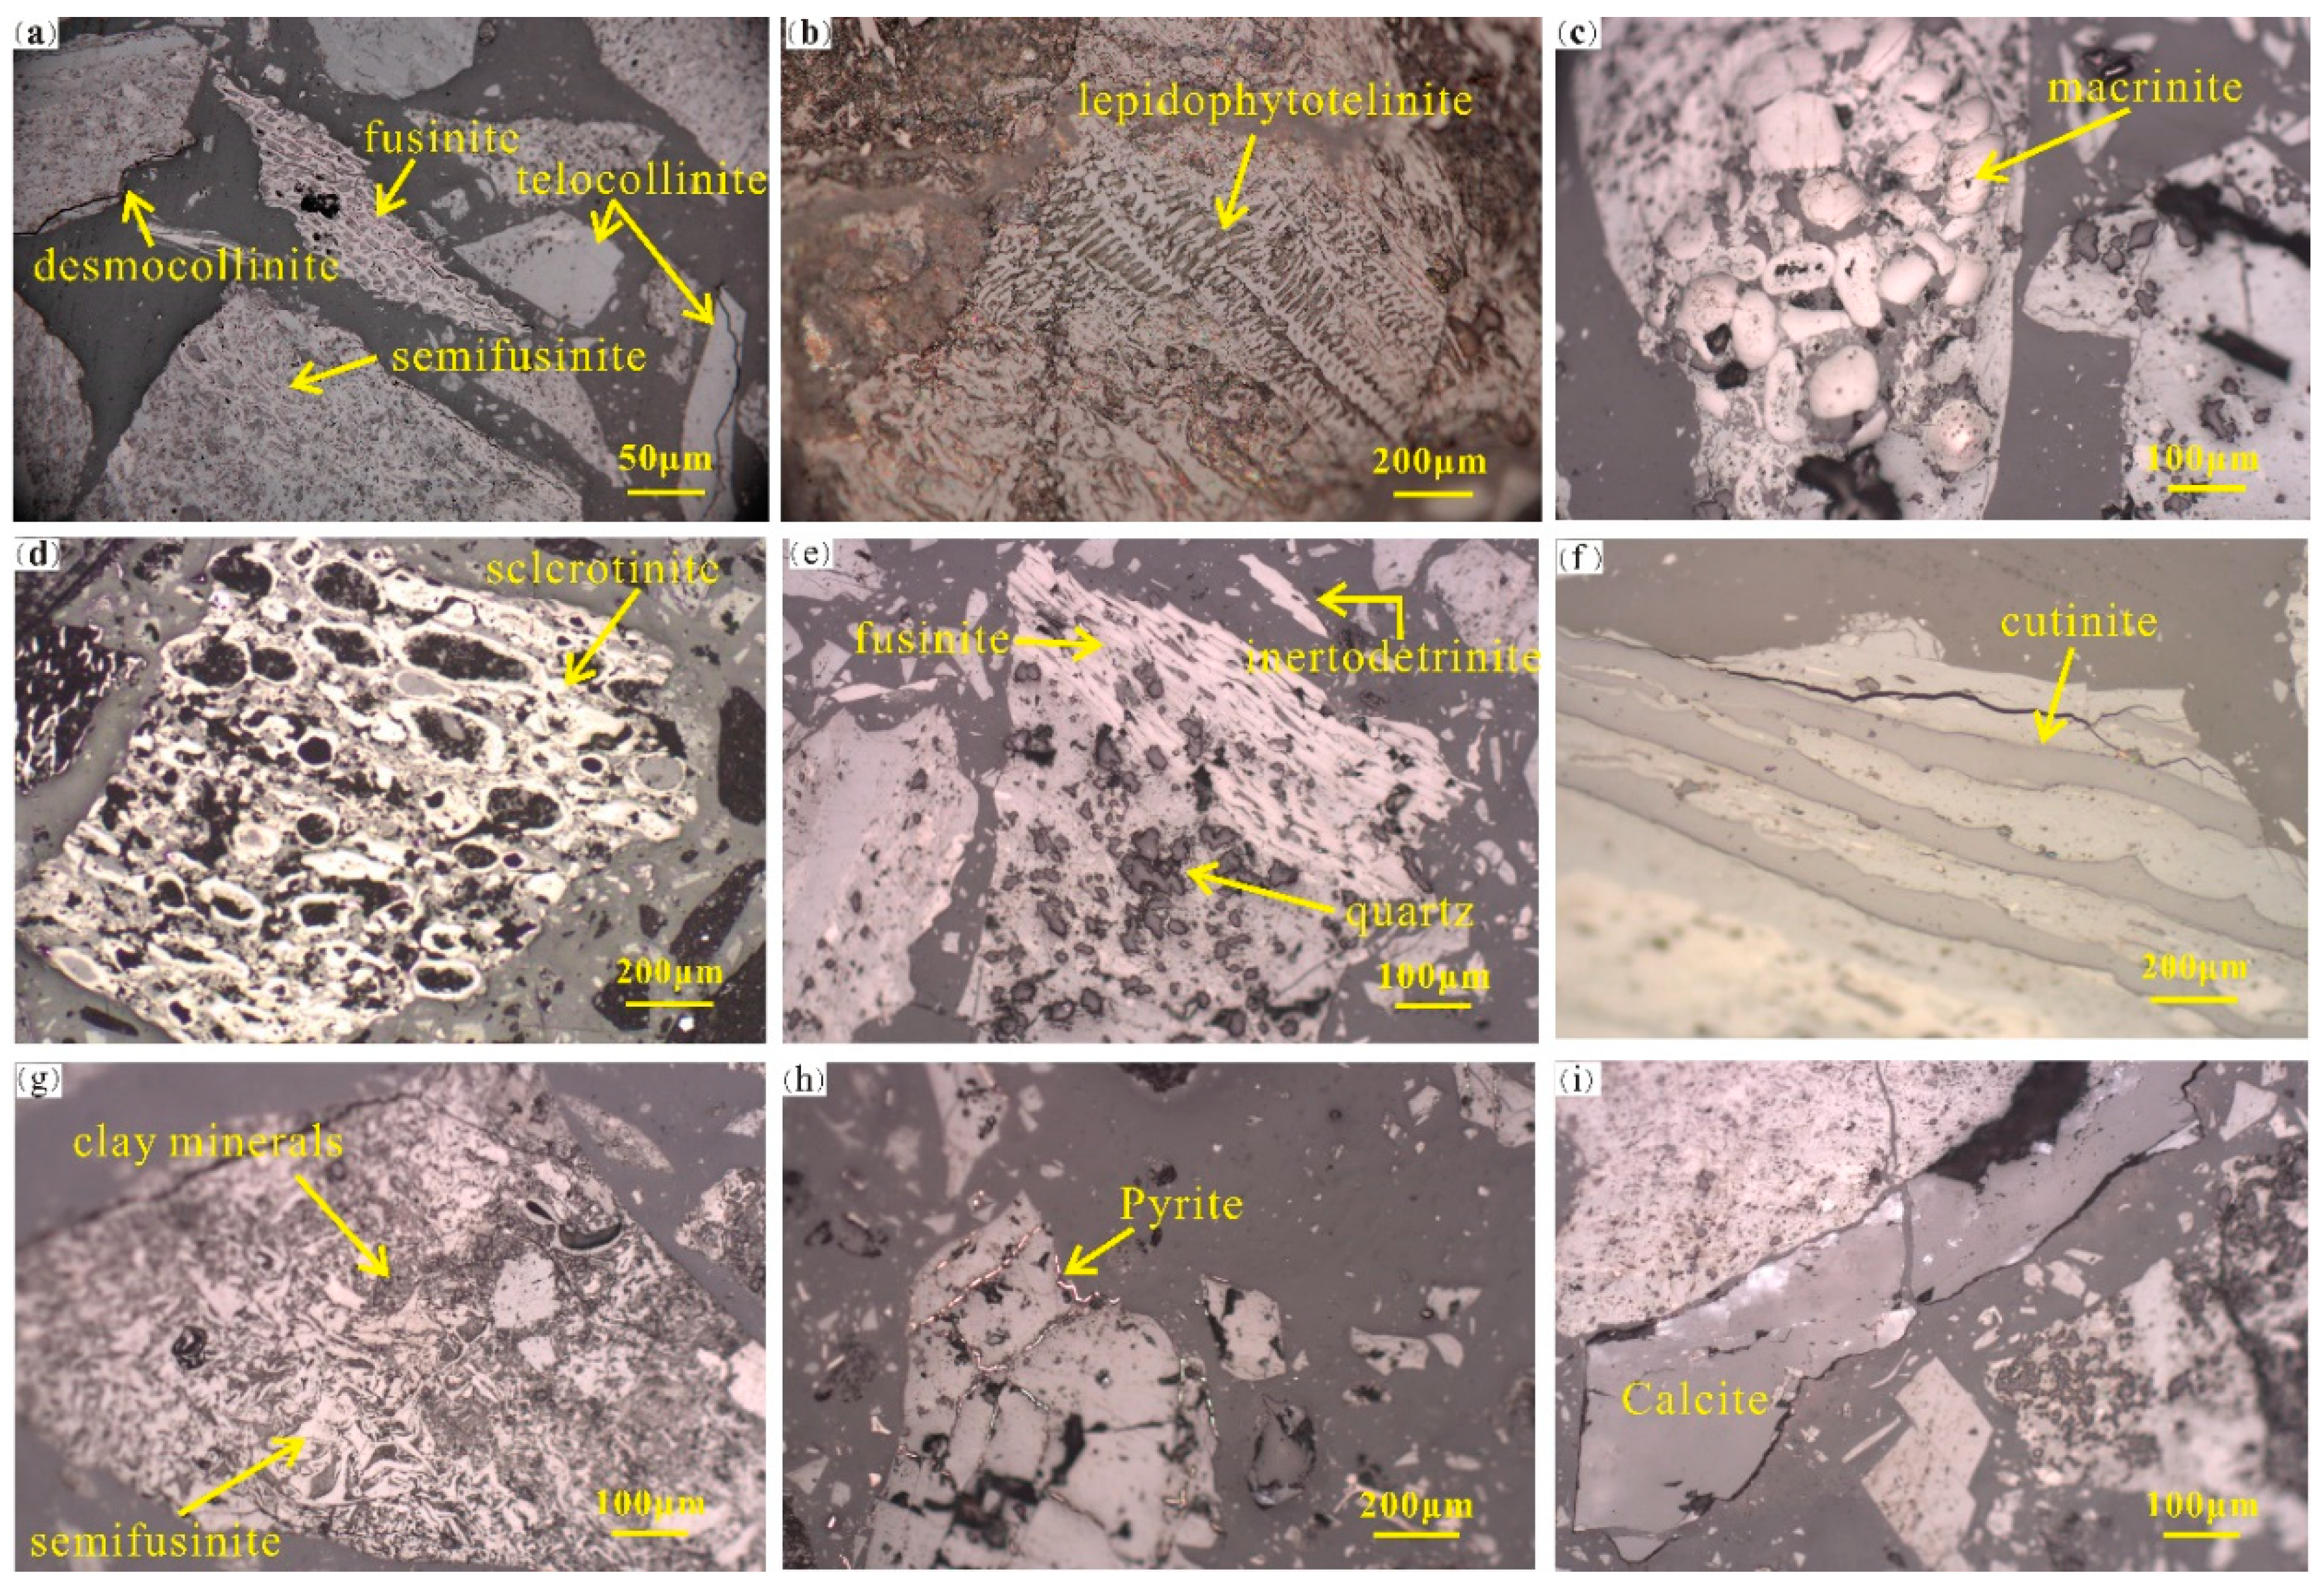
Table 2 summarizes the maceral data for 10 coal samples from the C3 coal (typical coal macerals, see Figure 2). The samples typically contained little mineral matter (average 11.5%, range of 3.5%~22.0%). They were predominantly vitrinite with a content of 72.6%~94.0% (av. 83.2%), followed by inertinite with a content of 1.0%~12.7% (av. 4.1%), whereas liptinite was only a very minor component with a content of 0%~0.7% (av. 0.2%). The vitrinites mainly consisted of desmocollinite (av. 36.1%) (Figure 2a), telocollinite (av. 22.5%) (Figure 2a), telinite (av. 12.9%) (Figure 2b), and vitrodetrinite (av. 11.8%) in descending order. Within the inertinites, fusinite (Figures 2a, 2e) were most abundant (av. 3.0%), followed by semifusinite (av. 0.7%) (Figure 2a, 2g), inertodetrinite (av. 0.4%) (Figure 2e), with minor amounts of macrinite (av. 0.1%) (Figure 2c) and sclerotinite (Figure 2d). The exinite component was rarely developed (av. 0.2%) and was only observed in a few samples due to its high degree of coalification, mainly by cutinite (Figure 2f).
The average content of mineral matter in the maceral compositions of the C3 coals was 11.5%, and was dominated by quartz (range 0.2%~20.3%, av. 8.0%), followed by clay minerals (range 0.5%~5.0%, av. 1.9%), calcite (range 0.4~2.1%, av. 1.0%), and pyrite (range 0%~1.2%, av. 0.6%). Quartz was the most abundant mineral, and was mostly embedded in desmocollinite or occurred as fusinite- and semifusinite-cell fillings (Figure 2e). Clay minerals typically occurred as dissemination with fine particles (Figure 2g) and were filled in the cell cavity of fusinite and semifusinite. Pyrite usually occurred as fracture-filling (Figure 2h) or was scattered in desmocollinite. Calcite was distributed independently in bands or filled in the cell cavity of fusinite (Figure 2i).

4.3. Trace elements in coal

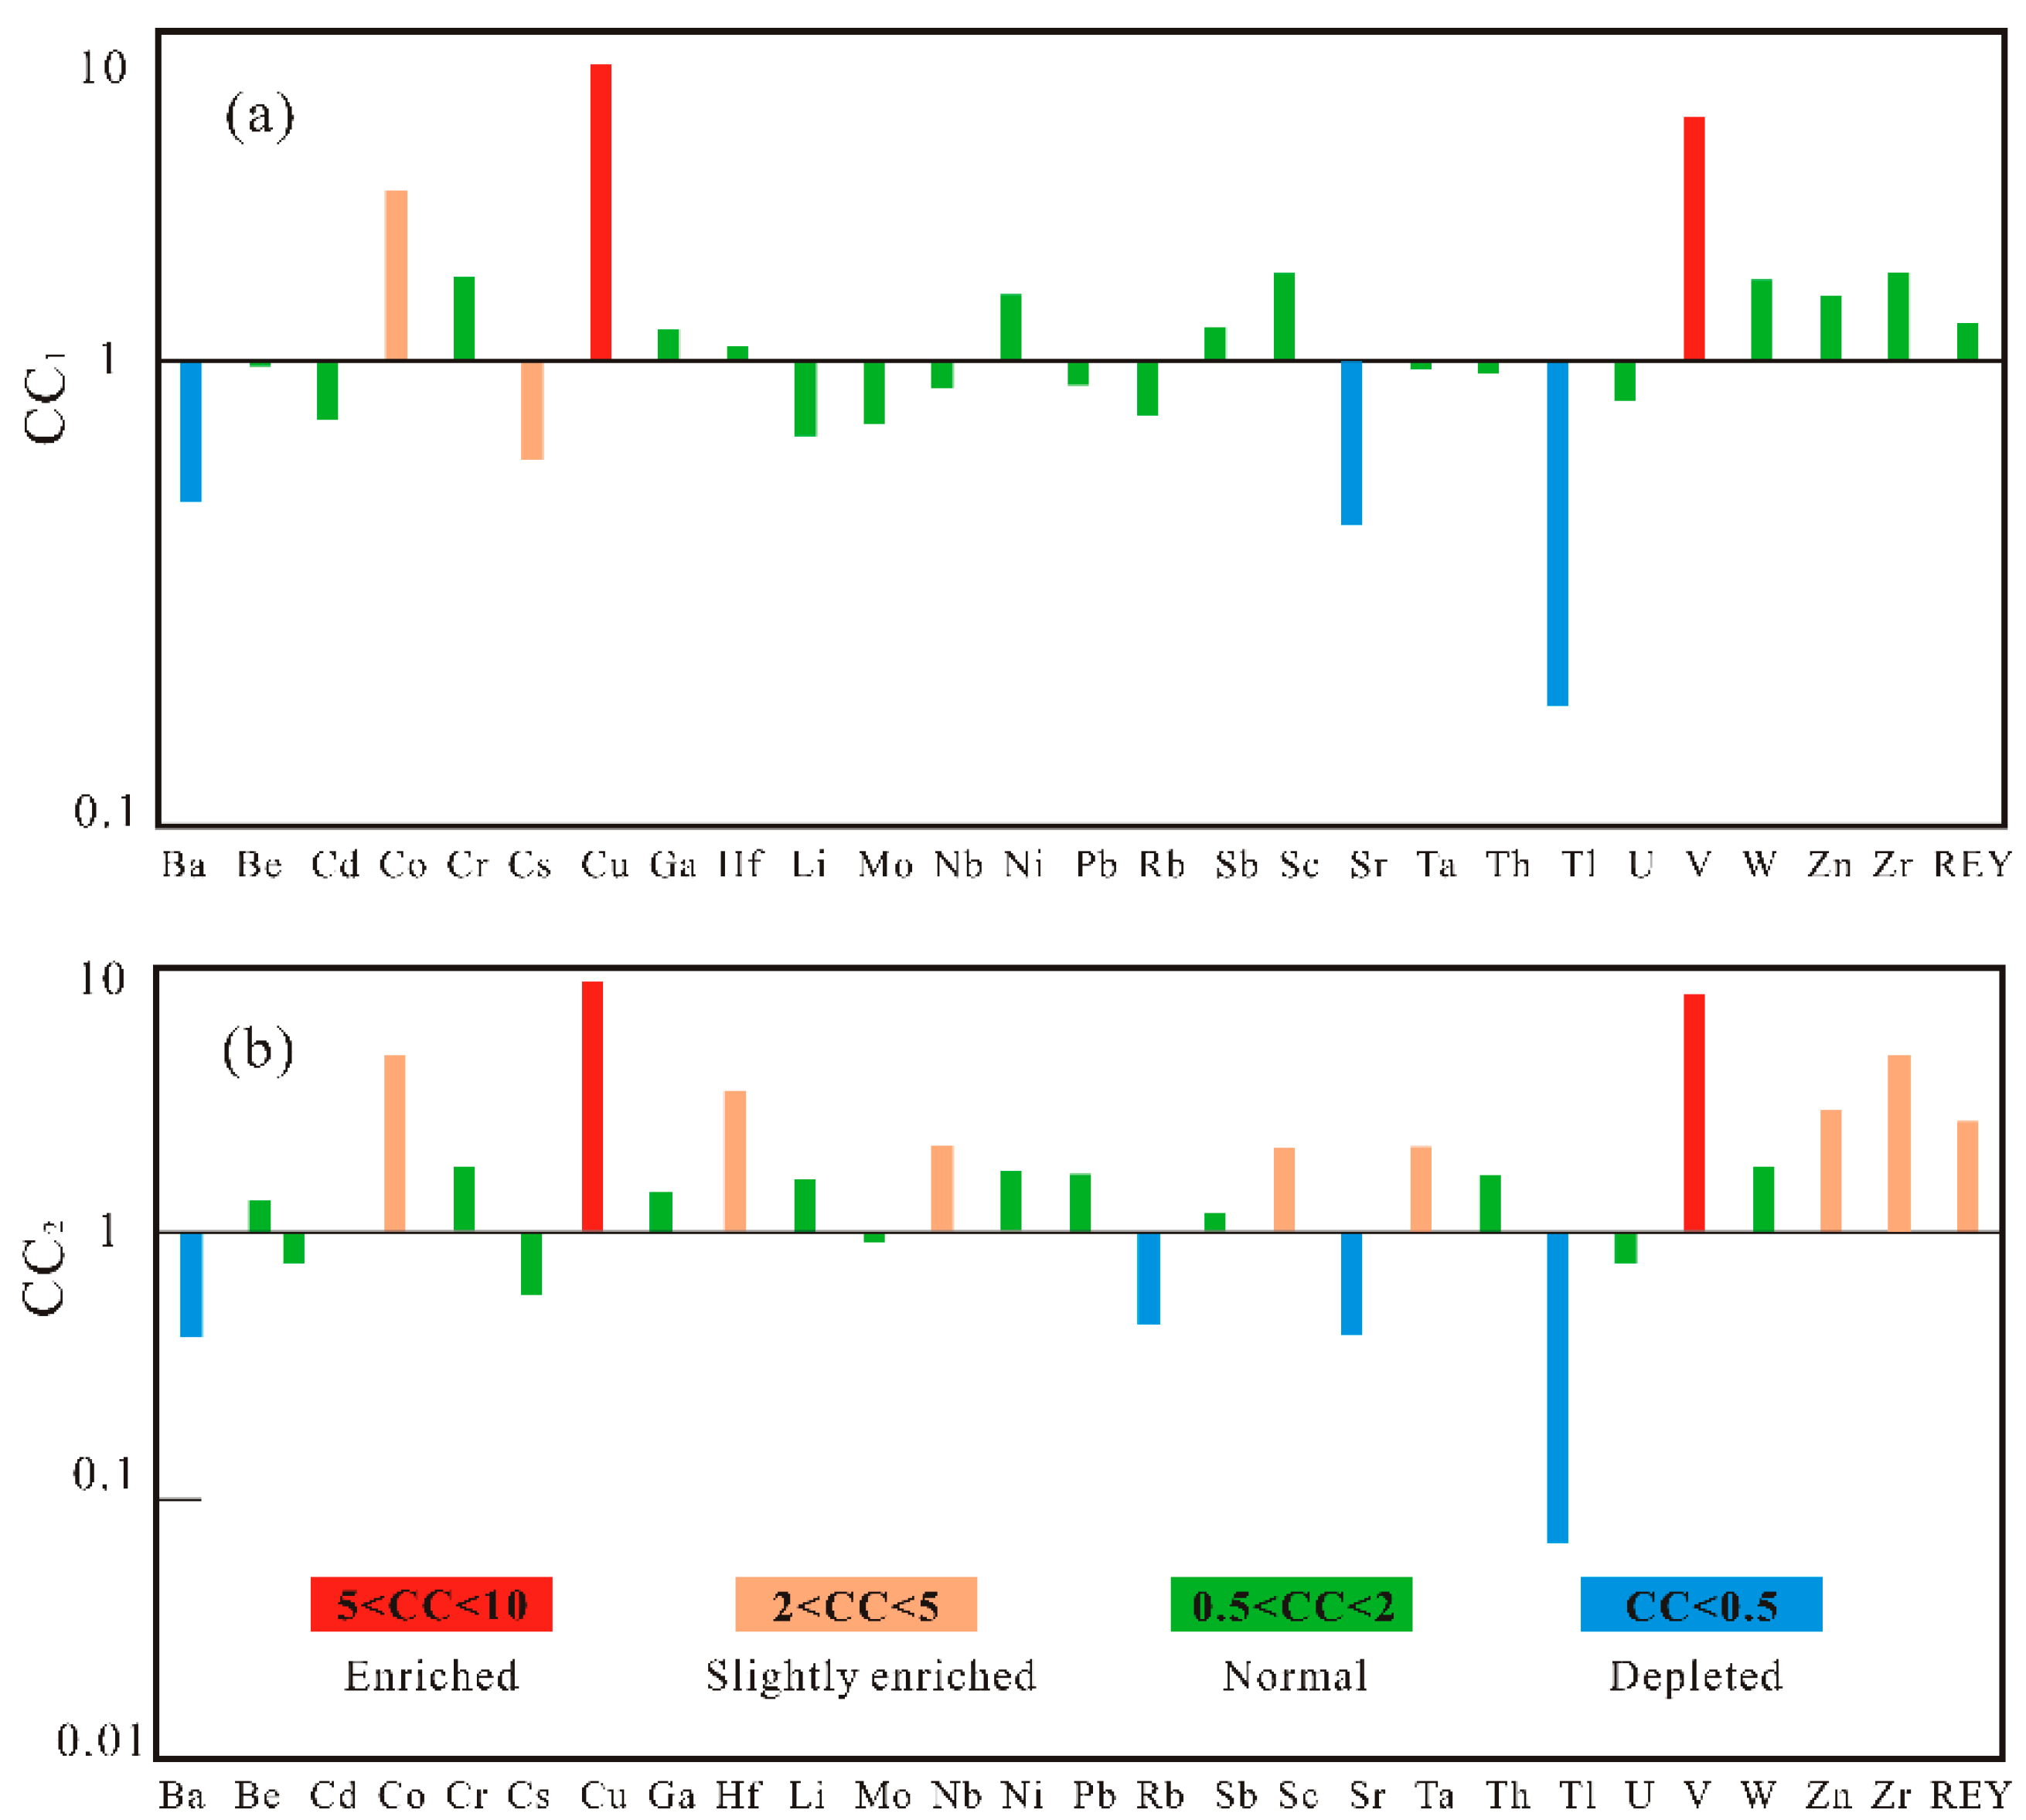
Table 3 shows the contents of trace and rare earth elements and yttrium (REY) in C3 coals, as well as a comparison with average levels in Chinese and world coals (µg/g). The concentration coefficient (CC, CC = element content in sample/average element content in Chinese or world coal) proposed by Dai et al. (2015) was used to evaluate the dispersion and enrichment of trace elements in C3 coal, with categories of 10 < CC < 100, significantly enriched; 5 < CC < 10, enriched; 2 < CC < 5, slightly enriched; 0.5 < CC < 2, normal; CC < 0.5, depleted. In comparison to Chinese coals, Cu and V were enriched in the C3 coal, Co was slightly enriched, and Ba, Sr, and Tl were depleted; all other elements were normal. Compared with the world coal, Cu and V were enriched, Co, Hf, Nb, Sc, Ta, Zn, and Zr were slightly enriched; and Ba, Rb, Sr, and Tl were depleted; all other elements were normal (Figure 3).

4.4. The REY content in coal

The REY content in coal was determined by dividing the materials into light, medium, and heavy fractions: LREY (La, Ce, Pr, Nd, and Sm), MREY (Eu, Gd, Tb, Dy, and Y), and HREY (Ho, Er, Tm, Yb, and Lu) (Seredin and Dai, 2012). The total REY content (ΣREY) in the C3 coal was in the range of 33.38~442.30 µg/g (av. 179.17 µg/g) (Table 3), which was similar to that in Chinese coal (135.89 µg/g, Dai et al., 2012), and slightly higher than that in world coal (68.47 µg/g, Ketris et al., 2009). When values of La, Sm, Gd, and Lu were normalized to chondrites (Table 4), REY could be identified as three enrichment types: L-type (light-REY; LaN/LuN > 1), M-type (medium-REY; LaN/SmN < 1, GdN/ LuN > 1), and H-type (heavy-REY; LaN/LuN < 1) (Seredin and Dai, 2012). The REY enrichment patterns in the benches of the C3 coal were all L-type.

5. Discussion

The accumulation and distribution of trace elements in coal can be controlled by numerous factors during peatification and coalification, as well as the weathering and oxidation processes that occur after coal formation. The types and amounts of trace elements in coal have already been well established during the peatification stage, and migration and transformation during the later coalification stage usually only occur locally. It is therefore particularly important to study the distribution of trace elements in the peatification stage (Tang et al., 2004; Ren et al., 2006).

5.1. Provenance characteristics

The REY and some trace elements, including Zr, Sc, Co, Th, and Hf, have excellent stability during weathering, transport, deposition, and compaction to rock, and can therefore represent the elemental characteristics of provenance. The contents and ratios of these stable elements are commonly used to identify the source materials of rocks (Tang et al., 2021).
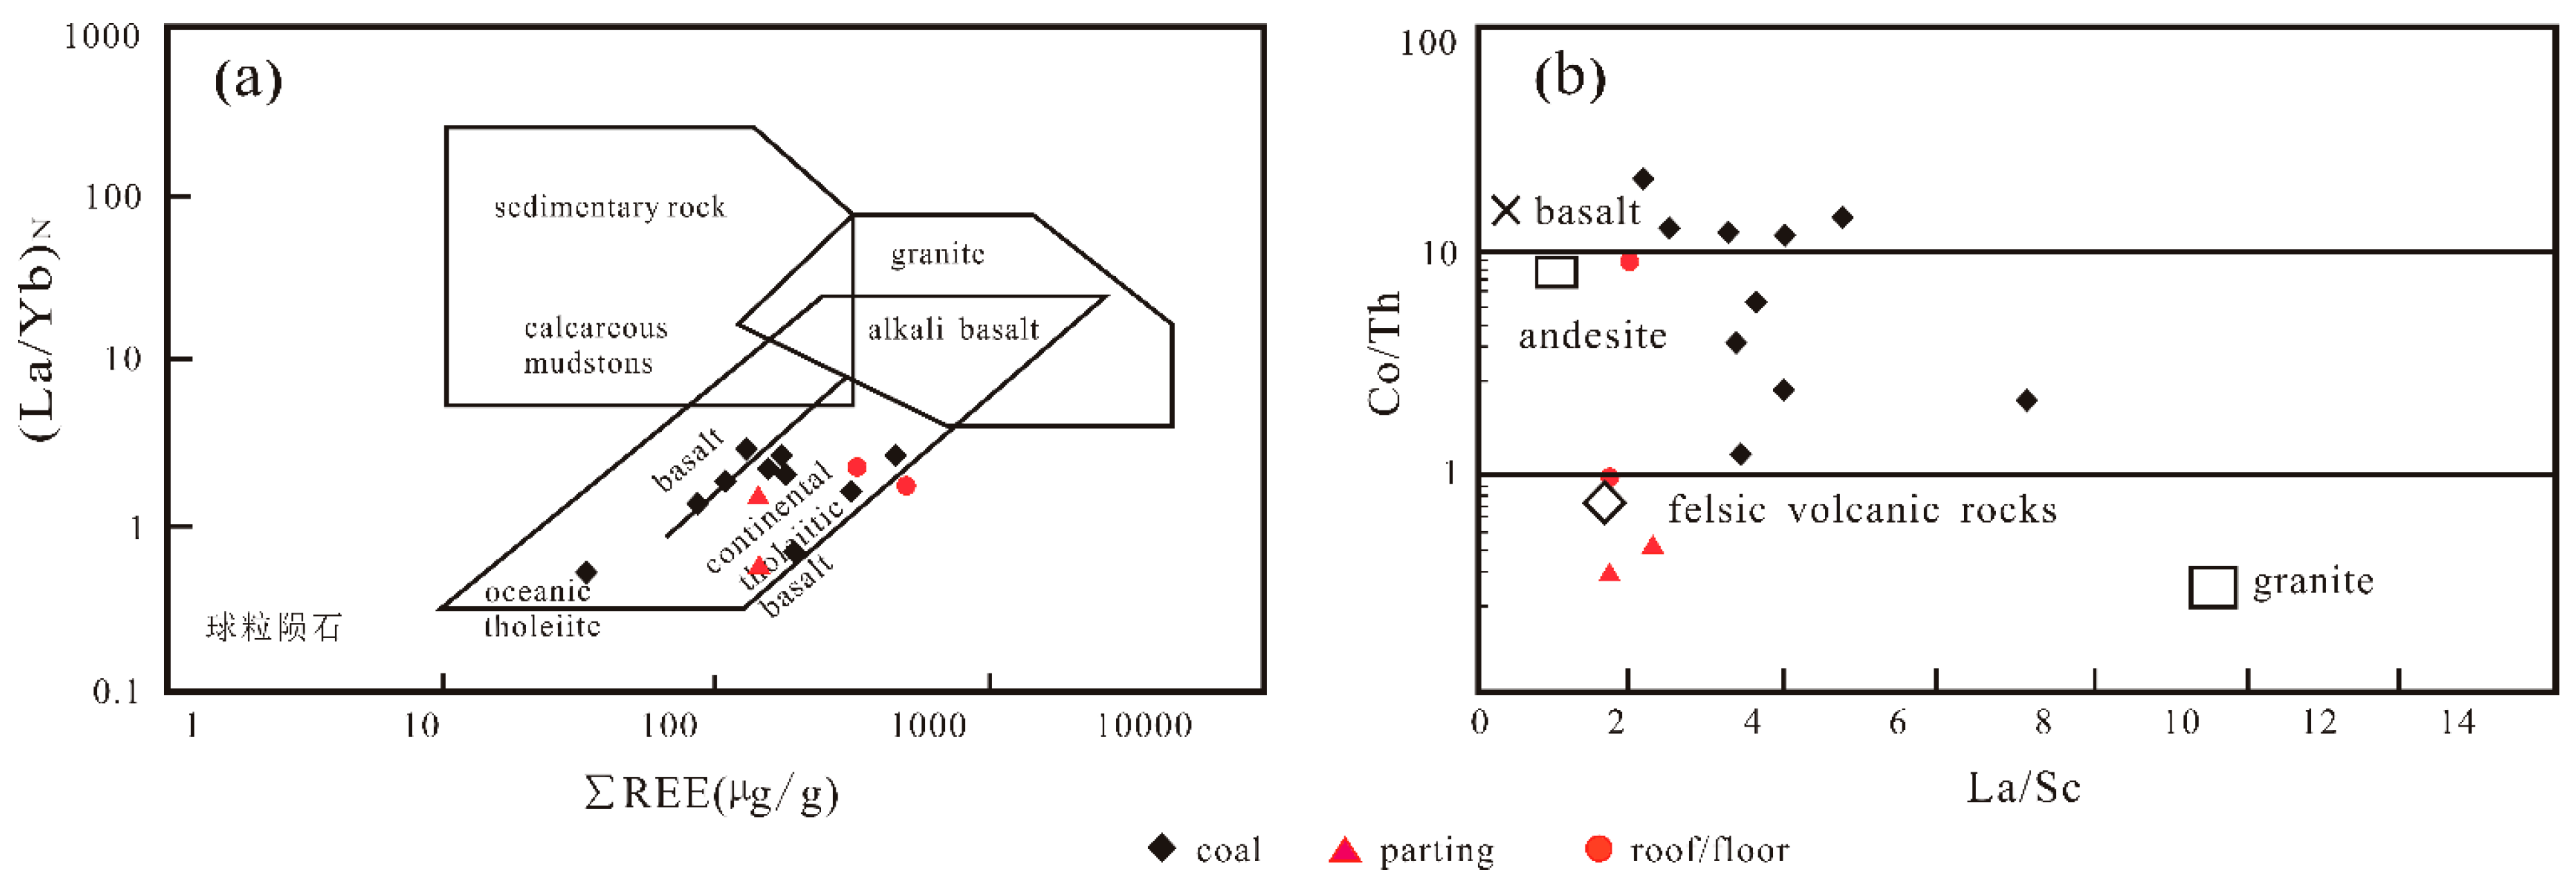
Diagrams of ∑REE-( La/Yb)N and La/Sc-Co/Th were constructed to analyze the source rocks. In Figure 4a, samples including coals, partings, and the seam roof are predominantly plotted in the basalt area, with the exception of C3-F (Figure 4a). Partings in the C3 seam were classified as felsic volcanic rocks in the La/Sc-Co/Th diagram, the seam roof and floor originated from andesite rock, whereas coals are plotted into the basalt and andesite area (Fig.4b).
From the dispersion of the samples plotted in the above two diagrams, it was inferred that the Late Permian coal-forming materials were related to the intermediate-basic volcanic rock, meanwhile the peat swamp was influenced by an input of acid volcanic ash during the coal gap (parting formation). This conclusion was in accordance with that of a previous study that found the Emeishan basalt and its weathering alteration products were the only terrigenous material supply in eastern Yunnan (Wang, 1996; Wang et al., 2011; Dai et al., 2014).

5.2. The depositional environment

5.2.1. Coal facies interpretation

Coal facies play a significant role in restoring the material conditions and depositional environments of coal-forming periods (Dai et al., 2020). Coal facies parameters, including the Gelation Index (GI), Texture Preservation Index (TPI), Groundwater Flow Index (GWI), Vegetation Index (VI), and Vitrinite content/Inertinite content (V/I), are widely used to evaluate depositional environment-related conditions, i.e., coal-forming plants, swamp medium conditions, and hydrodynamic conditions (Diessel, 1986, 1992; Moss et al., 2005; Jiu et al., 2021).
The GI refers to the ratio of macerals in a wet environment (vitrinite) to that in a dry environment (inertinite). A high GI value indicates a wetter coal-forming environment and deeper swamp water cover (Kalkreuth et al., 1991). The TPI reflects the degree of preservation and degradation, and the higher the TPI value, the better the preservation degree of plant cells, which can be used to determine the type of coal-forming plant. The GWI is calculated according to the maceral with gelification and mineral contents, and is indicative of the degree of control of groundwater on the peat swamp and water level when peat accumulates (Jiu et al., 2021). In general, a higher GWI value implies a stronger maceral degradation and greater mineral input, as well as strong hydrodynamic conditions. The VI reflects the type of coal-forming plants. A VI of < 1 is generally considered to be compatible with herbaceous or aquatic plants, and a value >1 is considered to be compatible with forests (Thompson et al., 1985; Calder et al., 1991). The indexes are defined as follows:
GI = (Total Vitrinite + Macrinite)/(Fusinite + Semifusinite + Inertodetrinite)
TPI = (Telinite + Telocollinite + Fusinite + Semifusinite)/(Desmocollinite + Macrinite + Inertodetrinite)
GWI = (Gelocollonite + Corpocollinite + Clay minerals + Vitrodetrinite)/( Telinite + Telocollinite + Desmocollinite)
VI = (Telinite + Telocollinite + Fusinite + Semifusinite + Sclerotinite)/(Desmocollinite + Inertodetrinite + Vitrodetrinite + Cutinite)
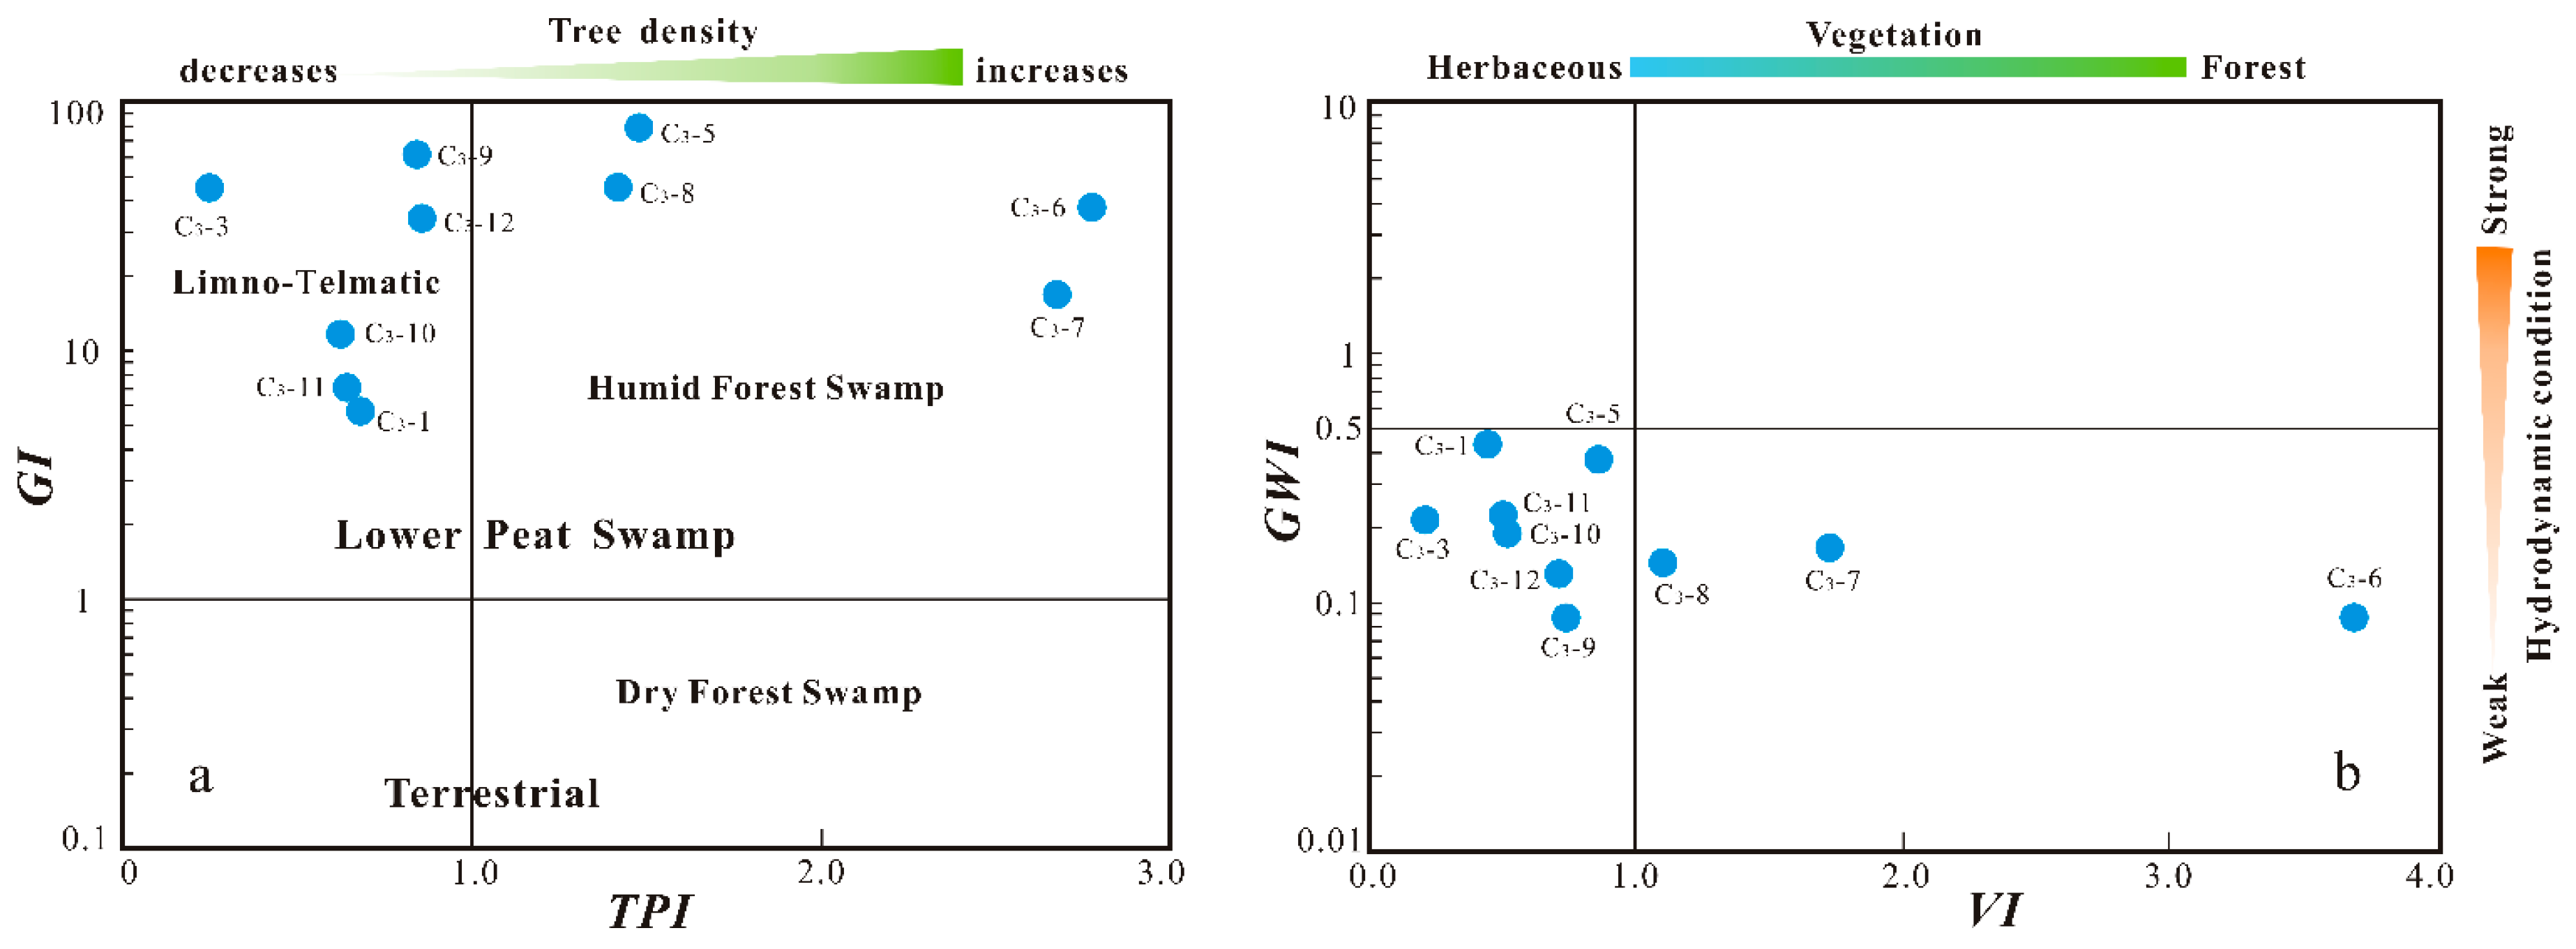
These four coal facies parameters were calculated for the C3 coal and the results are given in Table 2. Cross-plots of TPI-GI and VI-GWI based coal facies parameters are shown in Figure 5. In the TPI-GI cross-plot (Figure 5a), the C3 coal is distributed in both the limno-telmatic and humid forest swamp areas, indicating that the Late Permian C3 coal was formed in a low peat swamp with deep water cover. More specifically, the early and late peat were limno-telmatic, however the middle peat stage evolved into humid forest swamp.
The VI-GWI diagram (Figure 5b) showed that the C3 coal was positioned in the overlapping area of herbaceous and weak hydrodynamic conditions (GWI < 0.5 and VI < 1), which was consistent with its positioning on the TPI-GI diagram. This indicated that it formed in a wet low peat swamp dominated by herbaceous plants that gradually evolved into a forest swamp.

5.2.2. Trace element analysis

Both Sr and Ba exist as ions in freshwater environments. Ba increasingly precipitates in the form of BaSO4 with increasing salinity, while Sr will not precipitate until the salinity reaches a certain level. The Sr/Ba ratio is therefore often used to determine paleosalinity (Dai et al., 2018). The Sr/Ba value can be used to classify the three kinds of depositional environment: > 1 for salt water, 0.6~1.0 for brackish water, and < 0.6 for freshwater (Rimmer, 2004; Qu et al., 2019). The Sr/Ba ratio values of C3 coal ranged from 0.50 to 2.04 (av. 0.93) (Table 3), indicating that the C3 coal depositional environment changed from salt water to brackish water, which was obviously influenced by seawater and had experienced frequent transgressions.
The V/(V+Ni) ratio in sedimentary rocks is often used as a geochemical indicator of redox sensitivity. The hypervalent ions of V can be reduced and enriched in an anoxic denitrate environment, while Ni is mainly enriched in a sulfate reduction environment. This difference can distinguish the degree of redox in a sedimentary environment (Xiong et al., 2011). Hatch and Leventhal (1992) proposed that V/(V+Ni) ratio values of < 0.46, 0.46~0.60, 0.60~0.84, and > 0.84 indicate strong oxidizing, oxidizing, anoxic reducing, and euxinic reducing environments, respectively. The V/ (V+Ni) ratio values of C3 coals range from 0.75 to 0.96 (av. 0.87), which indicates that the coal-forming swamp had a stable reducing environment.
Rare earth elements (REEs) are often used to indicate the redox conditions of the paleoenvironment due to their sensitivity to changes in the sedimentary environment. The Ce anomaly parameter (Ceanom) proposed by Elderfield et al. (1986) has been widely used in the identification of paleoredox conditions. Generally, a Ceanom > −0.1 indicates a reducing environment, while a Ceanom < −0.1 indicates an oxidizing environment. The Ceanom value of C3 coal varied from -0.114 to -0.013 (av. -0.072), except for C3-6 and C3-10, indicating a reducing environment. Combined with the V/ (V+Ni) ratios, it was concluded that the C3 coals were mainly deposited in a reducing environment.

5.3. Influence of depositional environment on enrichment of trace elements

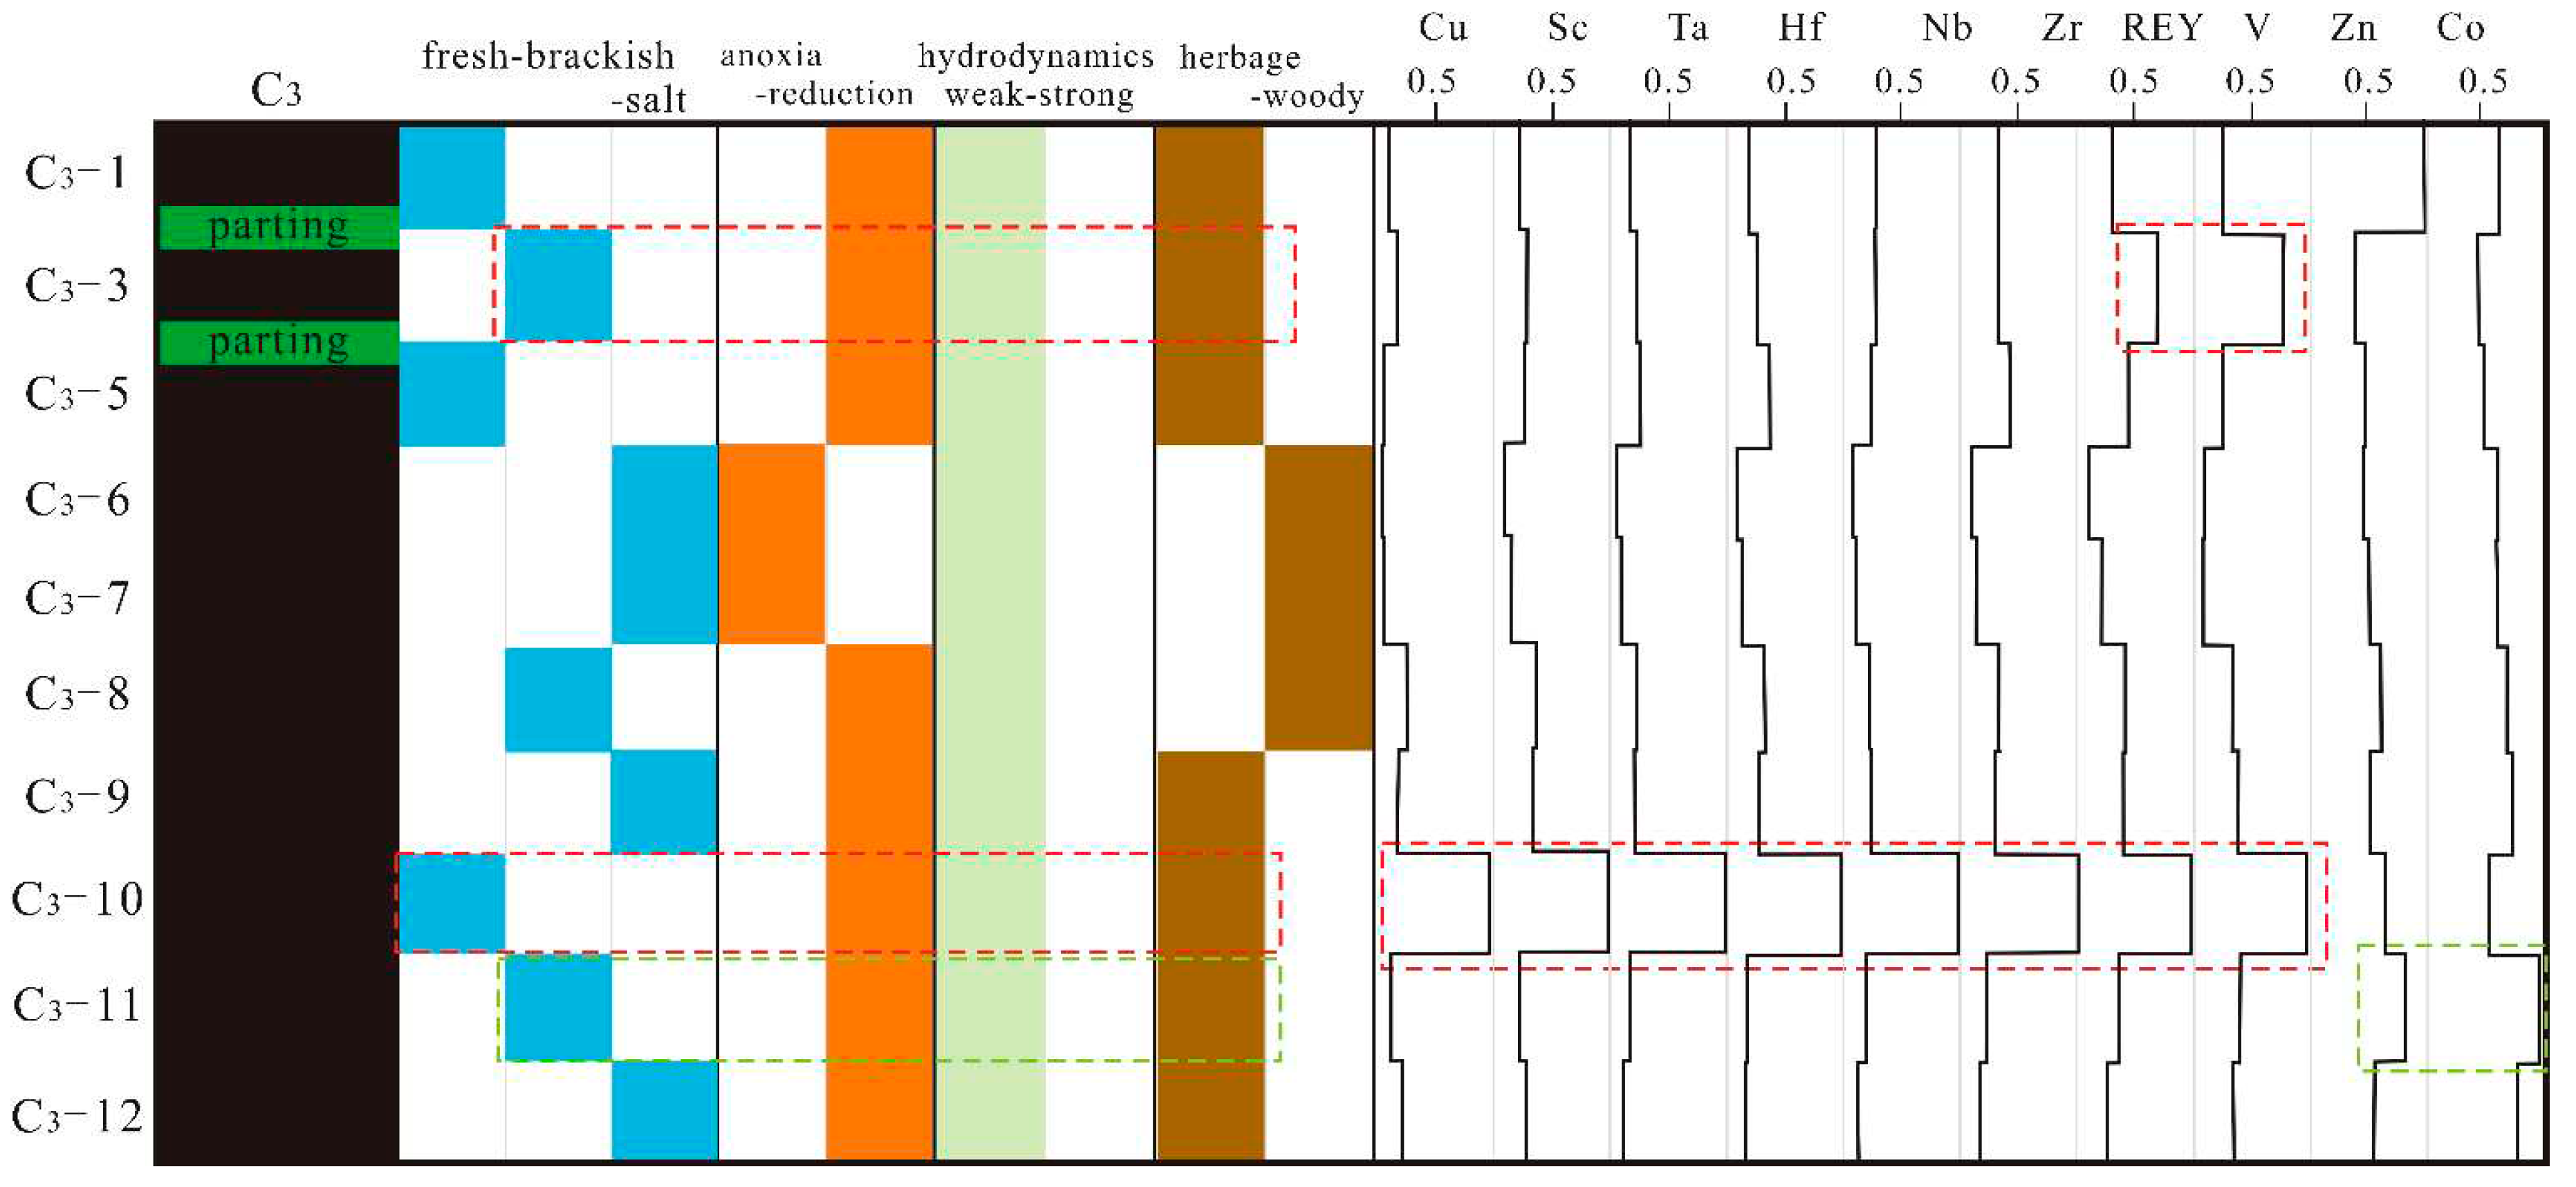
In addition to the influence of ancient plants and detrite material, the depositional environment-related conditions of peat swamps, including the oxidation-reduction state, pH value, paleosalinity, hydrodynamic conditions, and paleoclimate, play an important role in the enrichment of trace elements in coal (Tang et al., 2004; Qin et al., 2020; Wang et al., 2022). The relationship between the depositional environment of peat swamps and the content of trace elements was obtained by normalizing the trace element contents in coal bench samples (Figure 6). Compared to the average contents of Chinese and world coal, Cu and V were enriched, and some trace elements were slightly enriched in the Lefeng Mine coals, including Co, Hf, Nb, Sc, Ta, Zn, Zr, and REY. Most of the elements, including Cu, V, Hf, Nb, Sc, Ta, Zr, and REY were concentrated in sample C3-10, which represented a limno-telmatic environment with freshwater, reducing conditions, and weak hydrodynamic conditions (Fig.sin s6). Moreover, REY and V were also significantly enriched in the limno-telmatic environment with brackish water, reducing conditions, and weak hydrodynamic conditions of sample C3-3. Only Zn and Co were enriched in the bench sample C3-11, which originated from a depositional environment consistent with C3-3.
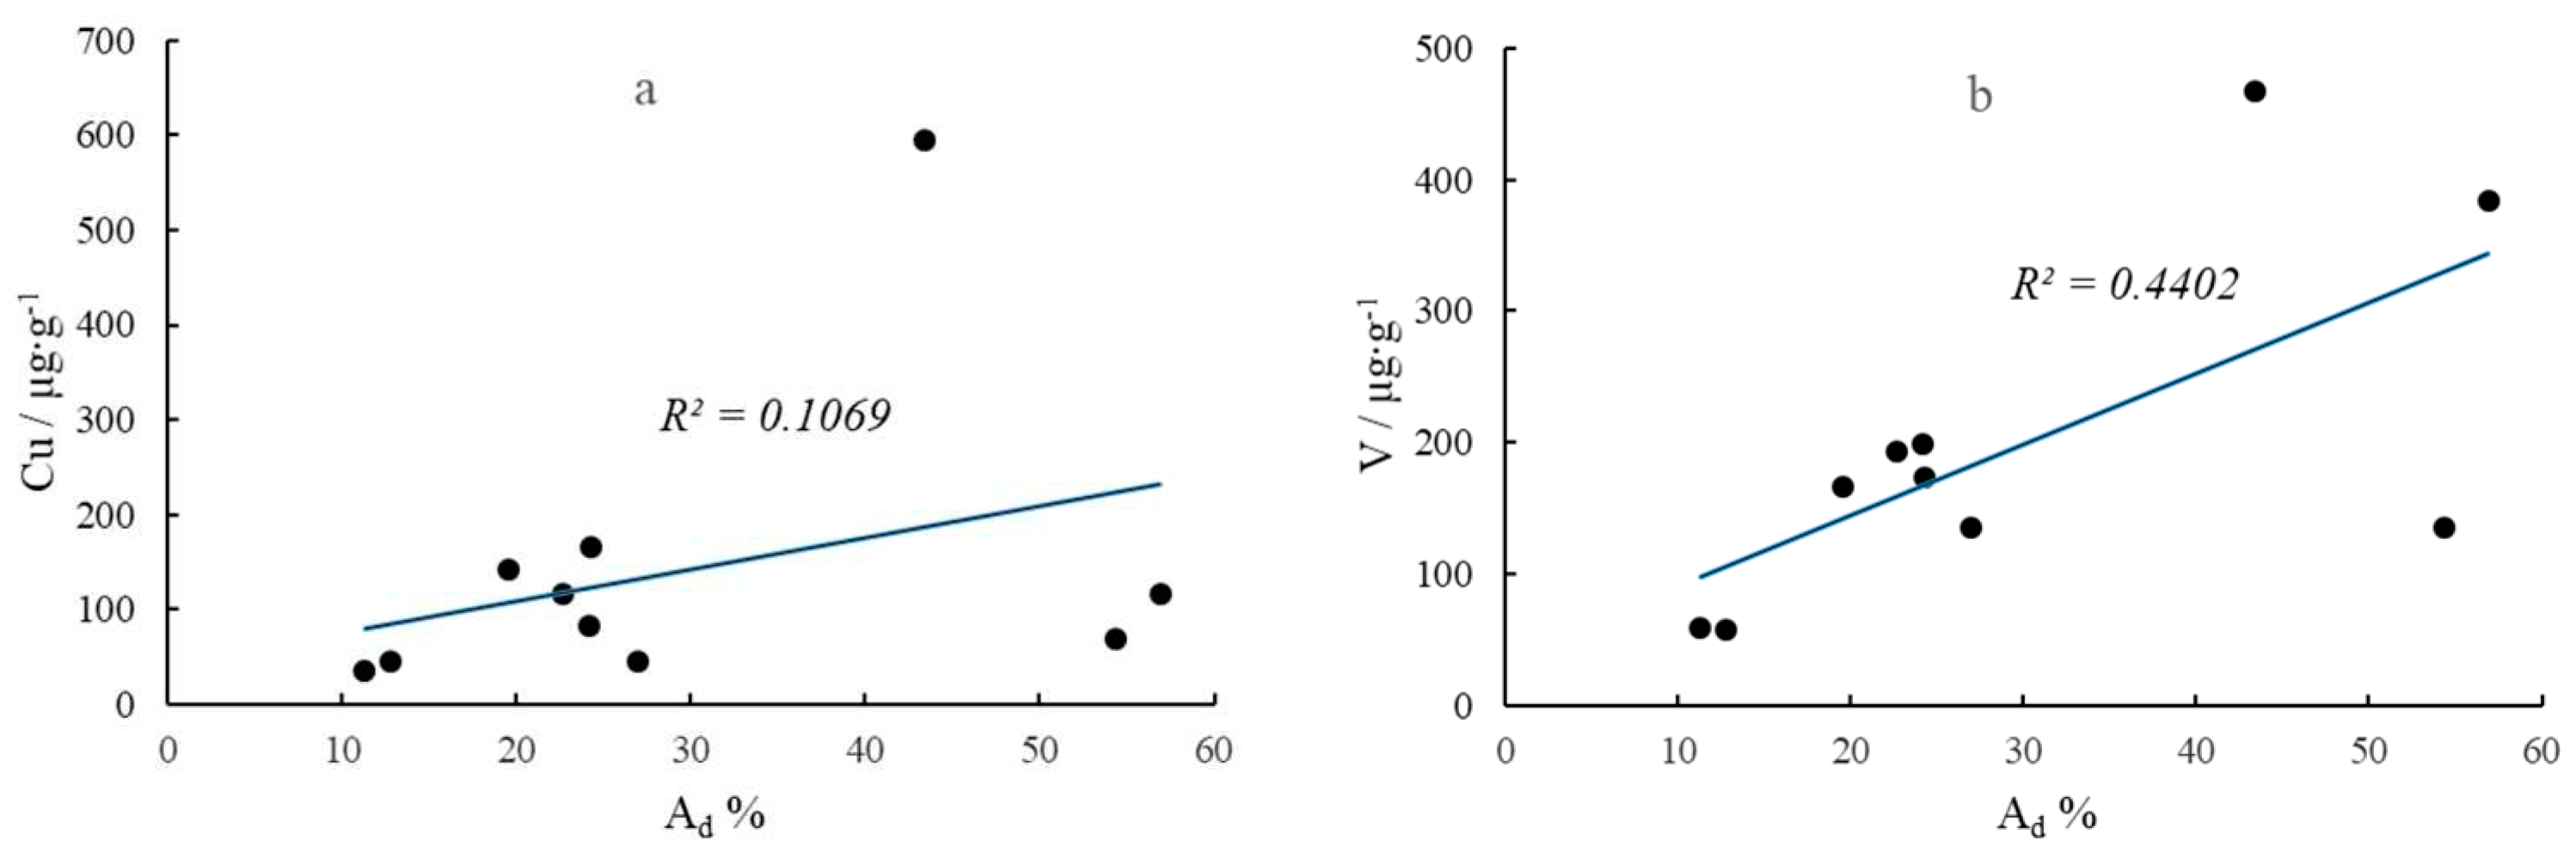
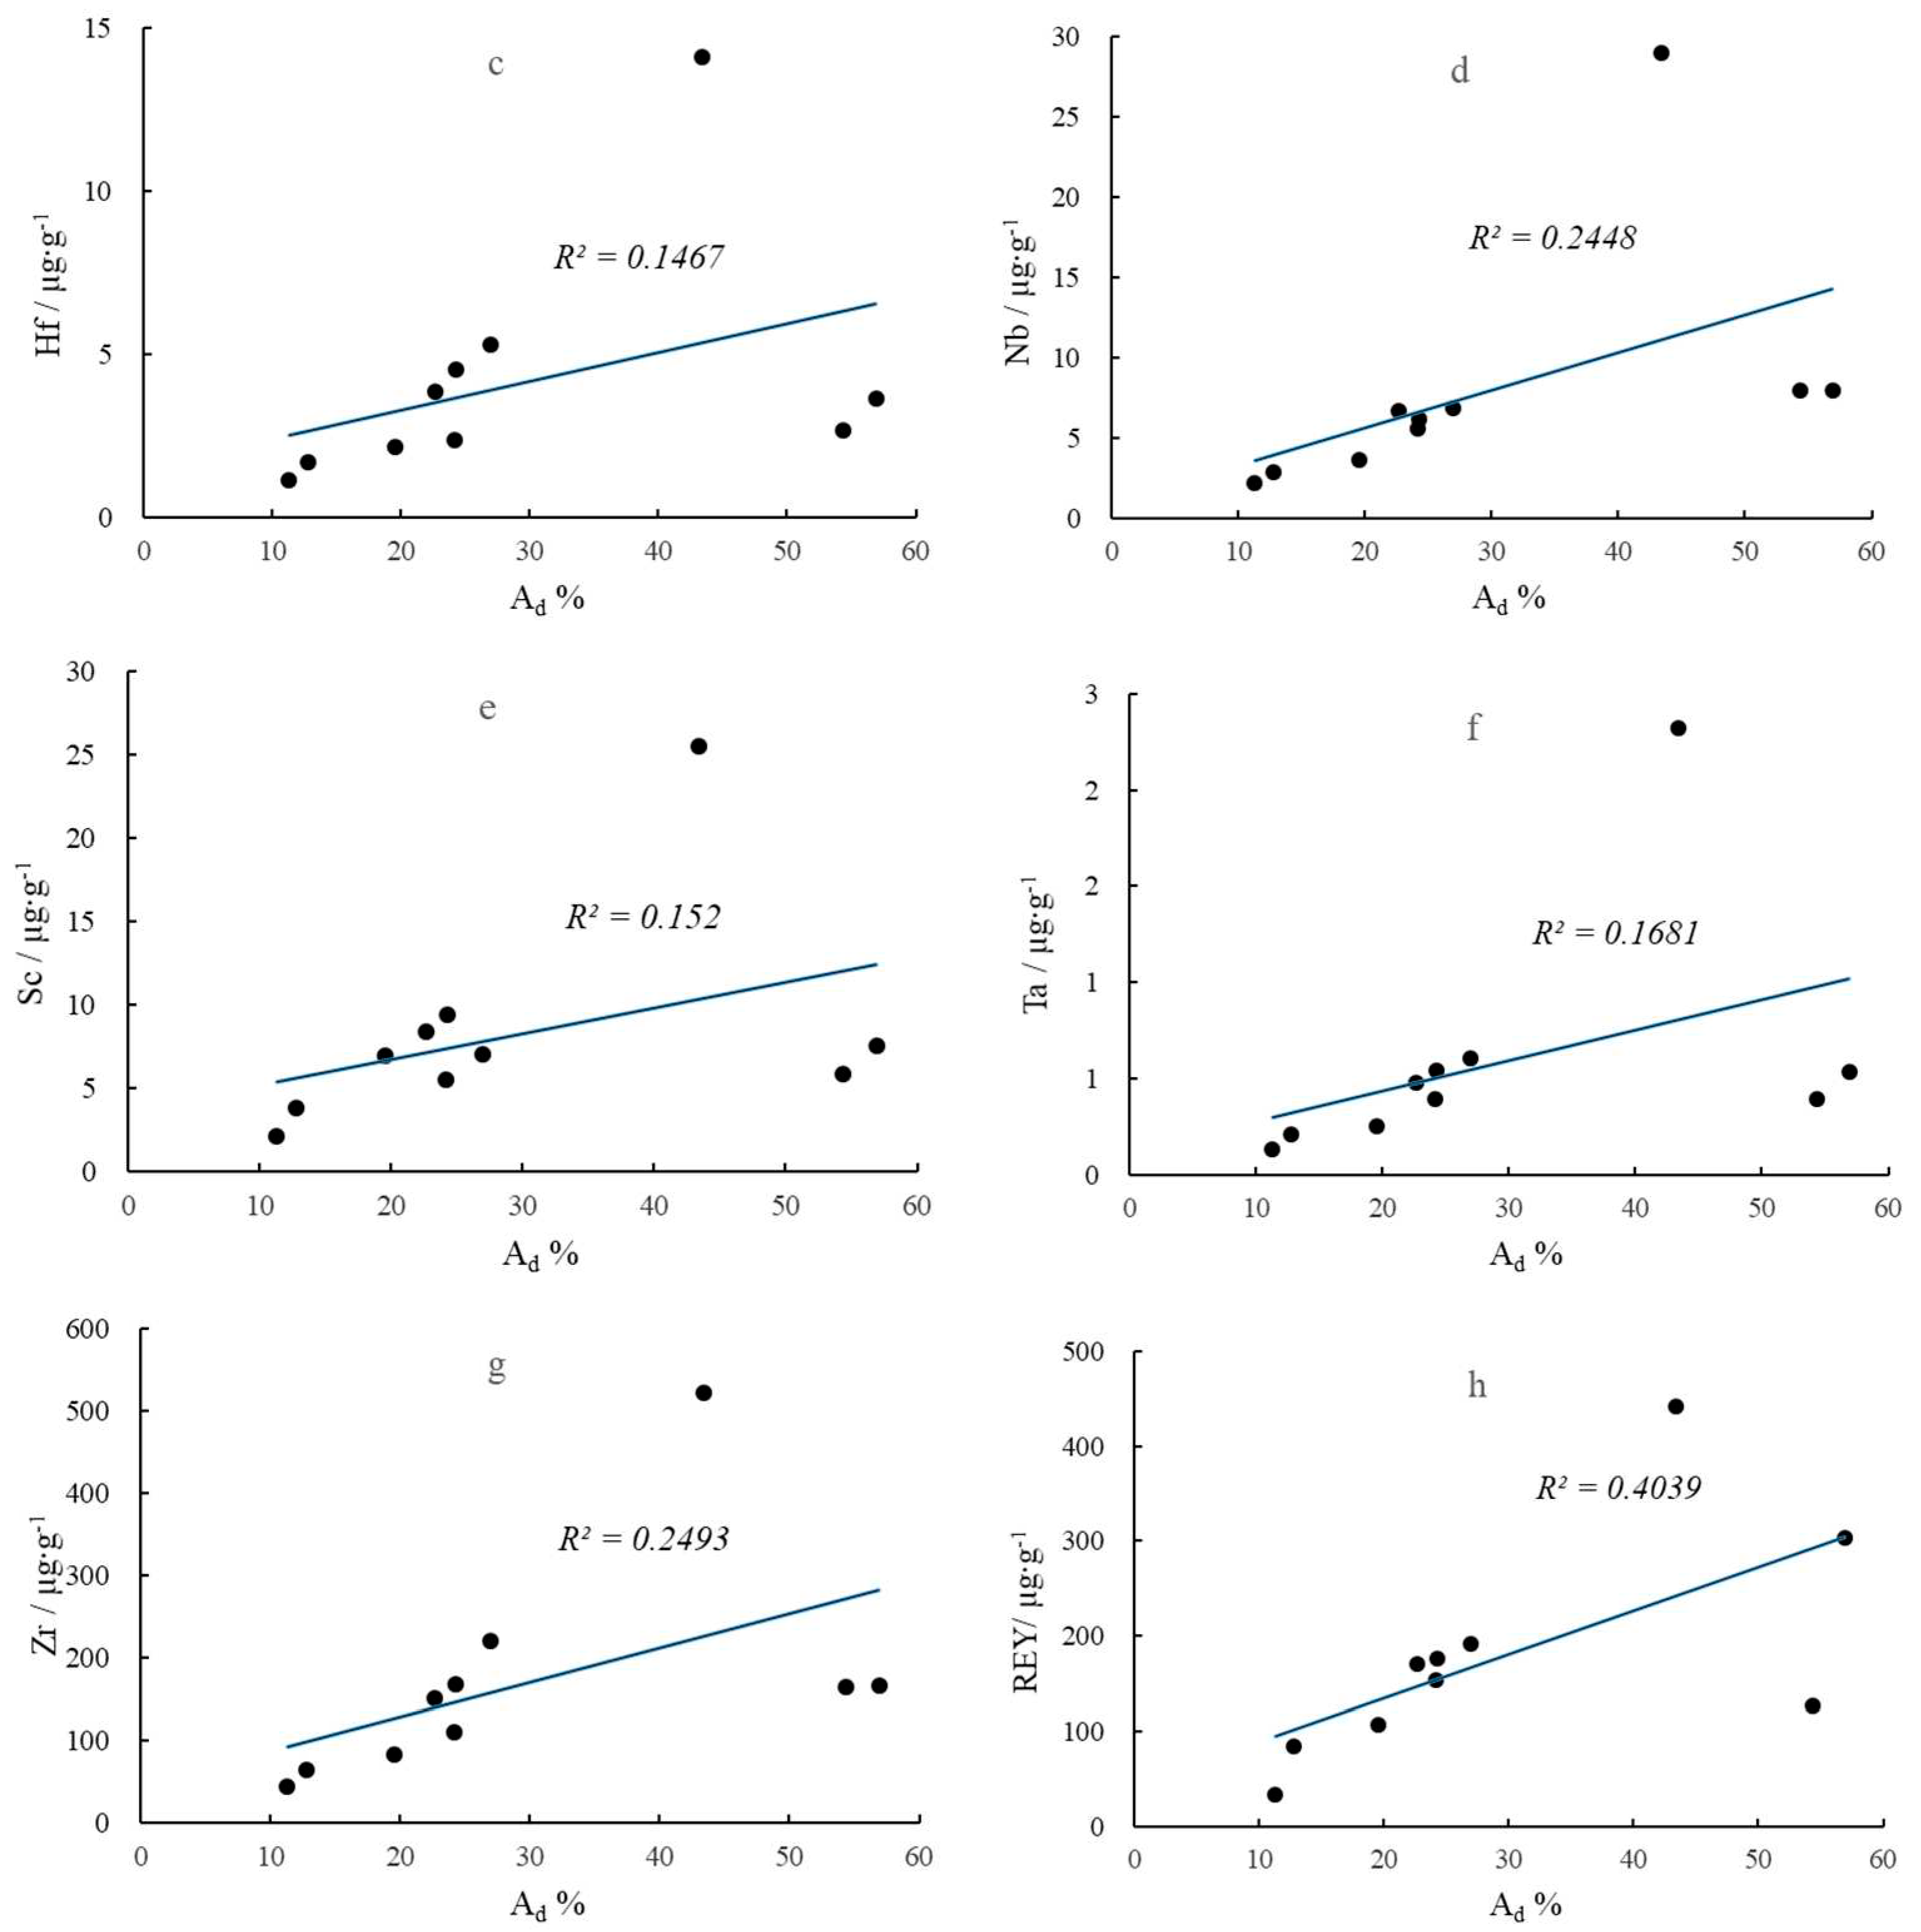
Since the ash yields of the bench samples C3-3 and C3-10 were 56.93% and 43.36%, respectively (Table 1), the correlation coefficients between the Cu, V, Hf, Nb, Sc, Ta, Zr, and REY enrichments in two samples and the ash yield were calculated (Figure 7). Only V and REY were significantly correlated with ash yield (confidence level of 90%), while the other elements were only weakly correlated with ash yield. Therefore, it was concluded that the enrichment of these elements in the two samples was not caused by a high ash content, but was more strongly controlled by the sedimentary environment. The REY and V contents were locally enriched in the same horizon, and Wang et al. (2002) also suggested that V was significantly correlated with REEs. The solubility of REEs in rivers is very low, and they usually react with unsaturated groups such as OH- and COOH- in the +3 oxidation state to form stable rare earth complexes and then migrate. When transporting media such as rivers are mixed with seawater, large amounts of the Al(OH)3 colloid in the medium will polymerize, resulting in rapid precipitation and enrichment of REEs. It was concluded that the enrichment of REEs was related not only to ash yield but also the brackish water environment caused by seawater intrusion. Ren et al. (2006) also argued that peat swamps affected by seawater are more likely to enrich V than coal seams affected by fresh water.
Among these enriched trace elements, Cu and V, which are the most enriched, are essential elements for human body, but excessive amounts can lead to toxic reactions. The enrichment of these two elements in peat swamps at that time may be one of the causes of mass extinction at the end of the Late Permian. Other enriched elements have no harmful effects on the environment so far.

6. Conclusions

The peat swamp depositional environment of C3 coal in the Late Permian Xuanwei Formation in eastern Yunnan was reconstructed using coal facies parameters together with geochemical characteristics, and the influence of the depositional environment on trace element (including REY) enrichment was investigated. The conclusions were as follows.
(1) The C3 coal was classified as a medium rank coking coal with an ultra-low moisture content, a medium-high-ash yield, and low-medium volatile content. Compared with the average values for Chinese and world coals, Cu and V are enriched, while several other trace elements were slightly enriched, including Co, Hf, Nb, Sc, Ta, Zn, and Zr in the C3 coal.
(2) The C3 coal was deposited in a low peat swamp with deep water cover, weak hydrodynamic conditions, brackish to salty water, and reducing conditions, mainly within a limno-telmatic environment.
(3) Trace elements, including Cu, V, Hf, Nb, Sc, Ta, Zr, and REY, were easily enriched in the limno-telmatic environment with fresh water, reducing conditions, and weak hydrodynamic conditions. Additionally, REY and V were also significantly enriched in the brackish water limno-telmatic with the same depositional environment.

Author Contributions

Conceptualization, J.W. ; methodology, J.W. and X.W.; validation, J.W. and L.S.; writing—original draft preparation, J.W.; writing—review and editing, J.W. and L.S. All authors have read and agreed to the published version of the manuscript.

Funding

This work was supported by the National Natural Science Foundation of China (No. 41602123 and 41572090), and the Fundamental Research Funds for the Universities of Henan Province (No. NSFRF220401).

Data Availability Statement

The raw data supporting the conclusions of this article will be made available by the authors, without undue reservation.

Conflicts of Interest

The authors declare that the research was conducted in the absence of any commercial or financial relationships that could be construed as a potential conflict of interest.

References

  1. Allegre C.J., Louvat P., Gaillardet J., Meynadier L., Rad S., Capmas F. The fundamental role of island arc weathering in the oceanic Sr isotope budget. Earth and Planetary Science Letters, 2010, 292 (1-2): 51-56. [CrossRef]
  2. Benton, M.J., Newell, A.J. Impacts of global warming on Permo-Triassic terrestrial ecosystems. Gondwana Res., 2014, 25 (4):1308-1337. [CrossRef]
  3. Bercovici A., Cui Y., Forel M.B., Yu J.X., Vajda V. Terrestrial paleoenvironment characterization across the Permian-Triassic boundary in South China. J. Asian Earth Sci., 2015, 98: 225-246. [CrossRef]
  4. Calder J. H., Gibling M.R., Mukhopadhyay P.K. Peat formation in a westphalian B piedmont setting, Cumberland Basin, Nova Scotia: implications for the maceral-based interpretation of rheotrophic and raised paleomires. Contribution series, 1991, 91-002: 283-296.
  5. Diessel C. F. K. The correlation between coal facies and depositional environments. Proc. Symposium on Advances in the study of the Sydney Basin: Newcastle. University of Newcastle, 1986: 19-22.
  6. Diessel C. Coal-bearing depositional systems. Thomson Press (India)Ltd., New Delhi, 1992, pp, 161-264.
  7. Dai S.F., Ren D.Y., Chou C.L., Finkelman R.B., Seredin V.V., Zhou Y.P. Geochemistry of trace elements in Chinese coals: A review of abundances, genetic types, impacts on human health, and industrial utilization. International Journal of Coal Geology, 2012, 94: 3-21. [CrossRef]
  8. Dai S.F., Luo Y.B., Seredin V.V., Ward C.R., Hower J.C., Zhao L., Liu S.D., Zhao C.L., Tian H.M., Zou J.H. Revisiting the late Permian coal from the Huayingshan, Sichuan, southwestern China: Enrichment and occurrence modes of minerals and trace elements. International Journal of Coal Geology, 2014, 122:110-128. [CrossRef]
  9. Dai S.F., Liu J.J., Ward C.R., Hower J.C., Xie P.P., Jiang Y.F., Hood M.M., O’keefe J.M.K., Song H.J. Petrological, geochemical, and mineralogical compositions of the low-Ge coals from the Shengli Coalfield, China: A comparative study with Ge-rich coals and a formation model for coal-hosted Ge ore deposit. Ore Geology Reviews, 2015, 71: 318-349. [CrossRef]
  10. Dai S.F., Ji D.P., Ward C.R., French D., Hower J.C., Yan X.Y., Wei Q. Mississippian anthracites in Guangxi Province, southern China: Petrological, mineralogical, and rare earth element evidence for high-temperature solutions. International Journal of Coal Geology, 2018, 197: 84-114. [CrossRef]
  11. Dai S.F., Bechtel A., Eble C.F., Flores R.M., French D., Graham I.T., Hood M.M., Hower J.C., Korasidis V.A., Moore T.A., Puttmann W., Wei Q., Zhao L., O’keefe J.M.K. Recognition of peat depositional environments in coal: a review. International Journal of Coal Geology, 2020, 219:103383. [CrossRef]
  12. Fu X.G., Wang J., Feng X.L., Chen W.B., Wang D., Song C.Y., Zeng S.Q. Mineralogical composition of and trace-element accumulation in lower Toarcian anoxic sediments: a case study from the Bilong Co. oil shale, eastern Tethys. Geological magazine, 2016, 153(4): 618-634. [CrossRef]
  13. Hatch J.R., Leventhal J.S. Relationship between inferred redox potential of the depositional environment and geochemistry of the Upper Pennsylvanian( Missourian) Stark Shale Member of the Dennis Limestone, Wabaunsee County, Kansas, USA. Chemical Geology, 1992, 99(1-3): 65-82. [CrossRef]
  14. He B., Xu .YG., Xiao L., Wang Y.M., Wang K.M., Sha S.L. Sedimentary Responses to Uplift of Emeishan Mantle Plume and its implications. Geological review, 2006, 52(1): 30-37. (in Chinese with English abstract).
  15. Jiu B., Huang W.H., Hao R.L. A method for judging depositional environment of coal reservoir based on coal facies parameters and rare earth element parameters. Journal of Petroleum Science and Engineering, 2021, 207, 109128. [CrossRef]
  16. Kalkreuth W.D., Marchioni D.L., Calder J.H., Lamberson M.N., Naylor R.D., Paul J. The relationship between coal petrography and depositional environments from selected coal basins in Canada. International Journal of Coal Geology, 1991, 19(1-4): 21-76. [CrossRef]
  17. Ketris M.P., Yudovich Y.E. Estimations of Clarkes for carbonaceous biolithes: world average for trace elements in black shales and coals. International Journal of Coal Geology, 2009, 78: 135-148. [CrossRef]
  18. Ling K.Y., Wen H.J., Zhang Z.W., Zhu X.Q., Tang H.S. Geochemical characteristics of dolomite weathering profiles and revelations to enrichment mechanism of trace elements in the Jiujialu Formation, central Guizhou Province. Acta petrologica sinica, 2019, 35(11): 3385-3397. [CrossRef]
  19. Liu Y., Wei Y., Liu G.J., Fu B., Chen B.Y., Zhang J.M., Gui L., Zhou H.H., Lu M.Y. Fine chemical speciation and environmental impact capacity of trace elements with different enrichment levels in coal. Science of the total environment, 2023, 856, 158928. [CrossRef]
  20. Lu J., Shao L..Y, Yang M.F., Zhou K., Wheeley J.R., Wang H., Hilton J. Depositional Model for Peat Swamp and Coal Facies Evolution Using Sedimentology, Coal Macerals, Geochemistry and Sequence Stratigraphy. Journal of Earth Science, 2017, 28(6): 1163-1177. [CrossRef]
  21. Moss P.T., Greenwood D.R., Archibald S.B. Regional and local vegetation community dynamics of the eocene okanagan highlands (British columbia-Washington state) from palynology. Canadian Journal of Earth Science, 2005, 42 (2), 187-204. [CrossRef]
  22. Oboirien B.O., Thulari V., North B.C. Enrichment of trace elements in bottom ash from coal oxy-combustion: Effect of coal types. Applied energy, 2016, 177: 81-86. [CrossRef]
  23. Qin G.H., Cao D.Y., Wei Y.C., Wang A.M., Liu J.C. Geochemical characteristics of the Permian coals in the Junger-Hebaopian mining district, northeastern Ordos Basin, China: Key role of paleopeatforming environments in Ga-Li-REY enrichment. Journal of Geochemical Exploration, 2020, 213, 106494.
  24. Qu Y. Palaeoenvironment of the Carboniferous-Permian carbonate rocks in Mandula-Xilinhot, Inner Mongolia. Doctoral Dissertation of Jilin University, 2019. (in Chinese with English abstract).
  25. Ren D.Y., Zhao F.H., Dai S.F., Zhang J.Y., Luo K.L. Geochemistry of Trace Elements in Coal. Science Press, Beijing, 2006, pp, 393-401. (in Chinese).
  26. Rimmer S.M., Thompson J.A., Goodnight S.A.,Robl T.L. Multiple controls on the preservation of organic matter in Devonian-Mississippian marine black shales: geochemical and petrographic evidence. Palaeogeography, Palaeoclimatology, Palaeoecology, 2004, 215 (1-2): 125-154. [CrossRef]
  27. Roser B.P., Korsch R.J. Determination of tectonic setting of sandstone-mudstone suites using SiO2 content and K2O/Na2O ratio. Journal of Geology, 1986, 94: 635-650. [CrossRef]
  28. Seredin, V.V., Dai S.F. Coal deposits as a potential alternative source for lanthanides and yttrium. Int. J. Coal Geol., 2012, 94, 67-93. [CrossRef]
  29. Shao L.Y., Gao C.X., Zhang C., Wang H., Guo L.J., Gao C.H. Sequence-Palaeogeography and coal accumulation of late Permian in Southwestern China. Acta Sedimentol. Sin., 2013, 31 (5), 856-866. (in Chinese with English abstract).
  30. Shao L.Y., Wang J., Hou H.H., Zhang M.Q., Spiro B., Large D., Zhou Y.P. Geochemistry of the C1 coal of latest Permian during mass extinction in Xuanwei, Yunnan. Acta Geol. Sin., 2015, 89:163-179 (in Chinese with English abstract).
  31. Shao L.Y., Wang X.T., Lu J., Wang D.D., Hou H.H. A Reappraisal on Development and Prospect of Coal Sedimentology in China. Acta Sedimentologica Sinica, 2017, 35(5): 1016-1031. (in Chinese with English abstract). [CrossRef]
  32. Shao L.Y., Hua F.H., Wang J., Ji X.K., Yan Z.M., Zhang T. C., Wang X.T., Ma S.M., Jones T., Lu H.N. Palynological dynamics in the late Permian and the Permian-Triassic transition in southwestern China. Palaeogeography, Palaeoclimatology, Palaeoecology, 2023, 111540. [CrossRef]
  33. Shen S.Z., Crowley J.L., Wang Y., Bowring S.A., Erwin D.H., Sadler P.M., Cao C.Q., Rothman D.H., Henderson C.M., Ramezani J., Zhang H., Shen Y.N., Wang X.D., Wang W., Mu L., Li W.Z., Tang Y.G., Liu X.L., Liu L.J., Zeng Y., Jiang Y.F., Jin Y.G. Calibrating the end-Permian mass extinction. Science, 2011, 334 (6061), 1367-1372. [CrossRef]
  34. Tang X.Y., Huang W.H. Trace elements of Chinese coal. The commercial Press, Beijing, 2004, pp, 3-41. (in Chinese).
  35. Thompson S., Morley R.J., Barnard P.C., Cooper B.S. Facies recognition of some Tertiary coals applied to prediction of oil source rock occurrence. Mar. Petrol. Geol., 1985, 2 (4): 288-297. [CrossRef]
  36. Wang G.Q., Sun B.L., Liu C., Wu J., Pan X.Y., Zeng F.G. Paleo-peat sedimentary environment and controlling on trace elements: example from the 11# coal seam in Donglutian Coalmine of Ningwu Coalfield. Journal of palaeogeography, 2022, 24(6): 1210-1223. (in Chinese with English abstract).
  37. Wang H., Shao L.Y., Hao L.M., Zhang P.F.,Glasspool I.J., Wheeley J.R., Wignall P.B., Yi T.S., Zhang M.Q., Hilton J. Sedimentology and sequence stratigraphy of the Lopingian (Late Permian) coalmeasures in southwestern China. International Journal of Coal Geology, 2011, 85:168-183. [CrossRef]
  38. Wang H., Shao L.Y., Newton R.J., Bottrell S.H., Wignall P.B., Large D. Records of terrestrial sulfur deposition from the latest Permian coals in SW China. Chemical Geology, 2012, 292-293:18-24. [CrossRef]
  39. Wang J., Shao L.Y., Yan Z.M., Wang X.T. The coal-forming environment during mass extinction in the latest Permian: Evidence from geochemistry of rare earth elements. Frontiers in Earth Science, 2023,18, 1057831. [CrossRef]
  40. Wang W.F., Qin Y., Song D.Y., Fu X.H. Geochemistry of rare earth elements in the middle and high sulfur coals from North Shanxi Province. Geochimica, 2002, 31(6): 564-570. (in Chinese with English abstract). [CrossRef]
  41. Wang Y., Cao J., Zhang B.L., Liao Z.W., Zhang B., Liu J.C., Shi C.H. Genesis of the wangpo bed in the sichuan basin: Formation by eruptions of the emeishan large igneous province. Palaeogeography, Palaeoclimatology, Palaeoecology, 2022, 594, 110935. [CrossRef]
  42. Williams M.L., Jones B.G., Carr P.F. Geochemical consequences of the Permian–Triassic mass extinction in a non-marine succession, Sydney Basin, Australia. Chemical Geology, 2012, 326-327: 174-188. [CrossRef]
  43. Wu Y.Y., Qin Y., Wang A.K., Shen J. Geochemical anomaly and the causes of transition metal accumulations in late Permian coal from the eastern Yunnan-western Guizhou region. International Journal of Mining Science and Technology, 2013, 23:105-111. [CrossRef]
  44. Xiong X.H., Xiao J.F. Geochemical Indicators of Sedimentary Environments-A Summary. Earth and Environment, 2011, 39(3): 405-414.
  45. Zhang H., Cao C.Q., Liu X.L., Mu L., Zheng Q.F., Liu F., Xiang L., Liu L.J., Shen S.Z. The terrestrial end-Permian mass extinction in South China. Palaeogeography, Palaeoclimatology, Palaeoecology, 2016, 448:108-124. [CrossRef]
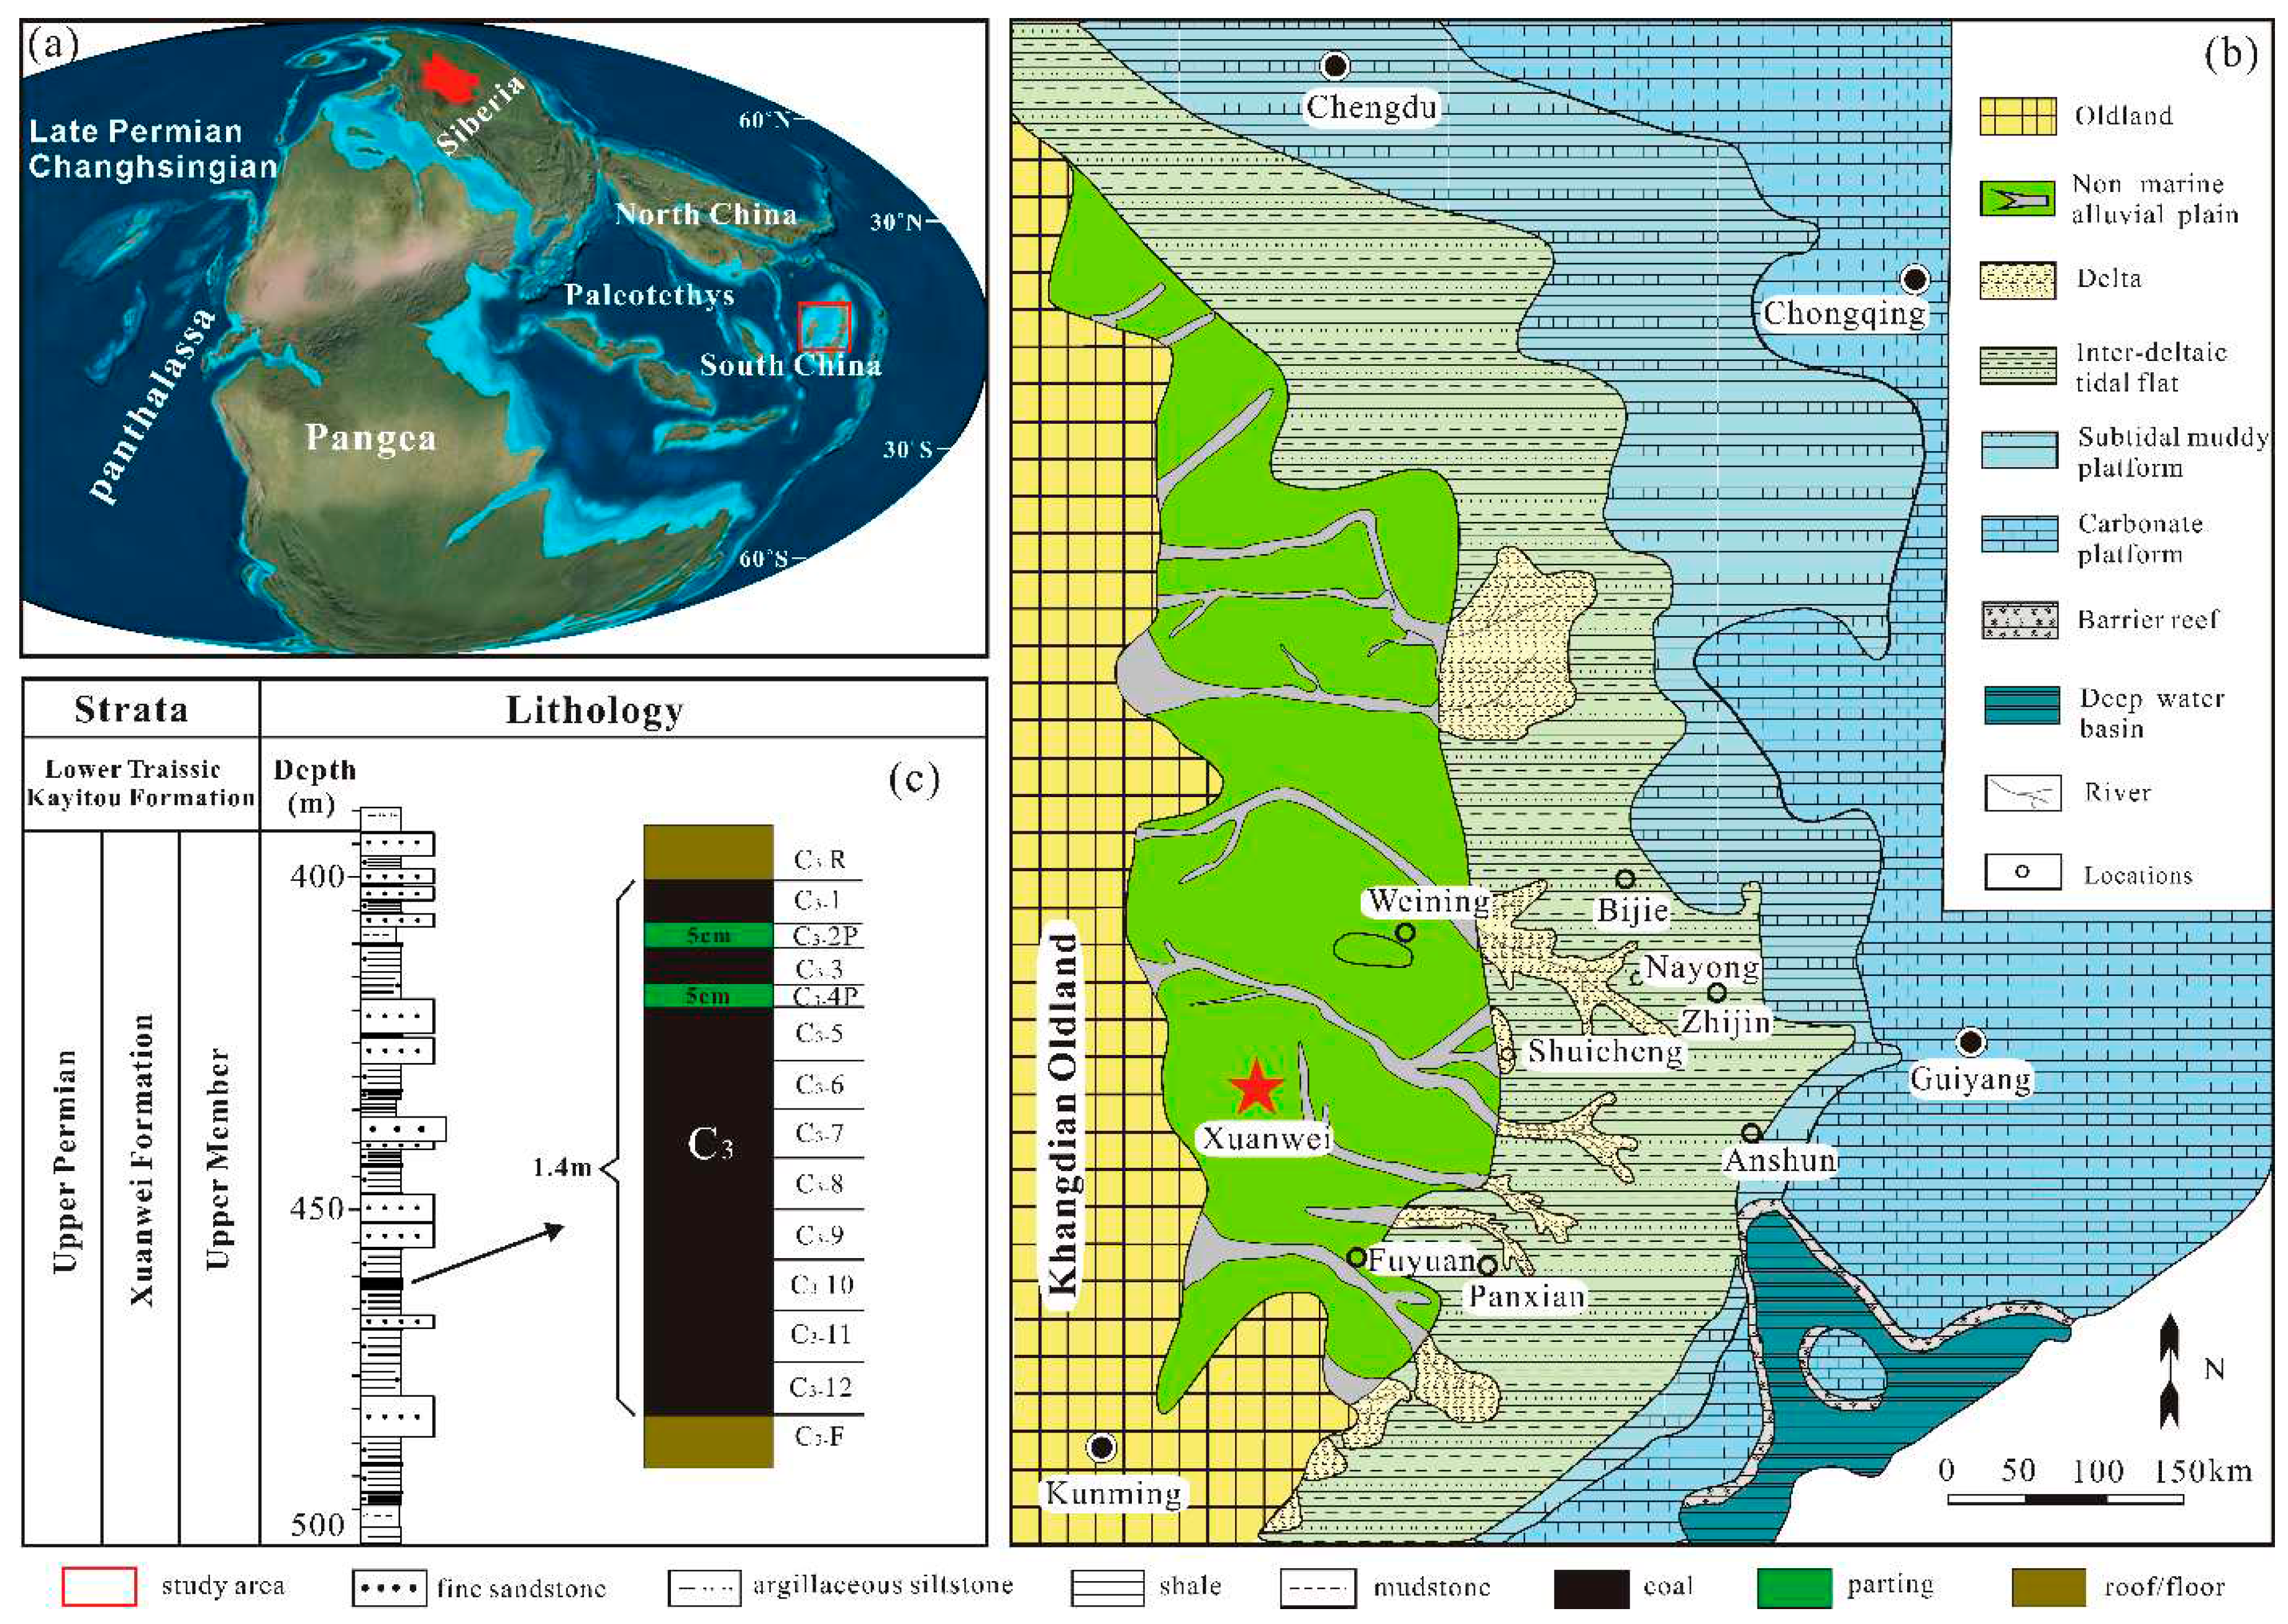
Figure 1. Location and geological context for the study area including a) Changhsingian (Late Permian) paleogeography showing position of the South China Plate (modified from the ~252 Ma map of the webpage http:// deeptimemaps.com/global-paleogeography-and-tectonics-in-deep-time); b) Palaeogeography of southwestern China in the Changhsingian (Late Permian) (modified from Wang, 2011); c) Lithology of the strata in Upper Member of Xuanwei Formation and horizons of samples in the coalseam C3 from the Lefeng Mine.
Preprints 82898 g001
Figure 2. Maceral compositions of the C3 coal from the Lefeng Mine (dry objective, reflected light).
Preprints 82898 g002
Figure 3. REY concentration coefficient of C3 coal from the Lefeng Coalmine.
Preprints 82898 g003
Figure 4. Source rock discrimination diagrams of the Xuanwei Formation coal measures. a) Diagram of ∑REE-( La/Yb)N (modified from Roser et al., 1986); b) Diagram of La/Sc-Co/Th (modified from Allegre et al., 2010).
Preprints 82898 g004
Figure 5. TPI-GI and VI-GWI coal facies of the C3 coal from the Lefeng Mine (modified from Diessel, 1992).
Preprints 82898 g005
Figure 6. Relationship between paleopeat-environment and trace elements of C3 coal from the Lefeng Mine.
Preprints 82898 g006
Figure 7. Correlation coefficients (R)between trace elememts and ash content of C3 coal from the Lefeng Mine.
Preprints 82898 g007aPreprints 82898 g007b
Table 1. Partial proximate analysis and vitrinite random reflectance (%) of the C3 coals.
NO. Mad Ad Vd FCd R°ran
C3-1 0.84 54.39 11.77 33.84 1.21
C3-3 1.04 56.93 11.97 31.1 1.32
C3-5 1.05 27.01 18.66 54.33 1.05
C3-6 1.12 11.3 22.69 66.01 1.15
C3-7 1.02 12.81 21.21 65.98 1.23
C3-8 1.47 24.3 19.11 56.59 1.35
C3-9 1.36 22.62 19.69 57.69 1.22
C3-10 1.49 43.36 15.98 40.66 1.77
C3-11 0.88 24.17 19.78 56.05 1.77
C3-12 1.41 19.55 20.98 59.47 1.26
Table 2. Maceral cpmpositions and coal facies of the C3 coals from the Lefeng Mine (%).
Sample C3-1 C3-3 C3-5 C3-6 C3-7 C3-8 C3-9 C3-10 C3-11 C3-12 av.
Vitrinite Telinite 11.2 8.2 13.7 5.6 18.7 23.6 16.7 20.6 6.8 3.7 12.9
Desmocollinite 37.4 58.7 25.2 13.9 22.5 32.6 44.0 44.2 39.9 42.8 36.1
Telocollinite 3.3 5.9 22.7 67.8 37.3 21.3 20.0 4.2 9.8 32.2 22.5
Vitrodetrinite 20.7 12.8 18.1 6.7 12.6 8.9 6.0 10.9 11.9 9.3 11.8
Total 72.6 85.6 79.7 94.0 91.1 86.4 86.7 79.9 68.4 88.0 83.2
Inertinite Fusinite 9.5 1.1 0.8 2.3 4.4 1.1 0.8 0.7 7.6 1.2 3.0
Semifusinite 2.3 0 0.2 0.2 0.7 0.6 0.2 0 1.8 0.7 0.7
Inertodetrinite 0.9 0.8 0 0 0.3 0.2 0.4 0.2 0.2 0.7 0.4
Macrinite 0 0 0 0 0 0 0 0.2 0 0.4 0.1
Sclerotinite 0 0 0 0 0 0 0 0.2 0 0 0.0
Total 12.7 1.9 1.0 2.5 5.4 1.9 1.4 1.3 9.6 3.0 4.1
Exinite Cutinite 0 0 0.2 0 0 0.7 0.6 0.4 0 0.4 0.2
mineral matter Clay minerals 1.6 2.9 5.0 0.9 0.5 2.3 1.0 3.4 0.7 0.9 1.9
Quartz 11.1 7.1 13.1 0.2 1.2 7.2 8.4 4.2 20.3 7.0 8.0
Pyrite 1.2 0.4 0 0.8 0.3 1.1 1.1 0.4 0.5 0.2 0.6
Calcite 0.9 2.1 1.0 1.6 1.5 0.4 0.8 0.4 0.5 0.5 1.0
Total 14.8 12.5 19.1 3.5 3.5 11.0 11.3 8.4 22.0 8.6 11.5
Coal facies GI 5.72 45.11 79.70 37.60 16.87 45.47 61.93 11.68 7.13 34.00 ——
TPI 0.69 0.26 1.48 2.78 2.68 1.42 0.85 0.63 0.65 0.86 ——
GWI 0.43 0.22 0.38 0.09 0.17 0.14 0.09 0.19 0.22 0.13 ——
V/I 0.45 0.21 0.86 3.68 1.73 1.10 0.74 0.52 0.50 0.71 ——
Table 3. Contents of trace elements and REY of C3 coal from the Lefeng Mine (µg/g).
Sample C3-1 C3-3 C3-5 C3-6 C3-7 C3-8 C3-9 C3-10 C3-11 C3-12 Av. Chinaa worldb CC1 CC2
Ba 65.8 90.7 57.3 26.4 29.1 38.4 41.1 173 46 26.70 59.45 159 150 0.37 0.40
Be 0.587 1.65 1.9 1.38 1.42 2.03 1.96 5.92 2.34 1.85 2.10 2.11 1.6 1.00 1.31
Cd 0.532 0.104 0.086 0 0.082 0.194 0.115 0.109 0.328 0.11 0.17 0.25 0.22 0.66 0.75
Co 22.7 16.3 18.2 22.6 22.3 24.7 26.8 19.8 35.4 28.40 23.72 7.08 5.1 3.35 4.65
Cr 33.9 31.9 17.7 15.1 16.1 22.4 25.2 73.1 25.7 21.30 28.24 15.4 16 1.83 1.77
Cs 0.513 2.3 0.401 0.043 0.108 0.302 0.255 1.46 0.196 0.15 0.57 1.13 1 0.51 0.57
Cu 69.3 116 44.5 34.4 45.7 166 117 594 83 143.00 141.29 17.5 16 8.07 8.83
Ga 5.72 11.1 9.13 3.62 4.31 9.58 7.27 20.4 5.63 5.87 8.26 6.55 5.8 1.26 1.42
Hf 2.65 3.64 5.27 1.14 1.7 4.52 3.84 14.1 2.37 2.14 4.14 3.71 1.2 1.12 3.45
Li 7.44 19.3 23.4 6.68 8.99 20.5 14.5 72.8 7.96 8.22 18.98 31.8 12 0.60 1.58
Mo 0.585 1.37 1.12 0.371 0.556 1.23 2.43 8.91 0.502 2.96 2.00 3.08 2.2 0.65 0.91
Nb 7.96 7.93 6.84 2.21 2.85 6.2 6.7 29 5.59 3.65 7.89 9.44 3.7 0.84 2.13
Ni 23.2 16.7 17.3 20 18.9 25.5 21.4 29.7 24.3 24.00 22.10 13.7 13 1.61 1.70
Pb 9.74 8.26 21.8 16.7 10.1 17.2 13.3 10.2 10.1 11.30 12.87 15.1 7.8 0.85 1.65
Rb 6.75 16.1 5.02 1.53 1.83 3.47 3.47 20.7 2.98 1.93 6.38 9.25 14 0.69 0.46
Sb 1.27 1.24 0.728 0.956 0.894 0.877 0.844 2.11 0.772 1.04 1.07 0.84 0.92 1.28 1.17
Sc 5.81 7.49 7.01 2.12 3.78 9.42 8.38 25.5 5.47 6.91 8.19 4.38 3.9 1.87 2.10
Sr 32.7 59.4 30.4 26.5 39.9 31.1 47 92 32.8 54.40 44.62 140 110 0.32 0.41
Ta 0.397 0.536 0.603 0.131 0.212 0.542 0.48 2.32 0.394 0.26 0.59 0.62 0.28 0.95 2.10
Th 2.01 7.93 7.93 1.11 1.9 6.64 4.68 16.8 2.59 2.32 5.39 5.84 3.3 0.92 1.63
Tl 0.04 0.071 0.027 0.05 0.005 0.027 0.029 0.106 0.023 0.04 0.04 0.47 0.63 0.09 0.07
U 0.993 3.37 2.41 0.491 0.715 1.86 1.77 4.45 1.05 1.08 1.82 2.43 2.4 0.75 0.76
V 135 384 135 59.4 57.1 173 193 467 199 166.00 196.85 35.1 25 5.61 7.87
W 4.79 2.89 0.801 0.798 1.07 0.543 2.49 1.48 3.05 1.41 1.93 1.08 1.1 1.79 1.76
Zn 109 43.7 52.7 51.6 56.8 68.3 56.8 72.1 91.3 61.70 66.40 41.4 23 1.60 2.89
Zr 164 166 220 44 64.6 167 150 521 110 82.50 168.91 89.5 36 1.89 4.69
La 22.80 52.60 27.40 4.48 12.10 31.10 29.80 85.5 25.50 16.90 30.82 22.5 11 1.37 2.80
Ce 50.00 99.10 55.40 7.22 27.60 58.10 55.00 146 48.30 31.70 57.84 46.7 23 1.24 2.51
Pr 5.93 12.80 6.65 0.84 3.54 7.39 7.59 19.1 6.28 4.23 7.44 6.42 3.5 1.16 2.12
Nd 22.90 47.70 25.20 3.50 15.20 31.10 31.20 78.3 26.80 18.20 30.01 22.3 12 1.35 2.50
Sm 4.16 9.16 4.82 0.85 3.16 6.18 5.81 14.3 4.74 4.00 5.72 4.07 2.0 1.40 2.86
Eu 0.84 1.74 1.05 0.20 0.69 1.34 1.56 3.39 1.38 1.03 1.32 0.84 0.47 1.57 2.81
Gd 3.23 8.63 5.42 0.95 2.62 4.92 5.20 11.1 4.58 3.82 5.05 4.65 2.7 1.09 1.87
Tb 0.51 1.64 1.07 0.20 0.44 0.87 0.90 2 0.83 0.69 0.92 0.62 0.32 1.48 2.86
Dy 2.52 8.47 6.50 1.43 2.36 4.80 4.65 11.5 4.35 3.85 5.04 3.74 2.1 1.35 2.40
Y 11.00 49.30 46.00 11.2 13.2 24.7 22.7 55.3 25.4 19.1 27.79 18.2 8.4 1.53 3.31
Ho 0.45 1.62 1.47 0.32 0.43 0.82 0.85 2.18 0.83 0.64 0.96 0.96 0.54 1.00 1.78
Er 1.22 4.69 4.40 0.99 1.25 2.48 2.22 5.94 2.26 1.56 2.70 1.79 0.93 1.51 2.90
Tm 0.21 0.82 0.72 0.16 0.21 0.38 0.28 0.92 0.37 0.26 0.43 0.64 0.31 0.68 1.40
Yb 1.44 4.98 4.62 0.91 1.29 2.47 2.03 5.85 1.97 1.47 2.70 2.08 1.0 1.30 2.70
Lu 0.22 0.80 0.74 0.13 0.18 0.33 0.36 0.92 0.36 0.25 0.43 0.38 0.20 1.13 2.15
∑REY 127.43 304.05 191.46 33.38 84.26 176.98 170.15 442.30 153.95 107.70 179.17 135.89 68.47 1.32 2.62
a from Dai et al., 2015; b from Ketriset al., 2009; CC1= element content in sample/element average content in Chinese coal; CC2 =element content in sample/element average content in world’s coal; REY=La+Ce+Pr+Nd+Sm+Eu+Gd+Tb+Dy+Y+Ho+Er+Tm+Yb+Lu.
Disclaimer/Publisher’s Note: The statements, opinions and data contained in all publications are solely those of the individual author(s) and contributor(s) and not of MDPI and/or the editor(s). MDPI and/or the editor(s) disclaim responsibility for any injury to people or property resulting from any ideas, methods, instructions or products referred to in the content.
Copyright: This open access article is published under a Creative Commons CC BY 4.0 license, which permit the free download, distribution, and reuse, provided that the author and preprint are cited in any reuse.
Prerpints.org logo

Preprints.org is a free preprint server supported by MDPI in Basel, Switzerland.

Subscribe

© 2024 MDPI (Basel, Switzerland) unless otherwise stated