Submitted:
21 August 2023
Posted:
22 August 2023
You are already at the latest version
Abstract
Keywords:
1. Introduction
2. Methods
2.1. Viewpoint
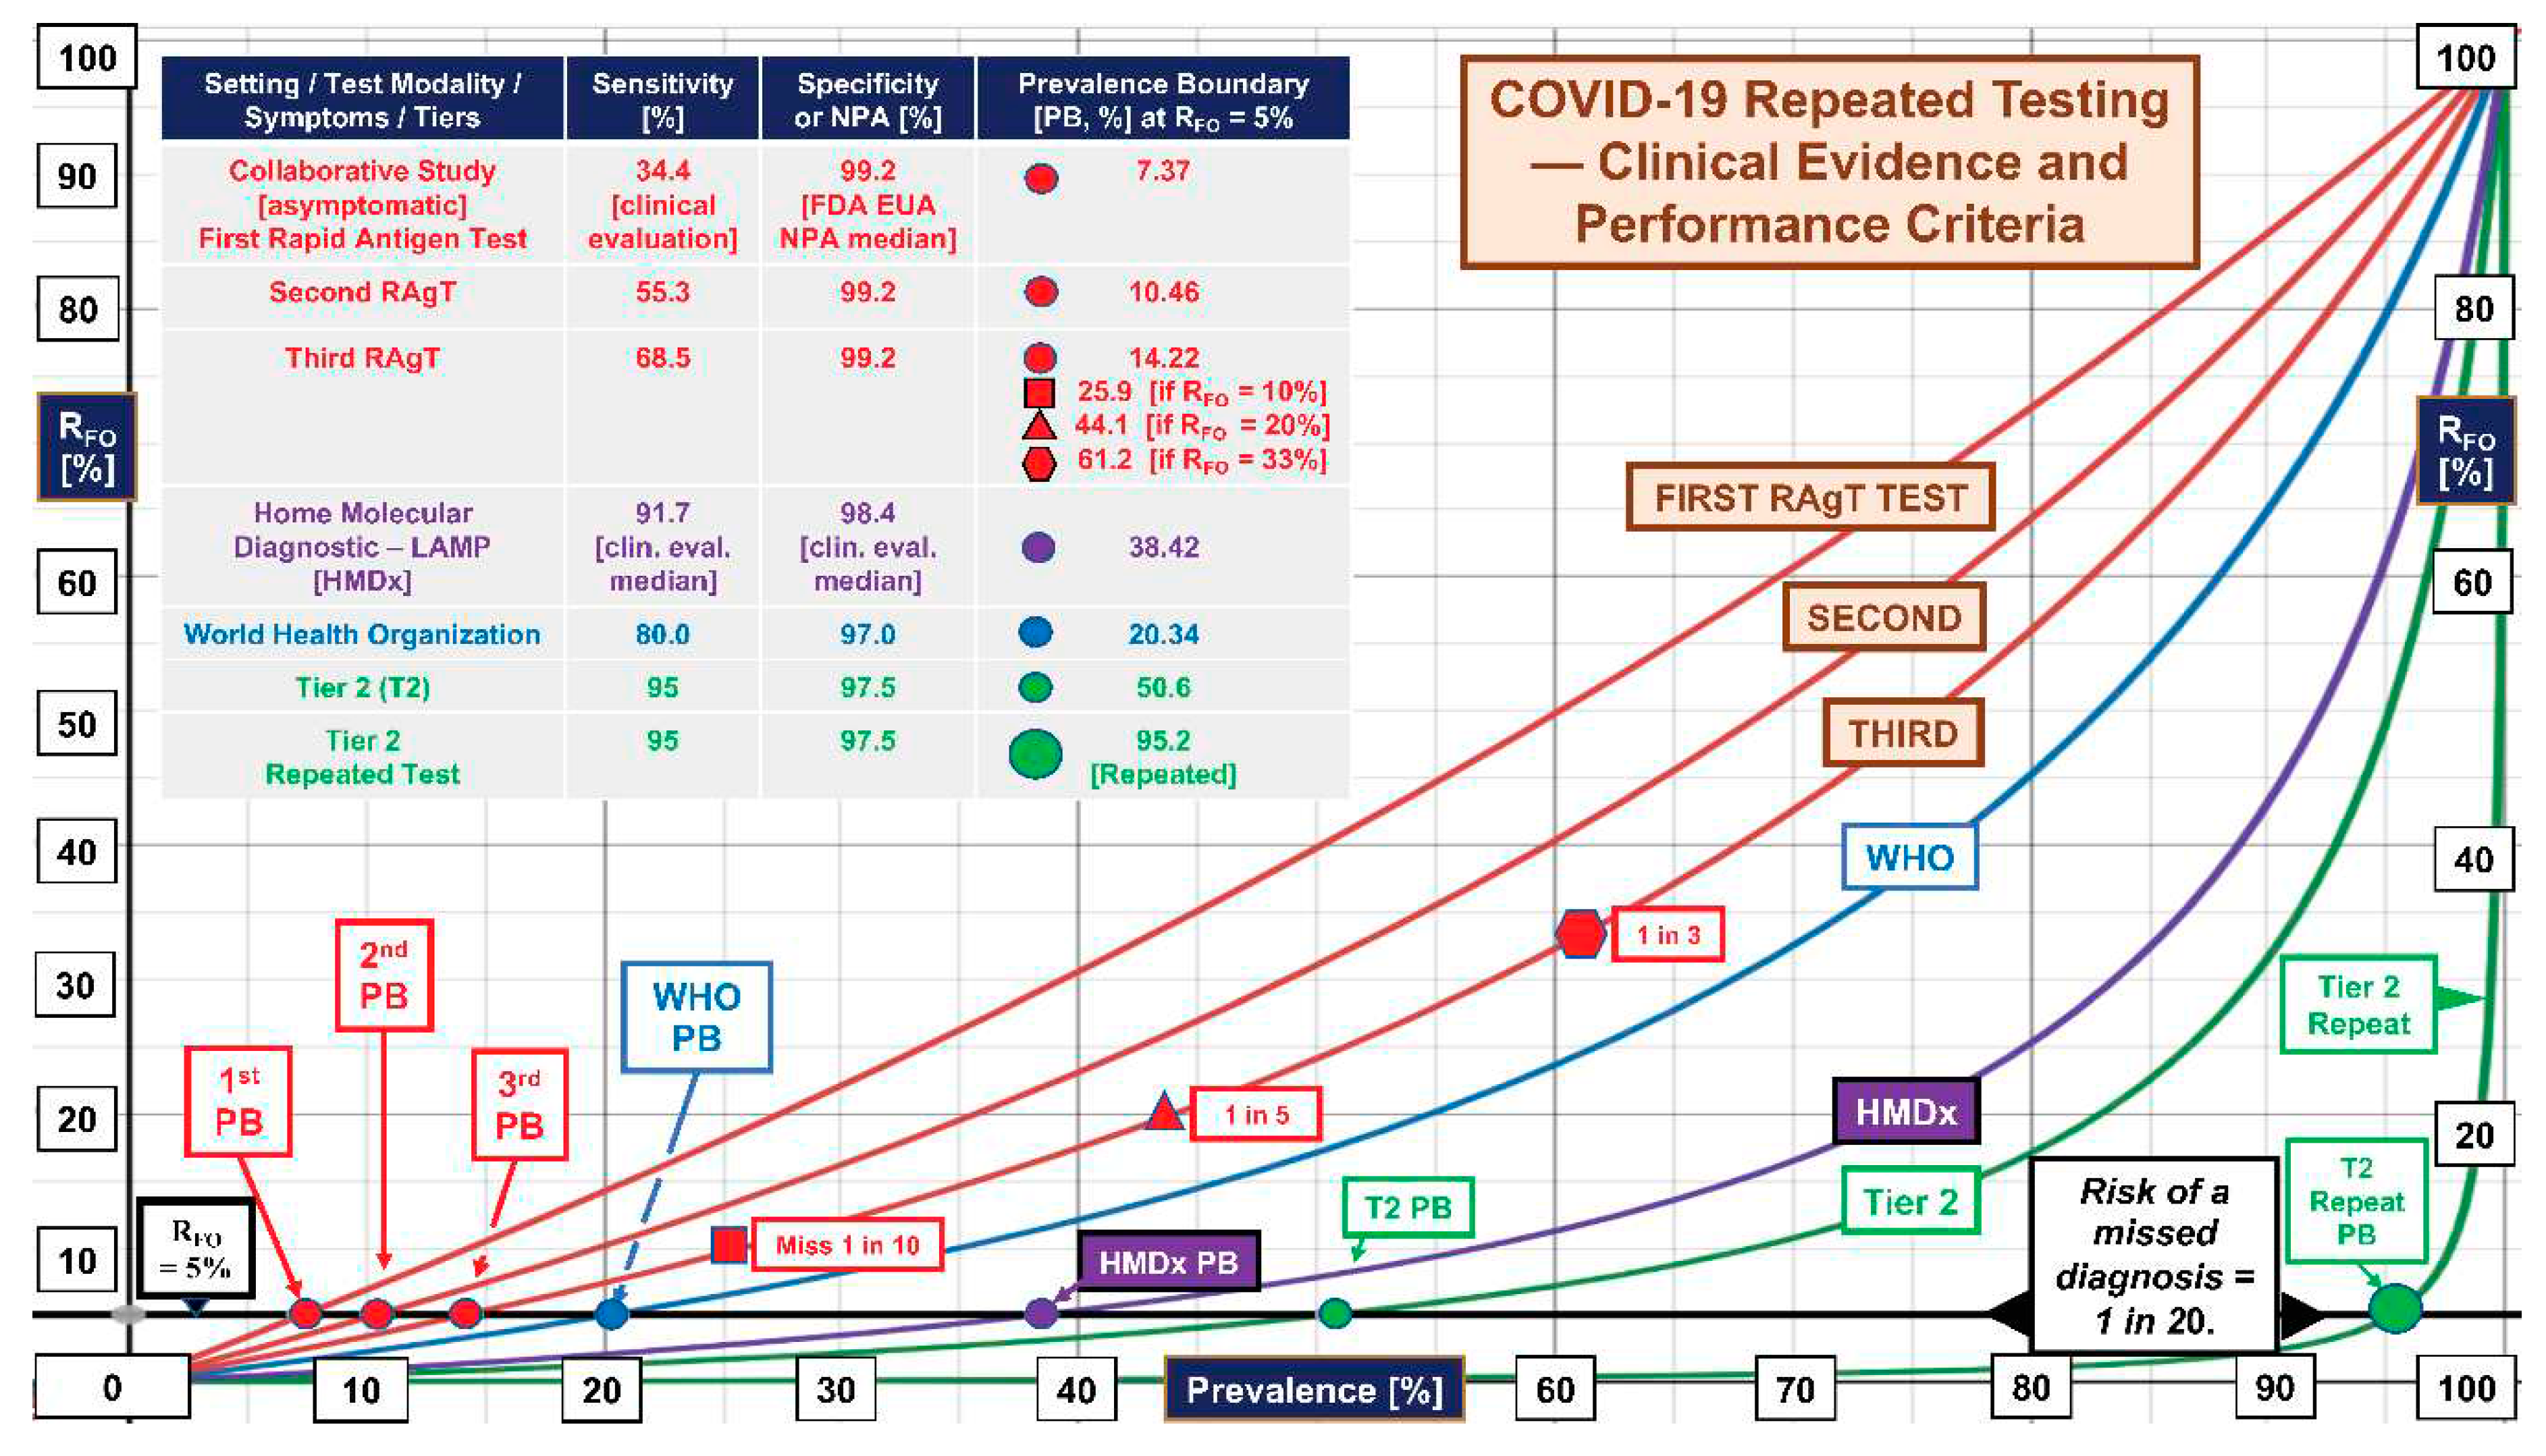
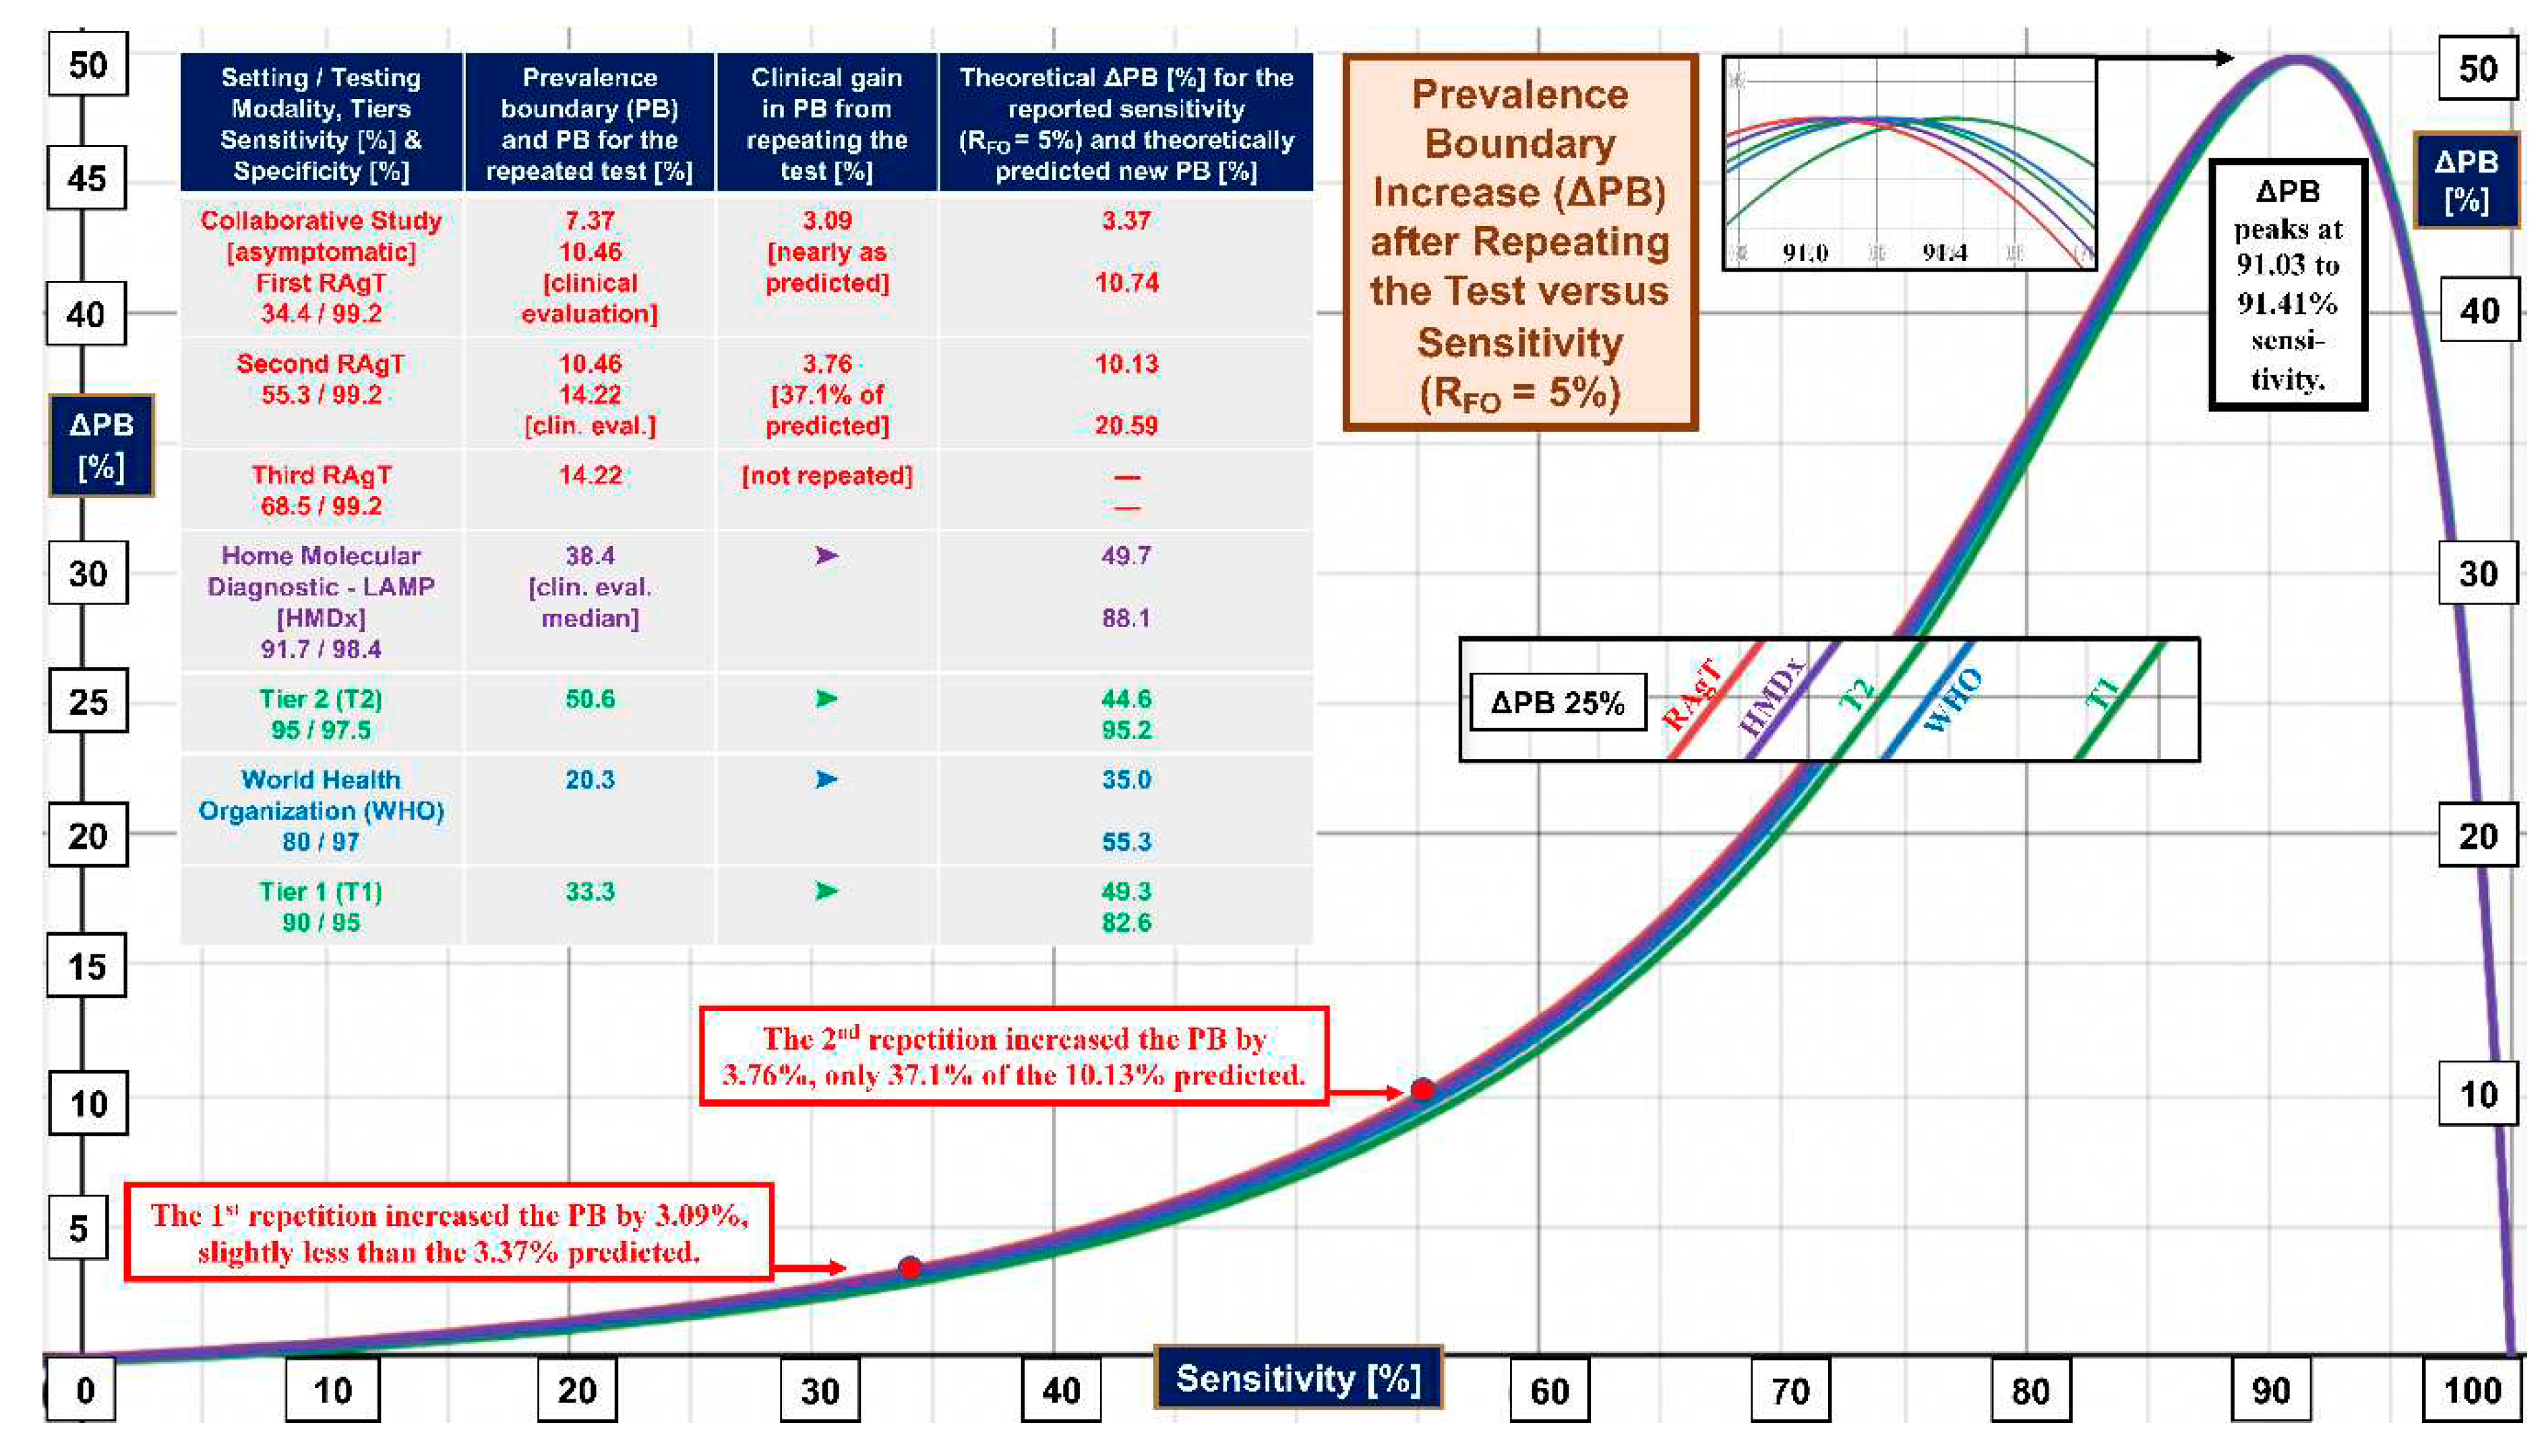
2.2. Tiers and Mathematical Foundations
| Tier | Performance Level | Sensitivity [%] | Specificity [%] | Prevalence Boundary for RFO of 5% 1st Test [%] 2nd Test [%] ∆PB [%] |
||
|---|---|---|---|---|---|---|
| 1 | Low | 90 | 95 | 33.3 | 82.6 | 49.3 |
| 2 | Marginal | 95 | 97.5 | 50.6 | 95.2 | 44.6 |
| 3 | High | 100 | ≥ 99 | No Boundary | No Boundary | — |
| Eq. No. | Category and Equations | Dep. Var. | Indep. Var. |
|---|---|---|---|
| Fundamental Definitions | |||
| 1 | x = Sens = TP/(TP + FN) | x | TP, FN |
| 2 | y = Spec = TN/(TN + FP) | y | TN, FP |
| 3 | s = PPV = TP/(TP + FP) | s | TP, FP |
| 4 | t = NPV = TN/(TN + FN) | t | TN, FN |
| 5 | p = Prev = (TP + FN)/N | p | TP, FN, N |
| 6 | N = TP + FP + TN + FN | N | TP, FP, TN, FN |
| Derived Equations | |||
| 7 | PPV = [Sens•Prev]/[Sens•Prev + (1-Spec)(1-Prev)], ors = [xp]/[xp + (1-y)(1-p)] — symbolic version of the equation above | s | x, y, p |
| 8 | p = [s(y-1)]/[s(x + y - 1) - x] | p | x, y, s |
| 9 | x = [s(p-1)(y-1)]/[p(s-1)] | x | y, p, s |
| 10 | y = [sp(x-1) + s - px]/[s(1-p)] | y | x, p, s |
| 11 | NPV = [Spec•(1-Prev)]/[Prev•(1–Sens) + Spec•(1–Prev)], or t = [y(1–p)]/[p(1–x) + y(1–p)] | t | x, y, p |
| 12 | p = [y(1-t)]/[t(1 - x - y) + y] | p | x, y, t |
| 13 | x = [pt + y(1-p)(t-1)]/[pt] | x | y, p, t |
| 14 | y = [pt(x-1)]/[t(1-p) – 1 +p] | y | x, p, t |
| Ratios | |||
| 15 | TP/FP = PPV/(1-PPV) = [Sens•Prev]/[(1-Spec)(1-Prev)], or [xp]/[(1-y)(1-p)] | TP/FP Ratio | x, y, p |
| 16 | FP/TP = (1-PPV)/PPV = [(1-y)(1-p)]/(xp) | FP/TP Ratio | x, y, p |
| 17 | FN/TN = (1-NPV)/NPV = [p(1-x)]/[y(1-p)] | FN/TN Ratio | x, y, p |
| Rates | |||
| True positive (RTP), false positive (RFP), & positive (RPOS) | |||
| 18 | RTP = TP/(TP + FN) = x | RTP | TP, FN |
| 19 | RFP = FP/(TN + FP) = 1 – Spec = 1- y | RFP | TN, FP |
| 20 | RPOS = (TP + FP)/N | RPOS | TP, FP, N |
| False Omission (RFO) | |||
| 21 | RFO = FN/(TN + FN) = 1 – NPV = 1- t = [p(1-x)]/[p(1-x) + y(1-p)] | RFO | x, y, p |
| RFO with repeated test (rt) | |||
| 22 | RFO/rt = [p(1-x)2]/[p(1-x)2 + y2(1-p)] | RFO/rt | x, y, p |
| Predictive value geometric mean-squared (range 0 to 1) | |||
| 23 | PV GM2 = PPV•NPV = s•t = {[xp]/[xp + (1-y)(1-p)]}• {[y(1–p)]/[p(1–x) + y(1–p)]} | PV GM2 | x, y, p |
| Prevalence Boundary | |||
| Prevalence boundary for one test given RFO | |||
| 24 | PB = y(1-t)/[(1-x) - (1-t)(1-x-y)] = [yRFO]/[(1-x) -RFO(1-x-y)] = [yRFO]/[RFO(x+y-1) + (1-x)] | PB | x, y, t orx, y, RFO |
| Prevalence boundary for repeated test (PBrt) given RFO | |||
| 25 | PBrt = [y2RFO]/[RFO(y2-x2+2x-1) + (x-1)2] | PBrt | x, y, RFO |
| Improvement in prevalence boundary (∆PB) when test second time given RFO | |||
| 26 | ∆PB = {y2RFO/[RFO(y2-x2+2x-1) + (x-1)2]}-{yRFO/[RFO/[(x+y-1) + (1-x)]} | ∆PB | x, y, RFO |
| Recursion | |||
| Recursive formulae for PPV (si+1) and NPV (ti+1) | |||
| 27 | si+1 = [xpi]/[xpi + (1-y)(1-pi)], where the index, i = 1, 2, 3… | si+1 | x, y, pi |
| 28 | ti+1 = [y(1-pi)]/[pi(1-x) + y(1-pi)] | ti+1 | x, y, pi |
| Special Cases | |||
| PPV when sensitivity is 100% | |||
| 29 | PPV = [Prev]/[Prev + (1-Spec)•(1-Prev)], ors = [p]/[p + (1-y)(1-p)] | s | y, p |
| Prevalence when sensitivity is 100% (i.e., FN = 0) | |||
| 30 | Prev = 1 – [(1 – N+/N)/Spec], or p = 1- [(1-POS%)/y] | p | POS%, y |
| Sensitivity when given specificity, RFO, and PB (no repeat) | |||
| 31 | x = [PB-RFO(y+PB-y•PB)]/[PB(1-RFO)] | x | y, RFO, PB |
| Sensitivity, given RFO and PB, when specificity (y) is 100% | |||
| 32 | x = (PB-RFO)/[PB(1-RFO)] | x | RFO, PB |
| Accuracy (not recommended – see note) | |||
| 33 | A = (TP + TN)/N = Sens•Prev(dz) + Spec•Prev(no dz) | A | TP, TN, N |
2.3. Prevalence Boundaries
2.4. FDA, NIH, University, and Industry RAgT Field Evaluation (“Collaborative Study”)
2.5. Rapid Antigen Tests in the Collaborative Study
2.6. FDA Directive for Rapid Antigen Tests
2.7. Software and Computational Design
2.8. Human Subjects
3. Results


4. Discussion

5. Conclusions and Recommendations
Funding
Acknowledgements
References
- Kost, GJ. Designing and interpreting COVID-19 diagnostics: Mathematics, visual logistics, and low prevalence. Arch Pathol Lab Med. 2021, 145, 291–307. [Google Scholar] [CrossRef] [PubMed]
- Kost, GJ. The impact of increasing prevalence, false omissions, and diagnostic uncertainty on Coronavirus Disease 2019 (COVID-19) test performance. Arch Pathol Lab Med. 2021, 145, 797–813. [Google Scholar] [CrossRef] [PubMed]
- Kost, GJ. Diagnostic strategies for endemic Coronavirus Disease 2019 (COVID-19) Rapid antigen tests, repeated testing, and prevalence boundaries. Arch Path Lab Med. 2022, 146(1), 16–25. [Google Scholar] [CrossRef] [PubMed]
- 4. Soni A, Herbert C, Pretz C, Stamegna P, Filippaios A, Shi Q, et al. Finding a needle in a haystack: Design and implementation of a digital site-less clinical study of serial rapid antigen testing to identify symptomatic SARS-CoV-2 infection. medRxiv. [CrossRef]
- 5. Soni A, Herbert C, Lin H, Yan Y, Pretz C, Stamegna P, et al. Performance of rapid antigen tests to detect symptomatic and asymptomatic SARS-CoV-2 Infection: A prospective cohort study. Ann Intern Med.
- 6. Food and Drug Administration. In Vitro Diagnostics EUAs - Antigen Diagnostic Tests for SARS-CoV-2. Individual EUAs for Antigen Diagnostic Tests for SARS-CoV-2. 18 August 2019.
- Kost, GJ. The Coronavirus disease 2019 spatial care path: Home, community, and emergency diagnostic portals. Diagnostics. 2022, 12(1216), 1–16. [Google Scholar]
- Kost, GJ. Table S1. COVID-19 Tests with FDA Emergency Use Authorization for Home Self-testing. Part I. Antigen Tests (pp. 1-2), and Table S2. COVID-19 Rapid Antigen Tests for Symptomatic and Asymptomatic Subjects in Community Settings. Part I. Point-of-care Testing (pp. 3-7). Diagnostics. /: Supplementary Materials. https, 18 August 1216. [Google Scholar]
- 9. Food and Drug Administration. Revisions Related to Serial (Repeat) Testing for the EUAs of Antigen IVDs, 18 August 1627.
- World Health Organization. Antigen-detection in the diagnosis of SARS-CoV-2 infection. Interim guidance. , 2021. file:///Users/m1/Downloads/WHO-2019-nCoV-Antigen-Detection-2021.1-eng.pdf (accessed on August 18, 2023). 6 October.
- Kost, GJ. Changing diagnostic culture calls for point-of-care preparedness — Multiplex now, open prevalence boundaries, and build community resistance. 21st Century Pathology. 2022, 129), 1–7. [Google Scholar]
- 12. Kweon OJ, Lim YK, Kim HR, Choi Y, Kim MC, Choi SH, et al. Evaluation of rapid SARS-CoV-2 antigen tests, AFIAS COVID-19 Ag and ichroma COVID-19 Ag, with serial nasopharyngeal specimens from COVID-19 patients. PLoS One, 0249. [CrossRef]
- 13. Hirotsu Y, Maejima M, Shibusawa M, Nagakubo Y, Hosaka K, Amemiya K, et al. Comparison of automated SARS-CoV-2 antigen test for COVID-19 infection with quantitative RT-PCR using 313 nasopharyngeal swabs, including from seven serially followed patients. Int J Infect Dis.
- 14. McKay SL, Tobolowsky FA, Moritz ED, Hatfield KM, Bhatnagar A, LaVoie SP, et al. Performance evaluation of serial SARS-CoV-2 rapid antigen testing during a nursing home outbreak. Ann Intern Med.
- 15. Lind ML, Schultes OL, Robertson AJ, Houde AJ, Cummings DAT, Ko AI, et al. Testing frequency matters: An evaluation of the diagnostic performance of a severe acute respiratory syndrome Coronavirus 2 (SARS-CoV-2) rapid antigen test in US correctional facilities. Clin Infect Dis.
- 16. Smith RL, Gibson LL, Martinez PP, Ke R, Mirza A, Conte M, et al. Longitudinal assessment of diagnostic test performance over the course of acute SARS-CoV-2 infection. J Infect Dis.
- 17. Pollán M, Pérez-Gómez B, Pastor-Barriuso R, Oteo J, Hernán MA, Pérez-Olmeda M, et al. Prevalence of SARS-CoV-2 in Spain (ENE-COVID): a nationwide, population-based seroepidemiological study. Lancet, 0250.
- 18. Gómez-Ochoa SA, Franco OH, Rojas LZ, Raguindin PF, Roa-Díaz ZM, Wyssmann BM, et al. COVID-19 in health-care workers: A living systematic review and meta-analysis of prevalence, risk factors, clinical characteristics, and outcomes. Am J Epidemiol.
- 19. Kalish H, Klumpp-Thomas C, Hunsberg S, Baus HA, Fay MP, Siripong N, et al. Undiagnosed SARS-CoV-2 seropositivity during the first 6 months of the COVID-19 pandemic in the United States. Sci Trans Med, 3982.
- 20. Dzinamarira T, Murewanhema G, Mhango M, Iradukunda PG, Chitungo I, Mashora M, et al. COVID-19 prevalence among healthcare workers. A systematic review and meta-analysis. Int J Environ Res Public Health.
- 21. Ma Q, Liu J, Liu Q, Kang L, Liu R, Jing W, et al. Global percentage of asymptomatic infections among the tested population and individuals with confirmed COVID-18 diagnosis. A systematic review and meta-analysis. JAMA Network Open. 2137.
- 22. Cox-Ganser JM, Henneberger PK, Weissman DN, Guthrie G, Groth CP. COVID-19 test positivity by occupation using the Delphi US COVID-19 trends and impact survey, September-November 2020. Am J Ind Med, 20 November.
- Lamb MR, Kandula S, Shaman J. Differential COVID-19 case positivity in New York City neighborhoods: Socioeconomic factors and mobility. Influenza Other Respir Viruses. 2021.
- Kost, GJ. Home, community, and emergency spatial care paths — Diagnostic portals for COVID-19, critical care, and superstorms (and the prevalence boundary hypothesis). IFCC Live Webinar on POCT: Developing Community Resilience. , 2023. 18 January.
- Kost, GJ. The mathematics of COVID-19 diagnostics (including the prevalence boundary hypothesis) and novel strategies for new global threats. Nauresuan University Live Symposium, Bangkok, Thailand, , 2023. 8 May.
- World Health Organization. EG.5 initial Risk Evaluation. Geneva: WHO, , 2023. https://www.who.int/docs/default-source/coronaviruse/09082023eg.5_ire_final.pdf?sfvrsn=2aa2daee_1 (accessed on August 18, 2023). 9 August.
- 27. Abbott B, Kamp J, Hopkins J. Omicron subvariant “Eris” drives rise in Covid infections. Wall Street Journal.
- Grant K, McNamara D. It may be time to pay attention to COVID again. WebMD Health News. , 2023. https://www.webmd.com/covid/news/20230810/it-may-be-time-to-pay-attention-to-covid-again (accessed on August 18, 2023). 11 August.
- 29. Mellou K, Sapounas S, Panagoulias I, Gkova M, Papadima K, Andreopoulou A, et al. Time lag between COVID-19 diagnosis and symptoms onset for different population groups: Evidence that self-testing in schools was associated with timely diagnosis among children. Life (Basel).
- Kost, GJ. Moderate (20-70%) and high (70-100%) COVID-19 positivity rates and prevalence in different geographic regions. Arch Path Lab Med, /: Digital Content. 2021, 145, 797-813. file, 18 August 2021. [Google Scholar]
- Kost, GJ. Geospatial hotspots need point-of-care strategies to stop highly infectious outbreaks. Arch Pathol Lab Med. 2020, 144(10), 1166–1190. [Google Scholar] [CrossRef] [PubMed]
Disclaimer/Publisher’s Note: The statements, opinions and data contained in all publications are solely those of the individual author(s) and contributor(s) and not of MDPI and/or the editor(s). MDPI and/or the editor(s) disclaim responsibility for any injury to people or property resulting from any ideas, methods, instructions or products referred to in the content. |
© 2023 by the authors. Licensee MDPI, Basel, Switzerland. This article is an open access article distributed under the terms and conditions of the Creative Commons Attribution (CC BY) license (http://creativecommons.org/licenses/by/4.0/).


