Preprint
Article

Towards the Development of A Low-Cost Solution for Wildlife Tracking using An Unmanned Aerial Platform

Altmetrics

Downloads

136

Views

68

Comments

1

This version is not peer-reviewed

Submitted:

02 September 2023

Posted:

05 September 2023

You are already at the latest version

Alerts
Abstract
Owing to the upsurge in the number of endangered species and understanding animal patterns in general as well as population demographics; the monitoring of wildlife species is an essential for the conservation and safety of animals. In order to organize and manage the reserves, the nature bequeaths to us, we need to have hands-on information of their population and food trends, conditions where they survive and other species in the ecosystem. The paper presents a vision-based approach to monitor wildlife using an aerial platform. A quad-rotor based aerial platform is used for the very first time for this purpose. Field imaging is done using a digital cellphone camera mounted on the platform to acquire video of horses in the field. Two techniques, Lucas-Kanade and Horn-Schunck methods are applied on the acquired set of images and the results are compared. Noise due to fluctuations and light conditions are minimized using Gaussian and HSV filters. Experiments show results with an absolute mean difference of 2.84 pixels and 8.50 pixels for changes in X and Y directions respectively for the two approaches.
Keywords: 
Subject: Computer Science and Mathematics  -   Computer Vision and Graphics

1. Introduction

Zoological surveys have always been a great challenge for conservation authorities due to various factors. The prime factor is the operational cost and complexity in conducting such surveys that are normally carried out using helicopters. Firstly, a skilled crew is required in order to carry out these surveys. Obviously, a skilled photographer is required; moreover, the need of an experienced pilot is indispensable.
As reported in a manual [1] produced by World Wide Fund (WWF), aerial surveys in Zimbabwe are conducted jointly by trained staff of Zimbabwe Parks and Wildlife Management Authority (ZMPWMA) and WWF. It is reported that these surveys are effective in areas usually greater than 1,000 km2. In addition to this, these surveys are only useful for large dark bodied animals. Therefore, it is difficult to track small bodied animals. Normally, a dry season is preferred for surveys as animals more visible in the dry season [1]. For animal counting, a skilled observer is required to sit on either side of the helicopter to count the animals manually; this poses safety threats to the observer as well as to the helicopter. Further, possibility of human error cannot be neglected. On the other hand, charter costs are too high ranging 1800 £ per hour to 7550 £ per hour depending upon the terrain and altitude of the flight.
Unmanned Air Vehicles (UAV) such as Quad copters are used for various purposes around the globe. A quad rotor provides a low cost solution with ease of maneuverability with vertical take-off and landing. Moreover, these UAVs can be operated with minimal training. The most significant advantages of these quadrotors over conventional fixed wing aircrafts are that they can take-off and land in limited space and easily hover above the target. The main purpose of this study is to develop an easily accessible solution using a quadrotor which can be used to monitor wildlife. This will not only reduce the survey cost significantly, but also it will provide a portable solution to wildlife conservation specialist.

1.1. Aerial Imaging

The idea of extraction of objects from aerial imagery was in market since the 1990s as proposed by Helmut Mayer. This approach focuses on extraction of buildings from aerial imaging using two criteria; content and density. Objects are found on the basis of basic 2D & 3D models. Movable objects such as people and vehicles were not considered in this research. [9]
In order to collect information for town planning and environment related investigations, this same strategy with focus on coupling of 2D & 3D images for estimation of shape and locations of buildings was utilized. They start off with image descriptions using points, lines and regions ultimately leading to integration of these 2D and 3D images and graphs. [10]

1.2. Unmanned Aerial Imaging

The use of unmanned aerial vehicles was popularly sought after in the same decade. UAVs were rendered as the human assistants that could monitor and record unusual events using intelligent visual surveillance.
Monitoring of wildlife using the airplanes has been in the game for years although the use of unmanned aerial vehicles also known as drones has been in-demand in the last two or three decades.
In order to conduct survey of wildlife using UAVs, various approaches have been proposed. Thermal imaging technique was used by M. Israel et al. [2] for the detection of fawns in the meadows. Images were captured using a thermal infrared camera and video transmission was also used for manual animal detection. In order to accelerate the flow work for high detection, a waypoint planning software was also developed.
Another thermal imaging technique was used by P. Christiansen et al. [3] for wildlife recognition. Top-view images are taken from a telescopic boom above the target area. Detection of hot objects and feature extraction is performed on the basis of dynamic threshold. A thermal feature extraction algorithm is proposed for classification of animals.
An acoustic biotelemetry approach for wildlife tracking using an autonomous UAV was proposed by Y. Q. Chen et al. [4]. A low-cost RF telemetry system was developed for triangulation and geo-location of the target. A Fish Tracking Payload System (FTPS) was designed and developed on which several flights were conducted and successful detection was made. [20]
The technique applied by A. M. Jensen et al [5] focused on the multi-UAV navigation and transmitter localization. Swarm-like navigation methods and Kalman Filters were applied on a real world simulator. The results were then compared using Monte Carlo Analysis.
A vision based technique is used by W. Selby et al[6] for tracking of marine animals. Algorithms of image segmentation and target identification were developed for monitoring whales at sea. This helped in identifying and following targets at constant speed.Various other approaches can be seen in work done by J.Linchant et al [7]. The recent advances in the visual tracking methods and techniques [14]

1.3. Preserving Wildlife

One of the emerging technologies to preserve the diversity of individual animals is being improved by devices and methods that are able to track animals using the drones. Owing to restraints on size and resources, use of airplanes is a lot of bill but drones or UAVs provide a better, timely and cheap alternative to the mentioned way as well as satellites. [11]
Also, a small device using radio technology on a near-earth orbit satellite to track small animals around the globe was proposed in the late 2006. [12]
Yungfei Fang et al. presented a method for wildlife monitoring and surveying of animals in wilderness. They presented a method utilizing global patterns of pixel by applying optical flow methods for surveying and monitoring animals on the move. Unwanted parts of the background were removed by applying a pixel velocity threshold. The segmented regions from the above were reinforced further by filtering out negative patches that could possibly belong to the background. [13]
This paper presents a technique to develop a low cost solution for the purpose. A simple blob detection algorithm is used and an experiment is designed in order to calculate the error of the developed algorithm.
The paper is organized as follows. Section II explains proposed technique while section III presents the background theory. Experimentation is discussed in section IV. Results are presented in section VI. Section VII presents the conclusion and future work.

2. Proposed Approach

Aerial images acquired through the aerial platform are imported in Matlab. Since the acquired images are of very high resolution i.e. 4160 x 3120, therefore, the proposed algorithm first resizes the images to 512 × 512 pixels. The algorithm then employs Gaussian filter for smoothing of images. In order to compensate the lighting effects, the image is converted from RGB color space to HSV color space. After application of HSV filter optical flow is applied on images. Application of optical flow calculates the flow vector, to get better estimation threshold the flow vectors. After thresholding we have flow vectors (u,v). Summary of the described algorithm is given in Figure 1.

2.1. Background theory

“An optical flow is the technique to calculates the displacement of brightness patterns from one image frame to another”[15] [20]. Several different approaches to optical flow estimation have been proposed, including correlation and energy-based methods. This paper concentrates on differential approach and gives comparison of the two differential techniques namely Lucas-Kanade and Horn-Schunck. These methods are widely used for flow estimation. Horn-Schunck algorithm and Lucas-Kanade algorithm are analysed and compared based on the results obtained.

2.1.1. Differential Techniques:

Differential techniques compute optical flow information from spatial and temporalvariations of the image brightness based on brightness constancy and temporal consistence assumptions[15],[16]. These assumptions result in a motion constraint estimated by the first order Taylor’s expansion of
C X , t = C ( X U t , 0 )
where U = ( u , v ) T . The Taylor expansion of (1) or intensity conservation assumption
d C ( X , t ) d t = 0
implies that
C X , t . U + C t X , t = 0
Where C X , t = ( C x X , t , C y ( X , t ) ) T and C . U denotes the usual dot product. Equation (3) gives the normal component (Un) of motion of constant intensity spatial contour as U n = s n , where s is the normal speed and n is the normal direction given by.
s X , t = C t ( X , t ) C ( X , t )
n X , t = C t ( X , t ) C ( X , t )
Second order differential methods bounds 2-D velocity using second order derivatives
C x x ( X , t ) C y x ( X , t ) C x y ( X , t ) C y y ( X , t ) U 1 U 2 + C t x ( X , t ) C t y ( X , t ) = 0 0
The conservation of equation (5) implies C X , t , d C ( X , t ) / d t = 0
The coefficients of these equations are combinations of spatial and temporal derivatives of the image brightness.
  • A. Horn– Schunck method:
The Horn-Schunck method uses the assumption that flow is smooth over the whole image[17].Therefore solutions which show more smoothness are preferred. The minimum distortions in the flow are ensured by minimizing a global energy function. The energy function is given for two-dimensional imagery as[15],[18]:
C x u + C y v + C t 2 + φ 2 ( u 2 + v 2 ) d x
where C x , C y and C t are the derivatives of the pixel intensity values along the x, y and time t dimensions respectively ,   U = ( u x , y , v ( x , y ) ) T is the flow vector, and φ is a regularization constant. To get smoother flow the value φ is made larger[19]. Iterative equations (6) are used to minimize the global energy function and obtain image velocity in 2-D.
u J + 1 = u J C x ( C x u k + C y v k + C t ) φ 2 + C x 2 + C y 2
v J + 1 = v J C y ( C x u k + C v k + C t ) φ 2 + C x 2 + C y 2
where J is the number of iteration.
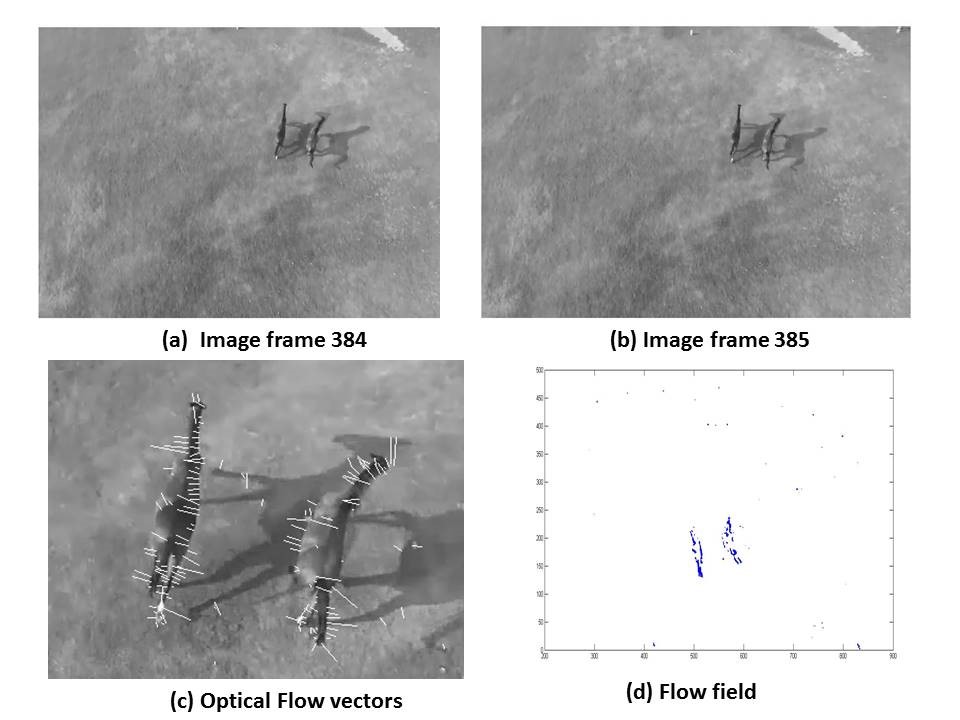
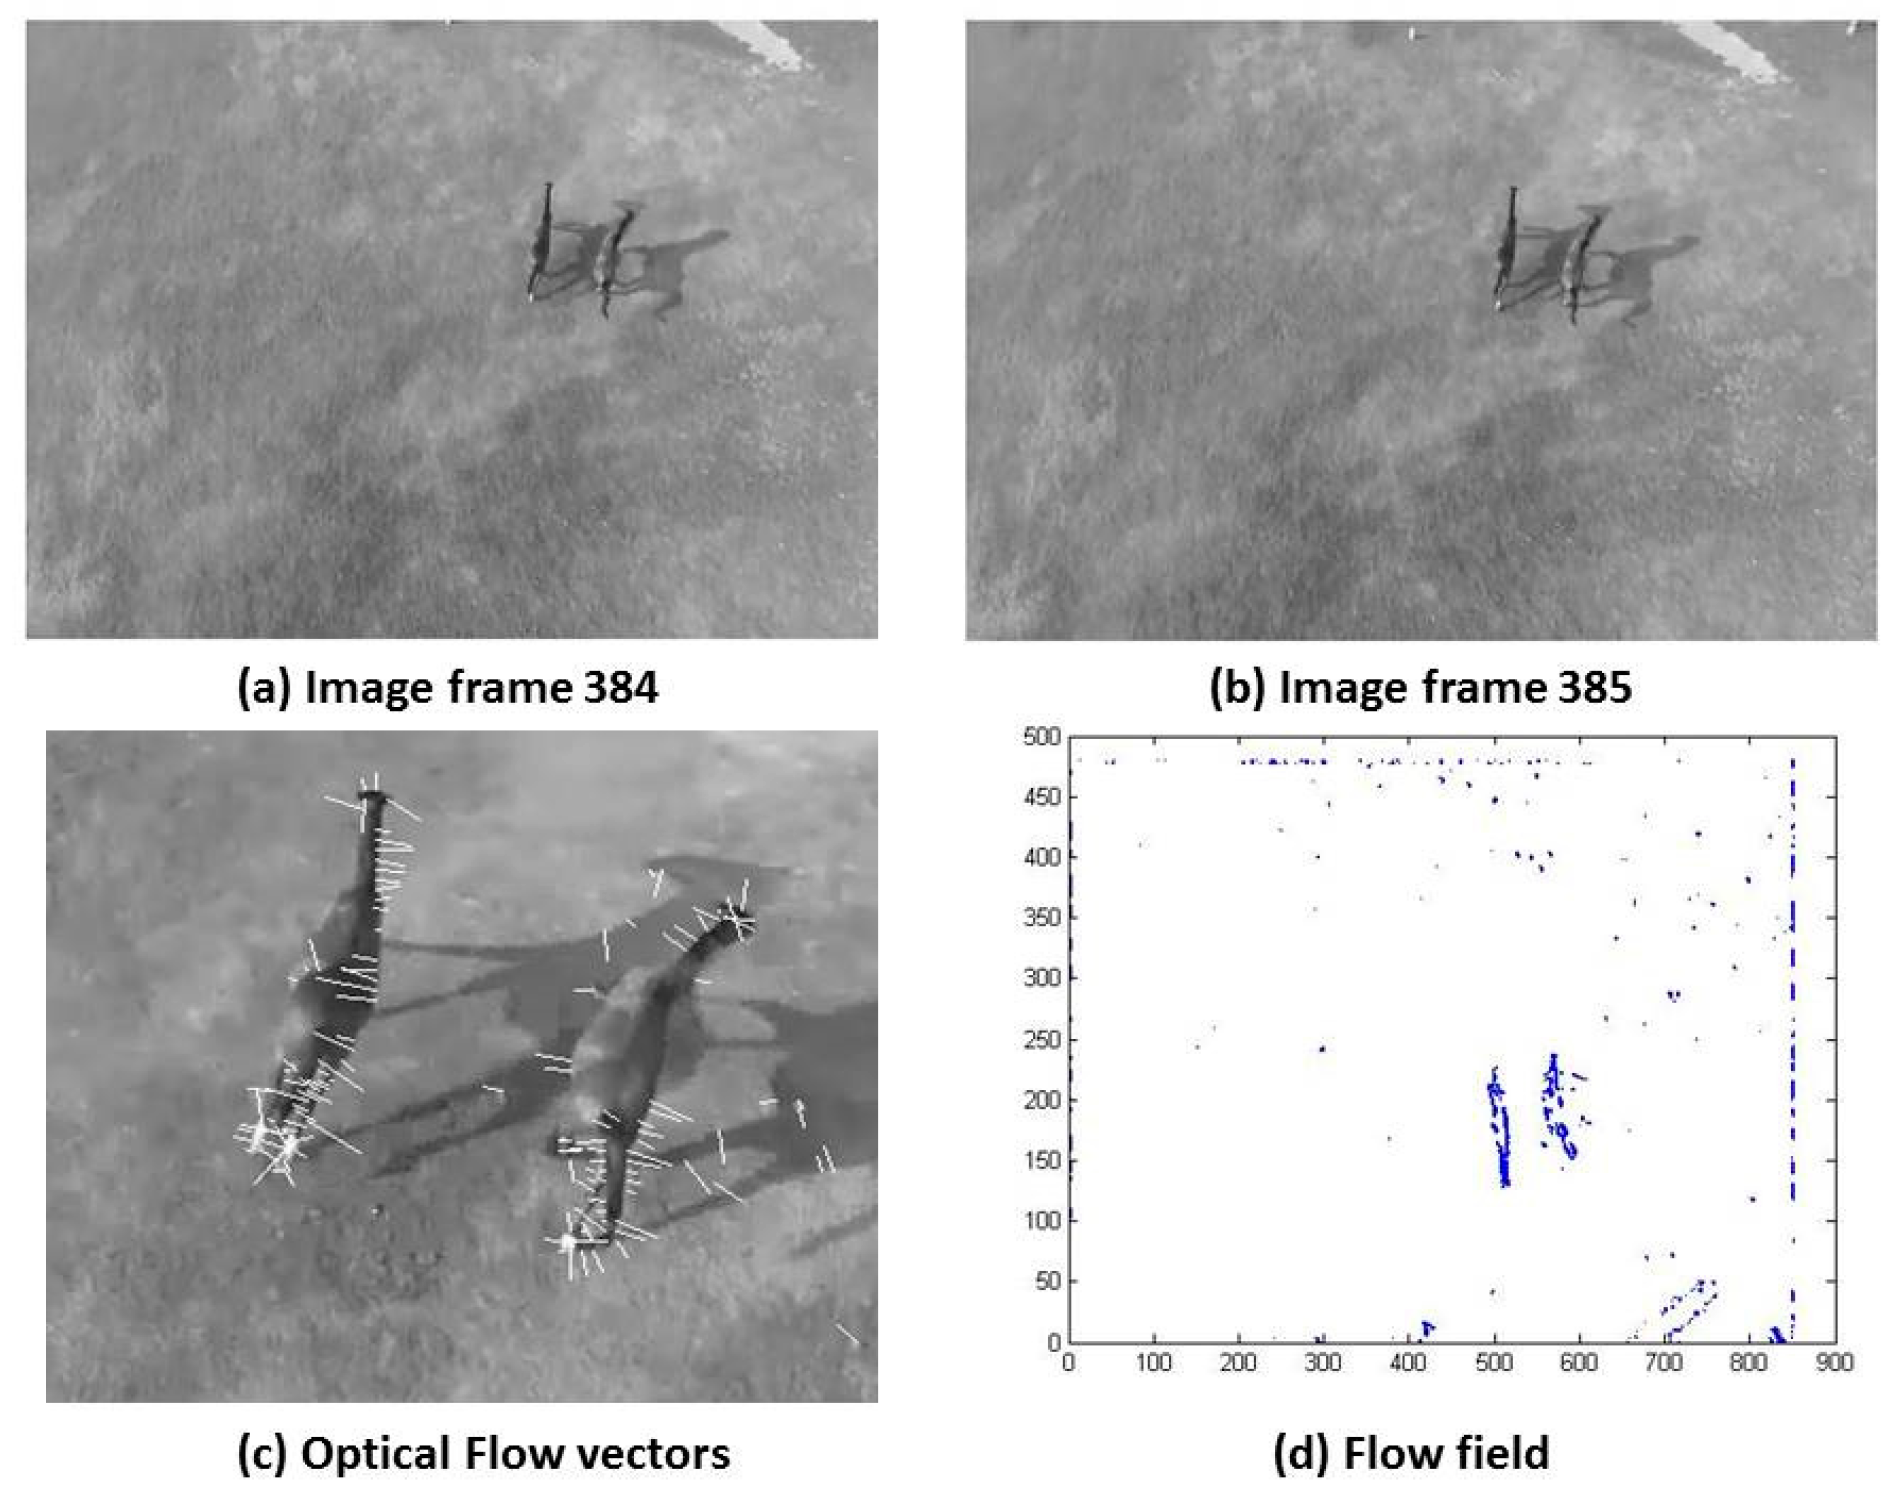
The Horn and Schunck method use first-order differences to estimate intensity derivatives. The Horn-Schunck algorithm applied to Fig 3(a) and Fig 3(b) gives the images in Fig 3(c) and Fig 3(d). The velocities obtained through this method are (-0.16, -0.38).
  • B. Lucas–Kanade method:
Although Horn-schunck algorithm is a complete algorithm for optical flow estimation but its iterative nature results in high computational cost[17]. The solution is provided by Lucas-Kanade methods which implements least square method to find the velocity minimizing the constraints errors, squared errors in this case[16],[18]. Major assumption here is constant flow in local neighborhood of the pixel under consideration. Velocity is obtained by solving basic optical flow equations for all the pixels in that neighborhood σ satisfying the least square criterion
x σ D 2 X [ C X , t . U + C t ( X , t ) ] 2
where D ( X ) is an n×n diagonal matrix containing the weights. The diagonal matrix ensures that constraints have more influence on pixels at the center of the neighborhood than those at the periphery. The solution to (8) is given by
B T D 2 B U = B T D 2 b
where for n points x i σ   at a single time t,
B = [ C ( X 1 , . . , C ( X n ) ) ] T D = d i a g ( D X 1 , . , D ( X n ) ) b = [ C t ( X 1 ) , , C t ( X n ) ] T
The solution to (10) is U = [ B T D 2 B ] 1 B T D 2 b , the solution exists if   B 2 D 2 B is nonsingular matrix.
B 2 D 2 B   = D 2 ( X ) C x 2 ( X ) D 2 ( X ) C x ( X ) C y ( X ) D 2 ( X ) C y ( X ) C x ( X ) D 2 ( X ) C y 2 ( X )
B 2 D 2 where all sums are taken over points in the neighborhood.
Equations (8) and (9) represent weighted least squares estimates of velocity components from estimates of normal velocities U n = s n . Equation (10) is equivalent to
x σ D 2 X d 2 ( X ) [ U . n x s ( X ) ] 2
Where the coefficients D 2 ( x ) reflect that how good in the normal velocity estimates are; here d x = C ( X , t )
To solve equation B T B U = B T D 2 b , B T B s eigenvalues should satisfy the constraint λ 1 λ 2 > 0 [17]. λ 2 should not be too small in order to avoid noise. Another constraint is, small value of λ 1 λ 2 which if not satisfied leads to the aperture problems. This condition is also works for Corner detection[18].
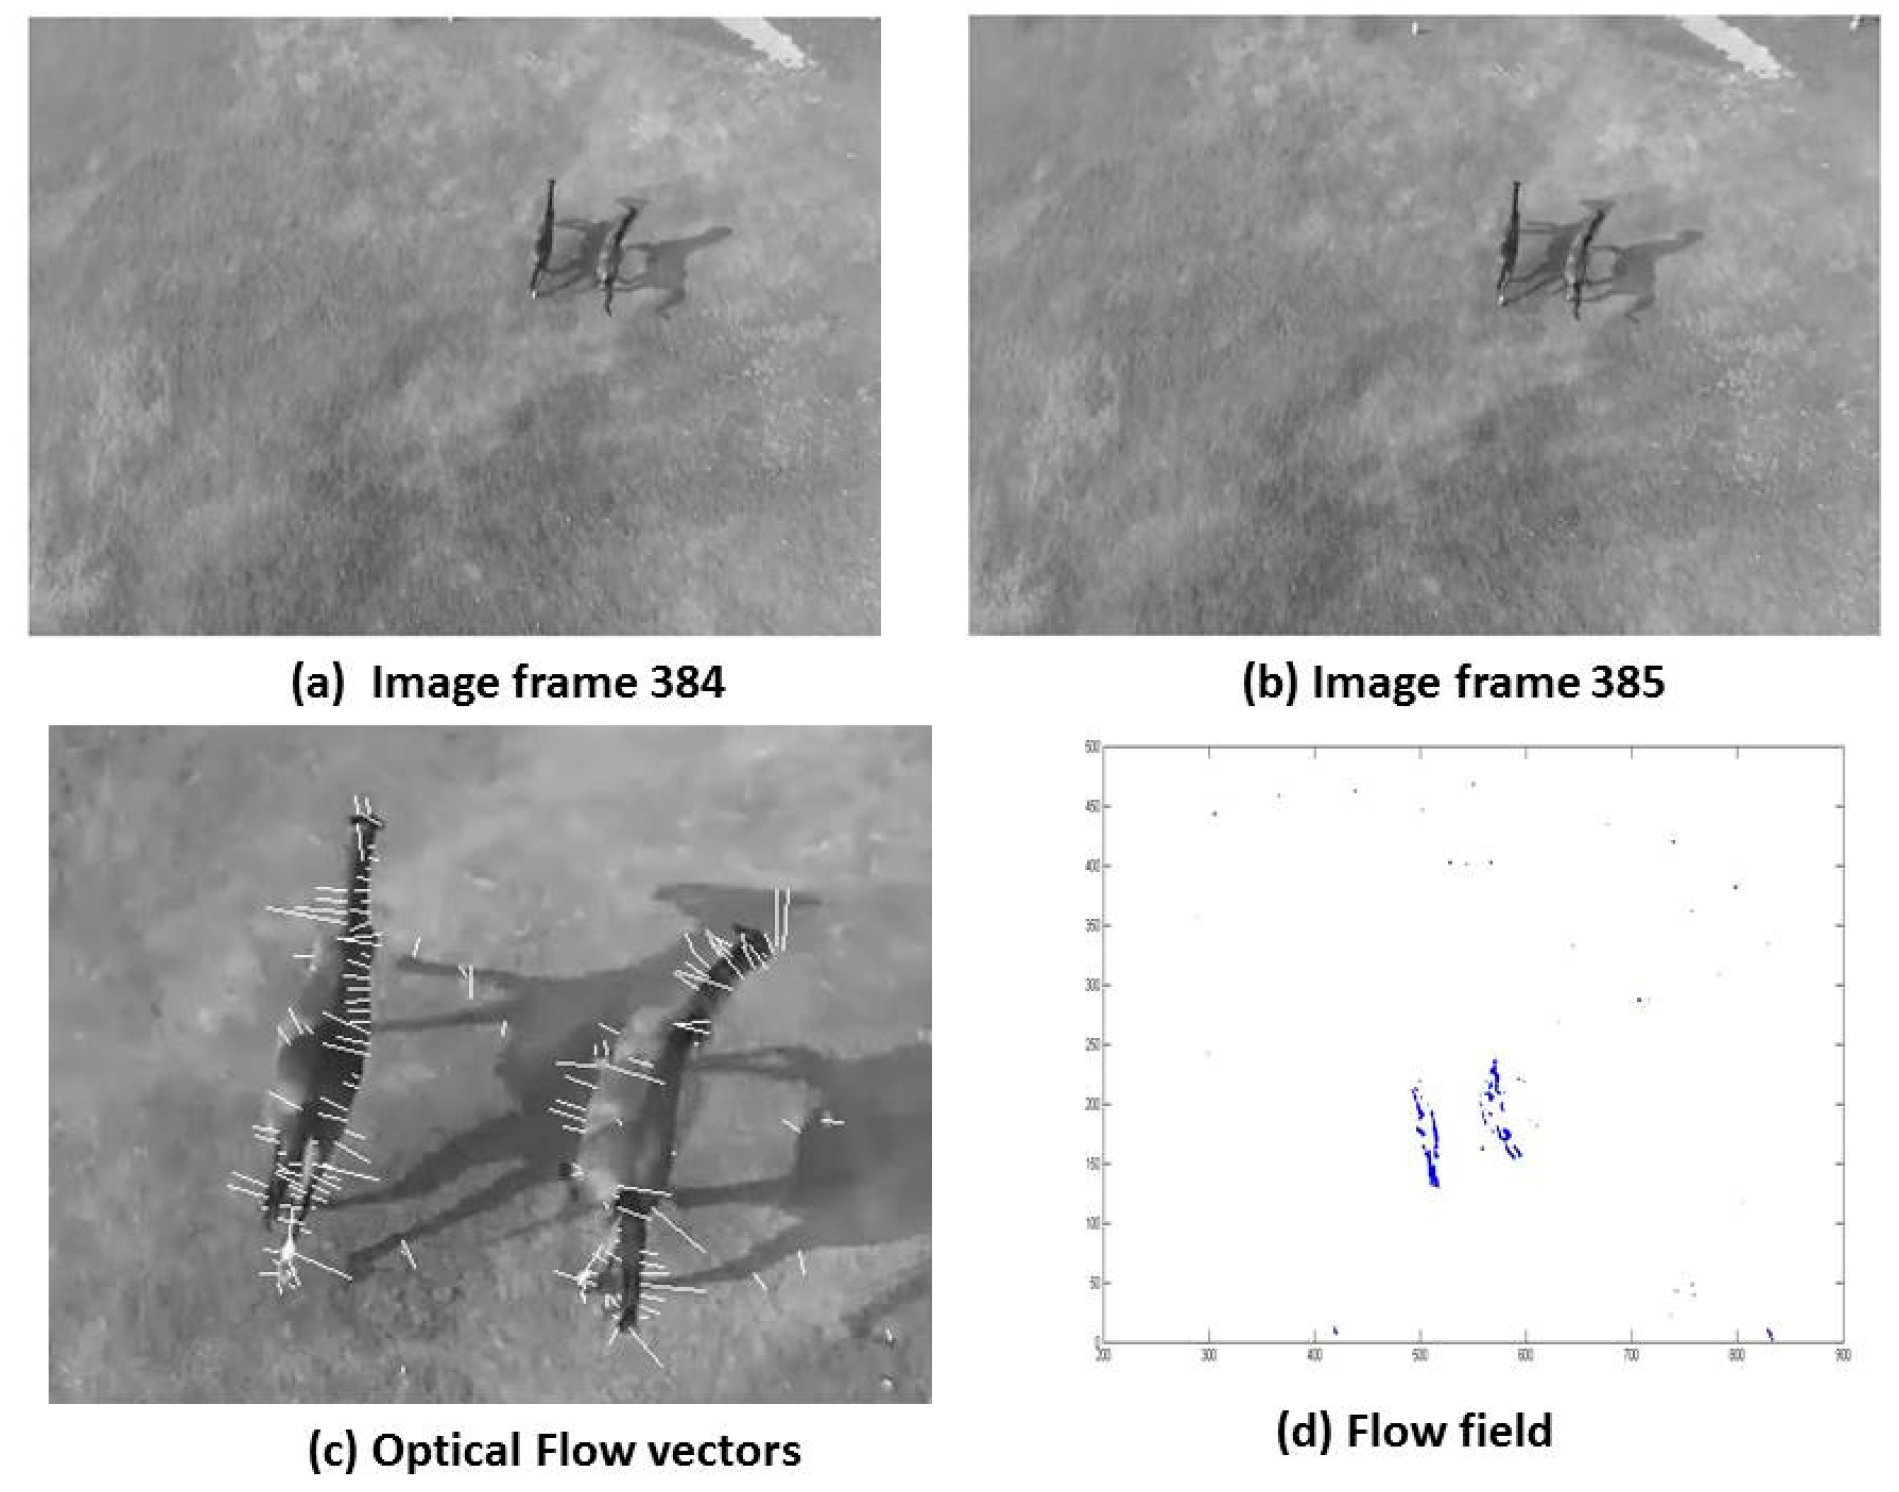
Fig 4(c) and Fig 4(d) are the resultant images after application of Lucas-Kanade algorithm to Fig 4(a) and Fig 4(b). The velocities obtained through this method are (0.10, -0.63).
Experimentation
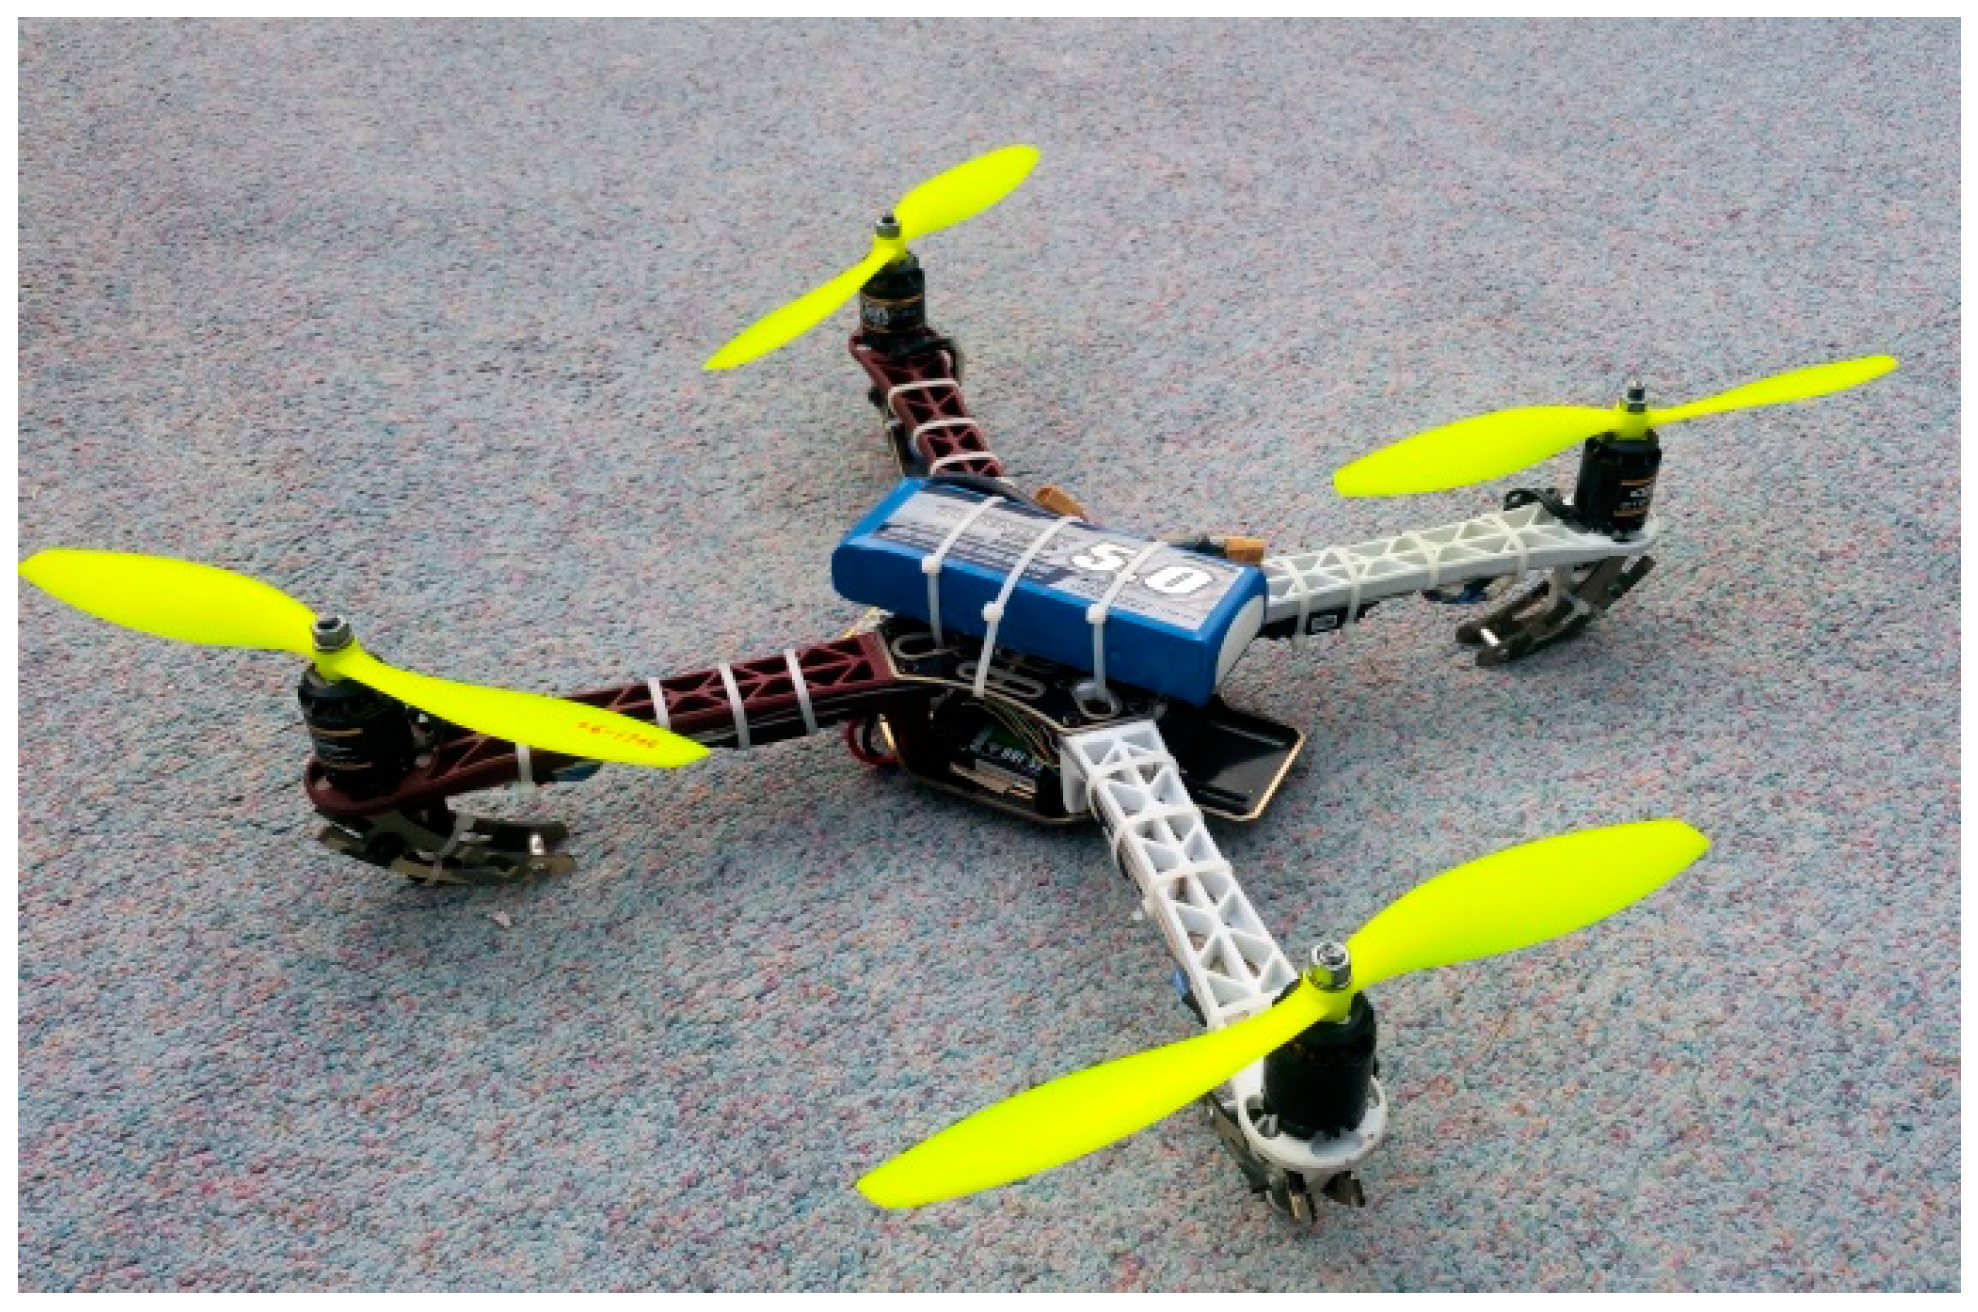
Experimentation is performed at around 4 pm in an evening at NUST College of E&ME Rawalpindi using a grid of 1m x 1m having four cells. The aerial platform that is used in experimentation is an X-configuration quad-rotor. It has an empty weight of 989grams and a payload carrying capacity of another 900 grams leading to a total takeoff and flying weight of approximately 2000 grams. The quadrotor uses 4 BLDC motors having thrust of 1280Nm each. The motors are controlled by a PD controller. The BLDCs has a maximum speed of 3200rpm. For imaging, the quad-rotor is equipped with LG G3 mobile phone having a 16 megapixels wide angle camera. Figure 2 shows the imaging platform.
A ball is placed first in the center of the grid that is taken as the starting point. The quad-rotor is made to hover over the grid at a constant altitude of 1.5 m above the ground. The ball is moved to different locations in the grid and the images are acquired. The images are then imported in MATLAB environment and are processed by the developed algorithm to calculate the change in position of the ball in different frames.
Figure 3 shows the experimental grid, whereas; Figure 4 shows the different positions of the ball in the grid. Figure 5 show the outcome of HSV filter and Figure 6 shows an inverted binarized image produce by the algorithm to calculate the change in position of the ball.
Figure 3. Lucas-Kanade.
Preprints 84075 g003
Figure 4. Horn-Schunck.
Preprints 84075 g004
Figure 5. Lucas Knade(vector u).
Preprints 84075 g005
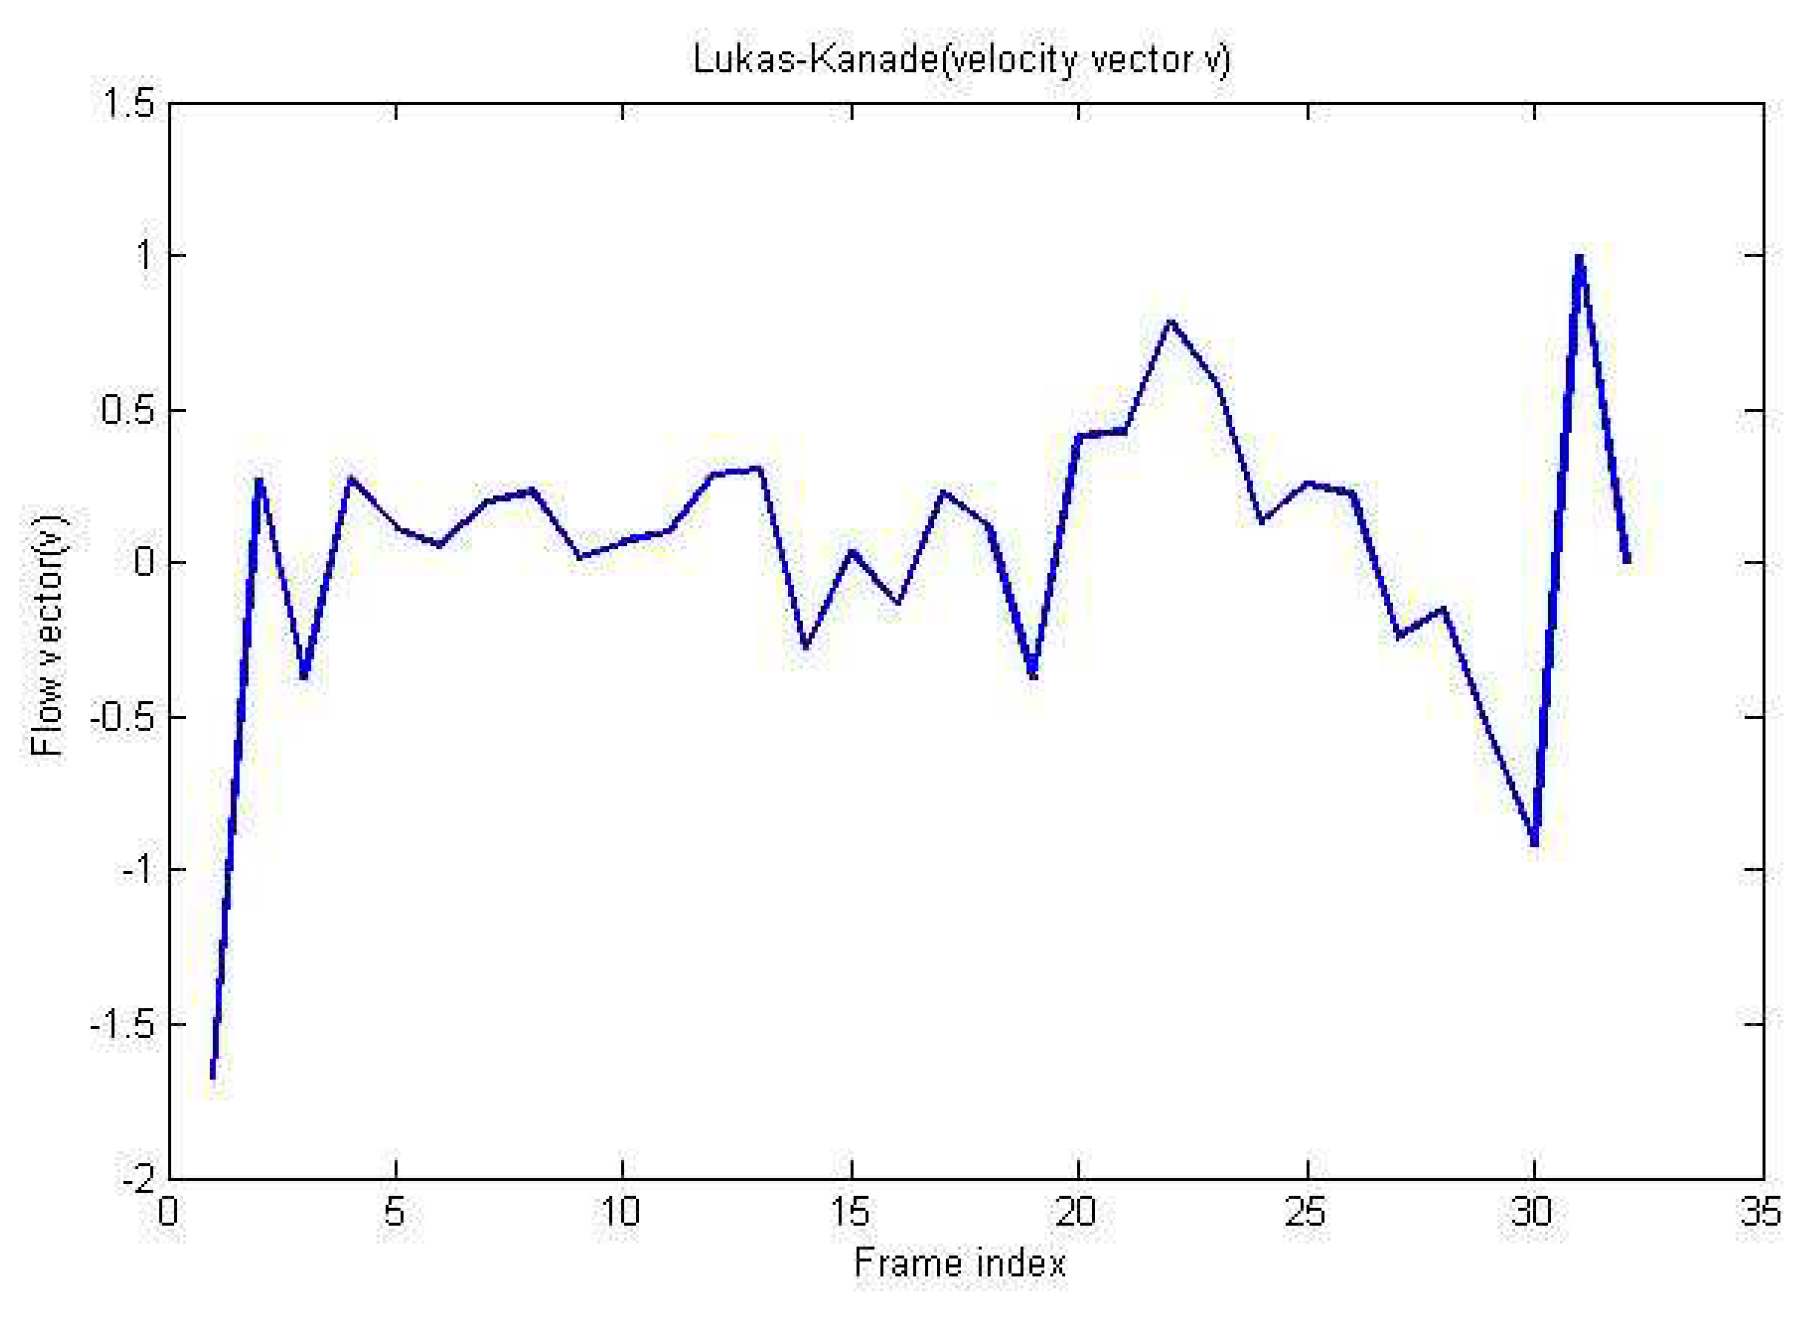
Figure 6. Lucas Knade(vector v).
Preprints 84075 g006

3. Experimental results

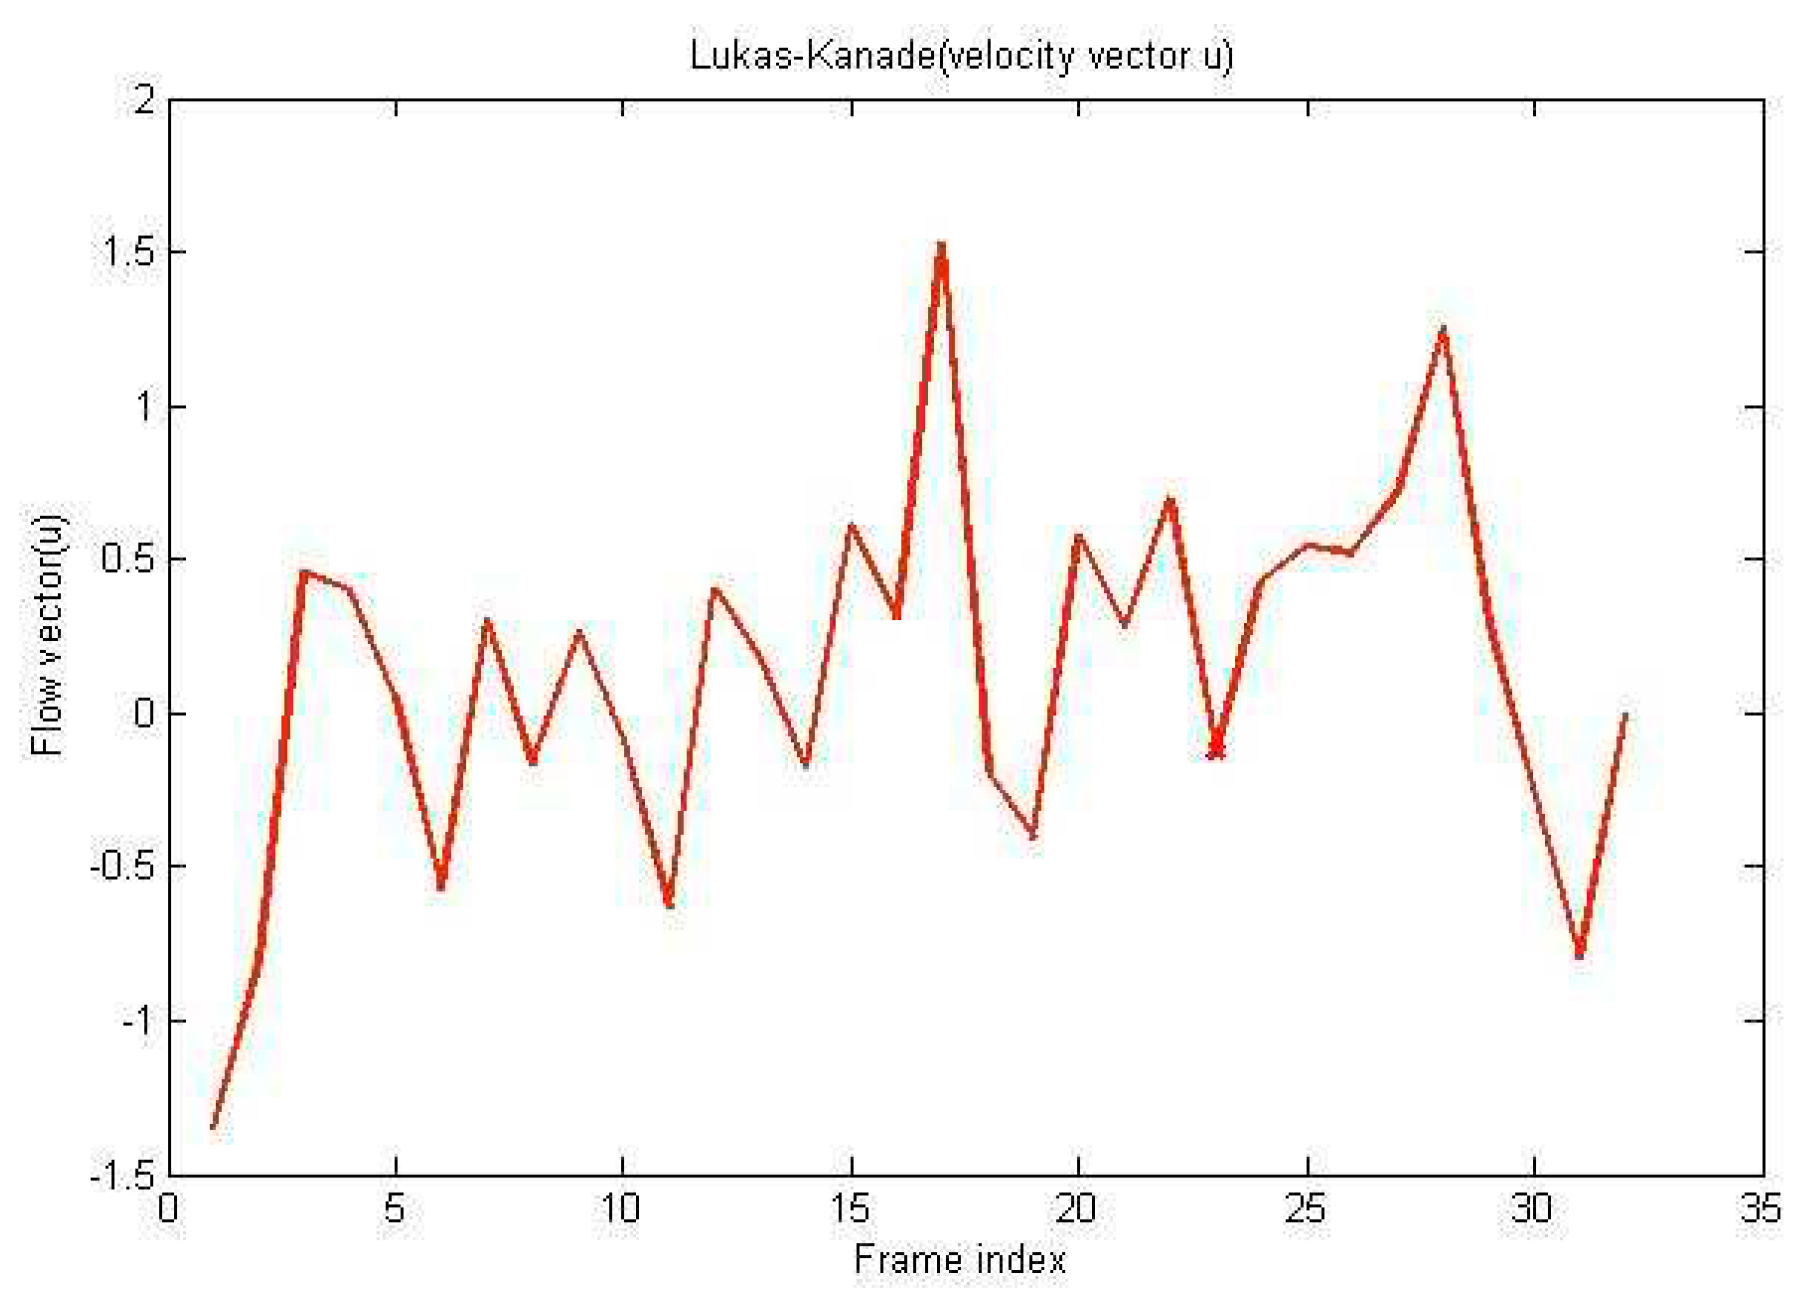
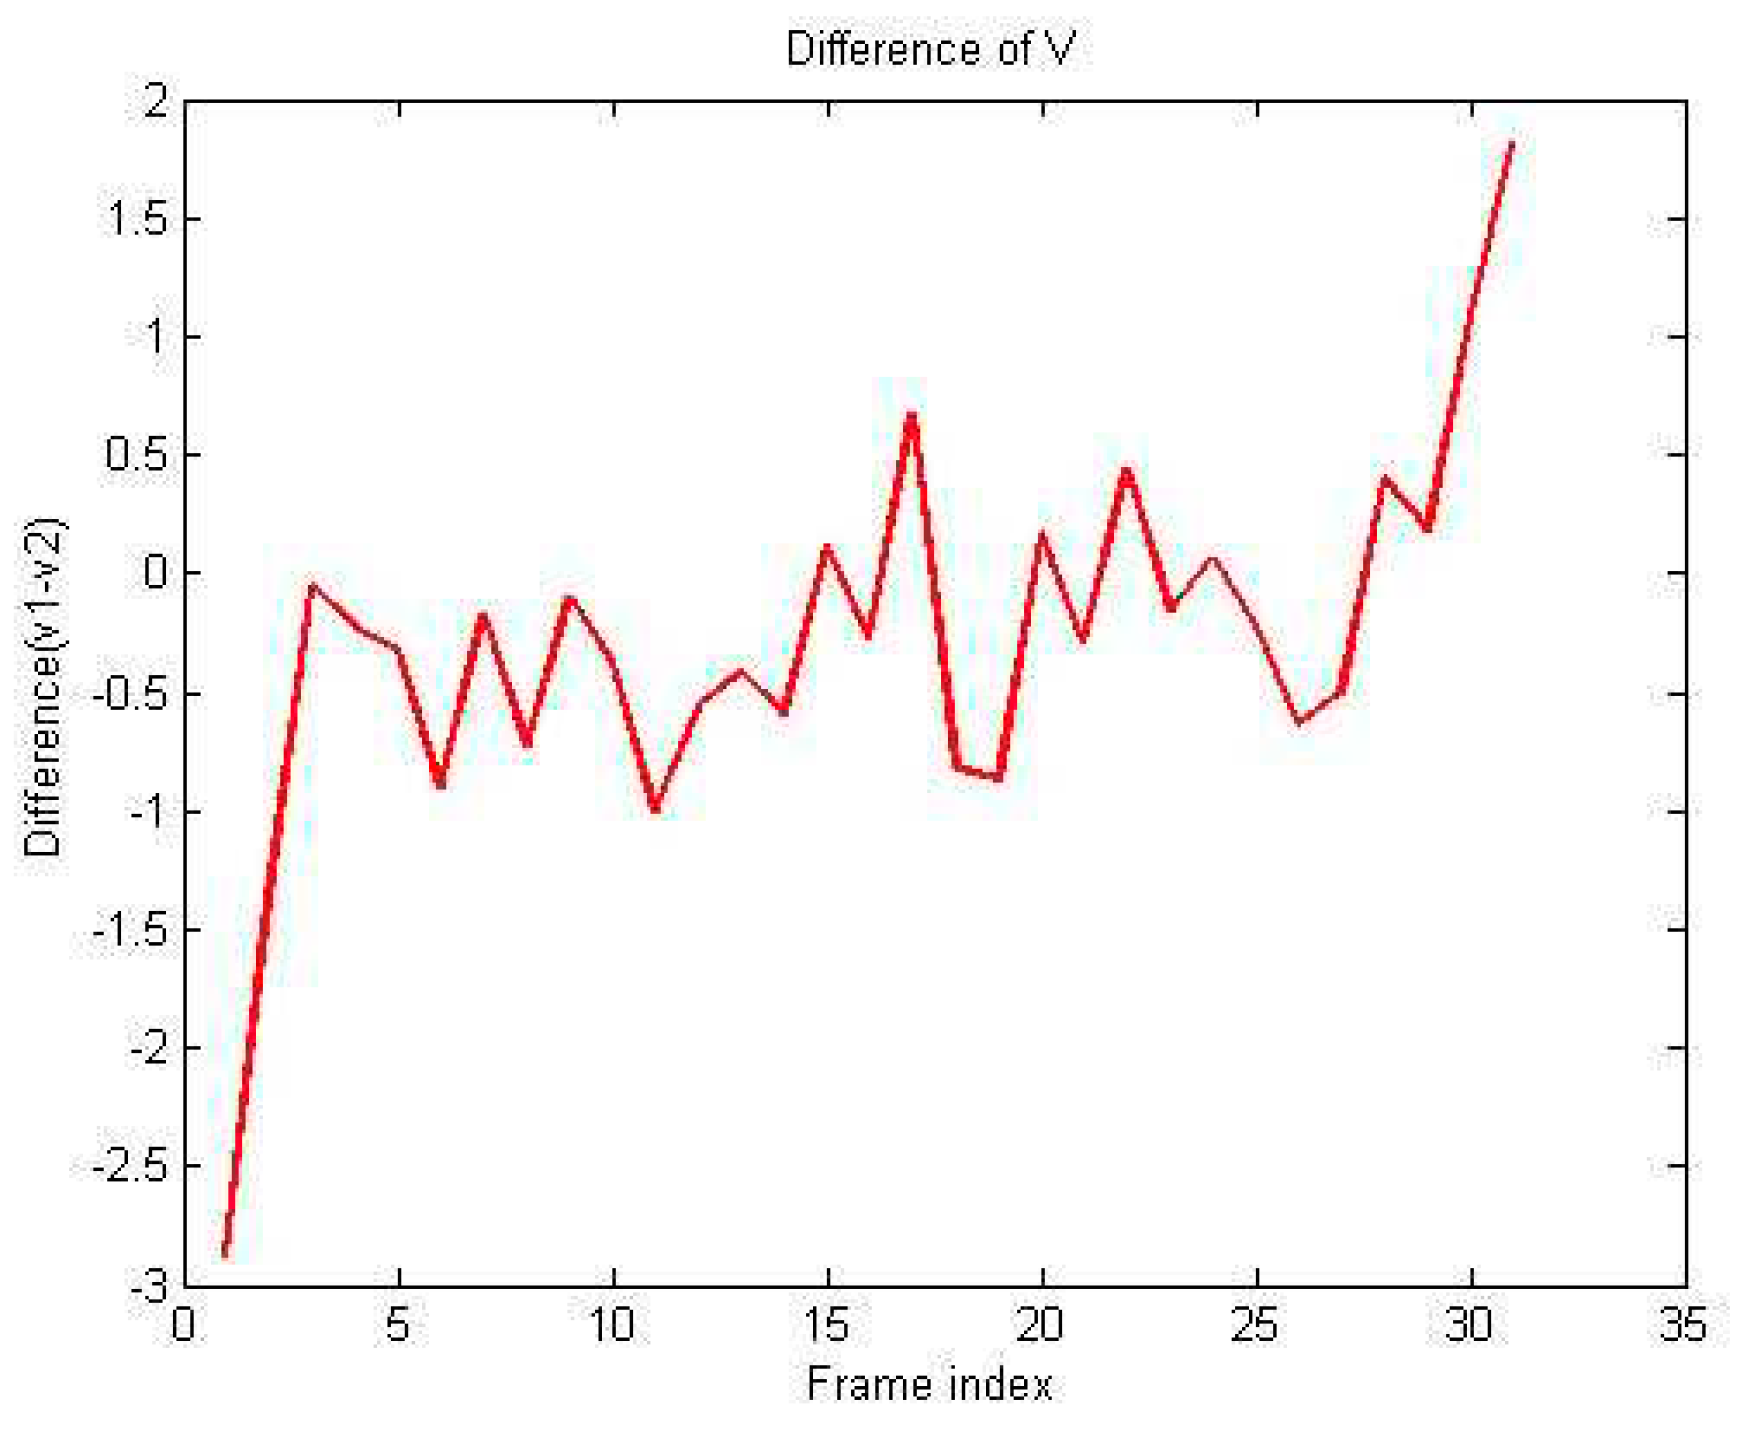
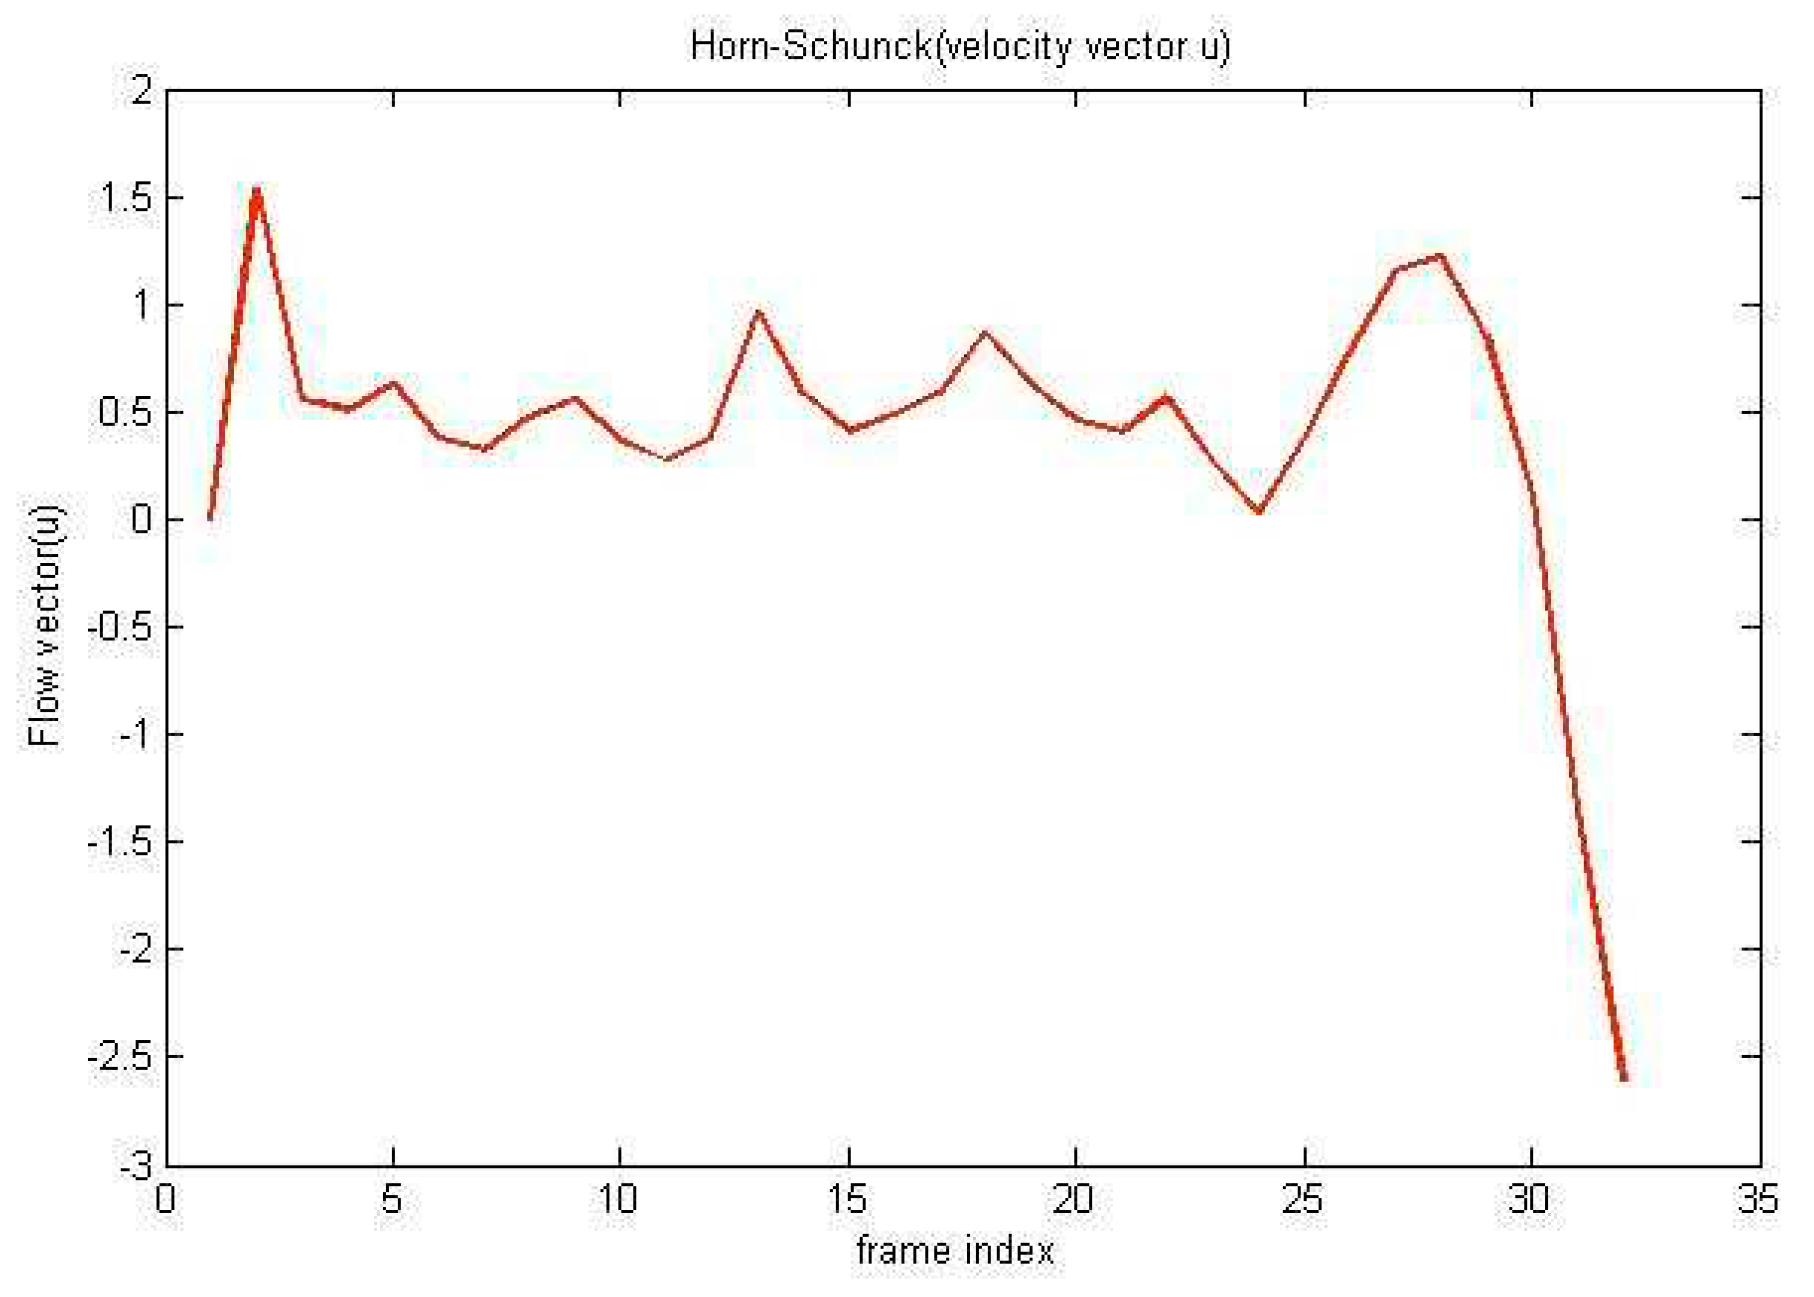
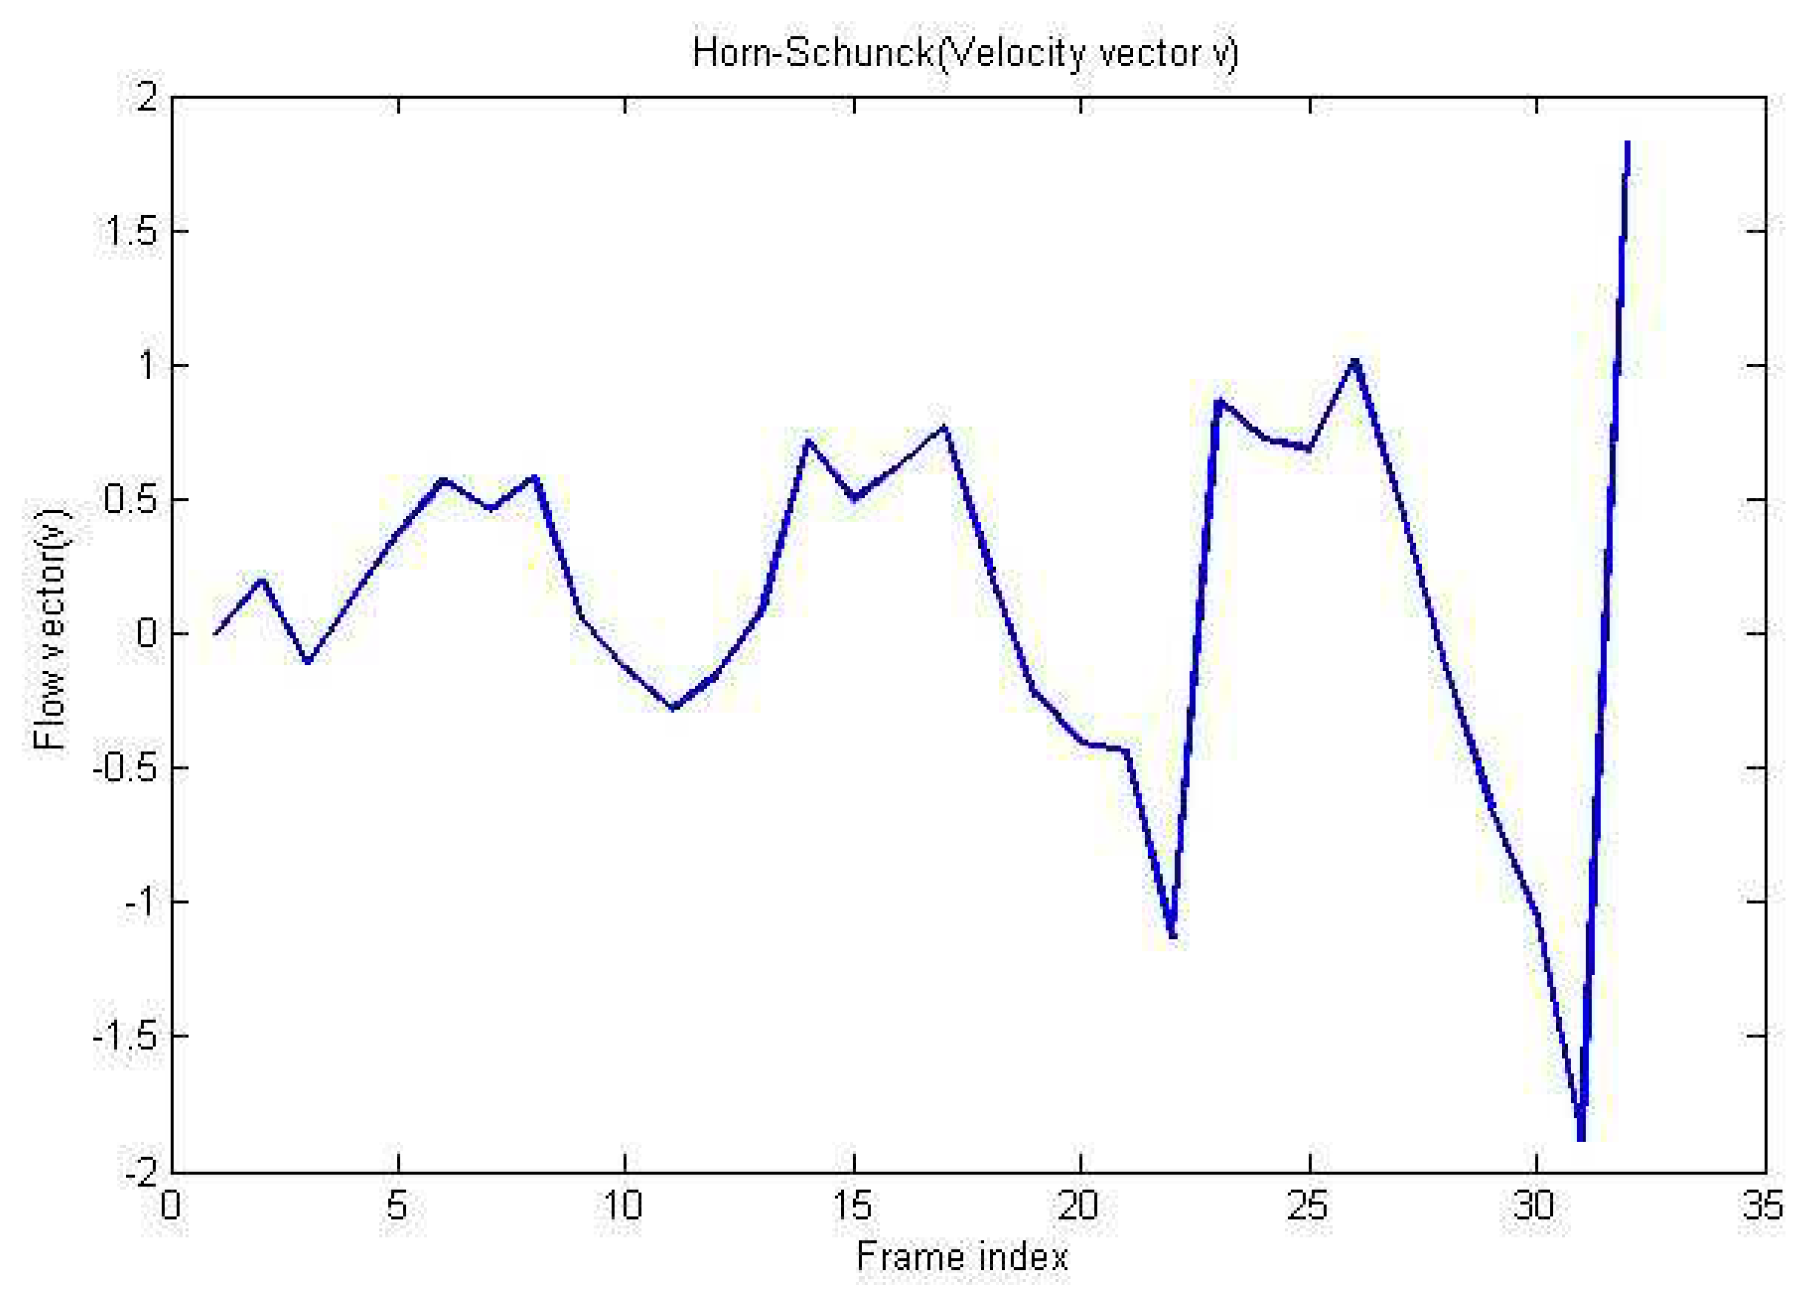
Experimental Table 1 shows the outcome of the algorithm versus the measured distance. The mean percentage error for change in X-direction is found to be 6.28%, whereas, for change in Y-direction, it is found to be 15.22%. The main reason for this error is uneven light distribution. This can also be seen in error graphs for X and Y as shown in Figure 7 and Figure 8. It is clear from Figure 6 that only sample no. 6 has a minimum error of 0.69% in the X-direction. This may be because of the reason that at such position the lighting is fairly better. Moreover, it can be seen that for the same reason, the overall error in X-direction is much lesser than the error in Y-direction.

4. Conclusion

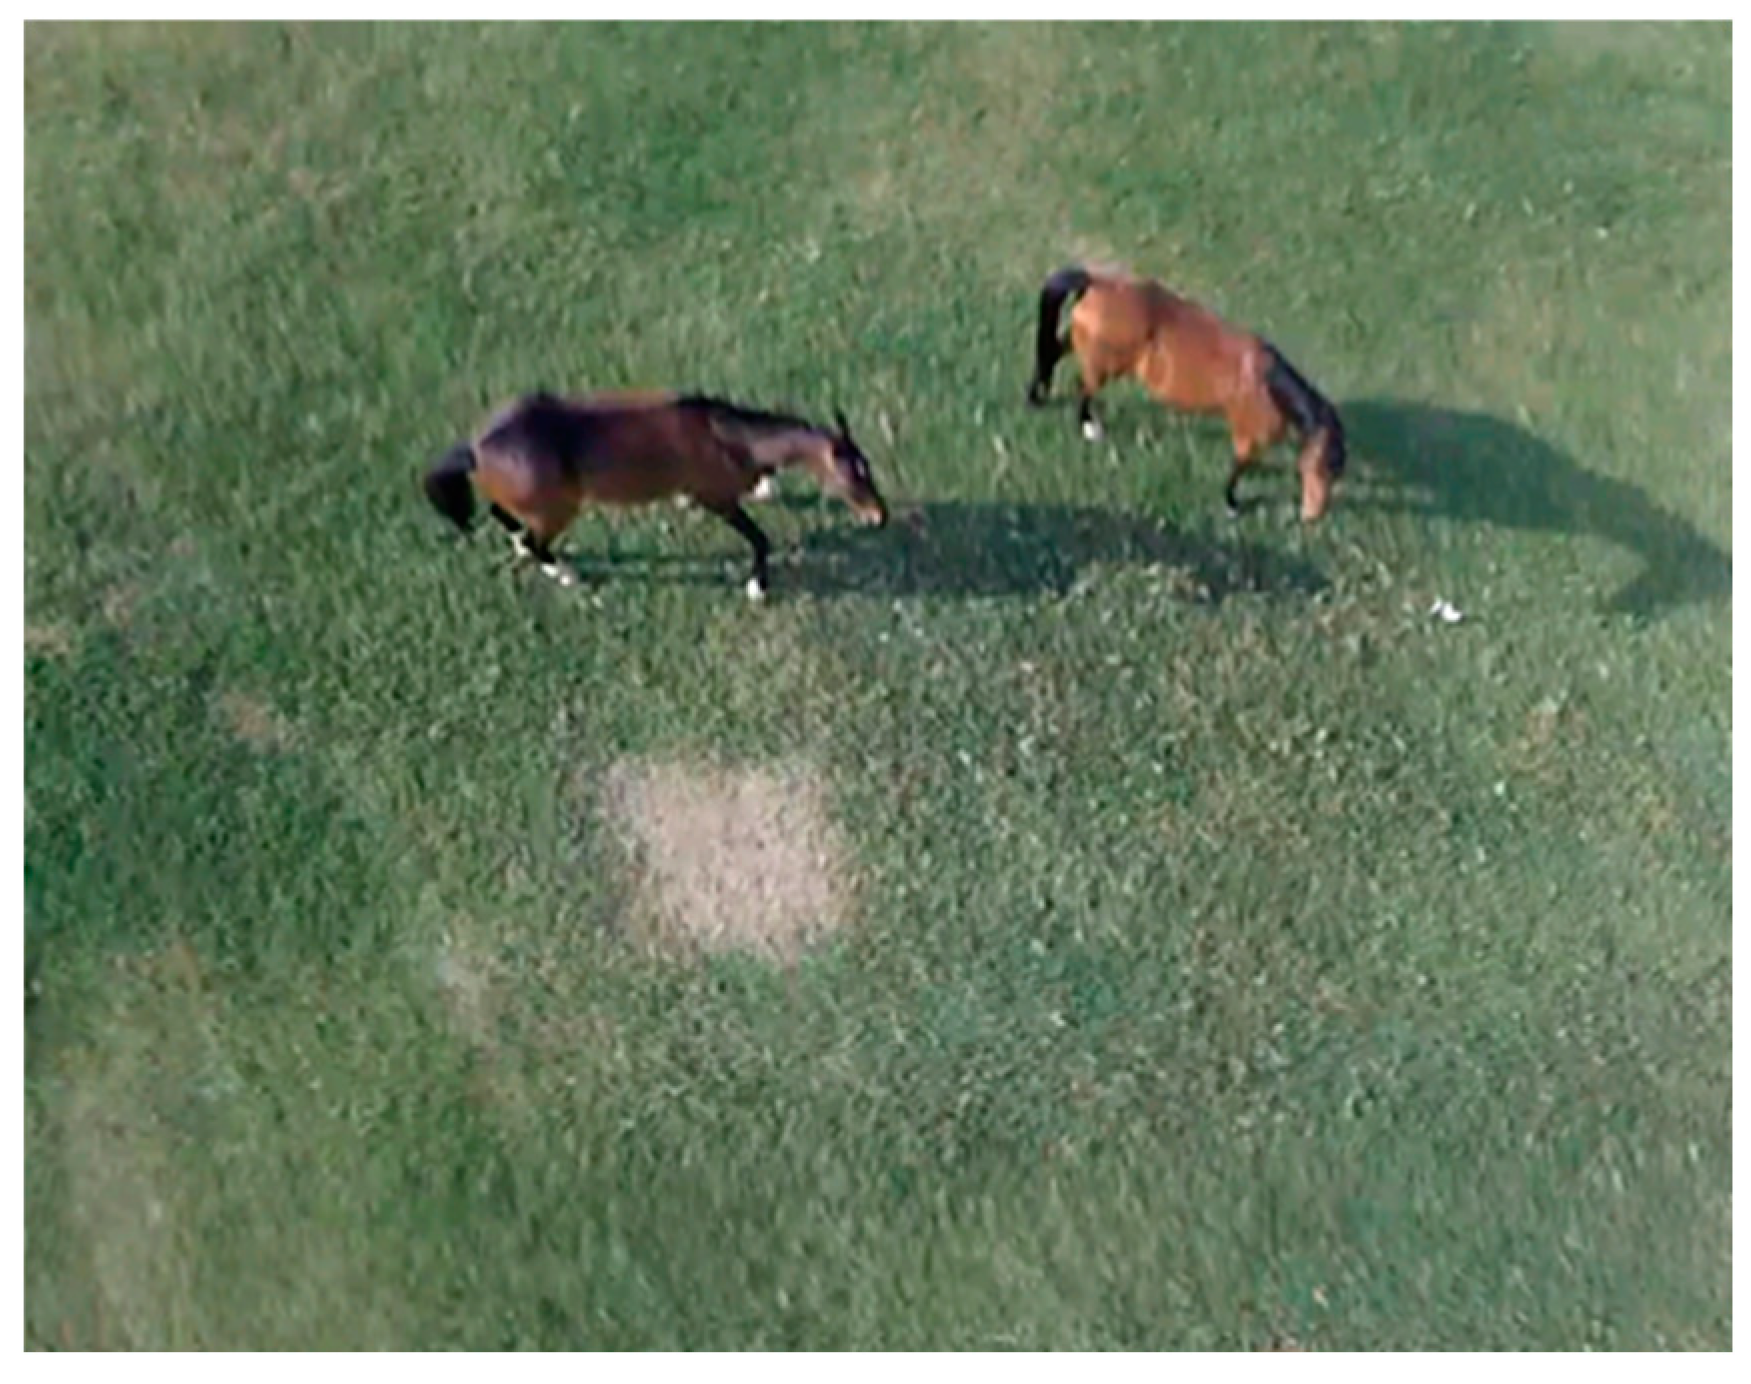
The proposed technique shows considerable results with mean percentage error of 6.28% for change in X-direction and 15.22% for change in Y-direction. Future work involves the tracking of real animals in the field using the proposed technique. Figure 9 shows an aerial image of horses available at riding club of the university campus. Figure 10 shows a binarized image of the aerial view shown in
Figure 9. Difference of u.
Preprints 84075 g009
Figure 9. Difference of v.
Preprints 84075 g010
Figure 9. Future work also involves the implementation of a real-time tracking algorithm using an on-board processor.
Preprints 84075 g011

References

  1. Counting Wildlife Manual, WWF-Southern Africa Regional Programme Office, Zimbabwe, January (2004).
  2. M. Israel, “AUAV-based Roe Deer Fawn detection system”, Conference on Unmanned Aerial Vehicle in Geomatics, Zurich, Switzerland, (2011).
  3. P. Christiansen, K. A. Steen, R. N. Jørgensen, H. Karstoft, “Automated Detection and Recognition of Wildlife Using Thermal Cameras”, Sensors, vol. 14 no. 8, pp 13778-13793, 2014. [CrossRef]
  4. M. Leonardo, A. M. Jensen, C.Coopmans, M. McKee, Y. Chen “A Miniature Wildlife Tracking UAV Payload System Using Acoustic Biotelemetry”, International Design Engineering Technical Conferences, (2013).
  5. M. Jensen, D. K Geller, YangQuanChen,“Monte Carlo Simulation Analysis of Tagged Fish Radio Tracking Performance by Swarming Unmanned Aerial Vehicles in Fractional Order Potential Fields”, Journal of Intelligent & Robotic Systems, vol. 74, no. 1-2, pp. 287-307, (2013). [CrossRef]
  6. W. Selby, P. Corke, D.Rus, “Autonomous Aerial Navigation and Tracking of Marine Animals”,Australasian Conference on Robotics and Automation, (2011).
  7. J. Linchant, C. Vermeulen, P. Lejeune, J. Semeki, J. Lisein, “Are unmanned aircraft systems (UASs) the future of wildlife monitoring? A review of accomplishments and challenges”, Laboratory of Tropical & Subtropical Forestry, Passage des Déportés, (2015). [CrossRef]
  8. R. C. Gonzales, R. E. Woods, and S. L. Eddins. Digital image processing using MATLAB.Pearson Prentice Hall, (2004).
  9. Helmut Mayer, Automatic Object Extraction from Aerial Imagery—A Survey Focusing on Buildings. January 28, (1999). [CrossRef]
  10. Andr´e Fischer, Thomas H. Kolbe, Extracting Buildings from Aerial Images Using Hierarchical Aggregation in 2D and 3D. July 7, (1998).
  11. Stuart L. Pimm,1,* Sky Alibhai. Emerging Technologies to Conserve Biodiversity.
  12. Martin Wikelski1, Roland W. Kays . Going wild: what a global small-animal tracking system could do for experimental biologists. 26 October (2006). [CrossRef]
  13. YunfeiFanga, Shengzhi Dub. Motion Based Animal Detection in Aerial Videos.
  14. Siyi Li, Dit-Yan Yeung . Visual Object Tracking for Unmanned Aerial Vehicles: A Benchmark and New Motion Models. [CrossRef]
  15. J. L. Barron, D. J. Fleet, and S. S. Beauchemin, “Performance of optical flow techniques,” Int. J. Comput. Vis., vol. 12, no. 1, pp. 43–77, 1994. [CrossRef]
  16. Bruhn, J. Weickert, and C. Schnörr, “Lucas/Kanade meets Horn/Schunck: Combining local and global optic flow methods,” Int. J. Comput. Vis., vol. 61, no. 3, pp. 1–21, 2005. [CrossRef]
  17. M. G. Pinto, A. P. Moreira, P. G. Costa, and M. V. Correia, “Revisiting Lucas-Kanade and Horn-Schunck,” J. Comput. Eng. Informatics, vol. 1, no. 2, pp. 23–29, 2013. [CrossRef]
  18. S. Negahdaripour, “Revised definition of optical flow: integration of radiometrie and geometric cues for dynamic scene analysis,” IEEE Trans. Pattern Anal. Mach. Intell., vol. 20, no. 9, pp. 961–979, 1998.
  19. L. Fennema and W. B. Thompson, “Velocity determination in scenes containing several moving objects,” Computer Graphics and Image Processing, vol. 9, no. 4. pp. 301–315, 1979. [CrossRef]
  20. Kim, Nam-In, et al. "Piezoelectric Sensors Operating at Very High Temperatures and in Extreme Environments Made of Flexible Ultrawide-Bandgap Single-Crystalline AlN Thin Films." Advanced Functional Materials 33.10 (2023): 2212538. [CrossRef]
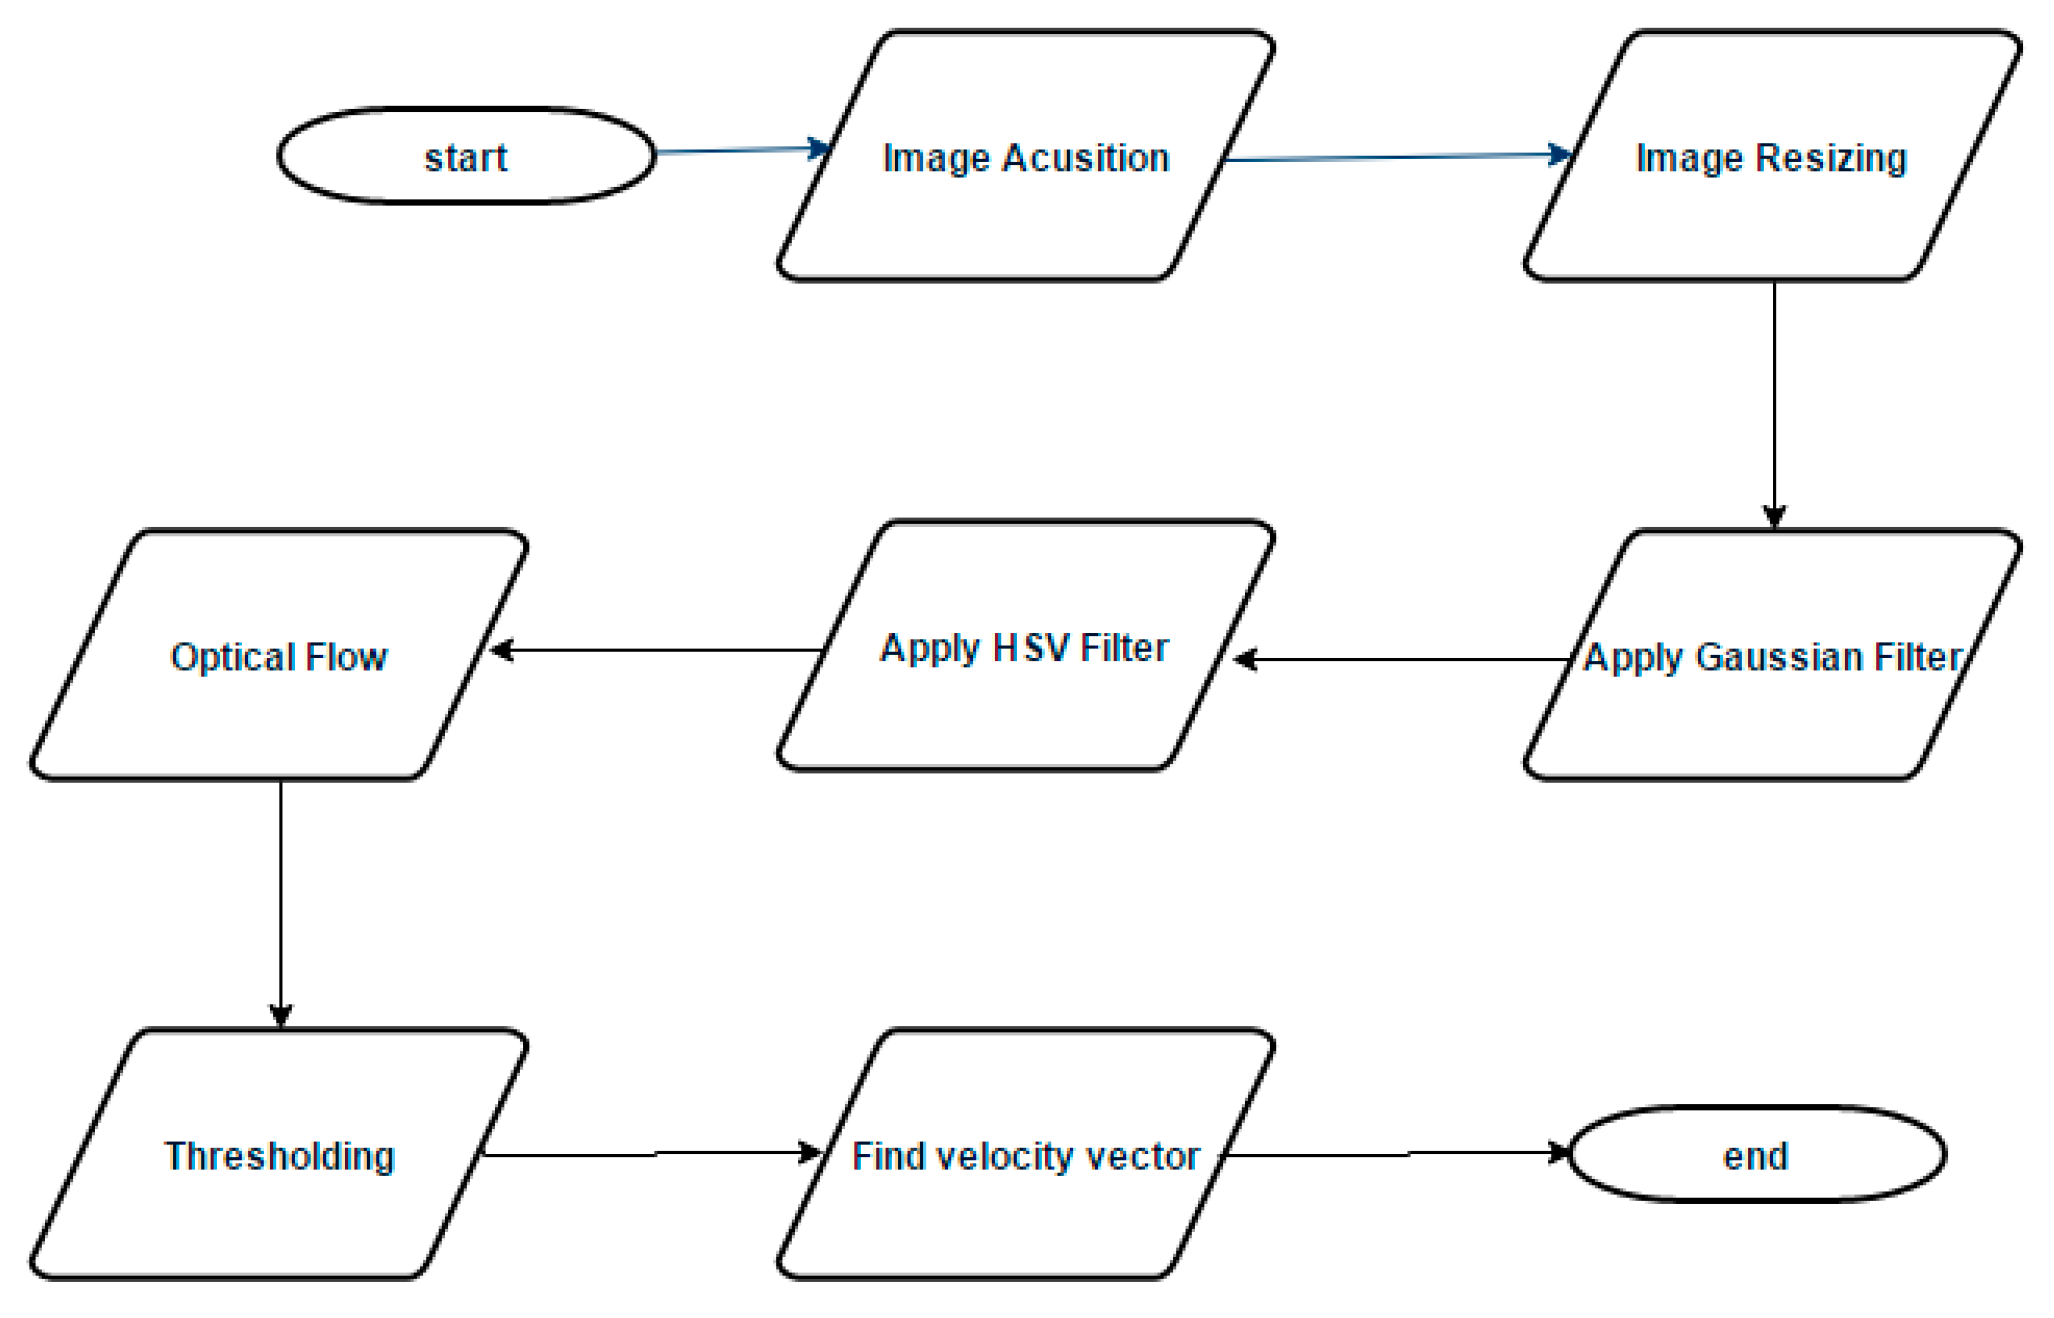
Figure 1. Algorithm Flowchart.
Preprints 84075 g001
Figure 2. Imaging Platform.
Preprints 84075 g002
Figure 7. Horn Schunck(vector u).
Preprints 84075 g007
Figure 8. Horn Schunck(vector v).
Preprints 84075 g008
Table 1. Measured and calculated Value.
Method Lucas-Kande Horn-schunck Difference
optical flow between frame (i & i+1) optical flow between frame (i & i+1)
Frame(i) U1 V1 U2 V2 U1-U2 V1-V2
1 -1.68 -1.35 0.19 1.53 -1.87 -2.88
2 0.28 -0.81 -0.11 0.56 0.39 -1.37
3 -0.37 0.46 0.13 0.51 -0.50 -0.05
4 0.27 0.40 0.37 0.63 -0.09 -0.23
5 0.12 0.06 0.57 0.38 -0.45 -0.32
6 0.06 -0.57 0.46 0.32 -0.40 -0.90
7 0.20 0.31 0.58 0.48 -0.38 -0.17
8 0.23 -0.16 0.05 0.56 0.18 -0.72
9 0.02 0.27 -0.13 0.37 0.15 -0.10
10 0.07 -0.09 -0.28 0.28 0.35 -0.37
11 0.10 -0.63 -0.16 0.38 0.26 -1.01
12 0.28 0.40 0.09 0.97 0.20 -0.56
13 0.31 0.18 0.72 0.59 -0.41 -0.41
14 -0.28 -0.18 0.50 0.41 -0.78 -0.59
15 0.03 0.61 0.62 0.49 -0.59 0.12
16 -0.14 0.31 0.77 0.59 -0.90 -0.27
17 0.23 1.53 0.23 0.86 -0.00 0.67
18 0.12 -0.19 -0.23 0.63 0.35 -0.82
19 -0.38 -0.41 -0.40 0.46 0.03 -0.87
20 0.41 0.58 -0.44 0.40 0.85 0.17
21 0.43 0.28 -1.13 0.56 1.55 -0.29
22 0.78 0.70 0.86 0.26 -0.08 0.45
23 0.58 -0.13 0.72 0.03 -0.14 -0.16
24 0.13 0.43 0.68 0.37 -0.56 0.06
25 0.26 0.54 1.02 0.76 -0.76 -0.22
26 0.22 0.52 0.48 1.15 -0.25 -0.63
27 -0.24 0.72 -0.13 1.22 -0.12 -0.50
28 -0.15 1.26 -0.65 0.85 0.50 0.40
29 -0.55 0.29 -1.06 0.10 0.51 0.18
30 -0.91 -0.27 -1.88 -1.35 0.97 1.08
31 1.00 -0.79 1.83 -2.60 -0.83 1.81
Table 2. Comparison of velocities.
Method Horn Schunck Lucas-kanade Difference
u 4.2616 1.4227 2.8389
v 12.7478 4.2467 8.5011
Disclaimer/Publisher’s Note: The statements, opinions and data contained in all publications are solely those of the individual author(s) and contributor(s) and not of MDPI and/or the editor(s). MDPI and/or the editor(s) disclaim responsibility for any injury to people or property resulting from any ideas, methods, instructions or products referred to in the content.
Copyright: This open access article is published under a Creative Commons CC BY 4.0 license, which permit the free download, distribution, and reuse, provided that the author and preprint are cited in any reuse.
Prerpints.org logo

Preprints.org is a free preprint server supported by MDPI in Basel, Switzerland.

Subscribe

© 2024 MDPI (Basel, Switzerland) unless otherwise stated