Preprint
Article

Investigating the Microwave-Assisted Extraction Conditions and Antioxidative and Anti-Inflammatory Capacities of Symphytum officinale WL Leaves

Altmetrics

Downloads

112

Views

33

Comments

0

A peer-reviewed article of this preprint also exists.

This version is not peer-reviewed

Submitted:

21 August 2023

Posted:

22 August 2023

You are already at the latest version

Alerts
Abstract
The root extracts of Symphytum officinale (comfrey) are commonly used in traditional medicine to treat muscle, joint, skin and bone disorders. However, little information is available on the biomedical functions of comfrey leaves. In this study, sequencing results of Internal Transcribed Spacer and trnL-trnF genes showed that plants purchased from the local market were comfrey and named as S. officinale WL (WL). The optimal extraction conditions of WL leave with the highest extract yield and contents of total phenols and flavonoids by microwave-assisted extraction were identified. The antioxidative and anti-inflammatory activities and possible molecular mechanism(s) of the WL leaf extract (WLE) were evaluated. Furthermore, the major component of WLE was identified as rosmarinic acid by HPLC. Results showed that the optimal extract condition was obtained with 750W microwave power, 50℃, 75% methanol, the solid-to-solvent ratio of 1:10, and 15 minutes. Results of all DPPH, ABTS and superoxide radical scavenging activities, reducing power, ferrous ion chelating activity, and ferric reducing antioxidant power showed high antioxidative capacities of WLE. Furthermore, WLE showed obvious DNA protecting activity. WLE attenuated lipopolysaccharides-stimulated inflammation by suppressing iNOS, COX-2, IL-1β, IL-6, and TNF-α expressions in RAW264.7 macrophages. These attenuations involved in inactivations of lipopolysaccharides-induced NF-κB and MAPK signaling pathways.
Keywords: 
Subject: Medicine and Pharmacology  -   Medicine and Pharmacology

1. Introduction

Comfrey is a perennial herb that belongs to the borage family (Boraginaceae) and the genus Symphytum. It originated from Western Asia and Europe, where it liked wet places, like near rivers and fields. Now, it spreads all over the world, and people grow it in gardens as a natural medicine [1]. Symphytum includes about 40 species, and five of them are commonly used as comfrey [2]. However, the most popular one is S. officinale L. for its well-known anti-inflammatory property [1,3].
The roots of S. officinale L. have a high reputation as a natural remedy in traditional medicine, especially in Europe, since millenary years ago [4]. The root extracts have been widely used for the treatment of severe muscle and joint problems, wounds and bone fractures, and inflammation [5,6]. They are also used as an external preparation to heal ulcers, sprains, and fractured bones [7]. Comfrey root extract exhibits remarkable antioxidant activity [6,8], which could be attributed to the diverse polyphenols, such as rosmarinic acid, a potent antioxidant in vitro [9,10]. Previous studies showed that rosmarinic acid and its derivates perform anti-inflammatory, antioxidant, antibacterial, anti-hyperglycemic, and anti-allergic activities [2,3,11]. The European Scientific Cooperative on Phytotherapy recommends comfrey for conditions such as tendinitis, knee injury, knee osteoarthritis, insect bites, mastitis, fractures and skin inflammation [12]. Comfrey root as a medicinal product has been widely accepted and marketed in at least 10 countries. However, the hepatotoxic pyrrolizidine alkaloids in comfrey limit its long-term and oral consumption [13,14]. Therefore, improvement of comfrey extraction is required to maximize levels of polyphenols while minimizing levels of pyrrolizidine alkaloids in order to produce the best therapeutic effect [11]. Extractions with different solvents and filtrations with different filters can lower the alkaloid content in comfrey extracts [8,15].
Using microwave energy to extract bioactive compounds from plant materials is a widely used technique [16]. This technique offers several benefits over conventional extraction methods, such as higher extraction efficiency, shorter extraction duration, higher specificity and more target substances [17]. Microwave-assisted extraction (MAE) can reduce the solvent consumption, so it is regarded as an environmentally friendly technology. The key parameters of MAE, such as solvent, extraction time, solid-solvent ratio, extraction temperature, and power applied, can enhance the active ingredients and secondary metabolites obtained by extraction and can be adapted to different functionalities [16,17].
According to Karavaev et al. [18], the leaves of comfrey contain high amounts of polyphenols that can inhibit fungal pathogens. Research also indicated that the leaves of comfrey can act against various bacterial pathogens [19], and the polyphenols in the leaves may be responsible for the antibacterial effect [20]. Furthermore, aqueous glycolic extract of S. officinale L. leaves also shows wound healing and anti-inflammatory effects [3,21]. Since the leaf extract of comfrey has much less hepatotoxic alkaloids than the root extract and comfrey shoots and leaves contain the most of rosmarinic acid, comfrey leaf extract may be a biomedicinal candidate [22,23]. A recent study demonstrated that the ethanol extract of comfrey leaves shows anti-enzymatic and anti-diabetic properties in vitro [23].
Leaves are easier than roots to mass-produce for industrial applications. The active ingredients and biological activities of comfrey leaf extract are unclear. In this study, we aimed to explore the biomedicinal potentials of comfrey leaf extract. The comfrey plant was obtained from a local market and verified by molecular biology techniques. MAE was applied to obtain the maximum amount of bioactive compounds of comfrey leaves. The optimal extraction parameters were determined through measuring the extraction yields, total phenolic and flavonoid contents. The antioxidant activities of comfrey leaf extract were assessed by various methods. The DNA protection effect of the leaf extract was also examined. The main components and their concentrations of comfrey leaf extract were identified by high-performance liquid chromatography (HPLC). Furthermore, the anti-inflammatory effect and possible mechanisms of comfrey leaf extract were investigated in an inflammation model of lipopolysaccharides (LPS)-induced murine RAW264.7 macrophages.

2. Materials and Methods

2.1. Materials (Plant and chemicals)

The comfrey plant was bought from a plant farm in Tanwei, Changhua, Taiwan.
Acetonitrile, agarose, aluminum chloride, ascorbic acid, 2,20-azino-bis-3-ethylbenzthiazoline-6-sulphonic acid (ABTS), bovine serum albumin (BSA), butylated hydroxytoluene (BHT), dimethyl sulfoxide (DMSO), 1,1-diphenyl-2-picrylhydrazyl (DPPH), 3-(4,5-dimethylthiazol-2-yl)-2,5-diphenyltetrazolium bromide (MTT), ethanol, ethylenediamine tetraacetic acid (EDTA), ferric chloride, ferrous sulfate, ferrozine, formic acid, Folin–Ciocalteu reagent, gallic acid, glycerol, hydrochloric acid, hydrogen peroxide, lipopolysaccharides (LPS), N-(1-naphthyl) ethylenediamine dihydrochloride, paraformaldehyde, phosphoric acid, potassium ferricyanide, potassium persulfate, polyacrylamide solution (29:1), pyrogallol, quercetin, rosmarinic acid (RA), sodium carbonate, sodium dodecyl sulfate (SDS), sodium hydroxide, sodium nitrite, sulfanilamide, α-tocopherol, trichloroacetic acid (TCA), and Tween 20 were obtained from Merck Co. All the chemicals and solvents used in the study were of analytical grade or of HPLC. Antibodies against nuclear factor kappa-light-chain enhancer of activated B cells (NF-κB) p65, phospho-NF-κB p65, inducible nitric oxide synthase (iNOS), cyclooxygenase 2 (COX2), and β-actin and coupled secondary antibodies were obtained from Cell Signaling Technology. Antibodies against mitogen-activated protein kinases (MAPKs) and phosphor-MAPKs were obtained from Signalway Antibody.
The comfrey plant was planted in the garden of Da-Yeh university. After two weeks of plant acclimatization, we propagated multiple plants using root cuttings. We collected leaves periodically, washed harvested leaves with reverse osmosis (RO) water, and then dried them in an oven at 60°C for two days. We weighed the dry weight of these leaves and then stored them in a moisture-proof box until experiments were carried out.

2.2. Extraction of comfrey genomic DNA

The genomic DNA was extracted from comfrey leaves by the Cetyl trimethyl ammonium bromide (CTAB) method [25]. We re-dissolved the genomic DNA in 50mM sodium phosphate buffer (pH 7.4) containing 1 mM EDTA and 5% glycerol and then stored at -20°C until used.

2.3. Molecular identification of comfrey

According to the published Comfrey molecular identification method, two commonly used DNA fragments, the internal transcribed spacer (ITS) of the ribosomal gene and the trnL-trnF fragment of chloroplast, were used to conduct the taxonomic study on the genetic relationship of comfrey [26]. The names of DNA fragments, primer names, sequences, and lengths of primers were listed in Table 1. We used ITS5-F and ITS4-R primers to amplify ITS and trnL-trnF-F and trnL-trnF-R primers to amplify trnL-trnF by polymerase chain reactions (PCR), respectively. PCR products were subjected to 2% agarose gel electrophoresis, and the amplified DNAs of target lengths were excavated and purified, and entrusted to Genomics company (New Taipei City, Taiwan) to perform DNA sequencing. The obtained DNA sequences were compared with sequences in the GenBank of NCBI using the BLAST program and then download sequences of species with high similarity. We used the BioEdit software (Informer Technologies, Inc.) to align all these sequences by the clustalW multiple alignment function. The phylogenetic tree analysis was drawn using the maximum likelihood method using Tamura 3 parameter and Gamma distributed and the neighbor-joining method in the MEGA X program (Molecular Evolutionary Genetics Analysis). The internal branch strength test of the phylogenetic tree uses the analysis of 1000 replications of bootstrap, and other parameters were preset according to MEGA X. Furthermore, the internal branch strength test of the neighbor-joining method also used the analysis of 1000 replications of bootstrap, and the substitution model used the Maximum composite likelihood analysis.

2.4. Assays of MAE conditions

The MAE of S. officinale WL (WL) leaves were used MAS-II PLUS microwave synthesis/extraction reaction apparatus (SINEO Microwave Chemistry Technology Co., Ltd.). The oven-dried WL leaves were ground into fine powders (< 10 mesh) using a stainless-steel grinder. The parameters of the microwave-assisted extraction conditions were discussed in order of microwave power, microwave temperature, solid-liquid ratio, and extraction time. We weighed the WL leaf powders, mixed them with solvent in a 50mL microwave extraction bottle, and then placed the bottle in the microwave instrument tank. After extraction, we centrifuged at 5,000 rpm for 5min to obtain supernatant and record the volume. Different extraction conditions were evaluated by total extraction yield, total phenolic content, and total flavonoid content.

2.5. Assays of total extraction yield

We dried 1mL of each extraction solution in 1.5mL Eppendorf at 60°C for 2 days. The dried weight of each extraction solution was recorded. The extraction yield (%) for each extraction solution was calculated using the following equation (1):
Yield (%) = (Wd x V) / Wt x 100%
where Wd is the dried weight of 1mL extraction solution, V is the volume of extraction solution, and Wt is the weight of WL leaf powder used (1g).

2.6. Assays of total phenolic and flavonoid contents

The total phenolic content (TPC) of the extract was determined using the Folin–Ciocalteu assay as previously described [27]. Briefly, WL leaf extract (WLE, 1mL) with various concentrations were mixed with 1mL aliquots of Folin–Ciocalteu reagent (10-fold dilution) and 100μL aliquots of sodium carbonate (10%, w/v). After mixing and reacting for 30min in the dark, the absorbance was measured at 735 nm. TPC are expressed as gallic acid equivalent (GAE) in mg per g of dried leaves.
The total flavonoid content (TFC) of the extract was determined using the aluminum chloride colorimetric method [28]. Briefly, WLE (1.8mL) with various concentrations were mixed and reacted with 0.09mL of 5% sodium nitrite solution for 6 min followed by 0.09mL of 10% aluminum chloride solution. Finally, after a 5-min reaction, 0.6mL of 1M sodium hydroxide was added to the mixture, and the absorbance was measured at 510 nm. We used quercetin as the standard compound and calculated the total flavonoid content using the calibration curve for quercetin. TFC are expressed as quercetin equivalent (GE) in mg per g of dried leaves.

2.7. DPPH free radical scavenging assays

The radical scavenging activity of WLE was determined by DPPH assay [29], with modifications. Briefly, varying dilutions of WLE (1.5mL) were added to 3mL aliquots of DPPH (0.2 mg/mL) and absorbance was measured at 517 nm after 30min. Seventy-five percent of methanol was used as blank. BHT was used as positive control. Radical scavenging activity was expressed as inhibition ratio (%) using the following equation (2):
The inhibition ratio (%) = (1 – Ae / Ac) × 100%
where Ae is the absorbance of WLE or standard, and Ac is the absorbance of the blank.

2.8. ABTS free radical scavenging assays

ABTS radical cation decolorization assay [30] was used with modifications. Briefly, we used 7.35mM potassium persulfate to mix 7µM ABTS and kept it in the dark for 24h at room temperature to promote the oxidation of ABTS and to generate blue-green ABTS+ free radicals. Then, the ABTS+ solution was diluted with 95% ethanol to the absorbance value of a wavelength of 735 nm was 1 (±0.05). The WLE (3mL) with various concentrations was added to 3mL ABTS+ solution, and absorbance was measured at 750 nm. Seventy-five percent of methanol was used as blank. Ascorbic acid was used as positive control.

2.9. Iron ion chelation assays

Iron ion chelation assays [31] were used with modifications. Briefly, 2mM ferrous sulfate (0.24mL) was mixed with various concentrations of WLE (2.4mL). After adding 5mM ferrozine (0.48mL), reactions were allowed to proceed for 10 min, and then absorbance was measured at 562 nm. Seventy-five percent of methanol was used as blank. EDTA was used as positive control. Percentage inhibition of ferrozine-Fe2+ complex formation was calculated using the following formula (3):
Iron chelating effect (%) = [1 - (A / B)] x 100%
where A is the absorbance of WLE, and B is the absorbance of the blank.

2.10. Reducing power assays

The reducing power of WLE was determined by monitoring the reduction of Fe3+ to Fe2+, as described previously [32], with modifications. Briefly, 2mL of various concentrations of WLE, 2mL of 200 mM phosphate buffer (pH 6.6), and 2mL potassium ferricyanide (1%, w/v) were added. After incubation at 50°C for 20min, 2mL of TCA (10%, w/v) was added, and then mixture was centrifuged at 9,000 rpm for 3min. Finally, 2mL supernatant was mixed with 2mL RO water and 0.4mL ferric chloride in water (0.1%, w/v). The absorbance was measured at 700 nm against a blank after 10min of reaction time. Positive control used was ascorbic acid.

2.11. Ferric reducing antioxidant power (FRAP) assays

FRAP assay [33] was used with modifications. Briefly, various concentrations of WLE (0.6mL) were mixed with 2.4mL FRAP reagent, then incubated at 37°C for 10min in dark. The absorbance was measured at 593 nm. Ascorbic acid was used as positive control. Results were expressed as ascorbic acid equivalent of mM ascorbic acid.

2.12. Superoxide scavenging (SOD-like) assays

SOD-like assays were used [34]. Briefly, various concentrations of WLE (1mL) were thoroughly mixed with 1mL Tris-HCl buffer (pH 7.4) and 0.5mL pyrogallol solution (in 1M hydrochloric acid). The absorbance (325 nm) was measured after mixing and incubation for 5min at 37°C. As the ΔA(325 nm, control) value reflects the initial concentration of substrate •O2-, it should be well controlled to guarantee the accuracy of the method. Seventy-five percent of methanol was used as a control. The percentage of superoxide radical scavenging activity was calculated using the following formula (4):
Activity (%) = [(∆A325, control)/T - (∆A325, sample)/T)] / [(∆A325, control)/T] × 100%
where ∆A325, control: ∆A325 of control; ∆A325, sample: ∆A325 of various concentrations of WLE; T: reaction time (5min).

2.13. DNA Protection Assay

Oxidative DNA damage was determined according to the conversion of circular supercoiled pCIneo plasmid DNA into nicked circular or further degraded forms as described [35] with slight modifications. Reaction mixtures of 20μL containing 2.5μL of supercoiled pCIneo (150 ng/μL), 10μL of a Fenton reaction solution containing 30 mM hydrogen peroxide, 100μM ferric chloride, and 100μM ascorbic acid in 20 mM Tris-HCl buffer (pH 7.6), and 5μL of various concentrations of WLE or 250 ng/mL quercetin (positive control). Reaction mixtures were incubated at 37°C for 30 min, and then plasmid DNA forms were separated on 1% agarose gel and were stained using SafeViewTM (Applied Biological Materials Inc.). To semi-quantify the antioxidant activity of the extract, quantities of supercoiled and nicked forms of pCIneo were quantified using an AlphaImager Mini (ProteinSimple) instrument, and band intensities on agarose gel were quantified using GelPro software. As negative and positive controls, pCIneo plasmid was incubated alone and with the Fenton reagent and quercetin mixture, respectively. The protective activity of WLE was calculated from quantities of supercoiled and nicked plasmid DNAs using the following equations (5,6):
Protection of supercoiled plasmid (%) = supercoiled form intensity / pCIneo supercoiled DNA band intensity x 100%
Percentage of nicked plasmid (%) = nicked form intensity / pCIneo total DNA band intensity x 100%

2.14. HPLC assays

The HPLC instruments used in this study consisted of Hitachi HPLC D-2000 System (Hitachi High-Tech Co.) and SPD-10A VP photodiode array detector (Shimadzu Co.). A Scpak ODS-P C18 column (5μm, 4.6 mm ID × 250 mm) (Analab Co.) was used. The mobile phase consisted of 0.1% aqueous formic acid (A) and 0.1% formic acid in acetonitrile (B) using a gradient elution of 5-95% B at 0-44min and 5% B at 44-49 min. WLE and various concentrations of RA (20μL) were filtered through a 0.45μm Minipore filter (Minipore Micro Products) before injection into the column, respectively. The flow rate was 1.0 mL/min, and the detection wavelength was 280 nm. RA was dissolved in 99.5% ethanol. Various concentrations of RA were used to obtain the standard curve for the calculation of RA concentration in WLE.

2.15. Cell culture

Murine macrophage RAW 264.7 cells were purchased from the Bioresource Collection and Research Center (BCRC 60001, Hsinchu, Taiwan) and cultured in Dulbecco’s modified eagle media (DMEM) supplemented with 10% heat-inactivated fetal bovine serum (FBS), 1% penicillin-streptomycin and 2mM L-glutamine (Biological Industries Ltd.) at 37°C in a 5% CO2 humidified incubator.

2.16. Cell viability assay

Cell viability was evaluated by MTT assay as described [36]. In brief, RAW 264.7 cells were cultured at a density of 5 × 10⁴ cells/well in 96-well plates for 24h. After treatment with various concentrations of WLE for 30min, we cultured cells with or without 10 ng/mL LPS for another 24h. After washing with phosphate-buffered saline (PBS, pH 7.4), we then added MTT and incubated for 3 hours. After mixing with 10% DMSO, we measured absorbance at 570 nm wavelength.

2.17. Nitrite determination

The amounts of nitrite in the culture media were determined on Griess reagent assay. RAW 264.7 cells were seeded onto 6-well plates (5 × 10⁵ cells/well) and incubated for 24h. After treatment with various concentrations of WLE for 30min, we cultured cells with or without 10 ng/mL LPS for another 24h. Subsequently, 100μL of the supernatant from each well was transferred onto a 96-well plate. Each well was supplemented with 100μL of Griess reagent (Abcam plc.) containing 1% sulfanilamide and 0.1% N-(1-naphthyl) ethylenediamine dihydrochloride in 5% phosphoric acid for 10min. The absorbance of the solution was measured at 540 nm, and the concentrations of nitrite were calculated using a standard calibration curve based on different concentrations of sodium nitrite.

2.18. Reverse transcription (RT)-PCR assay

RAW 264.7 cells were seeded onto 6-well plates (5 × 10⁵ cells/well) and incubated for 24h. After treatment with various concentrations of WLE for 30min, we cultured cells with or without 10 ng/mL LPS for another 24h. Using Trizol reagent and Superscript III system (Life Technologies), we extracted and reverse transcribed mRNAs. The primer pairs used to determine the expressions of interleukin (IL)-1β, IL-6, tumor necrosis factor (TNF)-α, and β-actin cDNAs by PCRs were described in Table 1.

2.19. Enzyme-linked immunosorbent assay (ELISA)

RAW 264.7 cells were pre-cultured at a density of 1 × 10⁵ cells/well in 6-well plates for 24h. After treatment with various concentrations of WLE for 30min, we cultured cells with or without 10 ng/mL LPS for another 24h. After centrifugation of media, we placed supernatants in 96-well plates and quantified concentrations of IL-1β, IL-6, and TNF-α using ELISA kits (Rhenium Ltd.) as manufacture instructions. We measured the absorbance at 450 nm and calculated the absolute concentration using the standard curve.

2.20. Western blots

The RAW 264.7 cells at a density of 2 × 10⁵ cells/well were planted in 6-well plates for 24h. After treatment with various concentrations of WLE for 30min, we cultured cells with or without 10 ng/mL LPS for another 24h. The treated cells were mixed with RIPA buffer containing protein inhibitor cocktail (Abcam) for cell lysis and then centrifuged at 13,000 rpm at 4˚C for 15min to collect cellular proteins. The extracted cellular proteins were separated using 4-12% SDS-polyacrylamide gel electrophoresis and transferred to polyvinylidene difluoride membranes (Sigma-Aldrich). After blocking, membranes were incubated with a 1: 1,000 dilution of specific primary antibodies for detecting mouse NF-κB p65, phospho-NF-κB p65, iNOS, COX2, MAPKs, and phospho-MAPKs. After reactions with coupled secondary antibodies, protein signals were developed using enhanced chemiluminescence (Sage Creation) and then were determined using AlphaEase FC software (Alpha Innotech).

2.21. NF-κB nuclear translocation analysis

The RAW 264.7 cells at a density of 2 × 10⁴ cells/well were planted in 24-well plates with 12mm chamber slide for 24h. After treatment with 500 μg/mL of WLE for 30min, we cultured cells with or without 10 ng/mL LPS for another 30min. Cells in a 12mm chamber slide were washed with PBST (Phosphate-buffered saline, pH7.4, containing 1% Tween 20) followed by fixed with 4% paraformaldehyde for 15min. Block specimen in Blocking buffer (PBST with 2.5% BSA) for 1h and then incubated with mouse anti-p65 antibody (1:100) for overnight at 4˚C. Cells were washed with PBST and incubated with goat-anti-mouse fluorescein isothiocyanate (FITC) antibody (1:200, Sigma-Aldrich) for 1h in the dark. Cell nuclei were stained with 1 mg/mL 4’,6-diamidino-2-phenylindole (DAPI) for 15min. Cells were rinsed with PBS and covered with SlowFade antifade reagent (Thermo Fisher Scientific). Finally, nuclear translocation of NF-κB subunit p65 protein was assessed under fluorescent microscope (OLYMPUS CKX41). To determine the subcellular regions of protein co-localization, the same field images were merged using with OLYMPUS cellSens software.

2.22. Statistical Analyses

All data are expressed as means ± standard deviation (SD) from at least three independent experiments. Differences between treatments were identified using Student’s t-test or ANOVA followed by Dunnett’s test. Differences were considered significant when P < .05.

3. Results and Discussion

3.1. Molecular identification of native comfrey species

In order to determine the correct scientific name of the purchased plant, we used molecular biological identification and classification for this plant species. The CTAB DNA extraction method was used to exclude the metabolic interference of plant. The concentration of plant chromosomal DNA obtained was 8.04 μg/μL, the absorbance ratio of 260/280 was 2.242, and the absorbance ratio of 260/230 was 1.952. The efficiency and quality of extracted plant chromosomal DNA were consistent with those described [25]. The genetic relationship of this plant were carried out using the ITS DNA fragment and the chloroplast trnL-trnF gene fragment by PCRs [26]. The length of the ITS fragment of this plant was in the range of 700-800 bp, while the length of the trnL-trnF fragment was in the range of 900-1000 bp. The lengths of the ITS and trnL-trnF fragments were in accordance with Symphytum species.
After DNA sequencing, the DNA sequences of ITS and trnL-trnF fragments were analyzed for genetic relationships using the maximum parsimony method of MEGA X software and tree structure analysis. The results in Figure 1(A) showed that the ITS sequences showed a good partitioning among the species of Symphytum, and the plant used in this study was identical (100% similarity) to the ITS sequence of S. officinale with the Accession number of MH645788.1 on the NCBI GenBank. The trnL-trnF fragment of this plant reached 88% similarity with the S. officinale sequence of Accession number JQ041857.1 on NCBI GenBank (Figure 1(B)). From the obtained DNA sequence similarities, we named the plant used in this study as S. officinale WL and abbreviated as WL.

3.2. The optimum MAE conditions of WLE

In order to increase the extraction efficiency, shorten the extraction time, reduce the extraction temperature, and obtain more bioactive substances, we used MAE to extract bioactive substances from the dried powder of WL leaves. Therefore, several variables of MAE were first studied, including microwave radiation power, extraction temperature, methanol solvent concentration, solid-to-solvent ratio, and extraction time. The extraction yield (%), total phenolic content, and total flavonoid content were analyzed to determine the optimal MAE conditions. Different concentrations of aqueous methanol were used as the extraction solvents in this study. Based on the boiling point of methanol at 64°C, the microwave radiation power ranged from 250W to 1000W, the extraction temperature ranged from 25°C to 60°C, the concentration of methanol ranged from 0% to 100%, the solid-to-solvent ratio ranged from 1:2.5 to 1:15 (w/v), and the extraction time ranged from 0.5 minutes to 45 minutes.

3.2.1. The optimal microwave radiation power

The effects of microwave powers of 250, 350, 500, 750, and 1000W on the extraction yields were investigated at an extraction temperature of 50℃, a solid-to-solvent ratio of 1:10, a solvent of 75% methanol, and an extraction time of 30 minutes. The results showed that the order of the extraction yield was 250W (10.93%) < 1000W (11.50%) < 350W (11.75%) < 500W (11.18%) < 750W (12.50%). With the exception of 1000W, the extraction yield tended to increase with increasing microwave power. Furthermore, the total phenolic and total flavonoid contents tended to decrease with increasing microwave power, except for the highest content at 750W. It can be concluded that although increasing the microwave radiation power can promote the release of leaf substances into the solvent, too high a power may damage the active ingredients in leaves. These preliminary results showed that 750W was the optimal microwave power for extraction of WL leaves.

3.2.2. The optimal microwave temperature

The effects of microwave temperatures of 25, 30, 40, 50 and 60℃ on the extraction yields were investigated under the microwave power of 750W, extraction time of 30 minutes, solid-to-solvent ratio of 1:10, and solvent of 75% methanol. The results showed that the order of the extraction yield was 30℃ (11.67%) < 25℃ (11.70%) < 40℃ (12.74%) < 60℃ (12.89%) < 50℃ (13.72%). The extractive yield increased with increasing temperature except for 60°C. The results of total phenolic and total flavonoid contents were consistent with the trend of extraction yield. This result indicated that the extracted phenols and flavonoids from WL leaves at temperatures below 50℃ are relatively stable. However, when the temperature exceeded 50℃, the decomposition of the main components decreased the extraction yield and the total phenolic and flavonoid contents. Therefore, 50°C was used as the optimal extraction temperature, which was similar to the results of previous studies on the extractions of litchi fruit pericarp [37] and pistachio green hull [38].

3.2.3. The optimal aqueous methanol concentration

The effects of 0%, 25%, 50%, 75%, and 100% methanol on the extraction yields were investigated at a microwave power of 750W, an extraction temperature of 50℃, an solid-to-solvent ratio of 1:10, and a time of 30 minutes. The results showed that 50% methanol was the most effective concentration in the extractive yield, but all of these extraction yields were in the range of 14-15% without any significant difference. However, 75% methanol could extract the most amounts of total phenols and total flavonoids. Previous studies have shown that 50% to 80% methanol have been used to extract hydroxycinnamic acids and many flavonoid molecules from plants [39]. It has also been suggested that extraction of anthocyanins from plants with 70% methanol has a higher extraction rate than water extraction [40]. Drużyńska et al. [41] found that diluted methanol was the optimal solvent for the extraction of total phenols and para-hydroxycinnamic acids from green tea than diluted acetone or ethanol. Therefore, we choose 75% methanol as the optimal extraction solvent.

3.2.4. The optimal solid-to-solvent ratio

The effect of different solid-to-solvent ratios on the total extraction yields were investigated at a microwave power of 750W, an extraction temperature of 50℃, a solvent of 75% methanol, and a time of 30 minutes. The results showed that the order of the extraction yields were 1:2.5 (9.27%) < 1:15 (10.875%) < 1:10 (13.58) < 1:7.5 (15.18%) < 1:5 (16.00%). The highest extraction yield was obtained when the solid-solvent ratio was increased to 1:5. Increasing the solid-to-solvent ratio increased the total phenol and flavonoid contents but decreased the concentrations of total phenols and total flavonoids in solution. This result is consistent with previous extraction studies [32,37]. Although the highest total phenolic content was found at solid-solvent ratio of 1:15, the highest total flavonoid content was found at solid-solvent ratio of 1:10. To decrease the volume of used solvent, 1:10 was chosen as the most suitable solid-solvent ratio.

3.2.5. The optimal extraction time

The effect of different extraction times on the extraction yield were investigated under microwave power of 750W, extraction temperature of 50℃, solvent of 75% methanol, and solid-solvent ratio of 1:10. The results showed that the longer the extraction time, the higher the extraction yield. However, the total flavonoids and total phenols reached the plateau of 64.22 mg/g and 13.13 mg/g after 10 min of extraction time, respectively. The longer microwave extraction time may cause unexpected reactions such as enzyme degradation and oxidation, that may result in the destruction of polyphenols [42]. Therefore, reducing the extraction time can reduce the energy and cost, as well as the damage and oxidation of chemicals in the plant. Based on these considerations, the optimal time for MAE was chosen to be 15 minutes.
In summary, the most suitable condition for MAE of WL leaves was microwave power of 750W, extraction temperature of 50°C, solvent of 75% methanol, solid-to-solvent ratio of 1:10, and extraction time of 15 minutes. The results of the extraction yield and the contents of total phenols and total flavonoids were shown in Table 2, respectively.

3.3. Antioxidant capacity of WLE

In order to obtain a large amount of WLE for various bioactivity analyses, we used MAE to extract WLE under the previous most suitable condition (Table 2). After extraction, WLE was concentrated under reduced pressure and freeze-dried. The WLE were resolubilized in 75% methanol and diluted to 31.25, 62.5, 125, 250, 500, 1000, 2000, and 4000 µg/mL in concentrations. The WLE were evaluated for various antioxidant capacities.
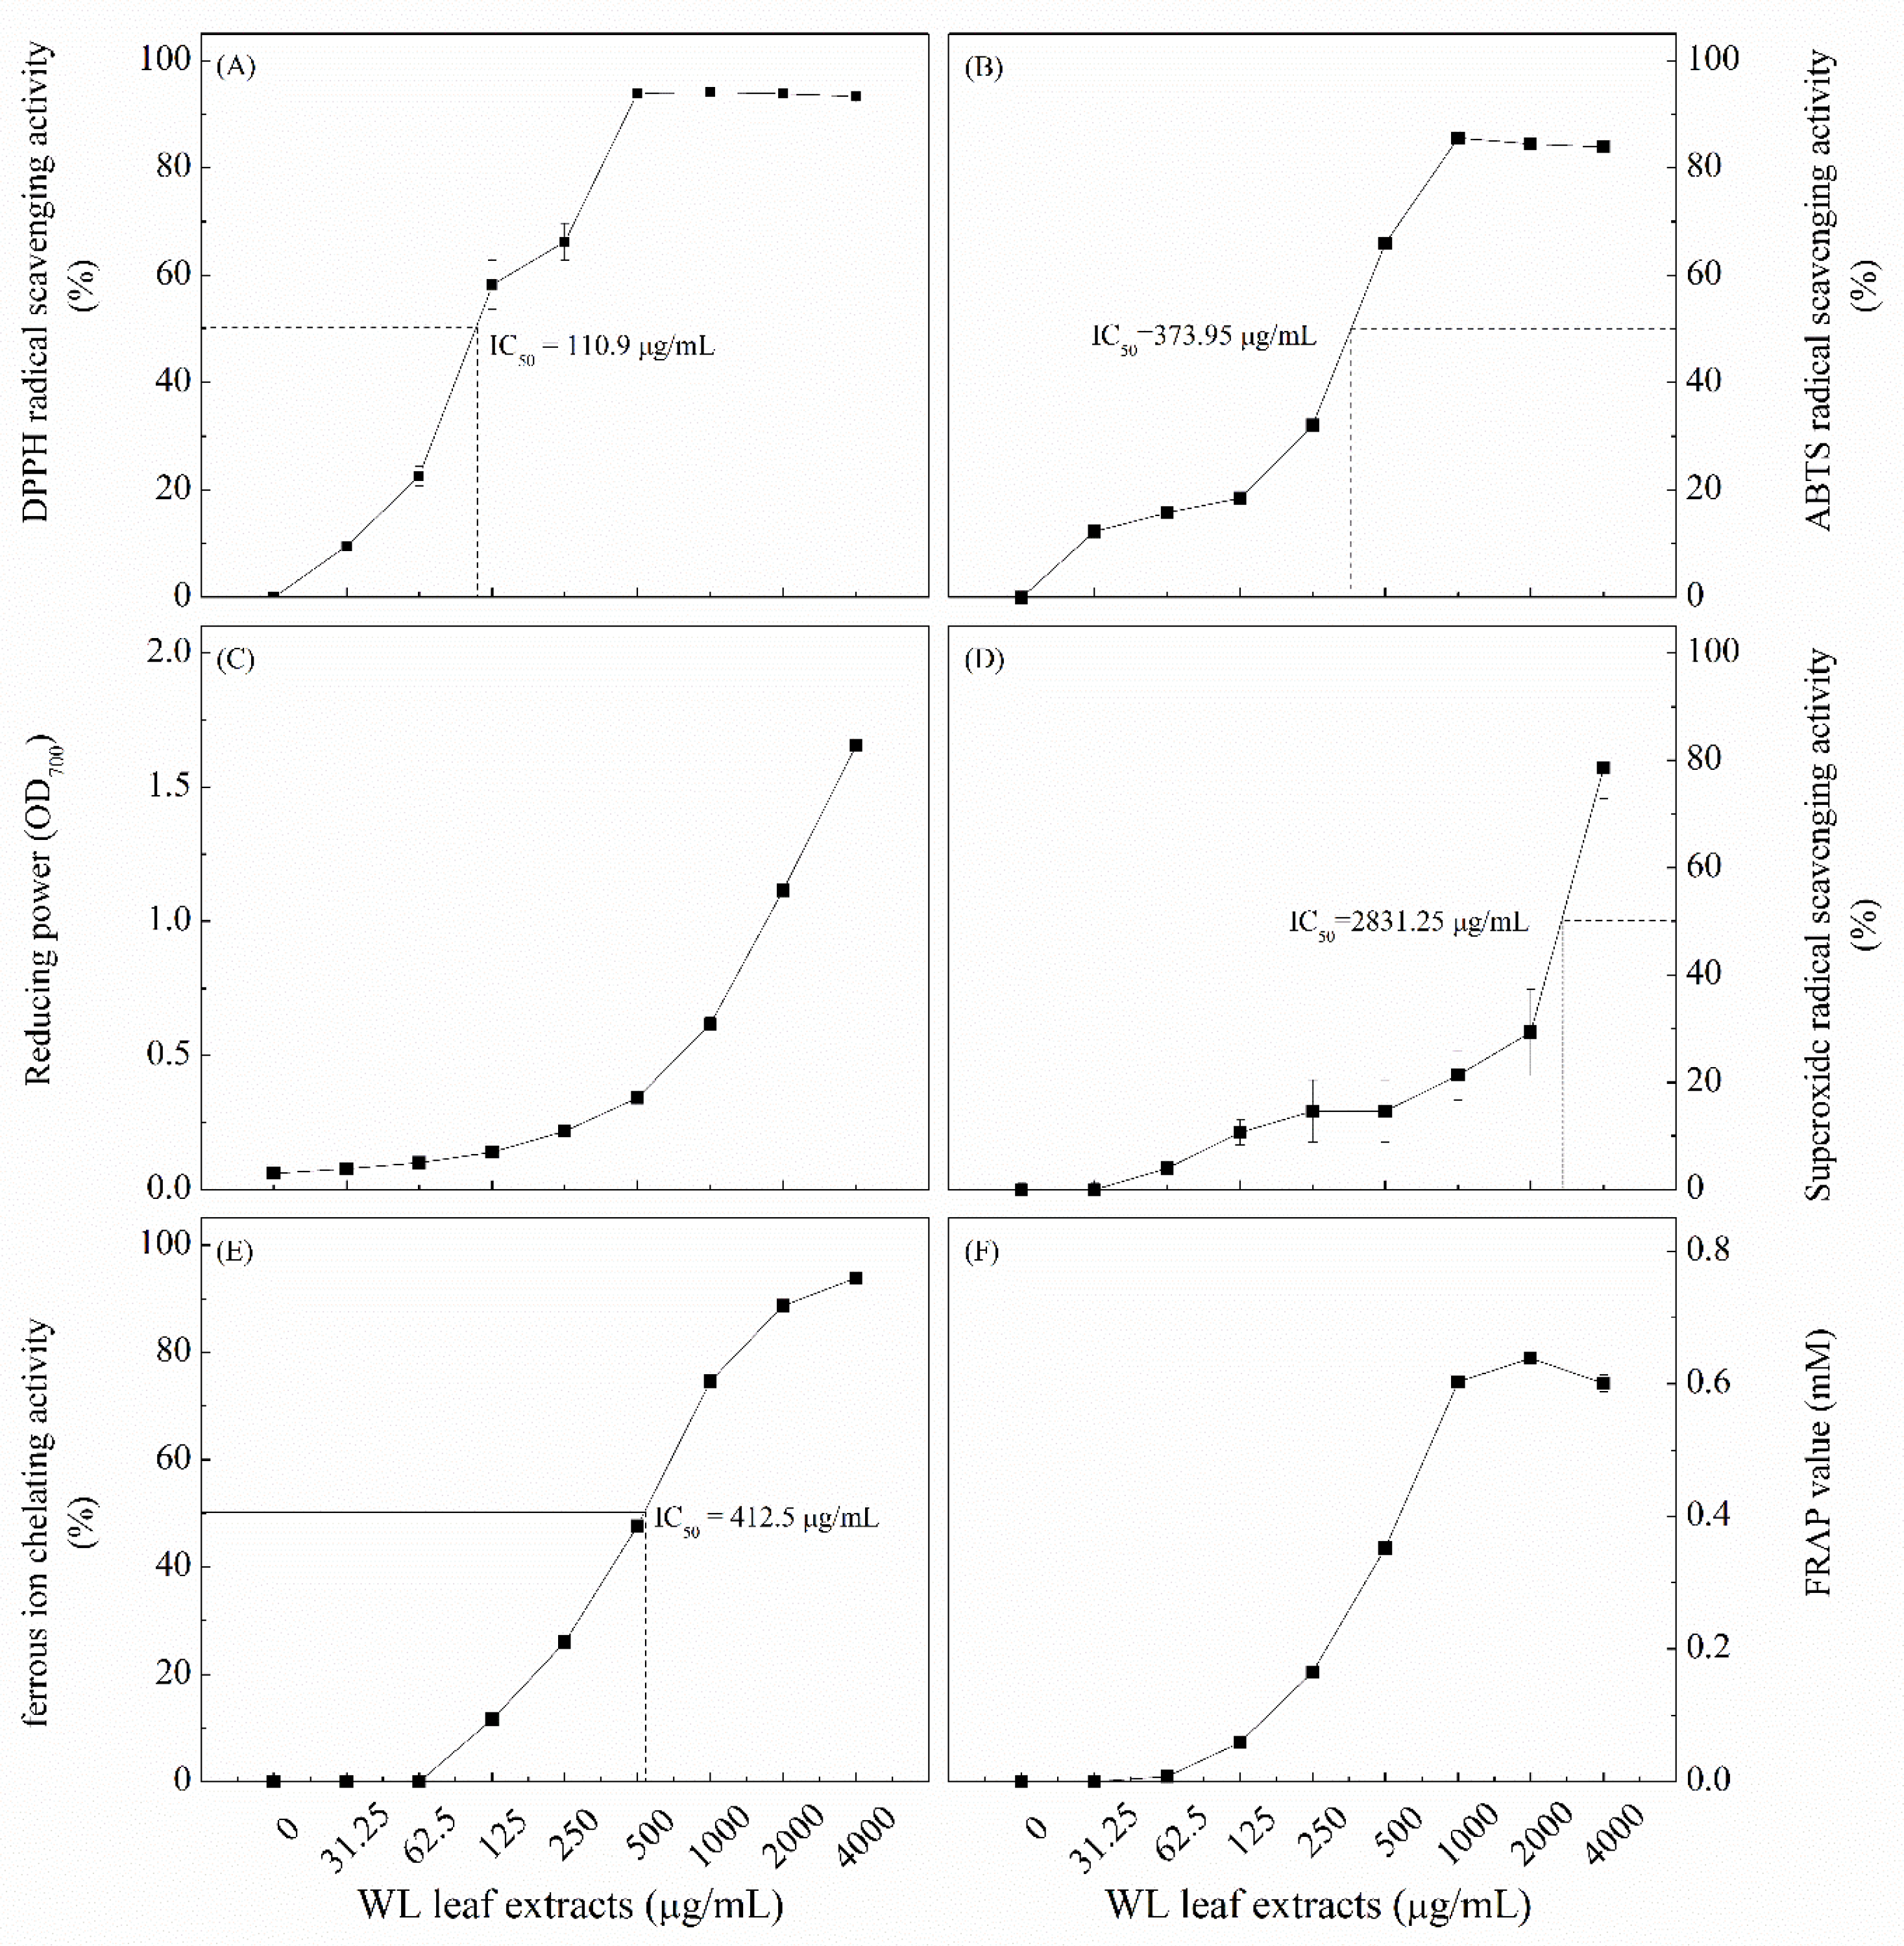
The DPPH radical scavenging activity assay was performed first. Figure 2(A) showed that the DPPH radical scavenging activity of WLE reached the plateau and similar to that of 4000 µg/mL BHT (87.2%) when concentrations of WLE ≥ 500 µg/mL The calculated IC50 value of the DPPH radical scavenging activity of WLE was 110.9 µg/mL.
Figure 2(B) showed that the highest ABTS radical scavenging activity was observed at the concentration of WLE ≥ 1000 µg/mL, which was similar to that of 1% ascorbic acid (87.2%). The calculated IC50 value of ABTS radical scavenging activity of WLE was 373.95 µg/mL.
Figure 2(C) showed that the higher the concentrations of WLE, the higher the reducing power. At 4000 µg/mL, the reducing power of WLE was 1.654, which was lower than that of ascorbic acid (3.975) at the same concentration.
Figure 2(D) showed that the higher the concentrations of WLE, the higher the SOD-like activity. The highest SOD-like activity was found at 4000 µg/mL (78.6%), which was lower than that of ascorbic acid (100%) at the same concentration. The calculated IC50 value for the SOD-like activity of WLE was 2831.25 µg/mL.
The concentration of WLE at 4000 µg/mL showed the highest ferrous ion chelating activity (93.8%), which was similar to that of 100 µg/mL EDTA (96.68%) (Figure 2(E)). The calculated IC50 value for the ferrous ion chelating activity of WLE was 412.5 µg/mL.
The results of Figure 2(F) showed that the higher the concentrations of WLE, the higher the ferrous reducing antioxidant power (FRAP value). The maximum FRAP value (0.638 µM) was reached at 2000 µg/mL WLE.
We used six commonly used methods to decipher the antioxidant capacities of WLE. There are fewer antioxidant studies on the antioxidant activity of the leaf extract of comfrey compared to the root extract. The contained polyphenols of comfrey root extract play important roles in scavenging free radicals [6], and high total phenolic content is associated with SOD-like capacity [43]. A previous study showed that the IC50 value of DPPH radical scavenging activity of ethanol extract of comfrey leaves was 39.97 µg/mL [43], which lower than the IC50 value (110.9 µg/mL) of WLE (Figure 2(A)). The ABTS radical scavenging activity, reducing power, SOD-like activity, ferrous chelating activity, and FRAP value showed the same trend with DPPH radical scavenging activity, and all of them increased with the increases of the WLE concentrations. In the present study, MAE of WL leaves was carried out, and the most suitable extraction conditions were chosen to maximize the total phenolic and total flavonoid contents. The WLE obtained were rich in total phenols and total flavonoids, and thus it had relatively high antioxidant capacity.

3.4. DNA protective assay of WLE

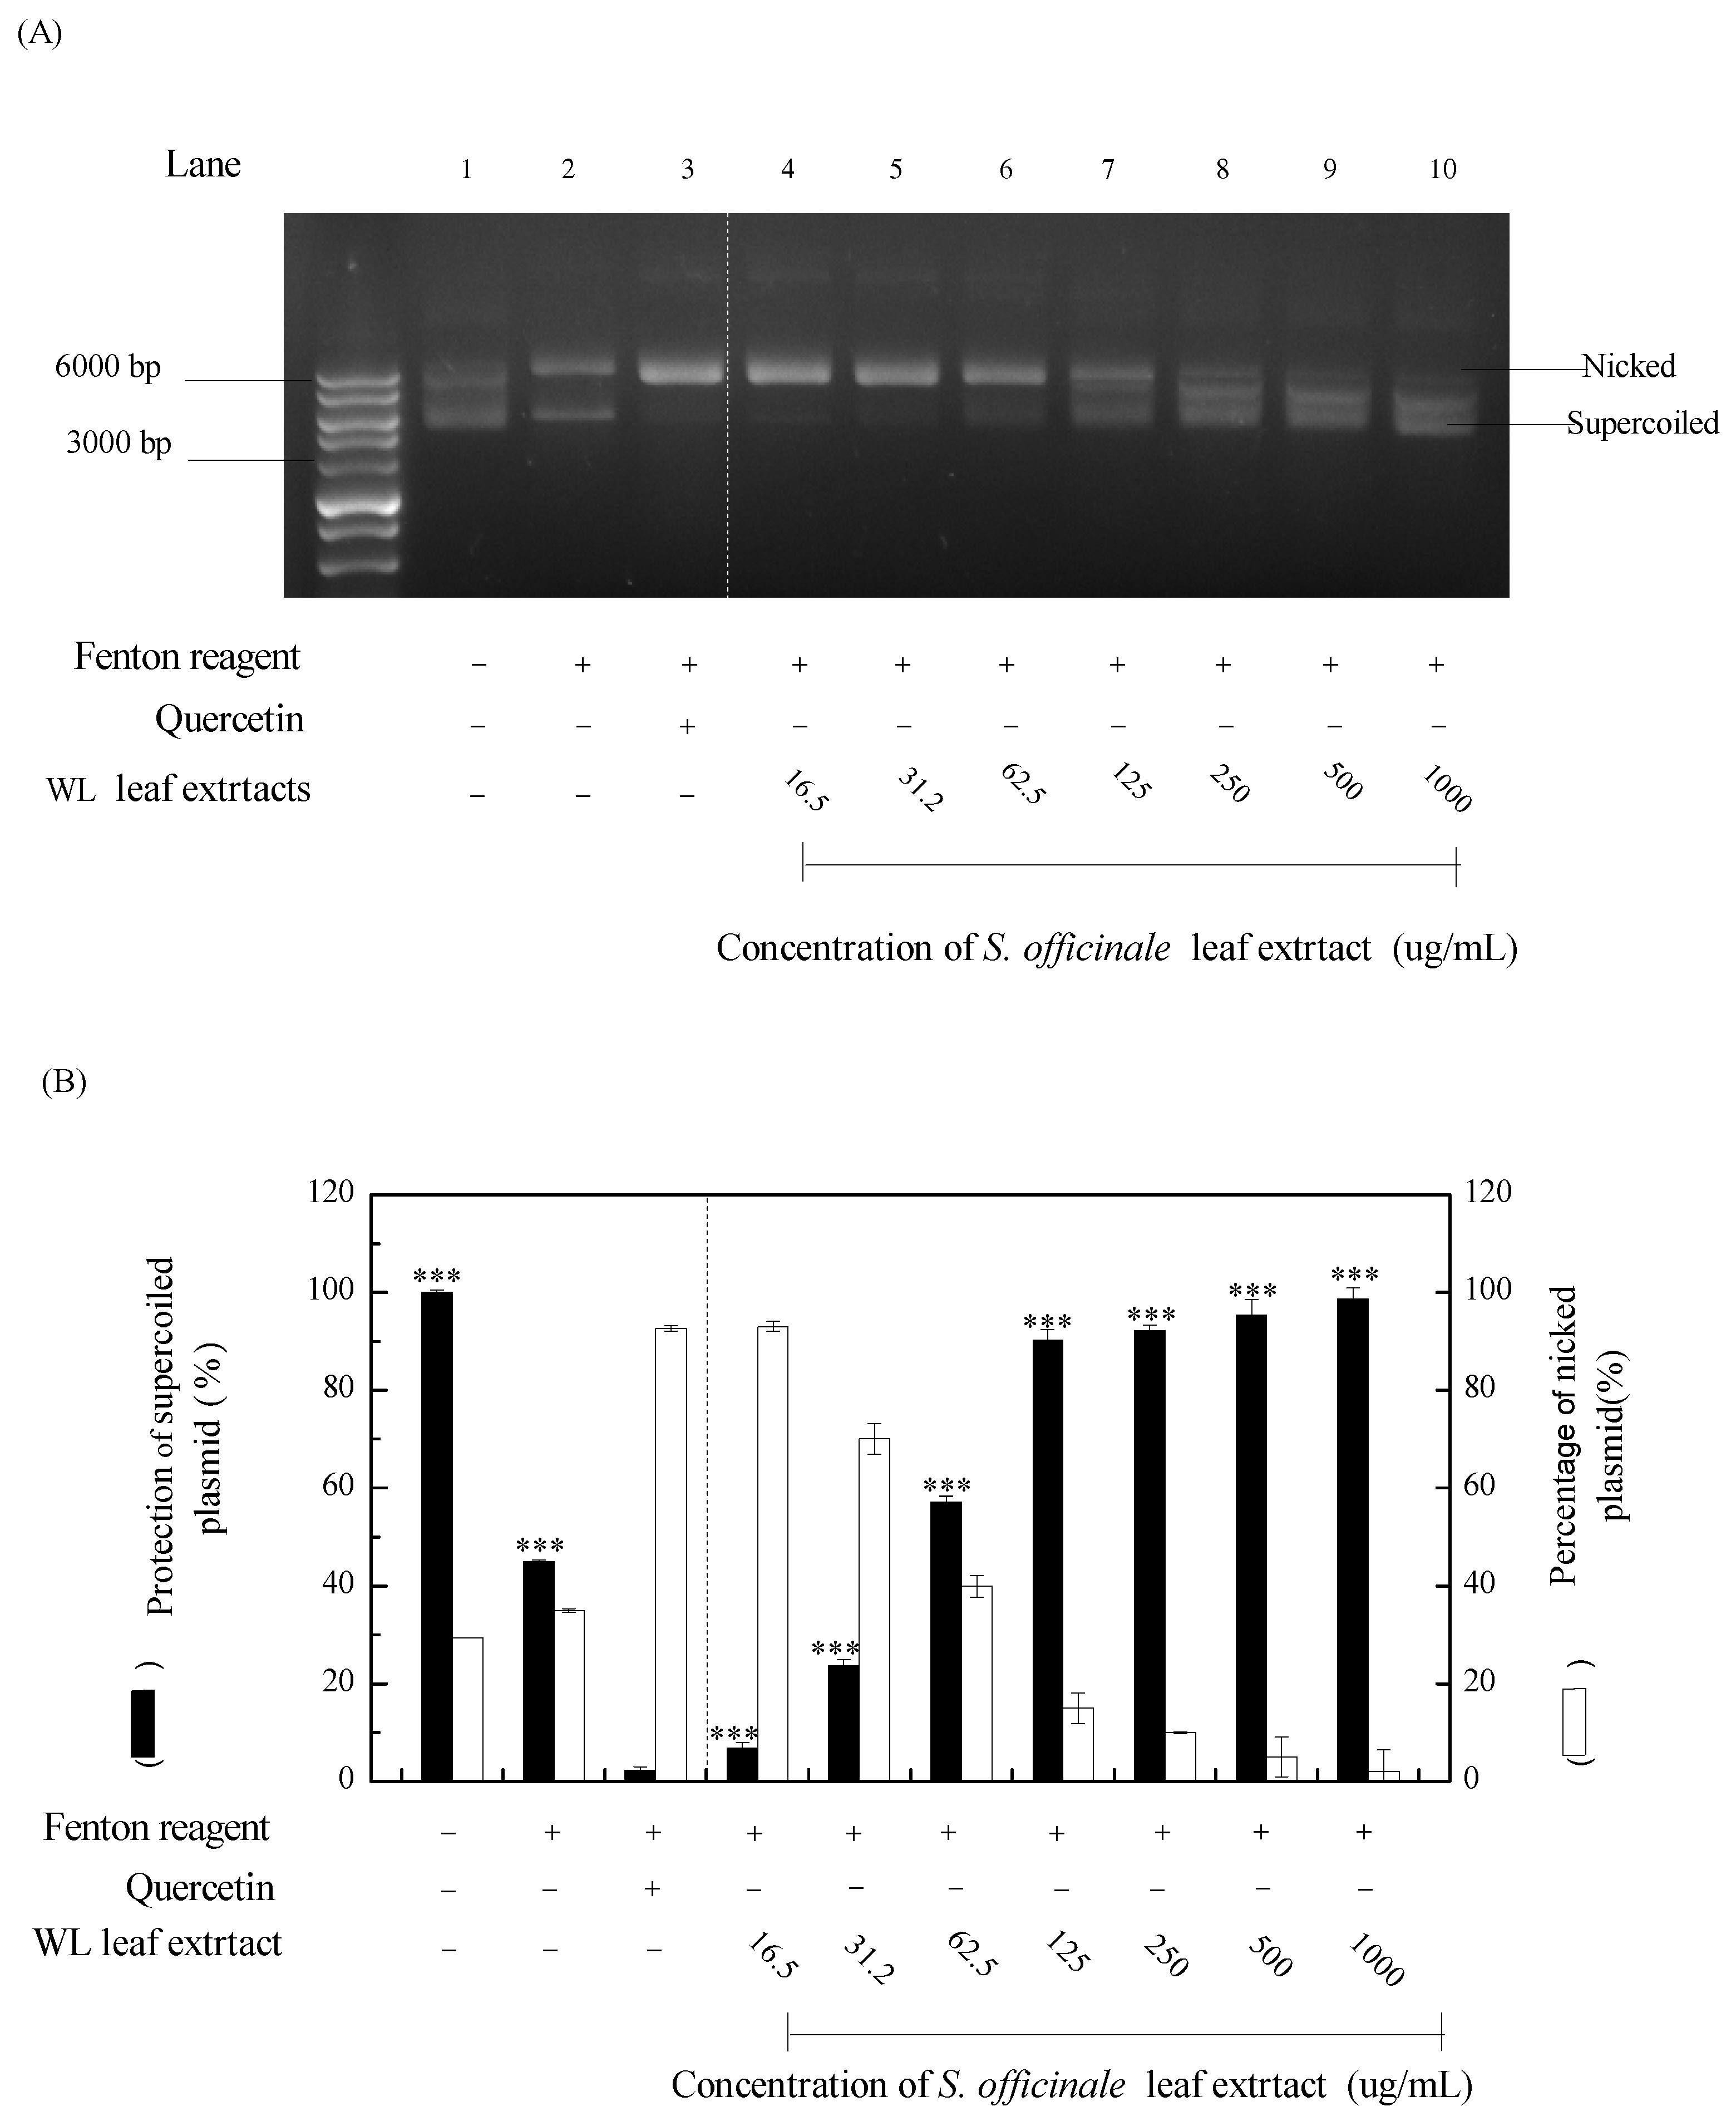
Reactive oxygen species are known to damage DNA and then cause human diseases or aging. DNA protective assay offers an in vitro model to sensitively determine the production of DNA damaging radicals [44]. In this experiment, Fenton reactions produced hydroxyl radicals that cleavage supercoiled plasmid DNA and then convert it to the nicked form, which shows decreased electrophoretic mobility [45,46]. By their relative electrophoretic mobility rates on agarose gel, supercoiled and nicked forms of plasmid were directly distinguished. Here, to evaluate the DNA protective activity of WLE, we incubated pCIneo DNA with the Fenton reactants with or without WLE. As shown in Figure 3(A), supercoiled DNA moved faster, and nicked DNA moved slower, respectively. Following treatments with WLE, as presented in Fig 3(A), WLE reduced DNA damage markedly at concentrations of 16.5–1000 μg/mL, with 25–94% protections of the supercoiled form, respectively (Figure 3(B), lanes 4–10). The DNA protection effects of WLE had reached the plateau in the concentration range of 125–1000 µg/mL. In contrast, quercetin effectively protected single-stranded nicked circular from oxidative fragmentation (lane 3) as reported [47]. The DNA protection effect of WLE is much higher than leaf extracts of Cinnamomum osmophloeum Kanehira and Vernonia amygdalina [48,49]. These are the first data to show a protective effect of comfrey extract on in vitro DNA damage by Fenton reactions. As a previous antioxidant capacity, the DNA protective effects of WLE are likely due to the presence of phenolic and flavonoid compounds.

3.5. Composition analysis of WLE

Root extracts are the most frequently investigated constituents for comfrey. Root extracts contain many active ingredients such as allantoin, RA, caffeic acid, and salvianolic acids [50]. However, it is less explored in the leaf part. Literature suggests that rosmarinic acid, p-Hydroxybenzoic acid, caffeic acid, and chlorogenic acid are present in the leaf, stem, and root extracts of S. officinal and S. cordatum [23].
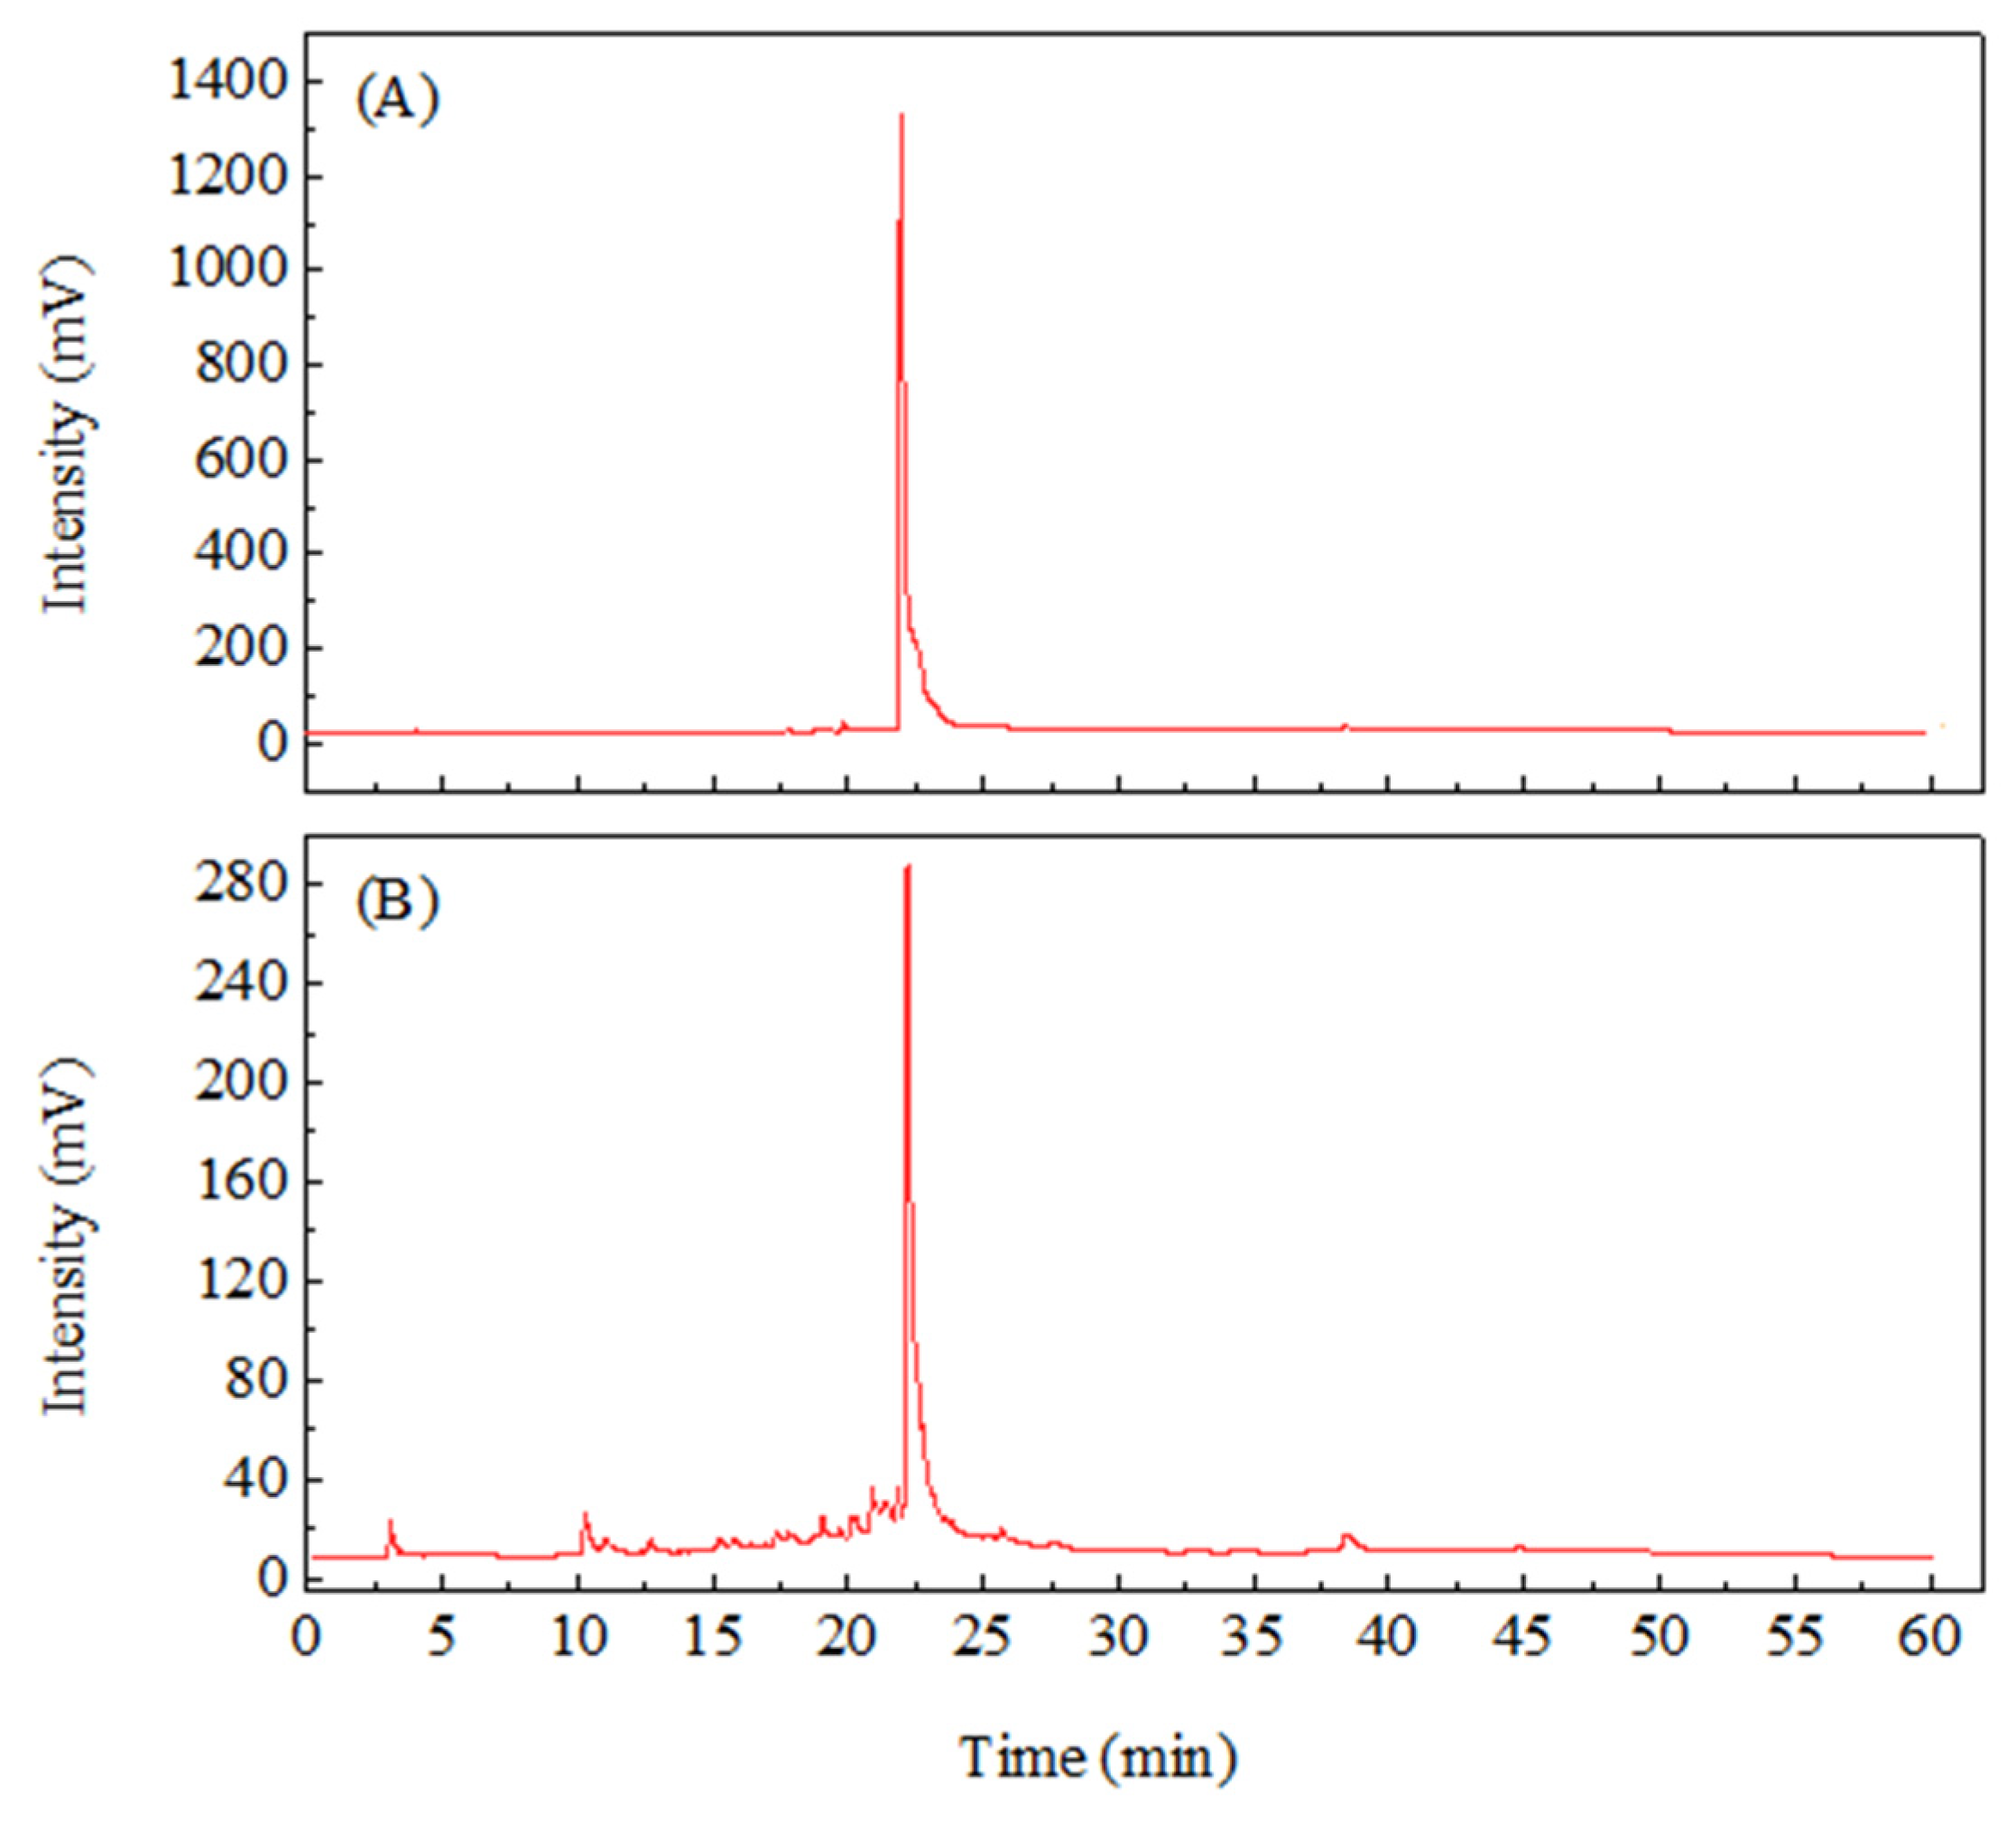
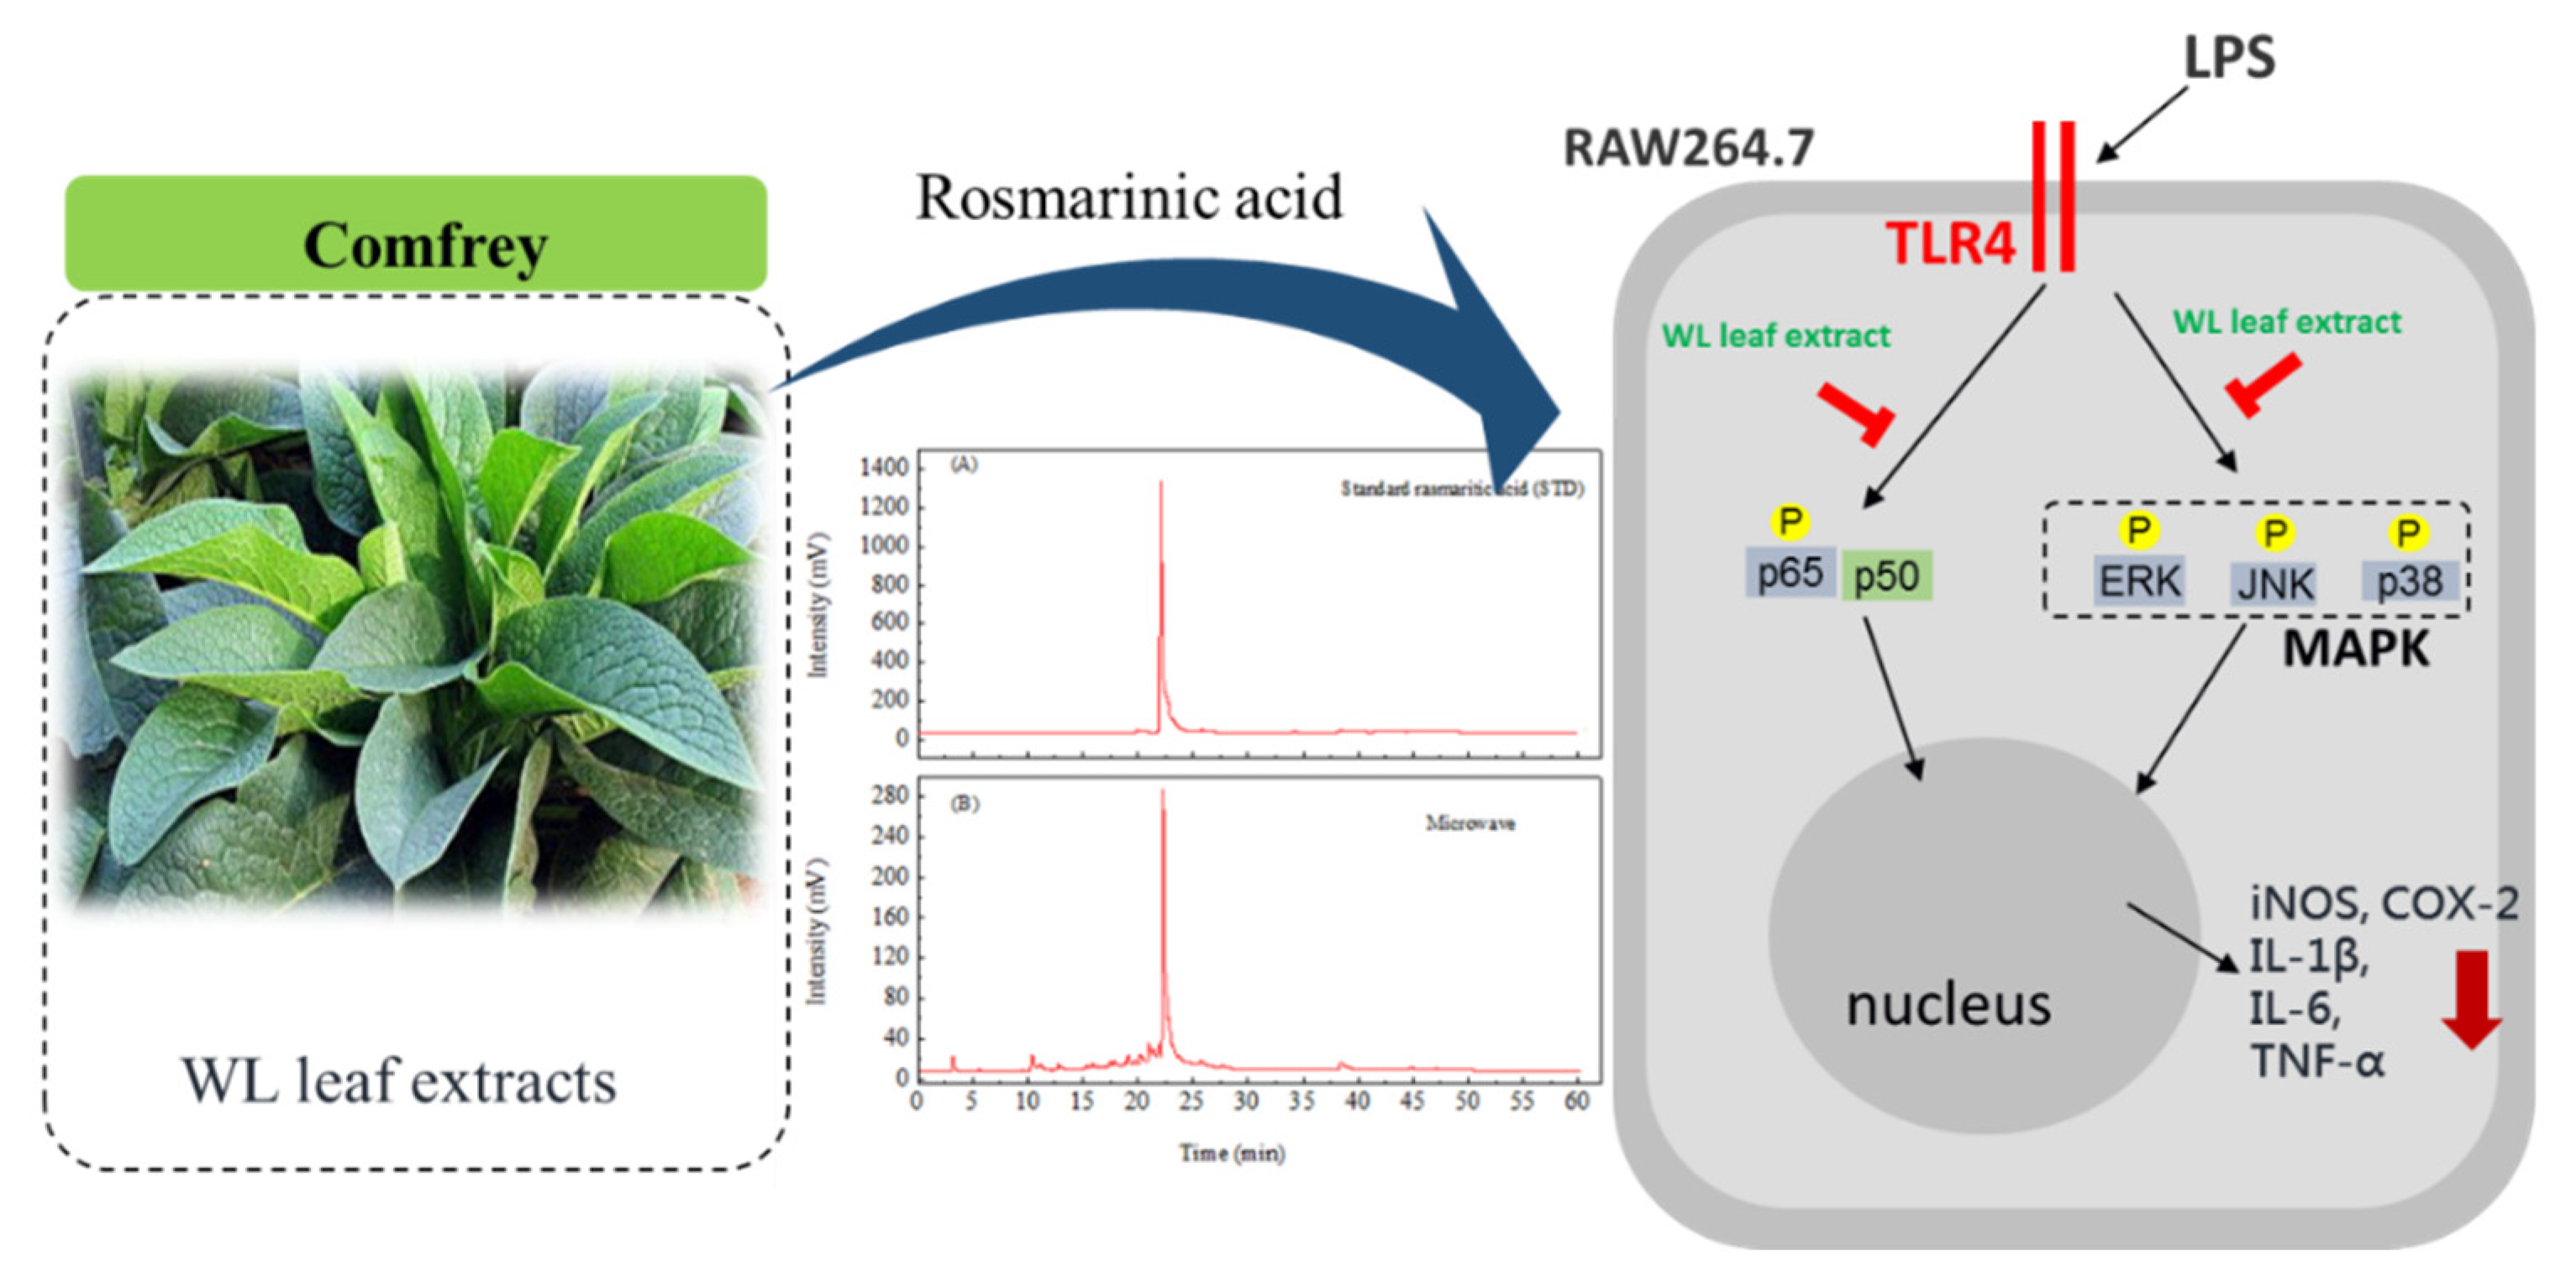
In order to identify the major components in WLE, 4000 µg/mL WLE was prepared and analyzed by HPLC for its major components. The HPLC analysis was carried out under the same conditions using RA as a standard. The HPLC profile of RA was shown in Figure 4(A); the HPLC profile of WLE was shown in Figure 4(B). The results showed that RA was the main component of WLE. The quantification of RA in WLE was calculated by the standard curve obtained from HPLC profiles with different concentrations of RA. The RA concentration in WLE was 33 mg/g. A previous study used ethanol to extract the roots of comfrey and analyzed the polyphenols in the extract, which showed that RA is the major polyphenol in comfrey root extract with the highest concentration of 1.85 mg/g [6]. Comfrey root extract using 65% ethanol showed that the major polyphenolic constituents were RA and salvianolic acid, in which RA had the highest content of 7.557 mg/g [11]. In this study, we used MAE to obtain WLE, which yielded high content of total phenols and total flavonoids. We found that RA was the main polyphenol in WLE, and the RA concentration in WLE was the highest among all published comfrey extracts.

3.6. Anti-inflammatory effects of WLE

Comfrey has been used in traditional medicine for its anti-inflammatory activity. Its active ingredients, such as allantoin, polyphenols, flavonoids, and alkaloids, can act on several intentions in the signaling pathways, constraining pro-inflammatory enzymes, and reducing the construction of inflammatory chemokines and cytokines, which afterward suppresses inflammation procedures [3].
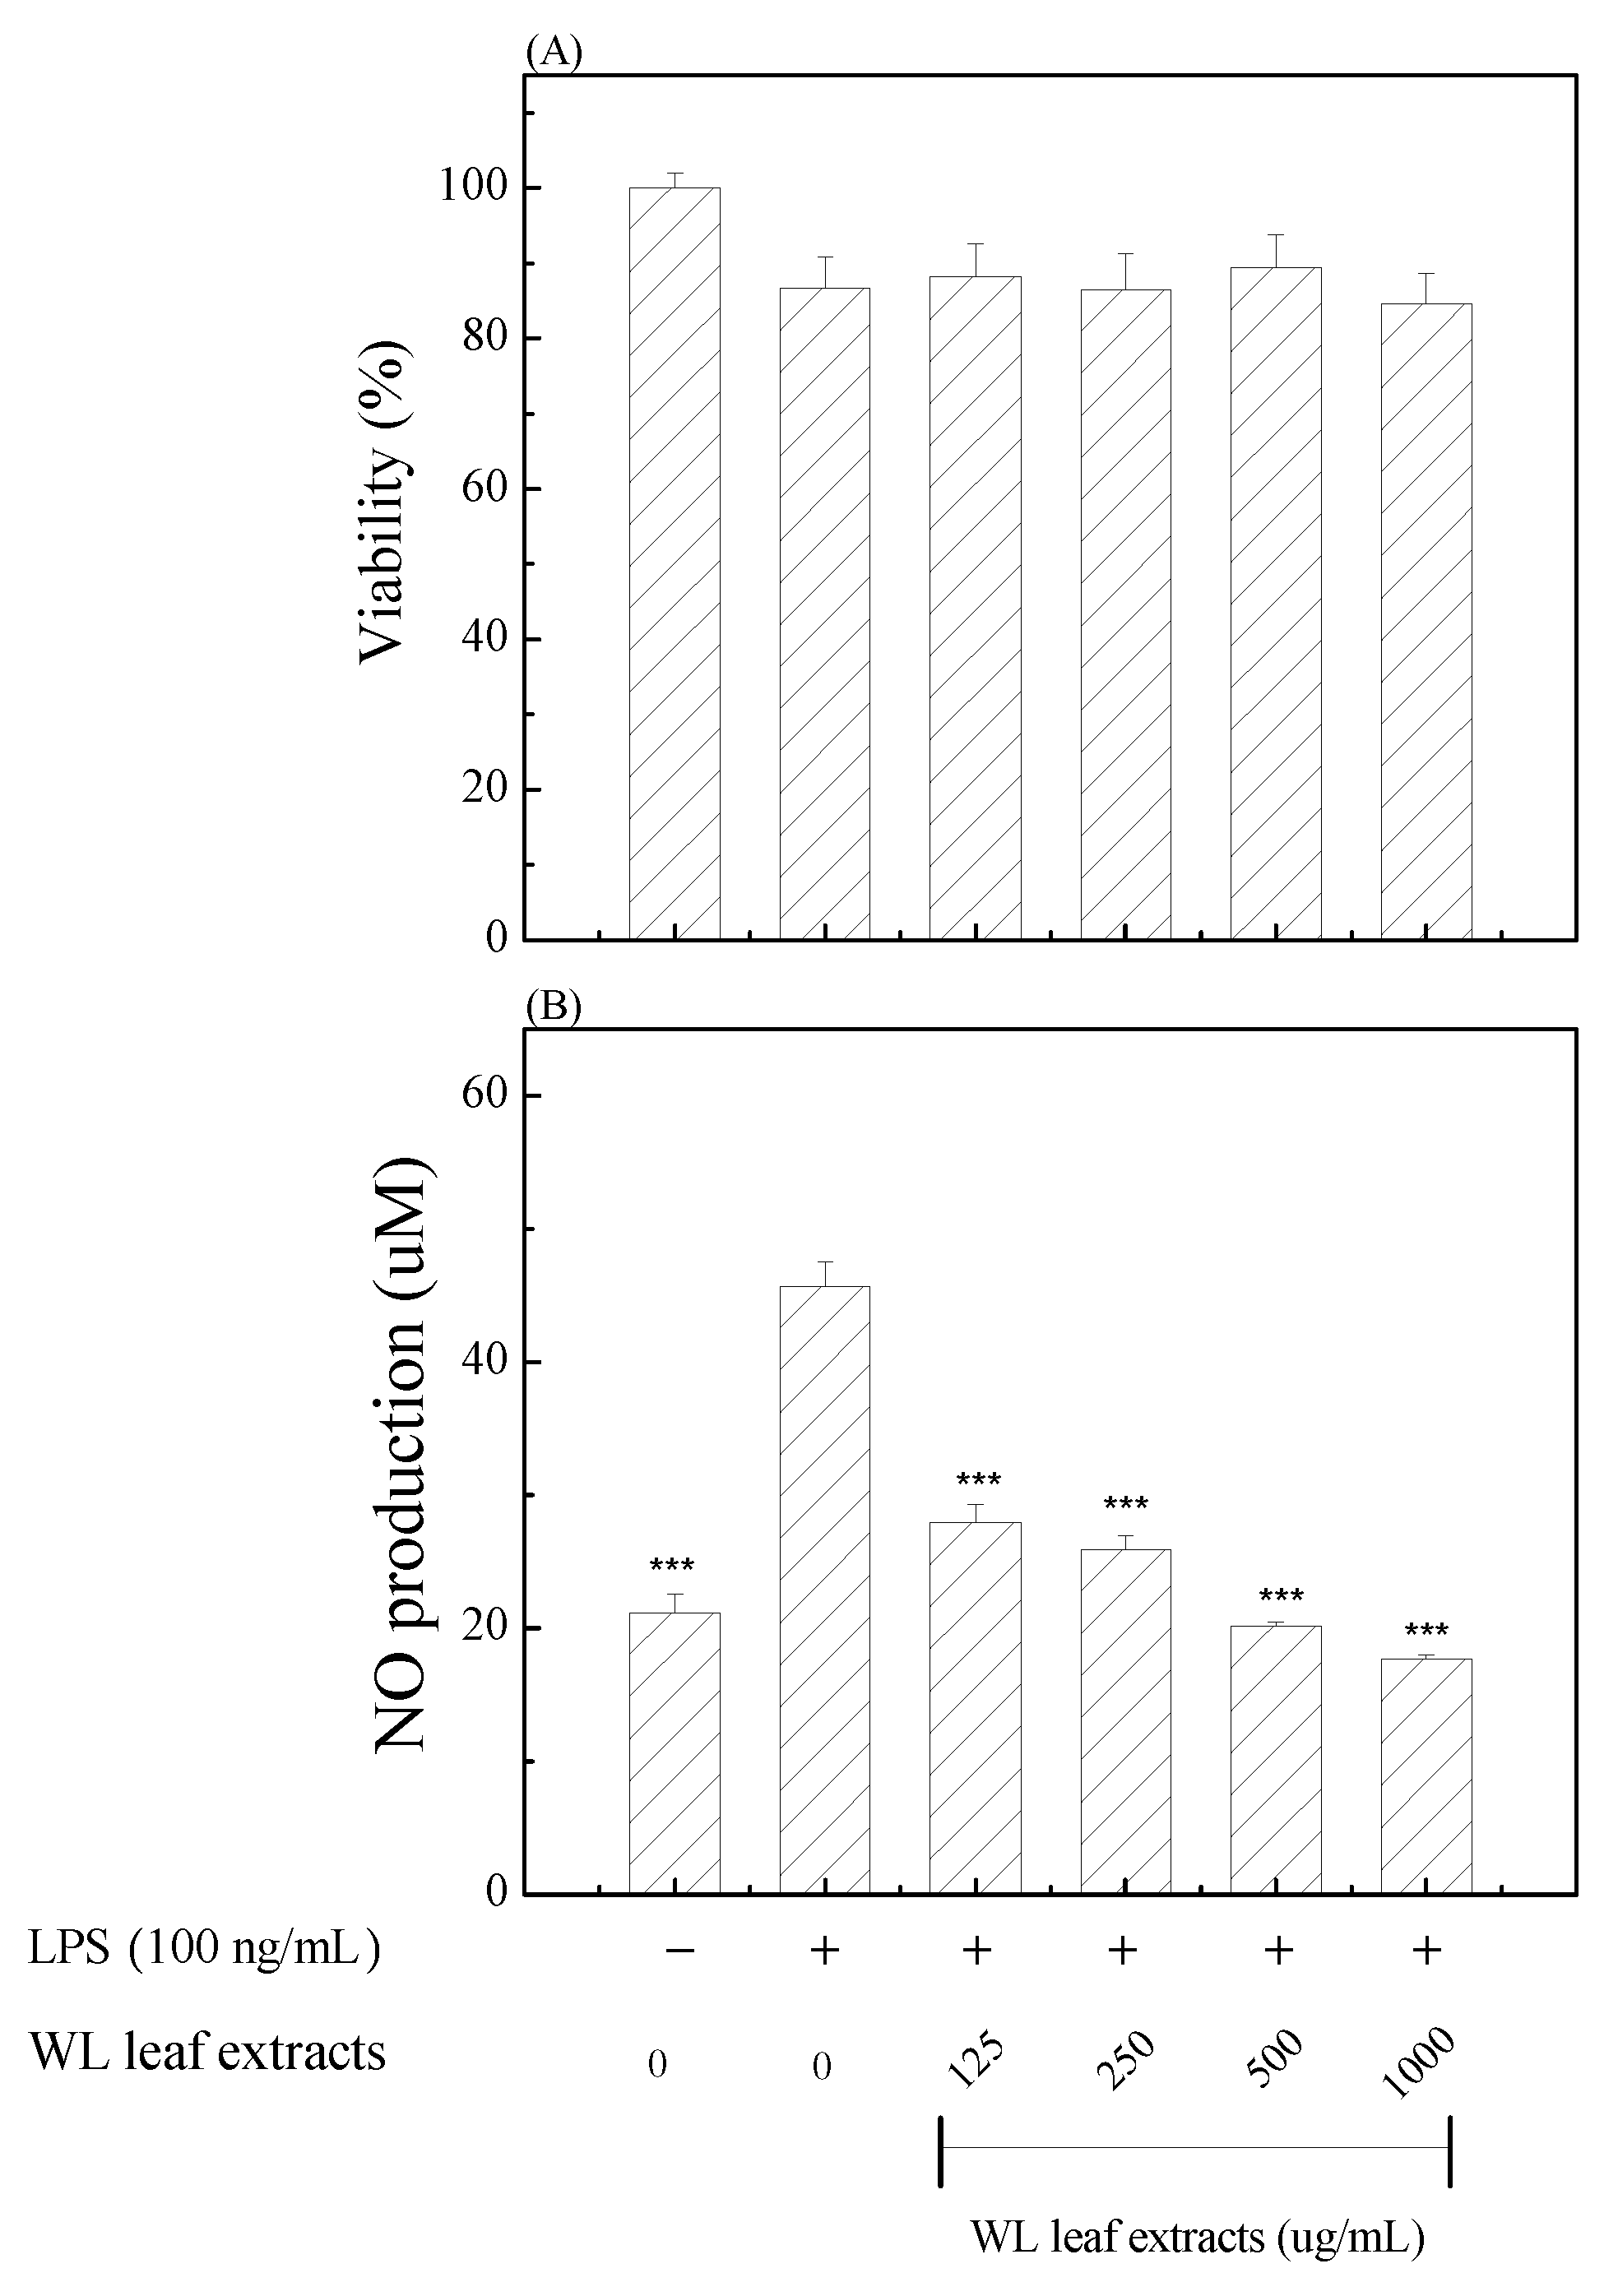
To decipher the anti-inflammatory activity and possible mechanism(s) of WLE, we used the common inflammatory cell model of LPS-stimulated RAW 264.7 macrophages. First, we investigated the cytotoxicity of various concentrations of WLE by MTT assay. Results of Figure 5(A) showed that concentrations of WLE lower than 1000 μg/mL had no significant effect on RAW 264.7 cell viability. To demonstrate the anti-inflammatory activity of WLE, first of all, we analyzed the LPS-stimulated NO (nitrite) production. Treatments with WLE inhibited LPS-induced NO productions in a dose-dependent manner in RAW 264.7 macrophages (Figure 5(B)). Concentrations of WLE higher than 125 μg/mL showed significant inhibitory effects on LPS-induced NO production.
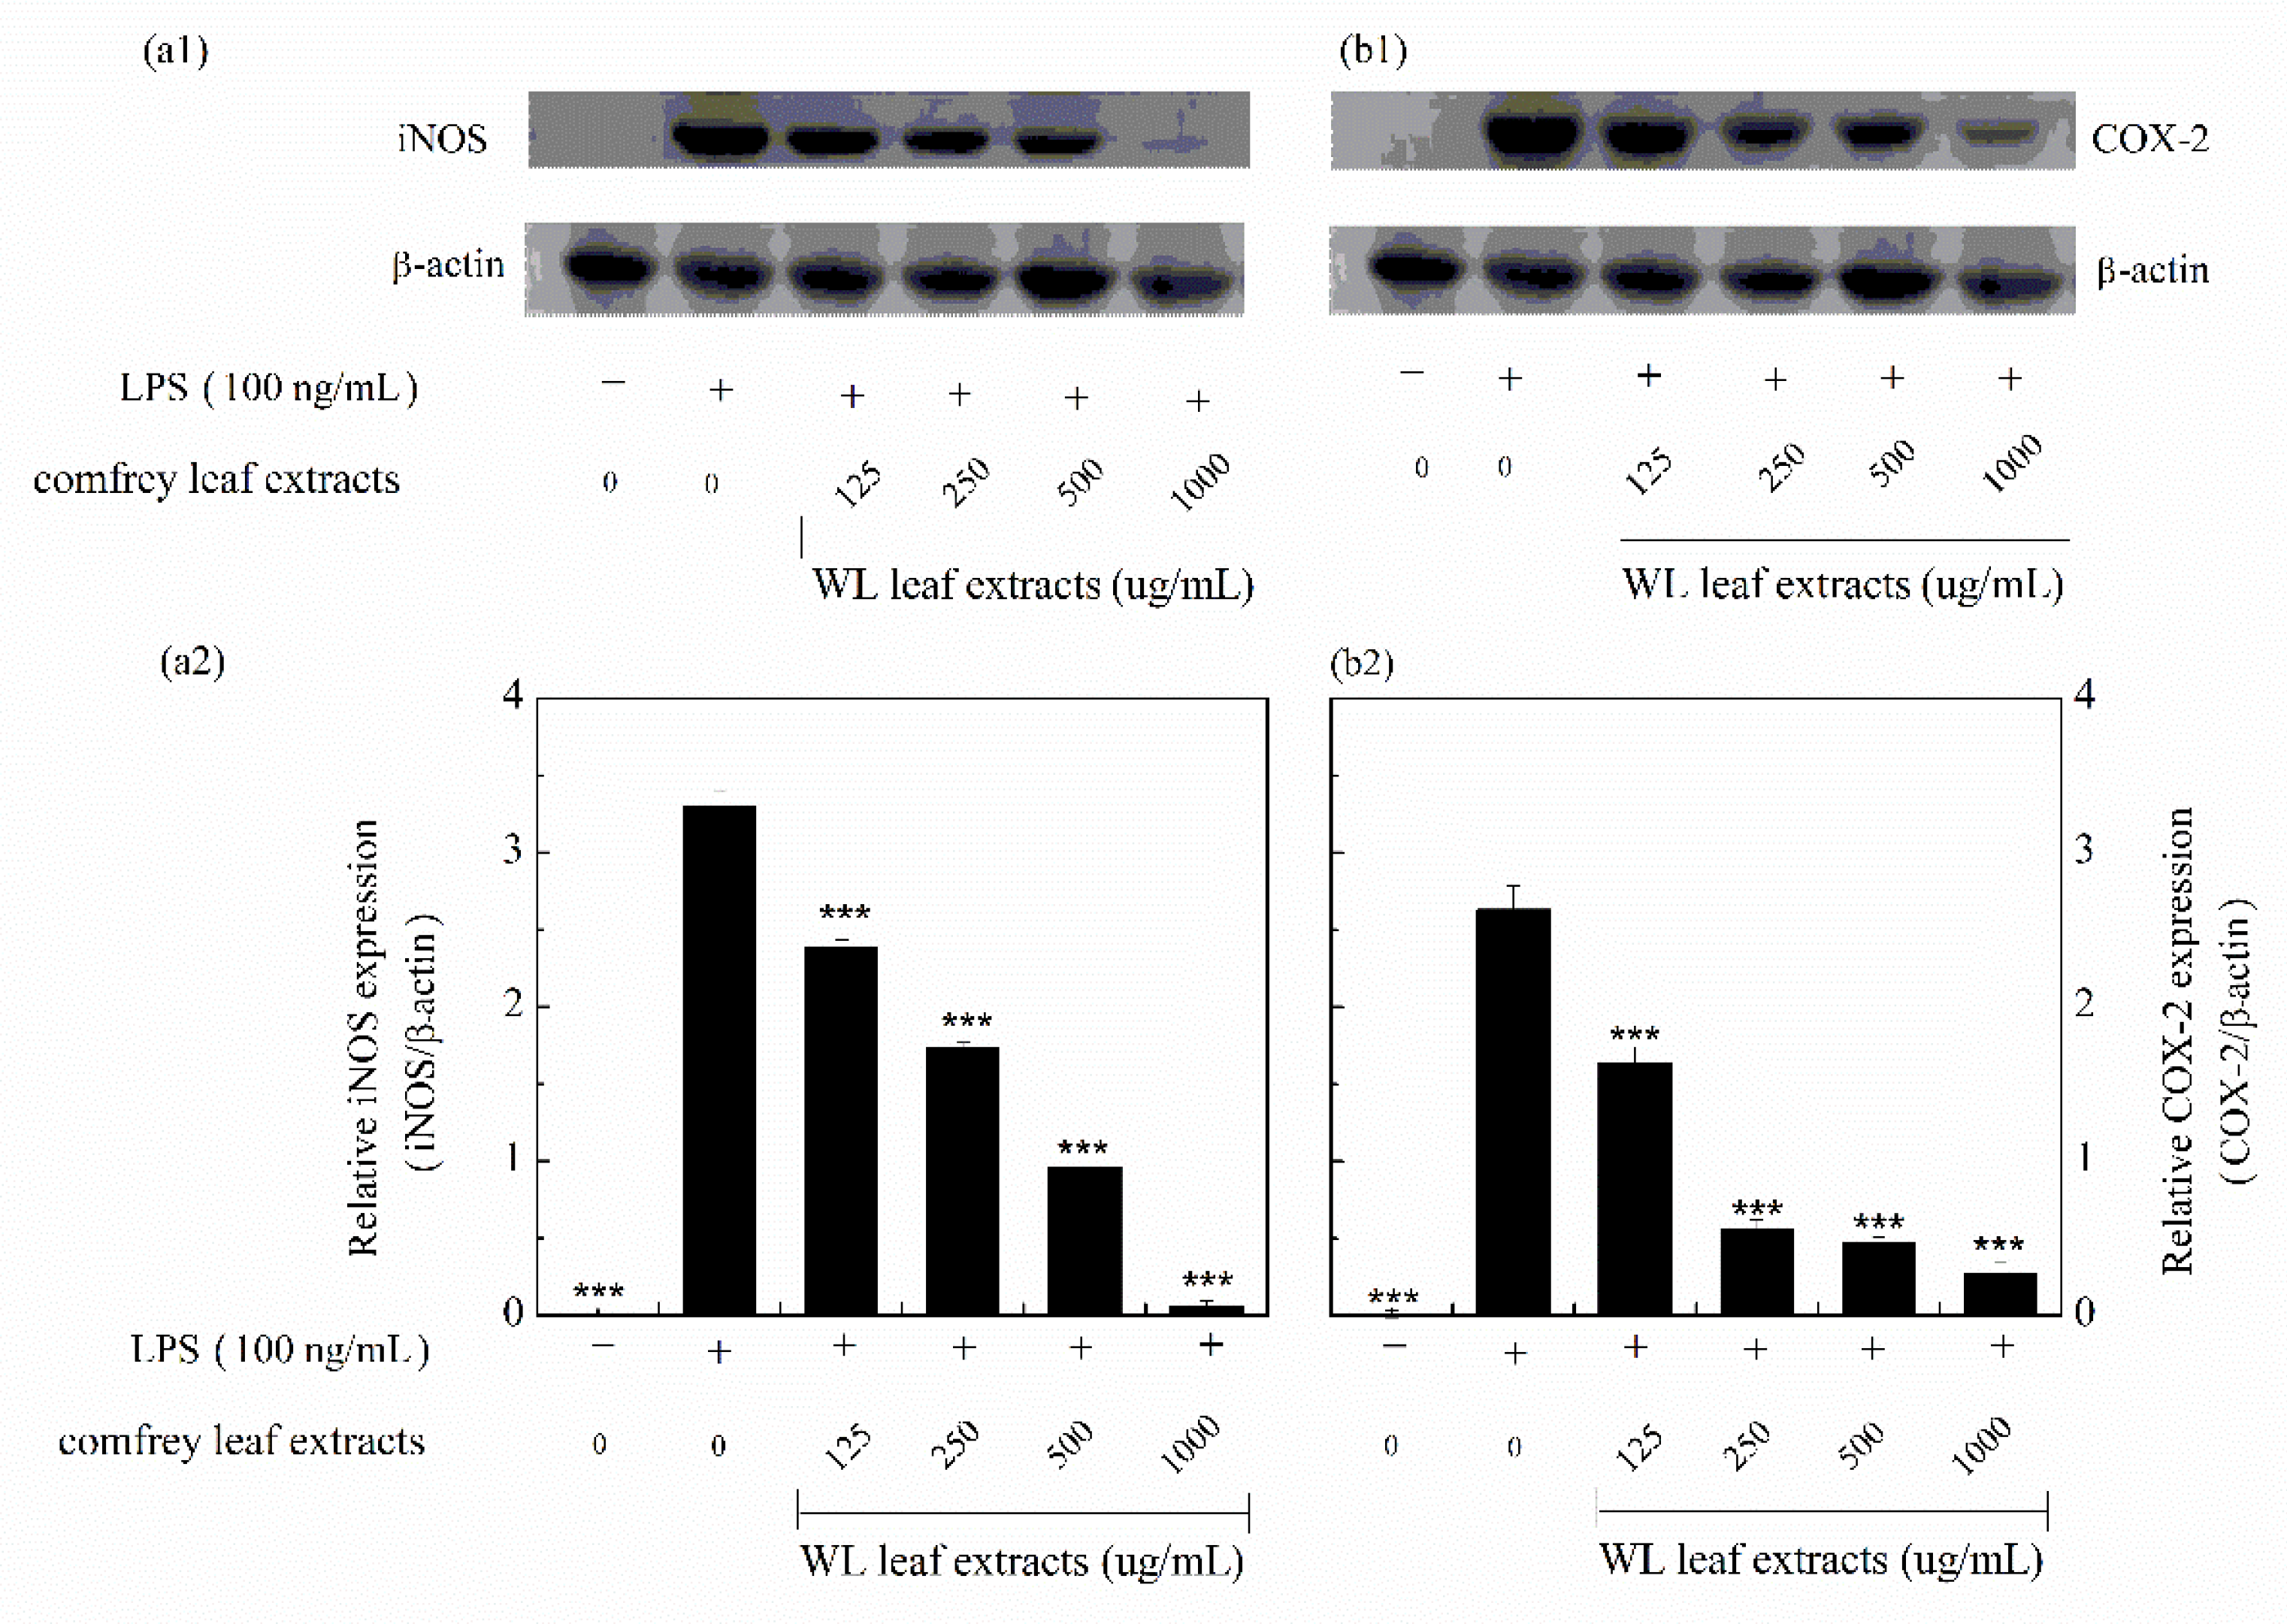
The iNOS and COX-2 are both important enzymes that mediate the inflammatory process. Inappropriate up-regulation of iNOS and COX-2 expression could lead to inflammatory diseases or even neoplastic disorders [51]. Next, we analyzed the effects of WLE on LPS-stimulated iNOS and COX-2 expressions by Western blotting. The WLE showed dose-dependent inhibitions of LPS-induced iNOS (Figure 6(a1, a2)) and COX-2 (Figure 6(b1, b2)) productions. In combination with Figure 5(B) and Figure 6(a1, a2), these results indicated that the inhibition of NO production by WLE might result from the inhibition of iNOS expression.
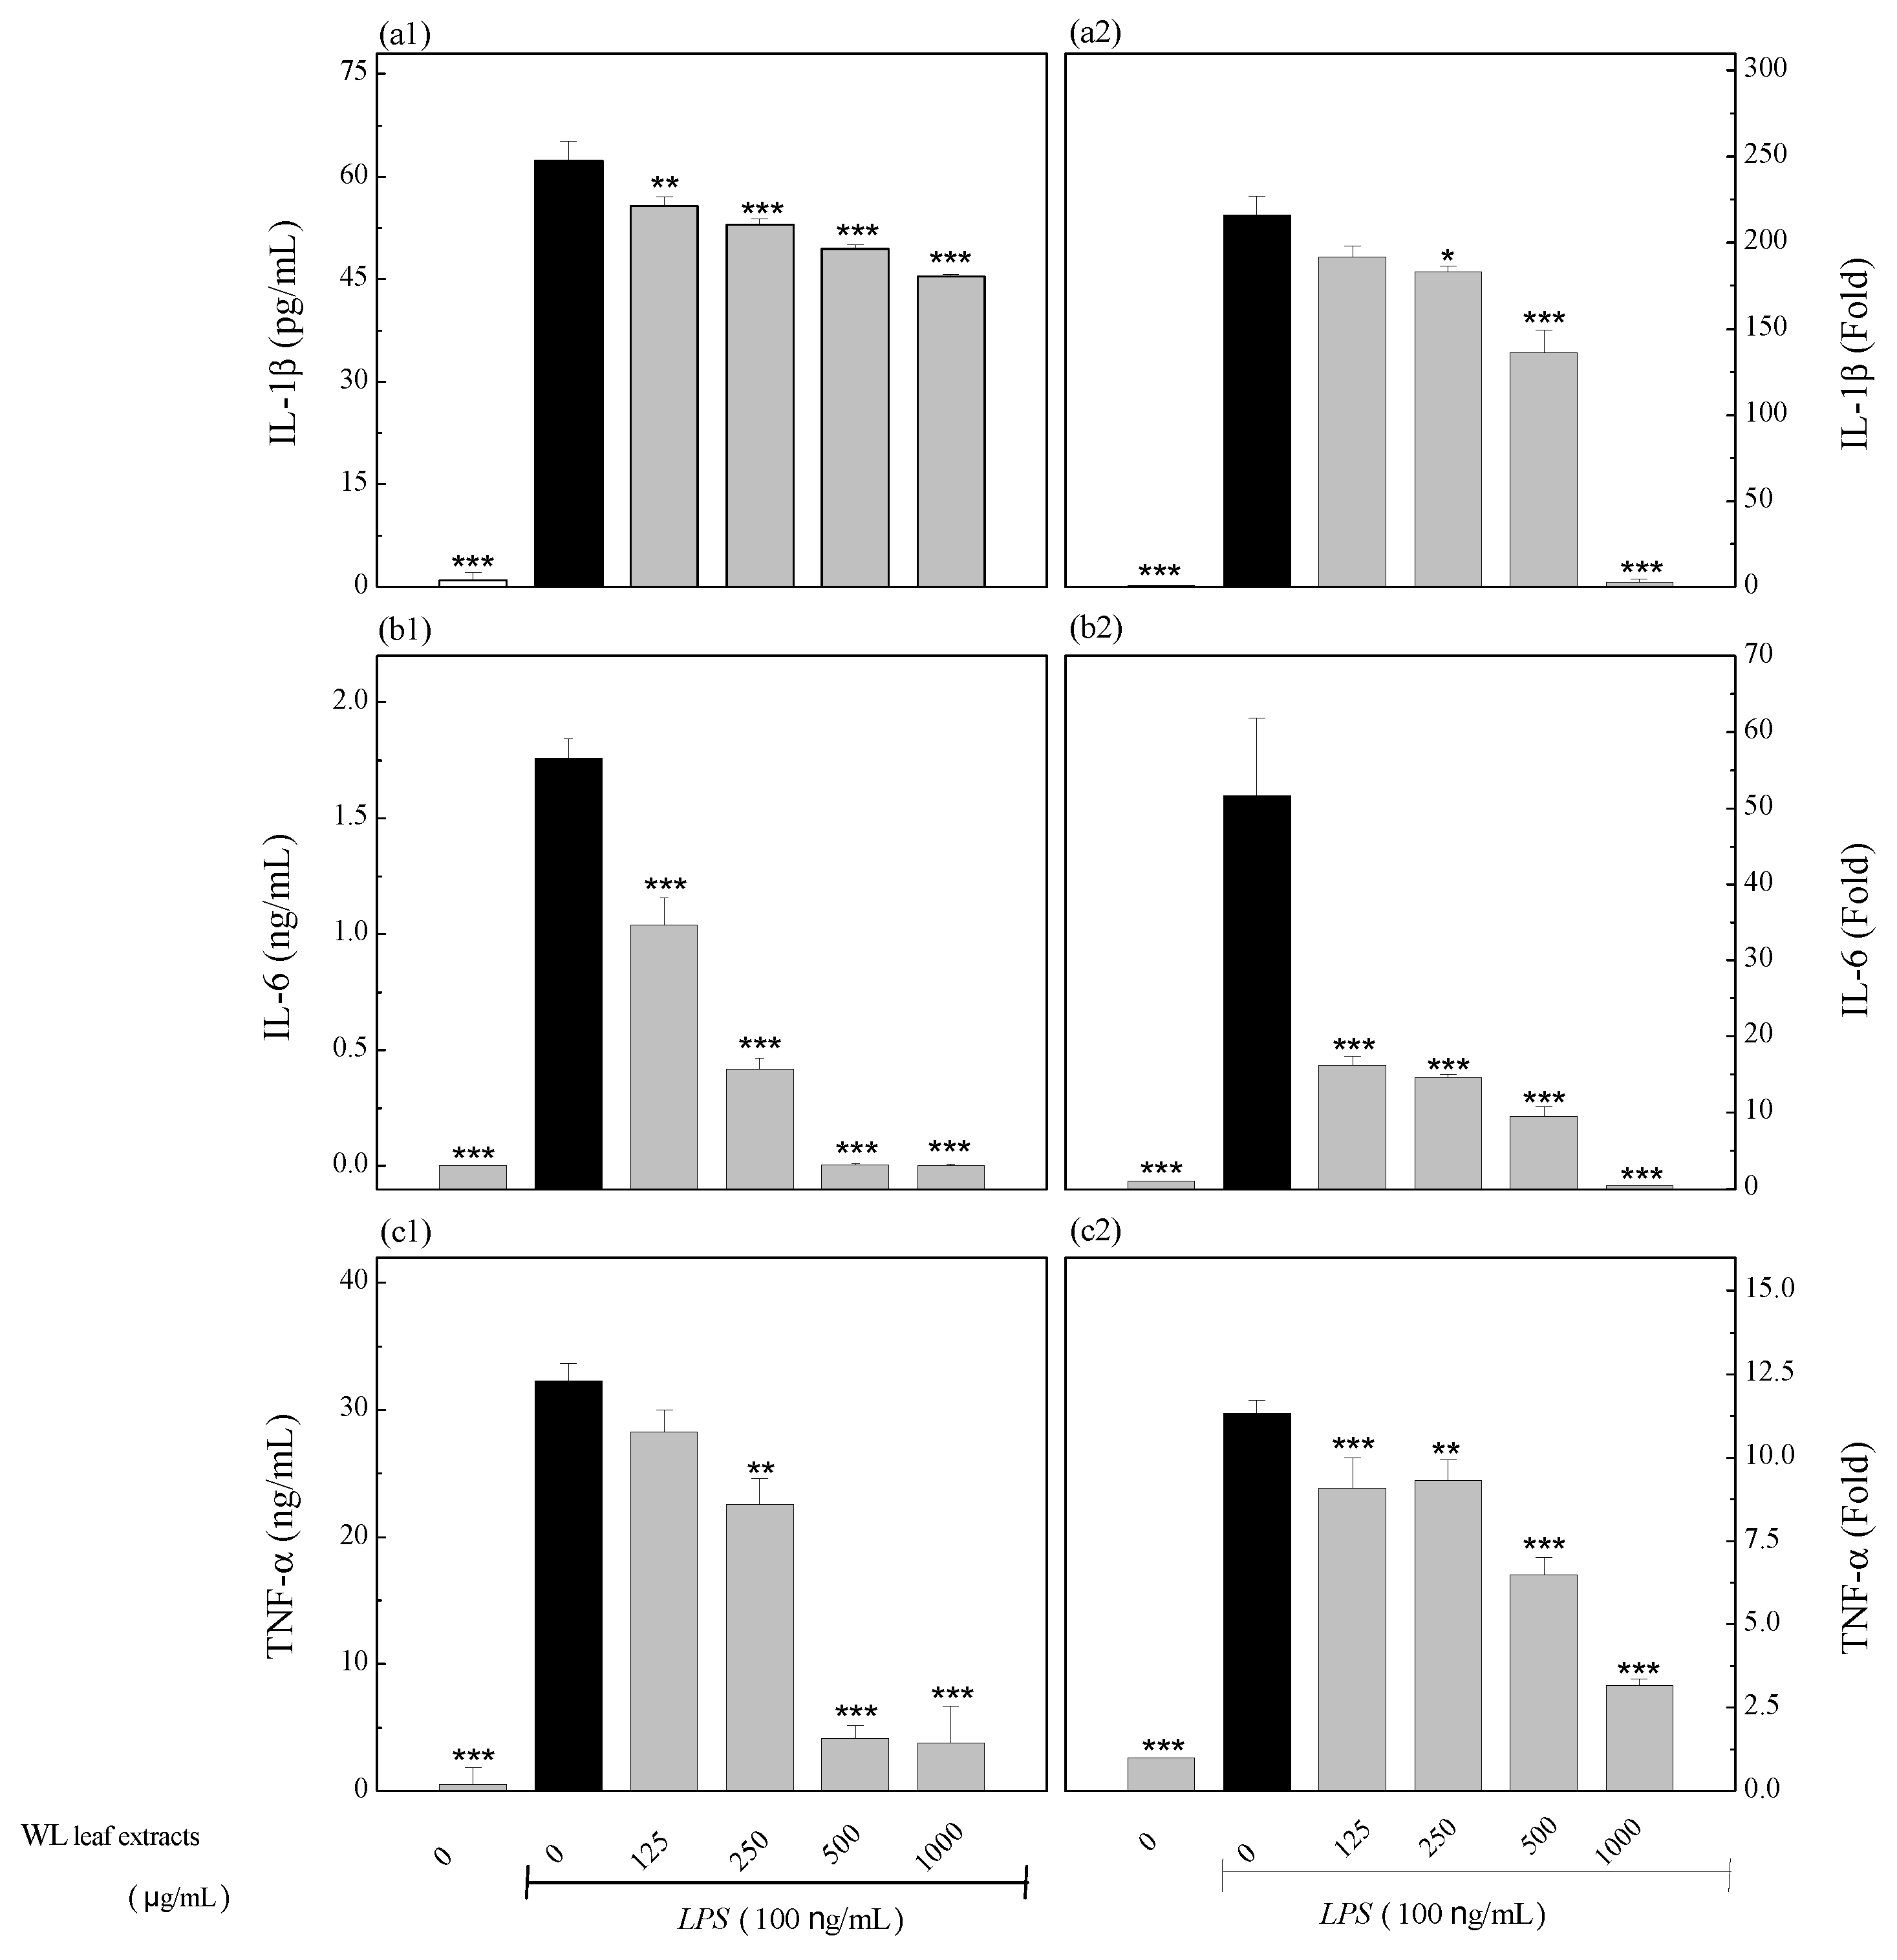
IL-1β, IL-6, and TNF-α are potent pro-inflammatory factors that regulate the release of many inflammatory cytokines and immune cell activation [52]. To further explore the molecular mechanisms of WLE in LPS-stimulated macrophages, the effects of different concentrations of WLE on LPS-induced pro-inflammatory cytokines including IL-1β, IL-6, and TNF-α were investigated. The relative mRNA levels and protein expression concentrations of these pro-inflammatory cytokines were shown (Figure 7). Results demonstrated that WLE significantly reduced LPS-induced IL-1β (a1), IL-6 (b1), and TNF-α (c1) protein concentrations, all in a dose-dependent manner. Similarly, WLE also significantly reduced LPS-induced IL-1β (a2), IL-6 (b2), and TNF-α (c2) mRNA expressions in a dose-dependent manner. The inhibitions of mRNA levels and protein concentrations of these pro-inflammatory cytokines were positively correlated. At 125 μg/mL, WLE was the most effective in inhibiting LPS-induced IL-6 mRNA and protein expressions.
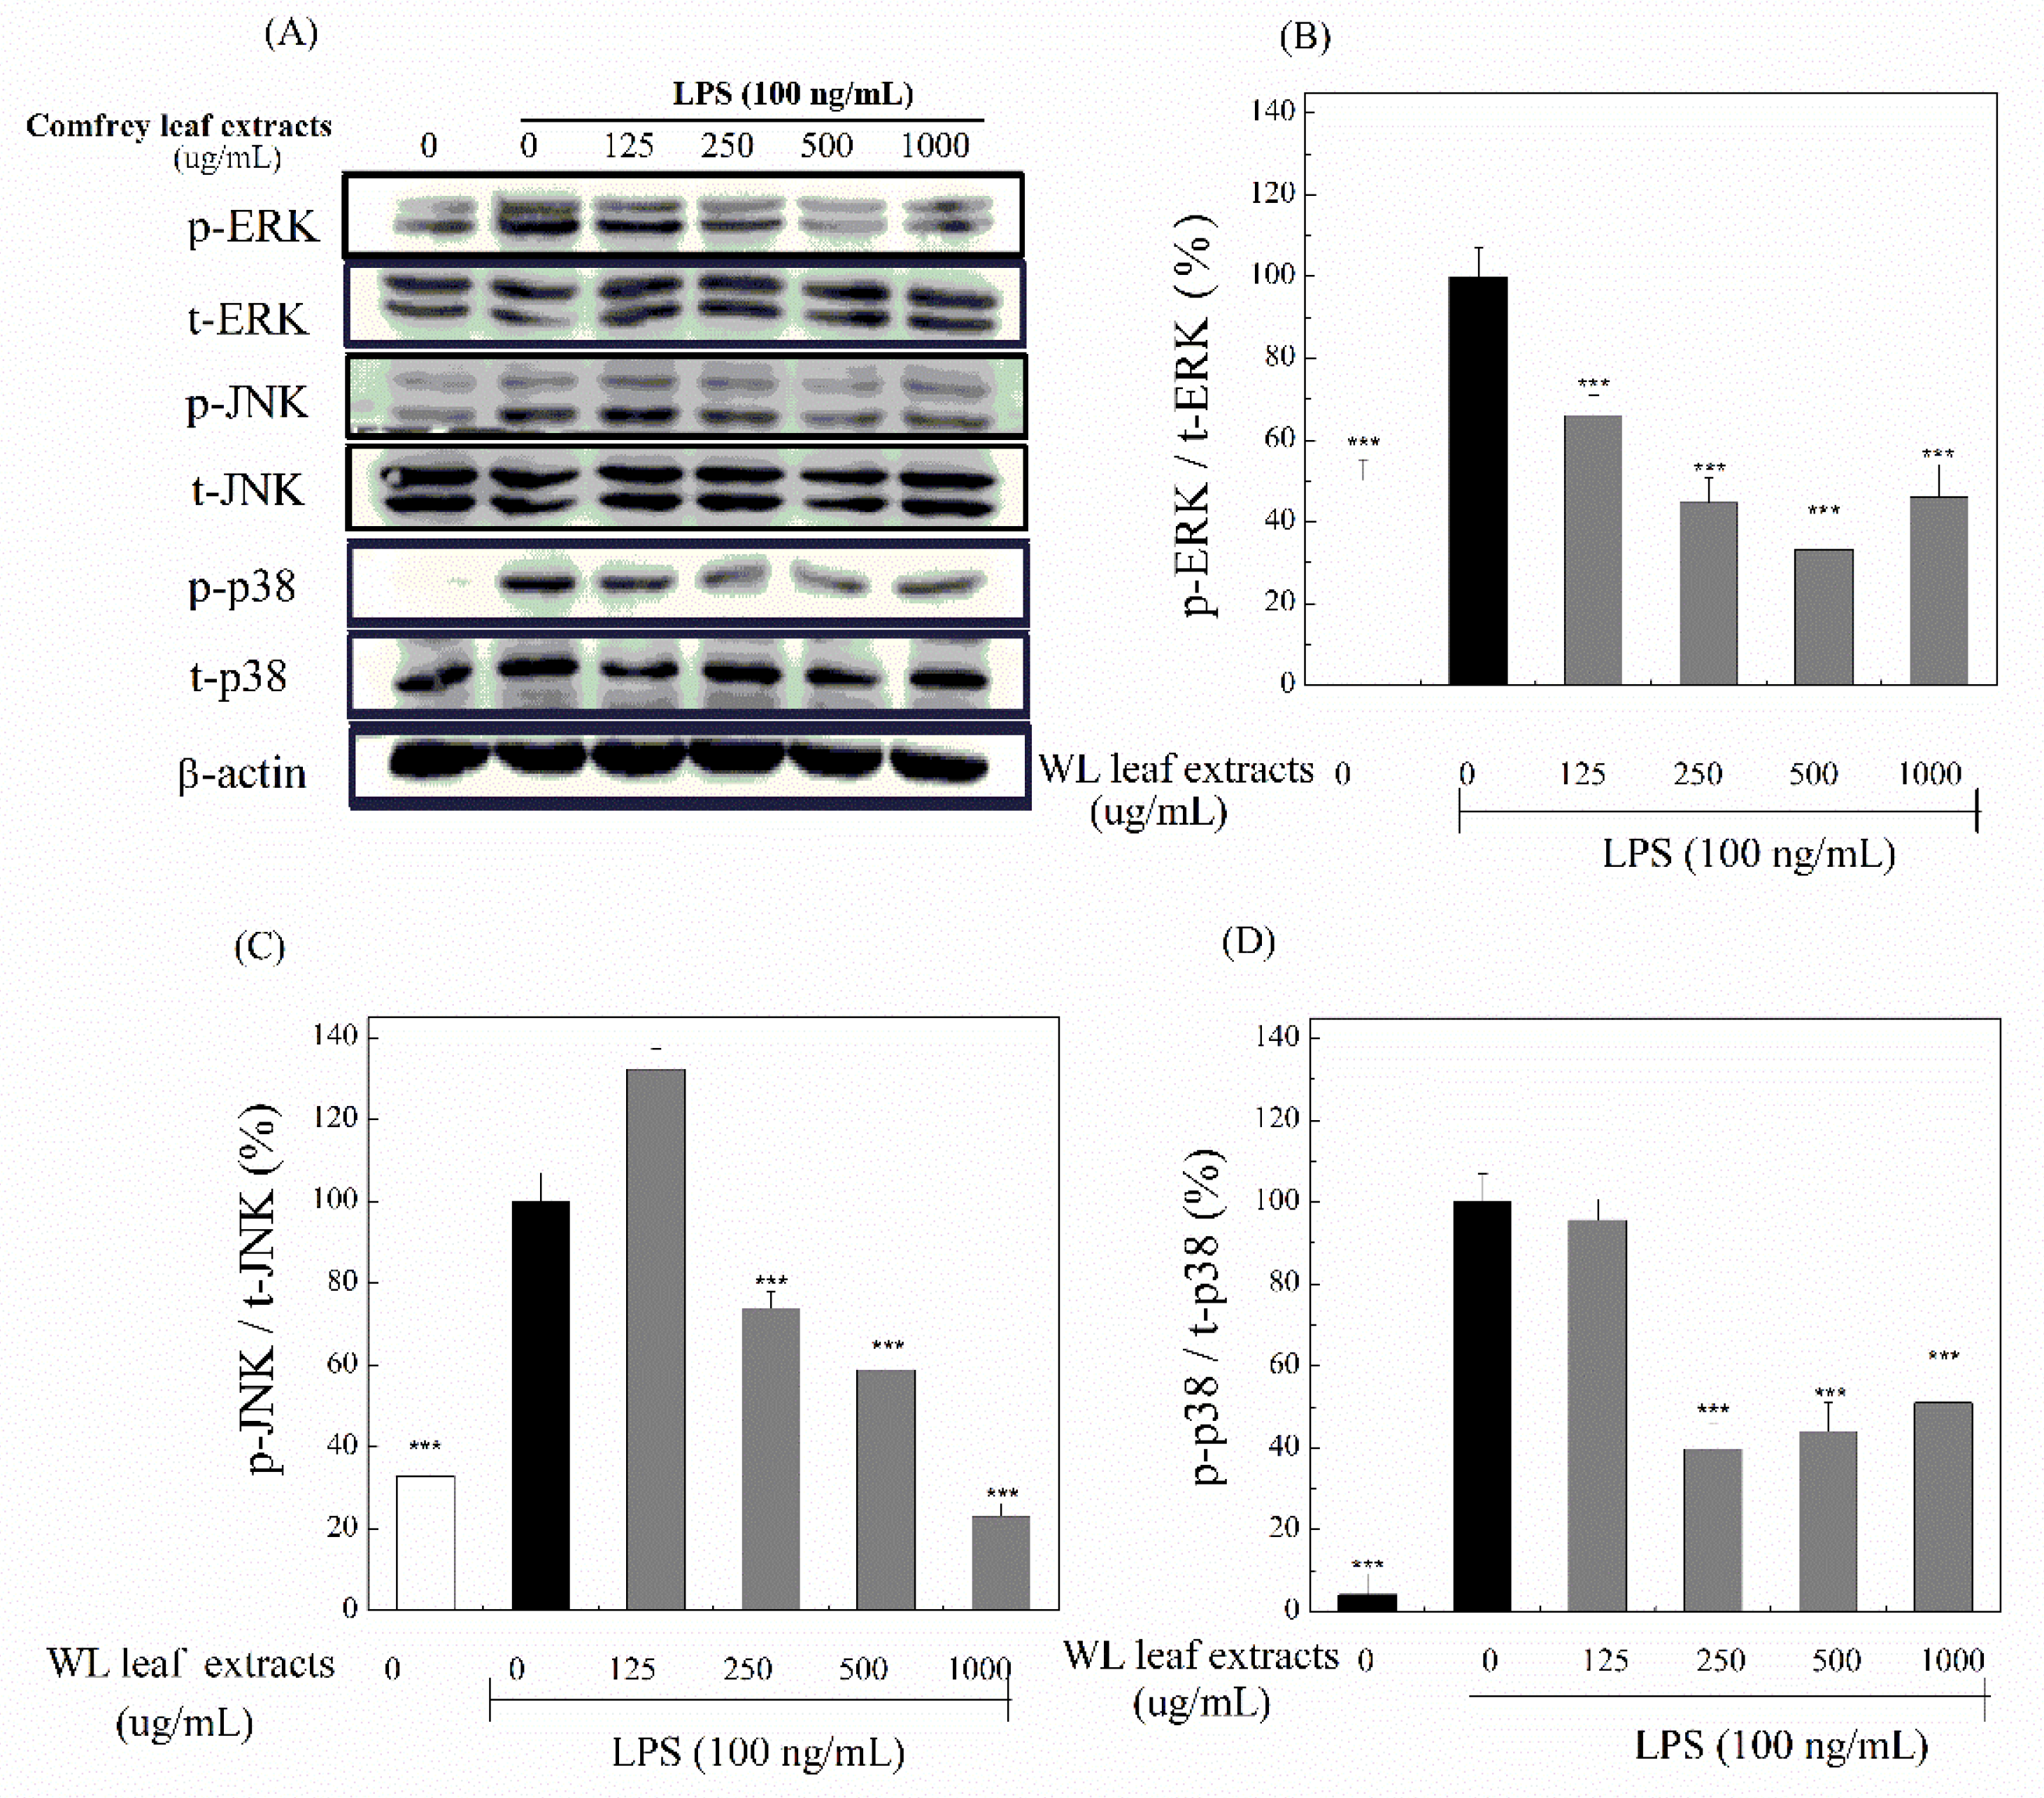
To decipher the signaling pathway(s) involved in WLE suppressing LPS-induced inflammation, we evaluated the effects of WLE on the MAPK signaling pathway, including ERK, JNK, and p38. When activated, phosphate groups were added on ERK, JNK, and p38. Expression levels of phospho-ERK (p-ERK), total ERK (t-ERK), phospho-JNK (p-JNK), total JNK (t-JNK), phospho-p38 (p-p38), and total p38 (t-p38) were obtained by Western blotting (Figure 8(A)). Ratios in percentages of p-ERK to t-ERK (Figure 8(B)), p-JNK to t-JNK (Figure 8(C)), and p-p38 to t-p38 (Figure 8(D)) were shown. These results indicated that LPS treatments significantly increased all ratios of p-ERK to t-ERK, p-JNK to t-JNK, and p-p38 to t-p38. The WLE significantly reduced LPS-induced p-p38 to t-p38 ratios at concentrations of 125–1000 μg/mL. However, only higher concentrations (≥ 250 μg/mL) of WLE showed significant inhibitory effects on ratios of p-ERK to t-ERK and p-JNK to t-JNK. Thus, p38 was more reactive than ERK and JNK by WLE. From the results of Figure 8, we identified that WLE suppressed LPS-induced inflammation through the MAPK signaling pathway.
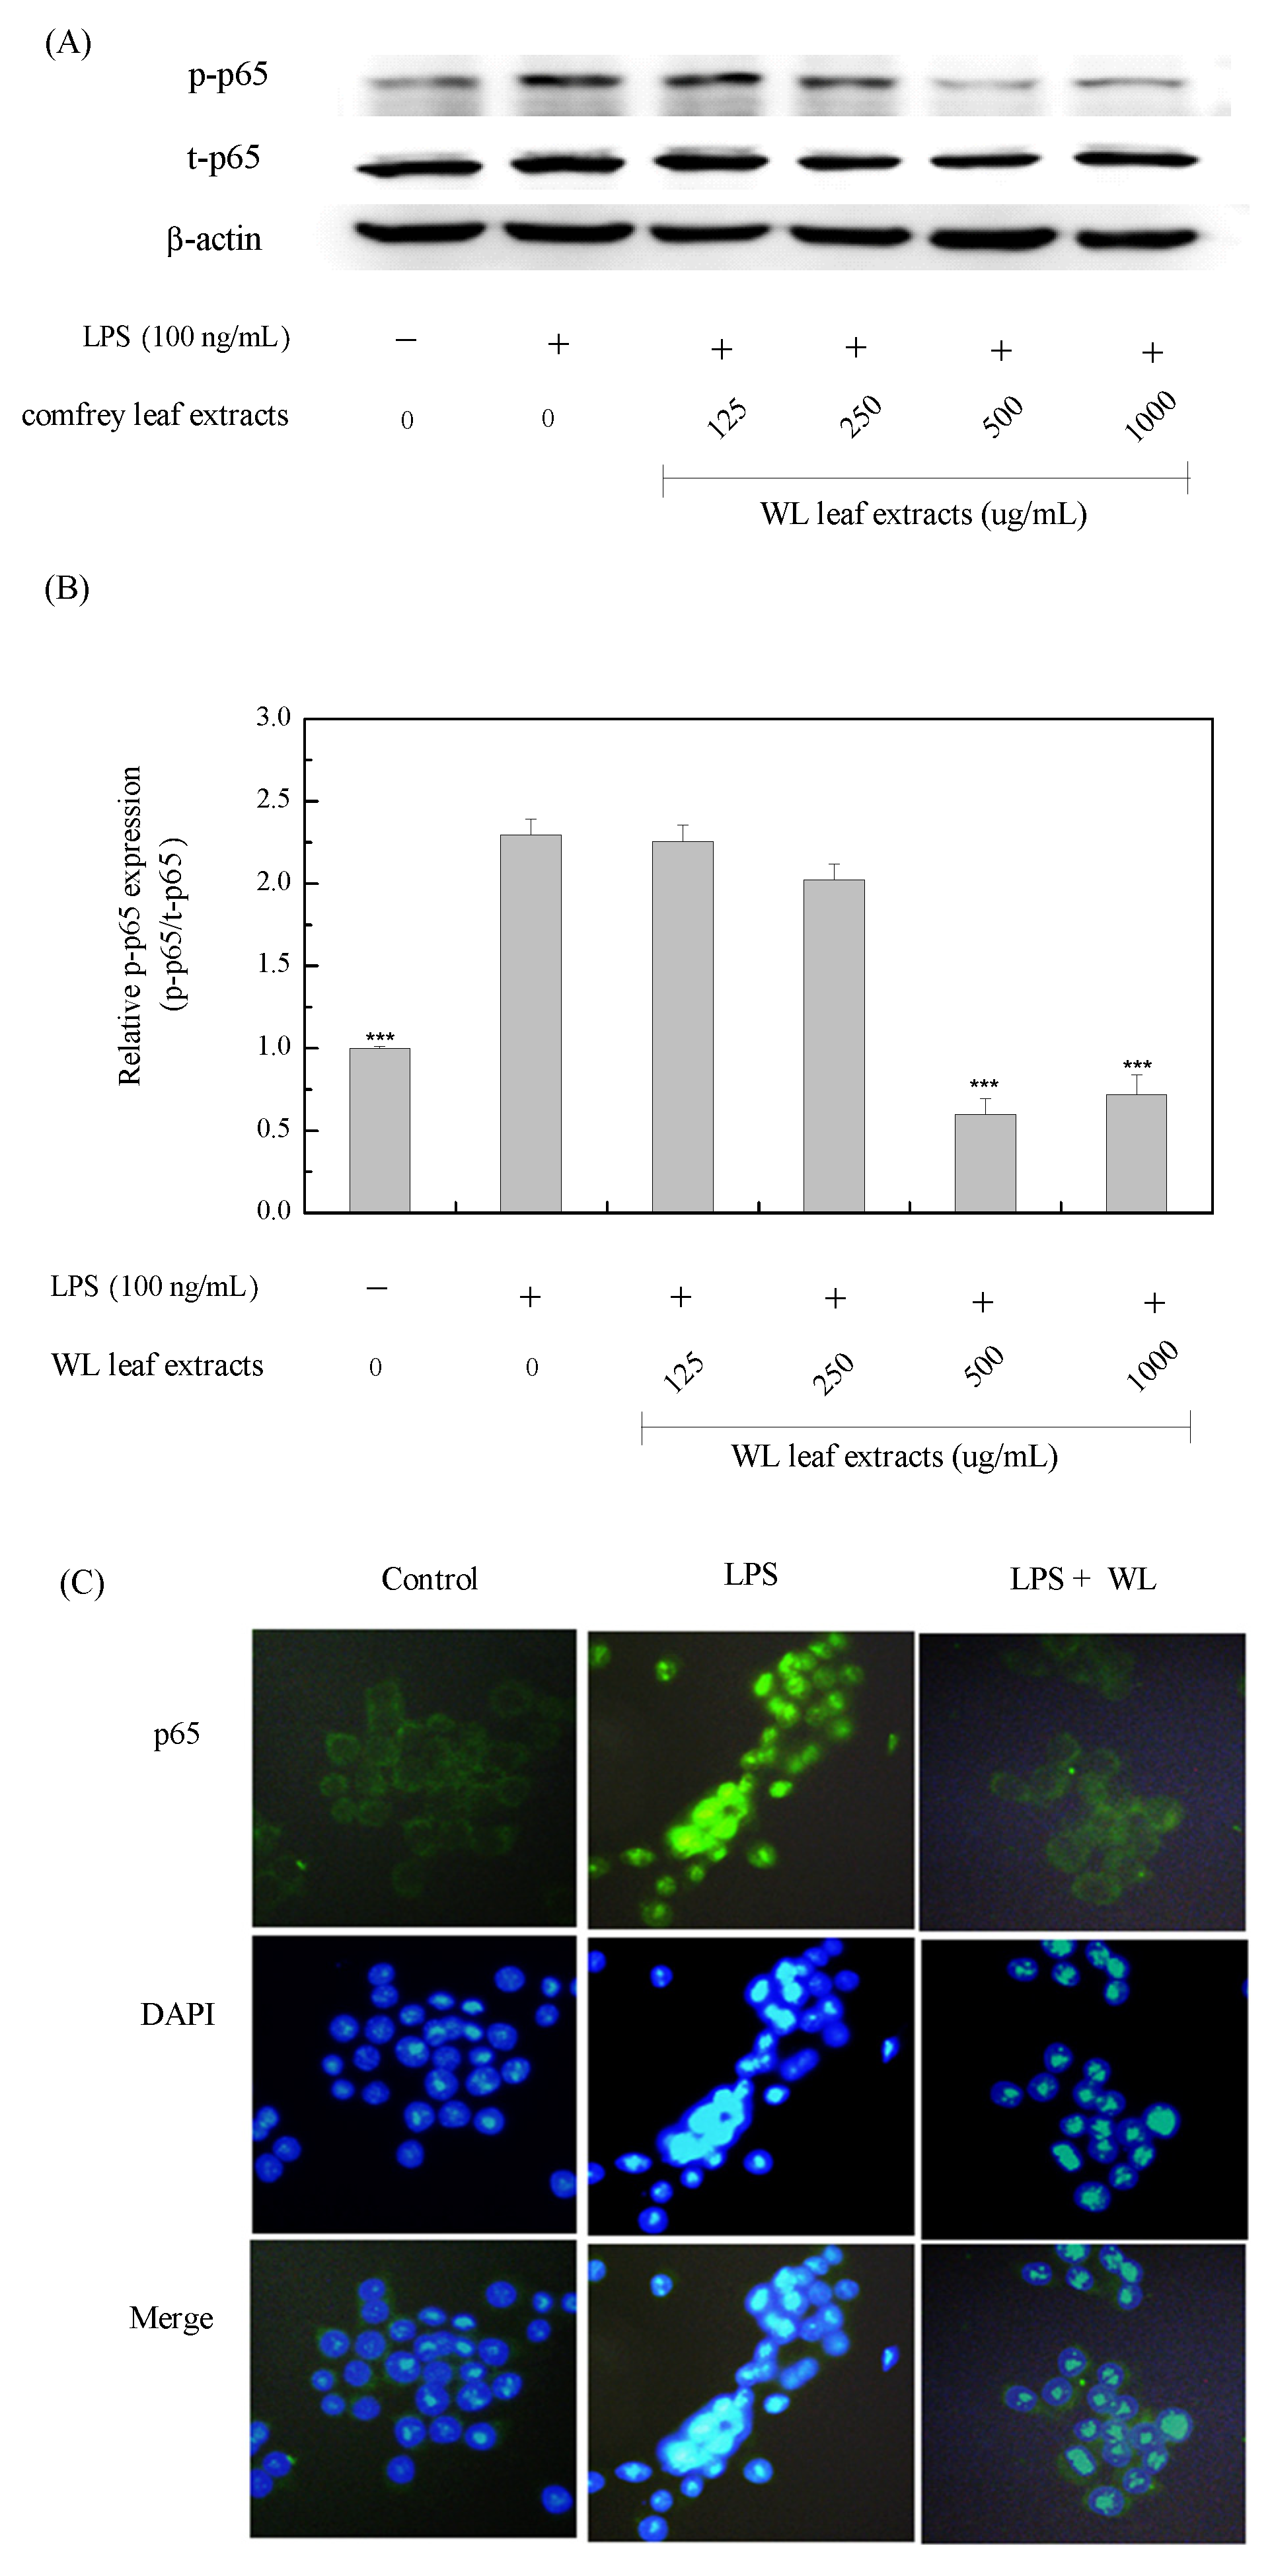
Furthermore, we determined whether WLE regulated the NF-κB signaling pathway. The p65 is an important trans-activating domain of NF-κB. When activated, the phosphate group is added to p65, and then phospho-p65 (p-p65) is translocated from the cytoplasm into the nucleus. We assessed the levels of p-p65 and total p65 (t-p65) by Western blotting (Figure 9(A)). Ratios in percentages of p-p65 to t-p65 were shown (Figure 9(B)). These results indicated that LPS treatments significantly increased the ratio of p-p65 to t-p65, and WLE significantly reduced this elevation at concentrations of 500–1000 μg/mL. Furthermore, the results of immunofluorescence of p-p65 and DAPI indicated that LPS treatments significantly increased the nuclear level of p65 protein, and WLE obviously lessened the translocation of p65 protein. In brief, we identified that WLE suppressed LPS-induced inflammation through the NF-κB signaling pathway, too.
MAPKs constitute important inflammatory signal cascades from the cell surface to the nucleus. LPS interacts with Toll-like receptor 4 and then activates various MAPK pathways including ERK, JNK, and p38, that mediate the activation of pro-inflammatory transcription factors [53]. The activation of NF-κB signaling pathway is closely linked to the activated MAPKs, that promote downstream transcription factors increasing inflammatory gene expressions [54]. The p38 has been identified as an upstream regulatory NF-κB kinase although the molecular mechanism of how p38 regulates NF-κB remains unclear [55]. Inhibition of p38 can attenuate NF-κB activation; however, it does not affect nuclear NF-κB translocation and DNA binding [56]. Therefore, blocking p38 can reduce expressions of NF-κB-mediated genes for pro-inflammatory factors, including TNF-α and IL-1β, and inflammatory mediators of COX-2 and iNOS [57,58]. Phenolic compounds of comfrey have been ascertained to be used as an anti-inflammatory agent in experiments both in vitro and in vivo [59]. RA is one of the polyphenols believed to be responsible for anti-inflammatory and wound-healing properties in plants including comfrey [60]. Thus, we conclude that RA in WLE attenuated LPS-stimulated pro-inflammatory cytokines including IL-1β, IL-6, and TNF-α, and inflammatory mediators including iNOS and COX-2 through inhibitions of both MAPK and NF-κB signaling pathways (Figure 10).

4. Conclusions

We identified a native comfrey plant as S. officinale WL by molecular identification. Using MAE, the optimal extract condition of WL leaves with high extraction yield and contents of total phenols and flavonoids was obtained with 750W microwave power, 50℃, 75% methanol, 1:10 solid-to-solvent ratio, and 15 minutes. WLE showed obvious antioxidant capacity by assays of DPPH, ABTS and SOD-like activities, reducing power, ferrous ion chelating activity, and FRAP. Furthermore, WLE showed the first reported DNA protective effect of comfrey extract by an in vitro study. Since high levels of phenolic and flavonoid compounds are highly associated with the antioxidant ability of plant extracts, we speculate that the phenolic and flavonoid compounds in WLE are responsible for antioxidant capacity and DNA protection. WLE also showed a significant anti-inflammatory effect in LPS-stimulated RAW 264.7 macrophages. WLE was a potent inhibitor of LPS-induced IL-1β, IL-6, TNF-α, iNOS, and COX-2 productions in macrophages. The inhibitory mechanisms involved MAPK and NF-κB signaling pathways. RA is one of the polyphenols believed to be responsible for anti-inflammation and wound-healing properties. We identified that WLE contained the highest RA concentration among all reported comfrey extracts by HPLC. We believe that the high RA concentration in WLE is responsible for the anti-inflammatory activity of WLE. Since our findings indicate that WLE has antioxidant, DNA protection, and anti-inflammation effects, they demonstrate that the production of comfrey leaf extract by MAE may provide a safe and efficacious source of comfrey extract for pharmaceutical applications.

Author Contributions

Conceptualization, K.-H.L. and J.-Y.W.; methodology, M.-S.T. and J.-Y.W.; software, J.-Y.W.; validation, M.-S.T. and J.-Y.W.; formal analysis, J.-Y.W.; investigation, K.-H.L.; resources, K.-H.L. and J.-Y.W.; data curation, K.-H.L.; writing—original draft preparation, K.-H.L.; writing—review and editing, M.-S.T. and J.-Y.W.; visualization, J.-Y.W.; supervision, J.-Y.W.; project administration, K.-H.L.; funding acquisition, K.-H.L. All authors have read and agreed to the published version of the manuscript.

Funding

This research was funded by Paoenergy Technology Co., LTD., grant number: SMI 2020123.

Data Availability Statement

The data presented in this study are available on request from the corresponding author. The data are not publicly available due to potential patent application.

Conflicts of Interest

The authors declare no conflict of interest.

References

  1. DerMarderosian, A.H.; Beutler, J.A. The review of natural products: The most complete source of natural product information; Facts and Comparisons: St. Louis, USA, 2002. [Google Scholar]
  2. Kadereit, J.W.; Bittrich, V. Eudicots: Aquifoliales, Boraginales, Bruniales, Dipsacales, Escalloniales, Garryales, Paracryphiales, Solanales (except Convolvulaceae), Icacinaceae, Metteniusaceae, Vahliaceae. In Flowering Plants, 1st ed.; Kadereit, J.W., Bittrich, V., Eds.; Springer International Publishing: Switzerland, 2016; pp. 41–102. [Google Scholar] [CrossRef]
  3. Mahmoudzadeh, E.; Nazemiyeh, H.; Hamedeyazdan, S. Anti-inflammatory Properties of the Genus Symphytum L.: A Review. Iran. J. Pharm. Res. 2022, 21, e123949. [Google Scholar] [CrossRef]
  4. Englert, K.; Mayer, J.G.; Staiger, C. Symphytum officinale L. - der Beinwell in der europäischen Pharmazie- und Medizingeschichte. Zeitschrift für Phytotherapie 2005, 26, 158–168. [Google Scholar] [CrossRef]
  5. Seigner, J.; Junker-Samek, M.; Plaza, A.; D’Urso, G.; Masullo, M.; Piacente, S.; Holper-Schichl, Y.M.; de Martin, R. A Symphytum officinale Root Extract Exerts Anti-inflammatory Properties by Affecting Two Distinct Steps of NF-κB Signaling. Front. Pharmacol. 2019, 10, 289. [Google Scholar] [CrossRef] [PubMed]
  6. Sowa, I.; Paduch, R.; Strzemski, M.; Zielińska, S.; Rydzik-Strzemska, E.; Sawicki, J.; Kocjan, R.; Polkowski, J.; Matkowski, A.; Latalski, M.; et al. Proliferative and antioxidant activity of Symphytum officinale root extract. Nat. Prod. Res. 2018, 32, 605–609. [Google Scholar] [CrossRef] [PubMed]
  7. Smith, D.B.; Jacobson, B.H. Effect of a blend of comfrey root extract (Symphytum officinale L.) and tannic acid creams in the treatment of osteoarthritis of the knee: Randomized, placebo-controlled, double-blind, multiclinical trials. J. Chiropr. Med. 2011, 10, 147–156. [Google Scholar] [CrossRef]
  8. Neagu, E.; Roman, G.P.; Radu, G.L. Antioxidant capacity of some Symphytum officinalis extracts processed by ultrafiltration. R. B. L. 2010, 15, 5505–5511. [Google Scholar]
  9. Savic, V.L.; Savić, S.; Nikolić, V.; Nikolić, L.; Najman, S.J.; Lazarević, J.S.; Djordjevic, A. The identification and quantification of bioactive compounds from the aqueous extract of comfrey root by UHPLC-DAD-HESI-MS method and its microbial activity. Hem. Ind. 2015, 69, 1–8. [Google Scholar] [CrossRef]
  10. Salehi, B.; Sharopov, F.; Boyunegmez Tumer, T.; Ozleyen, A.; Rodríguez-Pérez, C.; Ezzat, S.M.; Azzini, E.; Hosseinabadi, T.; Butnariu, M.; Sarac, I.; et al. Symphytum Species: A Comprehensive Review on Chemical Composition, Food Applications and Phytopharmacology. Molecules. 2019, 24. [Google Scholar] [CrossRef]
  11. Trifan, A.; Opitz, S.E.W.; Josuran, R.; Grubelnik, A.; Esslinger, N.; Peter, S.; Bräm, S.; Meier, N.; Wolfram, E. Is comfrey root more than toxic pyrrolizidine alkaloids? Salvianolic acids among antioxidant polyphenols in comfrey (Symphytum officinale L.) roots. Food Chem. Toxicol. 2018, 112, 178–187. [Google Scholar] [CrossRef]
  12. E.S.C.O. Symphyti radix, Comfrey root. In E/S/C/O/P Monographs: The Scientific Foundation for Herbal Medicinal Products. Supplement 2009, 2nd ed.; European Scientific Cooperative on Phytotherapy, 2009; pp. 249–254. [Google Scholar]
  13. Frost, R.; MacPherson, H.; O’Meara, S. A critical scoping review of external uses of comfrey (Symphytum spp.). Complement. Ther. Med. 2013, 21, 724–745. [Google Scholar] [CrossRef]
  14. Frost, R.; O’Meara, S.; MacPherson, H. The external use of comfrey: A practitioner survey. Complement. Ther. Clin. Pract. 2014, 20, 347–355. [Google Scholar] [CrossRef] [PubMed]
  15. Syarifah, A.N.; Suryadi, H.; Hayun, H.; Simamora, A.; Mun’im, A. Detoxification of comfrey (Symphytum officinale L.) extract using natural deep eutectic solvent (NADES) and evaluation of its anti-inflammatory, antioxidant, and hepatoprotective properties. Front. Pharmacol. 2023, 14, 1012716. [Google Scholar] [CrossRef] [PubMed]
  16. Elez Garofulić, I.; Dragović-Uzelac, V.; Režek Jambrak, A.; Jukić, M. The effect of microwave assisted extraction on the isolation of anthocyanins and phenolic acids from sour cherry Marasca (Prunus cerasus var. Marasca). J. Food Eng. 2013, 117, 437–442. [Google Scholar] [CrossRef]
  17. Tanongkankit, Y.; Sablani, S.S.; Chiewchan, N.; Devahastin, S. Microwave-assisted extraction of sulforaphane from white cabbages: Effects of extraction condition, solvent and sample pretreatment. J. Food Eng. 2013, 117, 151–157. [Google Scholar] [CrossRef]
  18. Karavaev, V.A.; Solntsev, M.K.; Iurina, T.P.; Iurina, E.V.; Poliakova, I.B.; Kuznetsov, A.M. [Antifungal activity of aqueous extracts from the leaf of cowparsnip and comfrey]. Izv. Akad. Nauk. Ser. Biol. 2001, 435–441. [Google Scholar]
  19. Sumathi, S.; Kumar, S.S.; Bai, A.L.G. Evaluation of Phytochemical Constituents and Antibacterial Activities of Symphytum officinale L. J. Pure. Appl. Microbiol. 2011, 5, 323–328. [Google Scholar]
  20. Sumathi, S.; Kumar, S.; Bharathi, V.; Sathish, S. Antibacterial activity of the plant extract of Symphytum officinale L. against selected pathogenic bacteria. Int. J. Res. Pharm. Sci. 2011, 2, 92–94. [Google Scholar]
  21. Araújo, L.U.; Reis, P.G.; Barbosa, L.C.; Saúde-Guimarães, D.A.; Grabe-Guimarães, A.; Mosqueira, V.C.; Carneiro, C.M.; Silva-Barcellos, N.M. In vivo wound healing effects of Symphytum officinale L. leaves extract in different topical formulations. Pharmazie 2012, 67, 355–360. [Google Scholar]
  22. Oberlies, N.H.; Kim, N.C.; Brine, D.R.; Collins, B.J.; Handy, R.W.; Sparacino, C.M.; Wani, M.C.; Wall, M.E. Analysis of herbal teas made from the leaves of comfrey (Symphytum officinale): Reduction of N-oxides results in order of magnitude increases in the measurable concentration of pyrrolizidine alkaloids. Public. Health. Nutr. 2004, 7, 919–924. [Google Scholar] [CrossRef]
  23. Dresler, S.; Szymczak, G.; Wójcik, M. Comparison of some secondary metabolite content in the seventeen species of the Boraginaceae family. Pharm. Biol. 2017, 55, 691–695. [Google Scholar] [CrossRef]
  24. Neagu, E.; Paun, G.; Albu, C.; Eremia, S.A.V.; Radu, G.L. Artemisia abrotanum and Symphytum officinale Polyphenolic Compounds-Rich Extracts with Potential Application in Diabetes Management.
  25. Khanuja, S.P.S.; Shasany, A.K.; Darokar, M.P.; Kumar, S. Rapid Isolation of DNA from Dry and Fresh Samples of Plants Producing Large Amounts of Secondary Metabolites and Essential Oils. Plant Mol. Biol. Rep. 1999, 17, 74. [Google Scholar] [CrossRef]
  26. Hacioğlu, B.; Eri̇k, S. Phylogeny of Symphytum L. (Boraginaceae) with special emphasis on Turkish species. Afr. J. Biotechnol. 2011, 10, 15483–15493. [Google Scholar] [CrossRef]
  27. Kähkönen, M.P.; Hopia, A.I.; Vuorela, H.J.; Rauha, J.P.; Pihlaja, K.; Kujala, T.S.; Heinonen, M. Antioxidant activity of plant extracts containing phenolic compounds. J. Agric. Food Chem. 1999, 47, 3954–3962. [Google Scholar] [CrossRef]
  28. Chang, C.C.; Yang, M.H.; Wen, H.M.; Chern, J.C. Estimation of Total Flavonoid Content in Propolis by Two Complementary Colorimetric Methods. J. Food. Drug Anal. 2002, 10, 178–182. [Google Scholar] [CrossRef]
  29. Lee, J.Y.; Cho, Y.R.; Park, J.H.; Ahn, E.K.; Jeong, W.; Shin, H.S.; Kim, M.S.; Yang, S.H.; Oh, J.S. Anti-melanogenic and anti-oxidant activities of ethanol extract of Kummerowia striata: Kummerowia striata regulate anti-melanogenic activity through down-regulation of TRP-1, TRP-2 and MITF expression. Toxicol. Rep. 2019, 6, 10–17. [Google Scholar] [CrossRef] [PubMed]
  30. Re, R.; Pellegrini, N.; Proteggente, A.; Pannala, A.; Yang, M.; Rice-Evans, C. Antioxidant activity applying an improved ABTS radical cation decolorization assay. Free Radic. Biol. Med. 1999, 26, 1231–1237. [Google Scholar] [CrossRef] [PubMed]
  31. Singh, N.; Rajini, P.S. Free radical scavenging activity of an aqueous extract of potato peel. Food Chem. 2004, 85, 611–616. [Google Scholar] [CrossRef]
  32. Zhao, H.; Fan, W.; Dong, J.; Lu, J.; Chen, J.; Shan, L.; Lin, Y.; Kong, W. Evaluation of antioxidant activities and total phenolic contents of typical malting barley varieties. Food Chem. 2008, 107, 296–304. [Google Scholar] [CrossRef]
  33. Kumar, V.; Rani, A.; Dixit, A.K.; Pratap, D.; Bhatnagar, D. A comparative assessment of total phenolic content, ferric reducing-anti-oxidative power, free radical-scavenging activity, vitamin C and isoflavones content in soybean with varying seed coat colour. Food Res. Int. 2010, 43, 323–328. [Google Scholar] [CrossRef]
  34. Li, X. Improved pyrogallol autoxidation method: A reliable and cheap superoxide-scavenging assay suitable for all antioxidants. J. Agric. Food Chem. 2012, 60, 6418–6424. [Google Scholar] [CrossRef]
  35. Jothy, S.L.; Chen, Y.; Kanwar, J.R.; Sasidharan, S. Evaluation of the Genotoxic Potential against H2O2-Radical-Mediated DNA Damage and Acute Oral Toxicity of Standardized Extract of Polyalthia longifolia Leaf. Evid. Based Complementary Altern. Med. 2013, 2013, 925380. [Google Scholar] [CrossRef] [PubMed]
  36. Li, C.Y.; Cheng, S.E.; Wang, S.H.; Wu, J.Y.; Hsieh, C.W.; Tsou, H.K.; Tsai, M.S. The Anti-inflammatory Effects of the Bioactive Compounds Isolated from Alpinia officinarum Hance Mediated by the Suppression of NF-kappaB and MAPK Signaling. Chin. J. Physiol. 2021, 64, 32–42. [Google Scholar] [CrossRef]
  37. Ruenroengklin, N.; Zhong, J.; Duan, X.; Yang, B.; Li, J.; Jiang, Y. Effects of various temperatures and pH values on the extraction yield of phenolics from litchi fruit pericarp tissue and the antioxidant activity of the extracted anthocyanins. Int. J. Mol. Sci. 2008, 9, 1333–1341. [Google Scholar] [CrossRef]
  38. Rajaei, A.; Barzegar, M.; Hamidi Esfahani, Z.; Sahari, M.A. Optimization of Extraction Conditions of Phenolic Compounds from Pistachio (Pistachia vera) Green Hull through Response Surface Method. J. Agr. Sci. Tech. 2010, 12. [Google Scholar]
  39. Tsao, R.; Deng, Z. Separation procedures for naturally occurring antioxidant phytochemicals. J. Chromatogr. B. 2004, 812, 85–99. [Google Scholar] [CrossRef]
  40. Kurucu, S.; Kartal, M.; Choudary, M.I.; Topcu, G. Pyrrolizidine Alkaloids from Symphytum sylvaticum Boiss. subsp. sepulcrale. (Boiss. & Bal.) Greuter & Burdet var. sepulcrale and Symphytum aintabicum Hub. - Mor. & Wickens. Turk. J. Chem. 2002, 26, 195–199. [Google Scholar]
  41. Drużyńska, B.; Stepniewska, A.; Wołosiak, R. The influence of time and type of solvent on efficiency of the extraction of polyphenols from green tea and antioxidant properties obtained extracts. Acta Sci. Pol. Technol. Aliment. 2007, 6, 27–36. [Google Scholar]
  42. Khoddami, A.; Wilkes, M.A.; Roberts, T.H. Techniques for analysis of plant phenolic compounds. Molecules. 2013, 18, 2328–2375. [Google Scholar] [CrossRef]
  43. Üstün Alkan, F.; Anlas, C.; Ustuner, O.; Bakırel, T.; Sari, A. Antioxidant and proliferative effects of aqueous and ethanolic extracts of Symphytum officinale on 3T3 Swiss albino mouse fibroblast cell line. Asian J. Plant Sci. Res. 2014, 4, 62–68. [Google Scholar]
  44. Goldstein, S.; Meyerstein, D.; Czapski, G. The Fenton reagents. Free Radic. Biol. Med. 1993, 15, 435–445. [Google Scholar] [CrossRef]
  45. Burrows, C.J.; Muller, J.G. Oxidative Nucleobase Modifications Leading to Strand Scission. Chem. Rev. 1998, 98, 1109–1152. [Google Scholar] [CrossRef]
  46. Spotheim-Maurizot, M.; Franchet, J.; Sabattier, R.; Charlier, M. DNA radiolysis by fast neutrons. II. Oxygen, thiols and ionic strength effects. Int. J. Radiat. Biol. 1991, 59, 1313–1324. [Google Scholar] [CrossRef] [PubMed]
  47. Sestili, P.; Guidarelli, A.; Dachà, M.; Cantoni, O. Quercetin Prevents DNA Single Strand Breakage and Cytotoxicity Caused By tert-Butylhydroperoxide: Free Radical Scavenging Versus Iron Chelating Mechanism. Free Radic. Biol. Med. 1998, 25, 196–200. [Google Scholar] [CrossRef] [PubMed]
  48. Ho, Y.S.; Wu, J.Y.; Chang, C.Y. A New Natural Antioxidant Biomaterial from Cinnamomum osmophloeum Kanehira Leaves Represses Melanogenesis and Protects against DNA Damage. Antioxidants (Basel). 2019, 8, 474. [Google Scholar] [CrossRef] [PubMed]
  49. Wang, W.-T.; Liao, S.-F.; Wu, Z.-L.; Chang, C.-W.; Wu, J.-Y. Simultaneous study of antioxidant activity, DNA protection and anti-inflammatory effect of Vernonia amygdalina leaves extracts. PLoS ONE. 2020, 15, e0235717. [Google Scholar] [CrossRef] [PubMed]
  50. Nastić, N.; Borrás-Linares, I.; Lozano-Sánchez, J.; Švarc-Gajić, J.; Segura-Carretero, A. Comparative Assessment of Phytochemical Profiles of Comfrey (Symphytum officinale L.) Root Extracts Obtained by Different Extraction Techniques. Molecules 2020, 25, 837. [Google Scholar] [CrossRef]
  51. Surh, Y.J.; Chun, K.S.; Cha, H.H.; Han, S.S.; Keum, Y.S.; Park, K.K.; Lee, S.S. Molecular mechanisms underlying chemopreventive activities of anti-inflammatory phytochemicals: Down-regulation of COX-2 and iNOS through suppression of NF-kappa B activation. Mutat. Res. 2001, 480–481, 243–268. [Google Scholar] [CrossRef] [PubMed]
  52. Feldmann, M. Cytokine networks: Do we understand them well enough to facilitate clinical benefits? Eur. Cytokine Netw. 1991, 2, 5–9. [Google Scholar]
  53. Guha, M.; Mackman, N. LPS induction of gene expression in human monocytes. Cell. Signal. 2001, 13, 85–94. [Google Scholar] [CrossRef] [PubMed]
  54. Saklatvala, J. Inflammatory signaling in cartilage: MAPK and NF-kappaB pathways in chondrocytes and the use of inhibitors for research into pathogenesis and therapy of osteoarthritis. Curr. Drug Targets. 2007, 8, 305–313. [Google Scholar] [CrossRef]
  55. Hehner, S.P.; Hofmann, T.G.; Ratter, F.; Dumont, A.; Dröge, W.; Schmitz, M.L. Tumor necrosis factor-alpha-induced cell killing and activation of transcription factor NF-kappaB are uncoupled in L929 cells. J. Biol. Chem. 1998, 273, 18117–18121. [Google Scholar] [CrossRef] [PubMed]
  56. Saha, R.N.; Jana, M.; Pahan, K. MAPK p38 regulates transcriptional activity of NF-kappaB in primary human astrocytes via acetylation of p65. J. Immunol. 2007, 179, 7101–7109. [Google Scholar] [CrossRef]
  57. Guo, W.; Sun, J.; Jiang, L.; Duan, L.; Huo, M.; Chen, N.; Zhong, W.; Wassy, L.; Yang, Z.; Feng, H. Imperatorin attenuates LPS-induced inflammation by suppressing NF-κB and MAPKs activation in RAW 264.7 macrophages. Inflammation. 2012, 35, 1764–1772. [Google Scholar] [CrossRef] [PubMed]
  58. Reddy, D.B.; Reddanna, P. Chebulagic acid (CA) attenuates LPS-induced inflammation by suppressing NF-kappaB and MAPK activation in RAW 264.7 macrophages. Biochem. Biophys. Res. Commun. 2009, 381, 112–117. [Google Scholar] [CrossRef] [PubMed]
  59. Chen, L.; Teng, H.; Xie, Z.; Cao, H.; Cheang, W.S.; Skalicka-Woniak, K.; Georgiev, M.I.; Xiao, J. Modifications of dietary flavonoids towards improved bioactivity: An update on structure-activity relationship. Crit. Rev. Food. Sci. Nutr. 2018, 58, 513–527. [Google Scholar] [CrossRef] [PubMed]
  60. Kučera, M.; Barna, M.; Horáček, O.; Kováriková, J.; Kučera, A. Efficacy and safety of topically applied Symphytum herb extract cream in the treatment of ankle distortion: Results of a randomized controlled clinical double-blind study. Wien. Med. Wochenschr. 2004, 154, 498–507. [Google Scholar] [CrossRef] [PubMed]
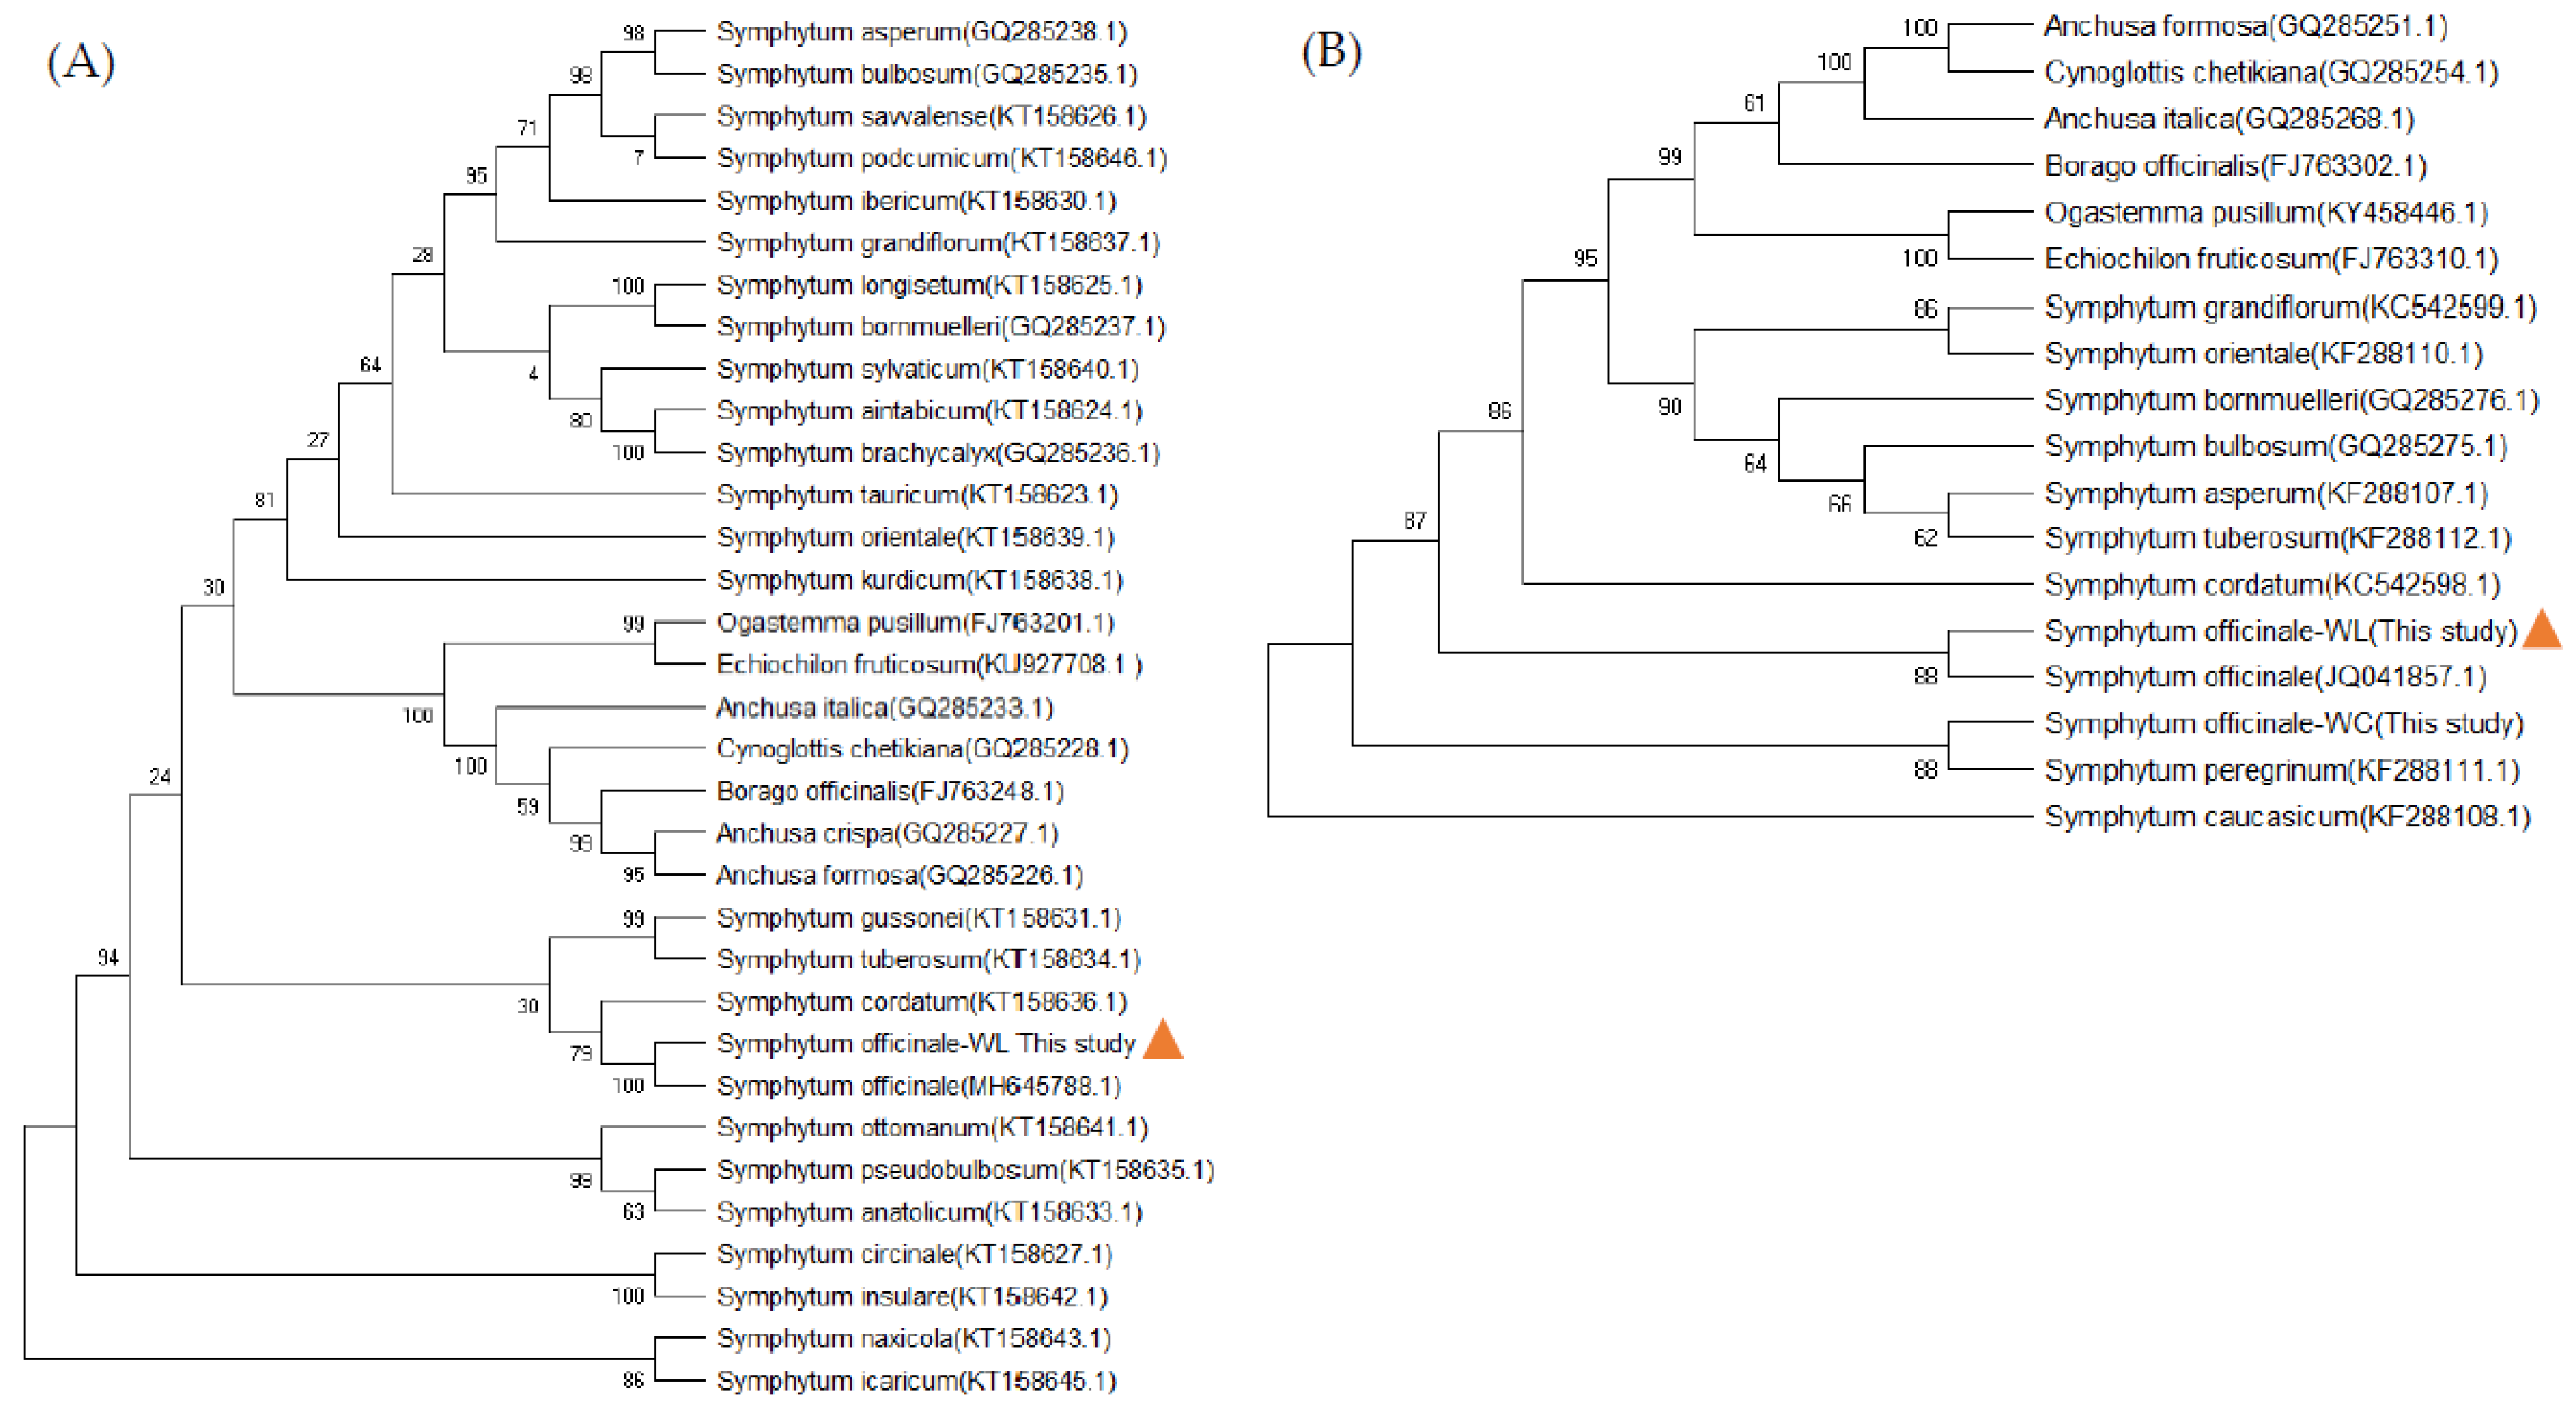
Figure 1. Results of sequence analyses of ITS (A) and trnL-trnF (B) by maximum parsimony.
Preprints 82911 g001
Figure 2. Antioxidant capacities of WLE were analyzed by DPPH radical scavenging activity (A), ABTS radical scavenging activity (B), reducing power (C), superoxide radical scavenging activity (D), ferrous ion chelating activity (E), and FRAP value (ferric reducing antioxidant power) (F). The used concentrations of WLE were indicated. Calculated IC50 in panel (A), (B), (D), and (E) were indicated.
Preprints 82911 g002
Figure 3. Results of DNA protective assay of WLE. (A) The photograph of DNA gel electrophoresis; (B) the quantitation results of protection of supercoiled plasmid and percentage of nicked plasmids. Treated with (+) or without (-) Fenton reagent, quercetin, and WLE were indicated. The used concentrations of WLE were indicated. *** (P < .001) denotes significant difference compared with Fenton reagent and quercetin treatment group (lane 3).
Preprints 82911 g003
Figure 4. Finger print profiles of the RA standard (A) and WLE (B) by HPLC.
Preprints 82911 g004
Figure 5. (A) Viabilities of RAW264.7 macrophages treated with indicated concentrations of WLE. (B) NO productions of LPS-induced RAW264.7 macrophages treated with indicated concentrations of WLE. Treated with (+) or without (-) LPS and WLE were indicated. The used concentrations of WLE were indicated. *** (P < .001) denotes significant difference compared with the LPS treated only group.
Preprints 82911 g005
Figure 6. The iNOS (a1, a2) and COX-2 (b1, b2) productions of LPS-induced RAW264.7 macrophages treated with indicated concentrations of WLE. Expression levels of iNOS and β-actin (a1) and COX-2 and β-actin (b1) were obtained by Western blotting. Relative iNOS (a2) and COX-2 (b2) expression levels were calculated. Treated with (+) or without (-) LPS and WLE, and the used concentrations of WLE were indicated. *** (P < .001) denotes significant difference compared with the LPS treated only group.
Preprints 82911 g006
Figure 7. Protein expression levels (a1, b1, c1) and relative folds of mRNA expression levels (a2, b2, c2) of IL-1β (a), IL-6 (b), and TNF-α (c) of LPS-induced RAW264.7 macrophages treated with indicated concentrations of WLE. Treated with LPS were underlined. The used concentrations of WLE were indicated. The expression levels of analyzed genes in cells without LPS and WLE were all designated 1.0-fold. * (P < .05), ** (P < .01), and *** (P < .001) denote significant difference compared with the LPS treated only group.
Preprints 82911 g007
Figure 8. Attenuations of LPS-induced MAPK signaling by WLE. (A) Expression levels of phospho-ERK (p-ERK), total ERK (t-ERK), phospho-JNK (p-JNK), total JNK (t-JNK), phospho-p38 (p-p38), total p38 (t-p38), and β-actin were obtained by Western blotting. Ratios (percentages) of p-ERK to t-ERK (B), p-JNK to t-JNK (C), and p-p38 to t-p38 (D) were calculated. Treated with LPS were underlined. The used concentrations of WLE were indicated. *** (P < .001) denotes significant difference compared with the LPS treated only group.
Preprints 82911 g008
Figure 9. Attenuations of LPS-induced NF-κB signaling by WLE. (A) Expression levels of phospho-p65 (p-p65), total p65 (t-p65), and β-actin were obtained by Western blotting. (B) Ratios of p-p65 to t-p65 were calculated. Treated with (+) or without (-) LPS and WLE were indicated. The used concentrations of WLE were indicated. *** (P < 0.001) denotes significant difference compared with the LPS treated only group. (C) Fluorescent images of p65 (upper), DAPI (medium), and merge (lower) in the control, LPS, and LPS+WLE groups, respectively.
Preprints 82911 g009
Figure 10. Schematic diagram of attenuating inflammation of LPS-induced RAW264.7 macrophages by WLE.
Preprints 82911 g010
Table 1. Gene or fragment name, primer names, sequences, and lengths of primer pairs used in this study.
Gene or fragment name Primer name Sequence Length (bp)
IL-1β IL-1β-mF 5′-GGGCTGCTTCCAAACCTTTG 20
IL-1β-mR 5′-GCTTGGGATCCACACTCTCC 20
IL-6 IL-6-mF 5′-TCCAGTTGCCTTCTTGGGAC 20
IL-6-mR 5′-GTGTAATTAAGCCTCCGACTTG 22
TNF-α TNF-α-mF 5′-TCTCATCAGTTCTATGGCCC 20
TNF-α-mR 5′-GGGAGTAGACAAGGTACAAC 20
β-actin β-act-mF 5′-GTGGGCCGCCCTAGGCACCAG 21
β-act-mR 5′-GGAGGAAGAGGATGCGGCAGT 21
ITS ITS5-F GGAAGTAAAAGTCGTAACAAGG 22
ITS4-R TCCTCCGCTTATTGATATGC 20
trnL–trnF trnL-trnF-F CGAAATCGGTAGACGCTACG 20
trnL-trnF-R ATTTGAACTGGTGACACGAG 20
mF: mouse forward primer; mR: mouse reverse primer; F: forward primer; R: reverse primer.
Table 2. Results of the extraction yields and contents of total polyphenols and flavonoids of WL leaves obtained by the optimal MAE conditions.
Extraction condition Optimal condition Extraction yield (%) Total phenols1 (mg/g) Total flavonoids2 (mg/g) Title 1 Title 2 Title 3
Microwave power (W) 750 12.50 ± 0.42 7.39 ± 0.21 44.70 ± 1.38 entry 1 data data
Temperature (℃) 50 13.72 ± 0.65 9.12 ± 0.01 60.08 ± 0.50 entry 2 data data 1
Methanol concentration (%) 75 14.43 ± 0.09 8.44 ± 0.08 66.98 ± 0.80
Solid-to-solvent ratio (w/v) 1:10 13.58 ± 0.01 9.09 ± 0.12 55.38 ± 0.72
Time (min) 15 16.38 ± 0.57 13.14 ± 0.17 64.23 ± 0.00
1 Total phenolic content was expressed as GAE in mg per g of dried leaves. 2 Total flavonoid content was expressed as GE in mg per g of dried leaves.
Disclaimer/Publisher’s Note: The statements, opinions and data contained in all publications are solely those of the individual author(s) and contributor(s) and not of MDPI and/or the editor(s). MDPI and/or the editor(s) disclaim responsibility for any injury to people or property resulting from any ideas, methods, instructions or products referred to in the content.
Copyright: This open access article is published under a Creative Commons CC BY 4.0 license, which permit the free download, distribution, and reuse, provided that the author and preprint are cited in any reuse.
Prerpints.org logo

Preprints.org is a free preprint server supported by MDPI in Basel, Switzerland.

Subscribe

© 2024 MDPI (Basel, Switzerland) unless otherwise stated