1. Introduction
Many steel bridges were built at the end of the 1960s to the beginning of the 1970s and were thus planned and designed for vehicles and traffic volumes of that time. As a result of globalization and the increase in international trade, the volume of traffic, especially heavy duty vehicles, has increased significantly [
1].
This development led to considerable damage to many steel bridges that impairs the load-bearing capacity of the structure. Therefore, the use of these bridges must be restricted or even closed to heavy traffic until a rehabilitation, e.g. repair [
2] or reconstruction [
3].
Consequently, maintenance measures for damaged bridges are an important factor to ensure the a sustainable infrastructure . In the field of retrofitting, there are several methods of repair, e.g. [
4][
5][
6]. In order to select a suitable repair measure, the type of fault and its cause must be known.
1.1. Causes for damage to bridges
Marzahn and Hamme [
1] show that there is seldom only one cause for the premature fatigue damage of steel structures such as bridges. The most common causes for damage to bridges are the increase in traffic loads, the use of non-deoxidized steel, which is of low quality with poor weldability, and the poor execution of weldments, which results, among other things, from the large tolerances of the blank sheets. The individual causes are discussed separately in the following sections.
1.1.1. Increase in traffic loads
The cause of damage of the inadequate design results from various circumstances and developments. One of the developments that led to inadequate design is the steady increase in traffic in general. While in 1975 only 21.2 million vehicles were registered in Germany, the number of vehicles registered in 2020 is 58.2 million [
7][
8]. This is why the emergency lane on bridges was opened to traffic in order to increase capacity. This loading of the outermost lane by trucks significantly exceeds the design loads and the fatigue strength.
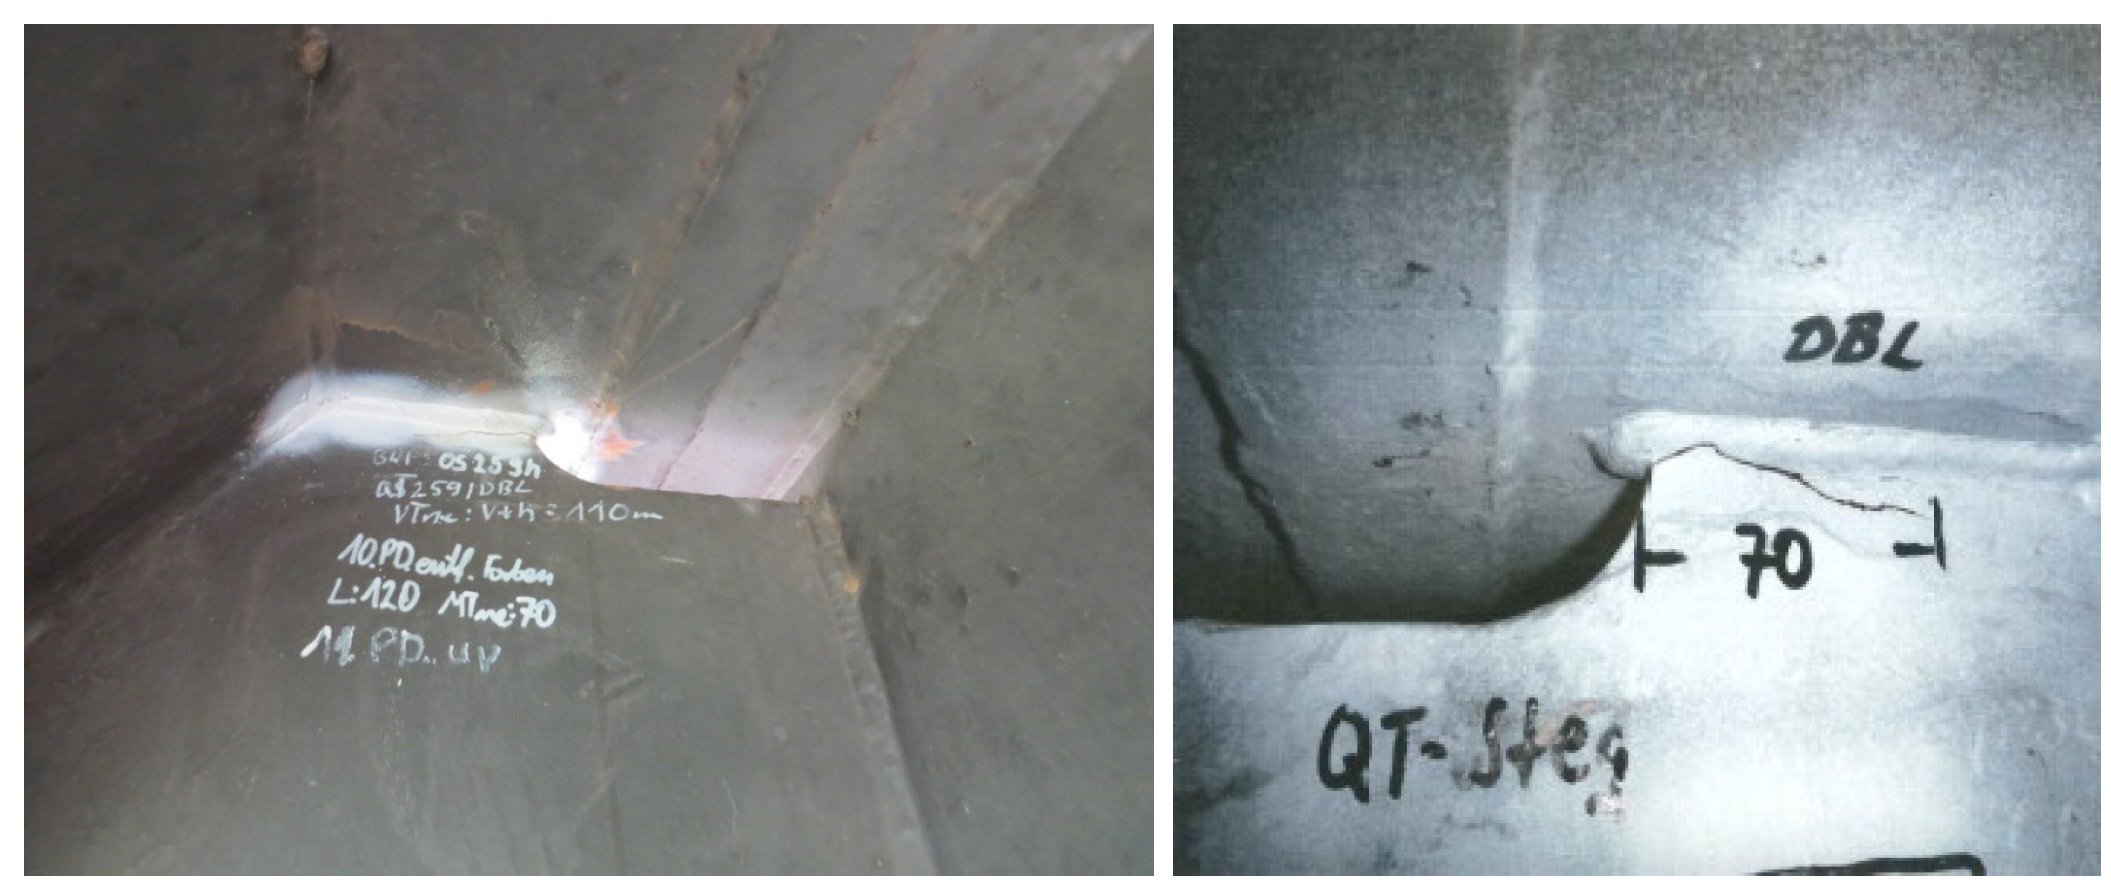
In addition to the increase in traffic, the vehicle weights, both of passenger cars and of goods and freight transports, have also become increasingly higher. Exceeding the maximum load capacity causes damage in the form of cracks, which are mainly located near weld seams. One detail that suffers from overloading is, for example, the connection between the cover plate and the cross member, as shown in
Figure 1. Since the cover plate is usually only a few millimeters thick, it bends when vehicles pass over the weld seam on the cross member. This results in a high bending fatigue stress and the formation of fatigue cracks. Such a cracked weld seam is depicted in
Figure 1.
1.1.2. Processing of non-deoxidized steel
Another reason for the occurrence of damage at bridges from the 1960s and 1970s is the use of non-deoxidized steel. The content of undesirable elements, such as phosphorus and sulfur, in steels from the 1960s and 1970s is relatively high compared to current structural steel grades. Accordingly, weldability is limited and mechanical properties are lower, while the tendency to lamellar tearing is higher than in modern steel grades [
9].
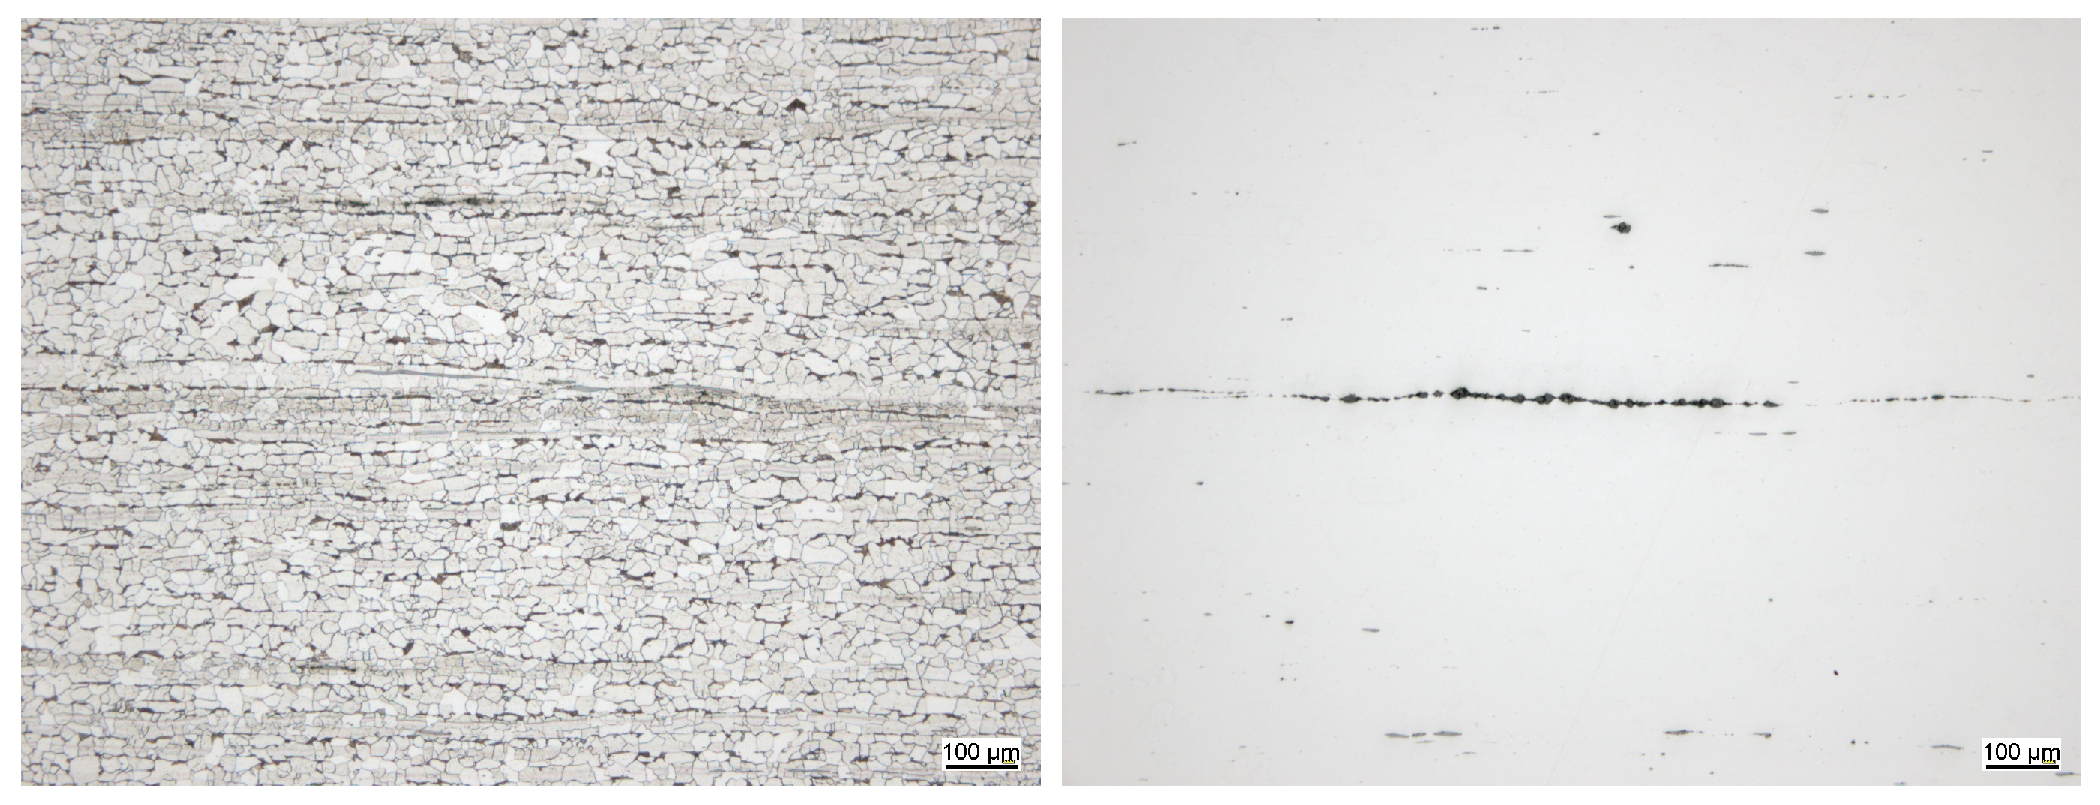
The reason for the low Z-quality of these steels and the tendency to lamellar tearing when stressed in the direction of sheet thickness are manganese sulfides, which are present as elongated lines due to the rolling process [
9]. Such manganese sulfide lines are shown in
Figure 2.
1.1.3. Execution of the weld seams
Due to the large tolerances of the beams and blank sheets, the gap openings at the joints to be welded were often too large or too small. If the gap openings are smaller than intended, accessibility is no longer guaranteed, especially at cross joints, resulting in lack of fusion and insufficient root penetration [
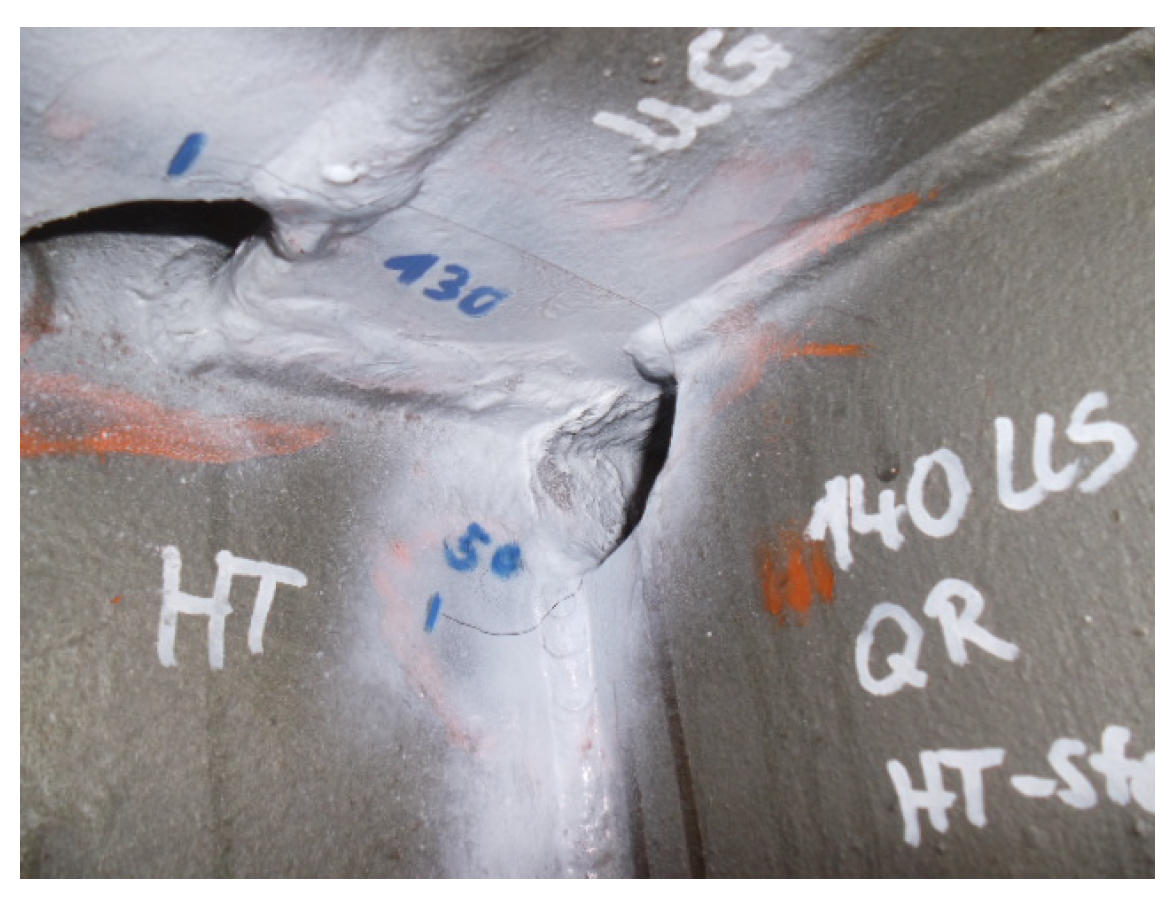
1]. In addition, the design of the parts to be welded was not suitable for execution. Many cracks occur on details with welds around free cuts, which is illustrated in
Figure 3. Exposure of these cracks at welds around free cuts revealed welding defects such as impurities, slag inclusions and lack of fusion. These weld imperfections ultimately lead to crack initiation. [
10].
In the case of steel bridges, these causes predominantly lead to cracks in weld seams, which in the long term, if left untreated, lead to fatal consequences. The repair of these symptoms is manifold. The most obvious repair measure is rewelding. With this method, the original construction is largely preserved and only minimal intervention in the structure is necessary. But, according to today`s design codes welding under operational loads is not covered. Therefore, bridges have to be closed for traffic to conduct maintenance measures such as repair welding.
In the 1980s and 2000s, several research projects were carried out on the complex of "welding under operational loads". But still, the correlation between welding under seam flank movement and achievable seam quality or fatigue strength is unknown.
1.2. Application of welding under cyclic loads
In the past, basic investigations for welding under cyclic loads were conducted. Those investigations focused on the general occurrence of hot cracks when welding under different crack opening parameters. Especially in Japan, due to the large number of steel bridges, there were already investigations on welding under cyclic loads in the 1980s. Horikawa et al. [
11] carried out various tests on welding under vibration. They used slot specimens that were connected at the edge areas. The seams were prepared as Y-butt welds and manual arc welding was applied. The investigated parameter field was (A=1 mm / f=0.3 Hz; A=0.6 / f=3 Hz; A=0.02 mm / f=30 Hz). Due to the specimen geometry and the setting of the amplitude and frequency via the cylinder movement and not via the gap opening itself, cracks were not caused while welding at any frequency-amplitude combination. Information about the actual movement of the seam flanks were not recorded.
At the end of the 90s, Schiebel [
12] carried out fracture mechanics investigations on specimens welded under operational stress. A test setup was developed in which the seam flank movement was implemented by means of a 4-point bending device. The setup consisted of two girders where the specimen to be welded was attached on the upper flange at the joint of the two girders. The movement was applied via two members on the girders at each side of the specimen. The welds were V-butt welds executed as multi-pass-welds in flat position using GMAW. Here, too, the seam flank amplitude, which was varied in the range from 0.25 to 0.75 mm, was not controlled directly via the gap opening, but via the displacement of the test cylinder. The investigated frequency was varied from 0.25 to 1 Hz. With this approach, the force redistribution and thus the minimisation of the seam movement with increasing weld length could be reproduced well. In practice, the used setup could, for example, represent the repair of a partially cracked upper flange. The results of the tests showed that despite indirect gap opening control and the use of a run-in plates, hot cracks occurred at every investigated seam opening amplitude. The run-in plate reduced the seam opening amplitude at the beginning of the seam to less than half compared to the end of the seam. Another finding was, that the residual stresses in joints welded under moving seam flanks were higher than those of joints welded without the movement of seam flanks.
Based on these investigations, Wichers [
13] attempted to expand the parameter field investigated in Schiebel [
12] and thus to determine the limit for the seam opening amplitude at which flawless welding is still possible. In the test setup used for this purpose, the sample to be welded was screwed onto slides. The seam flank movement was generated by moving this sliding carriage, whereby the control was implemented via eddy current sensors on the carriage [
13]. The welds were V-butt welds executed as single-pass-welds in flat position using GMAW. The investigated parameter field of the seam flank movement varied from 0.1 to 0.8 mm with a frequency of 0.1 to 7 Hz. In all parameter combinations, hot cracks were found either on the surface or in the middle of the weld metal.
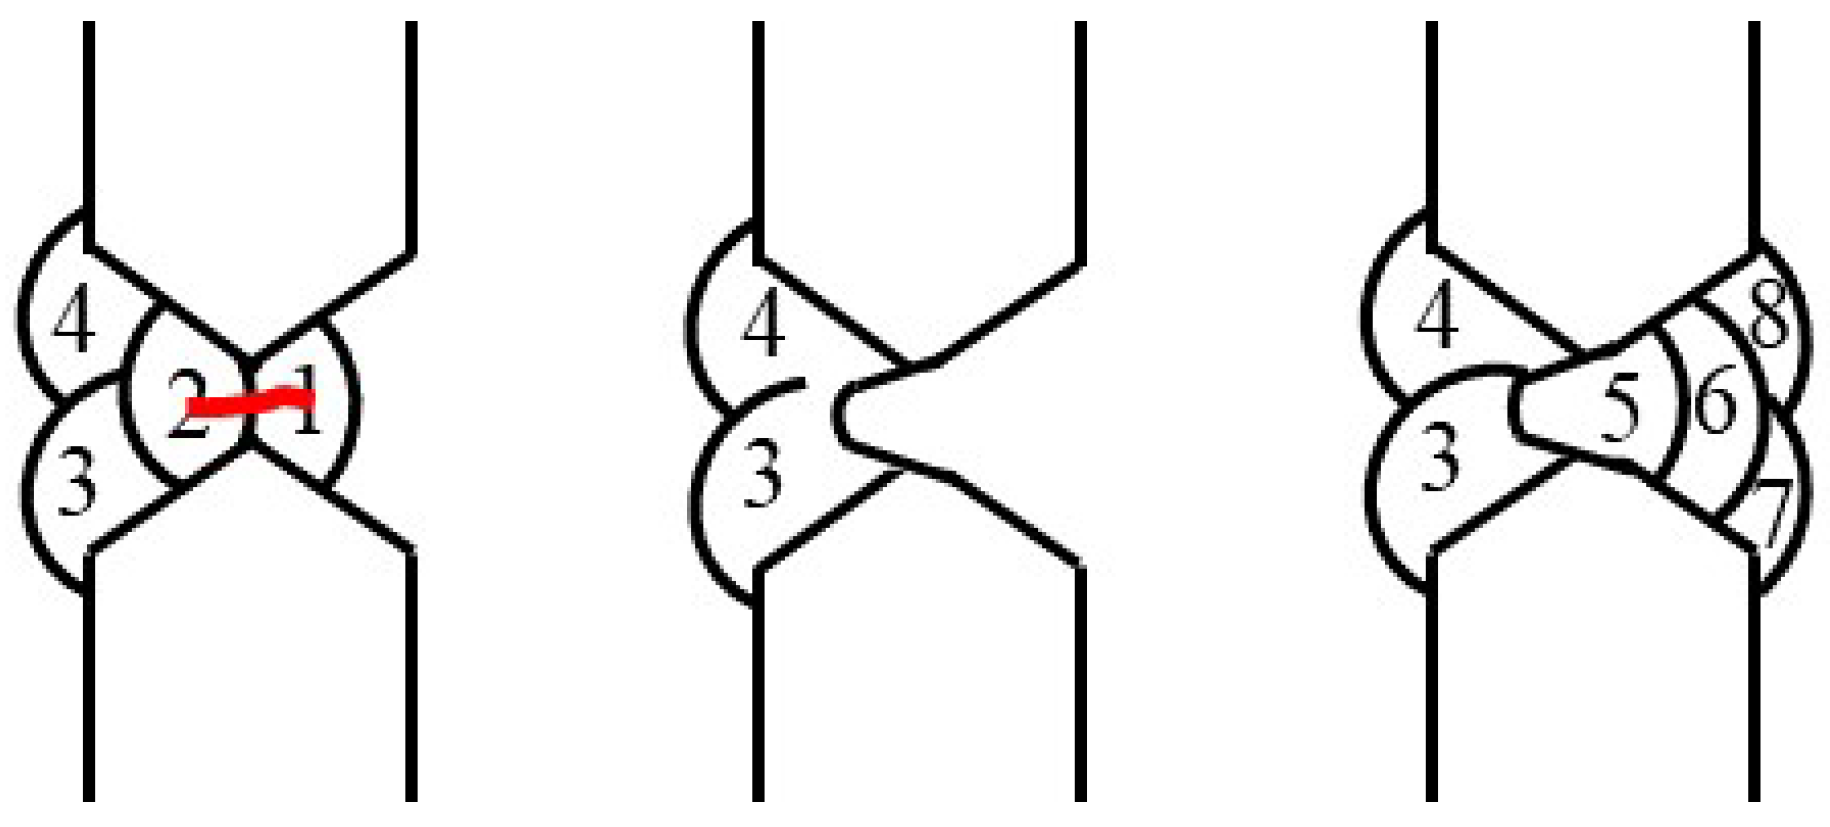
In current repairs of bridges there is a method for welding under cyclic loads that is already being applied. It is based on the suppression of the crack flank movement by bringing in a first root layer which is removed afterwards, compare
Figure 4. The general procedure is as follows: The crack is ground out generously and one bead is inserted from one side as the first root. This absorbs strain and thus temporarily suppresses the movement of the flanks. Then the second root layer is welded from the opposite side and the seam is filled with filler and top beads. The weld beads are checked for defects by magnetic particle inspections after each layer. Afterwards, the first root bead on the opposite side is completely ground out and the seam is also filled and tested by non-destructive testing here.
In this way, defect-free seams can be made in practice, even under operational loads. Although this procedure has proven itself, it is not anchored in any standard because there is a lack of experience regarding the relationship between seam flank movement and achievable weld quality. In addition, the achievable fatigue strength when welding moving seam flanks is still unknown.
In summary it can be stated, that preliminary investigations on the influence of moving seam flanks on the quality of the weld revealed the main problem which is the occurrence of solidification cracks. The following section gives a short overview of the mechanisms and the influences on hot cracks in welds.
1.3. Influences on hot cracking
Hot cracks are material separations occurring at high temperatures between
and
[
14]. They can be categorized regarding their formation reasons into solidification cracks, remelting cracks and ductility dip cracks. [
15]
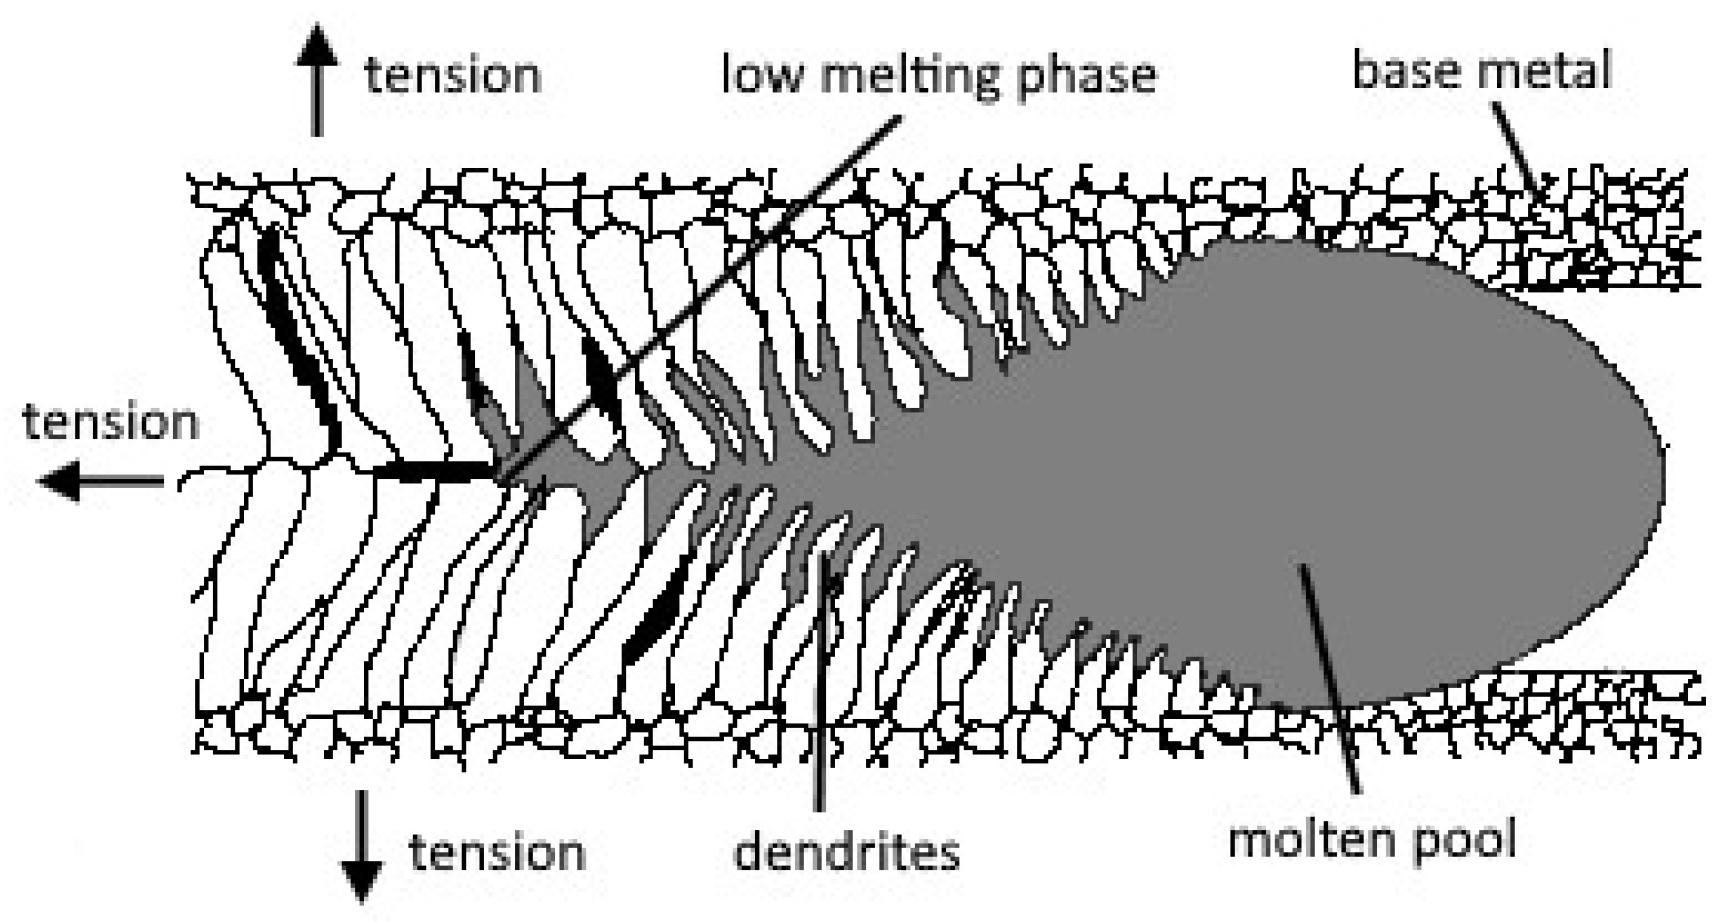
The relevant type of hot cracking for repair welding under cyclic loads is solidification cracking. The mechanism can be explained by the help of
Figure 5. During the solidification of the molten pool, dendrites start to grow. The growing direction follows the highest temperature gradient. Depending on the chemical composition of the molten pool, low-melting phases are forming and remain between the grain boundaries in the middle of the weld bead impeding material closure.
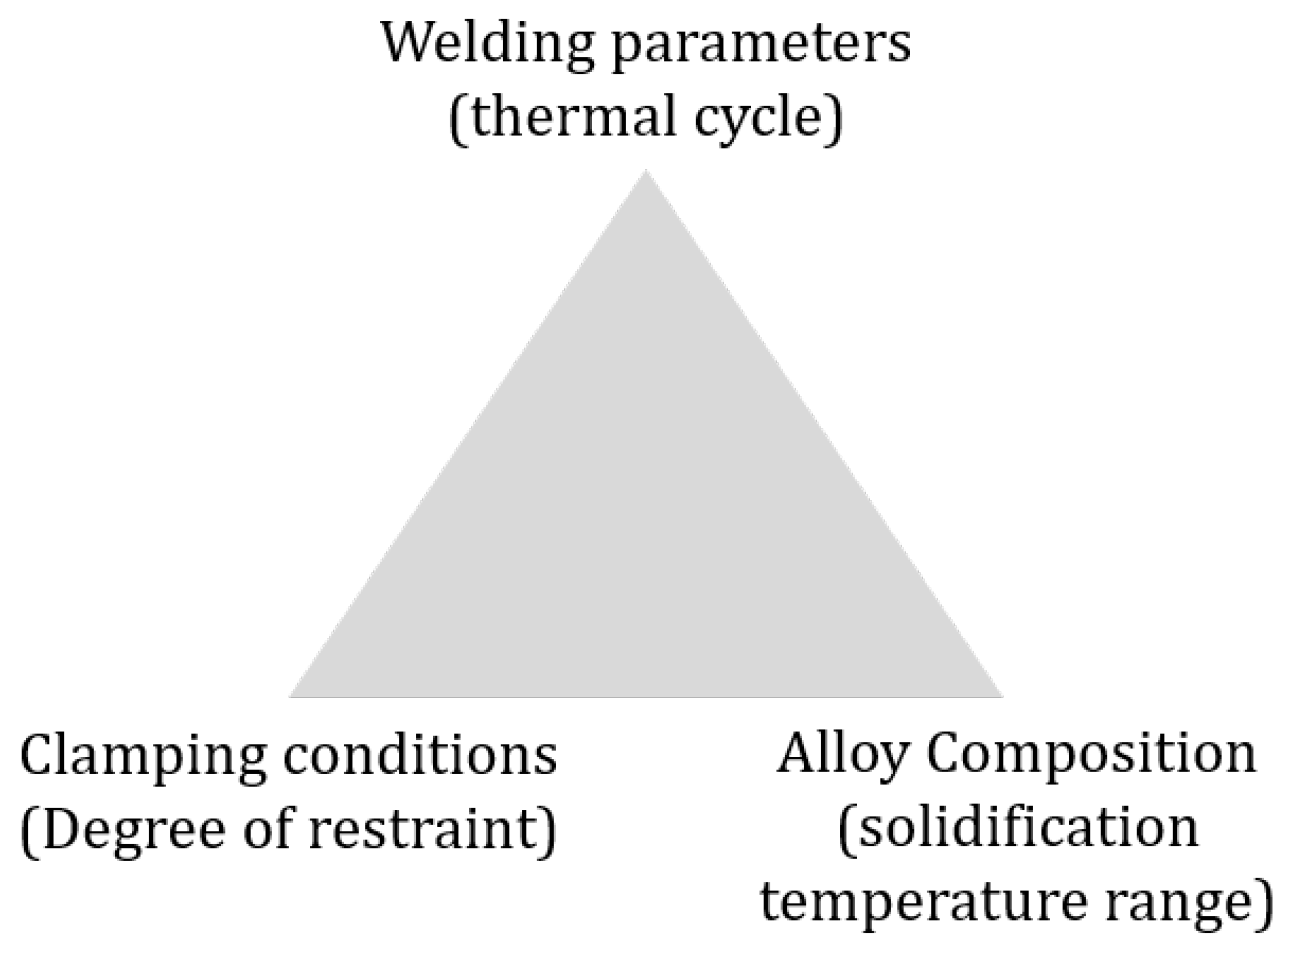
The probability of the occurrence of solidification cracks is dependent of the circumstances which are depicted in
Figure 6.
The welding parameters rule the thermal cycle and determine the geometry of the molten pool, which influences the formation of hot cracks. Dilthey states in [
14] that a ratio of width to depth of the molten pool of less than 1 is favorable. So a shallow and broad molten pool should be aimed for. Furthermore, the growth direction of the dendrites during solidification is determined by the temperature gradient in the part to be welded. A growth direction parallel to the welding direction, which can be achieved by slow welding speeds, leads to a higher resistance to solidification cracking.
The second influencing factor is the alloy composition as it determines the solidification temperature range. According to Borland [
18] a large solidification range promotes the formation of hot cracks. Especially in case of non-deoxidized steel this factor is dominant. Due to the presence of sulphur in the base material, phases with a low solidification temperature form during solidification (e.g. S+Ni
). As a result, low-melting eutectics accumulate at the solidification front during dendritic solidification and hot cracks form in the middle of the seam [
14].
The last factor that leads to solidification cracking, which is of special importance for repair welding, is the clamping condition. In the case of repair welding in the context of bridges, a structure with very high stiffness is present and thus there is a high degree of restraint. During cooling, the weld bead is shrinking while the surrounding structure is not, which leads to high tensile forces in the weld bead. In addition, there is also the movement of the seam flanks when bridges are repaired under operational loads.
In conclusion, there is need for research in the field of welding under cyclic loads, since there are no results that give a recommendation to achieve crack-free joints when welding under operational stresses. Preliminary investigations focused on fundamental questions and lacked relevance for practice. At infrastructural constructions like bridges the details to be repaired are mostly in horizontal welding position with both side accessibility. So a welding detail like a double-V-groove weld would be closer to the actual situation at the bridges and additionally opens up new ways for applying beneficial production and welding sequences. Furthermore the fatigue strength of joints welded under cyclic loads needs to be determined.
2. Material and methods
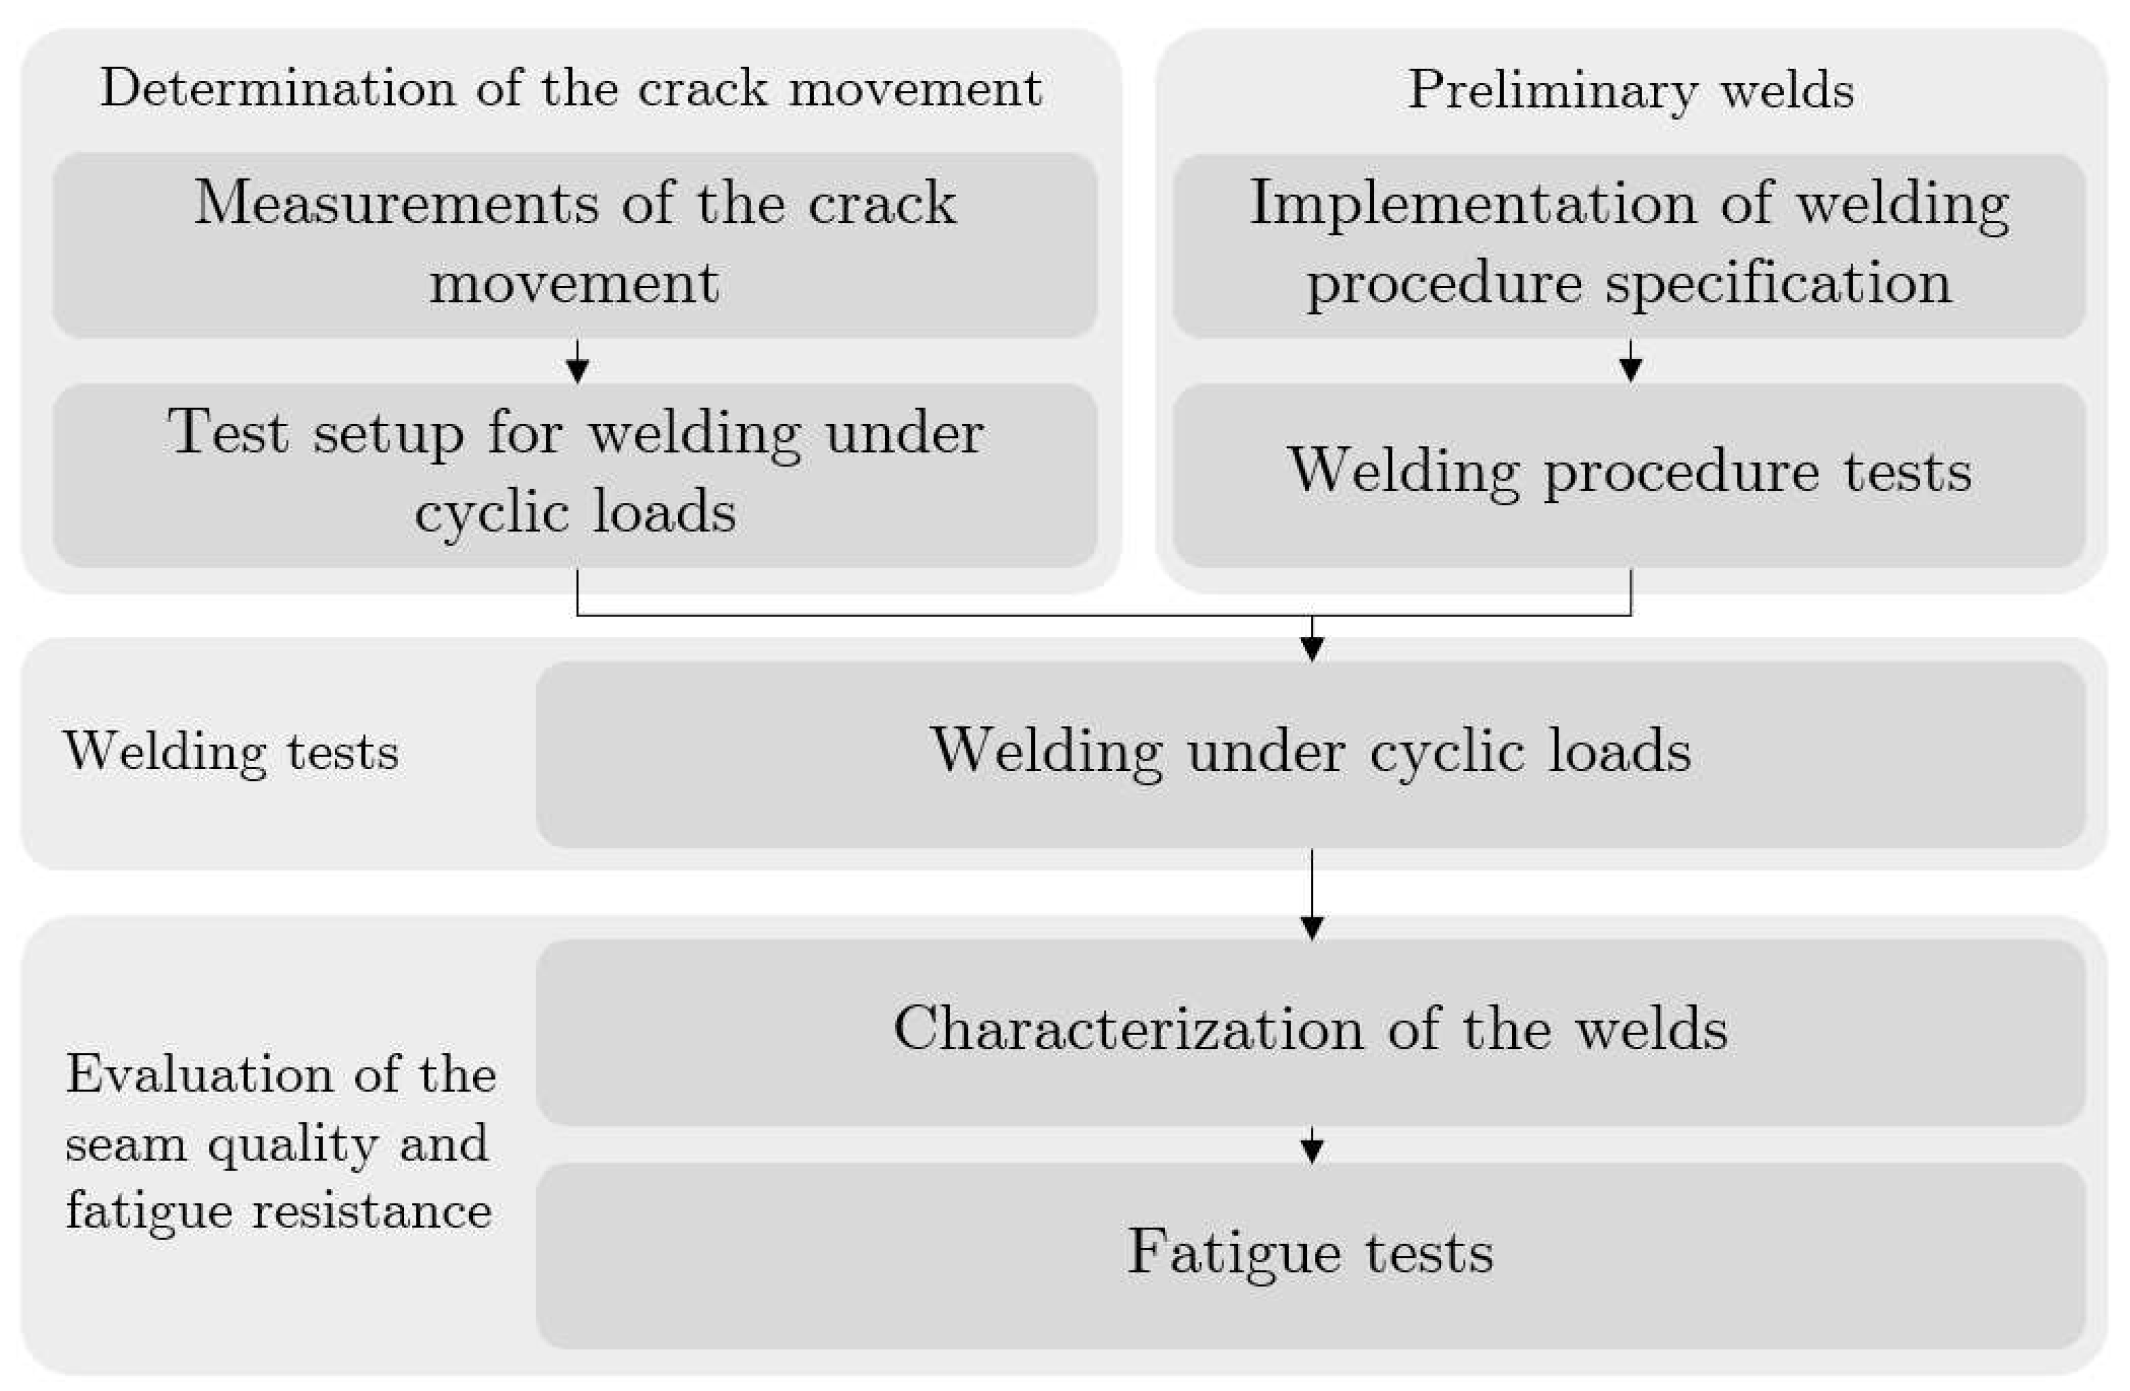
In order to investigate the effect of moving seam flanks on the resulting weld seam quality and thus the fatigue strength, specimens were welded in a test setup under cyclic loads. For the experiments, a welding sequence was applied which based on deep grinding of the first root. To ensure practical relevance, the magnitude of a crack movement was measured at the Rhinebridge of the A40 in Duisburg-Neuenkamp, and implemented to the test setup. In the end, the obtained specimens were tested and the fatigue strength was evaluated and compared with reference welds. The following sections give further details about the applied materials and methods. The whole workflow is depicted in
Figure 7.
2.1. Material and qualification of welding process
For the welding experiments a S355J2+N (t=12 mm) was used as a base plate. As welding wire a Robofil R71 (T46 4 P M 1 H5) was used, which is a rutile filler wire with a diameter of 1.2 mm. The mechanical properties are depicted in
Table 1 and the chemical composition is given in
Table 2.
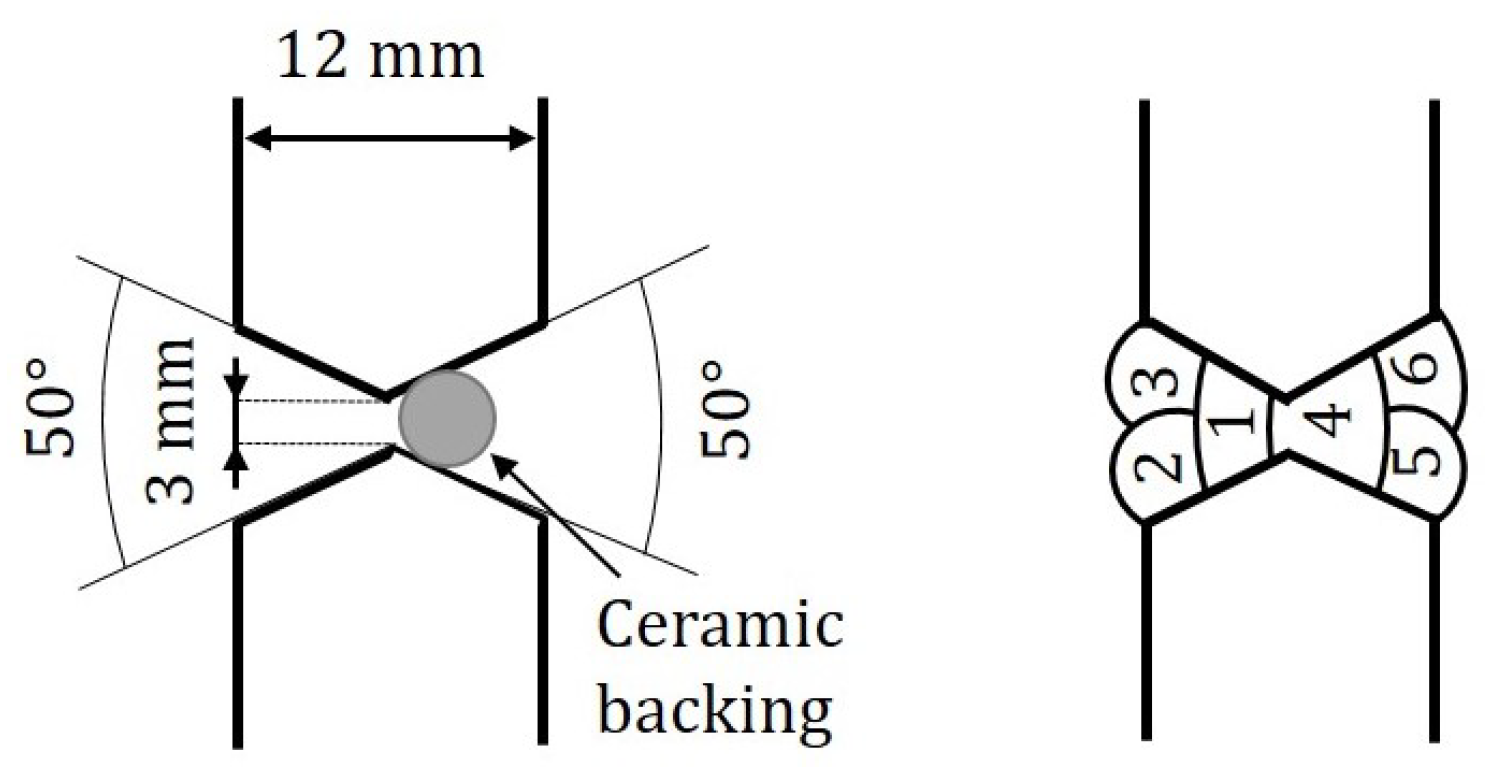
A butt joint was chosen as the joint detail to be investigated, which was welded as double-V groove weld with a seam opening angle of 50° as shown in
Figure 8. The gap was 3 mm and a ceramic backing with a diameter of 6 mm was used. This joint is typical for repair welds of cracks in bridge construction and represents a large range of applications in steel construction. The welding parameters were chosen according to an exisiting welding procedure specification as shown in
Table 3.
The welding experiments were conducted in two steps. First, the welding procedure specification was implemented and the joints were subsequently evaluated via macro- and microsections, hardness testing and tensile testing. After the succesful qualification of the welding process, specimens for fatigue tests were welded.
2.2. Measurements of the crack movements
In order to determine the gap opening of a cracked detail of a bridge, a structural health monitoring system (SHM) was used. In the test setup, the gap opening was translated into describable parameters, which were the gap opening amplitude and frequency. The monitoring was conducted at the A40 Rhinebridge in Duisburg Neuenkamp. The bridge was chosen as a typical example of a steel bridge from the 1970s that has to be permanently repaired due to the increased traffic volume and the reasons given in
Section 1.1. While the bridge was designed for approximately 30,000 vehicles per day, today around 100,000 vehicles are crossing the bridge daily [
19]. In order to handle the traffic volume, the emergency lane was temporarily opened to traffic. So the heavy trucks load the bridge support structure with maximum leverage. The cross-section in the field area of the bridge is a two-cell box girder with an orthotropic cover plate, which is supported in the outer areas by inclined beams as shown in
Figure 9. The loading of the outside lane has resulted in increased effective loads in addition to the increased traffic and heavy load volumes.
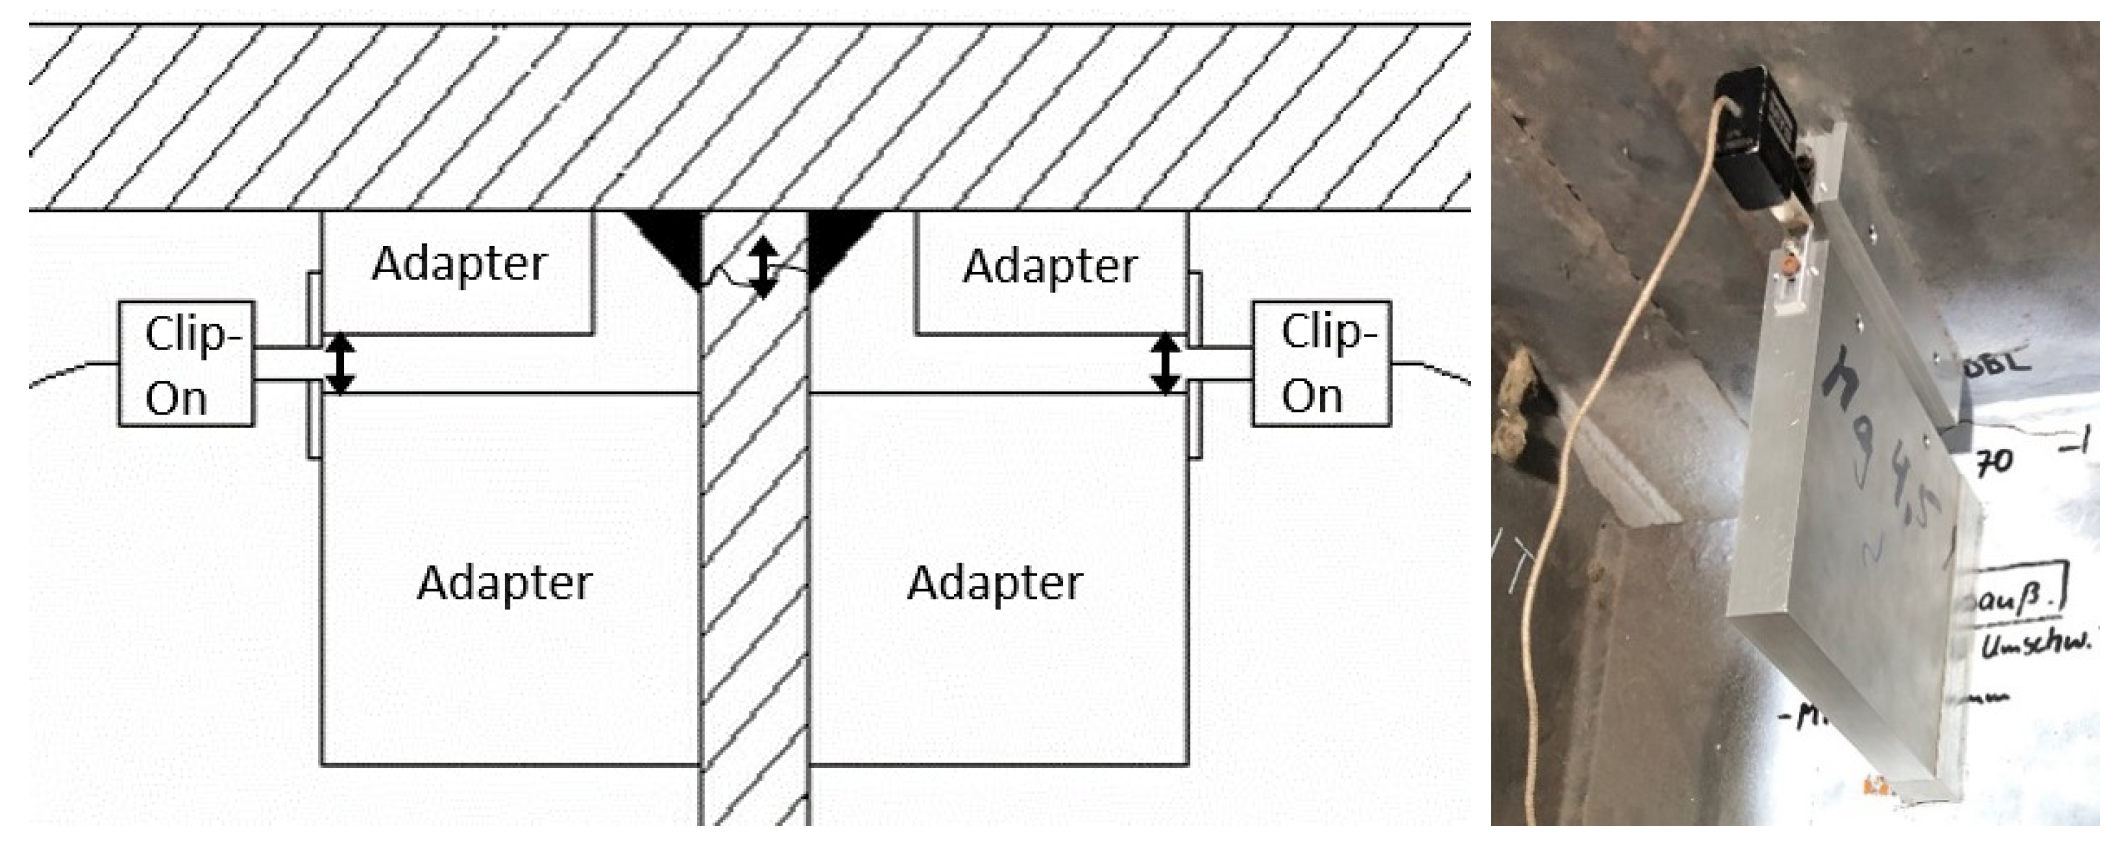
The investigated detail was a crack in the toe of a fillet weld at the connection between the cross girder web and the deck plate of the bridge. In the in-situ measurements, continuous measurements were carried out for a period of two weeks to see how the crack opening parameters vary in different traffic situations. The aim is to provide a measuring system for determining the seam flank movement on welds which have to be repaired and to determine a limit value for the real displacement of the crack, where defect-free welding is still possible. For the monitoring system for the metrological investigation of the gap opening used two clip-on extensometer (MTS model 632-02F-20), which were attached via two magnetic adapters on each side of the deck plate and web. To attach them to the magnets they are clipped between two cutting edges as shown in
Figure 10. The clip-on extensometers measure the gap opening close to the crack on both sides.
2.3. Test setup for welding under cyclic loads
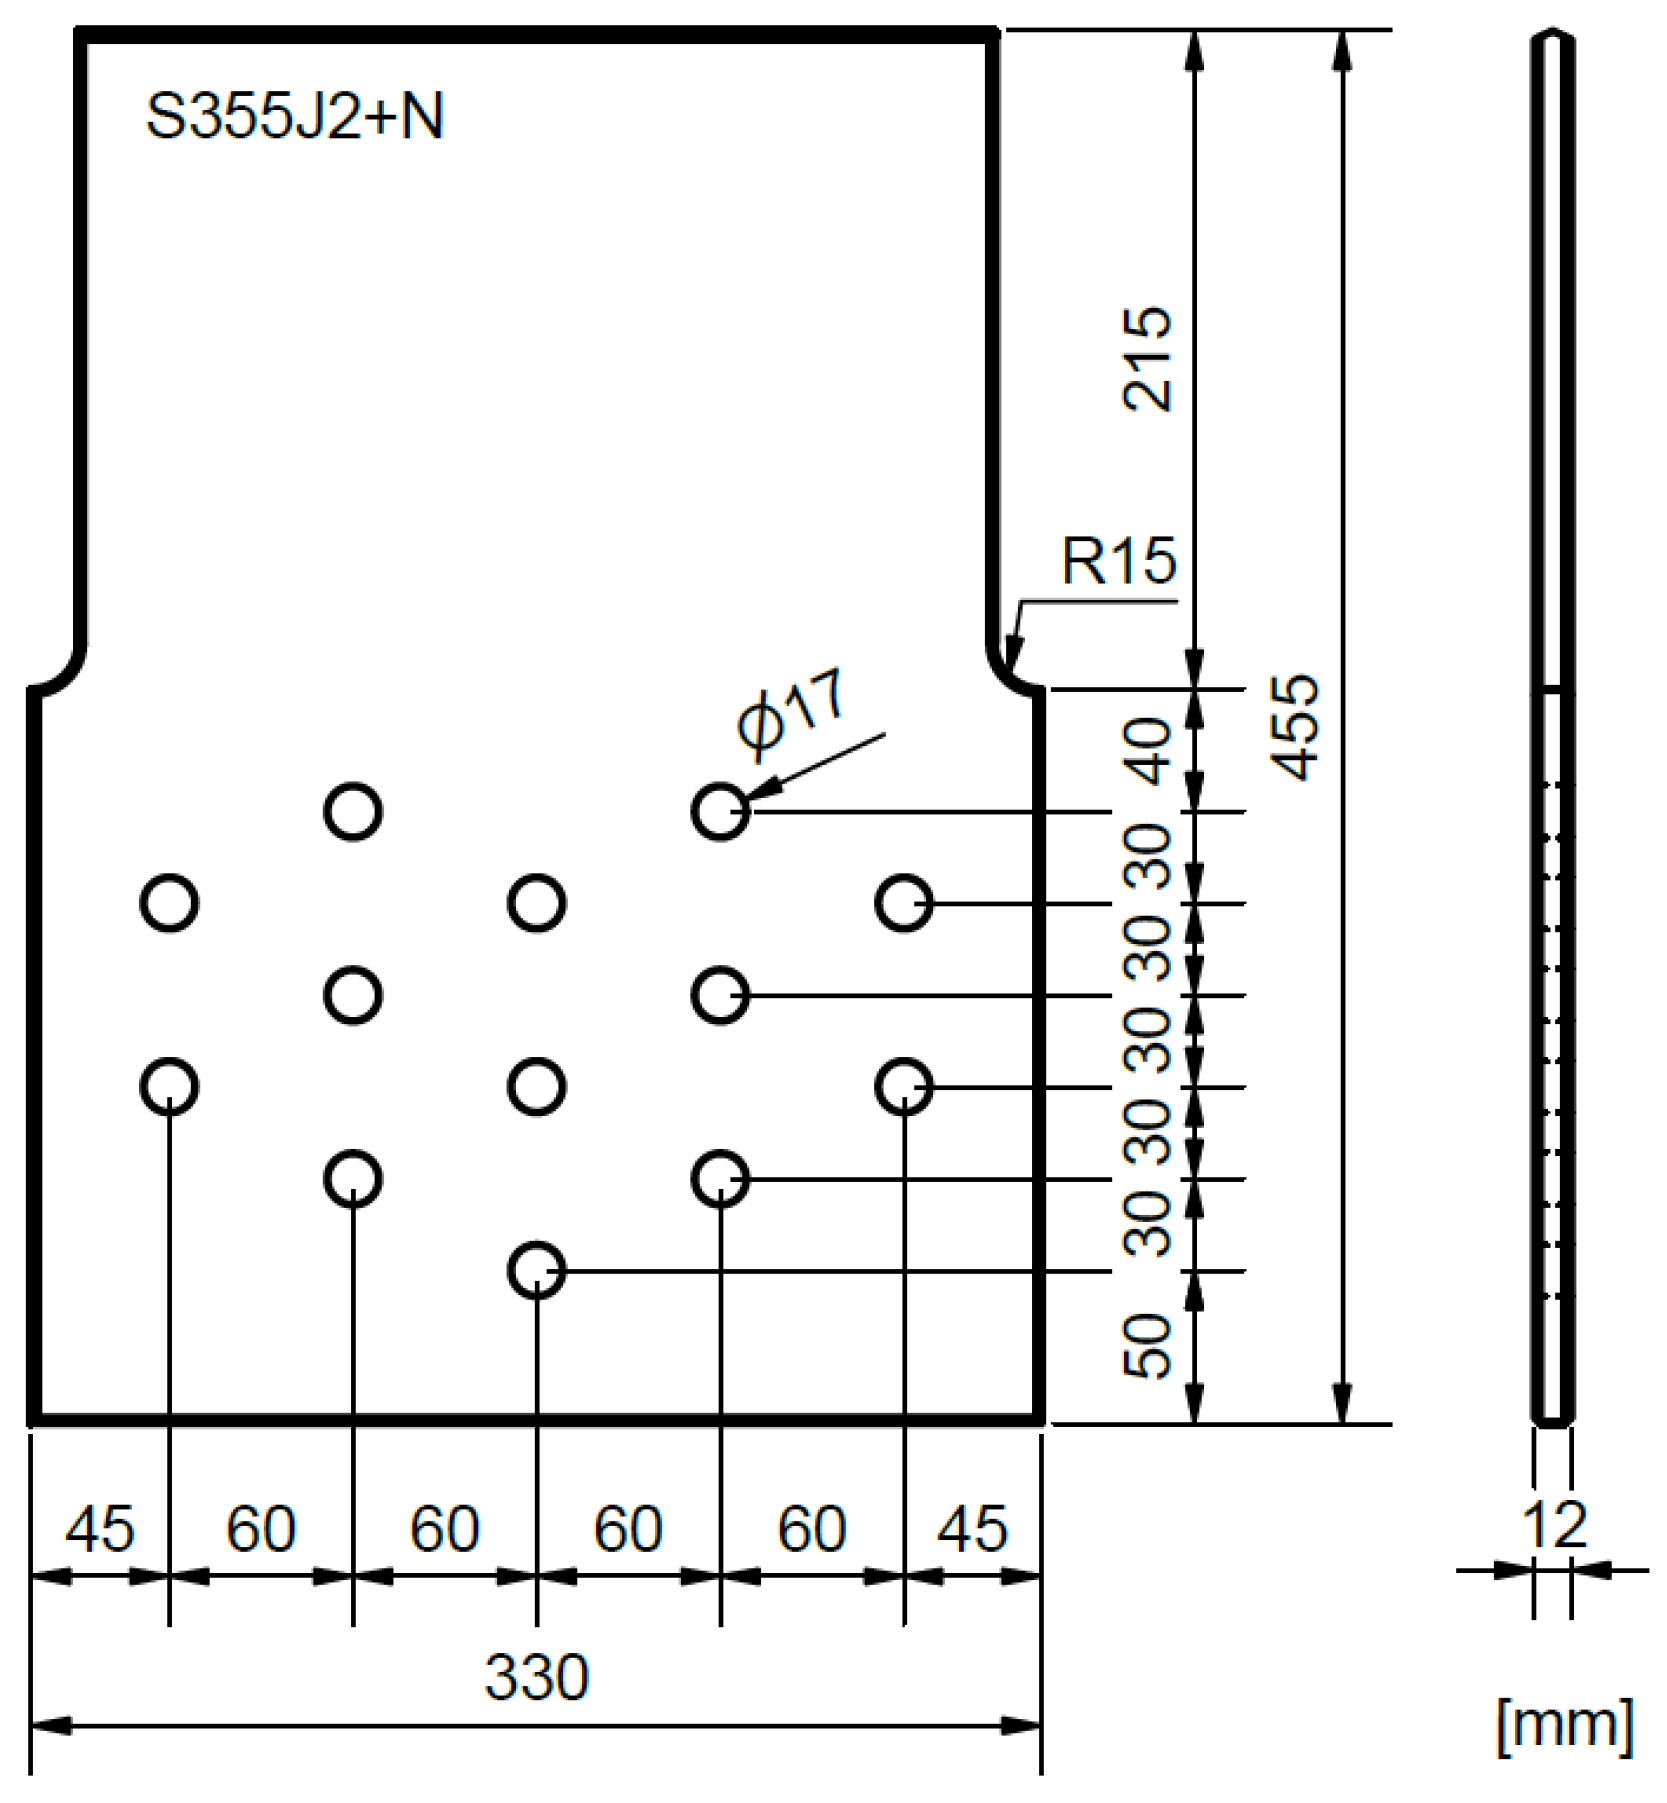
In order to implement the determined seam flanks movements in the welding tests in a reproducible way, a test setup was set up at the Institute of Steel Structures. A key factor in the planning and design was to enable multilayer welding on both sides. In the center of the test setup are the two base plates with a seam preparation. The geometry of the specimens is shown in
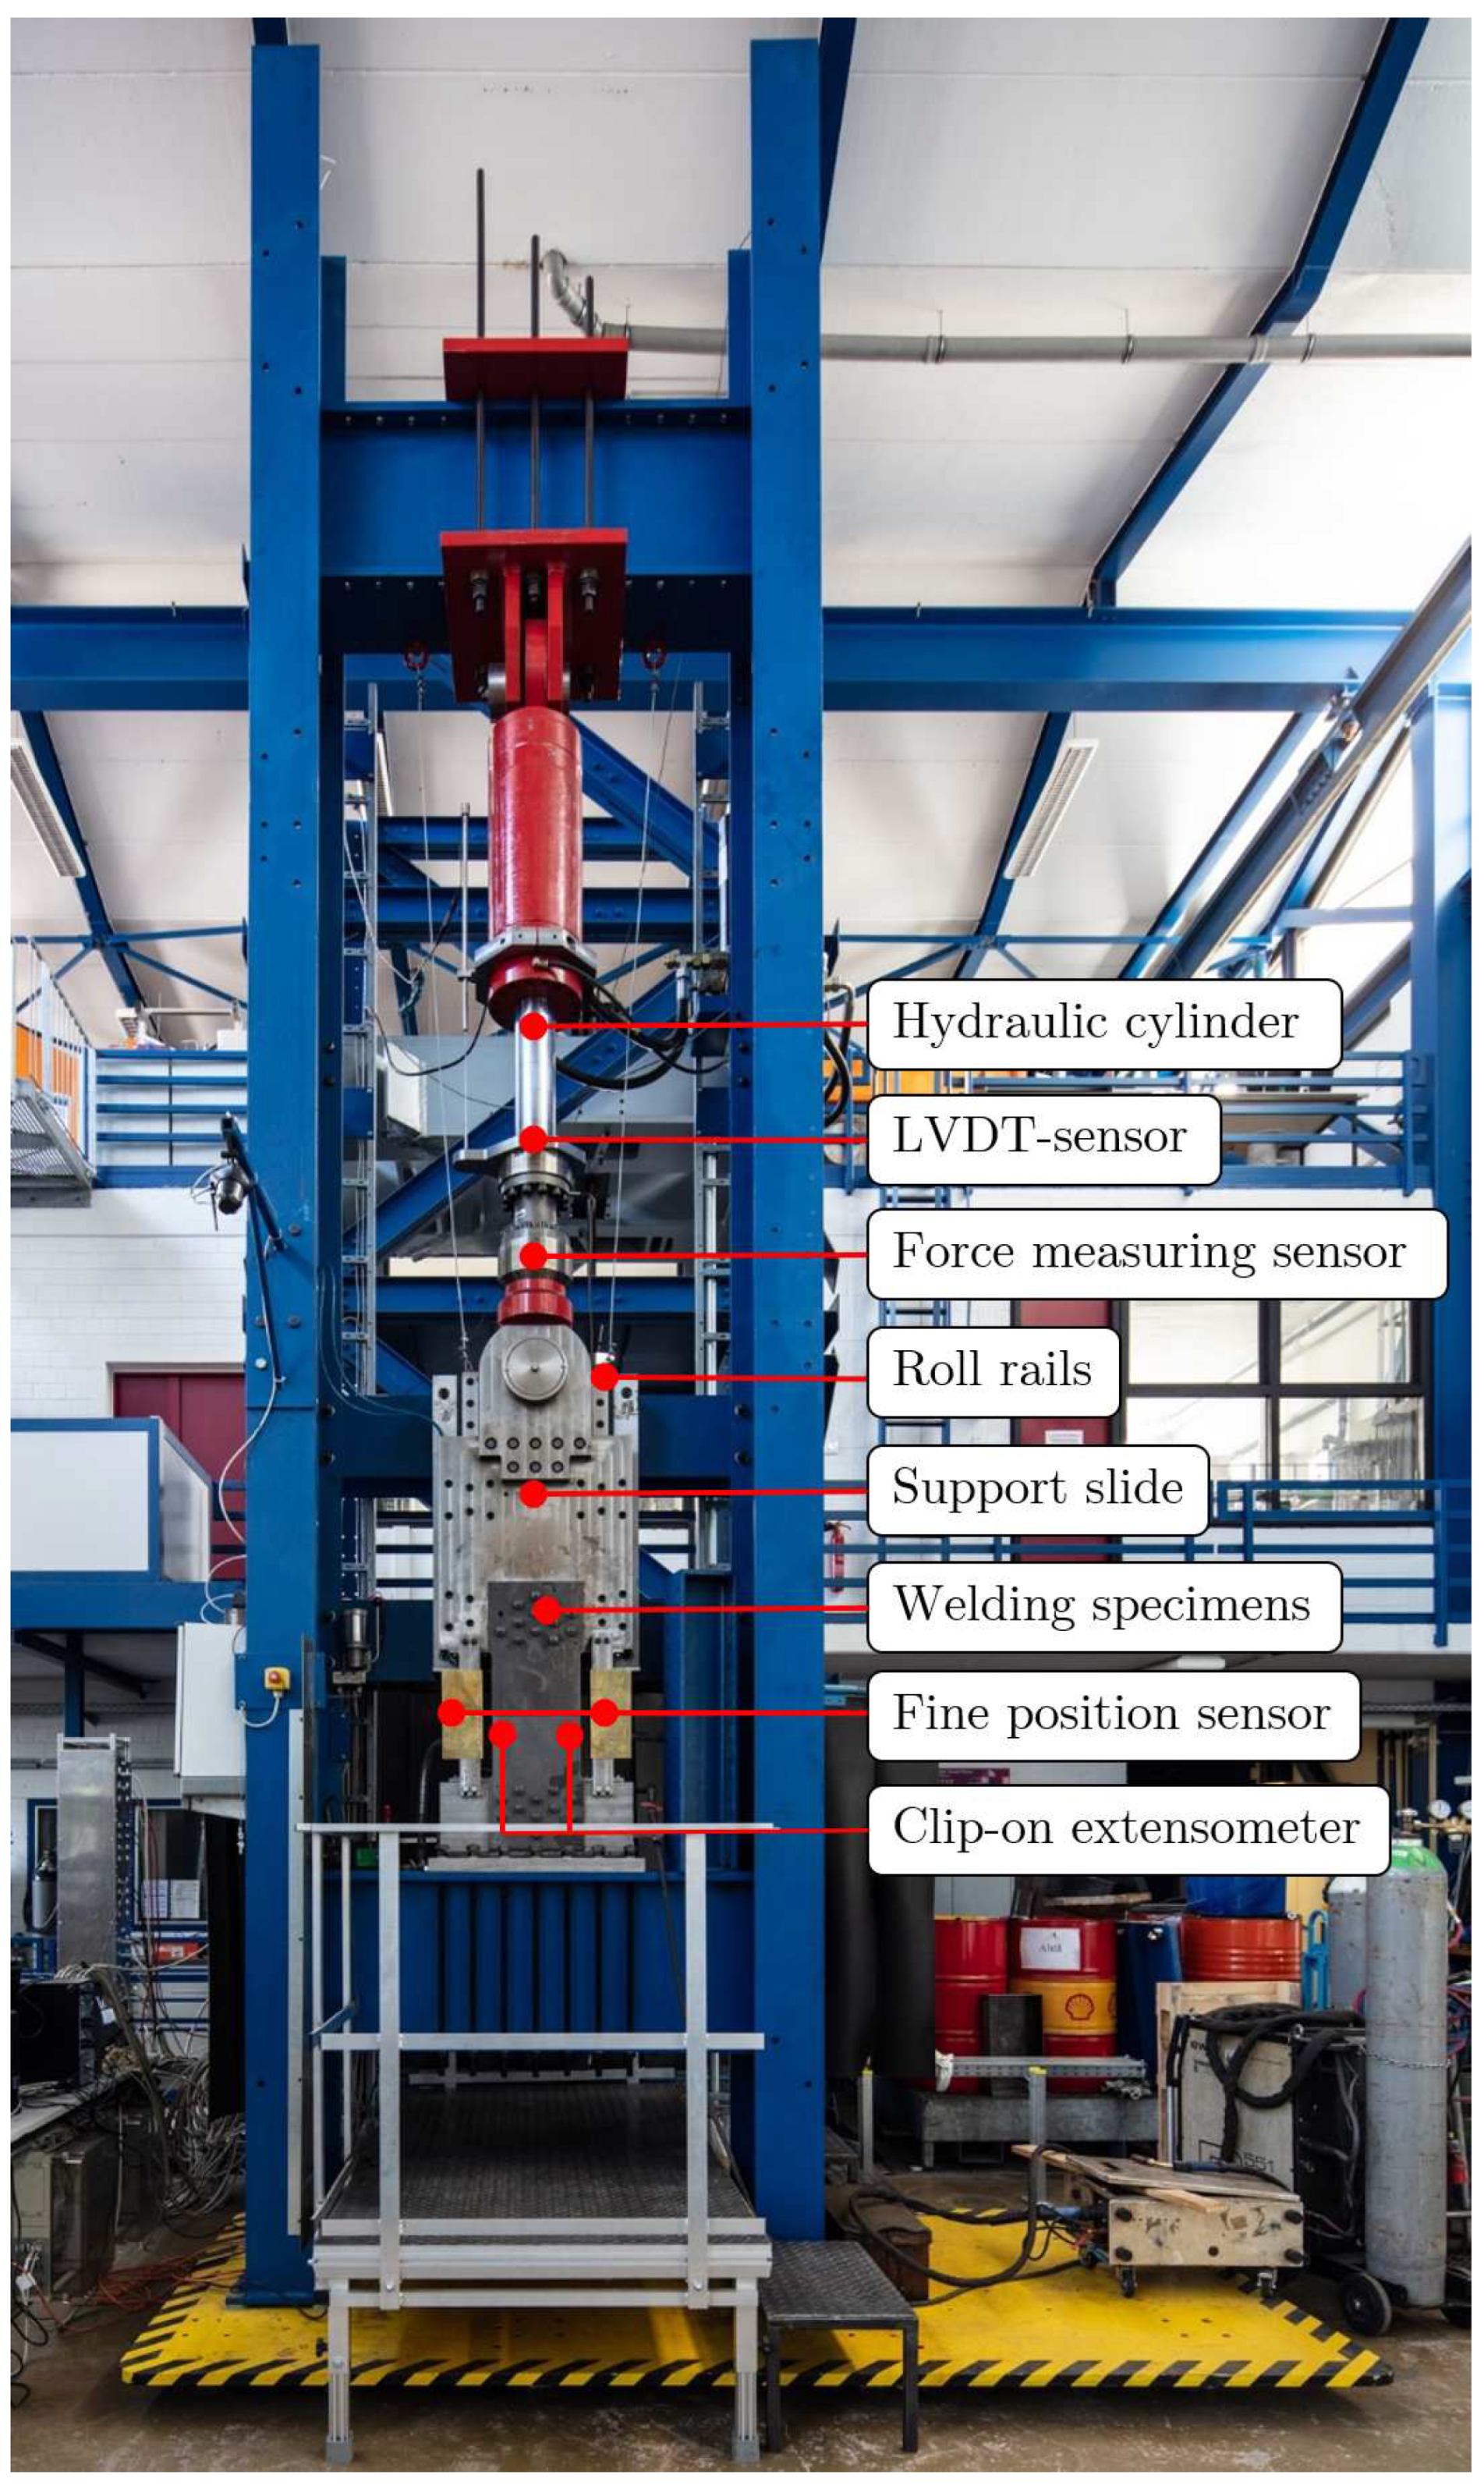
Figure 11. The lower base plate is fixed firmly to the girder of the frame structure via a connecting element. The upper plate is supported on a movable bearing slide so that it can be moved cyclically via the hydraulic cylinder (Hänchen 850 kN tension and 1250 kN compression) during the welding test. The bearing slide is guided almost friction-free on two roller rails. At the same time, the slide design absorbs the offset moments resulting from the force eccentricities during the welding process. This prevents the bearing slide from twisting and ensures that the seam flanks remain parallel and the hydraulic cylinder is not subjected to bending stresses. The specimens are fixed with fitted bolts to ensure the force transfer and that the specimen is fixed in position so that the slide movement is also transferred to the seam flanks during the welding test and does not disappear in the process. This aspect was important for the planning of the test setup in order to achieve consistent conditions during the welding tests. The test setup for the welding tests under cyclic loads is shown in
Figure 12.
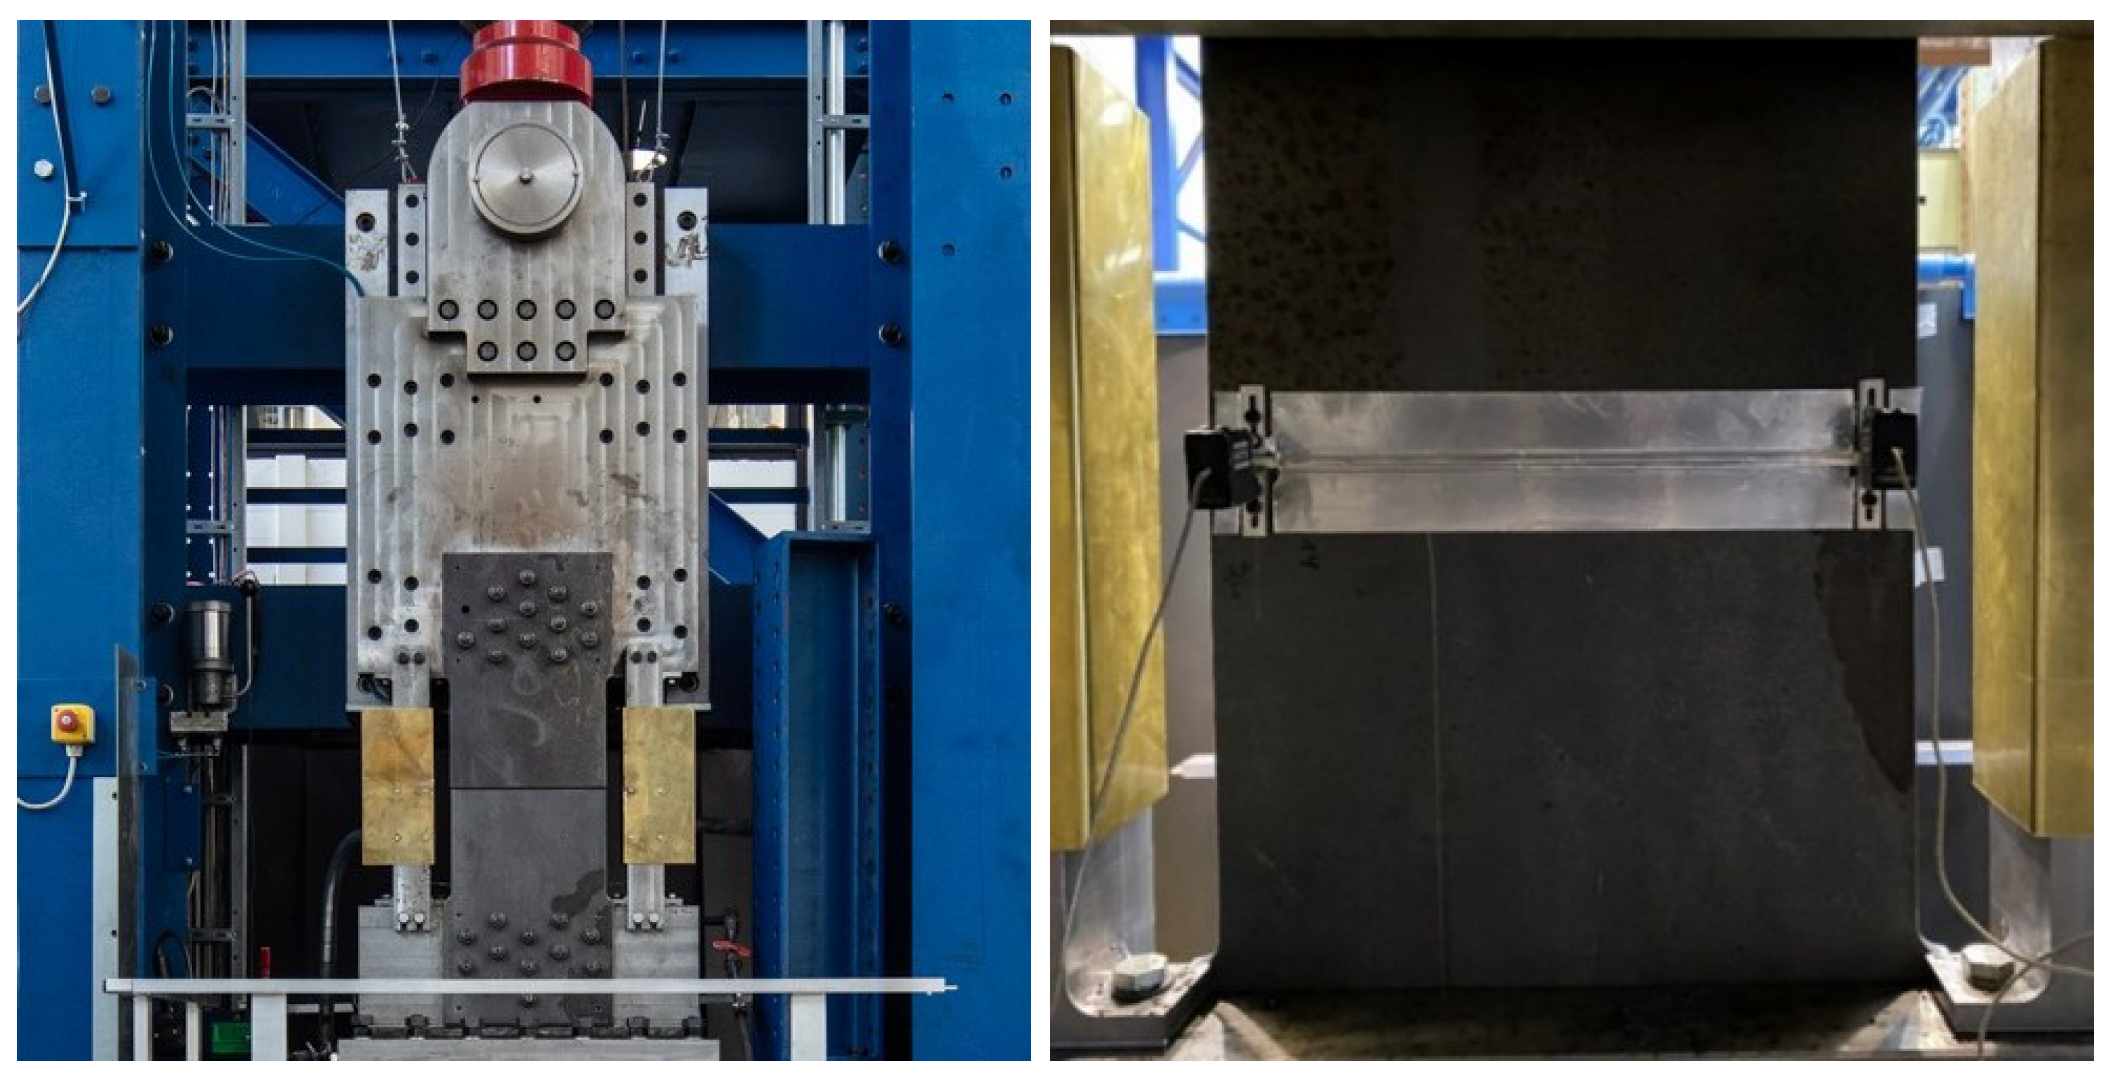
The test setup is equipped with a 1.2 MN force measuring sensor, a displacement sensor and an eddy current-based displacement measuring instrument. The force measuring sensor (type GTM serie RF) is integrated directly into the hydraulic cylinder via individually manufactured adapters. The displacement sensor (type Trans-Tek F-7) is a linear variable differential transformer (LVDT) based on an inductive measuring principle. The LVDT sensor is coupled to the hydraulic cylinder for rough positioning of the bearing slide, especially for specimen installation and removal. For the eddy current-based displacement measurement system, two displacement sensors (type Micro-Epsilon eddyNCDT 3300) are used to record the slide movement during the welding test. The fine displacement sensors are positioned under the bearing slide, on both sides next to the specimen as shown in
Figure 13.
The fine displacement sensors only record the slide movement during the welding test. As soon as force is transmitted via the welding of the root layer, the relative displacement between the seam flanks is less than the actual slide movement, due to the elastic deformation of the specimens. Direct measurement of the relative displacement with the fine displacement sensors is desirable, but not possible due to thermal and mechanical influences. In order to detect the actual relative movement between the seam flanks, two clip-on extensometers (type MTS model 632-02F-20) are used during the welding test. As shown in
Figure 13, these are attached to the back of the specimen directly at the level of the seam flanks via two cutting edges on each side. In this way, the relative seam flank displacement during the root weld and the cover layers are recorded.
2.4. Welding under cyclic loads
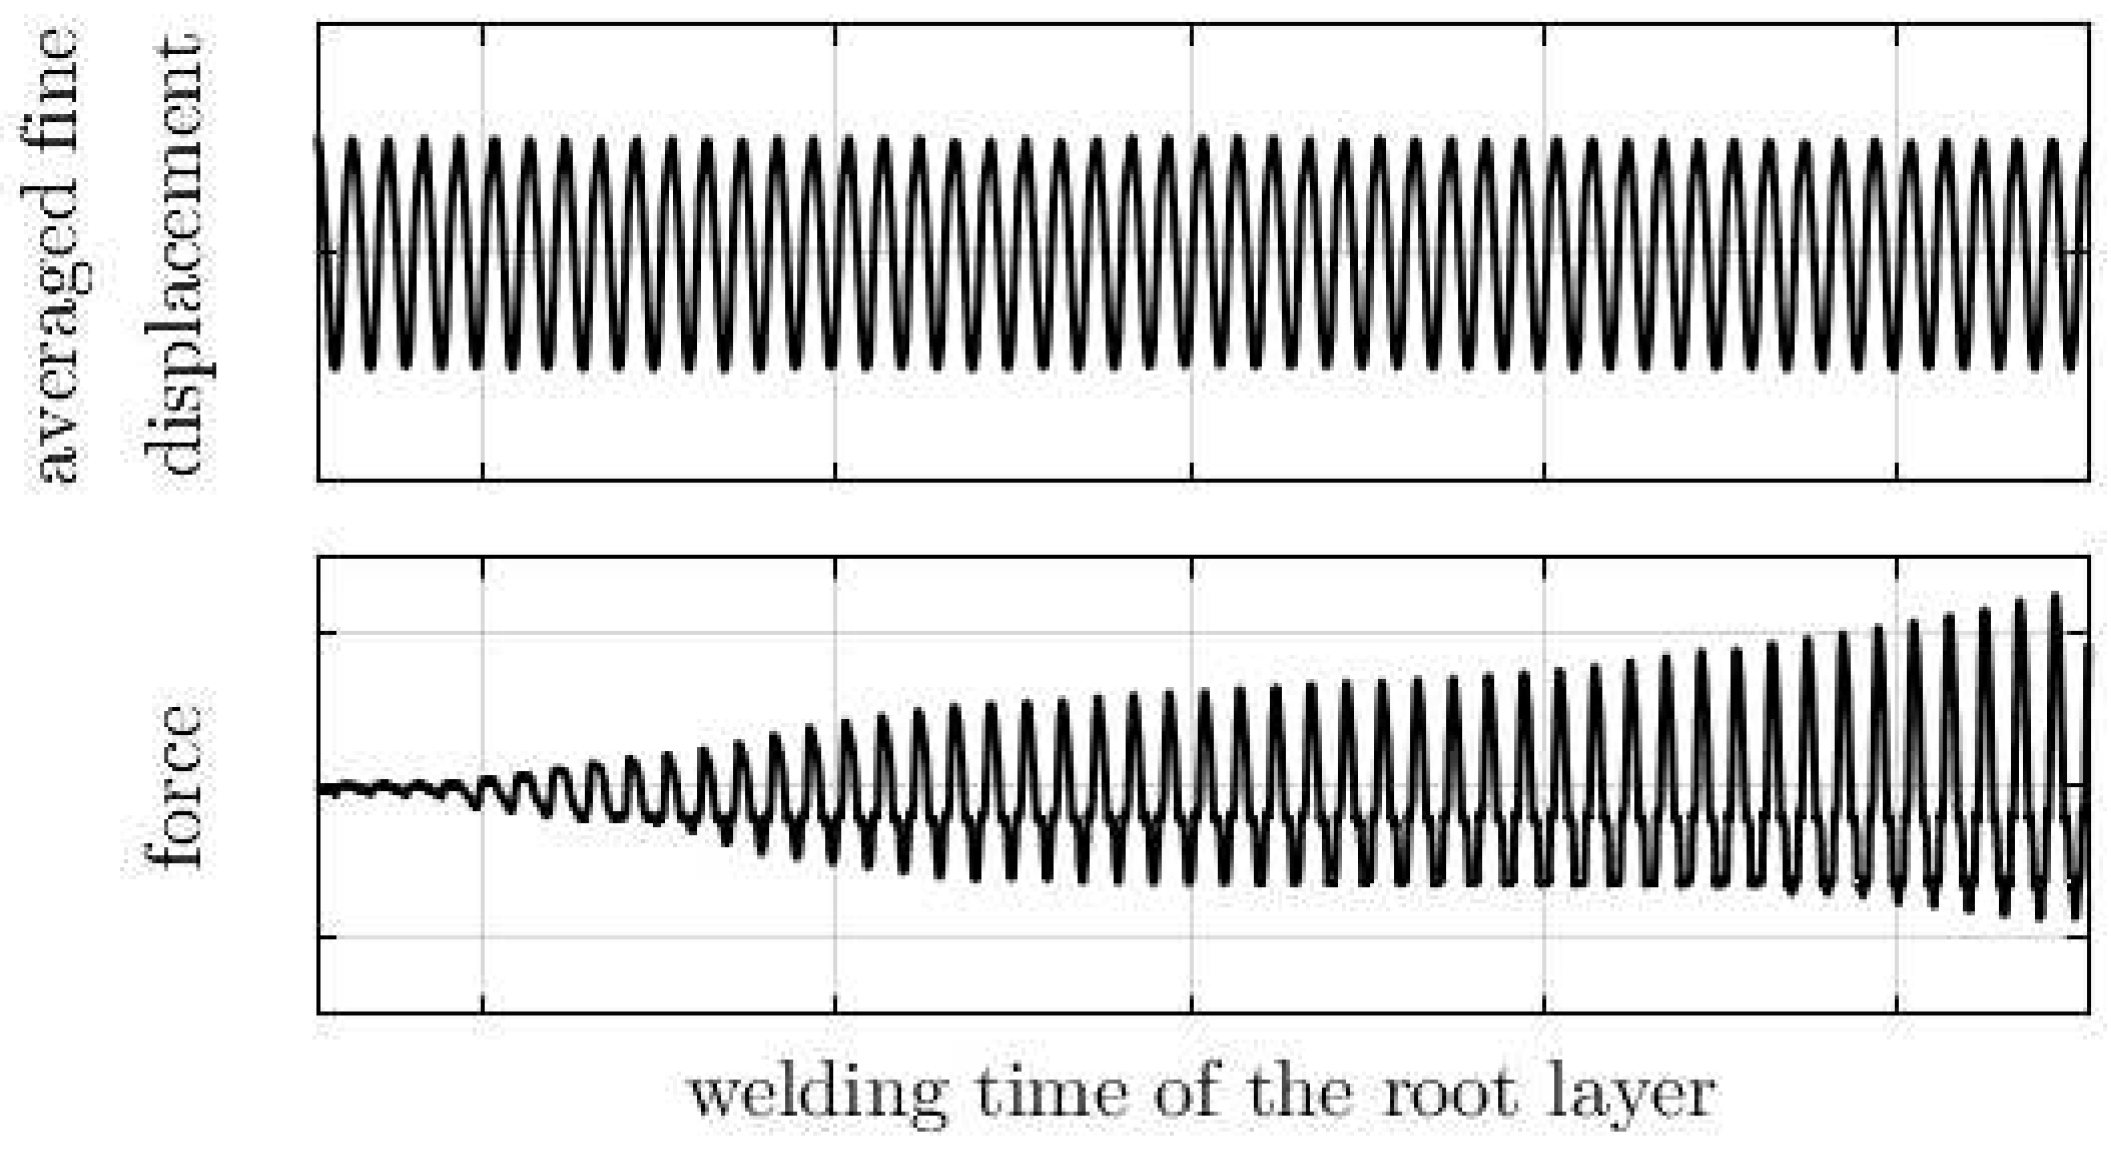
The welding tests were realized in displacement control. The displacement is controlled via the averaged fine displacement of the two eddy current sensors, namely the movement of the bearing slide. Before the welding process, the averaged fine displacement represents the seam flank displacement between the two specimens and therefore the signal from the clip-on extensometer. There is no force transfer between the two test specimens. The force increases with the start of welding as shown in
Figure 14 for the total welding duration of the root layer.
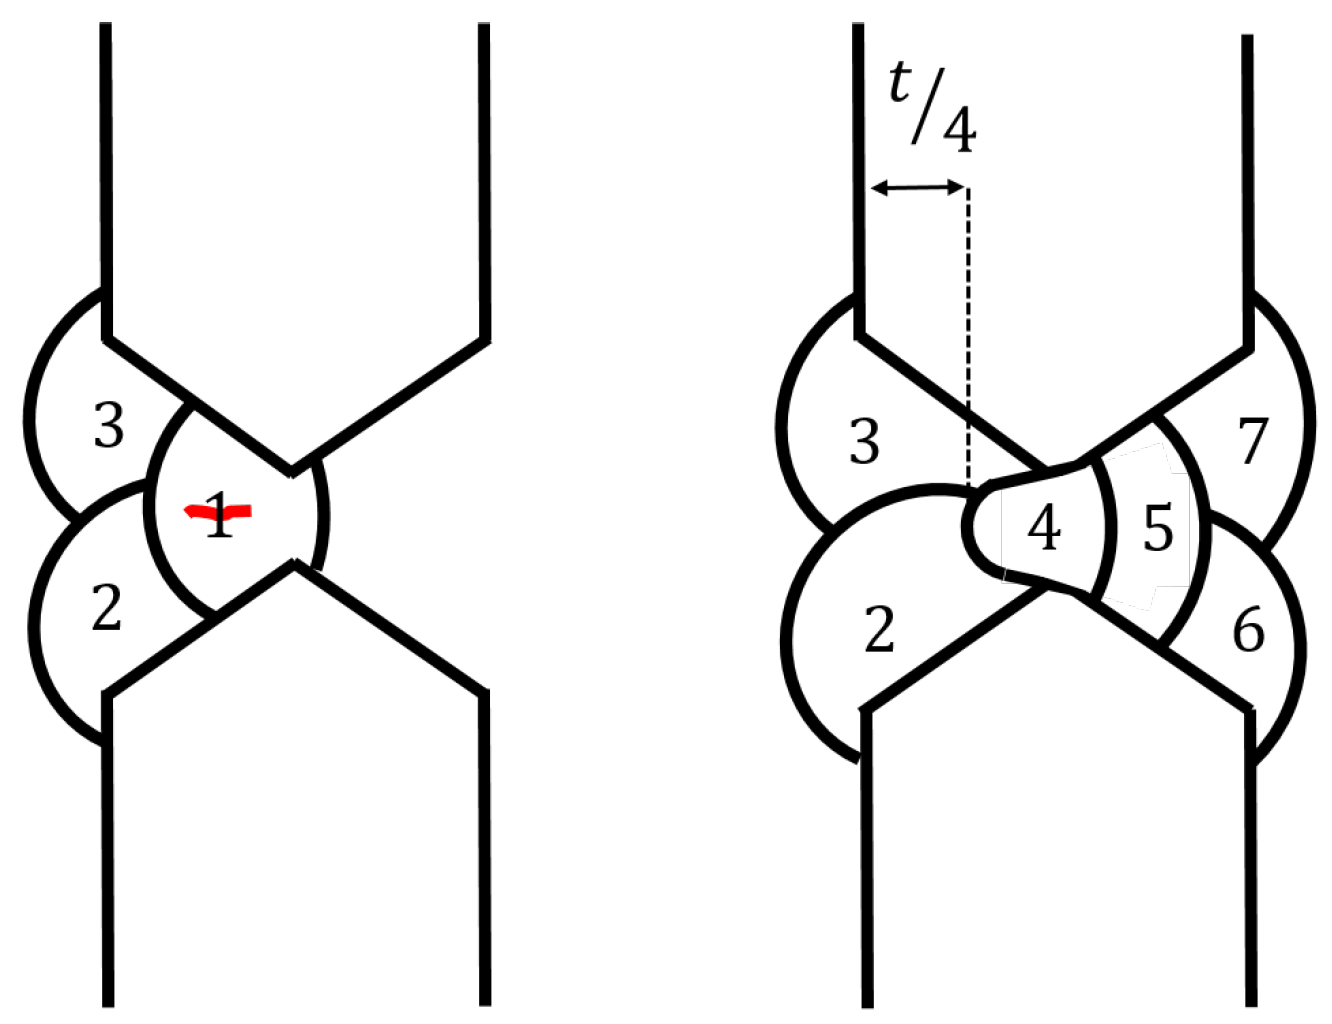
For the welding under cyclic loads a welding sequence was applied which bases on the repair method described in
Section 1.2. After finishing the first side of the weld, the root layer is ground out until approximately 1/4 of the sheet thickness is left, compare
Figure 15.
2.5. Fatigue tests
From each welded specimen in
Figure 11 three fatigue test specimens, as shown in
Figure 16, were extracted via water jet cutting and the contour was milled to eliminate the surface roughness resulting from the water jet cutting. For the geometrical characterization of the specimens, more precisely the welded joints, and the classification into quality groups according to ISO 5817 [
20], all specimens were measured using a laser triangulation sensor (type Micro-Epsilon optoNCDT1800). The scans were conducted along three lines on the front and three lines on the back of the specimens, compare 16.
From all six laser scanning lines of a specimen the most critical for the considered quality criterion was chosen and used for the quality assessment. The three quality criteria investigated here were the axial misalignment of the plates, the excessive weld overfill and the weld angle. Via that the specimens were classified into quality groups according to ISO 5817 [
20]
3. Results and discussion
3.1. Qualification of welding process
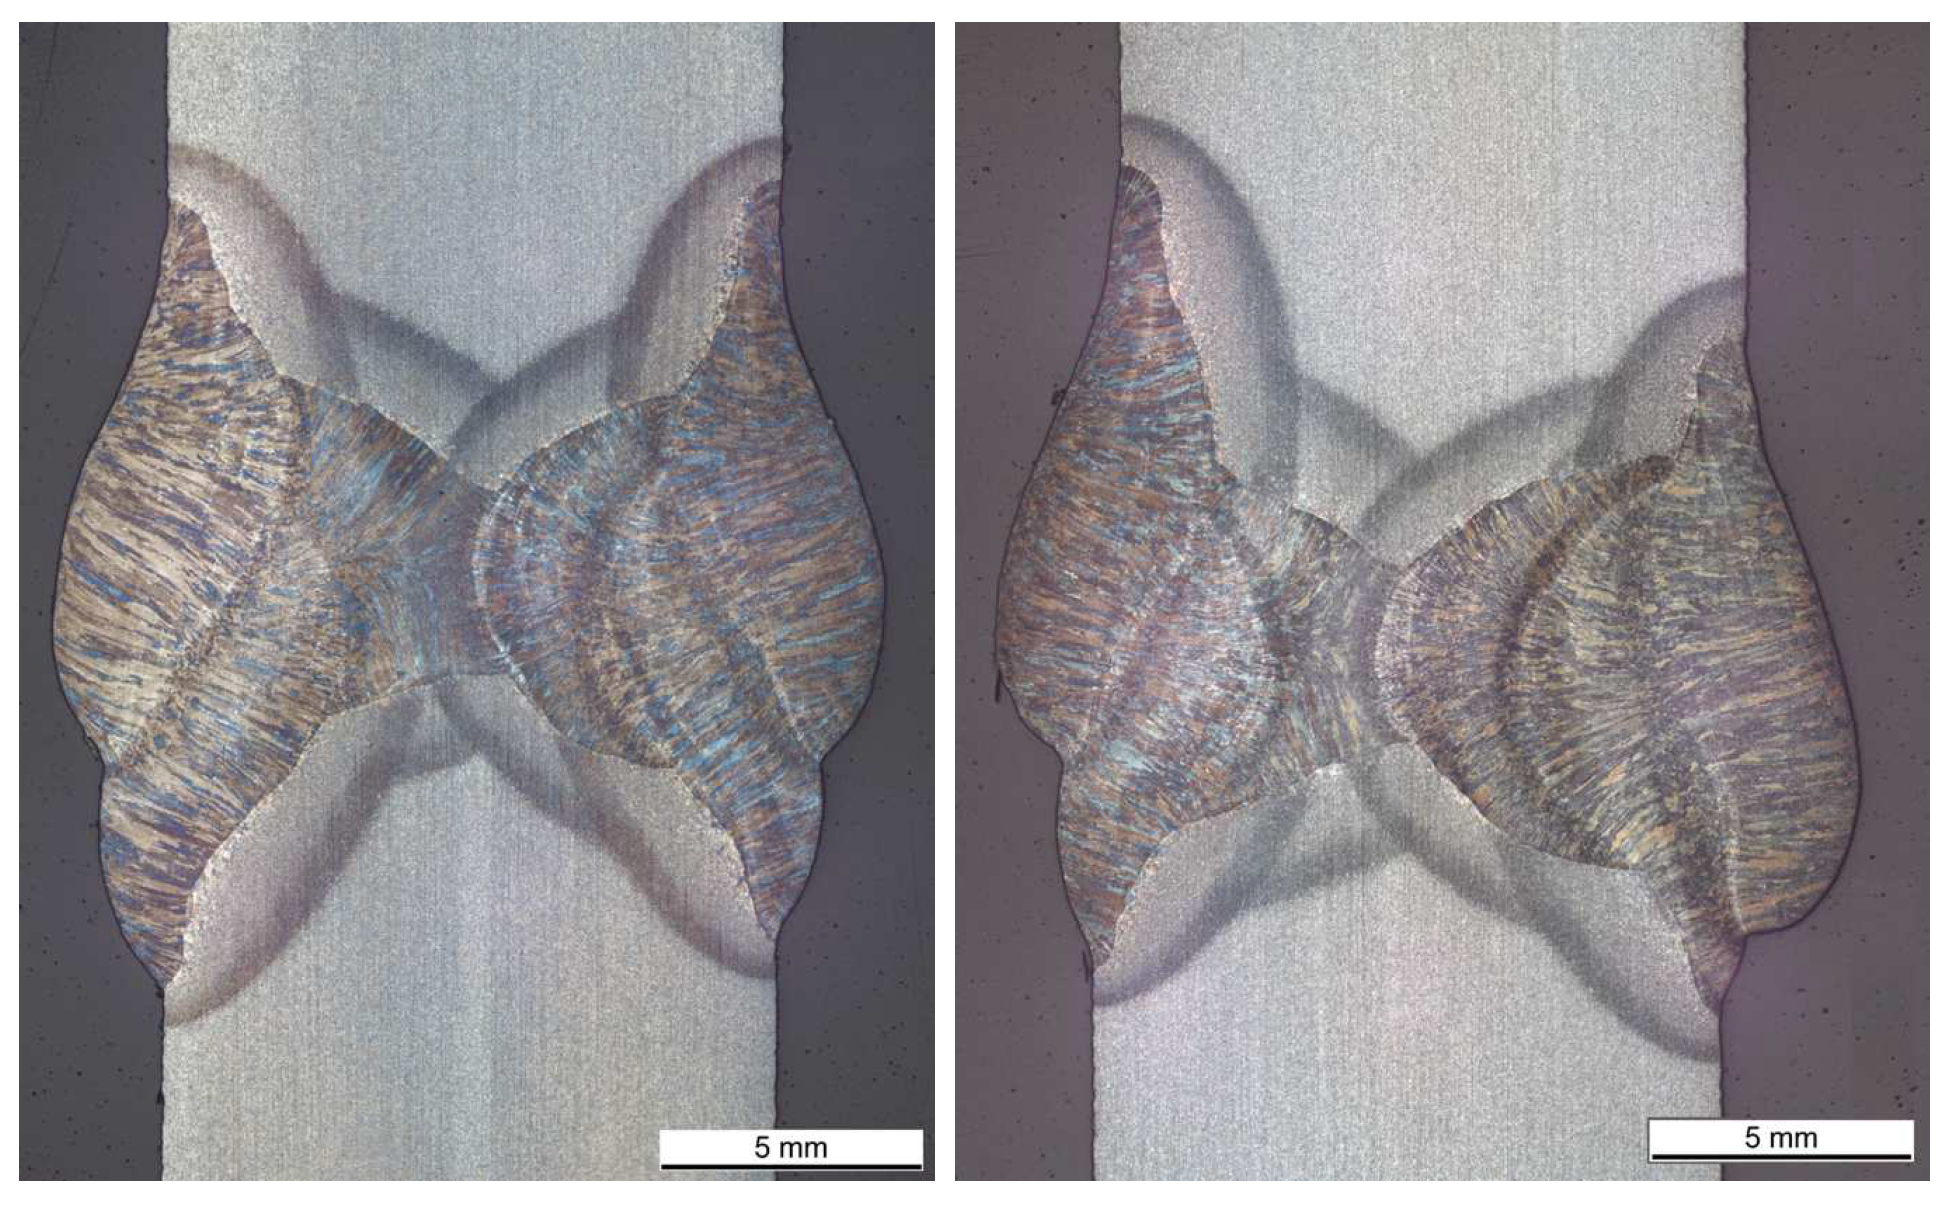
The implementation of the welding procedure specification and the subsequent evaluation of the joints via macro- and microsections, hardness tests and tensile tests were conducted in the context of preliminary welds. From the fabricated specimens two metallographic specimens, two tensile test specimens and one bending test specimen were extracted. The macrosections in
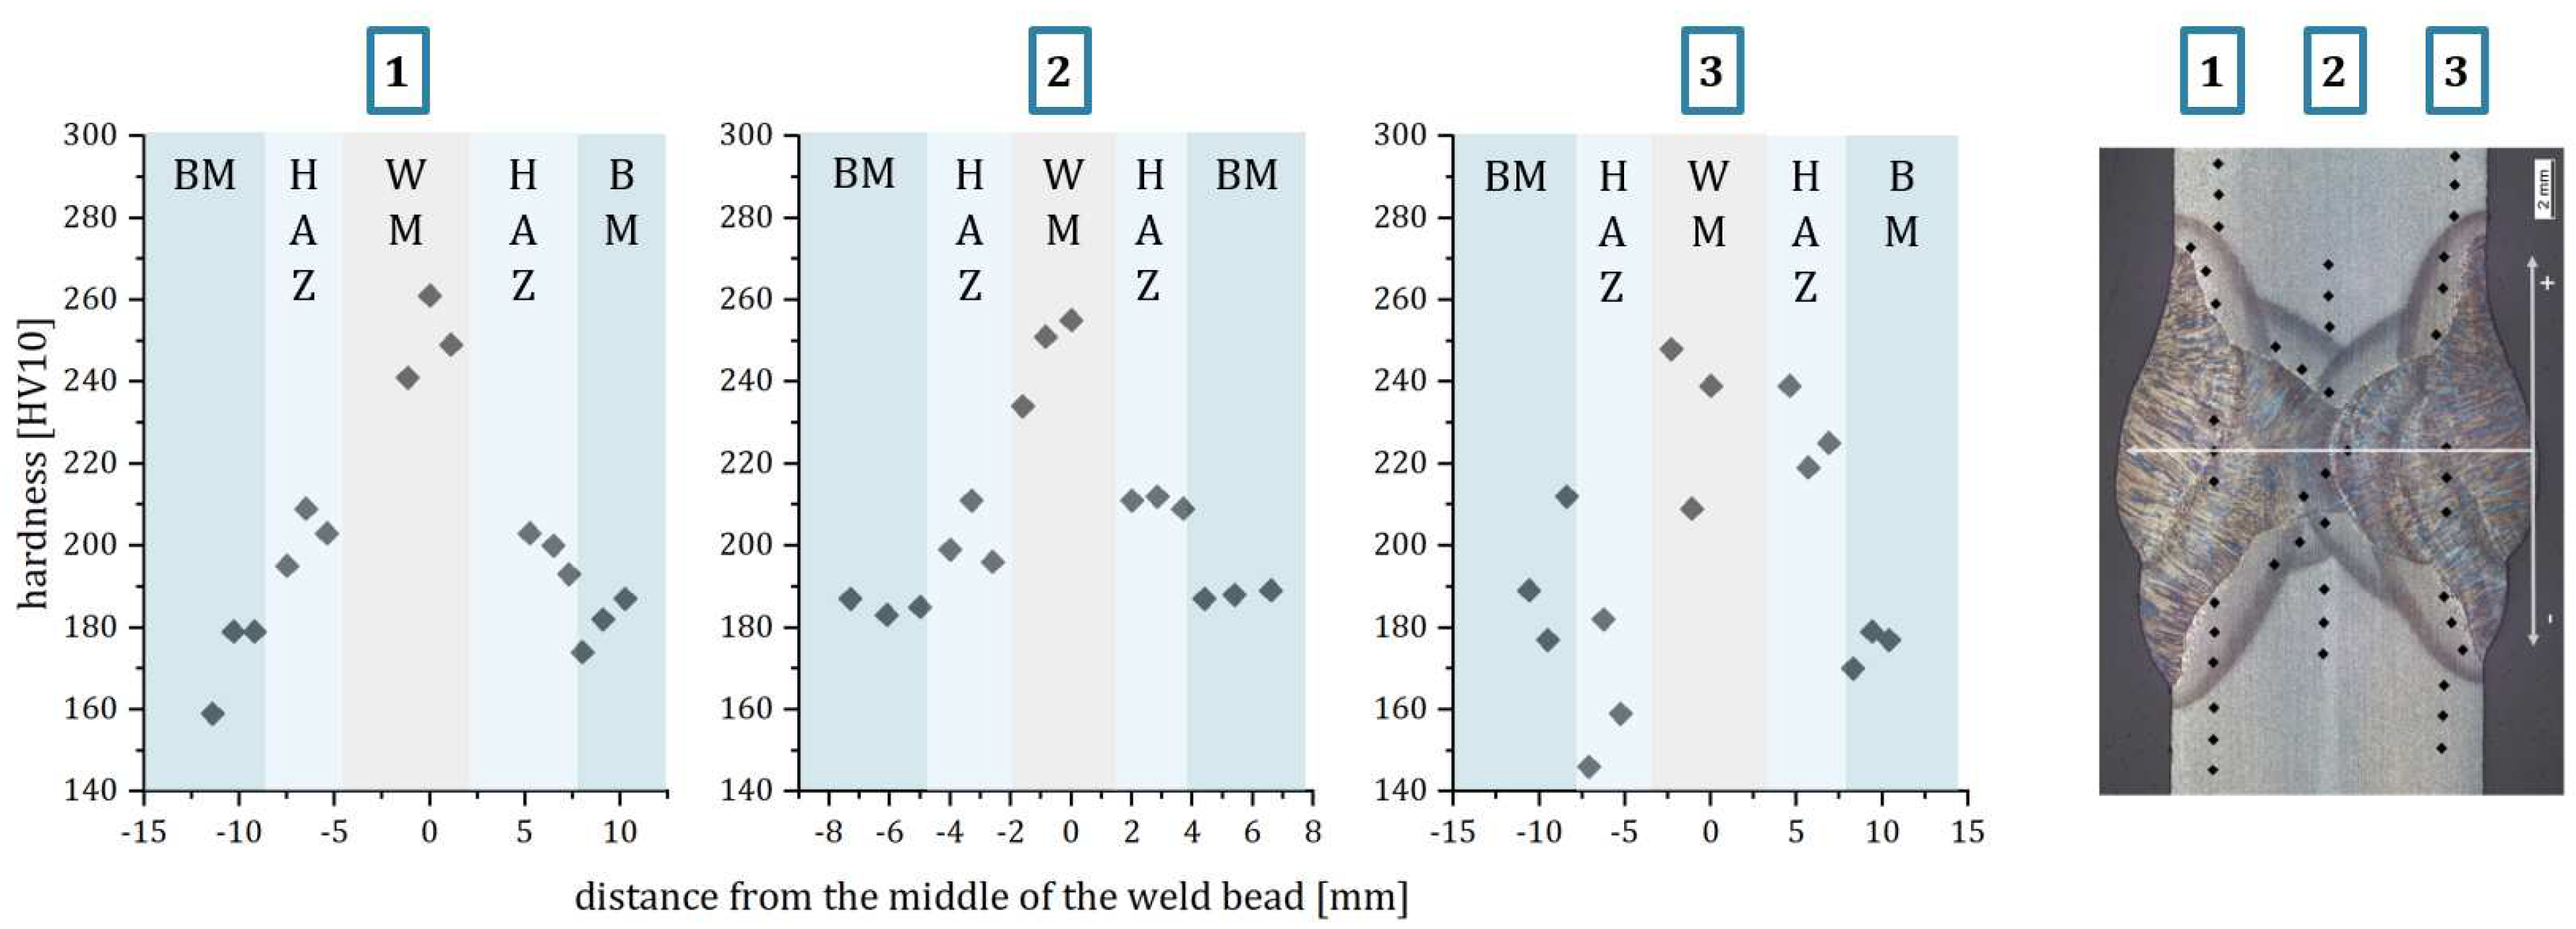
Figure 17 show no irregularities or inner defects. The results of the hardness testing are depicted in
Figure 18. The requirement regarding maximum hardness for this material is <380 HV10. The results show, that the weld metal has the highest hardness with 260 HV10.
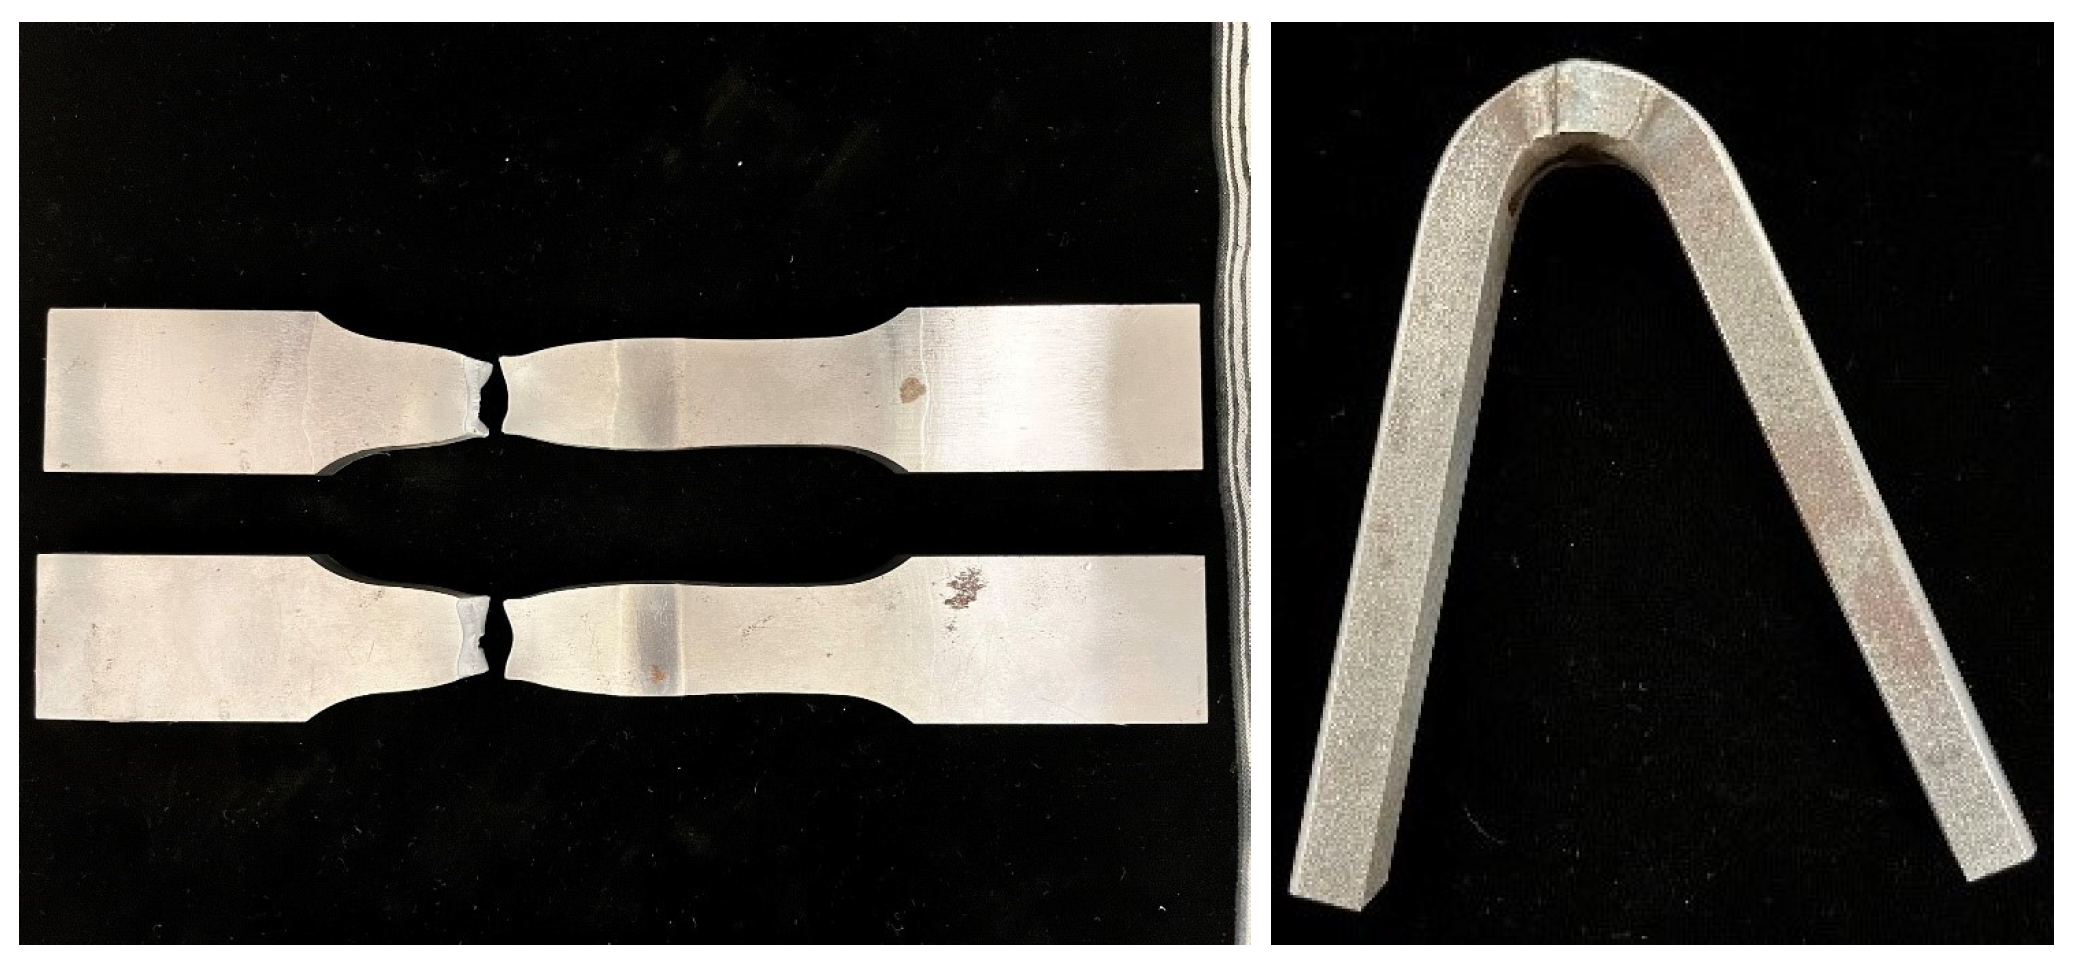
Tensile tests to determine the tensile strength were conducted with two specimens. Both specimens showed a tensile strength of 565 MPa and the failure was in the base metal, compare
Figure 19 a). The bending test (lateral bending test transverse to butt weld) was conducted up to 145 ° and resulted in crack-free samples. After the successful implementation of the welding procedure specification, the welding parameters were applied to the manufacturing of fatigue test specimens.
3.2. Measurements of the crack movement
From the continuous measurements, gap opening parameters for the amplitude and the frequency in the test setup were derived.
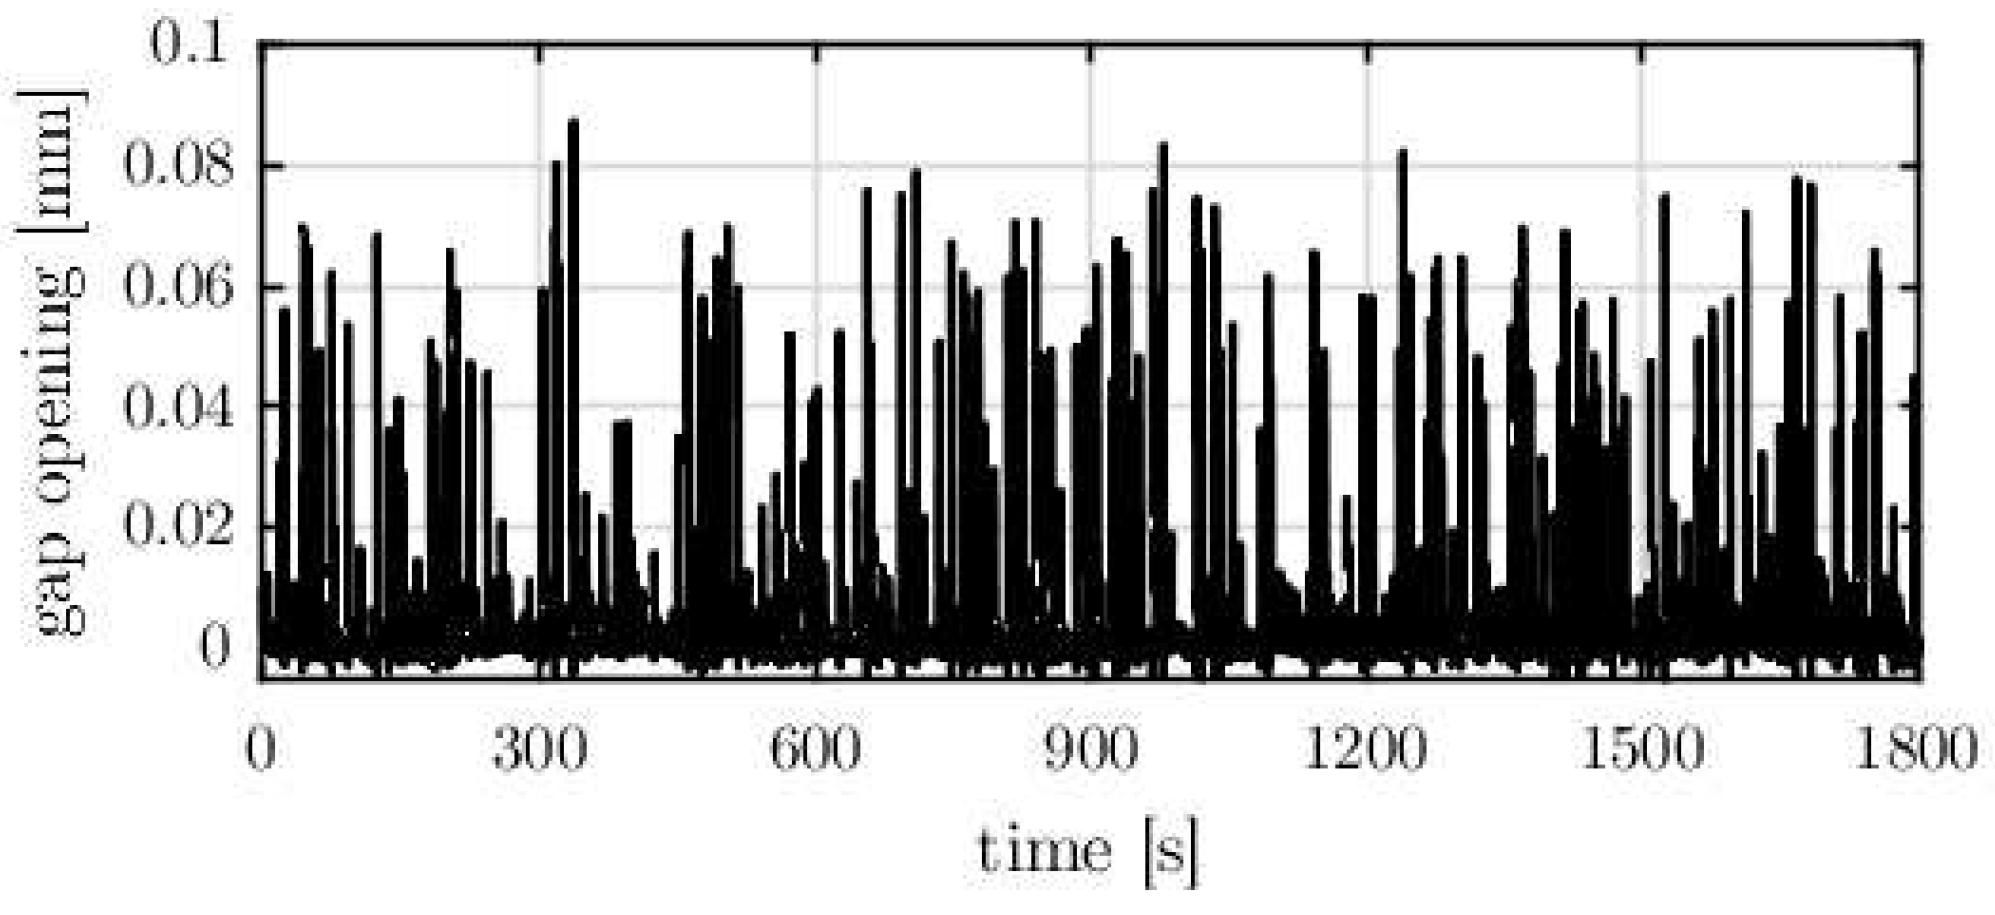
Figure 20 shows a half-hourly extract of the measurement data as an example. The data is representative for a working day during the rush hour.
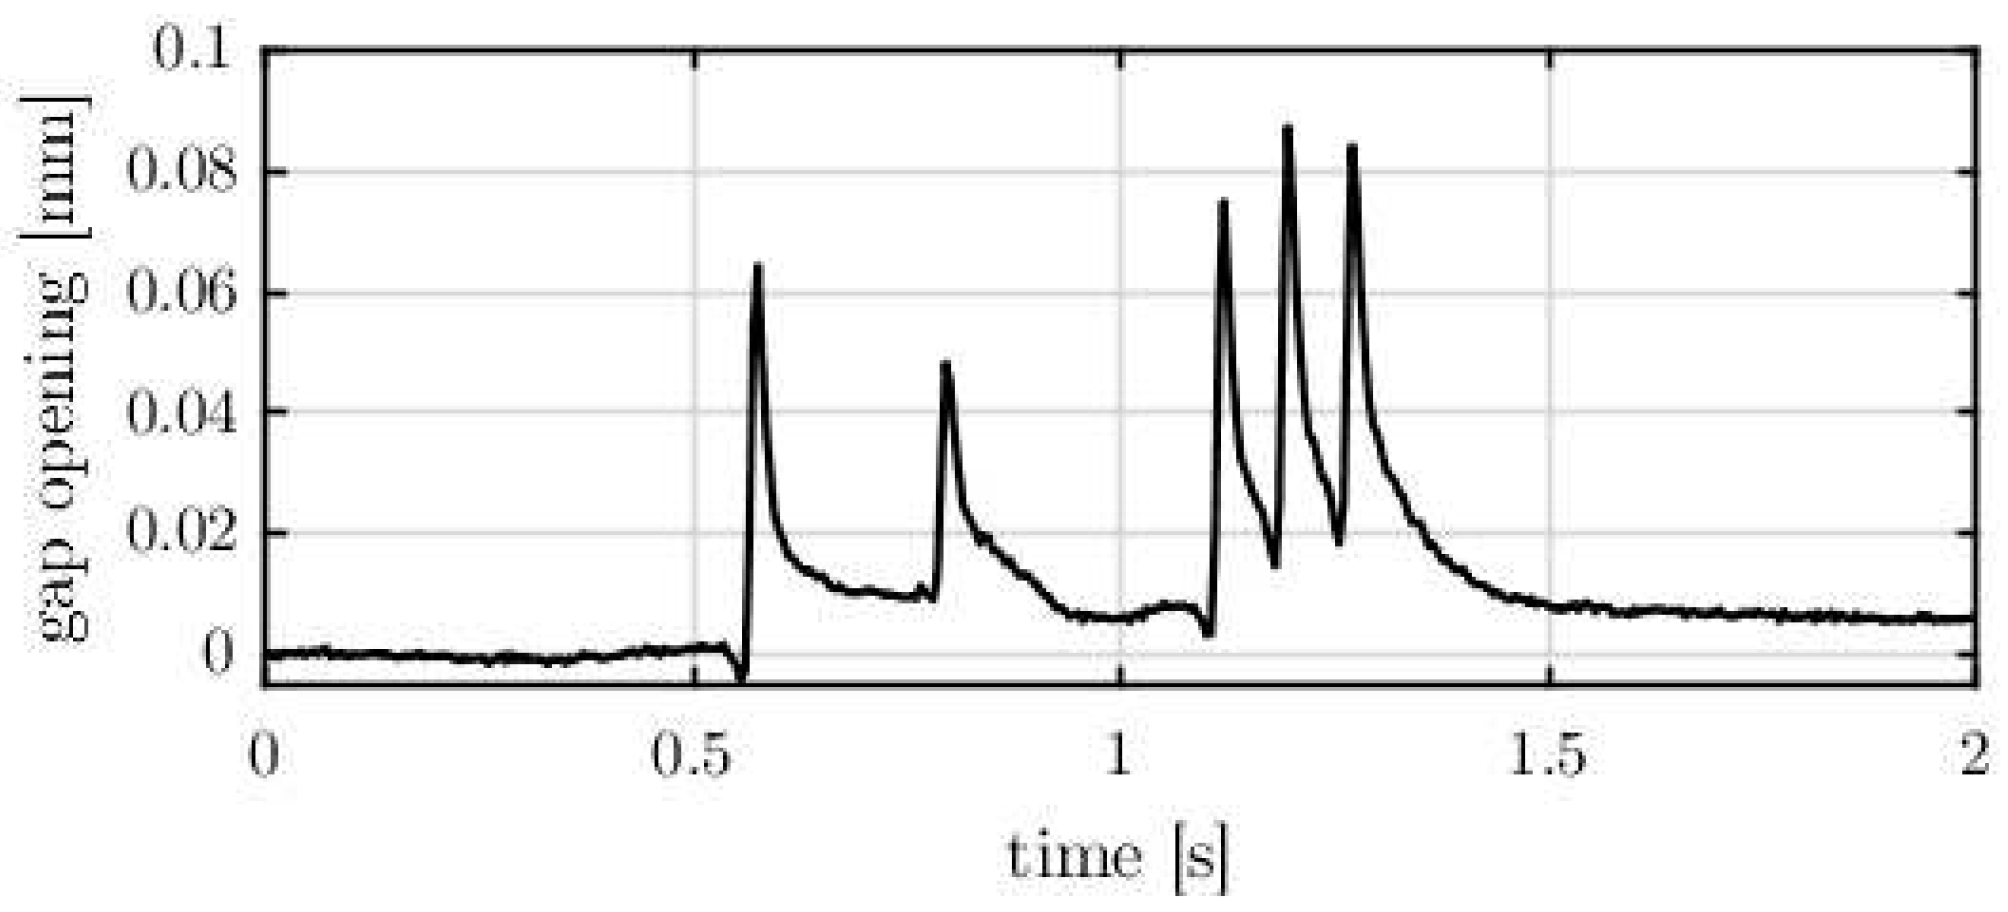
The vehicle crossings cause rapid changes in the measurement signal for the gap opening. The monitoring system has a measurement rate of 200 readings per second so that the vehicles can be detected axis by axis. This statement was confirmed by matching with temporary traffic recordings. It should be noted that the vehicles travel on different lanes and therefore have no constant influence on the gap opening. In addition, the vehicle weights, especially of the trucks, are unknown. However, basic statements can be made by evaluating the largest amplitude in the measurement signal by a rainflow analysis to derive reference values for the gap opening parameters of amplitude and frequency. During a vehicle crossing, gap openings with a maximum of 0.1 mm were measured, which are occuring in a frequency range of
Hz. It should be noted that the frequency range is higher when the individual axes of a vehicle are analyzed. For example, the measurement signal of a single vehicle crossing is shown in
Figure 21. The first two peaks can be associated with the truck cab and the three higher peaks with the truck trailer.
3.3. Welding tests under cyclic loads
Based on the determined gap opening parameters and the implemented preliminary welds, initial welding tests were realized in the test setup (cf.
Figure 12). In general welding under cyclic loads is possible. Up to an initial amplitude of 0.1 mm with a frequency of 2 Hz, cracks on the surface or during the welding process could not be detected optically. Smaller hot cracks, which inevitably appear in the root layer, are removed by deep grinding out the root layer during the welding process.
At higher amplitudes, cracks occur over several welding layers during the welding process. These cracks rapidly grow during welding under cyclic loads and were not repairable through grinding and welding again.
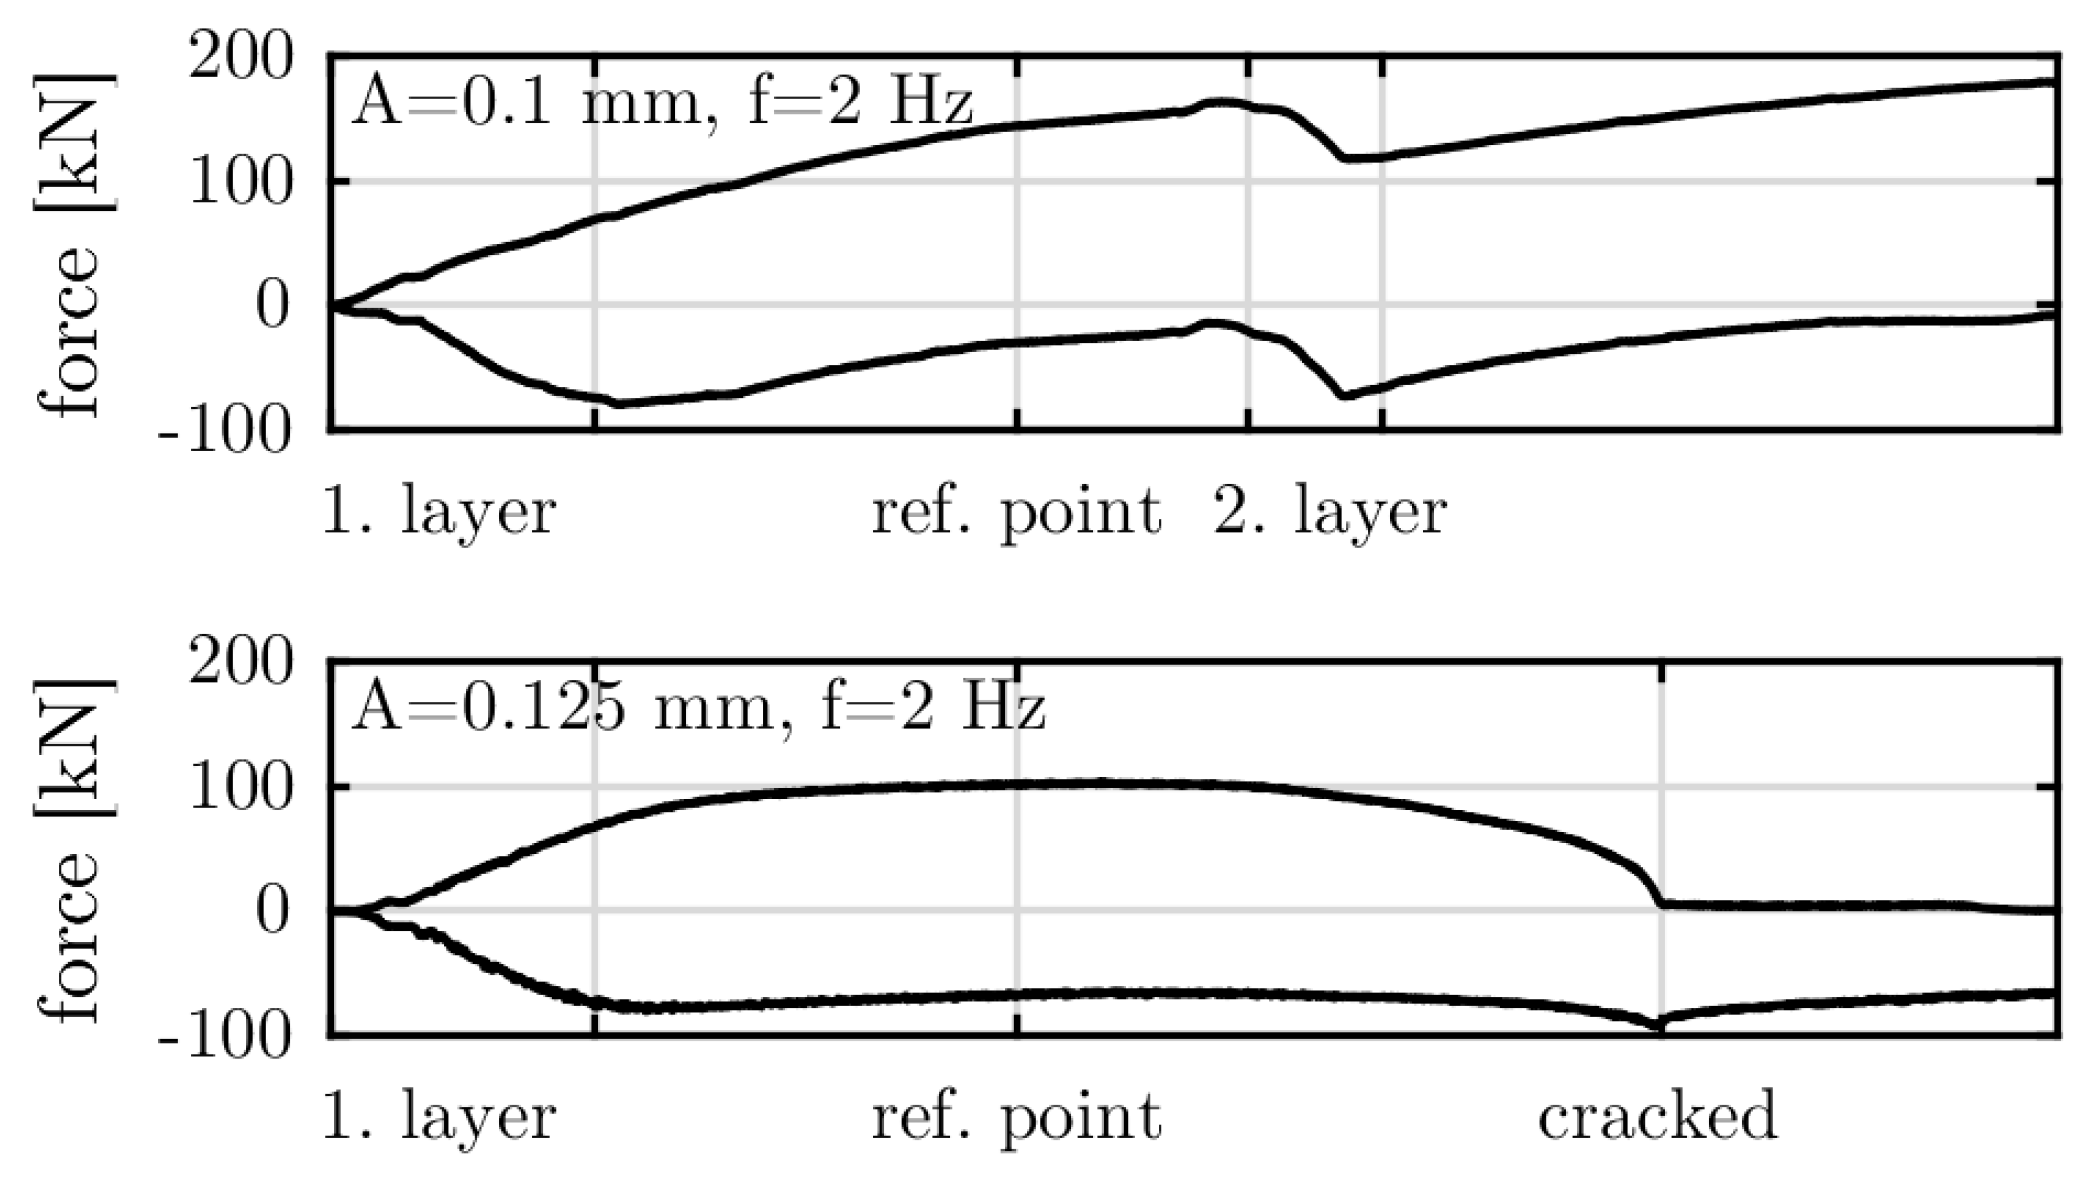
Figure 22 shows the minimal and maximal value of the force signal for an amplitude of 0.1 mm and 0.125 mm with the same welding procedure. The individual welding layers can be recognized by the drop in force during a welding break. This drop results from the cooling of the specimen.
Figure 22 a) shows the welding of a force transmitting root layer. At the beginning of the experiment, the force is zero, the plates are not yet welded and thus no force is transmitted. As the welding progresses and the weld metal solidifies, force can be transmitted and the peak values increase. This process is superimposed by the thermal expansion of the material due to the the welding process.
Figure 22 b) shows the welding of a completely cracked root layer. In this experiment, force initially builds up during welding. However, cracks develop at the same time and grow rapidly. Immediately after the first layer, the force increases more slowly until the highlighted reference point. At this point the force decrease to zero, and welding of the root layer is not possible.
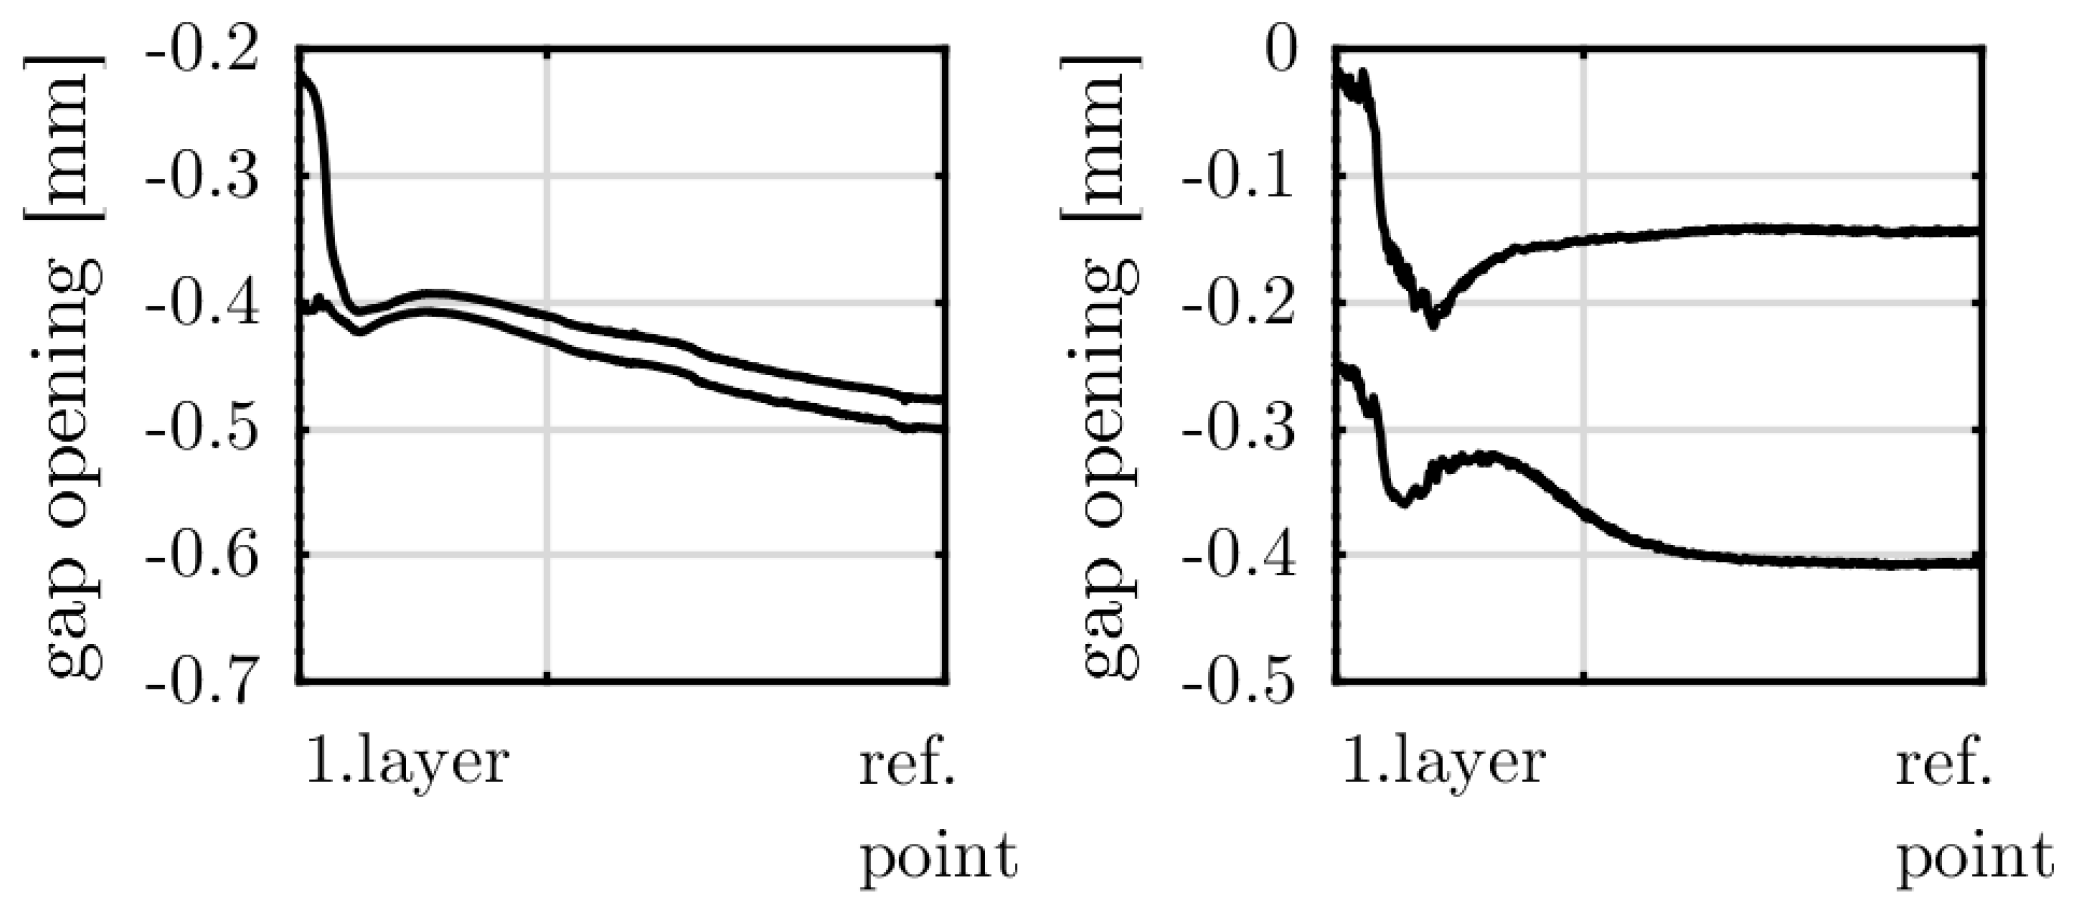
Figure 23 shows the minimal and maximal value of the gap opening during the root welding until the reference point for both amplitudes. The gap opening was measured by the first clip-on extensometer as shown in
Figure 13 at the start position of the welding process. Before the specimens are welded the gap opening is 0.1 mm resp. 0.125 mm. For the welding of a force transmitting root layer at 0.1 mm amplitude the gap opening decreases quickly during the root welding. As a result of the successful force connection, the reduced gap opening is maintained. For an amplitude of 0.125 mm cracks develop and grow rapidly, so that the gap opening does not decrease. Due to the constant gap opening the welding of the root layer is not possible.
3.4. Characterization of the welds
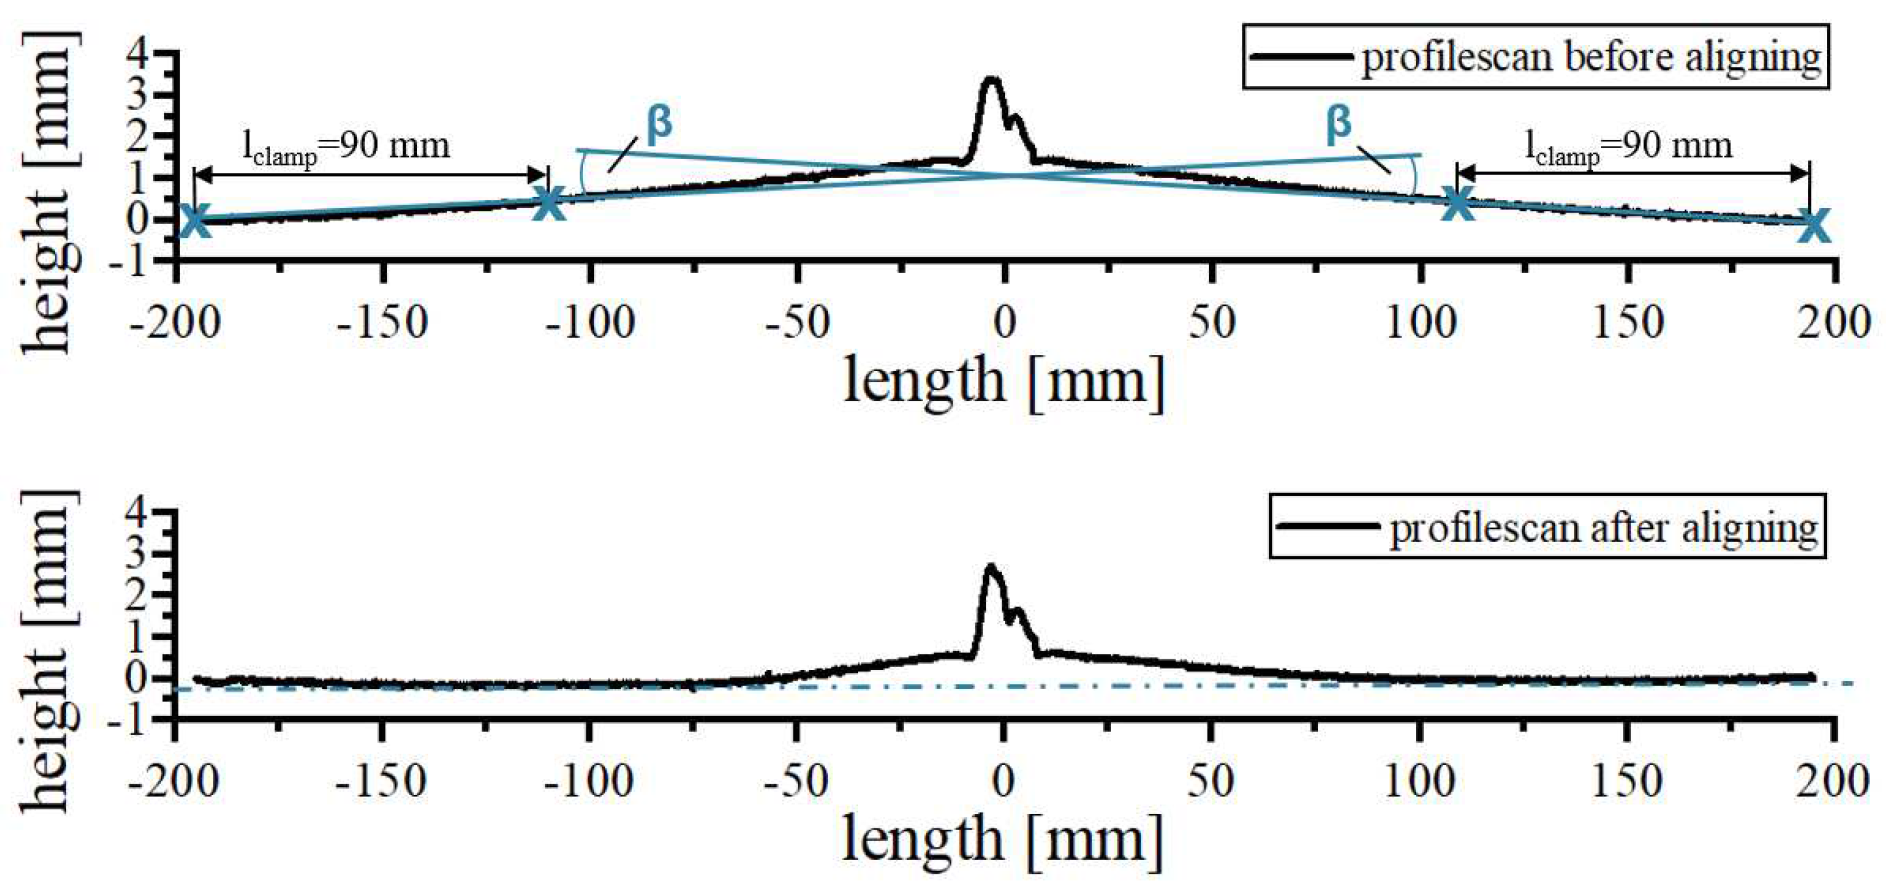
The geometrical characterization of the welds is performed on the extracted fatigue specimens. All fatigue test specimens were aligned regarding their angular misalignment. This prevents additional loads on the weld when clamping the specimen in the fatigue test setup. The process of aligning is depicted in
Figure 24 and was conducted in an universal testing machine (Instron 150).
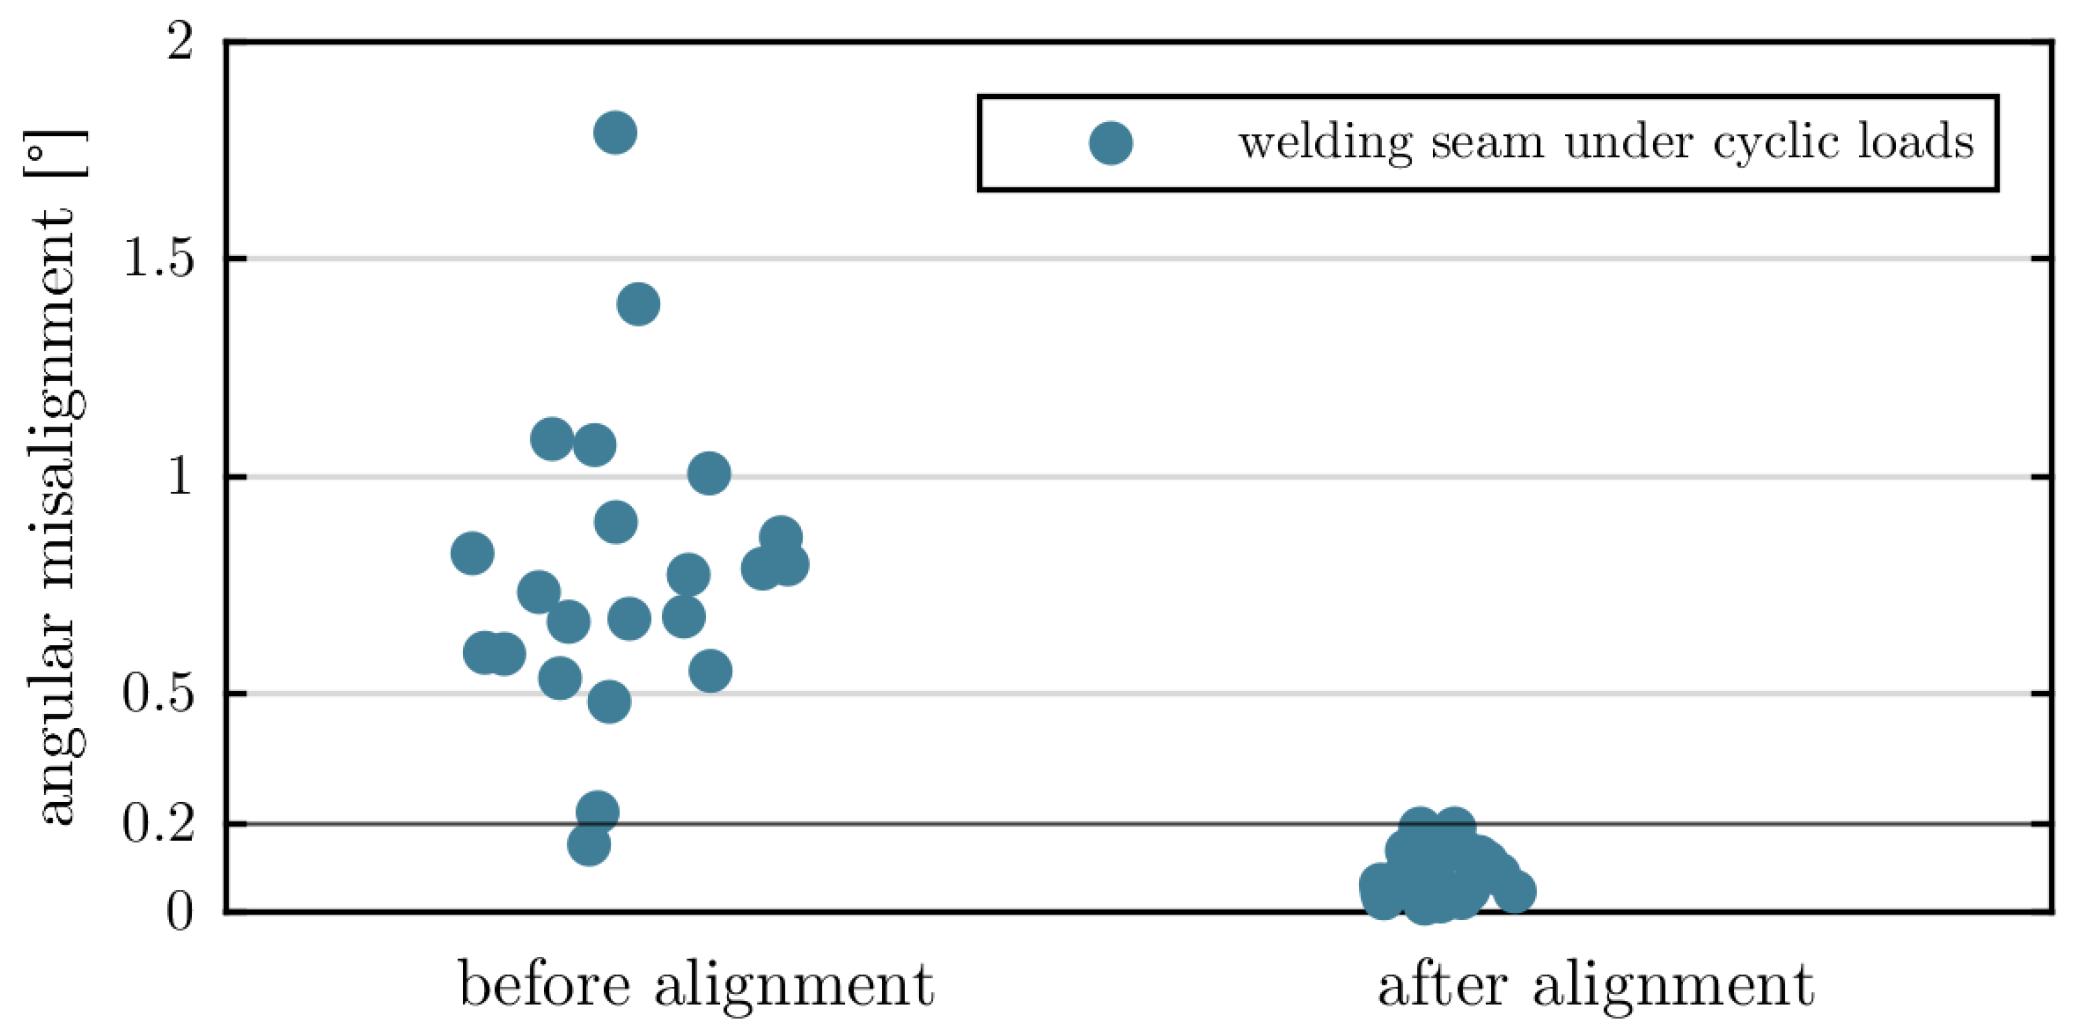
Before the aligning process the specimens had an axial misalignment ranging from almost zero to 1.8°. The angle was measured between the parts of the specimens which are clamped. After aligning all specimens showed an angular misalignment of <0.2°. The angular misalignment of the welding seams are shown in
Figure 25.
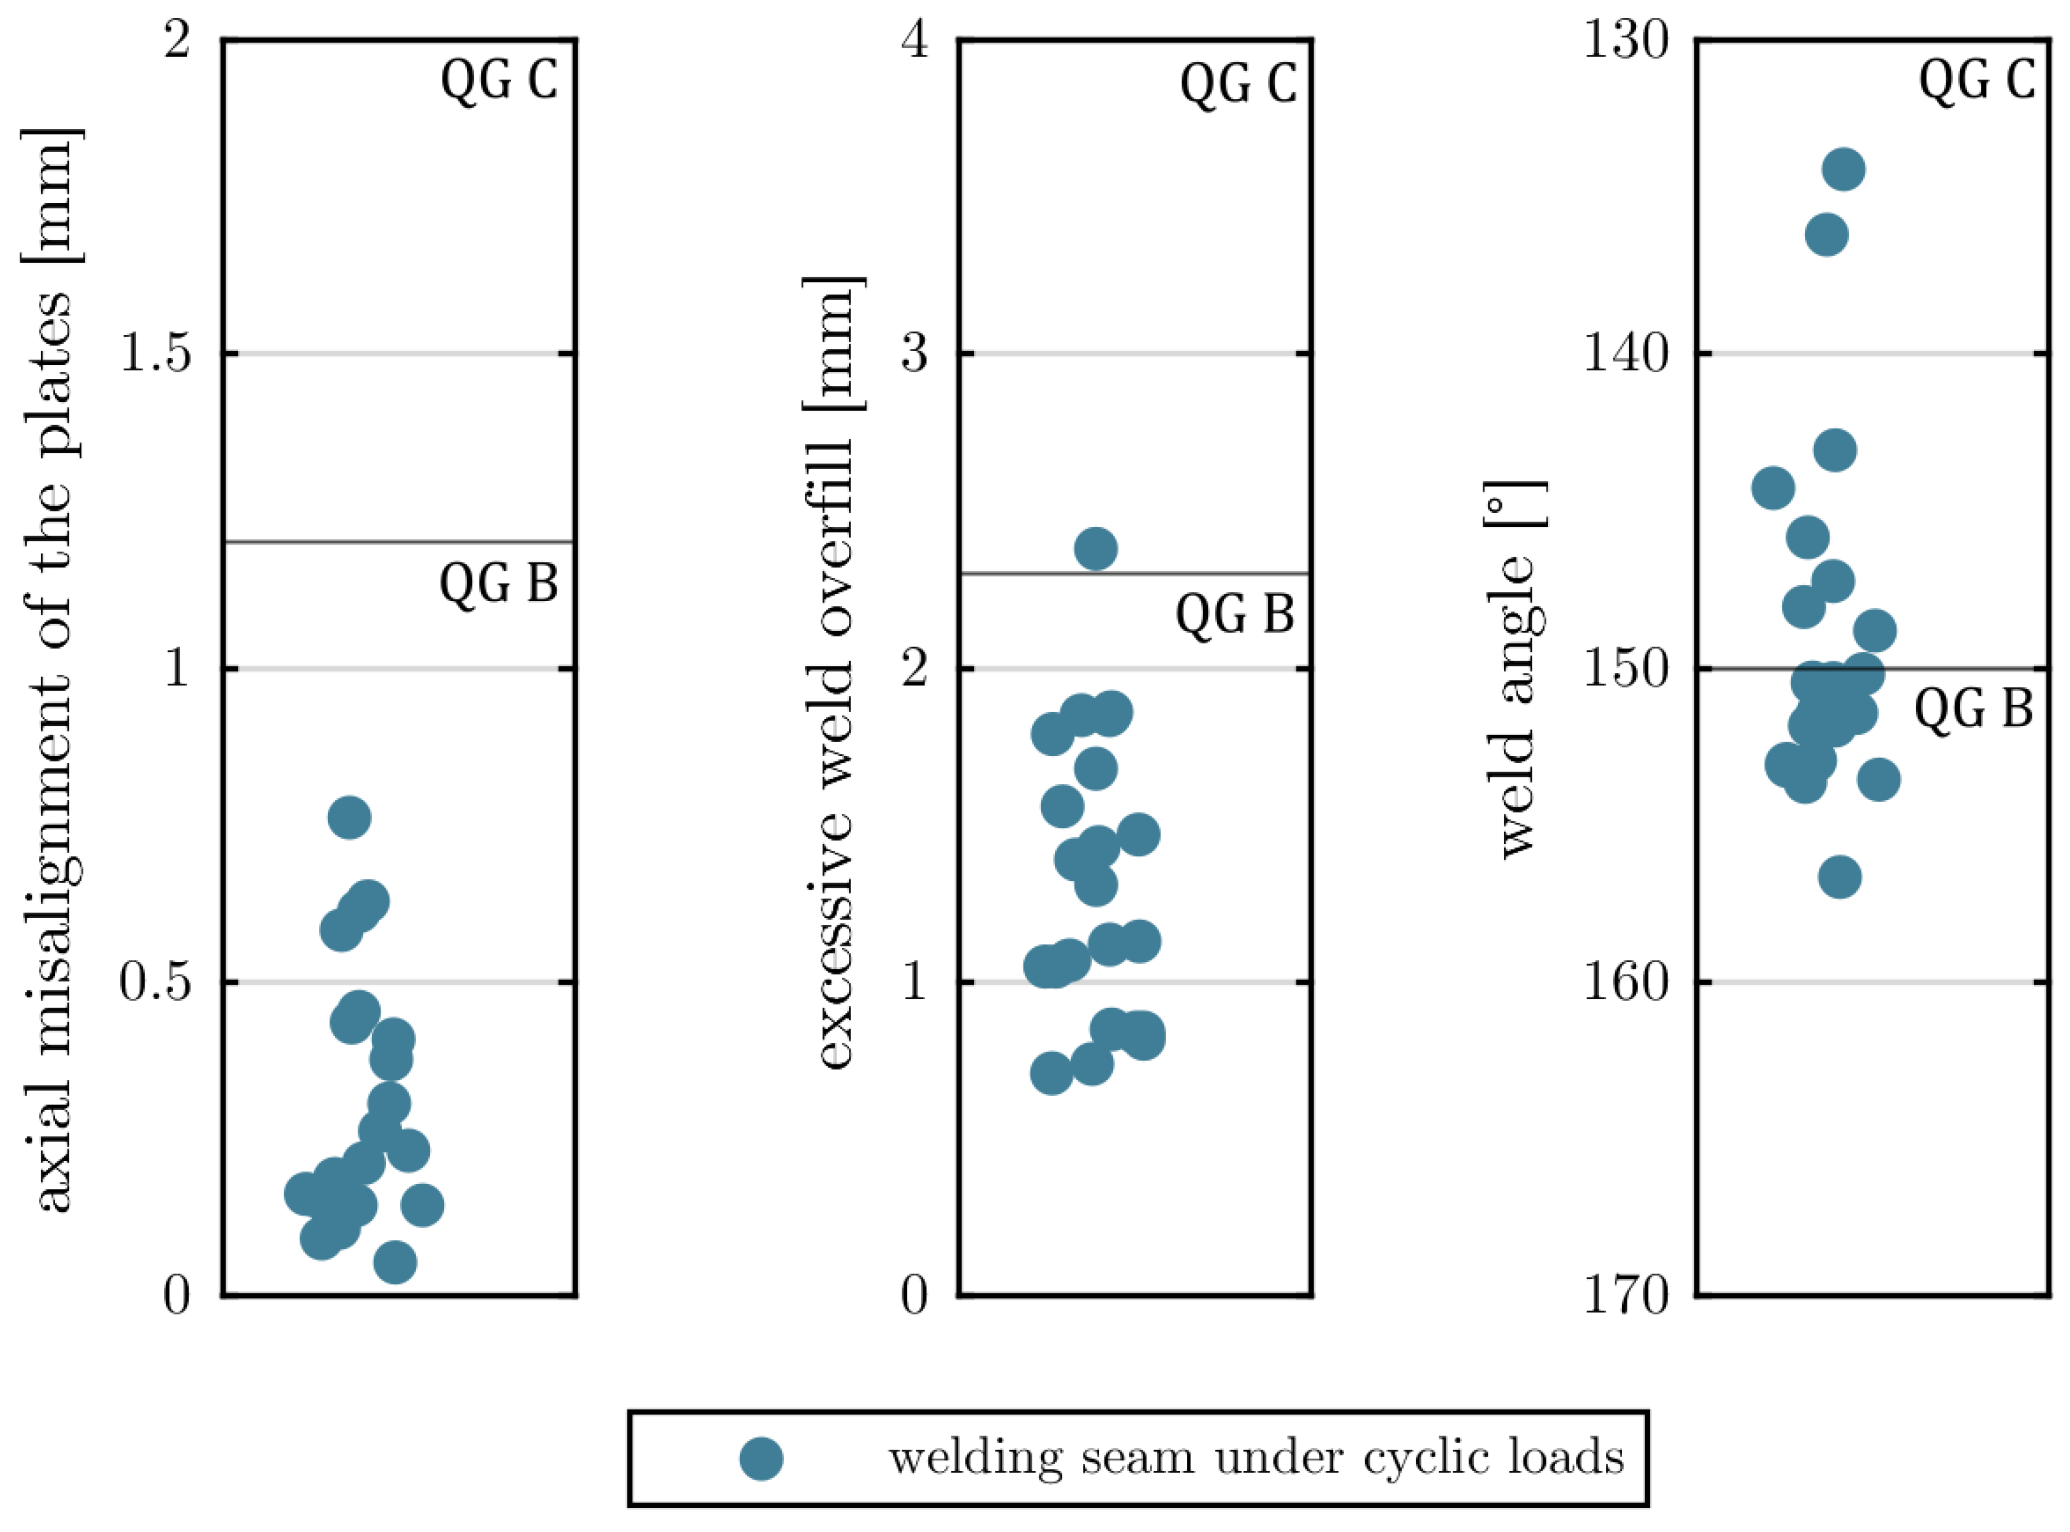
In
Figure 26 the results of the classification into the quality groups B and C are illustrated. Quality criteria are the axial misalignment of the plates, the excessive weld overfill and the weld angle.
It can be seen, that the most critical quality criteria is the weld angle, since the welds with moving seam flanks were conducted in vertical (PC) welding position. For the further evaluation of the fatigue behavior of the specimens they were classified into the ISO 5817 quality groups [
20]. If even one quality criterion (axial misalignment of the plates, excessive weld overfill or weld angle) does not correspond to quality group B, the entire sample was classified as quality group C.
3.5. Fatigue tests
In total 22 fatigue tests for the specimens manufactured under cyclic loads were performed in a test setup (MFL HUS 60). The specimen geometry is shown in
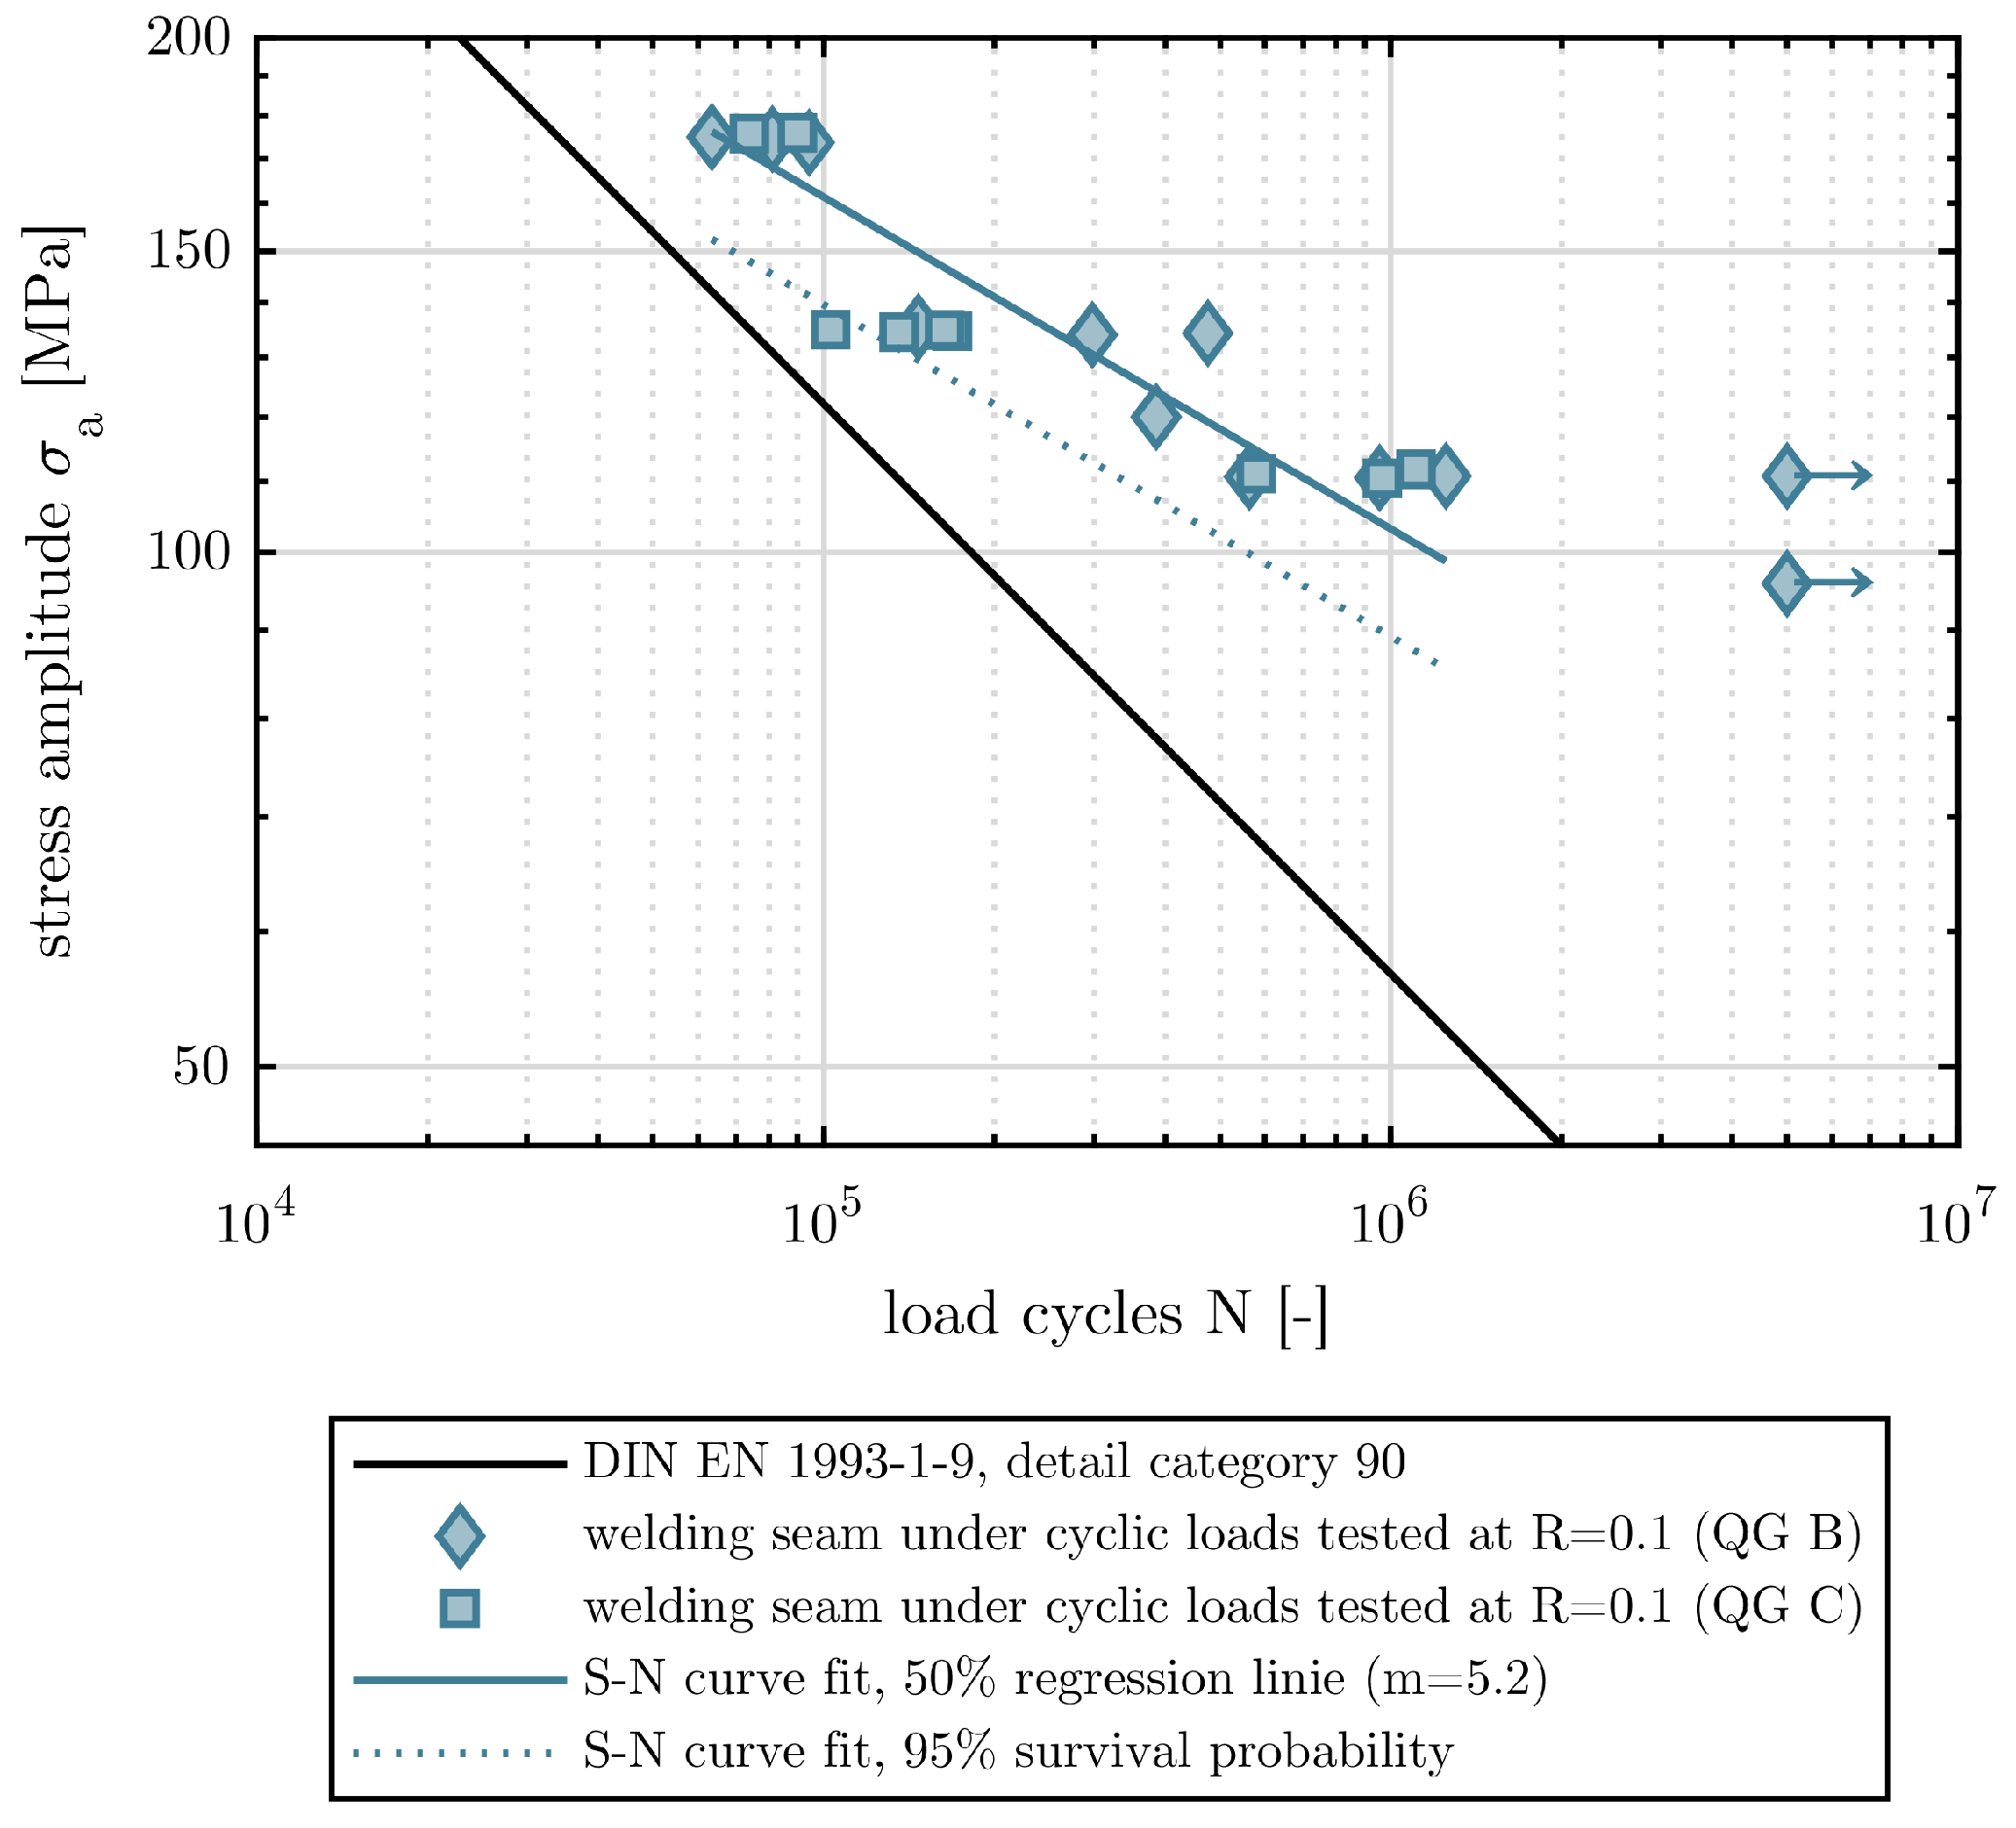
Figure 16. The fatigue tests are force-controlled in compliance with the design codes under tension-swell loading (stress ratio R = 0.1). They were carried out in the high-cycle range with stress amplitude between 95 MPa and 175 MPa. The test frequency was 15 Hz and the cut-off limit corresponds to
load cycles or total rupture. The results of the fatigue tests were classified in the standards of the DIN EN 1993-1-9 [
21] and the IIW recommendations [
22].
Figure 27 shows the results of the fatigue tests, where the welding seams under cyclic loads are classified depending on the relevant quality group (QG B and C). The 50% regression line with m=5.2 and the 95% survival probability are shown. The design curve from the DIN EN 1993-1-9 [
21] are also added for the classification in the standards. It can be seen, that all results show fatigue strength above the design curve from the DIN EN 1993-1-9 [
21].
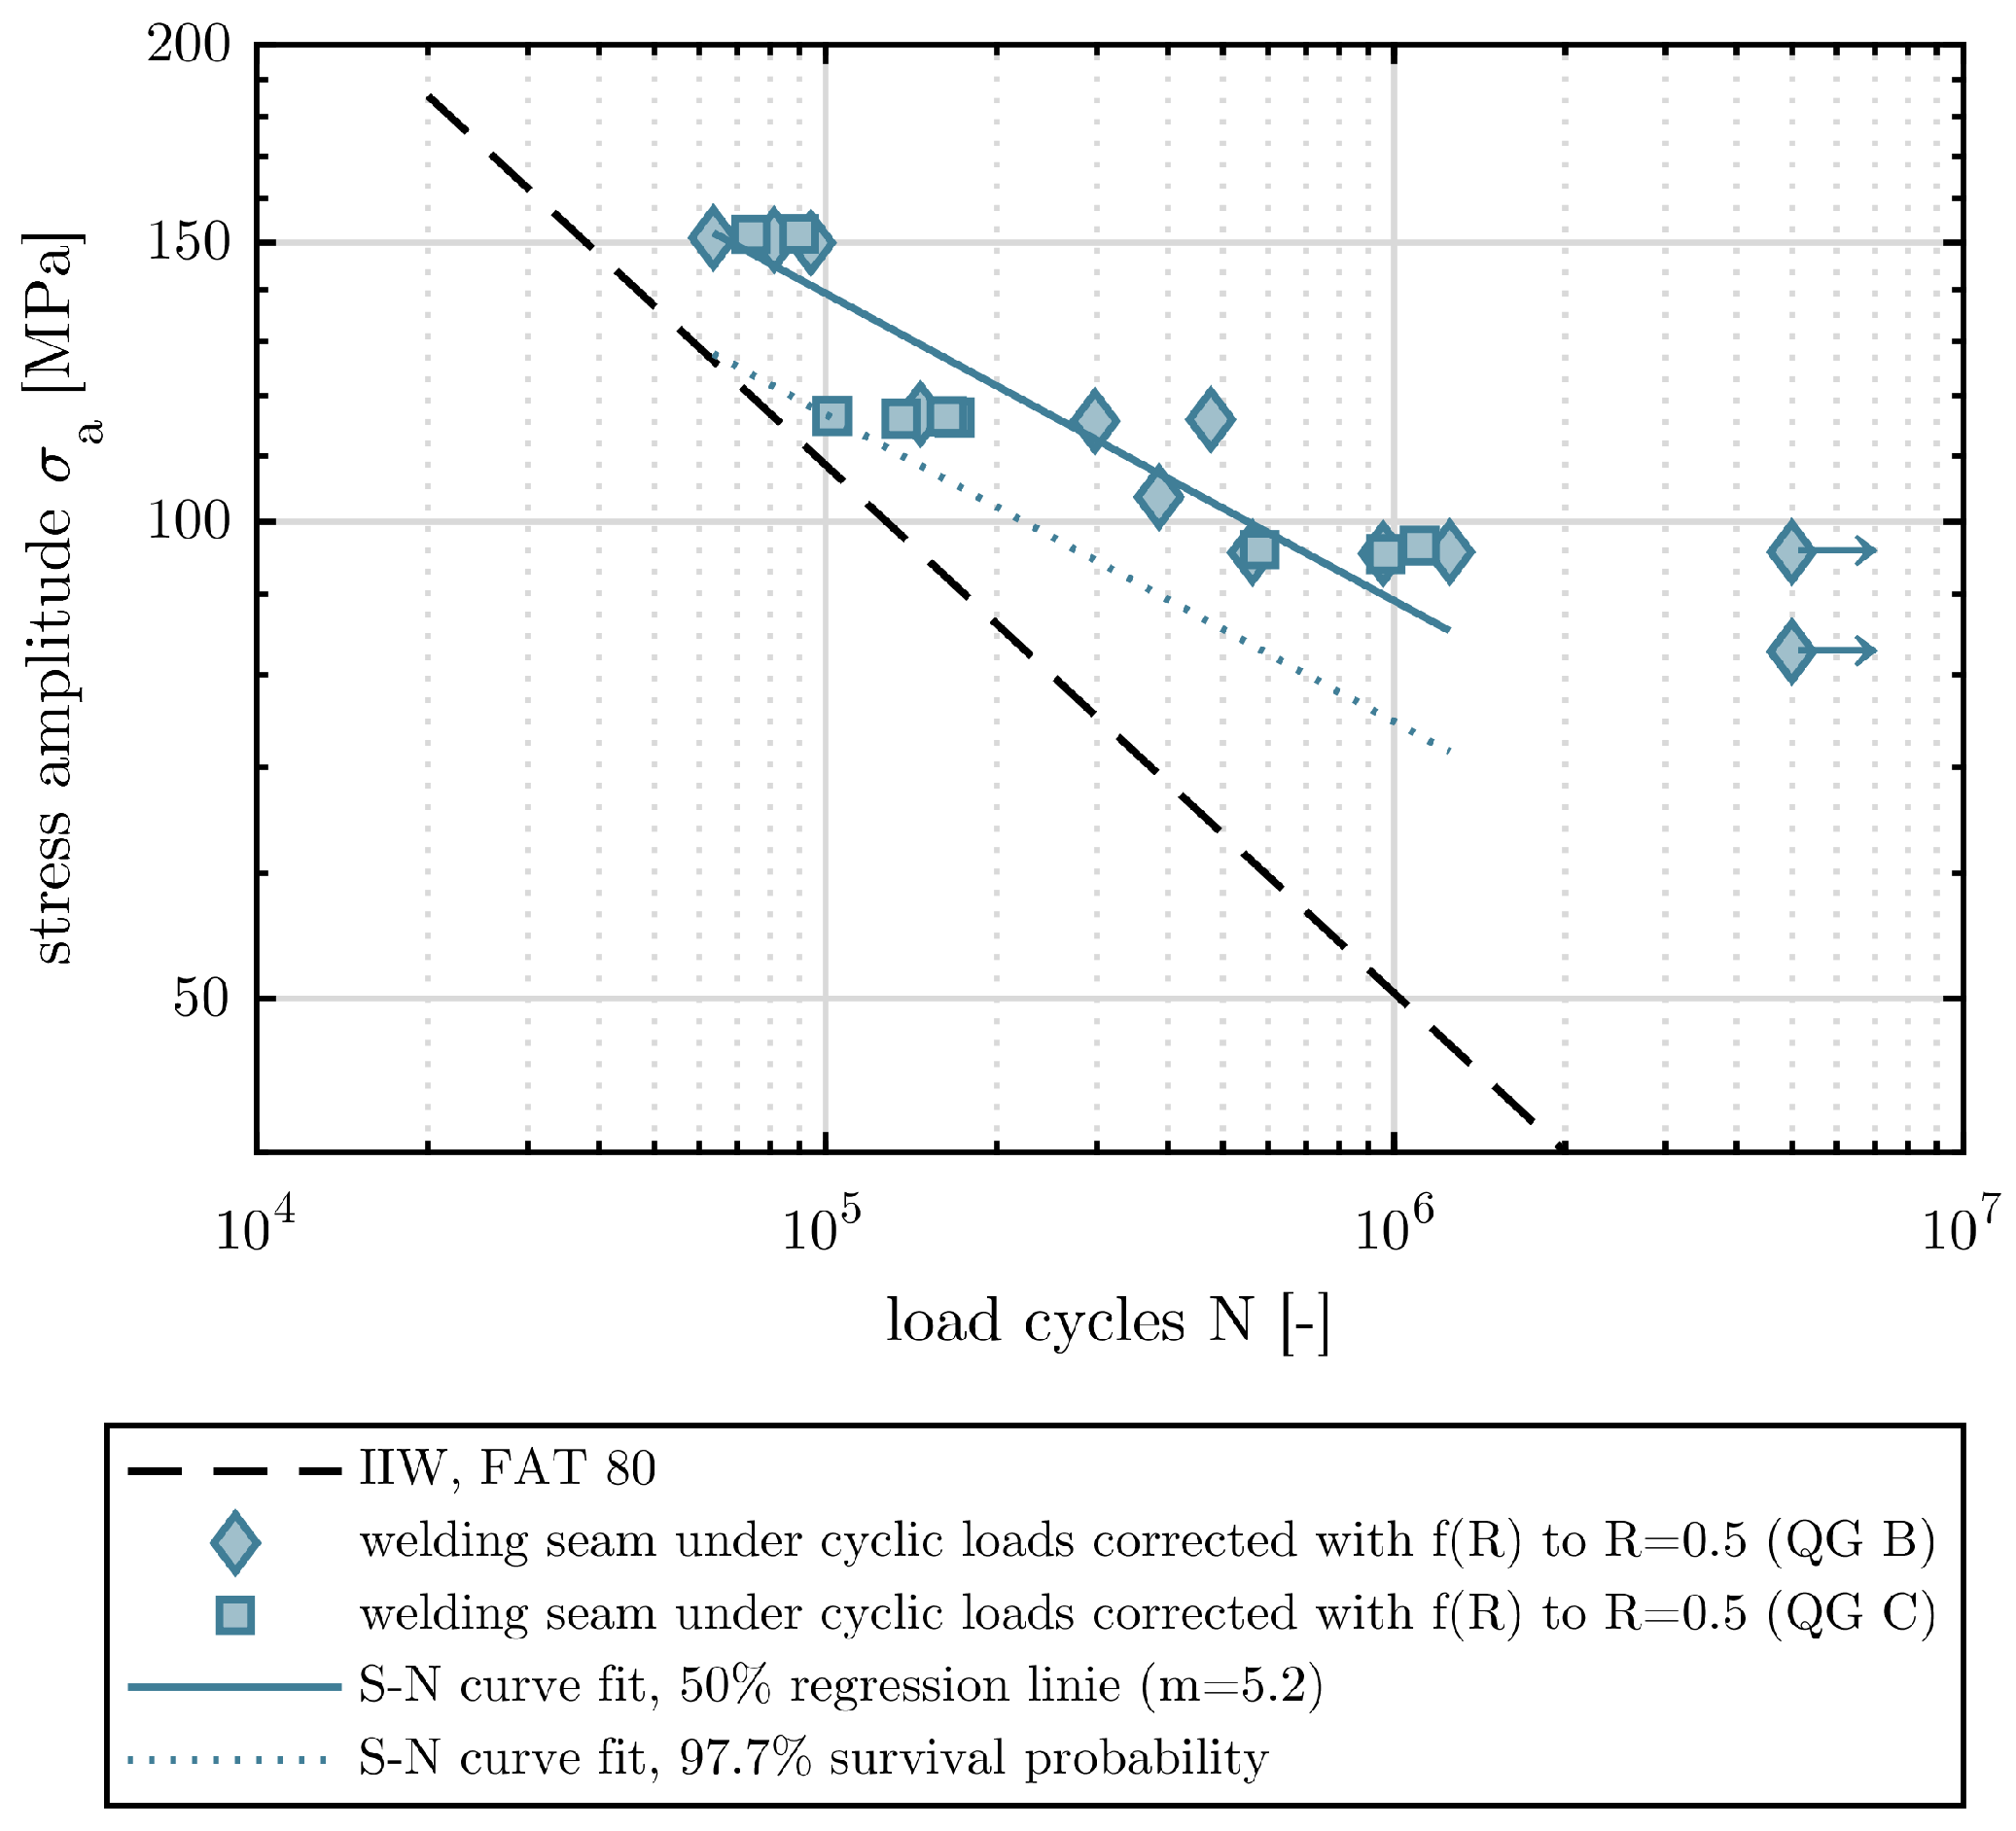
For the classification in the standards from the IIW recommendations [
22] the same results were corrected with f(R) to a stress ratio R=0.5.
Figure 28 shows the corrected results depending on the relevant quality group (QG B and C) and the design curve. The 50% regression line with m=5.2 and the 97.7% survival probability are also added. All results show fatigue strength above the design curve from the IIW recommendations [
22].
4. Conclusion
In conclusion, the studies have shown that under certain aspects, welding under service conditions is possible. For standard-compliant weld seams with regard to weld quality and fatigue strength, the following aspects must be considered:
optically defect-free welds were welded up to a limit of 0.1 mm amplitude with a frequency of 2 Hz
smaller hot cracks inevitably occur in the root layer during welding under service conditions
smaller hot cracks were removed by deep grinding of the root layer during the welding process
With the repair method, compare
Figure 15, the load-bearing capacity of the seam is ensured during the repair process. No further hot cracks occur in the following layers, because the crack flank movement is suppressed. The results of the fatigue tests show that it is possible to fabricate weld seams in compliance with the standard requirements. Further research is necessary for complex weld details with limited accessibility where the repair method cannot be applied. In addition, the influence of variable amplitude loads should be investigated.
Funding
The research project "Welding under service conditions in compliance with standard requirements for weld seam quality and fatigue resistance" of the Research Association for Steel Application e.V. (P1362/13/2019) is funded via the AiF as part of the program for the industrial collective research (IGF-No.20678N) by the Federal Ministry for Economic Affairs and Climate Action on the basis of a decision by the German Bundestag. This work is associated with the Deutsche Forschungsgemeinschaft (DFG, German Research Foundation) - GRK 2075: Modelling the constitutional evolution of building materials and structures with respect to aging (Project-No.255042459).
Acknowledgments
We acknowledge Schachtbau Nordhausen GmbH for the technical welding support and the provision of welding staff as part of the presented research results.
References
- Marzahn, G.; Hamme, M. Fallstudie Rheinbrücke Leverkusen im Zuge der A1: Das Bauwerk und seine Schadensentwicklung. In Beurteilung, Ertüchtigung und Instandsetzung von Brücken; Krieger, J., Isecke, B., Eds.; Techn. Akad. Esslingen: Ostfildern, 2014; pp. 243–246. [Google Scholar]
- Paschen, M.; Hensen, W.; Hamme, M. Instandsetzungs- und Sicherungsmaßnahmen bei den Rheinbrücken Leverkusen und DuisburgNeuenkamp - ein Zwischenbericht (Teil 1). Stahlbau 2017, 86, 603–618. [Google Scholar] [CrossRef]
- Schumm, M.; Pasderski, U.; Krinitzki, C.; Lakrori, P. Entwurf des Ersatzneubaus der Rheinbrücke Duisburg–Neuenkamp. Stahlbau 2022, 91, 471–481. [Google Scholar] [CrossRef]
- Huawen, Y.; König, C.; Ummenhofer, T.; Shizhong, Q.; Plum, R. Fatigue Performance of Tension Steel Plates Strengthened with Prestressed CFRP Laminates. Journal of Composites for Construction 2010, 14, 609–615. [Google Scholar] [CrossRef]
- Abeln, B.; Gessler, A.; Stammen, E.; Ilg, F.; Feldmann, M.; Dilger, K.; Schuler, C. Strengthening of fatigue cracks in steel bridges by means of adhesively bonded steel patches. The Journal of Adhesion 2022, 98, 827–853. [Google Scholar] [CrossRef]
- Izadi, M.R.; Ghafoori, E.; Shahverdi, M.; Motavalli, M.; Maalek, S. Development of an iron-based shape memory alloy (Fe-SMA) strengthening system for steel plates. Engineering Structures 2018, 174, 433–446. [Google Scholar] [CrossRef]
- Der Fahrzeugbestand am 1. Januar 2020, 02.03.2020.
- Kraftfahrt-Bundesamt. Fahrzeugklassen und Aufbauarten: Zeitreihe 1955 bis 2013, 07.11.2020.
- Langenberg, P.; Paschen, M.; Groten, G.U. Eigenschaften von Altstahl in geschweißten Brücken der Nachkriegszeit. In Beurteilung, Ertüchtigung und Instandsetzung von Brücken; Krieger, J., Isecke, B., Eds.; Techn. Akad. Esslingen: Ostfildern, 2014; pp. 259–264. [Google Scholar]
- Paschen, M.; Jungmann, H.D.; Senk, B. Brückensanierung einer Großbrücke aus Sicht der Beteiligten. In Beurteilung, Ertüchtigung und Instandsetzung von Brücken; Krieger, J., Isecke, B., Eds.; Techn. Akad. Esslingen: Ostfildern, 2014; pp. 265–278. [Google Scholar]
- Horikawa, K.; Suzuki, H.; Imi, K. Repair Welding on Bridges in Service Condition: Welding Mechanics, Strength and Design. Transactions of JWRI 1983, 12, 309–315. [Google Scholar]
- Schiebel, C. (Ed.) Schweißen unter Betriebsbeanspruchung: Eigenspannungen und bruchmechanische Betrachtungen; Vol. 235, Fortschritt-Berichte VDI - Reihe 18, VDI Verlag, 1998.
- Wichers, M. Schweißen unter einachsiger, zyklischer Beanspruchung: Experimentelle und numerische. Untersuchungen. Dissertation, TU Braunschweig, Braunschweig, 2006. [Google Scholar]
- Schweißtechnische Fertigungsverfahren 2: Verhalten der Werkstoffe beim Schweißen, 3. , bearbeitete auflage ed.; SpringerLink Bücher, Springer-Verlag: Berlin/Heidelberg, 2005. [Google Scholar] [CrossRef]
- DVS Verband – Ausschuss für Technik im DVS, Arbeitsgruppe Q4 – Prüfen von Schweißungen. Merkblatt DVS_1004-1: Heißrissprüfverfahren Grundlagen, Oktober 2019.
- Jähniche, W.; Dahl, W. Werkstoffkunde Stahl: Band 1: Grundlagen; Verlag Stahleisen: Düsseldorf, 1984. [Google Scholar]
- Cross, C.E.; Böllinghaus, T. (Eds.) The effect of restraint on weld solidification cracking in aluminium, Proceedings of the IIW International Conference on Benefits of new methods and trends in welding to economy, productivity and quality, Prag, 2005.
- Borland, J.C. Generalized Theory of Super-Solidus Cracking in Welds (and Castings). British Welding Journal 1980, 7, 508–512. [Google Scholar]
- Landesbetrieb Straßenbau NRW. A40: Rheinbrücke Neuenkamp muss langfristig erneuert werden, 10.12.2021.
- DIN EN ISO 5817: Schweißen - Schmelzschweißverbindungen an Stahl, Nickel, Titan, und deren Legierungen (ohne Strahlschweißen) - Bewertungsgruppen von Unregelmäßigkeiten (ISO 5817), 2014.
- DIN 1993-1-9: Eurocode 3: Bemessung und Konstruktion von Stahlbauten - Teil 1-9: Ermüdung, 2010.
- Hobbacher, A. Recommendations for Fue Design of Welded Joints and Components 2007.
Figure 1.
Crack between cover plate and cross member
Figure 1.
Crack between cover plate and cross member
Figure 2.
(a) Ferritic-pearlitic microstructure of a structural steel from 1965, (b) Baumann print with extended manganese sulfide line and oxide inclusions
Figure 2.
(a) Ferritic-pearlitic microstructure of a structural steel from 1965, (b) Baumann print with extended manganese sulfide line and oxide inclusions
Figure 3.
Weld detail with poor accessibility
Figure 3.
Weld detail with poor accessibility
Figure 4.
Repair sequence
Figure 4.
Repair sequence
Figure 5.
Formation of solidification cracks, [
16]
Figure 5.
Formation of solidification cracks, [
16]
Figure 6.
Influences on the formation of hot cracks, [
17]
Figure 6.
Influences on the formation of hot cracks, [
17]
Figure 7.
Workflow for the welding experiments and the fatigue tests
Figure 7.
Workflow for the welding experiments and the fatigue tests
Figure 8.
(a) Geometry of the joints, (b) Welding sequence
Figure 8.
(a) Geometry of the joints, (b) Welding sequence
Figure 9.
Cross section of the A40 Rhinebridge in Duisburg Neuenkamp
Figure 9.
Cross section of the A40 Rhinebridge in Duisburg Neuenkamp
Figure 10.
Measurement setup for clip-on extensometer
Figure 10.
Measurement setup for clip-on extensometer
Figure 11.
Geometry of the welding specimen
Figure 11.
Geometry of the welding specimen
Figure 12.
Test setup for welding tests under cyclic loads
Figure 12.
Test setup for welding tests under cyclic loads
Figure 13.
(a) Front view of the bearing slide and the welding specimens in the test setup, (b) Back view of the welding specimens with the attached Clip-on extensometers
Figure 13.
(a) Front view of the bearing slide and the welding specimens in the test setup, (b) Back view of the welding specimens with the attached Clip-on extensometers
Figure 14.
Schematic display of the displacement and force measurements during the welding time of the root layer
Figure 14.
Schematic display of the displacement and force measurements during the welding time of the root layer
Figure 15.
Repair method for the welding tests in the test setup
Figure 15.
Repair method for the welding tests in the test setup
Figure 16.
Geometry of the fatigue test specimens with laser scanning lines
Figure 16.
Geometry of the fatigue test specimens with laser scanning lines
Figure 17.
Macrosections of the preliminary welds
Figure 17.
Macrosections of the preliminary welds
Figure 18.
Hardness test results in the base metal (BM), the heat affected zone (HAZ) and the weld metal (WM)
Figure 18.
Hardness test results in the base metal (BM), the heat affected zone (HAZ) and the weld metal (WM)
Figure 19.
Photographs of the samples after a) tensile testing and b) bending testing
Figure 19.
Photographs of the samples after a) tensile testing and b) bending testing
Figure 20.
Extract from the measurement data of the gap opening measured during half an hour
Figure 20.
Extract from the measurement data of the gap opening measured during half an hour
Figure 21.
Extract from the measurement data of the gap opening during a vehicle crossing
Figure 21.
Extract from the measurement data of the gap opening during a vehicle crossing
Figure 22.
Force signal during the welding of a) a force transmitting root layer and b) a completely cracked root layer
Figure 22.
Force signal during the welding of a) a force transmitting root layer and b) a completely cracked root layer
Figure 23.
Gap opening during the welding of a) a force transmitting root layer and b) a completely cracked root layer
Figure 23.
Gap opening during the welding of a) a force transmitting root layer and b) a completely cracked root layer
Figure 24.
Schematic of the aligning process
Figure 24.
Schematic of the aligning process
Figure 25.
Angular misalignment of the specimens before and after the alignment
Figure 25.
Angular misalignment of the specimens before and after the alignment
Figure 26.
Results from quality assessment with evaluation of the axial misalignment of the plates (No. 3.1), the excessive weld overfill (No. 1.9) and the weld angle (No. 1.12) [
20]
Figure 26.
Results from quality assessment with evaluation of the axial misalignment of the plates (No. 3.1), the excessive weld overfill (No. 1.9) and the weld angle (No. 1.12) [
20]
Figure 27.
Fatigue test results of the welding seams under cyclic loads tested at stress ratio R=0.1
Figure 27.
Fatigue test results of the welding seams under cyclic loads tested at stress ratio R=0.1
Figure 28.
Fatigue test results of the welding seams under cyclic loads corrected with f(R) to stress ratio R=0.5
Figure 28.
Fatigue test results of the welding seams under cyclic loads corrected with f(R) to stress ratio R=0.5
Table 1.
Mechanical properties of the substrate and the welding wire according to manufacturer specifications
Table 1.
Mechanical properties of the substrate and the welding wire according to manufacturer specifications
| |
|
|
|
|
| |
|
|
|
|
| S355J2+N |
542 |
413 |
25.5 |
238 (-20°C) |
| T46 4 P M 1 H5 |
570 |
510 |
25 |
70 (-40°C) |
Table 2.
Chemical composition of the substrate and the welding wire (nominal composition)
Table 2.
Chemical composition of the substrate and the welding wire (nominal composition)
| |
C |
Mn |
Si |
Al |
P |
Cr |
S |
Cr |
Cu |
Mo |
Ni |
V |
| S355J2+N |
0.17 |
1.34 |
0.025 |
0.035 |
0.013 |
0.022 |
0.006 |
0.022 |
0.03 |
0.002 |
0.011 |
0.001 |
| T46 4 P M 1 H5 |
0.04 |
1.2 |
0.4 |
- |
- |
- |
- |
- |
- |
- |
- |
- |
Table 3.
Welding parameters according to the WPS
Table 3.
Welding parameters according to the WPS
| Current |
Voltage |
Pobrity |
Wire feed |
Welding speed |
Contact tube to workpiece distance |
Shielding gas |
Flow rate |
Interpass temperature |
Welding position |
| [A] |
[V] |
- |
[m/min] |
[cm/min] |
[mm] |
- |
[l/min] |
[°C] |
- |
| 210-230 |
23-24 |
DC + |
7-8 |
20-40 |
15-20 |
M21 *
|
12-16 |
< 230°C |
PC |
|
Disclaimer/Publisher’s Note: The statements, opinions and data contained in all publications are solely those of the individual author(s) and contributor(s) and not of MDPI and/or the editor(s). MDPI and/or the editor(s) disclaim responsibility for any injury to people or property resulting from any ideas, methods, instructions or products referred to in the content. |
© 2023 by the authors. Licensee MDPI, Basel, Switzerland. This article is an open access article distributed under the terms and conditions of the Creative Commons Attribution (CC BY) license (http://creativecommons.org/licenses/by/4.0/).
