Preprint
Article

Eco-Innovative Concrete for Infrastructure Obtained with Alter-Native Aggregates and a Supplementary Cementitious Material (SCMs)

Altmetrics

Downloads

119

Views

45

Comments

0

A peer-reviewed article of this preprint also exists.

Submitted:

18 August 2023

Posted:

25 August 2023

You are already at the latest version

Alerts
Abstract
Concrete is a heterogeneous material, one of the most widely used materials on the Planet and a major consumer of natural resources. Carbon emissions are largely due to the extensive use of cement in its composition, which contributes to 7% of global CO2 emissions. Extraction and processing of aggregates is another sources of CO2 emissions. Many countries have succeeded in moving from a linear economy to a circular economy by partially or fully replacing non-renewable natural materials with alternatives from waste recycling. One such alternative consists in partially replacing cement by supplementary cementitious materials (SCMs) in concrete mixes. Thus, the work is based on the experimental investigation of the fresh and hardened properties of civil engineering concrete, hereafter referred to as road concrete, in which, crushed river aggregate have been replaced with recycled waste aggregates of uncemented concrete and partial replacement of cement with a SCM material in the form of glass powder that improves the durability characteristics of this sustainable concrete. The microstructure and compositional features of the selected optimum composite has been also investigated by polarized light optical microscopy (OM) Scanning electron microscope (SEM) and X-ray diffraction by the Powder method (PXRD) for the qualitative analysis of crystalline constitutive materials.
Keywords: 
Subject: Engineering  -   Civil Engineering

1. Introduction

It becomes absolutely necessary the transition from the "Linear Economy" [1] toward the waste management concept of European Directive 2008/98/EC [2] and the Industrial Emissions Directive known as European Directive 2010/75/EU in favor of the "Circular Economy" [3,4], based on reducing the consumption of natural resources through the use of recycled waste from various industries and industrial by-products, which might become alternatives to the raw materials used in the construction industry by creating more ecological construction products, as results of the circular economy put in practice. The uncontrolled consumption of natural resources may lead to the climate and economic changes we are already facing, which are the result of a still existing linear economy in certain areas of the world [4].
The increasingly large volume of waste in landfills, the lack of storage space and the stringent reduction of non-renewable natural resources, are strong motivation for researchers to mobilize and support recyclers in finding innovative ways to use recycled waste as raw materials in new concrete mixes, which represents one of the most eco-friendly options.
Conventional concrete is the most widely used artificial material in the construction industry and worldwide, second only to water. Its production involves the depletion of the natural resources and increased use of cement, whose production requires significant amount of electrical energy and limestone, leading to significant environmental impacts and CO2 generation beside the high amount of emissions released [5,6,7,8,9,10,11,12].
Recycled waste, such as glass, plastic, concrete, construction waste, rubber, and ceramics used in the production of concrete, may facilitate the transition from the linear economy to the circular one [4]. Numerous research has been undertaken by [Corbu et al.,] for concrete mixtures using glass powder as partial replacement for cement in conventional concrete mixes, an innovative method supporting the recycling companies' in reducing of waste in landfills [13,14] and their transformation into final recyclers by putting into production the new eco-friendly concrete for various construction elements (paving curbs, hollow blocks, platforms, sidewalks) [15,16,17,18]. The recycling of concrete from demolitions or that obtained by crushing prefabs is equally welcomed. If the volume allows, concrete obtained from tests of samples subjected to destructive or non-destructive laboratory determinations, with or without a known track can be used, such an example being the present research.
Numerous studies have been conducted worldwide with respect to the use of glass powder or of recycled concrete aggregates individually. However, studies of the mixture containing both in a single composite are relatively limited in number.
Glass powder resulting from recycling (WGP-Waste Glass Powder), used as a substitute for cement in proportions of 10÷25% in concrete/mortar mixtures, has been highlighted in recent studies of the authors [19,20,21,22,23,24,25]. It has also been used in geopolymer concrete in proportions of 20÷80% [26,27,28]. Furthermore, studies have been conducted on the substitution of up to 60% of materials and the monitoring of strength development up to 90 days [29,30] and focusing on the efficiency of pozzolanic activity of cementitious materials [31,32,33,34,35].
Hornea et al. (2017) investigated the properties of mortars with cathode ray tube (CRT) glass waste (Pb containing) added in the amount of 30, 40 to 50 weight percent, as re-placement for river sand. The experimental results indicate that all the samples containing glass waste achieved higher compressive strength than the control mortar. After 14, 28 and 42 days of maintaining the mortar in water, no evidence of Pb was detected in the solutions [36].
All these studies can encourage recyclers to create their own SMEs and to produce and implement such eco-friendly concretes in the production of various precast elements like paving or curbs, Lego-type hollow blocks, sidewalks, bike lanes, industrial platforms, parking lots, etc., depending on the specific requirements and regulations of each region.
The purpose of this study is to evaluate the possibility of integrating waste materials such as WGP (Waste Glass Powder) and RCA (Recycled Concrete Aggregates) into cementitious composites (concrete/mortar) and quantify their influence on mechanical strengths and durability, particularly in terms of abrasion resistance.
As a result, the findings of this study confirm a favorable contribution to the mechanical characteristics and abrasion resistance of road concretes when using WGP waste materials. The current use of WGP-RCA waste materials in concrete composition may redirect the construction industry towards a circular and sustainable economy in line with the main directions and requirements of EU.

2. Materials and Methods

2.1. Materials/Constituent materials

In Figure 1 are presented the two substituting materials, which might replace cement (WGP) and coarse aggregates (RCA), respectively.

2.1.1. Aggregates

The aggregates used for the control road concrete and for the eco-friendly road concrete are presented synthetically in Table 1.
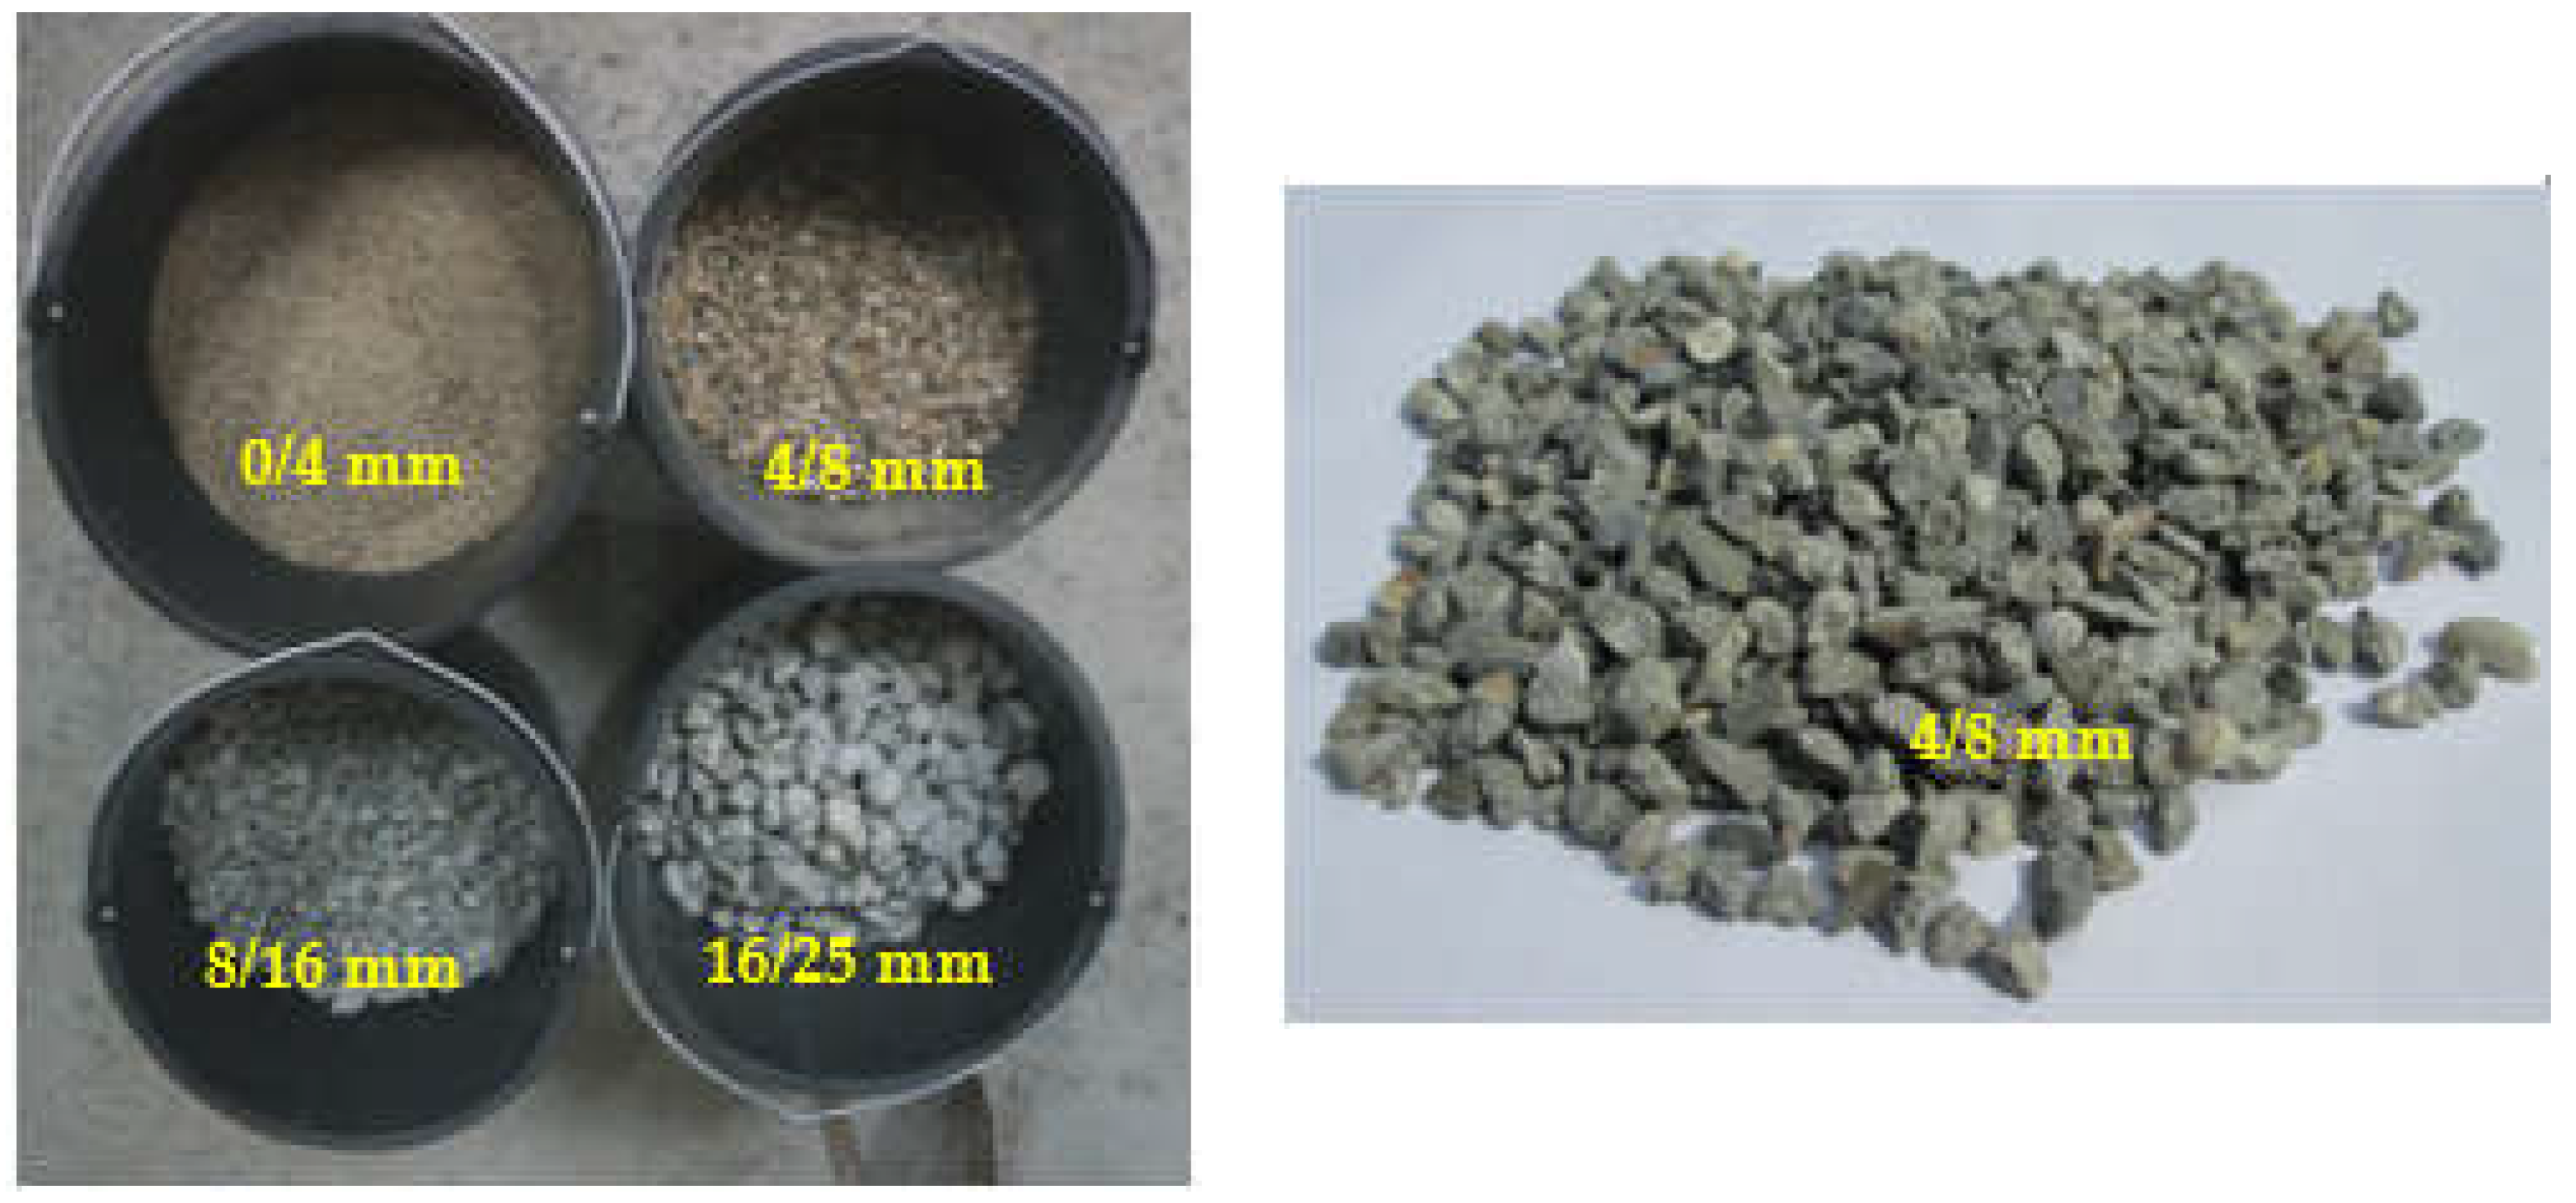
In Figure 2, images of the aggregates used in the design for the control/reference concrete and the recycled coarse aggregate (4/8mm) RCA are presented.
In the present study concrete recipe design has been carried out through careful analysis of the characteristics of the used aggregates, especially for the recycled aggregates, (Ilker 1995) [37] followed by the adjustment of appropriate proportions based on an algorithm, in such a way that the designed mixtures comply with the requirements of the current standards in Romania for the production of road concrete [38,39].
Special attention is paid to the total aggregate as it represents approximately 60÷80% of the concrete composition. Recycled concrete aggregate exhibits inconsistency in quality due to its various sources often lacking a known history. In this study RCA (Recycled Concrete Aggregate) comes from a local laboratory that consistently verifies the quality of the designed/implemented materials, ensuring that they have not been contaminated in storage, RCA being obtained by crushing cubic specimens from a concrete class (C25/30) [37,40].
The design of concrete mixtures tooks into consideration the widest possible applicability of alternative aggregates to replace traditional, natural aggregates. The popularity of the new concrete is increasing as it is used as a secondary raw material in construction products. Through sustainable design of the resulting concrete, a smaller carbon footprint is achieved by using alternative RCA (Recycled Concrete Aggregates), which are approximately 10% lighter due to their porosity and the presence of cement paste compared to traditional mineral aggregates. However, high porosity in aggregates might result higher water absorption, lower mechanical strengths, and reduced resistance to repeated freeze-thaw cycles. Therefore, severe quality control is essential for recycled aggregates compared to traditional, natural aggregates. Some studies indicate methods of hydrophobization or enriching the density of aggregates through various techniques, to close the pores and, as consequence, to reduce water absorption [41,42,43,44].
In the present study, the criteria imposed on aggregates (according to SR EN 933-1:2012) [45] for single-layer road wearing courses were chosen, which are identical with the requirements for the types of aggregates used for double-layer road wearing courses, including the wearing layer, according to NE 014:2002 [38].
In the following, the determinations performed on aggregates in the laboratory will be presented.

2.1.1.1. The granularity of the aggregates, according to SR EN 933-1: 2012 [45]

The test consists of separating the material into several size granularity with decreasing dimensions, using a series of sieves. The masses of particles retained on the different sieves are reported relative to the initial mass of the material. The cumulative percentages of passage through each sieve are presented in numerical form (Table 2, Table 3, Table 4, Table 5). The obtained results are the average of 3 determinations.

2.1.1.2. Real density and water absorption coefficient for (RCA)

The determination is carried out according to SR EN 1097-6: 2013 [46].
The real density is calculated based on the mass-to-volume ratio. The mass is determined by weighing the saturated test specimen, with dry surface and again after drying in an oven. The volume is calculated based on the mass of the displaced water, determined by weighing using the picnometer method (for aggregates of size 0/4 and 4/8) or by reducing the mass using the wire loop method (for aggregates of size 8/16 and 16/25).
The following parameters have been calculated and presented in Table 6: Absolute volume mass (ρa), Real volume mass determined by oven drying (ρrd), Real volume mass on the saturated dry surface (ρssd), Water absorption coefficient (WA24) (expressed as a percentage of the dry mass after 24 hours of immersion in water), according to the equations:
Absolute volumetric mass:
ρ a = ρ w M 4 M 4 M 2 M 3 , M g / m 3
Actual density determined after drying in oven:
ρ rd = M 4 M 1 M 2 M 3 , M g / m 3
Actual density on the saturated dry surface:
ρ ssd = M 1 M 1 M 2 M 3 , M g / m 3
The water absorption coefficient (expressed as a percentage of the dry mass) after 24 hours of immersion (WA24) is calculated according to the following equation:
WA 24 = 100 × M 1 M 4 M 4 , %
where:
  • ρw - volumetric mass of water at the test temperature (0,9973 la T=240 C), Mg/m3
  • M1 - mass in air of saturated and superficially dried aggregates, g;
  • M2 - mass of the pycnometer containing the sample of saturated aggregates, g;
  • M3 - pycnometer mass filled with water only, g;
  • M4 - mass in air of the test sample dried in the oven, g.
Using the wire loop method, the obtained results are included in Table 6.

2.1.1.3. The resistance to fragmentation of the coarse aggregate (Los Angeles coefficient) for (RCA) according to SR EN 1097-2: 2010 [47] and [38]

The determination is performed on an aggregate sample that is rolled together with an abrasive load consisting of steel balls in a rotating drum. Finally, the amount of material retained on the 1.6 mm sieve is determined. The Los Angeles coefficient (LA) is calculated according to the following equation:
L A = 5000 m 50
where: m – The mass of the material retained on the 1.6 mm sieve, g.
Obtained results (Table 7):
High value means less resistance to crushing.

2.1.1.4. Abrasion testing of coarse aggregate (MicroDeval coefficient) for (RCA)

The abrasion testing is performed according to SR EN 1097-1: 2011 [48]
Working method: The test involves measuring the abrasion loss produced under specified conditions by the reciprocal rubbing of sampled aggregates in a cylinder as they are ground with steel balls in the presence of water. After rotation, the amount of retained aggregates on the 1.6 mm sieve is determined.
Expression of results: The Micro-Deval coefficient (MDE) of the test in the presence of water is calculated according to the following equation:
MDE = 500 m 5 ,
where: m – mass of the retained aggregates on the 1,6 mm sieve.
The results are considered as an average of 2 determinations (Table 8).

2.1.1.5. Flattening coefficient for (RCA) according to SR EN 933-3: 2012 [49]

Working method: The test consists of performing a double screening. First, the sample is fragmented into elementary aggregates di/Di using the test sieves. Each of the elementary aggregates di/Di is then screened using grates with slots parallel to a size of Di/2. The overall flattening coefficient is calculated as the total mass of particles passing through the grate with slots, expressed as a percentage of the total dry mass of the particles under test.
Expression of results:
The overall flattening coefficient (A) is calculated based on the following equation:
A = M 2 M 1 × 100 ,
where:
M1 - sum of the aggregate masses of the elements di/Di, g
M2 - sum of the masses of the granules passed through the slotted grate corresponding to the opening Di/2, g.
Obtained results (Table 9):

2.1.2. Cement

The cement type used in the road concrete mixtures is CEM I 42.5R with the characteristics shown in Table 10.
The product is certified accordance to SR EN 197-1:2011 [50] and in accordance with SR EN 196-1 [51], SR EN 196-2 [52], SR EN 196-3 [53]. The road concrete classes to be designed with this cement are: BcR3.5, BcR4, BcR4.5, and BcR5. The quantity of cement in the road concrete mix for class BcR4 is set by the normative [NE 014] to a quantity of 330 kg/m3. The concrete shrinkage is influenced by the mineralogical nature of Portland cement, specific surface area, and cement ratio.

2.1.3. WGP-Waste Glass Powder

Recycled glass waste in the form of powder [54] has been obtained through grinding in a ball mill and it is a pozzolanic material. In Romanian norms, they are referred to as "Addition type II." When incorporated into cement, mortar, or concrete compositions, they have major role in reducing the carbon dioxide (CO2) emissions and are referred to in the literature as "Supplementary Cementitious Materials (SCMs)" or "additional constituents with cementitious (hydration or pozzolanic) characteristics." Depending on their size, glass particles transition from being inert minerals to becoming reactive materials during cement hydration in the concrete mixture, especially when ground into a fine powder with reduced particle sizes [55,56,57].
For particle sizes smaller than 0.250 mm [54] alkali-silica reactions (ASR) are cancelled, [58,59] and due to the pozzolanic action of powdered glass in the basic cement-water mixture of concrete/mortar during the hydration of the cement, it supports the properties of the concrete (mechanical resistances and wear).
Puzzolanicity is the ability of a natural or artificial pozoolanic material (produced by industrial processes) to react with Ca (OH)2 in the presence of water. Pozzolan reaction rate depends on the intrinsic characteristics of pozzolan, such as specific surface area, chemical composition and content of the active phase [60], According to ASTM C618 prescriptions [61], pozzolanele should contain SiO2 + Al2O3 + Fe2O3 ≥ (50÷70) %.
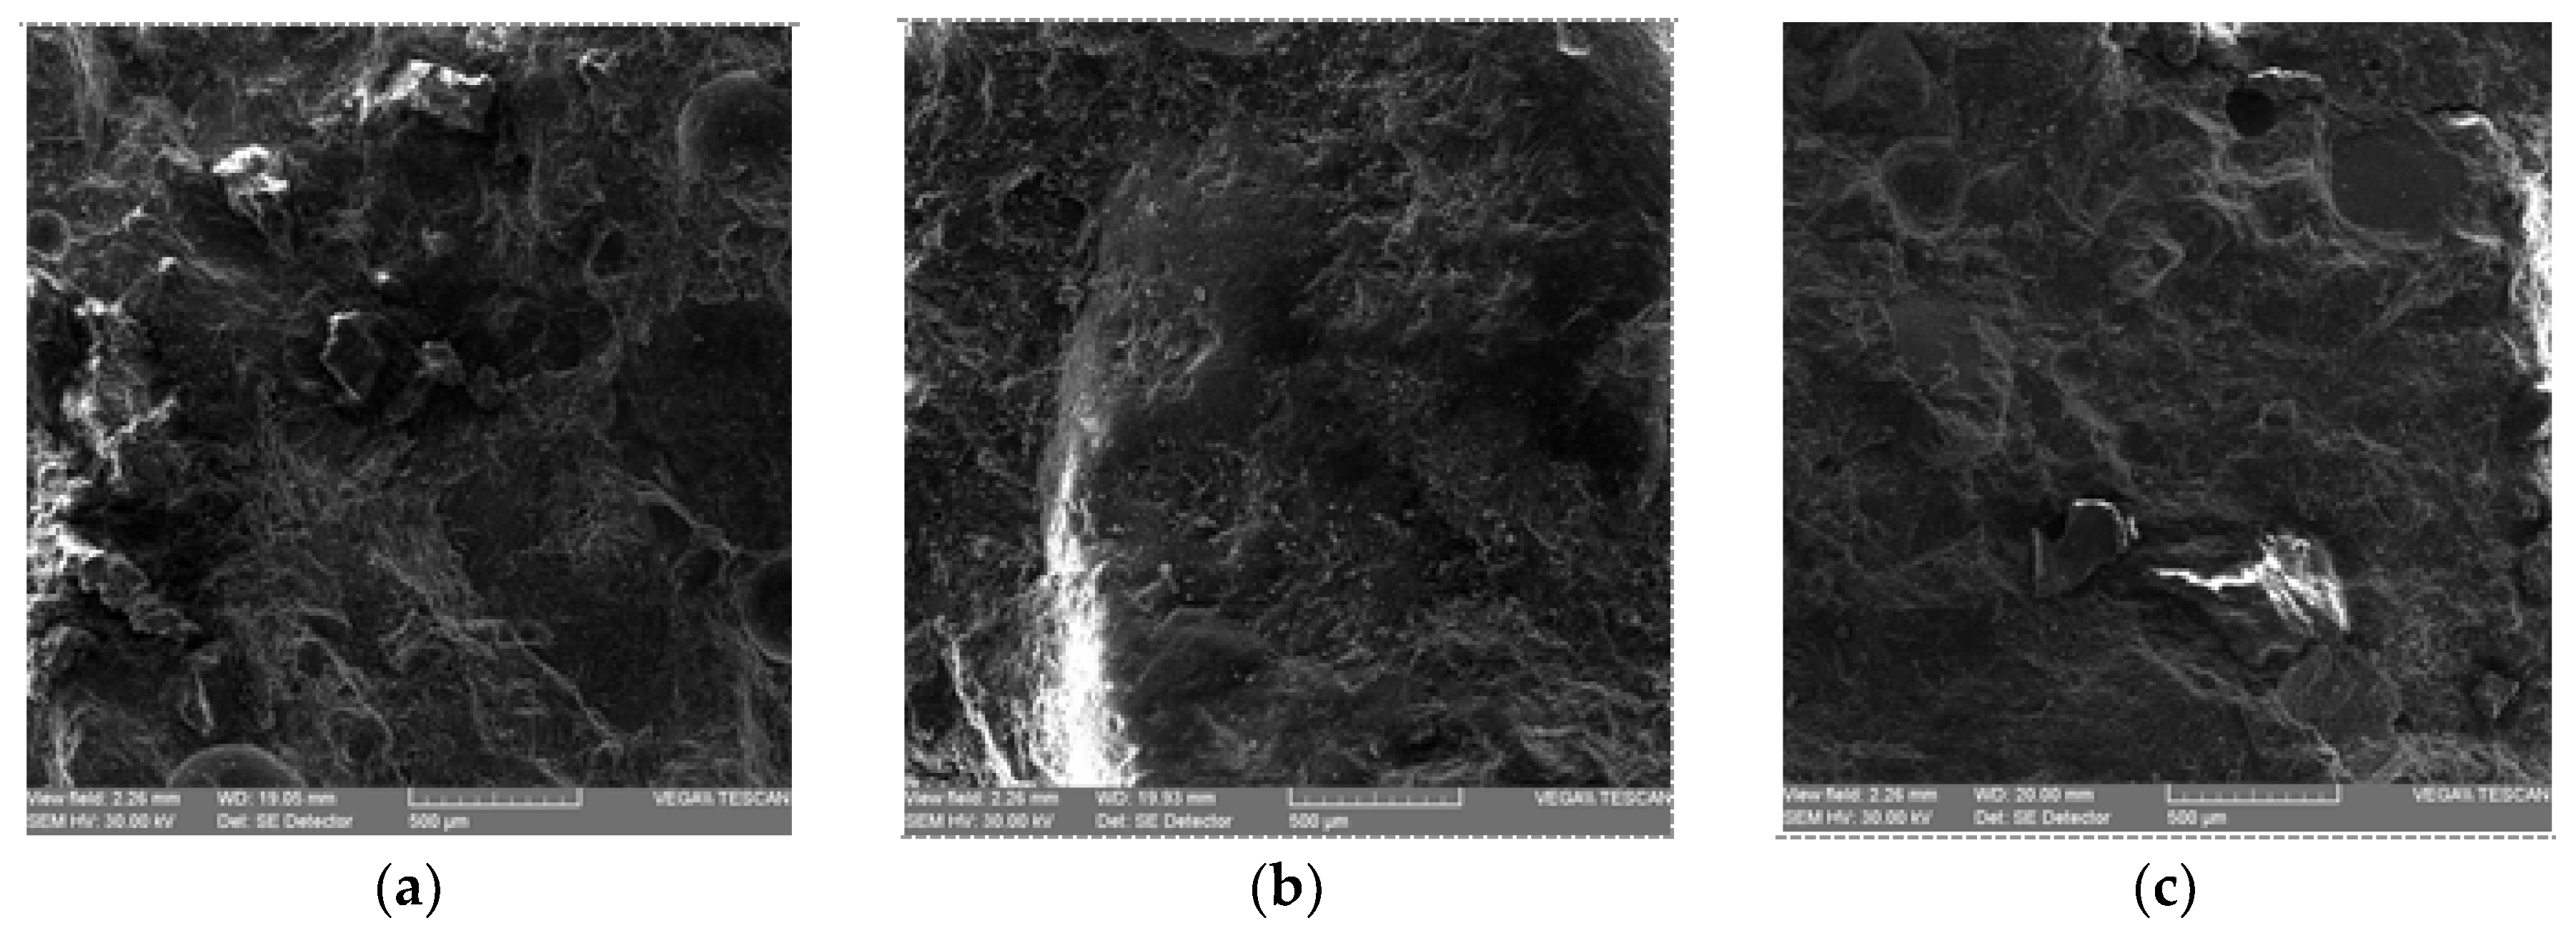
In Figure 3 are shown the SEM (Scanning Electronic Microscopy) images on three mortar compositions under study (Corbu et al, 2015) [54] prior to the road concrete design are presented, to observe the efficiency of several types of powders in mixtures.
Scanning electronic microscopy has been performed using SEM Tescan VEGA II LSH to investigate the microstructure and the raw material. The test was carried out using secondary as well as backscattered electron detectors.
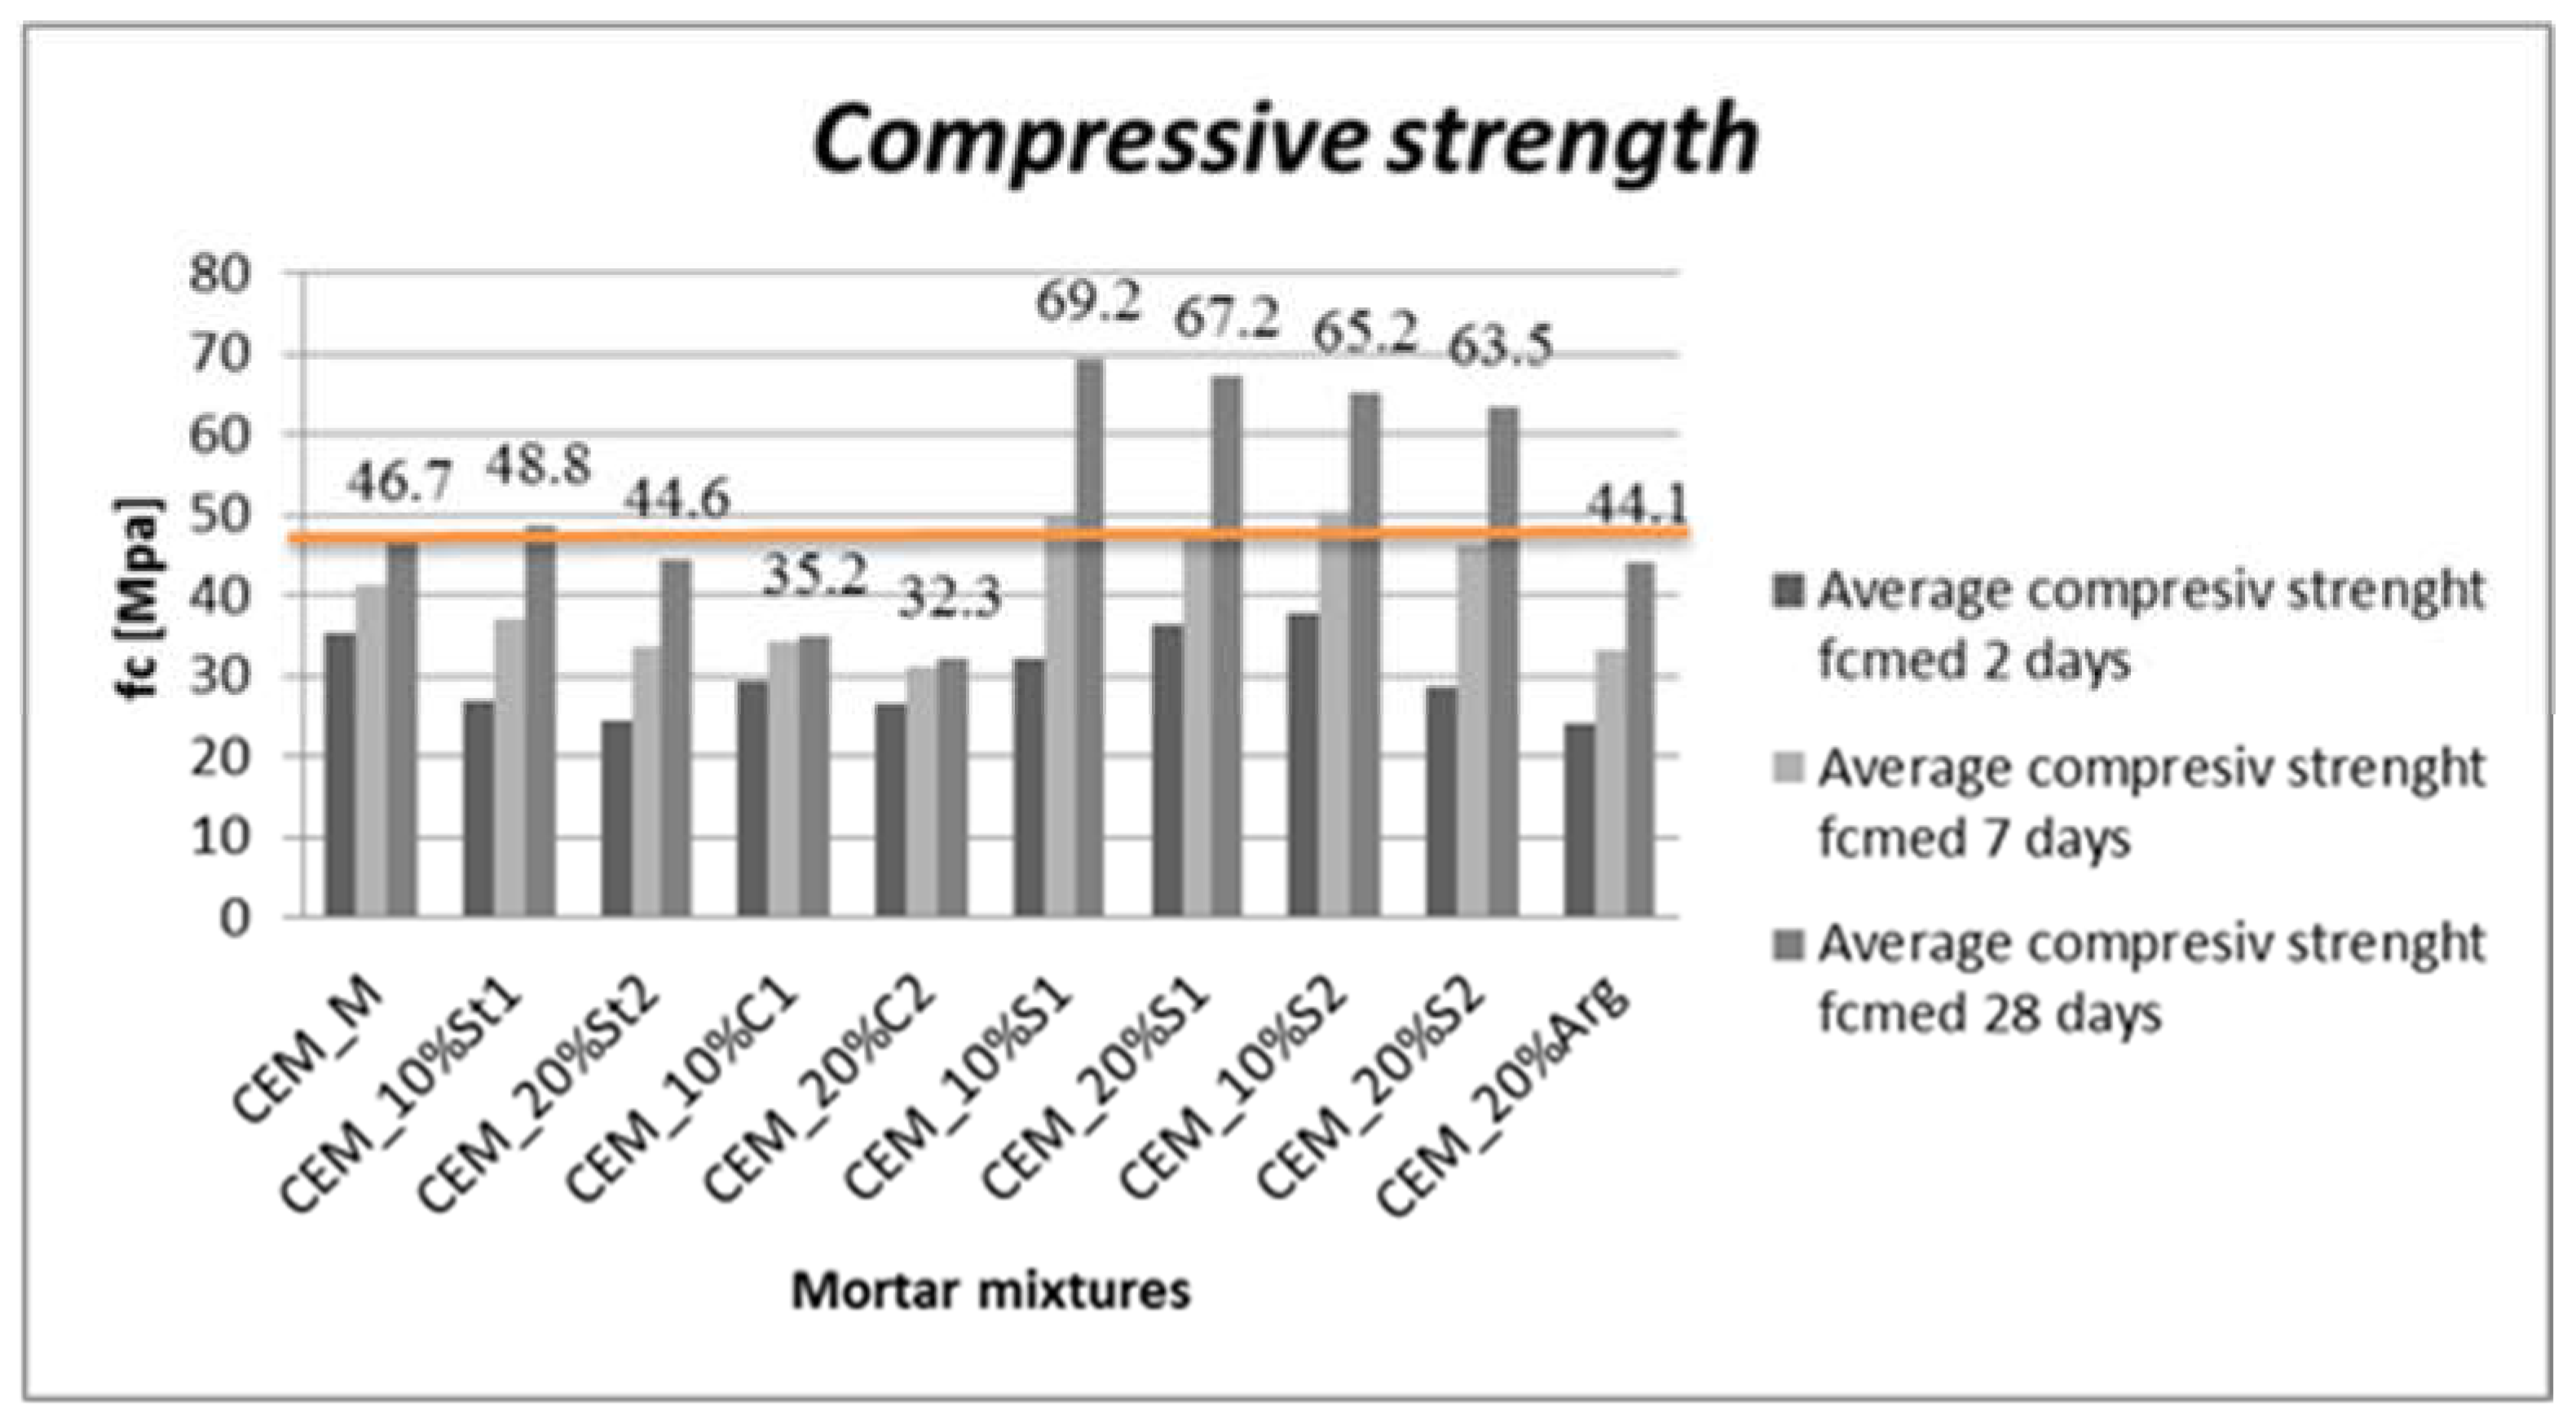
The mortar compositions tested are of components at the age of 28 days obtained after compression testing. The compression test results for the mixtures in the study (Corbu 2015) [54] are presented in Figure 4 (the first three positions are analyzed here). It can be observed that when substituting 10% of the cement content with glass waste in the form of powder (CEM - 10% WGP1 (St1 = WGP1)), the compressive strength is slightly higher at the age of 28 days compared to the conventional control mixture. This confirms the effective pozzolanic activity of the glass powder at the 10% substitution ratio.
The SEM images highlights again that the microstructure (Figure 3) shows a complete consumption of fine glass particles in the mixture with 10% WGP, compared to the one with 20% WGP, due to the pozzolanic reaction during cement hydration, [62] favoring the evolution of compressive strengths [63]. In both cases, the fracture surfaces of the mortar specimens indicated a compact microstructure [64].
In Table 11 is presented the chemical composition of the researched powders ((CEM I 42.5R) and of the glass powder (WGP), determined by X-ray fluorescence (XRF), using (XRF-Qualitax, Italy), in School of Materials Engineer-ing, University of Malaysia Perlis (UniMAP), Perlis, Malaysia [65].
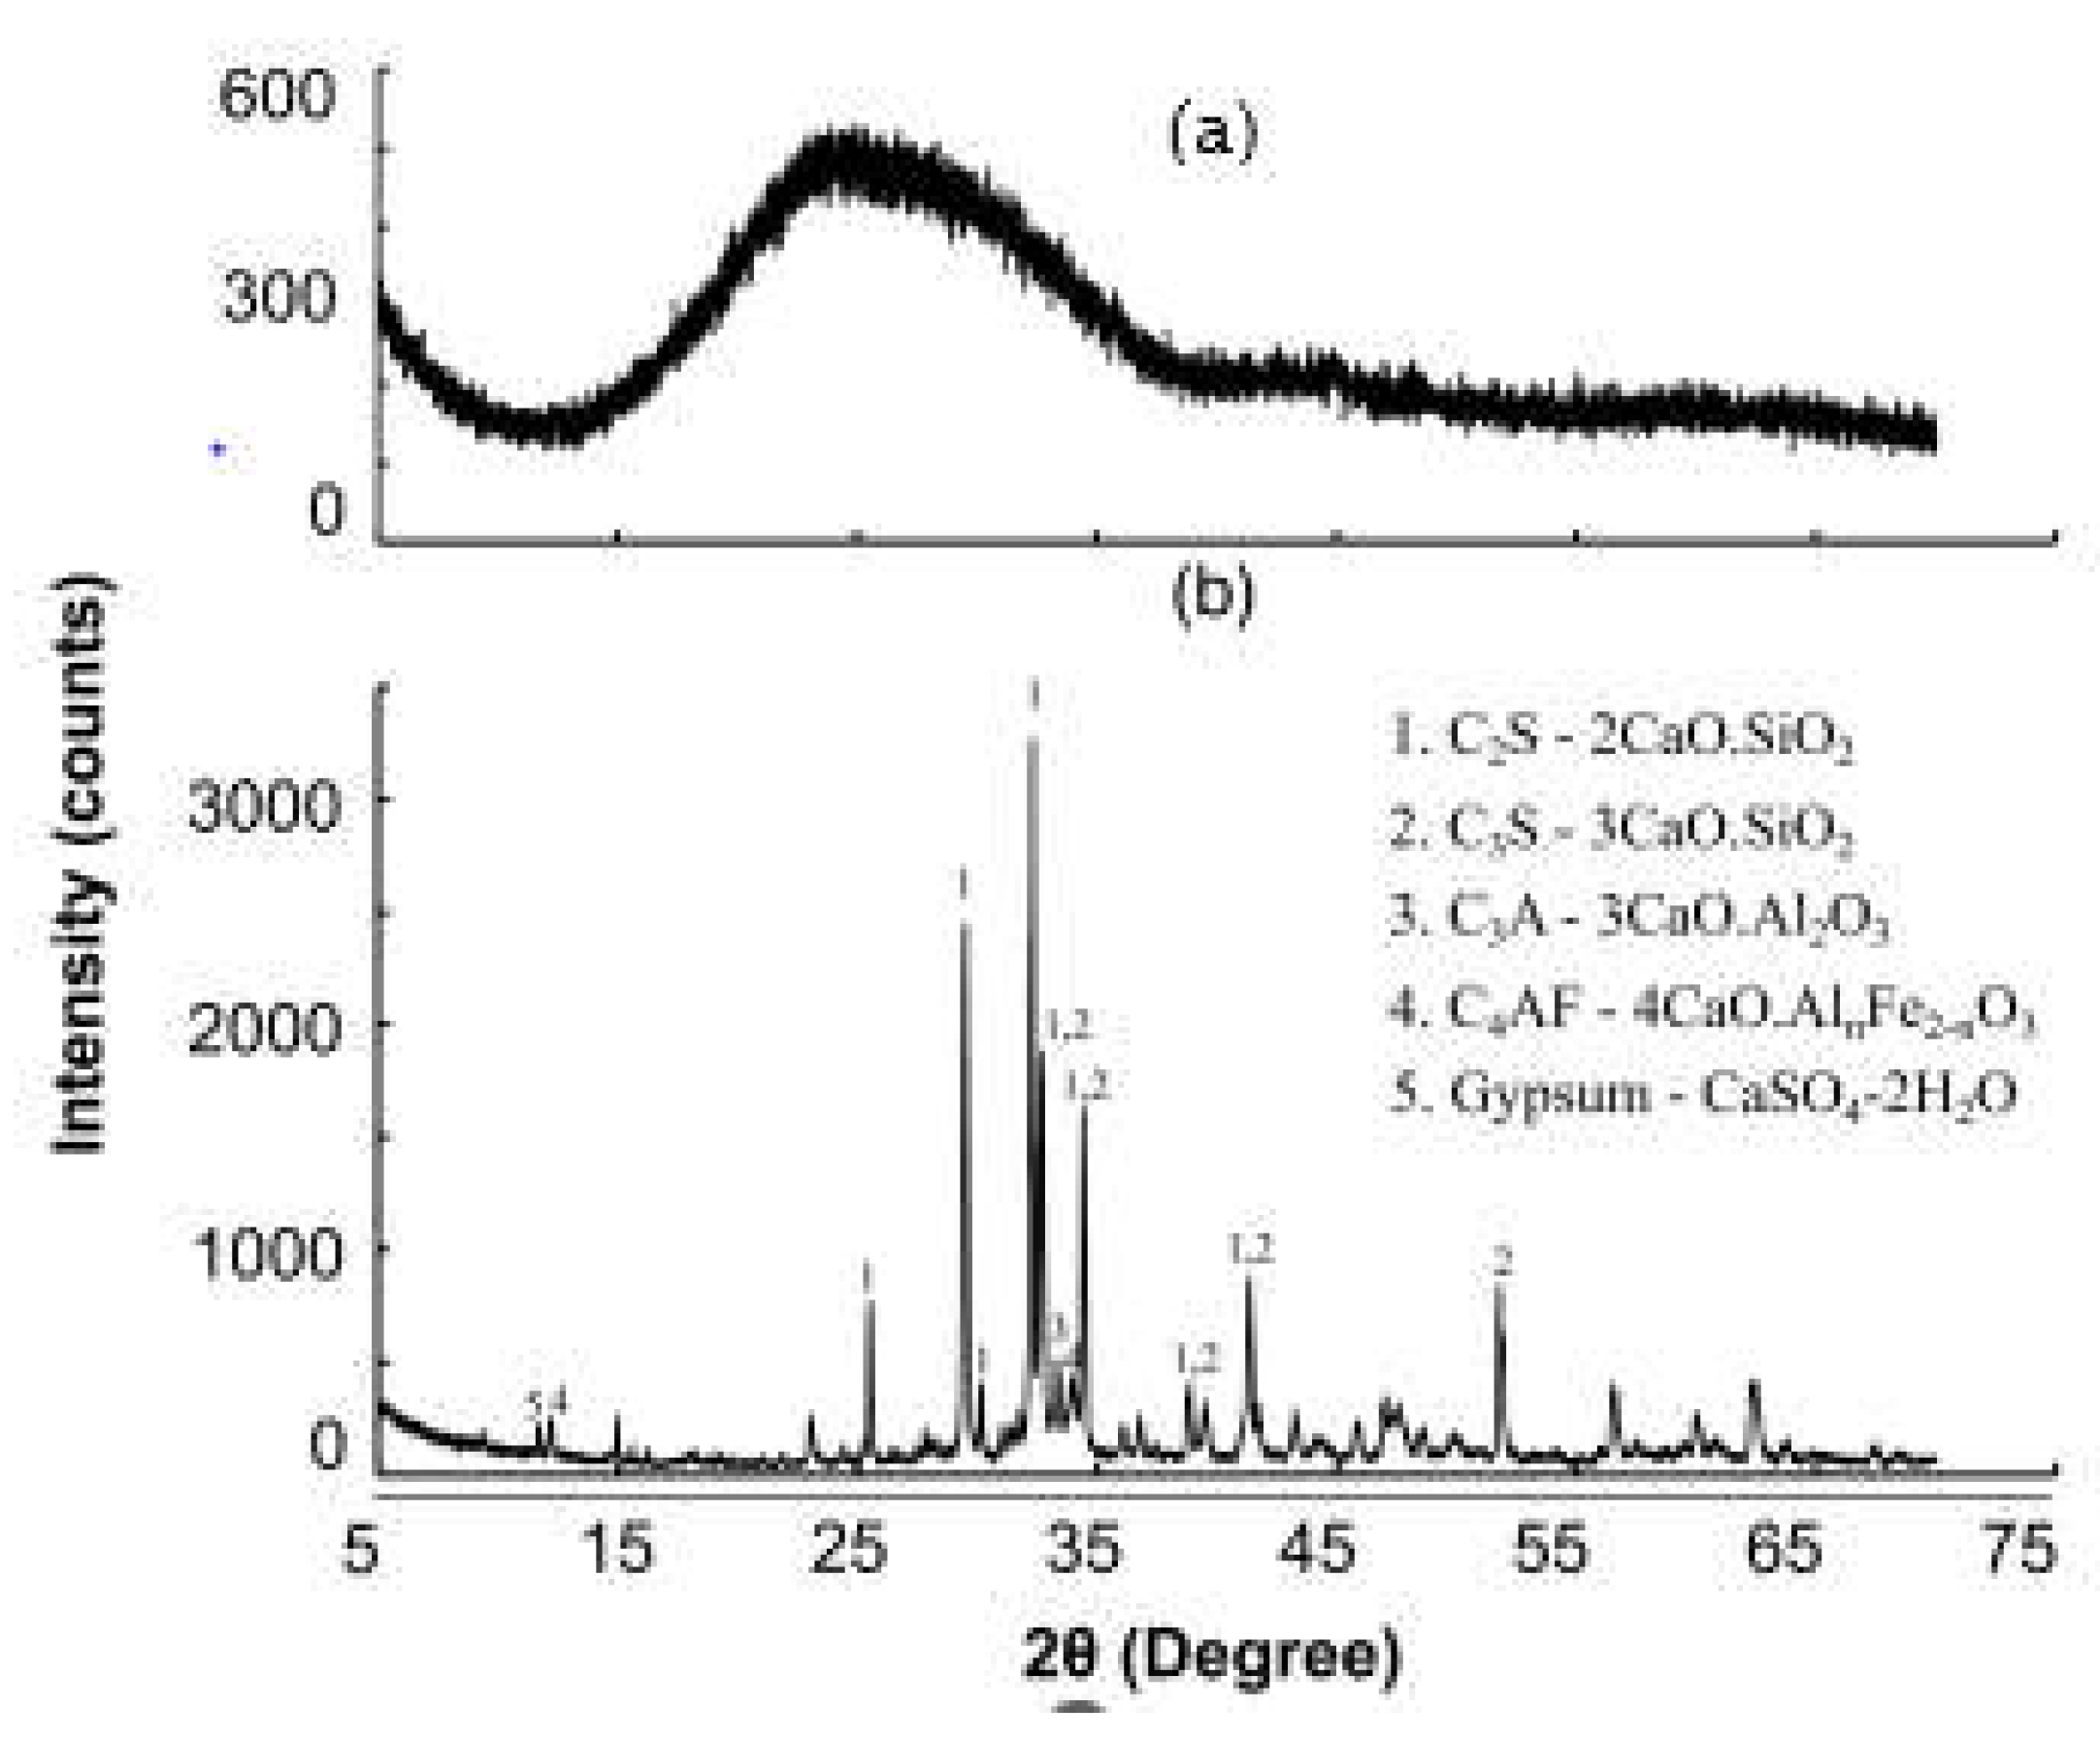
In Table 12. The fineness of the glass powder is observed, which allows it to react very effectively within the concrete matrix during cement hydration reactions, similar to other Supplementary Cementitious Materials (SCMs) [66,67,68]. In Figure 5 the X-ray diffraction spectra of the glass powder (Figure 5a) and the cement CEM I 42.5 R (Figure 5b) used in this study are presented. The XRD pattern shows the amorphous feature of the glass waste and the presence of C2S, C3S, C3A, C4AF and gypsum as the main mineralogic phases in the used CEM I 42,5 R sample [69].
C3S (Tricalcium Silicate) is the most important component, showing optimal characteristics for road cements from all perspectives, and it is recommended to be equal to or greater than 55% (Table 13) [70].

2.1.4. The water used is in accordance with SR EN 1008: 2003) [71]

The water-cement ratio (A/C) is imposed by the current norms [38,39] for the designed concrete class BcR4 as 0.45, for the content of aggregates with continuous gradation.

2.1.5. Additives used in the composition of the concrete mixtures, in accordance with SR EN 934-2+A1 [72]

Two types of additives are used in the composition of the road concrete mixtures. The first one is a superplasticizer for high-performance concrete (MasterGlenium 115 BASF), and the second one is an air-entraining admixture (MICROAir 107-2 BASF), which is imposed by the current standard [39] to provide the concrete with better freeze-thaw resistance. The additives are compatible with Lafarge CEM I 42.5R cement and meet the requirements of the standard [72]. The necessary amount of the additive is calculated as a percentage of the cement mass.

2.2. Methods for designing and determining the properties of mixtures/Mixes/Mixing procedure/Sampling and methodology/

2.2.1. Design and preparation of road concrete recipes for BcR4 class

Three road concrete recipes have been designed in Variant I:
Recipe 1 – the control recipe BcR-NA with natural aggregates (river aggregates, river crushed aggregates, and crusher aggregates/ chippings). The second mix design (BcR-RCA) differs from the control mix by replacing the river crushed aggregate with alternative aggregates obtained from recycled concrete waste (RCA) in a sorted form, in accordance with the normative for road concrete NE 014 [38], and the harmonized standard SR EN 12620+A1 [73], SR 667 [74]. The third recipe (BcR-RCA-WGP) includes the same types of aggregates as BcR-RA, but with the addition of substituting 10% of the cement with glass waste in the form of powder (WGP). This series of recipes is referred to as Variant I (Var. I).
The composition of the types and gradations of aggregates for the concrete mixtures for road pavements is chosen in accordance with NE 014 [38], as shown in Table 14. Thus, the chosen variant coincides with both methods of laying road concrete, either in a single layer or in two layers for the wearing layer.
The natural sand of 0/4 mm fraction has been retained in each mixture to support good compaction and workability of the concrete due to the rounded shape of the particles (all other aggregates in the concrete mix were processed through a crushing process). The proportions of the aggregates have been kept the same for all recipes in Variant I:
30% for 0/4 mm natural river sand (NRA)
16% for 4/8 mm crushed gravel (CRA)
24% for 8/16 mm crushed aggregate (CAC)
30% for 16/25 mm crushed aggregate (CAC).
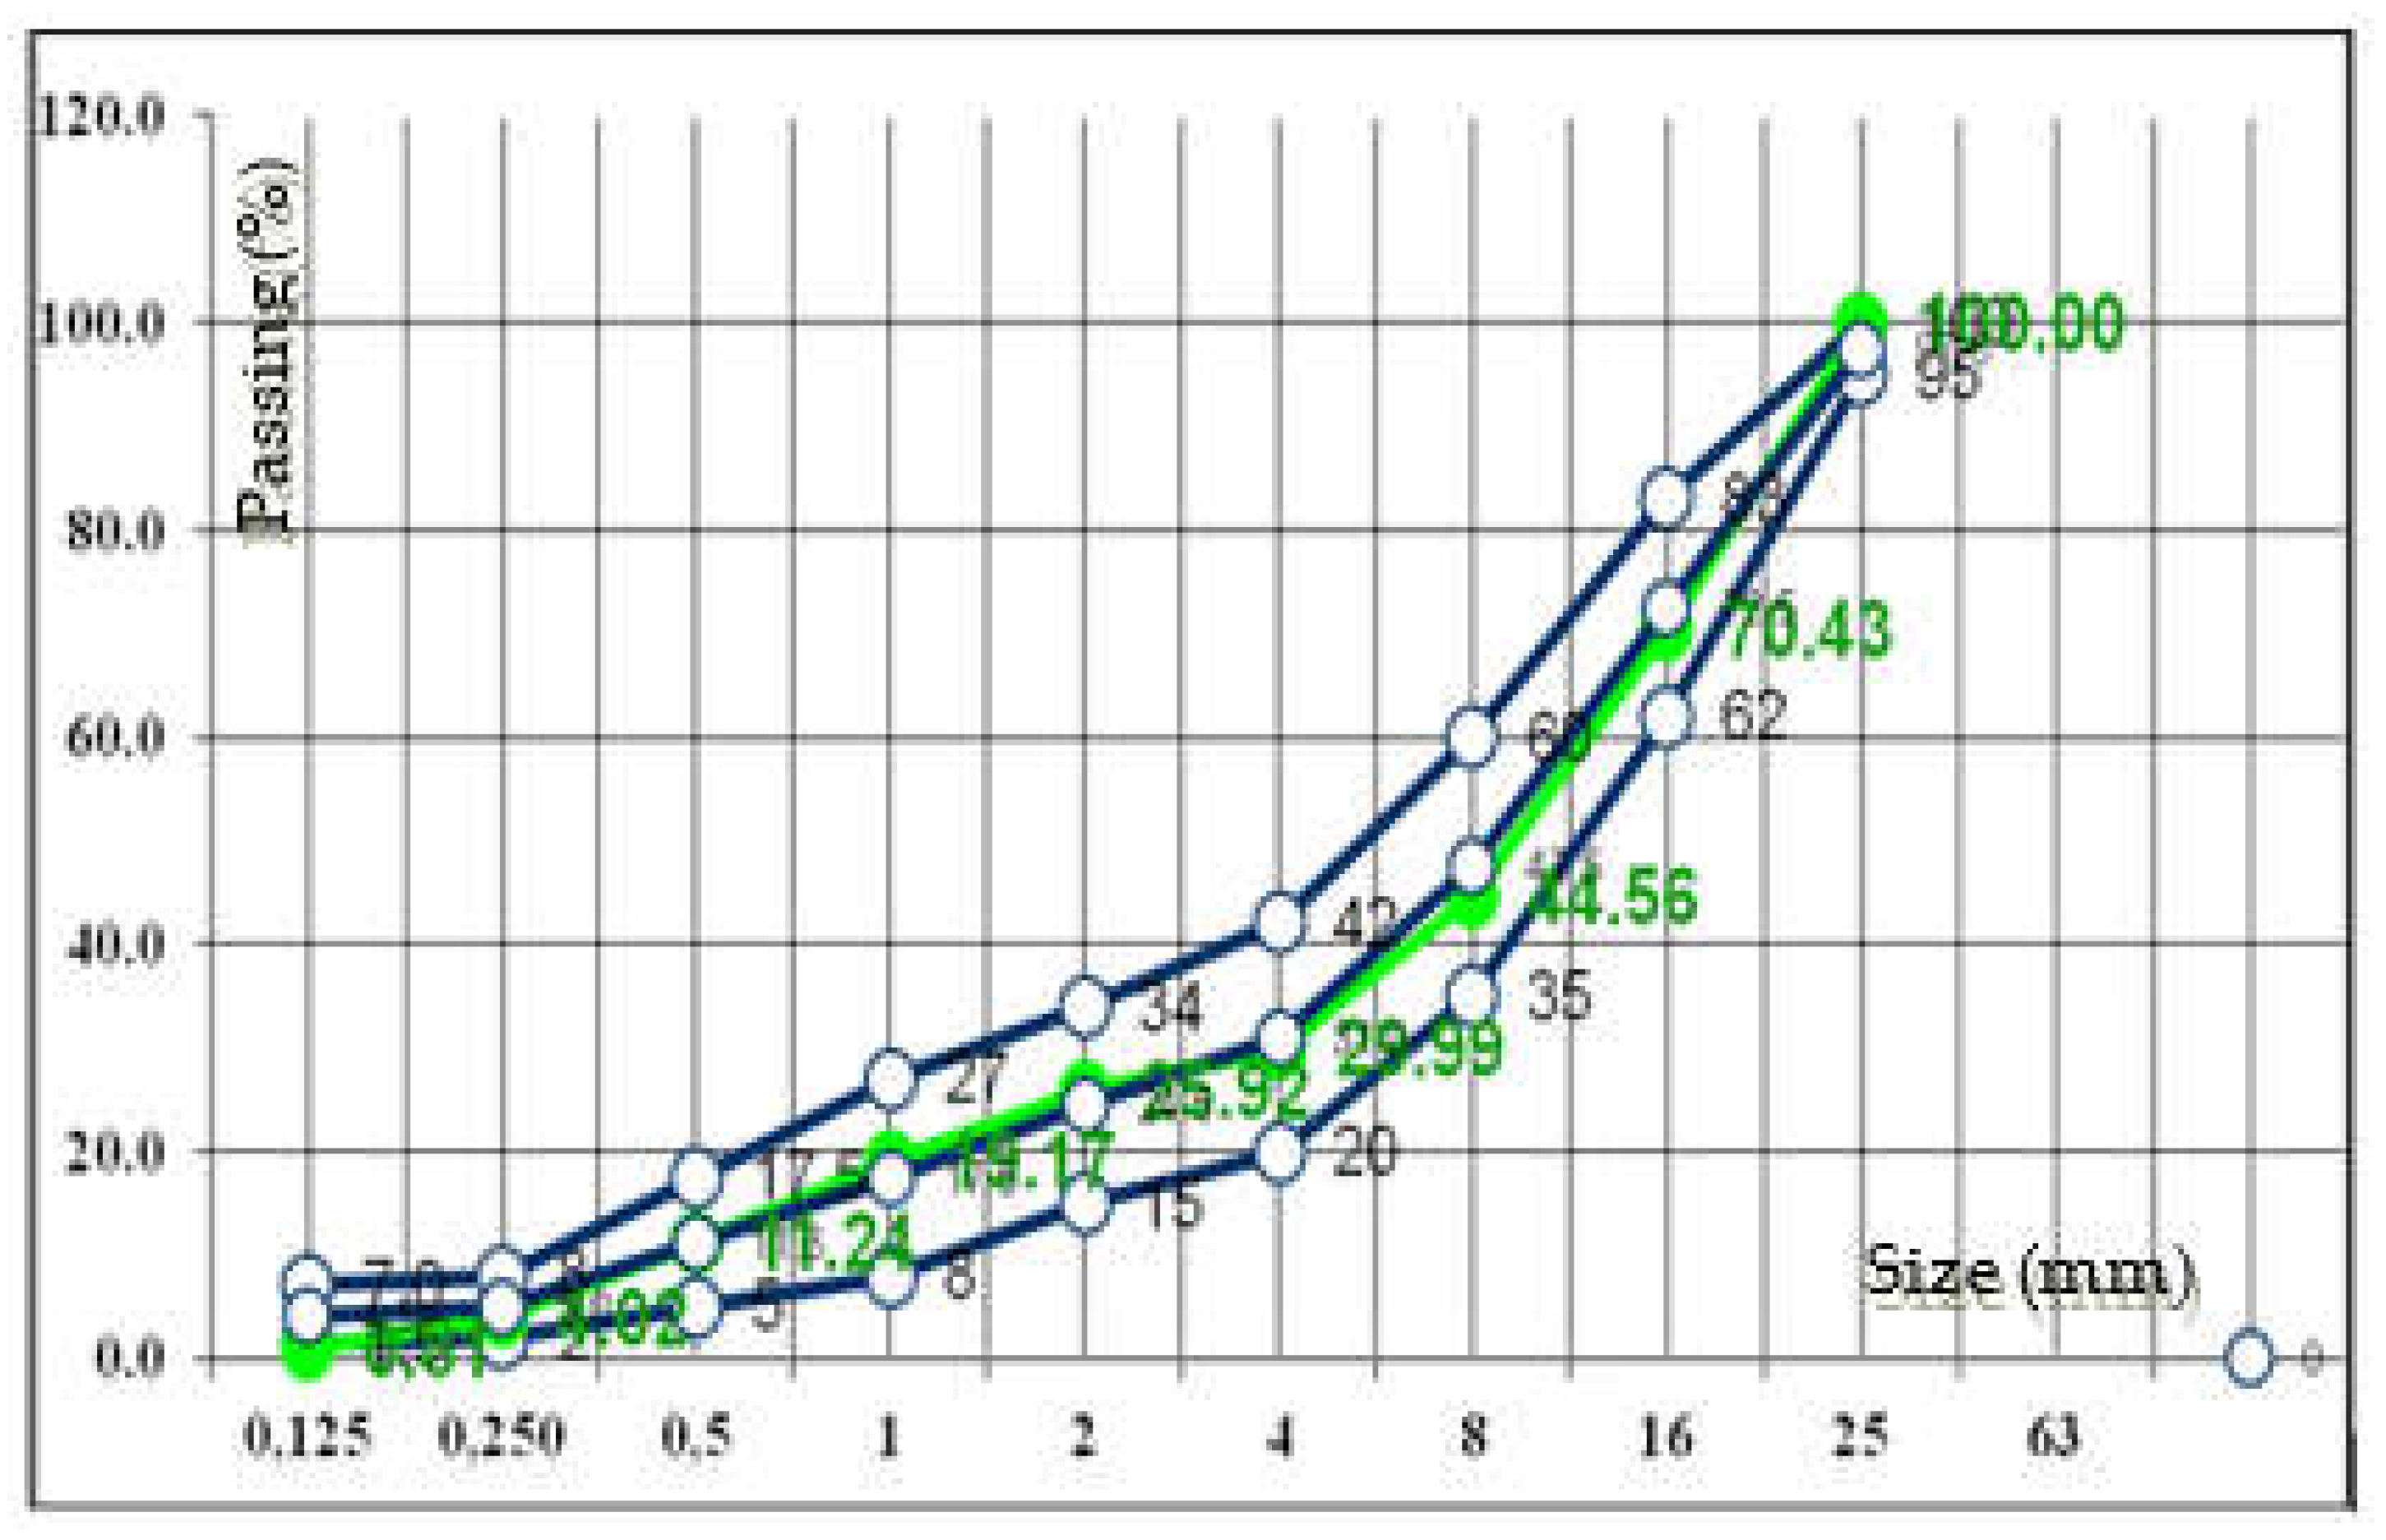
These percentages have been calculated to ensure that the total gradation curve falls within the "Favorable Zone," as presented in Table 14.
In a similar way, the water/cement ratio of 0.45, in accordance with NE 014 [38] and SR EN 206 [39], has been maintained for all recipes to observe any changes in workability/consistency of the concrete based on the variations in the mixture.
The percentages of the aggregates have been calculated in such a way to ensure that the total gradation curve falls within the "Favorable Zone," which is delimited by the limits of granulometry of the total aggregate for road concretes made with continuous gradation aggregates of 0/25 mm. The representation of the total curve can be found in Figure 6.
In Table 15, the total gradation curves are presented for the control mixture and the other two mixes design, where the modification involves replacing the 4/8 mm crushed river aggregate (CRA) with recycled concrete aggregate (RCA). This replacement was carried out as a first phase of the study. The replacement is relevant because the two types of aggregates have very similar Los Angeles abrasion resistance values (31.0% and 30.9%, respectively) and have been obtained through crushing processes.
Design parameters according to standards and cement quantities (kg/m3) for preparing concretes are presented in Table 16.
In Table 17, the compositions of the designed/calculated and realized mixtures are presented, where it can be remarked that the difference in the cement amount occurs in the concrete made with glass waste (in the form of powder with particle size < 0.125 mm), where it substitutes 10% of the cement content compared to the control recipe.
Aiming use of as much recycled material in the asphalt concrete mix and since the total aggregate curve allows entry into the favorable zone, new percentages for aggregates have been adapted. Additionally, 20% of the cement quantity has been substituted with WGP in a second mix design variant (Var. II), presented in Table 18.
In Variant II, the first mixtures have been prepared using natural river aggregates (NRA) and crushed aggregates / chipping (CAC), along with recycled concrete aggregates (RCA) with a size of 4/8 mm. In the third mixture, 20% of the cement has been substituted with WGP to enhance wear resistance while maintaining the water-to-cement ratio (W/C) and admixture dosage. However, after preparing the mixtures, a significant reduction in workability has been observed, as expected, due to the 6% water absorption of RCA, which necessitated an increase of the superplasticizer admixture (Admixture 1) from 1.8% to 2.3% relative to the cement quantity, as well as maintaining the W/C ratio of 0.55. Consequently, a consistency class of S1 (10÷40 mm) was achieved in accordance with NE 014 [38].
Several studies have highlighted that crushed concrete aggregates in the size range of 4 to 8 mm exhibit the highest amount of adhered mortar, which implies that aggregate size has a significant effect on water absorption and concrete strength [75,76]. The determined water absorption values for RCA (sort 4/8 mm) are 6.0%, while for NRA they are 3%.

2.2.2. Determinations in the Fresh and Hardened State of BcR Concrete

2.2.2.1. Determinations in the Fresh State of BcR Concrete

In the study the following determinations have been conducted:
  • Concrete temperature (°C), in accordance with SR EN 206:2014 [39]
  • Consistency using the slump test (mm), in accordance with SR EN 12350-2:2009 [77]
  • Mixture density (Kg/m3), in accordance with SR EN 12350-6:2009 [78]
  • Air content (%), in accordance with SR EN 12350-7:2009 [79]
The temperature has been measured using a specialized thermometer for concrete determinations, at various points on the poured material.
Consistency, which indicates workability, has been determined using the slump cone method. Three determinations have been performed for each mixture.
The density of fresh concrete mixtures has been determined using a vessel of known volume, which has been weighed before and after filling. The difference in masses, reported to the volume, provided the density value.
The air content has been determined using equipment with a manometer. The vessel has been filled in three layers, and the material was vibrated until no more air bubbles escaped. The vessel has been then covered with a lid equipped with valves, an air release valve, and a manometer indicating the percentage of entrained air content.

2.2.2.3. Determinations of Mechanical Strength and Durability of BcR Concrete

The following determinations have been conducted for BcR concrete:
  • Flexural strength (fct,fl) in accordance with SR EN 12390-5 [80]
  • Compressive strength (fcm) in accordance with SR EN 12390-3 [81]
  • Splitting tensile strength (fct,sp) in accordance with SR EN 12390-6 [82]
  • Hardened concrete density (ρa) in accordance with SR EN 12390-7 [83]
  • Loss of strength after 100 freeze-thaw cycles in accordance with SR 3518 [84]
  • Abrasion resistance in accordance with SR EN 1338, SR EN 1339, SR EN 1340 [85,86,87]
  • Carbonation depth determination according to SR CR 12793 [88]
2.2.2.3.1. Flexural strength (fct,fl)
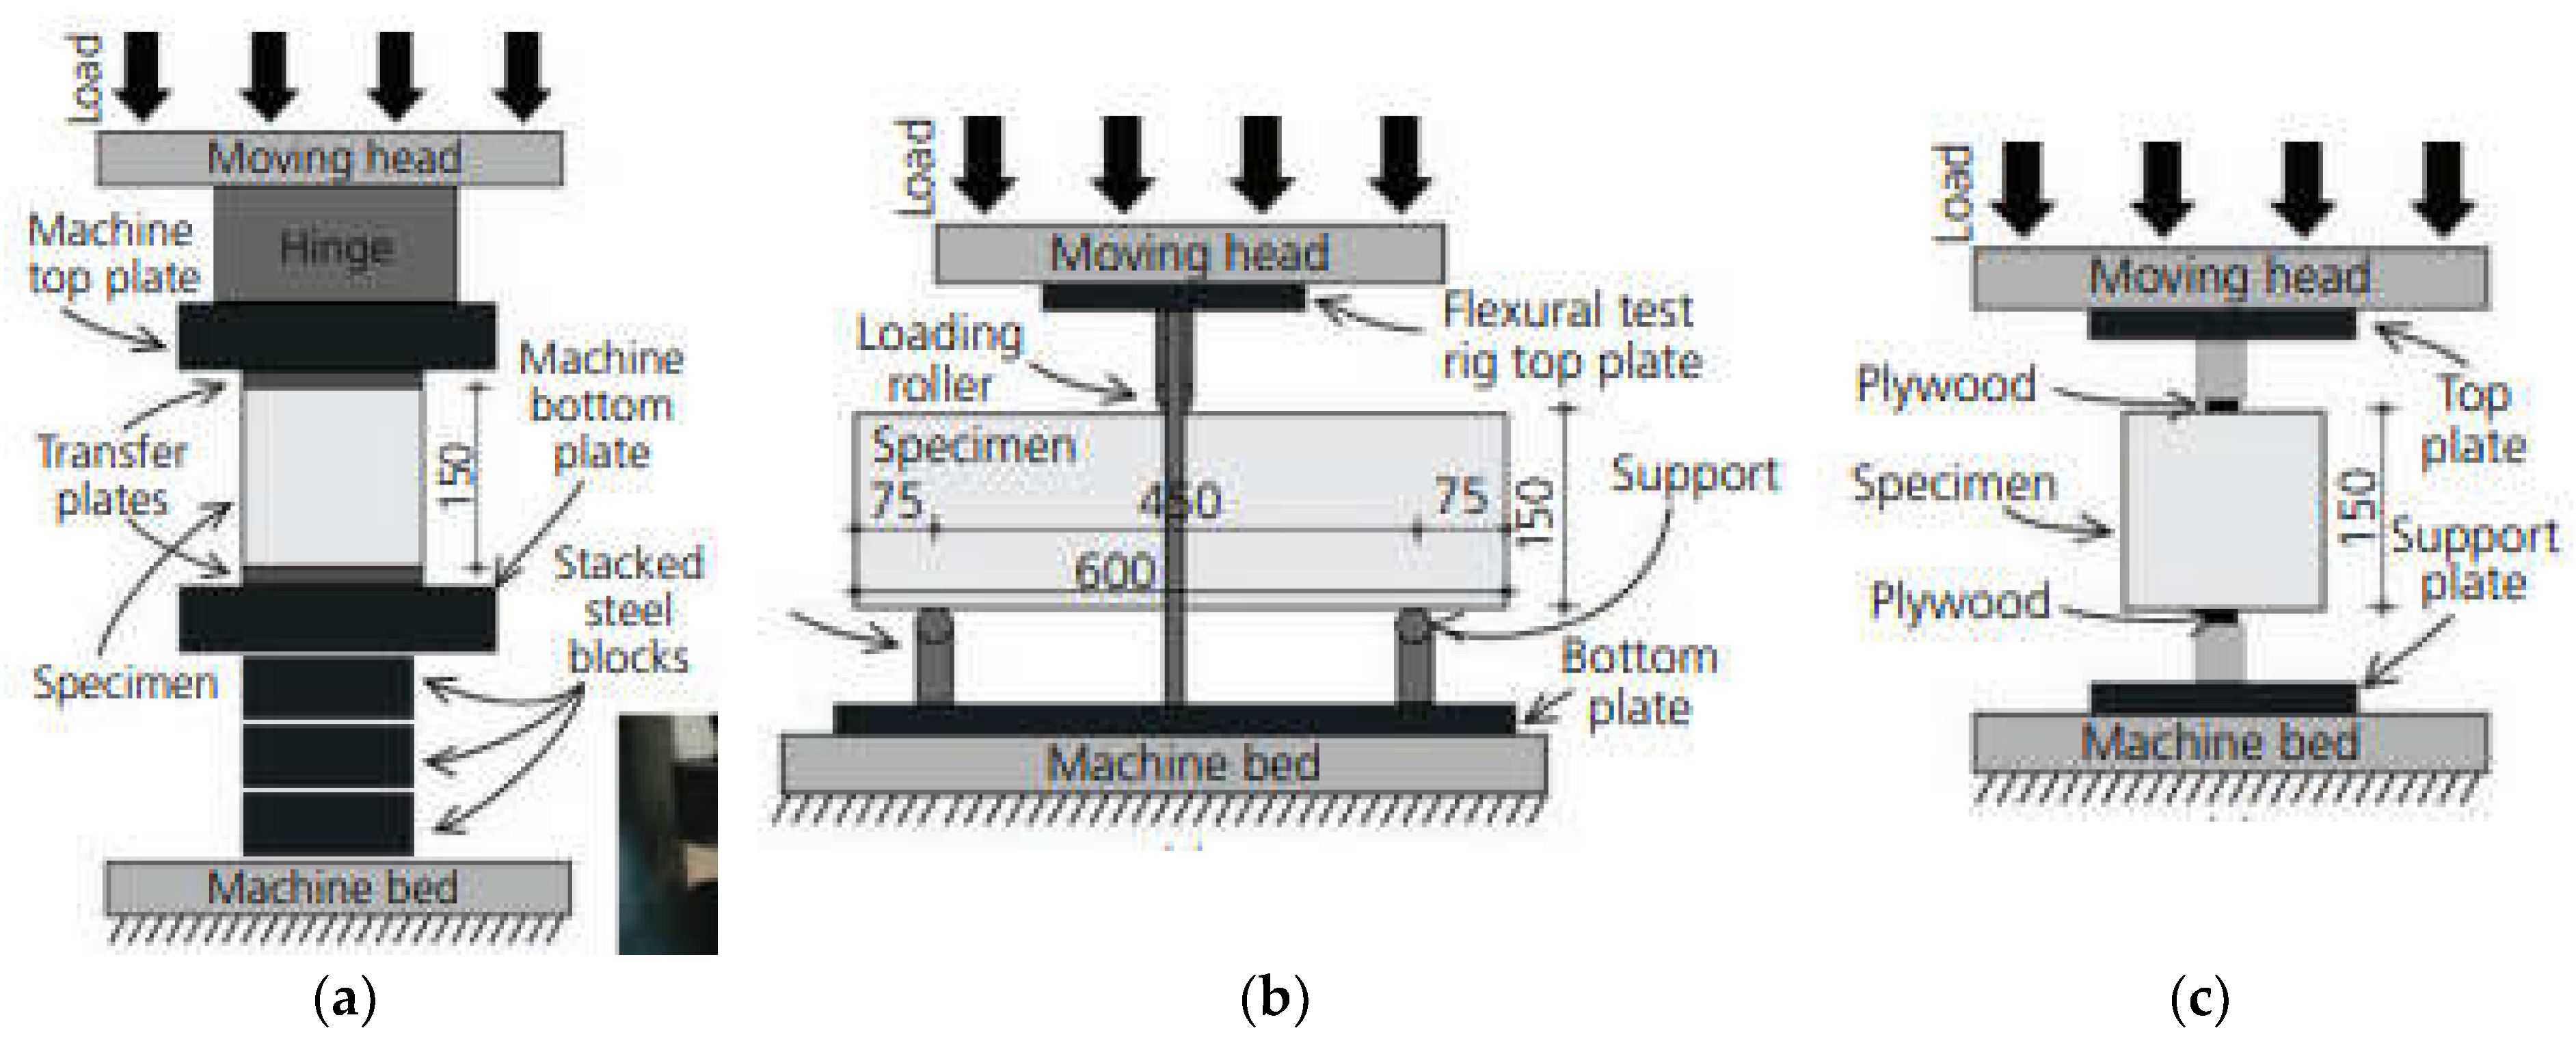
For determining the flexural strength, a minimum of three prismatic specimens measuring 150x150x600 mm have been taken for each BcR concrete mixture. The results from this test are used as a reference for establishing the class of BcR concrete compared to conventional concretes, where the compressive strength on cylinders or cubes is relevant. The hardened specimens, immediately after demolding, have been kept in water at a controlled temperature of (20±2) °C until the reference age of 28 days, and then tested using a digital press. The loading device, as shown in Figure 6b, consists of two support rollers and two upper rollers supported by an articulated transverse arm, which evenly distributes the load applied by the press between the two rollers. The loading rate has been set at 0.04÷0.06 MPa/s, as per SR EN 12390-3.
The flexural strength is determined using the equation:
fct , fl = F × Ι d 1 × d 2 2 ,
where
fct,fl is the tensile strength, in MPa/s (N/mm2∙s);
F is the maximum load, in N;
l the span between the supports, in mm;
d1 and d2 are the lateral dimensions of the specimen, in mm (as in Figure 6b).
Flexural strength is expressed rounded to the nearest 0.1 MPa (N/mm²).
2.2.2.3.2. Compressive strength (fcm)
For determining compressive strength (Figure 6a), in addition to the series of cubes taken with a side length of 150 mm, determinations also on the prism fragments have been conducted, using non-deformable metal plates for the testing surface. The principle of the compressive strength determination method involves applying a steadily increasing force to cubic specimens, or roughly on prism fragments resulting from flexural and cylindrical (core) testing. The specimen has been centered relative to the lower platen with an accuracy of 1% of the designated cube size or designated cylindrical specimen diameter.
The loading rate should remain constant within the range of (0.6 ± 0.2) MPa/s (N/mm².s). After applying the initial load, which should not exceed approximately 30% of the ultimate load, the load is applied without shock to the specimen, and it is continuously increased at the chosen constant rate ± 10%, until the specimen can no longer withstand a higher load.
Compressive strength is determined by the equation:
fc = P A c
where:
fc compressive strength, in MPa (N/mm2).
P maximum load at yield, in N.
Ac the cross-sectional area of the specimen on which the compressive force acts, calculated from the designated dimensions of the specimen in accordance with [SR EN 12390-1 [89] or from measurements of the specimen if tested according to Annex B, in mm².
The obtained result is rounded to 0, 1 N/mm2. The loading rate has been 0.5 MPa/s, according to SR EN 12390-3 [81].
2.2.2.3.3. Splitting tensile strength (fct,sp)
The determination of tensile splitting strength has been carried out on cubes with length of edges of 150 mm and prism fragments. The specimen is centrally positioned, and the direction of force application must be perpendicular to the direction of concrete casting. The prismatic specimens are subjected to a compressive force applied over a narrow region along their length. The resulting orthogonal tensile stress causes the failure of the tensile-stressed specimen.
Benzi de incarcare: confectionate din placi dure, cu densitatea > 900 kg/m3, cu dimensiunile urmatoare: latime: (10±1) mm, grosime: (4±1) mm, iar lungimea trebuie sa fie mai mare decât lungimea liniei de contact a epruvetei supuse incercarii. Acestea trebuie sa fie utilizate doar odata. Se pozitioneaza benzile de incarcare (fâsii de material din placa dura) si piesele de incarcare, de-a lungul partii superioare si inferioare a planului de incarcare a epruvetei. Viteza de încărcare este de 0.04 MPa/s according to SR EN 12390-3 [81].
The loading strips have been made of hard plates with density > 900 kg/m³, with the following dimensions: width: (10±1) mm, thickness: (4±1) mm, with the length greater than the length of the contact line of the tested specimen. These strips are used only once. The loading strips (strips of material from the hard plate) and loading pieces are positioned along the upper and lower parts of the specimen's loading plane. The loading rate is 0.04 MPa/s according to SR EN 12390-3 [81].
The tensile splitting strength is determined by the formula:
fct , sp = F × Ι d 1 × d 2 2
where:
fct,sp – tensile splitting strength, in MPa
F – maximum load, in N
L – length of the contact line of the specimen, in mm
d – size of the transversal cross-section.
The obtained value is rounded to the nearest 0,05 MPa.
The determinations are presented schematically and with images during laboratory tests in Figure 7. All mechanical property tests have been performed using the Advantest 9 digital press of 2000 kN capacity, provided by CONTROLS company.
2.2.2.3.4. Hardened concrete density (ρa)
The hardened concrete density has been determined by weighing, calculating the mass of each sample in relation to the volume of the cube with a side length of 150 mm.
2.2.2.3.5. Loss of strength due to 100 freeze-thaw cycles
Concrete specimens are kept for 7 days in water at temperature Twater = (20+2) °C, and for 21 days in air at Tair = (20+2) °C and relative humidity URA = (65+5) %.
Specimens aged at a minimum of 28 days are placed in a water bath at a temperature of (20+5) °C for saturation, 4 days before the start of the test. Water is poured into the bath up to 1/4 of the height of the specimens; after 24 hours, it is added up to 1/2 of the height, and after another 24 hours, up to 3/4 of the height. After 3 days from introducing them into the bath, the water level should be at least 20 mm above the height of the specimens, maintaining this level for 24 hours. Afterward, the specimens are considered saturated.
Specimens intended for freeze-thaw cycles were placed in the thermostat cabinet of CONTROLS. Control specimens are continuously kept underwater.
Saturated specimens introduced into the refrigeration chamber at (-17+2) °C are kept for 4 hours for the freezing cycle. Under conditions of a temperature of (20+5) °C and humidity of 95%, the thawing cycle is carried out for 4 hours. The specimens must be arranged so that they are completely surrounded by air. The distance between specimens and between specimens and the walls of the installations must be at least 20 mm. The support on which the specimens are placed must be constructed in such a way that the contact surface with the base of the specimens is minimal.
After subjecting the specimens to 100 freeze-thaw cycles, the loss of compressive strength is determined by subjecting them to a compressive test. The number of specimens tested is the same as the number of control specimens. The test is stopped after reaching the number of 100 cycles or if the loss of compressive strength exceeds 25% compared to the control specimens of the same age.
The loss of compressive strength (ŋ) is determined by the relationship:
ŋ = Rm Ri Rm   100
where:
Rm - Arithmetic mean value of the compressive strengths of the control specimens, in N/mm².
Ri - Arithmetic mean of the compressive strengths of the freeze-thaw specimens, in N/mm² or MPa.

2.2.2.6. Abrasion Resistance–Volume Loss

The purpose of the test is to determine the Böhme abrasion resistance expressed as volume loss relative to 5000 mm². For the determination, cubes with a side length of 71.0 ± 1.5 mm have been placed on the abrasive disk of the Böhme apparatus (Figure 8), on the testing track where a standard abrasive has been spread. The disk is rotated, and the specimens are subjected to an abrasive load of (29 ± 3) N for a specified number of cycles. The abrasive wear on the specimen leads to volume loss. The contact face and the opposite face of the specimen must be parallel and flat. Before the test, the density of the specimen, ρR, has been determined by measuring to the nearest millimeter and by weighing to the nearest 0.1g.
The standard abrasive used should be fused alumina (artificial corundum) designed to produce an abrasion of 1.10 mm to 1.3 mm when specimens are tested.
Before the abrasion test and after every four cycles, the specimen is weighed with an accuracy of 0.1 g. 20 g of standard abrasive is placed on the testing track. The specimen is fixed in the specimen holder, with the test face placed on the track, and a central load of (294 ± 3) N is applied.
The disk is started, ensuring that the abrasive on the track remains evenly distributed over the surface defined by the width of the specimen. The specimen is tested for 16 cycles, each consisting of 22 rotations. After each cycle, the disk and the contact face are cleaned, the specimen is progressively rotated by 90°, and a new abrasive is placed on the testing track.
The abrasion is calculated after 16 cycles as the average of the lost volume ΔV, using the equation:
Δ V = Δ m ρ R , [ mm 3 ]
where:
Δ V is the volume loss after 16 cycles, in mm3.
Δ m is the loss of mass after 16 cycles, in g;
ρR is the density of the specimen, in g/mm3.
Abrasion is expressed by the volume loss of the specimen after it has been subjected to wear.
2.2.2.3.6. Carbonation–Depth of Carbonation Layer
The depth of the carbonation layer in hardened concrete is determined using the phenolphthalein method in accordance with SR CR 12793: 2002 [88].
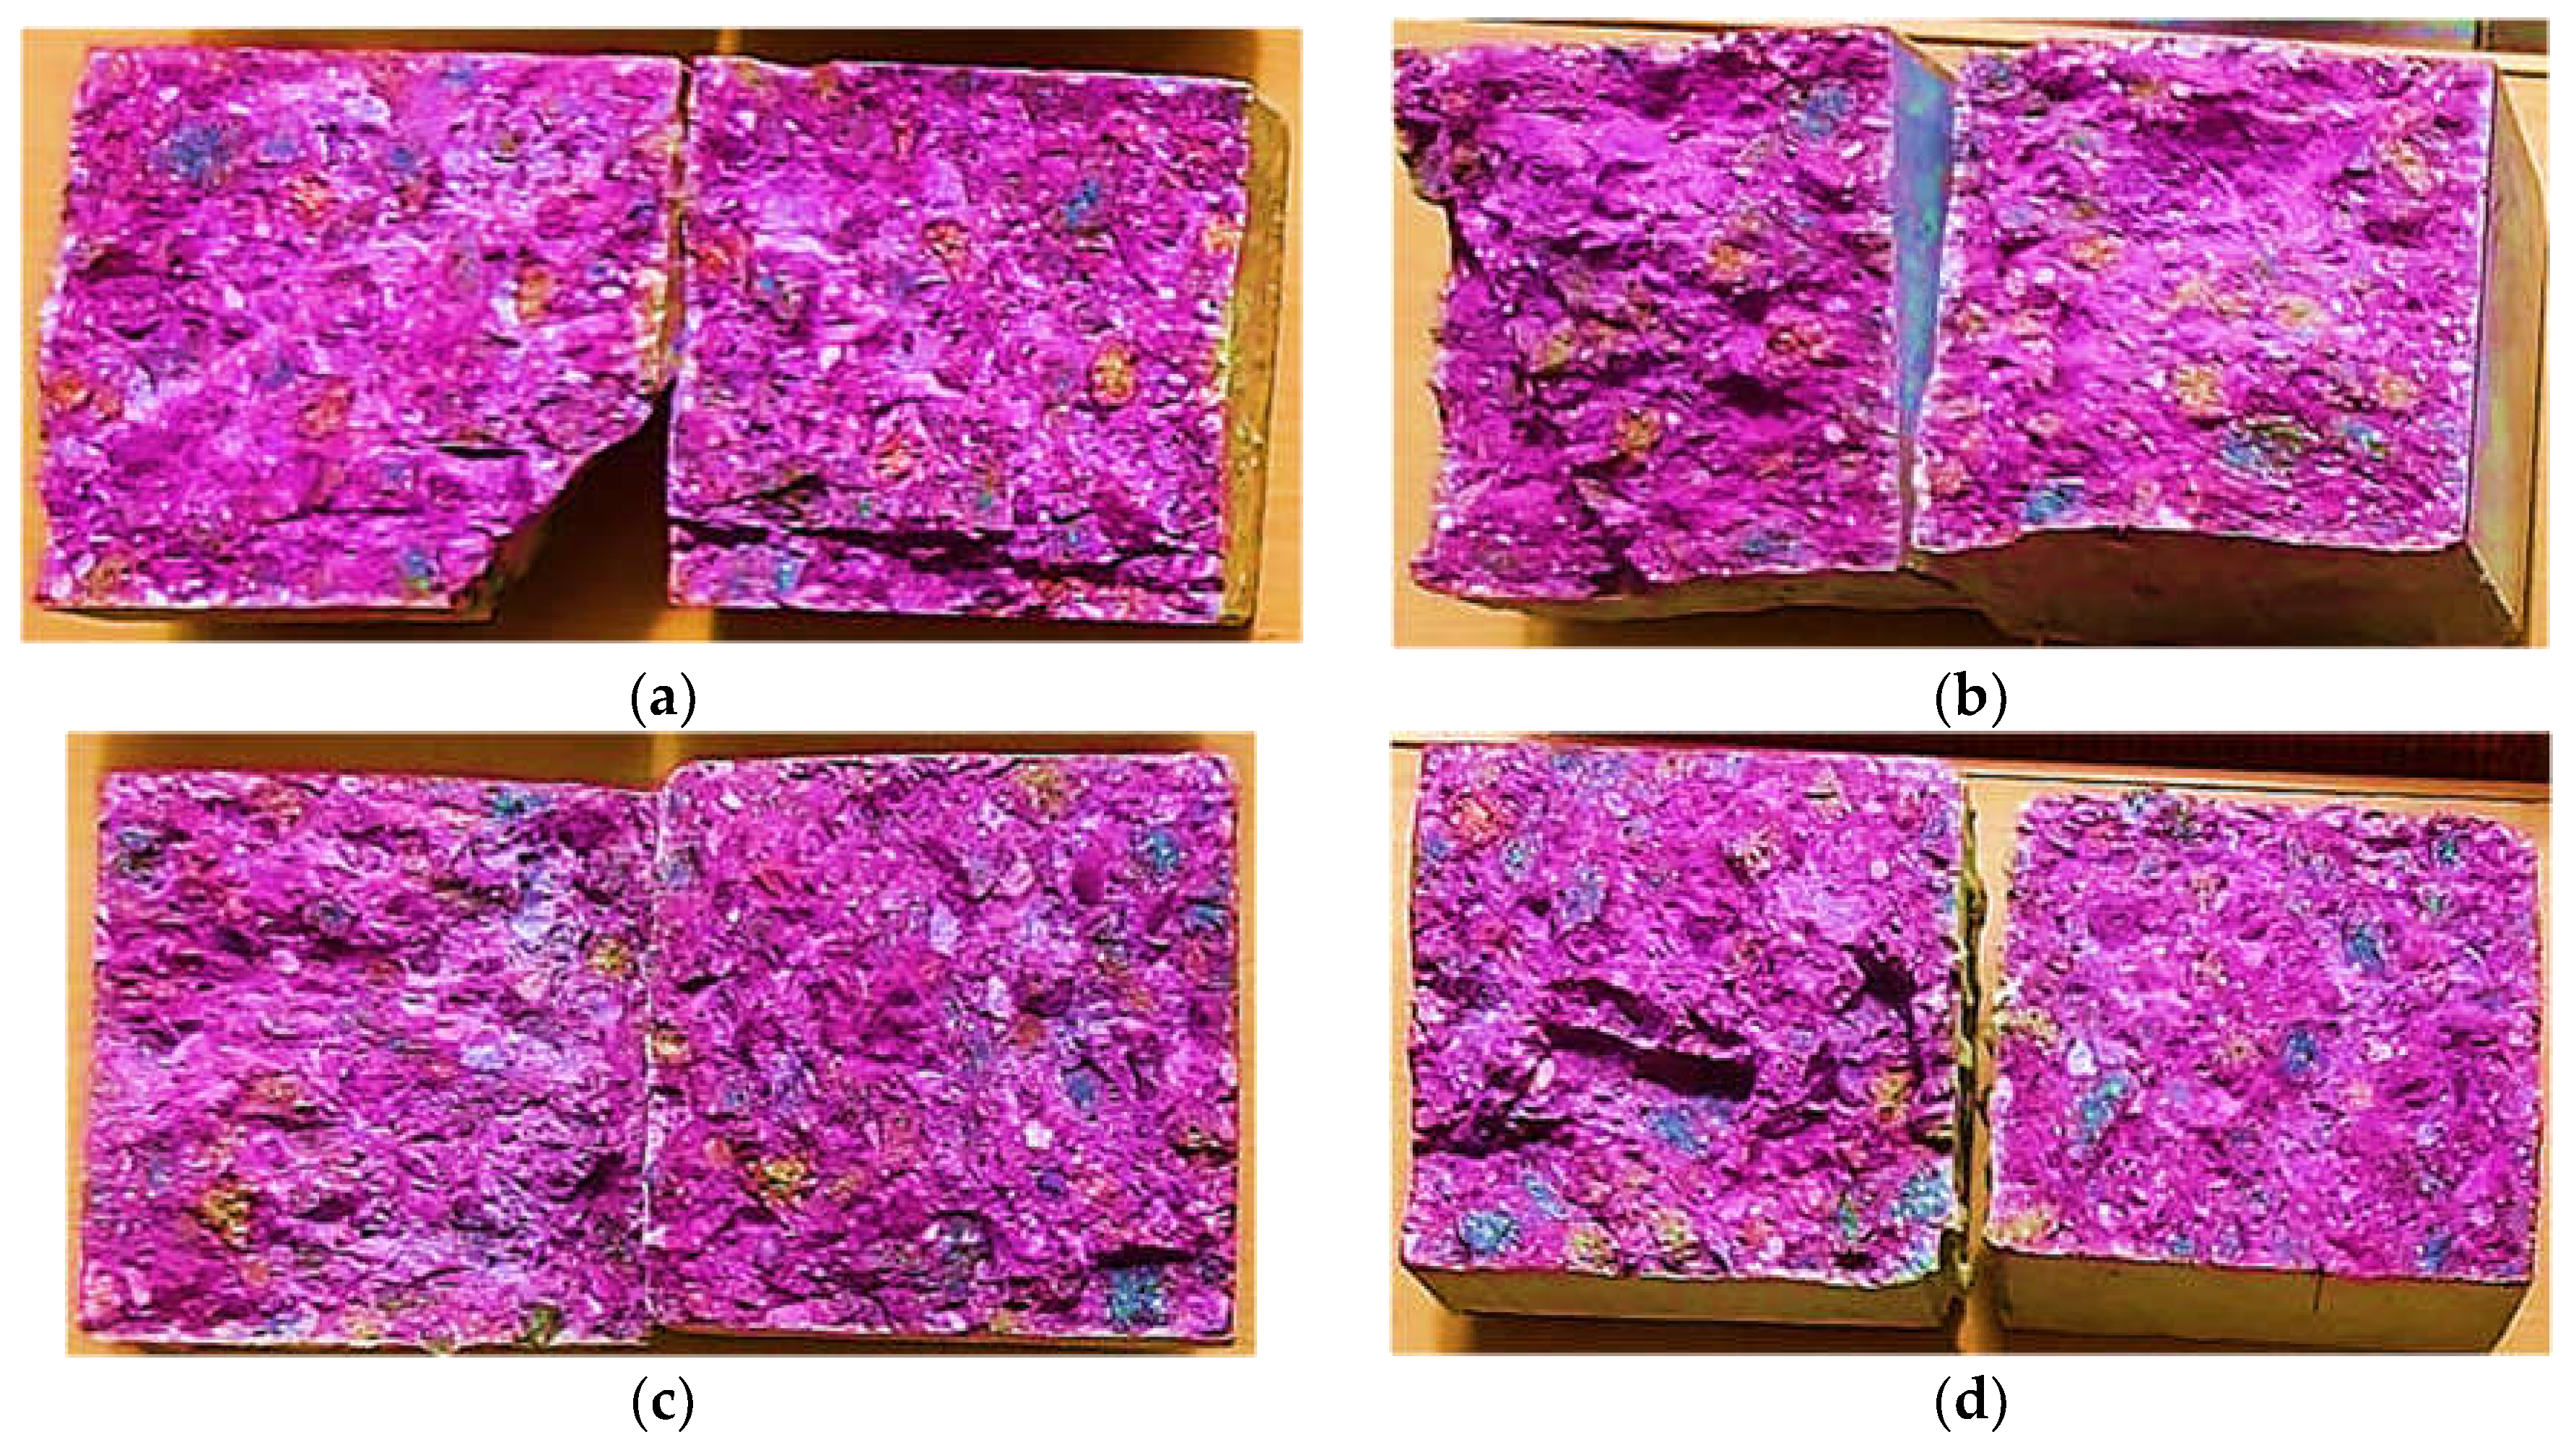
The carbonation of the concrete specimens has been assessed in freshly exposed sections through the reaction with pH indicator substances, such as phenolphthalein, which turns the concrete red purple at a pH value of approximately 9. This measurement can be carried out at various ages (days).
Carbonation has been determined at an age of 8 years (2920 days). The specimens have been kept in a laboratory room at a temperature of 20+3°C throughout this period. Before the test, they have been stored in water for 28 days, then taken out, excess water has been removed, and split open. A 1% solution of phenolphthalein in 70% ethanol has been sprayed onto the fresh concrete section. The depth of carbonation is represented by the distance dk (measured in mm) from the outer surface of the concrete to the edge of the red-purple colored region. Both the average depth, dk average, and the maximum depth, dk max, are measured.

2.2.3. Microstructural determinations

2.2.3.1. Optical microscopy and X-Ray Powder Diffraction method (PXRD) for the qualitative analysis of crystalline constitutive materials
Polarized light optical microscopy have been used in order to investigate the concrete/mortars samples. Thin section has been prepared from all samples of investigated concrete and mortars and a Nikon Optiphot T2 – Pol have been used for optical studies (textural and compositional) at crossed and parallel pollars respectively as well as for taking photos.
X-ray diffraction (XRD) has been performed on the concrete/mortars using a Bruker D8 Advance diffractometer with Cu Kα radiation (λ = 1.541874 Å), a 0.01-mm Fe filter, and a LynxEye one-dimensional detector at the Department of Geology, Babeș-Bolyai University (Cluj-Napoca, Romania). The determinations have been performed on samples aged 2920 days, as in the case of carbonation determination.

3. Results

3.1. Characteristics of Fresh State Concrete for Road Pavement

It has to be noted that the designed mixes in Variant II required an increase in the amount of admixture and the water-to-cementitious materials ratio (W/C or W/L) due to the increased proportions of natural river aggregates (NRA) of 0/4 mm by 2%, and recycled concrete aggregates (RCA) of 4/8 mm by 4% compared to the mixes in Variant I. The increase in water content leads to a reduction in mechanical characteristics.
The results obtained from the determinations on fresh concrete are presented in Table 19.

3.2. Hardened BcR composite properties

The results obtained from mechanical tests on cubic and prismatic concrete specimens for the two mix variants, namely, for the compositions BcR-NA/NA; BcR-RCA; BcR-RCA-WGP, are presented in Table 20.
In Figure 9, it can be observed that in all specimens aged for 2920 days, a slight and non-uniform carbonation outline is present, reaching a maximum depth of 0.5 mm; however, color intensity becomes more pronounced after 1 day from spraying. This phenomenon, occurring at a testing age of 28 days under testing/holding conditions according to the standard, would not have existed. We suggest that the diffusion of carbon dioxide did not take place within the cement matrix, a phenomenon hindered by the compactness of the cementitious stone in the concrete [90,91].

3.3. Microstructural determinations

3.3.1. Optical microscopy using polarized light

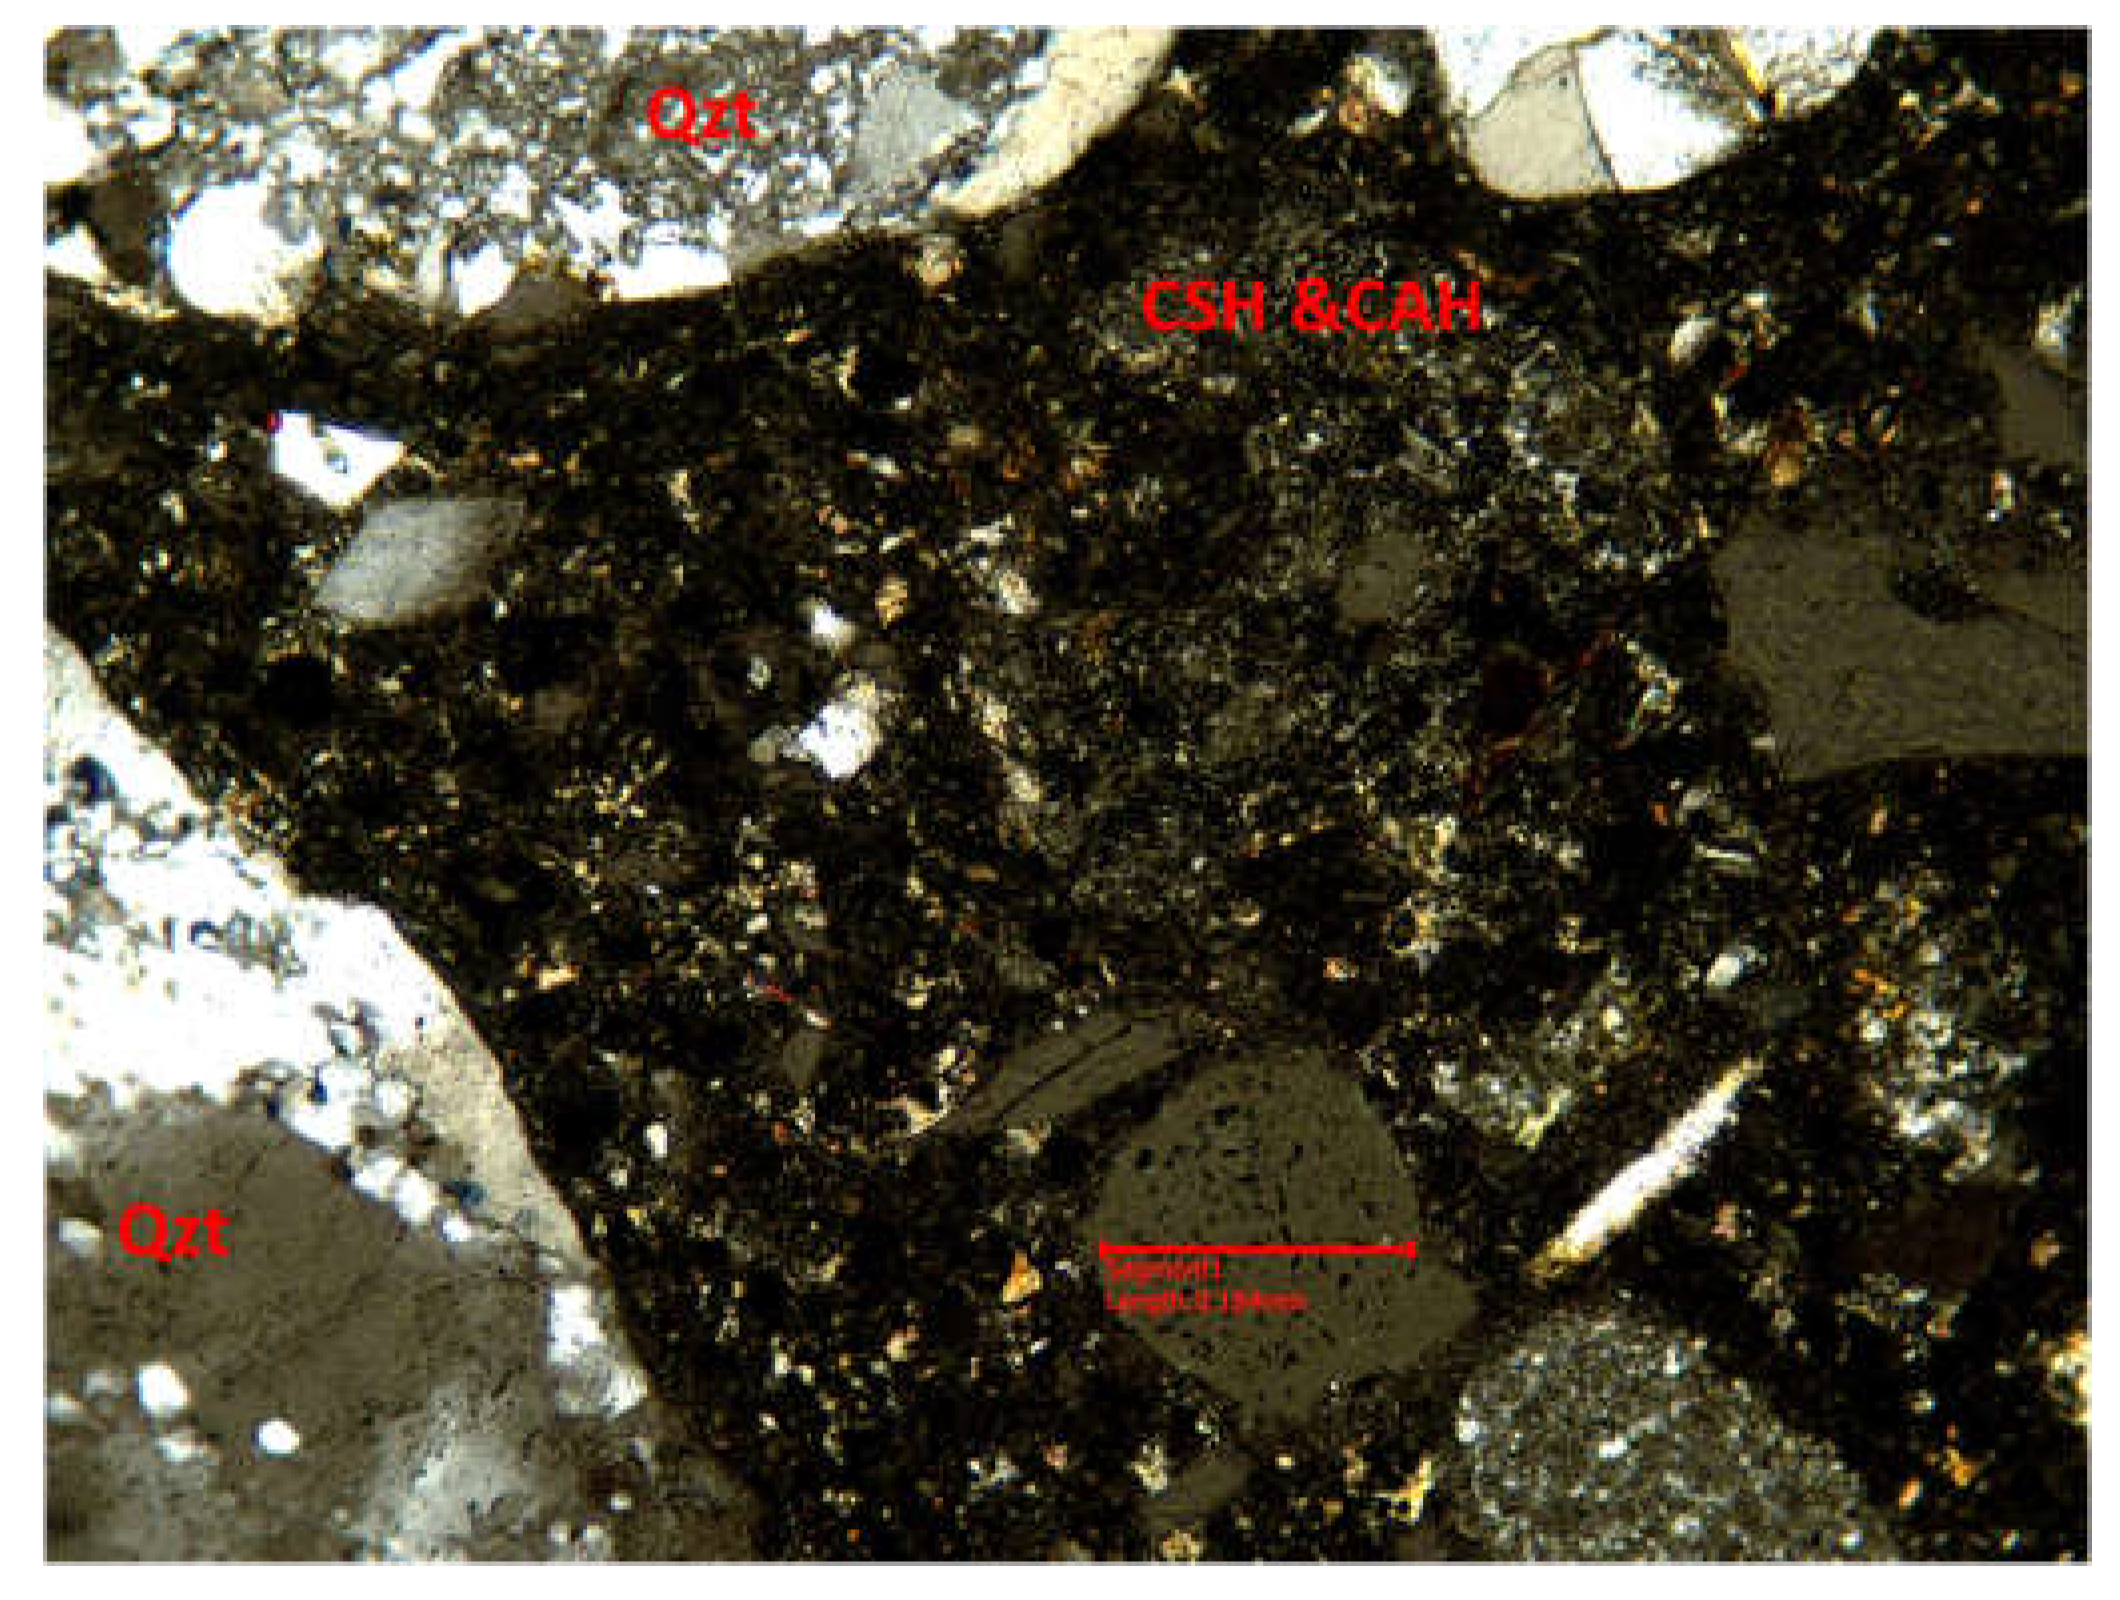
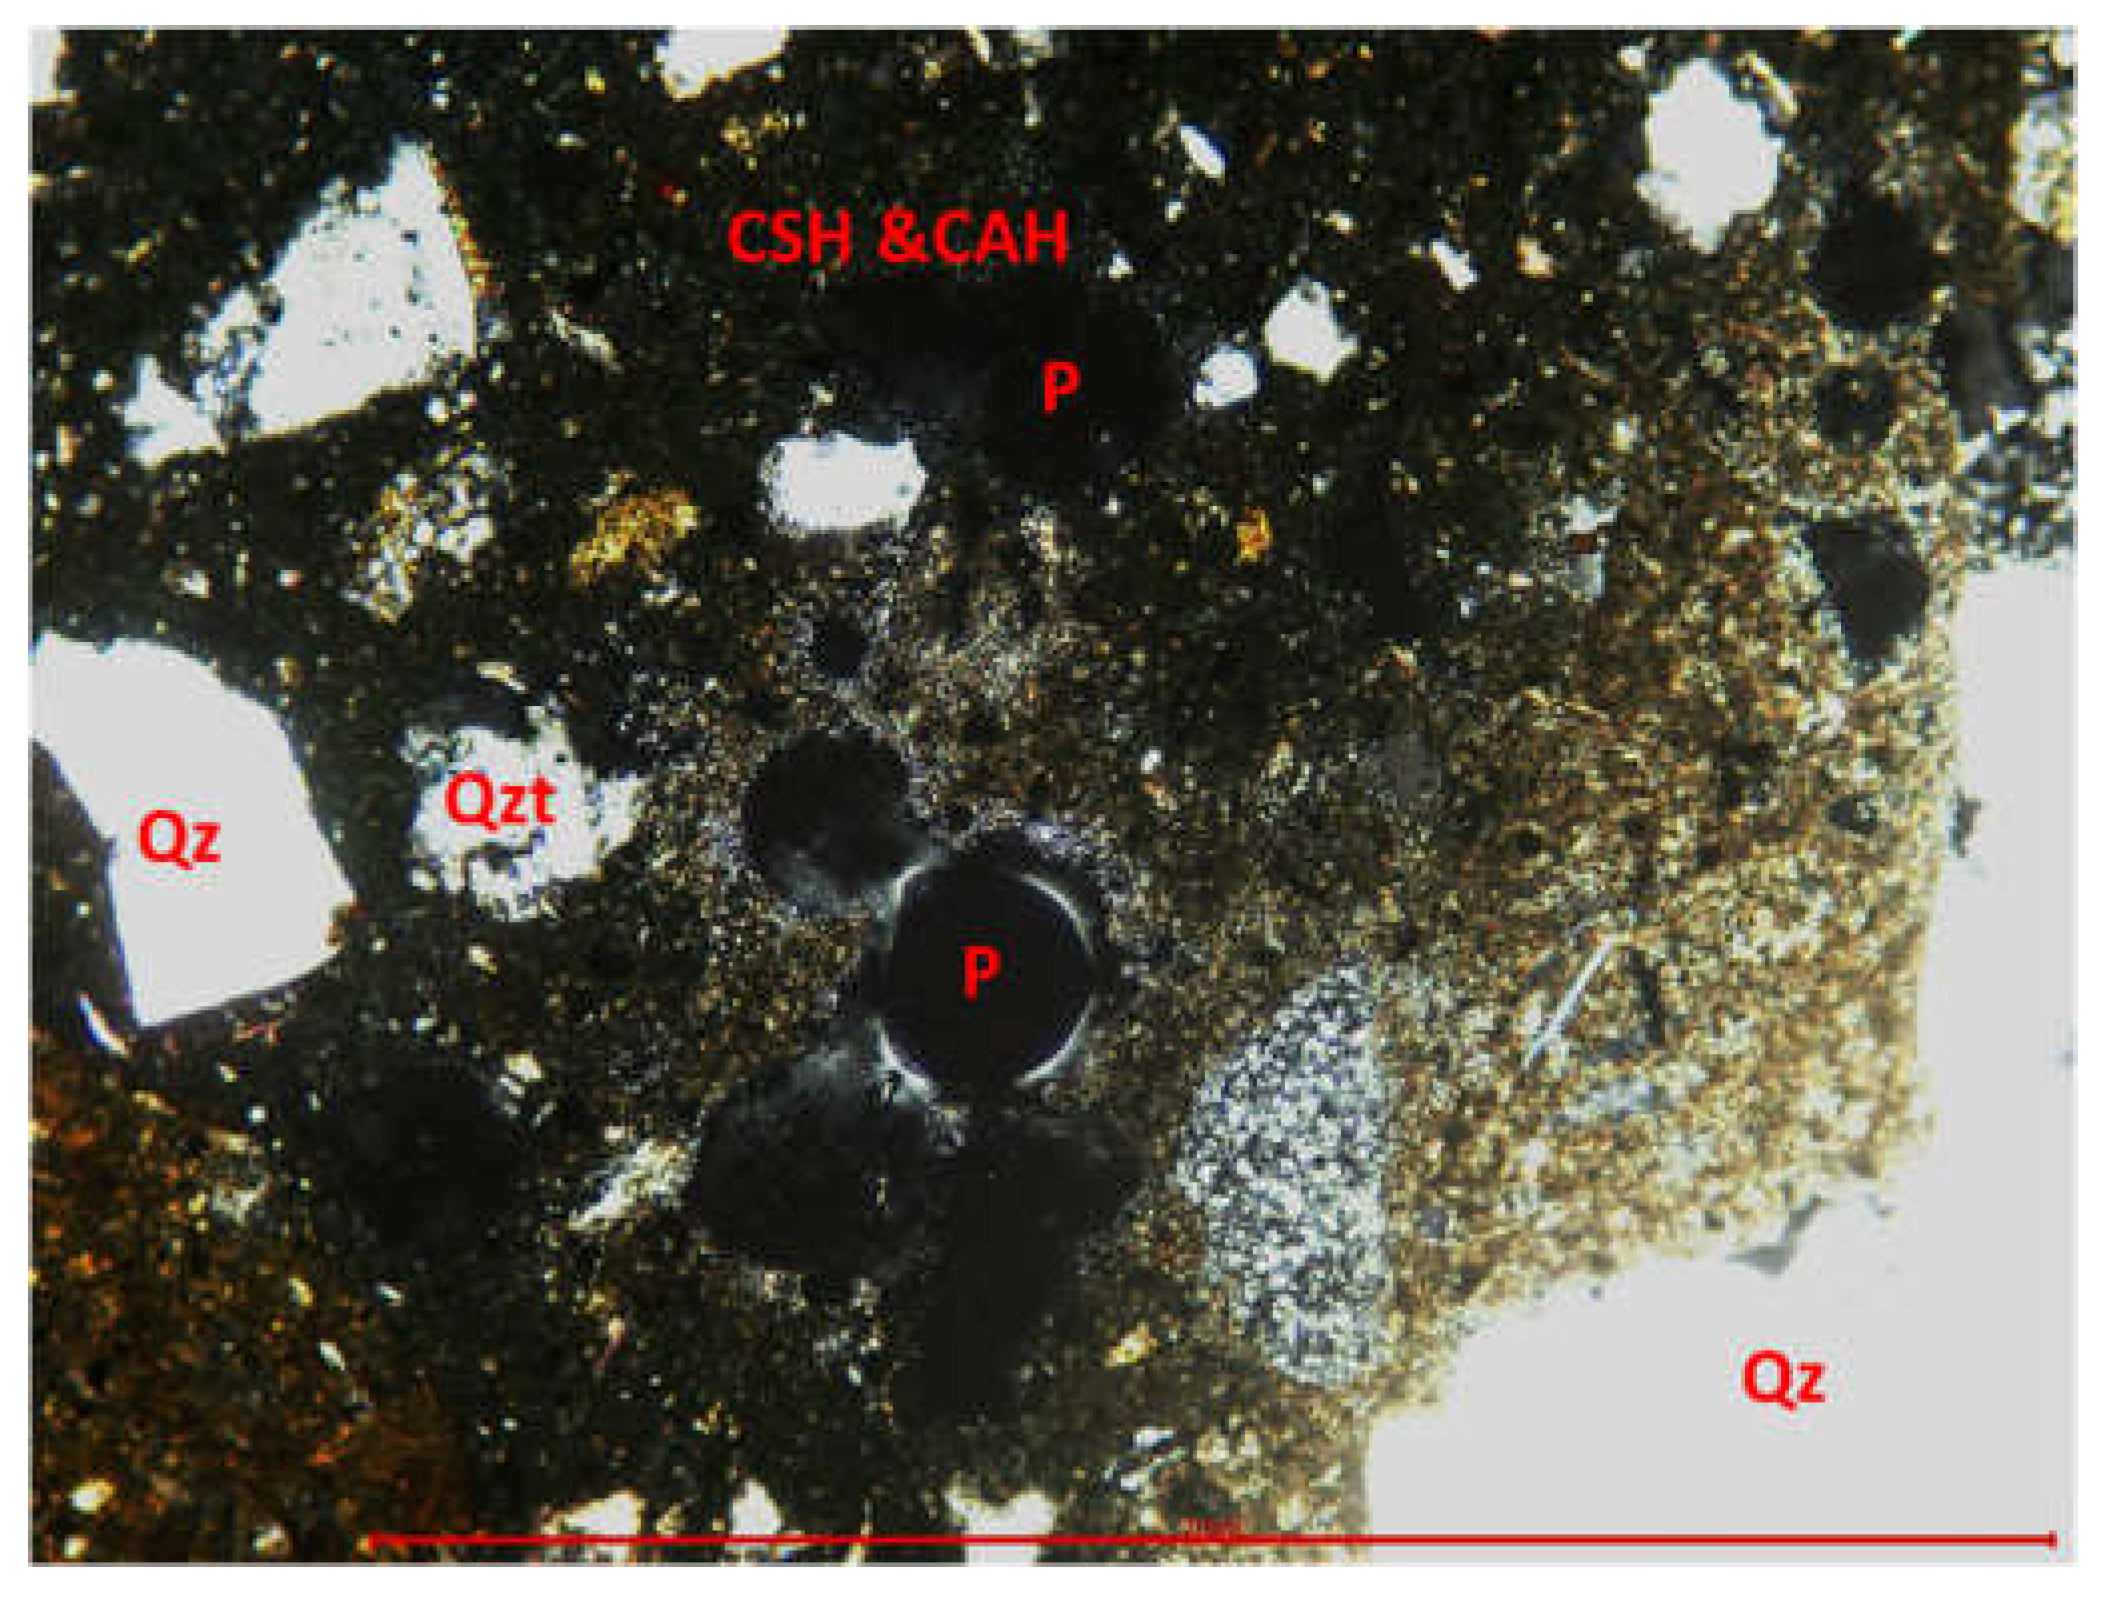
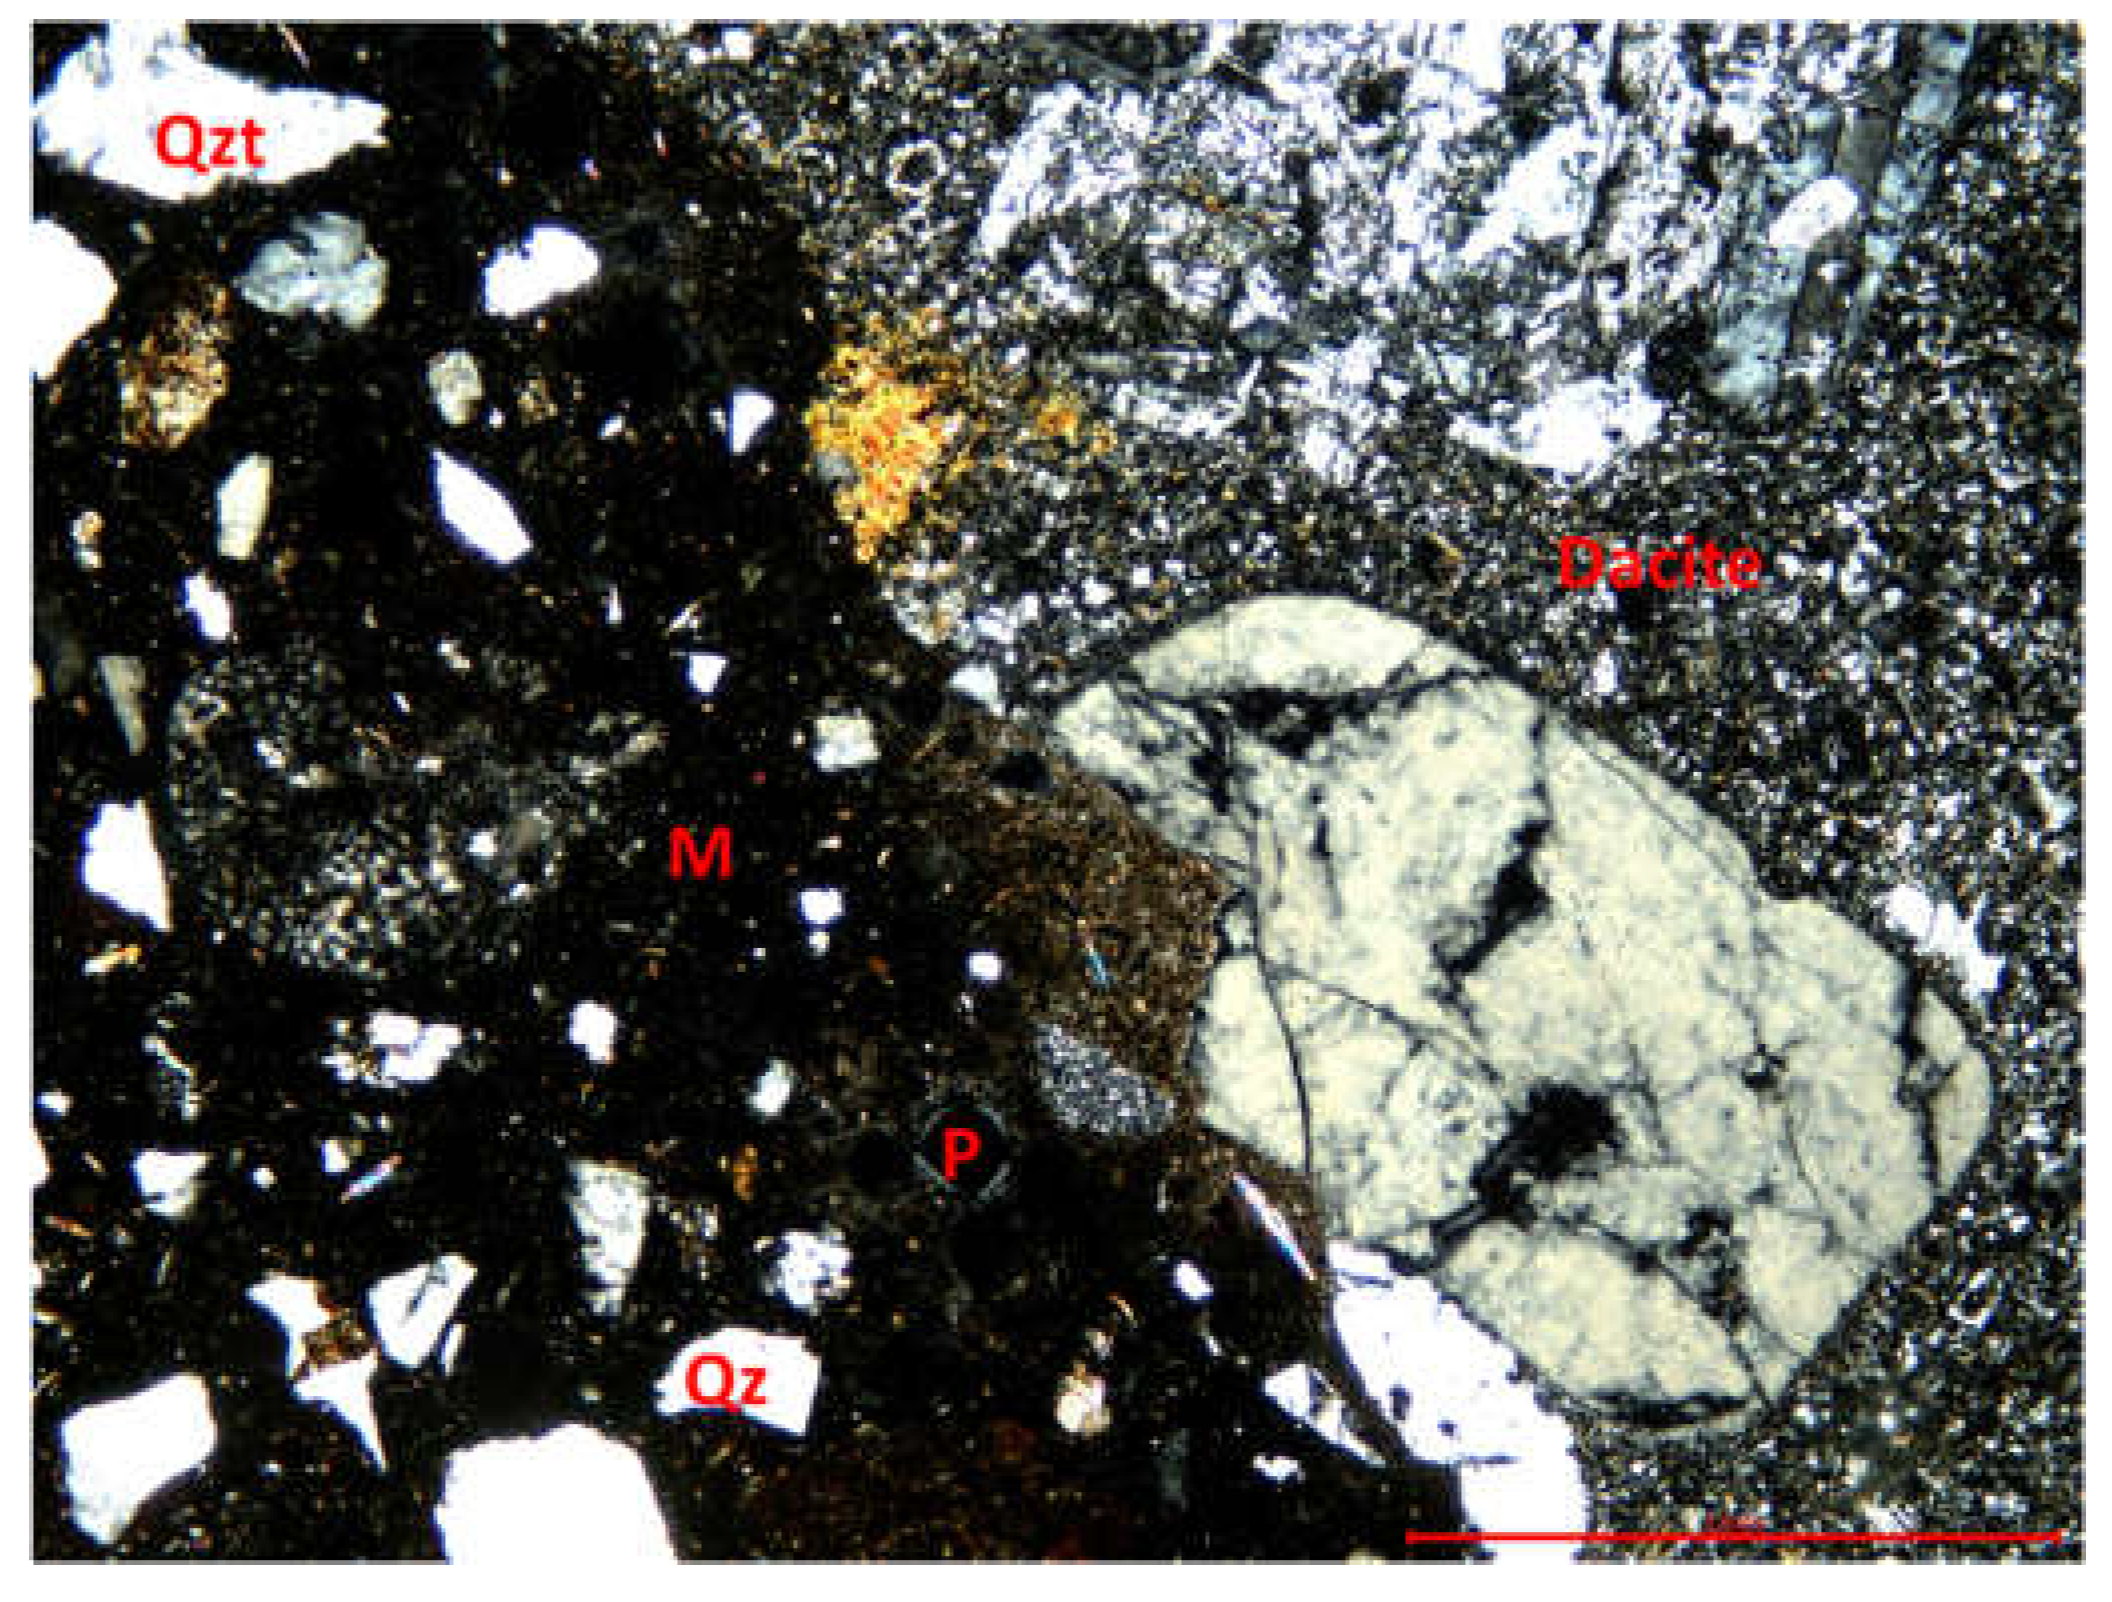
Thin section has been repared from to type of concrete: type 1 BcR-NA (sample 1) and type 2 BcR-RCA-10%WGP (sample 16) respectively. Both type of samples has porphyroclastic texture (Figure 10 and Figure 11) defined by the presence of large fragments of aggregates embedded into the microcrystalline groundmass (matrix of the concrete). In the matrix there are pores spherical in shape, having diameter up to 0.2 mm (Figure 10 and Figure 11). The aggregates consist of fragments (clasts) of minerals (crystalloclasts), rocks (lithoclasts) and concrete (concreteclasts) respectively. The crystalloclasts are originated in the river sand or are resulted from the mechanical crushing of the rock (aggregates) extracted from the quarry.
Compositional features of sample BcR-NA.
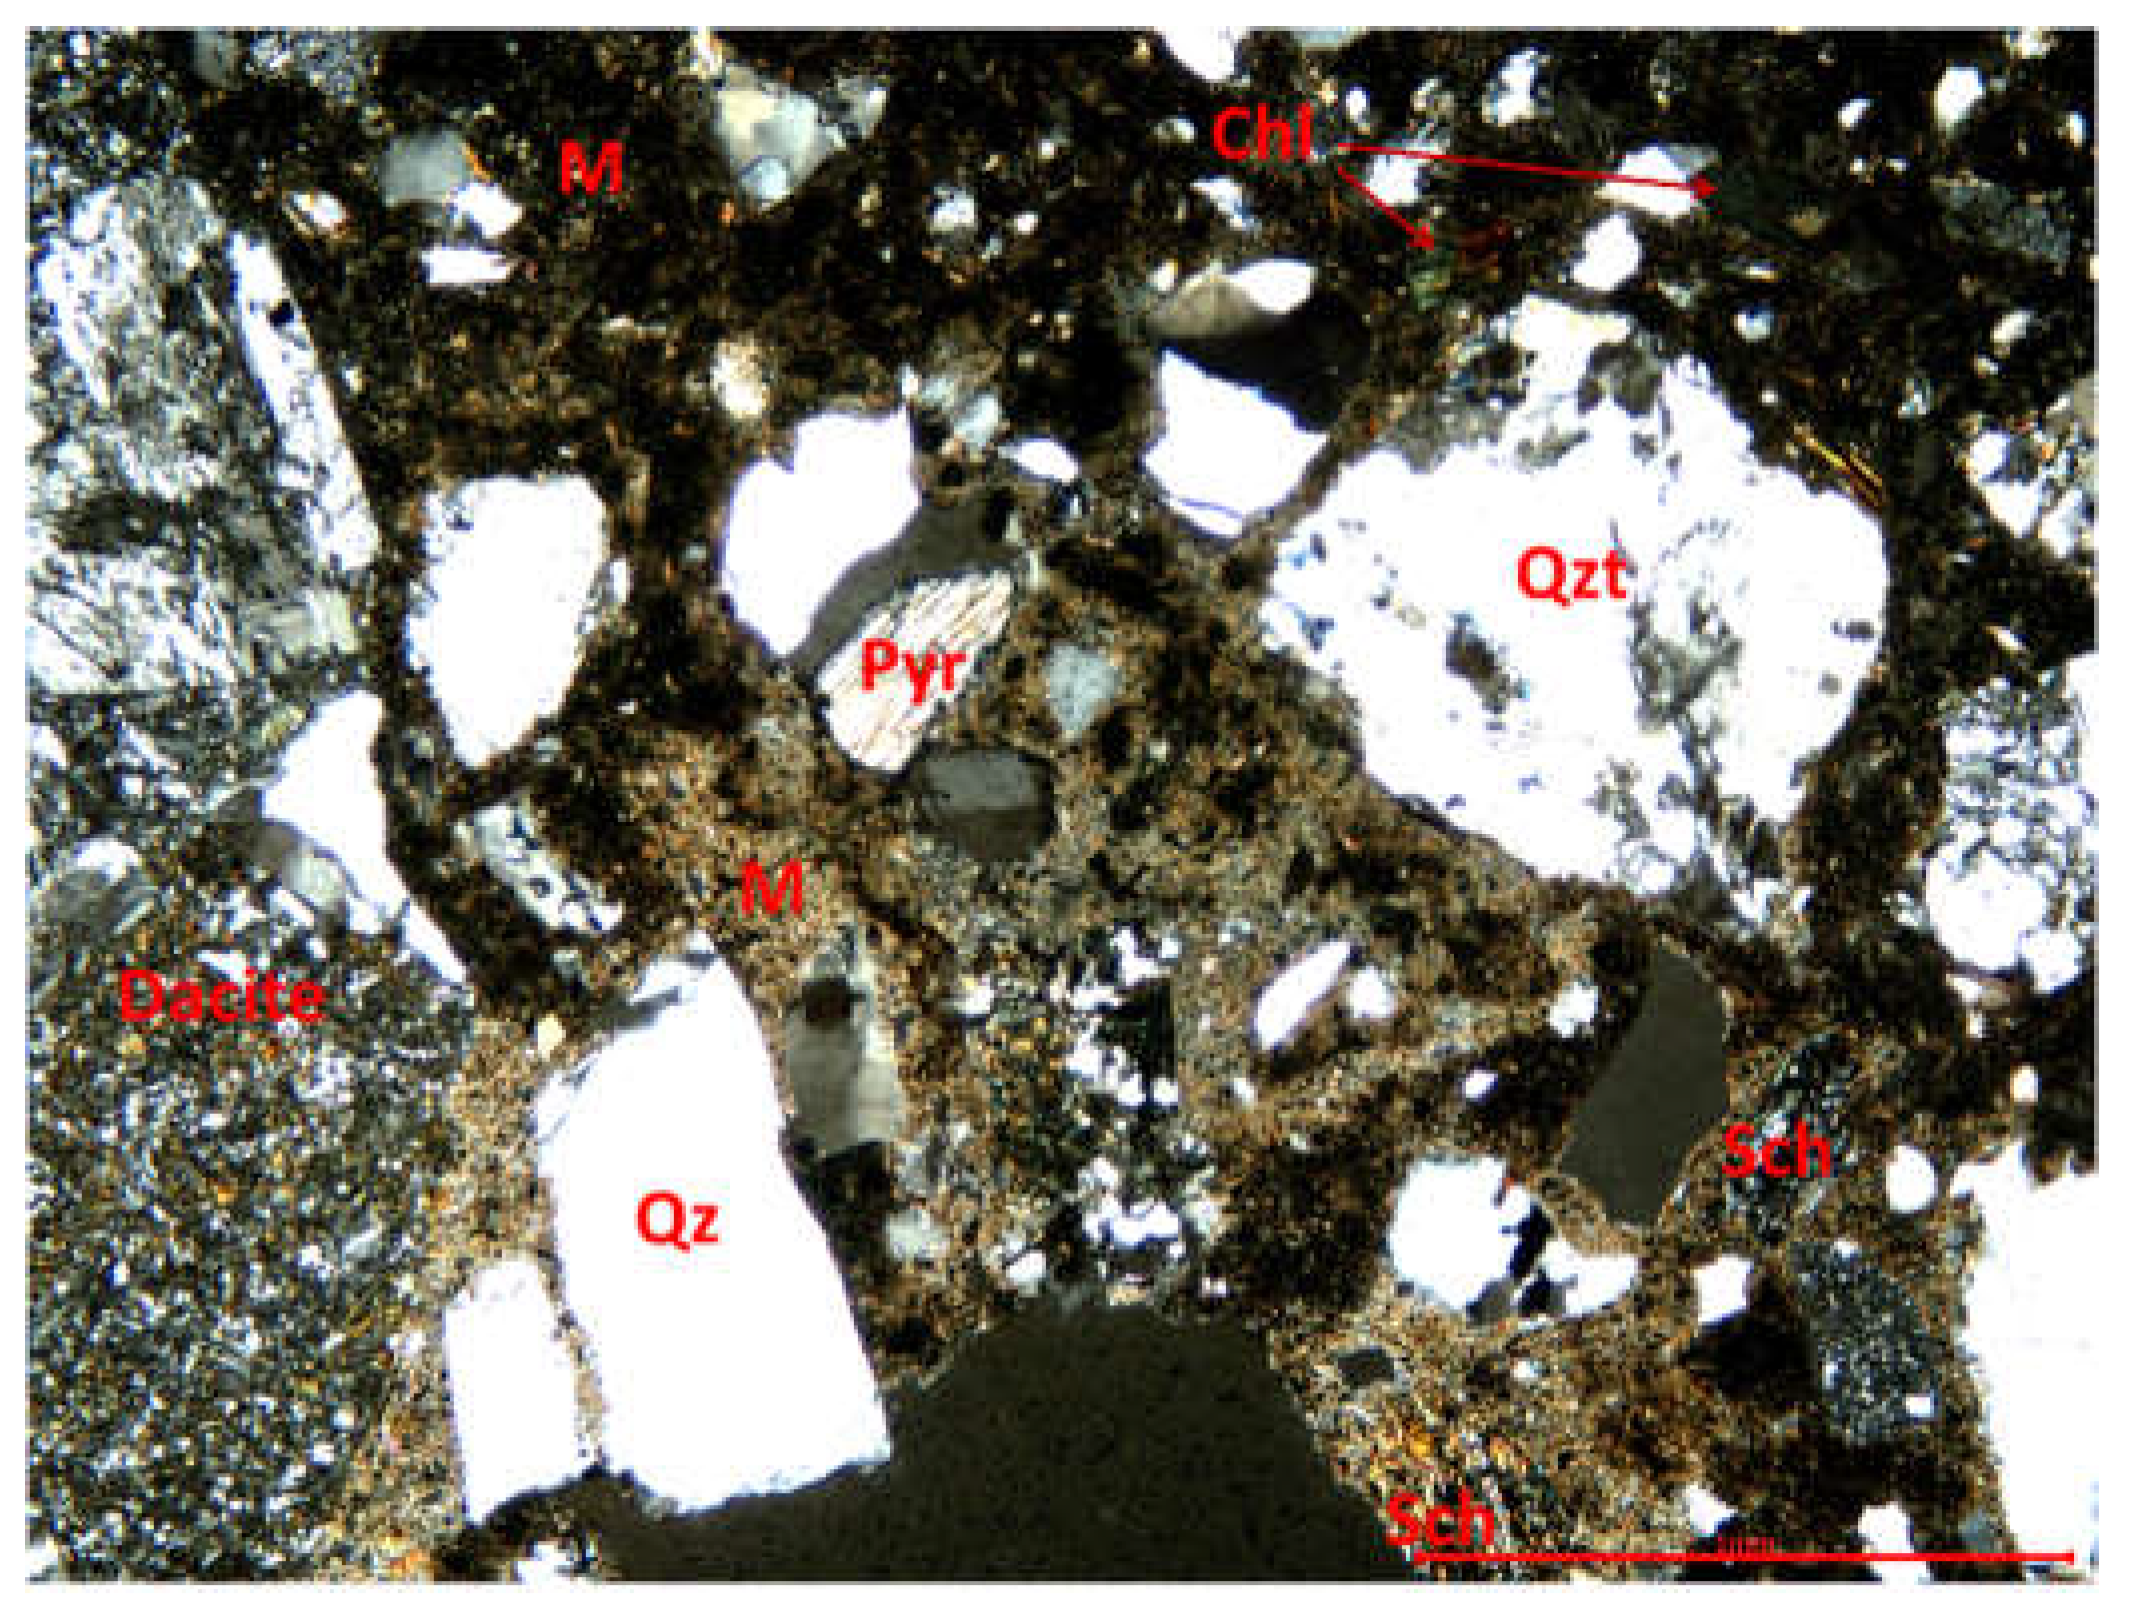
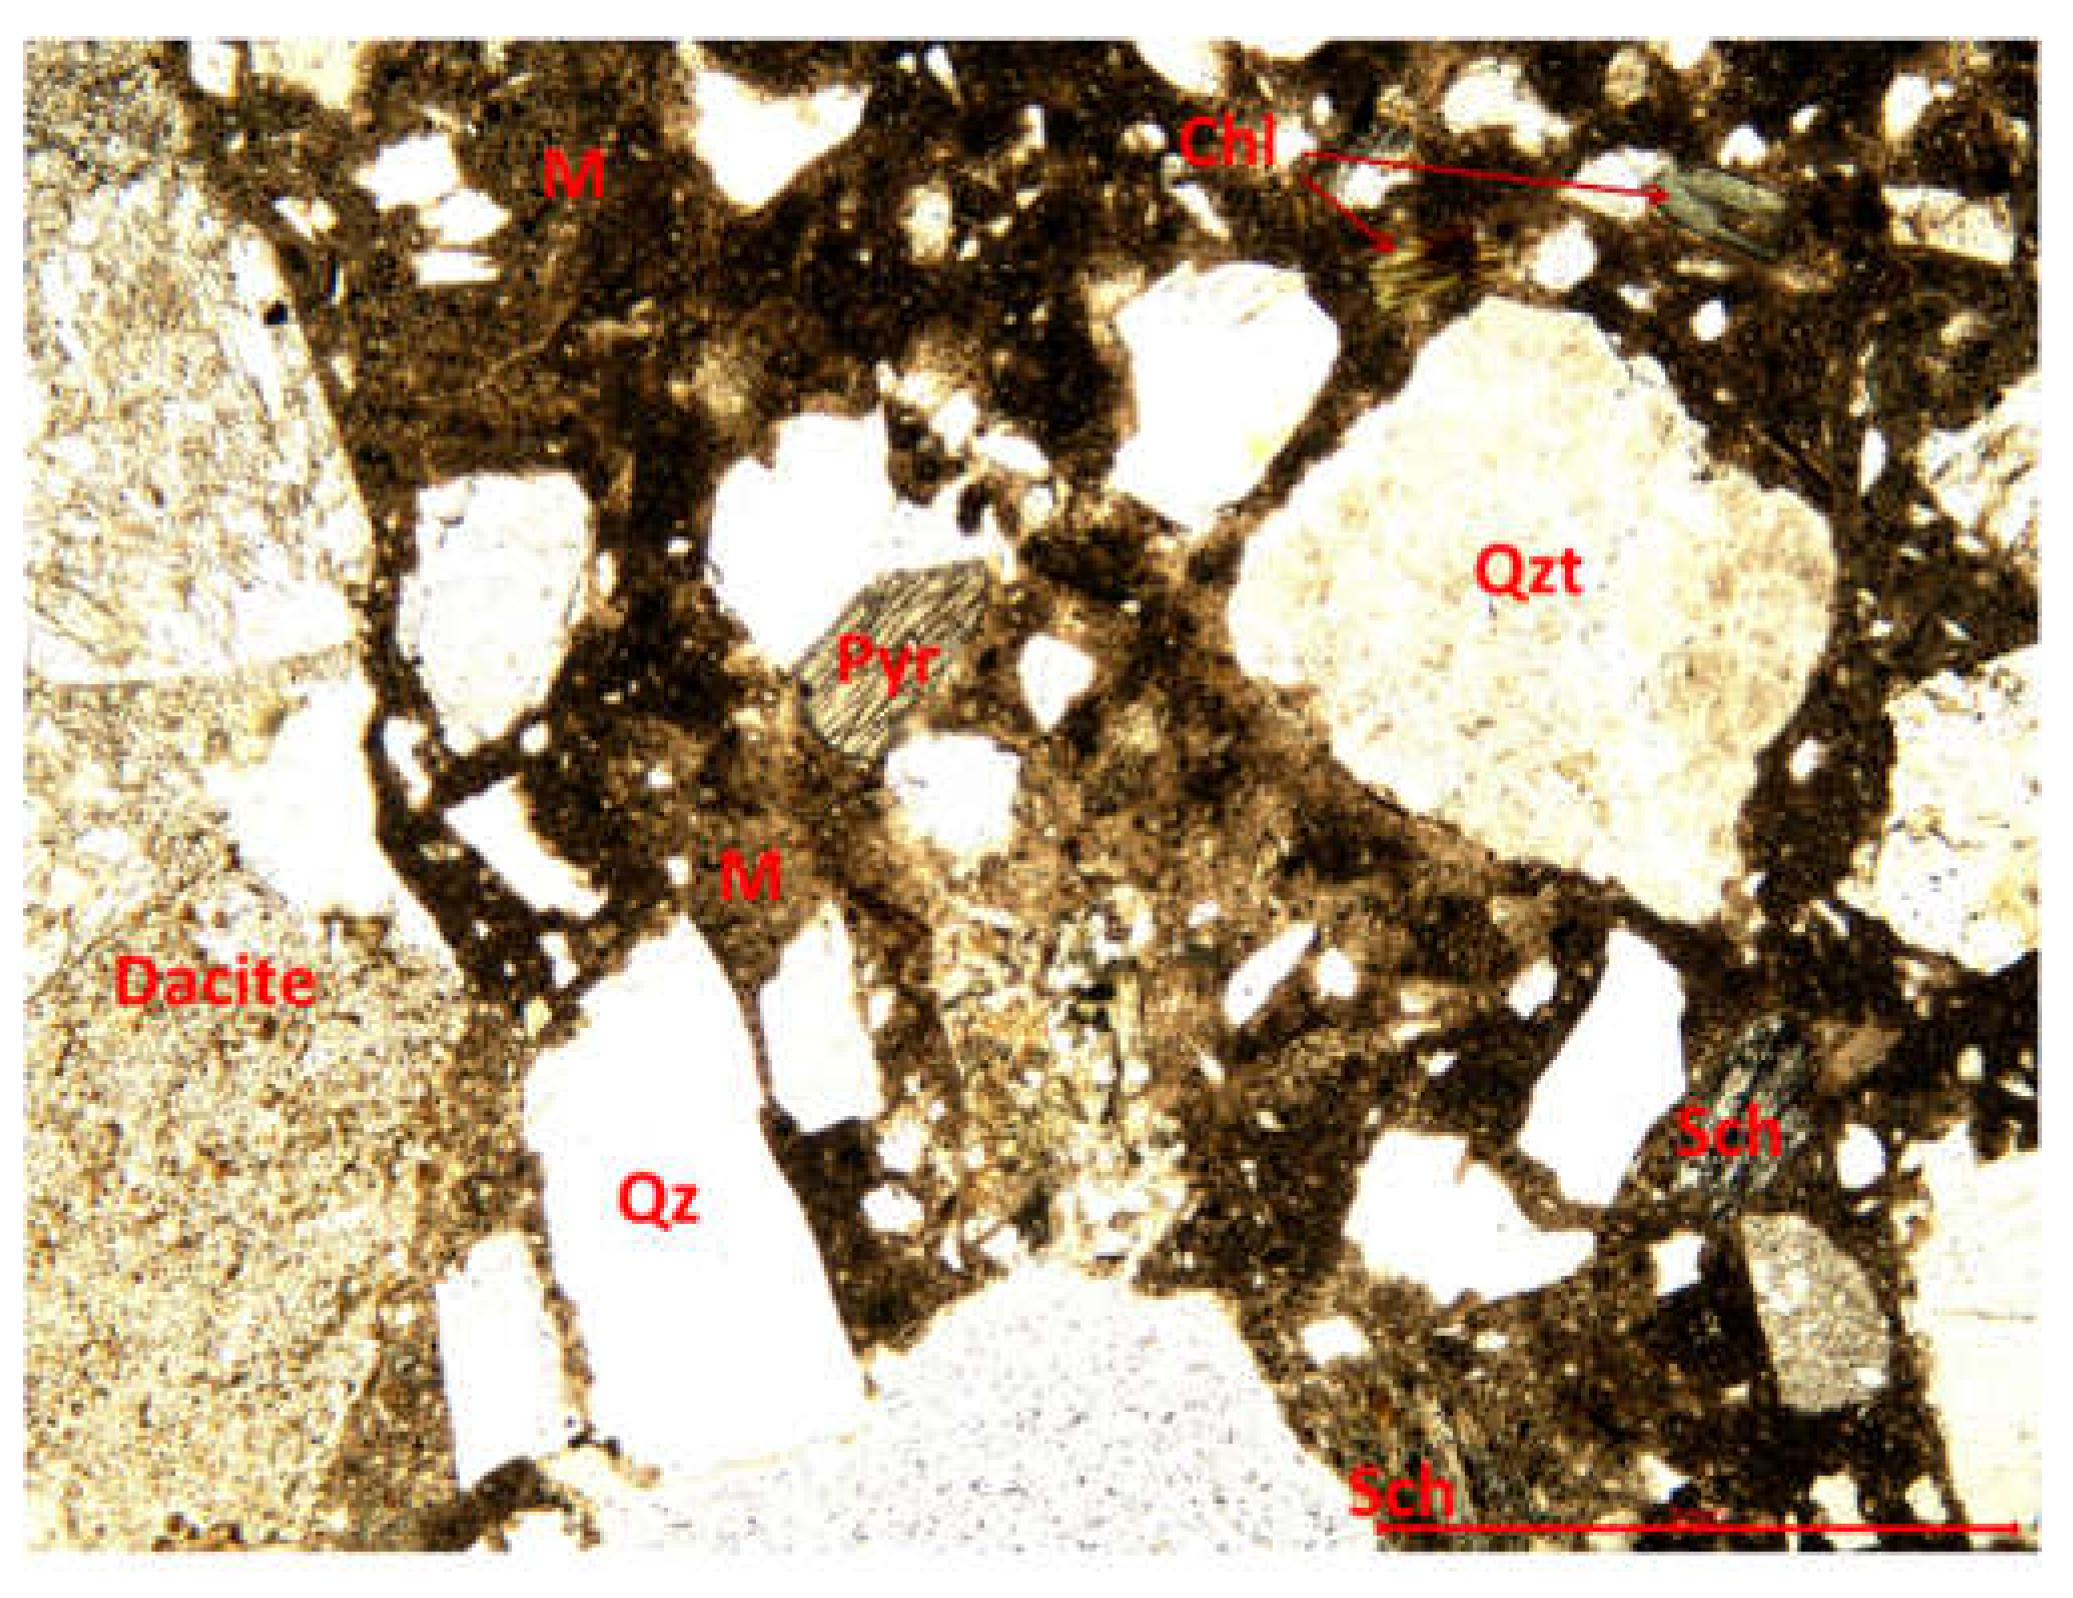
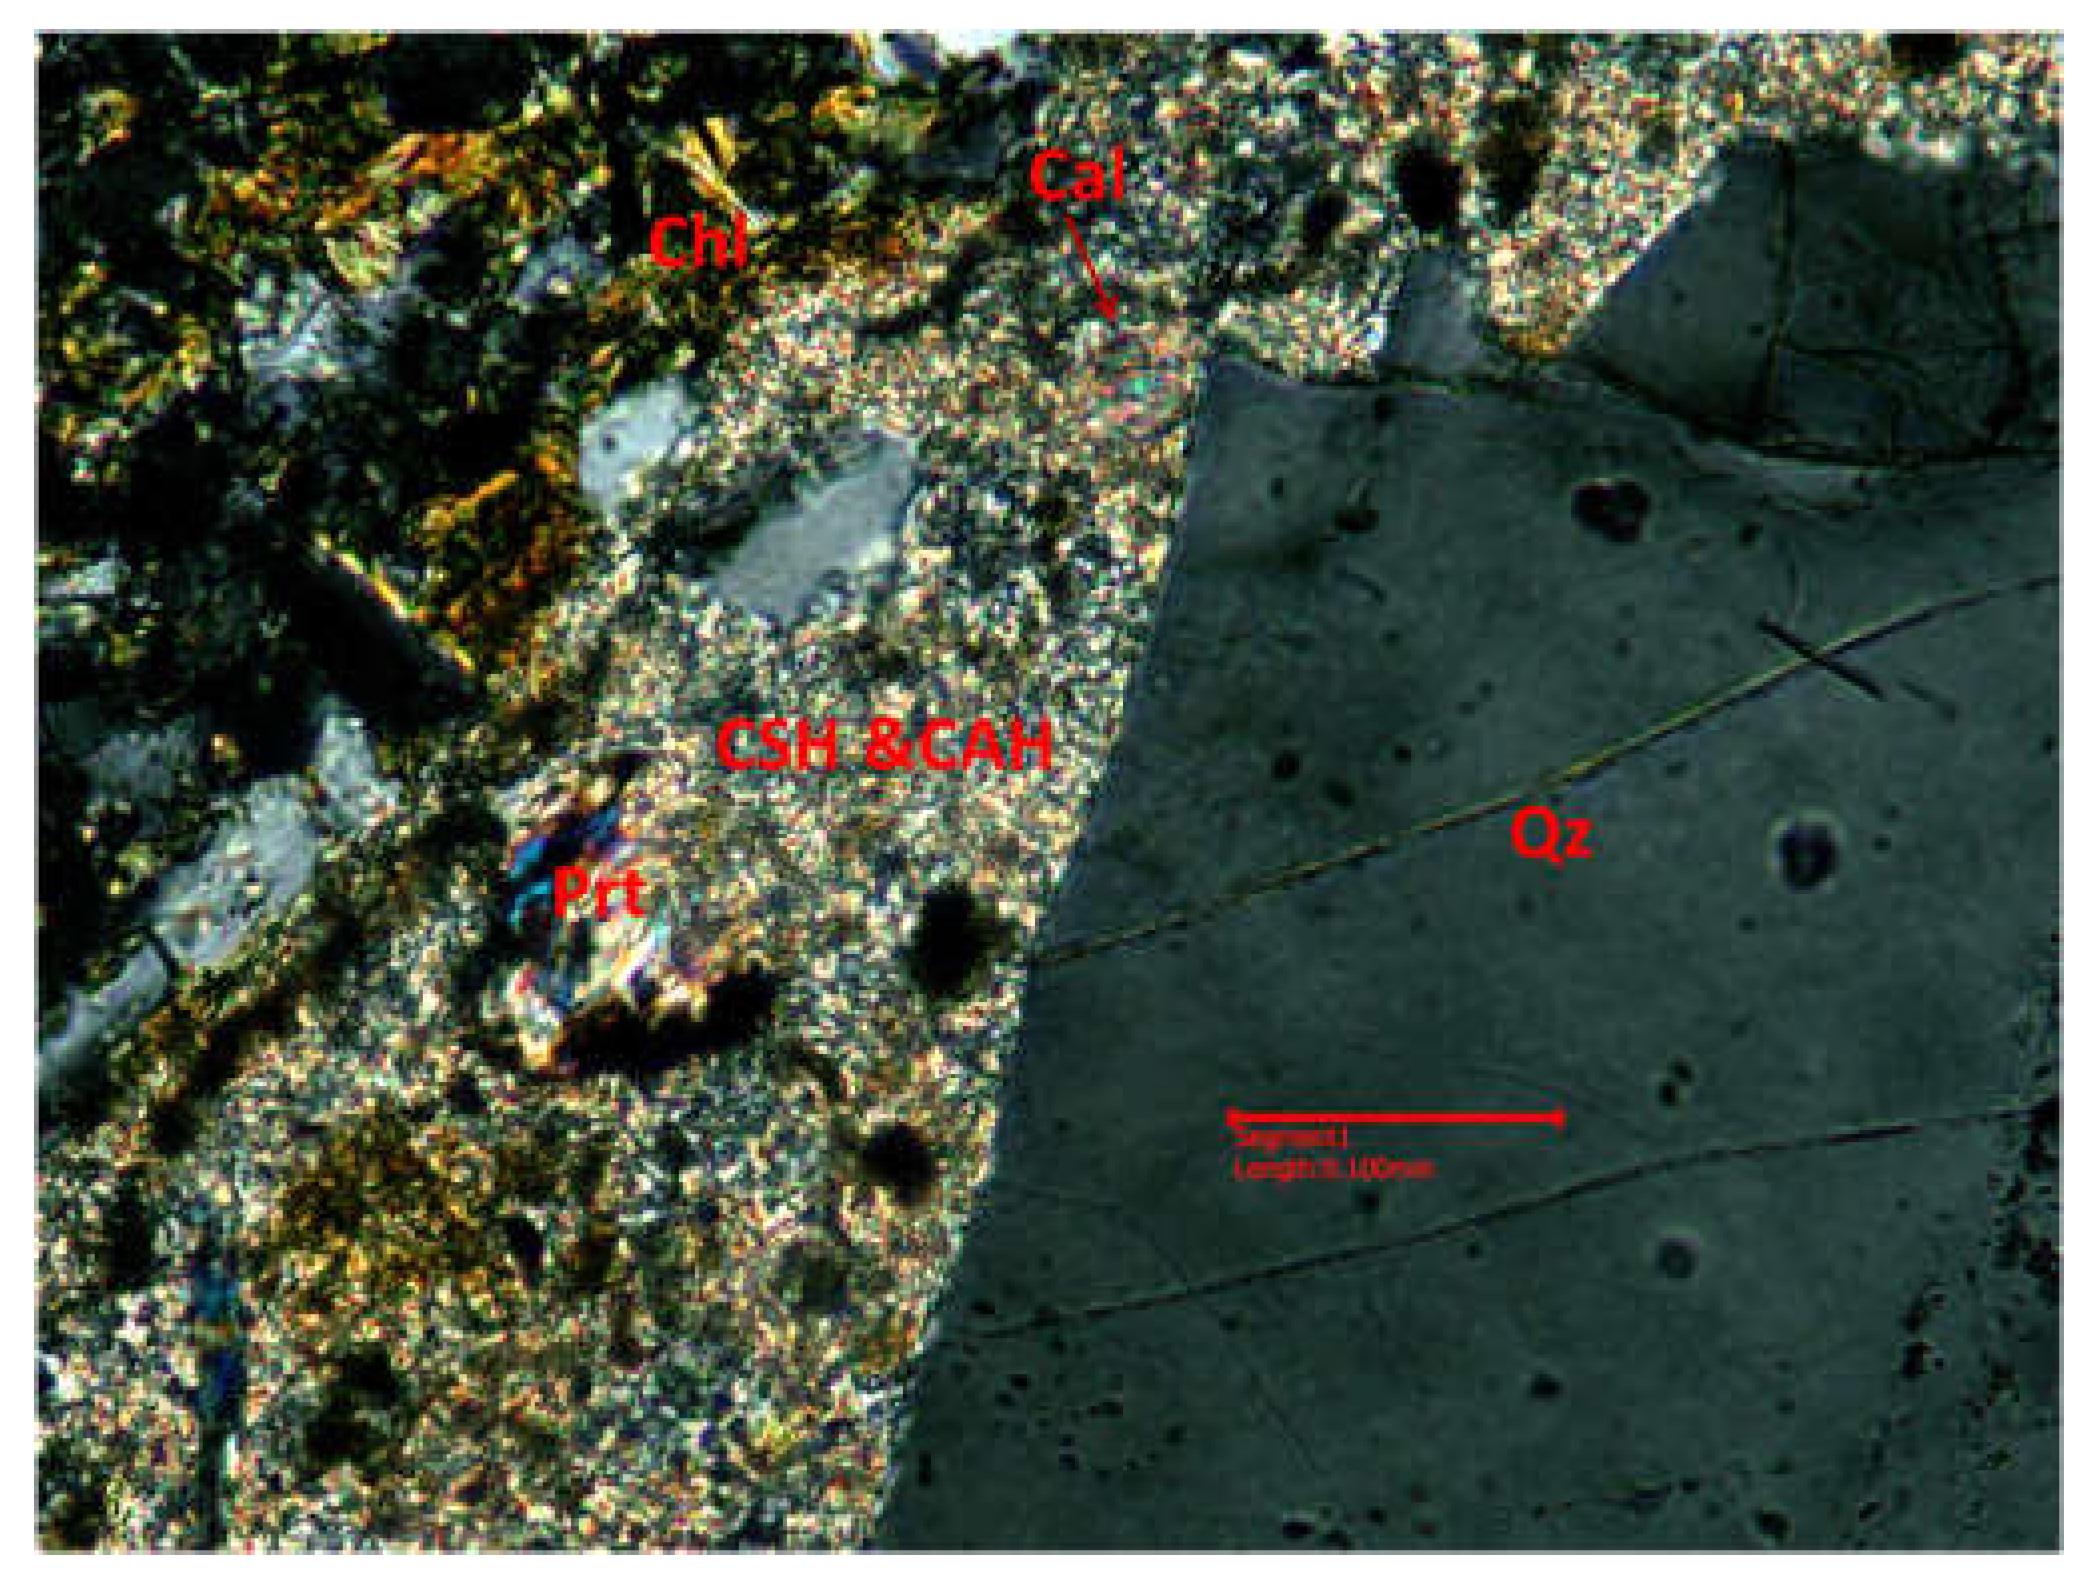
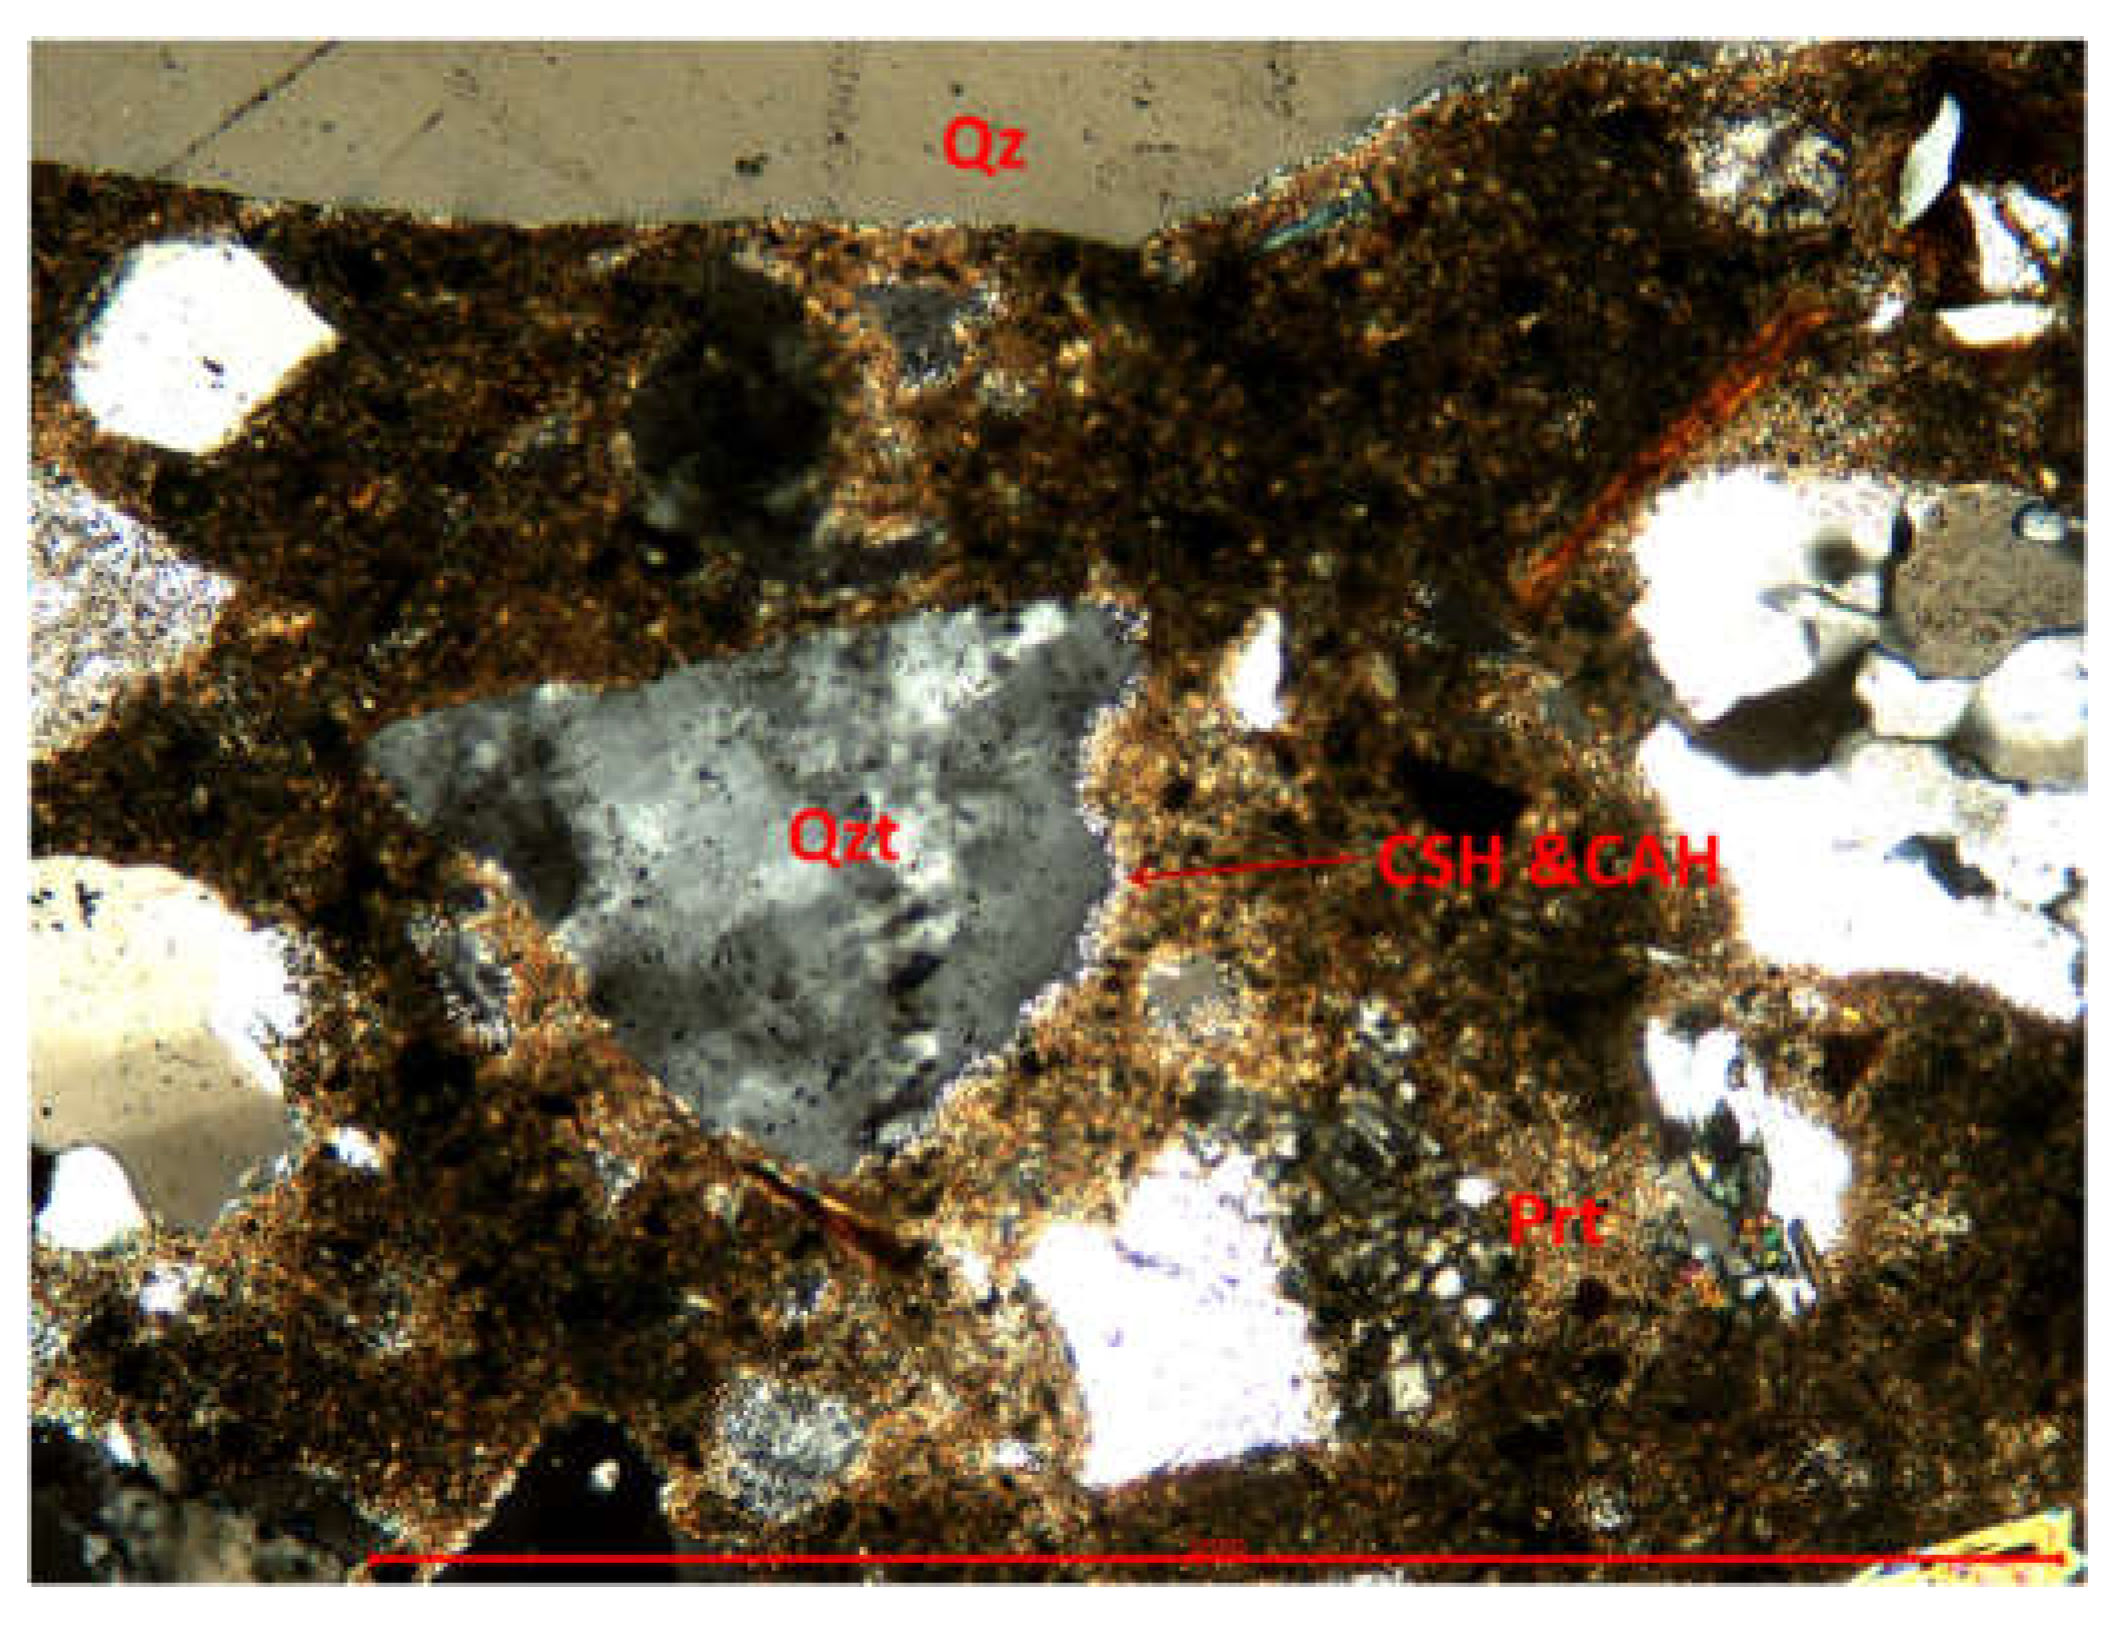
The aggregates consist of fragments of minerals and rocks (Figure 12 and Figure 13). The minerals identified into the sample BcR-NA are represented by quartz, muscovite, biotite (sometime chloritized), pyroxene, plagioclase feldspars etc. The fragments of rocks are represented mainly by dacite and subordinated by quartzite and crystalline schists. The matrix is very fine crystallized (Figure 14) and consist of hydrated calcium and aluminium silicates, calcite and portlandite. The local brawn color of the matrix indicates the presence of iron hydroxides formed on the brownmillerite from the cement. Frequently the newly formed minerals resulted from hydration processes are developed as a rim surrounding the aggregate fragments (Figure 15).
Compositional features of sample BcR-RCA-10%WGP.
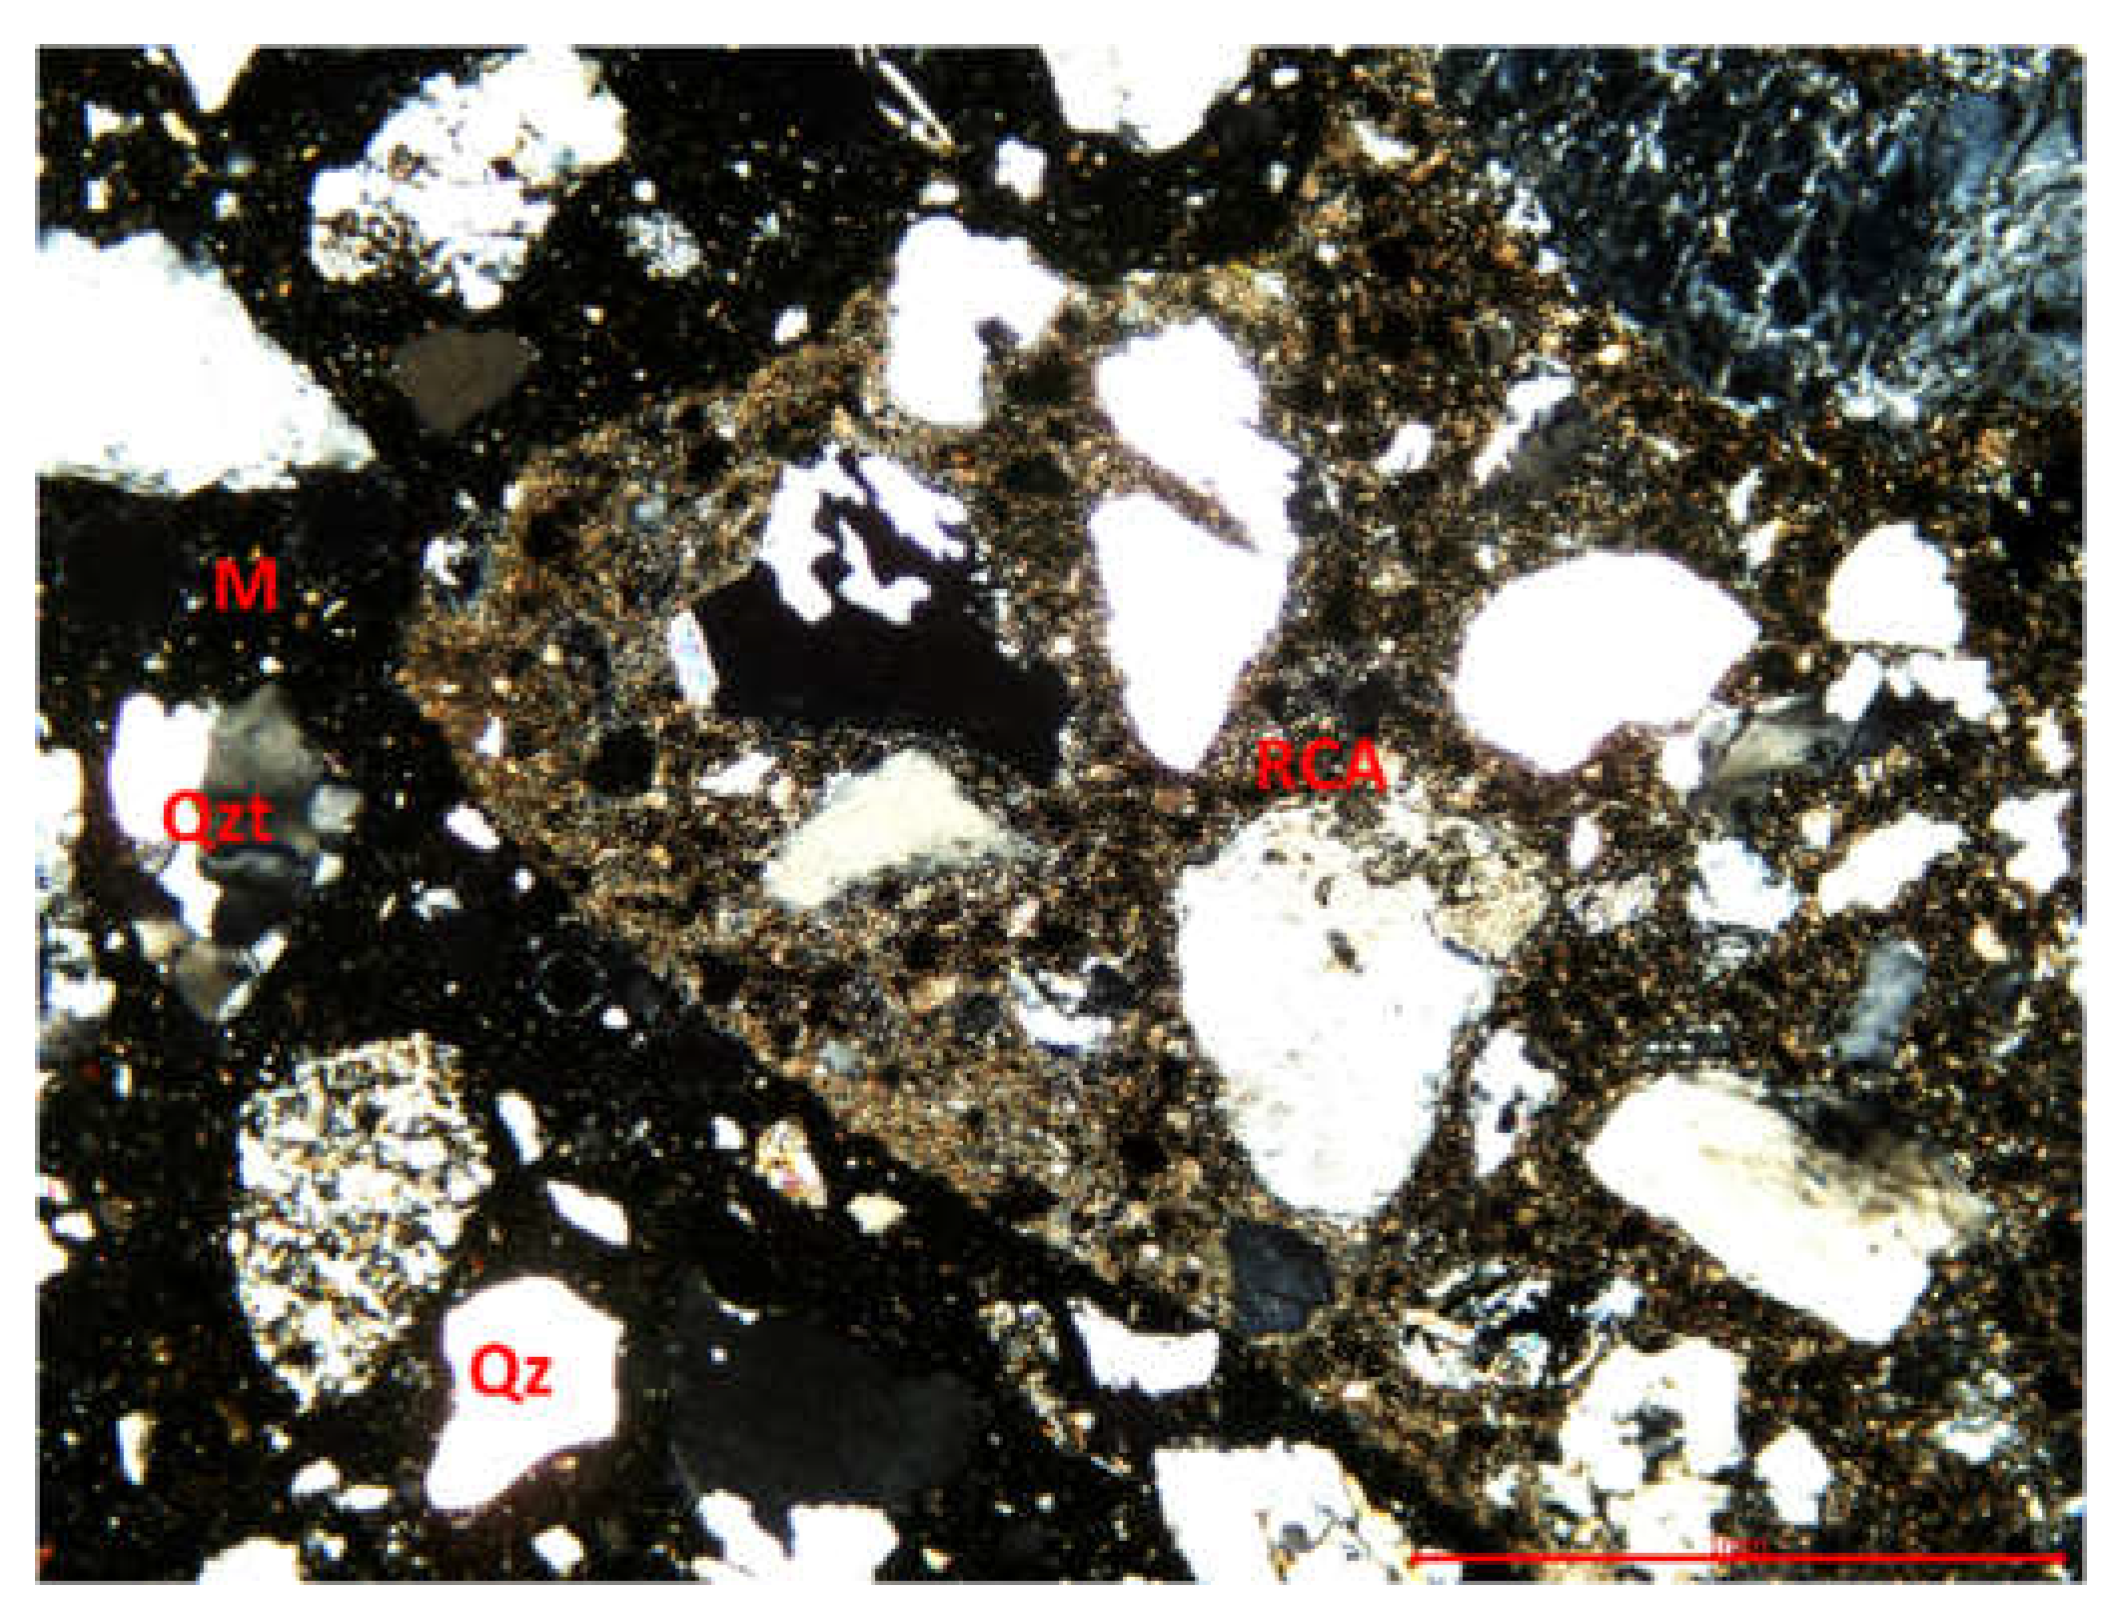
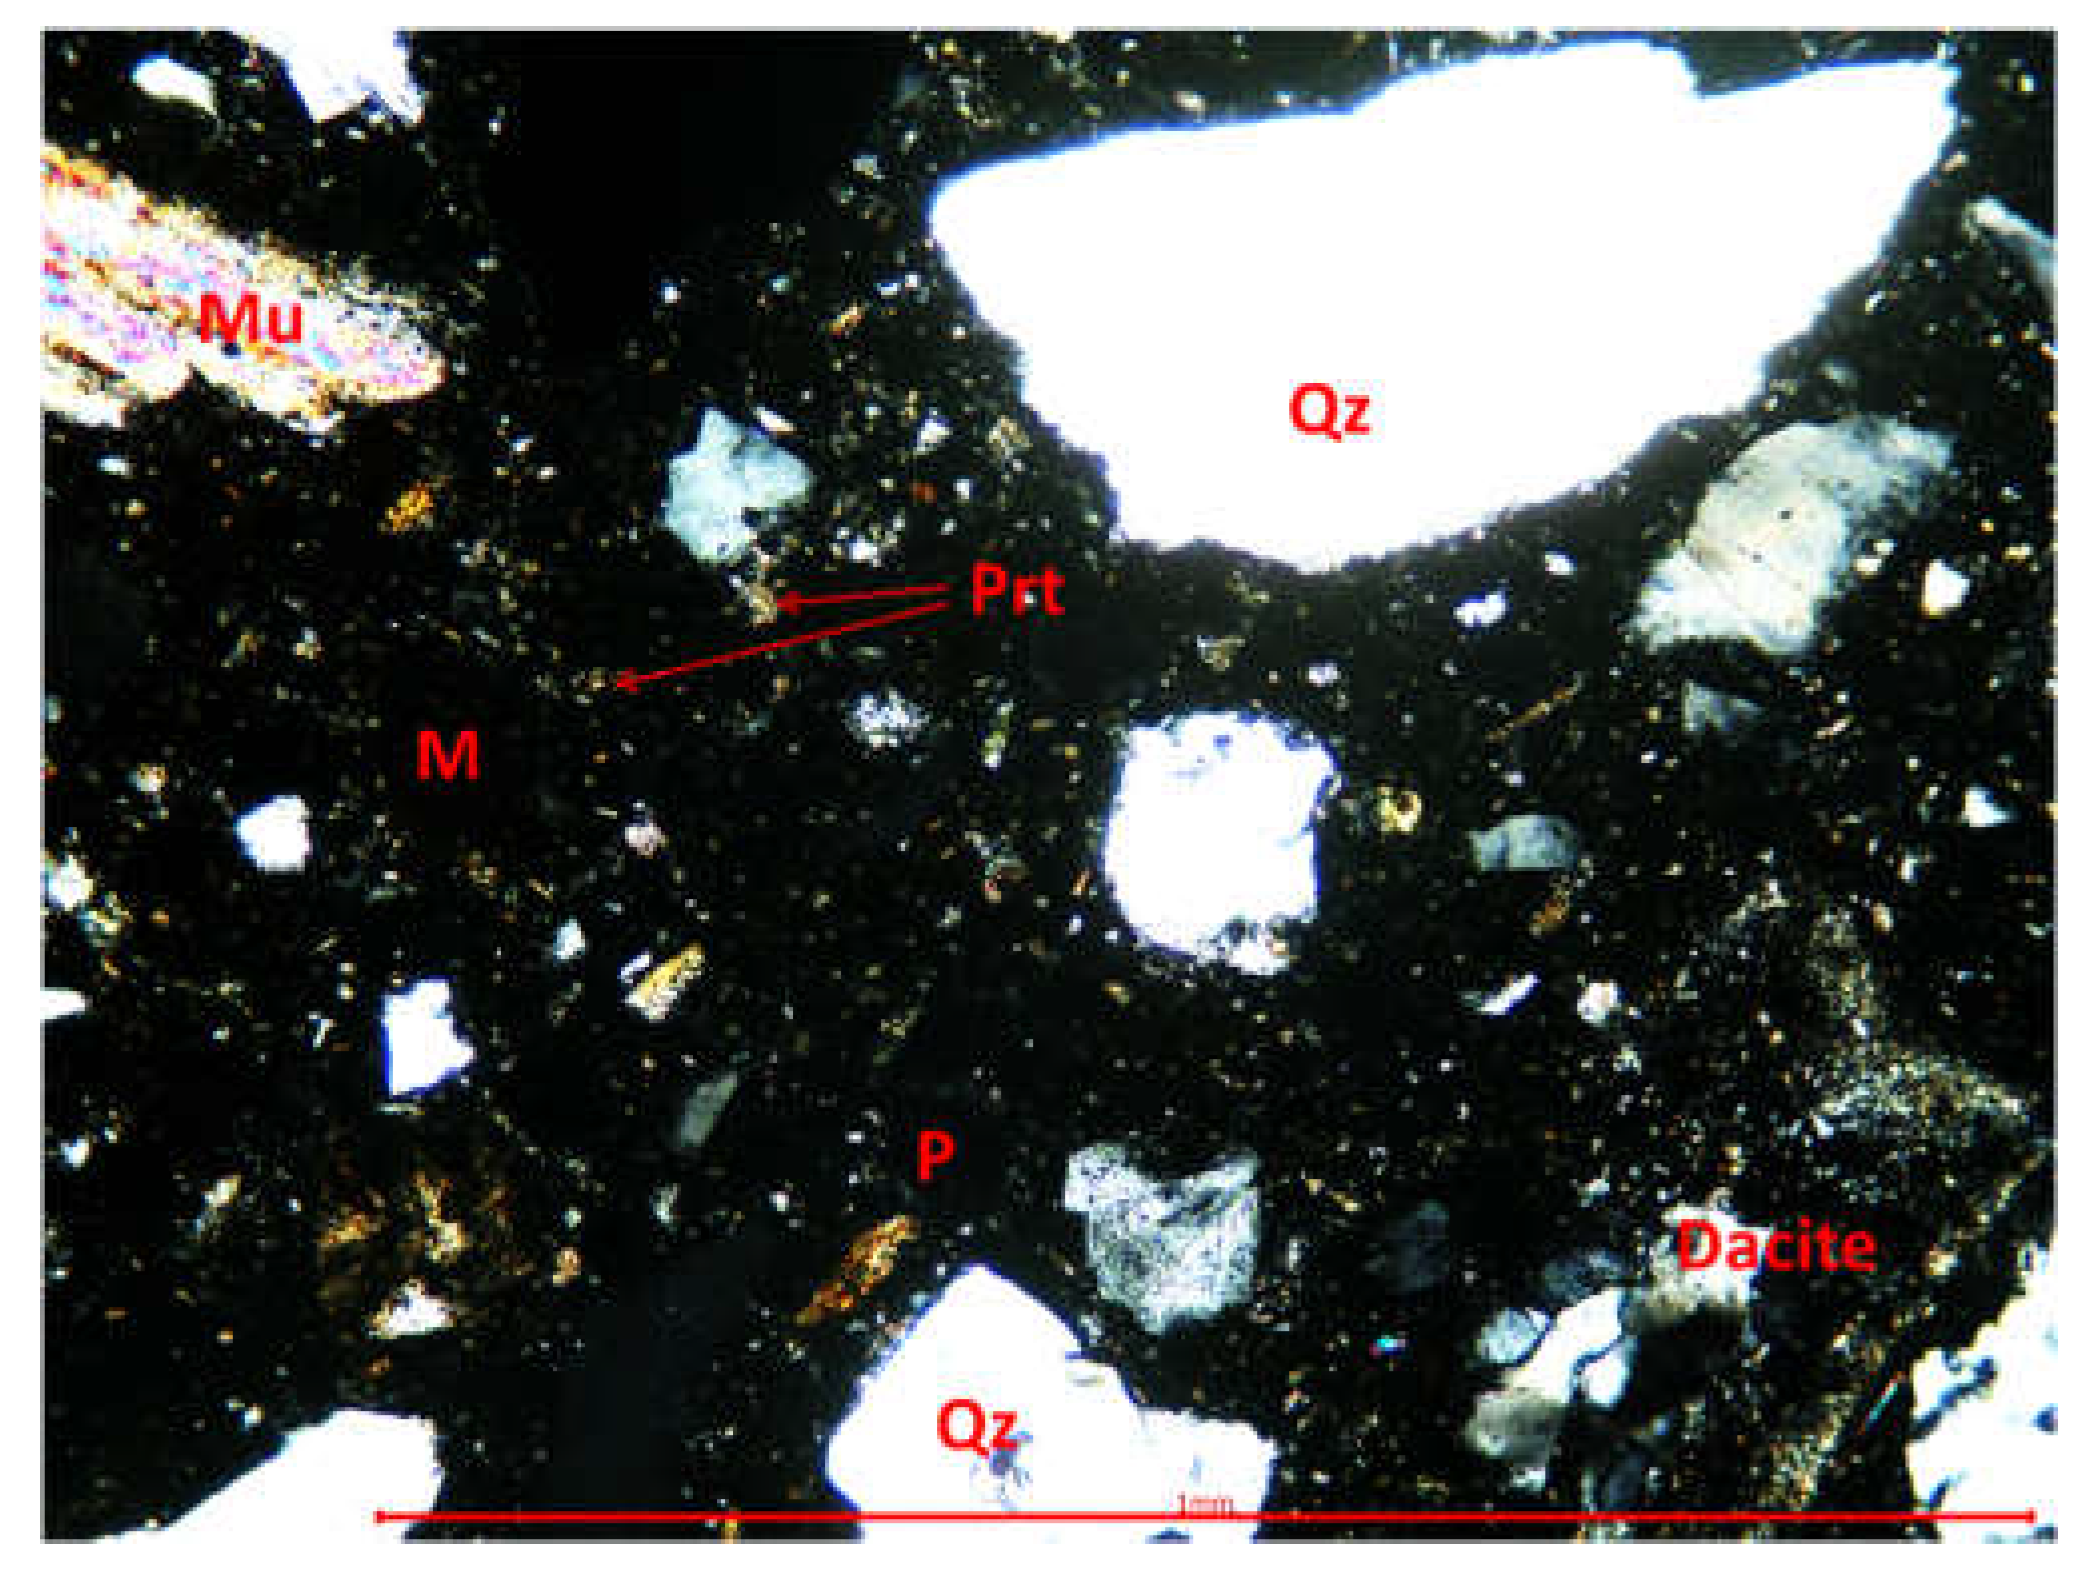
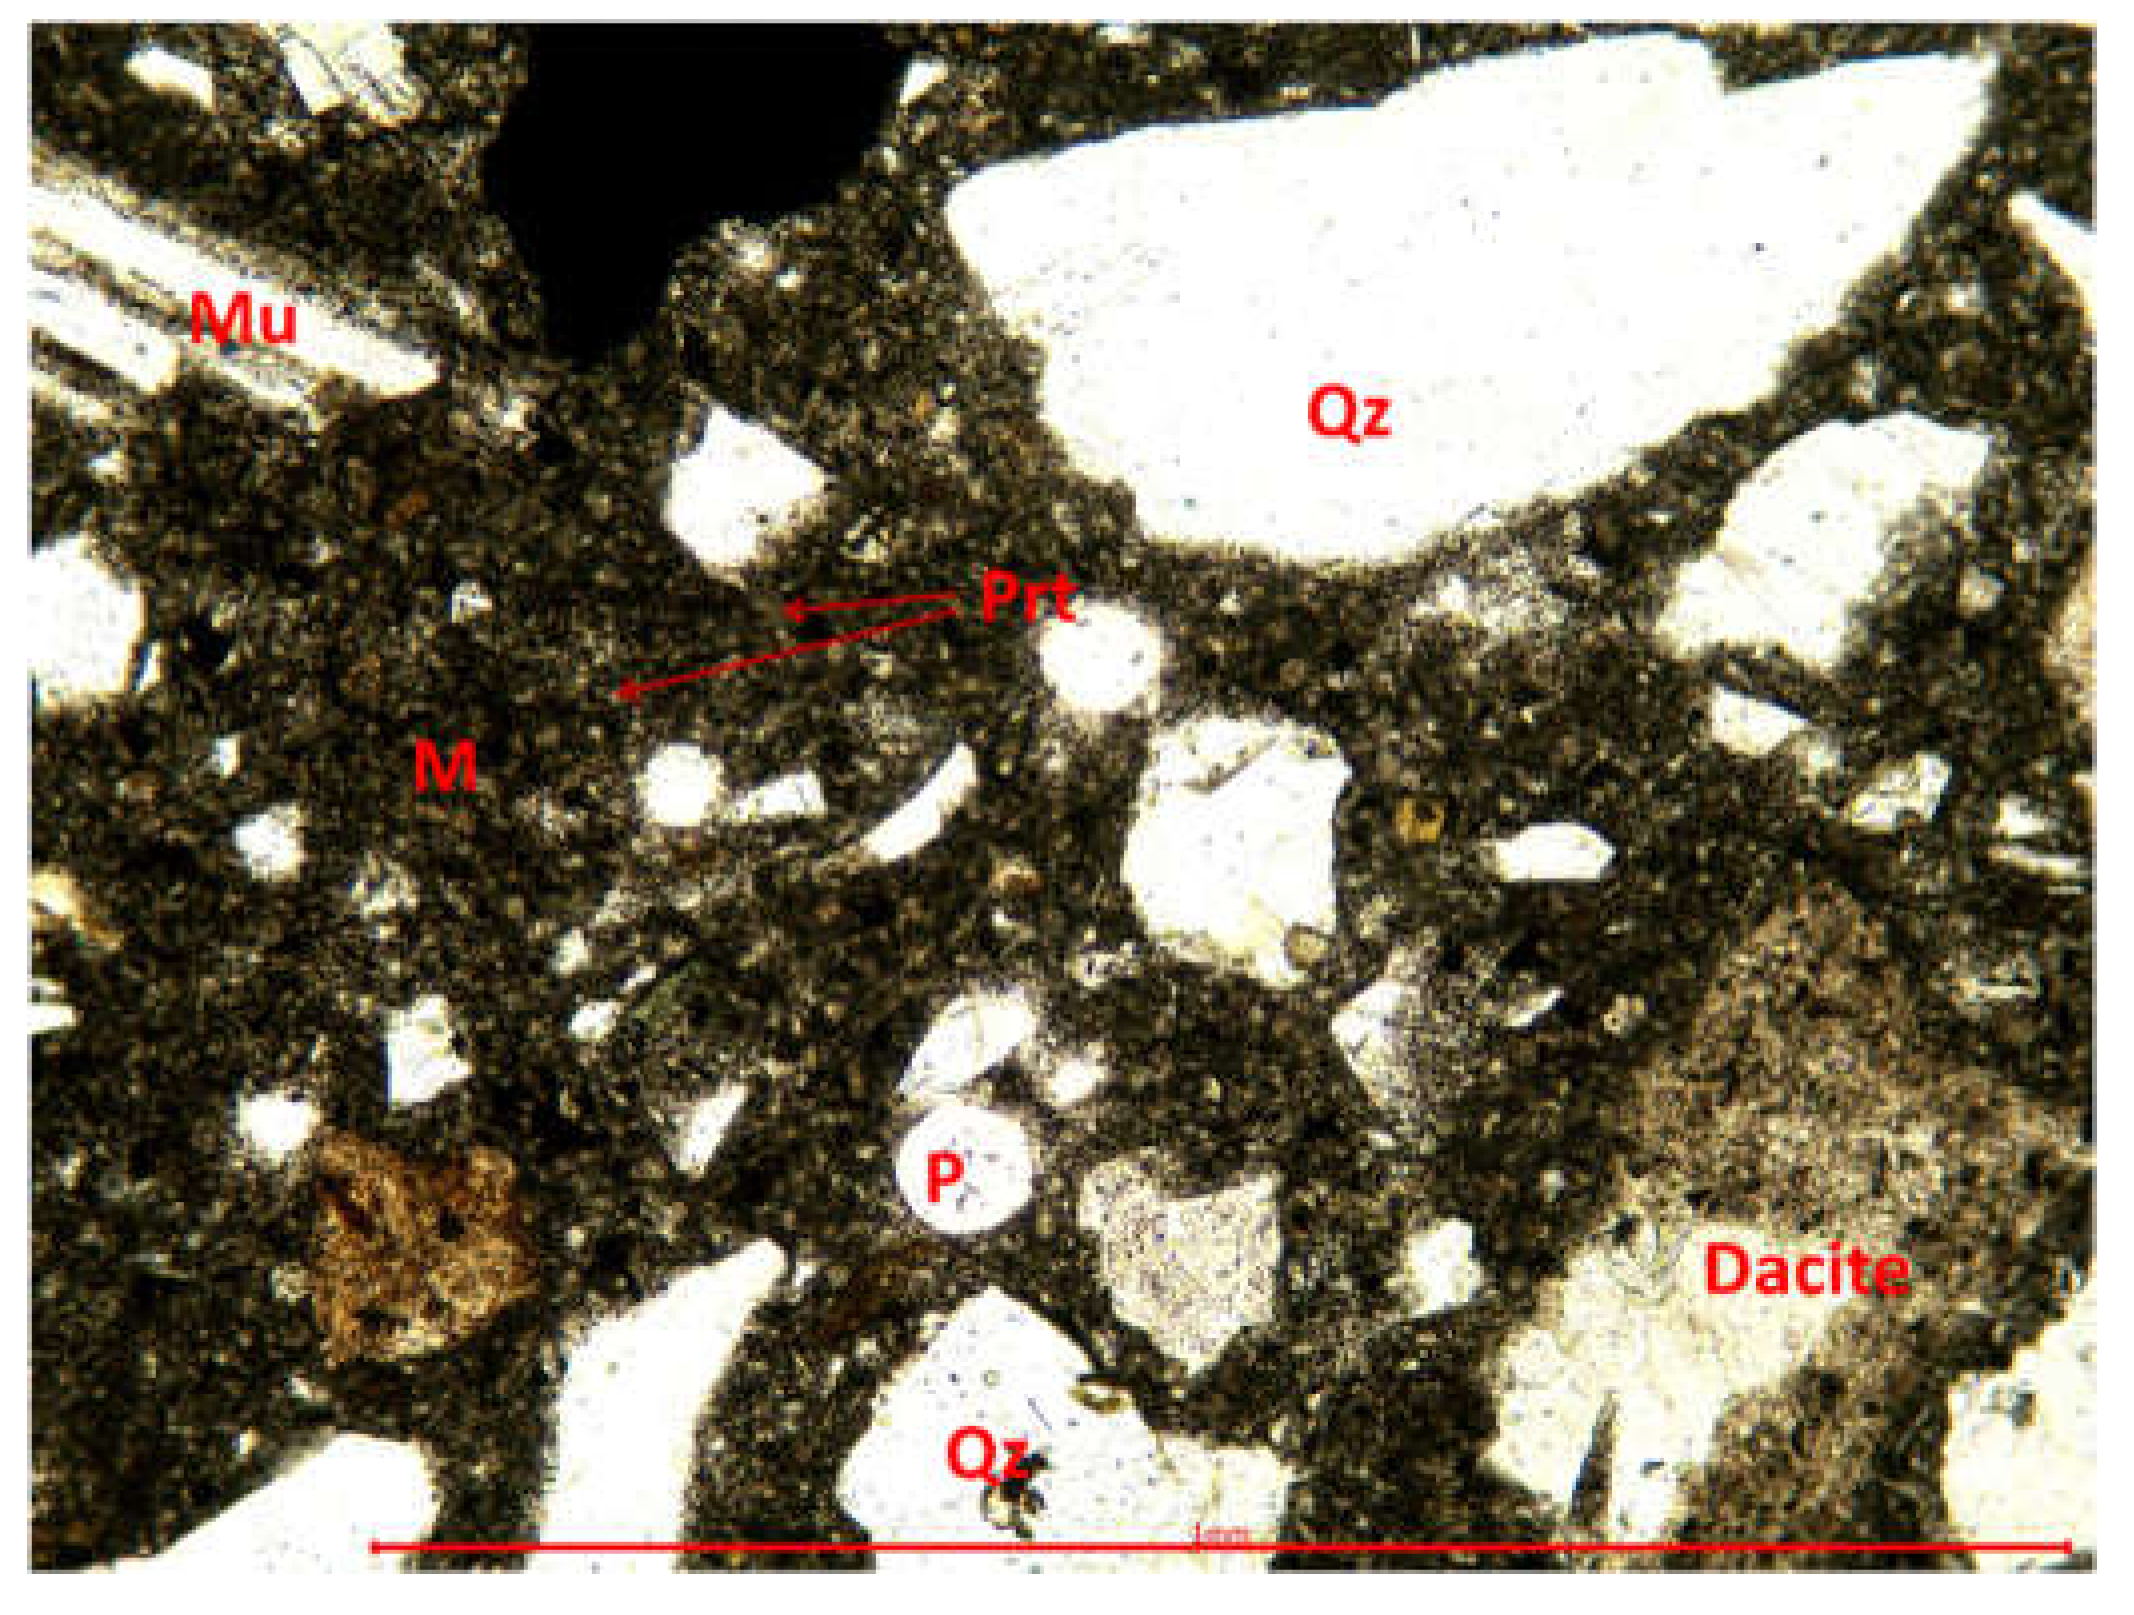
The aggregates of the sample BcR-RCA-10%WGP consist of fragments of minerals, rocks (Figure 16) and recycled concrete (Figure 17). The fragments of minerals consist of quartz, muscovite (Figure 18 and Figure 19), pyroxene, and feldspars and are originated in the river sand or are resulted from the mechanical crushing of the rock (aggregates) extracted from the quarry. The lithoclasts are consisting of dacite (quarry crusehed aggregates; (Figure 18 and Figure 19), quartzite and crystaline schists. Recycled concrete aggregates (RCA) are also present in the sample BcR-RCA-10%WGP. Under the microscope is well visible that the matrix of RCA is well crystalized as compared with the matrix of BcR-RCA-10%WGP sample (Figure 16). BcR-RA-10%WGP matrix is predominantly isotropic (black in color at crossed pollars) indicating the presence of glass powder. Small crystals of portlandite are also visible into the matrix.

2.3.2. X-ray diffraction by the Powder method (PXRD) for the calitative analysis

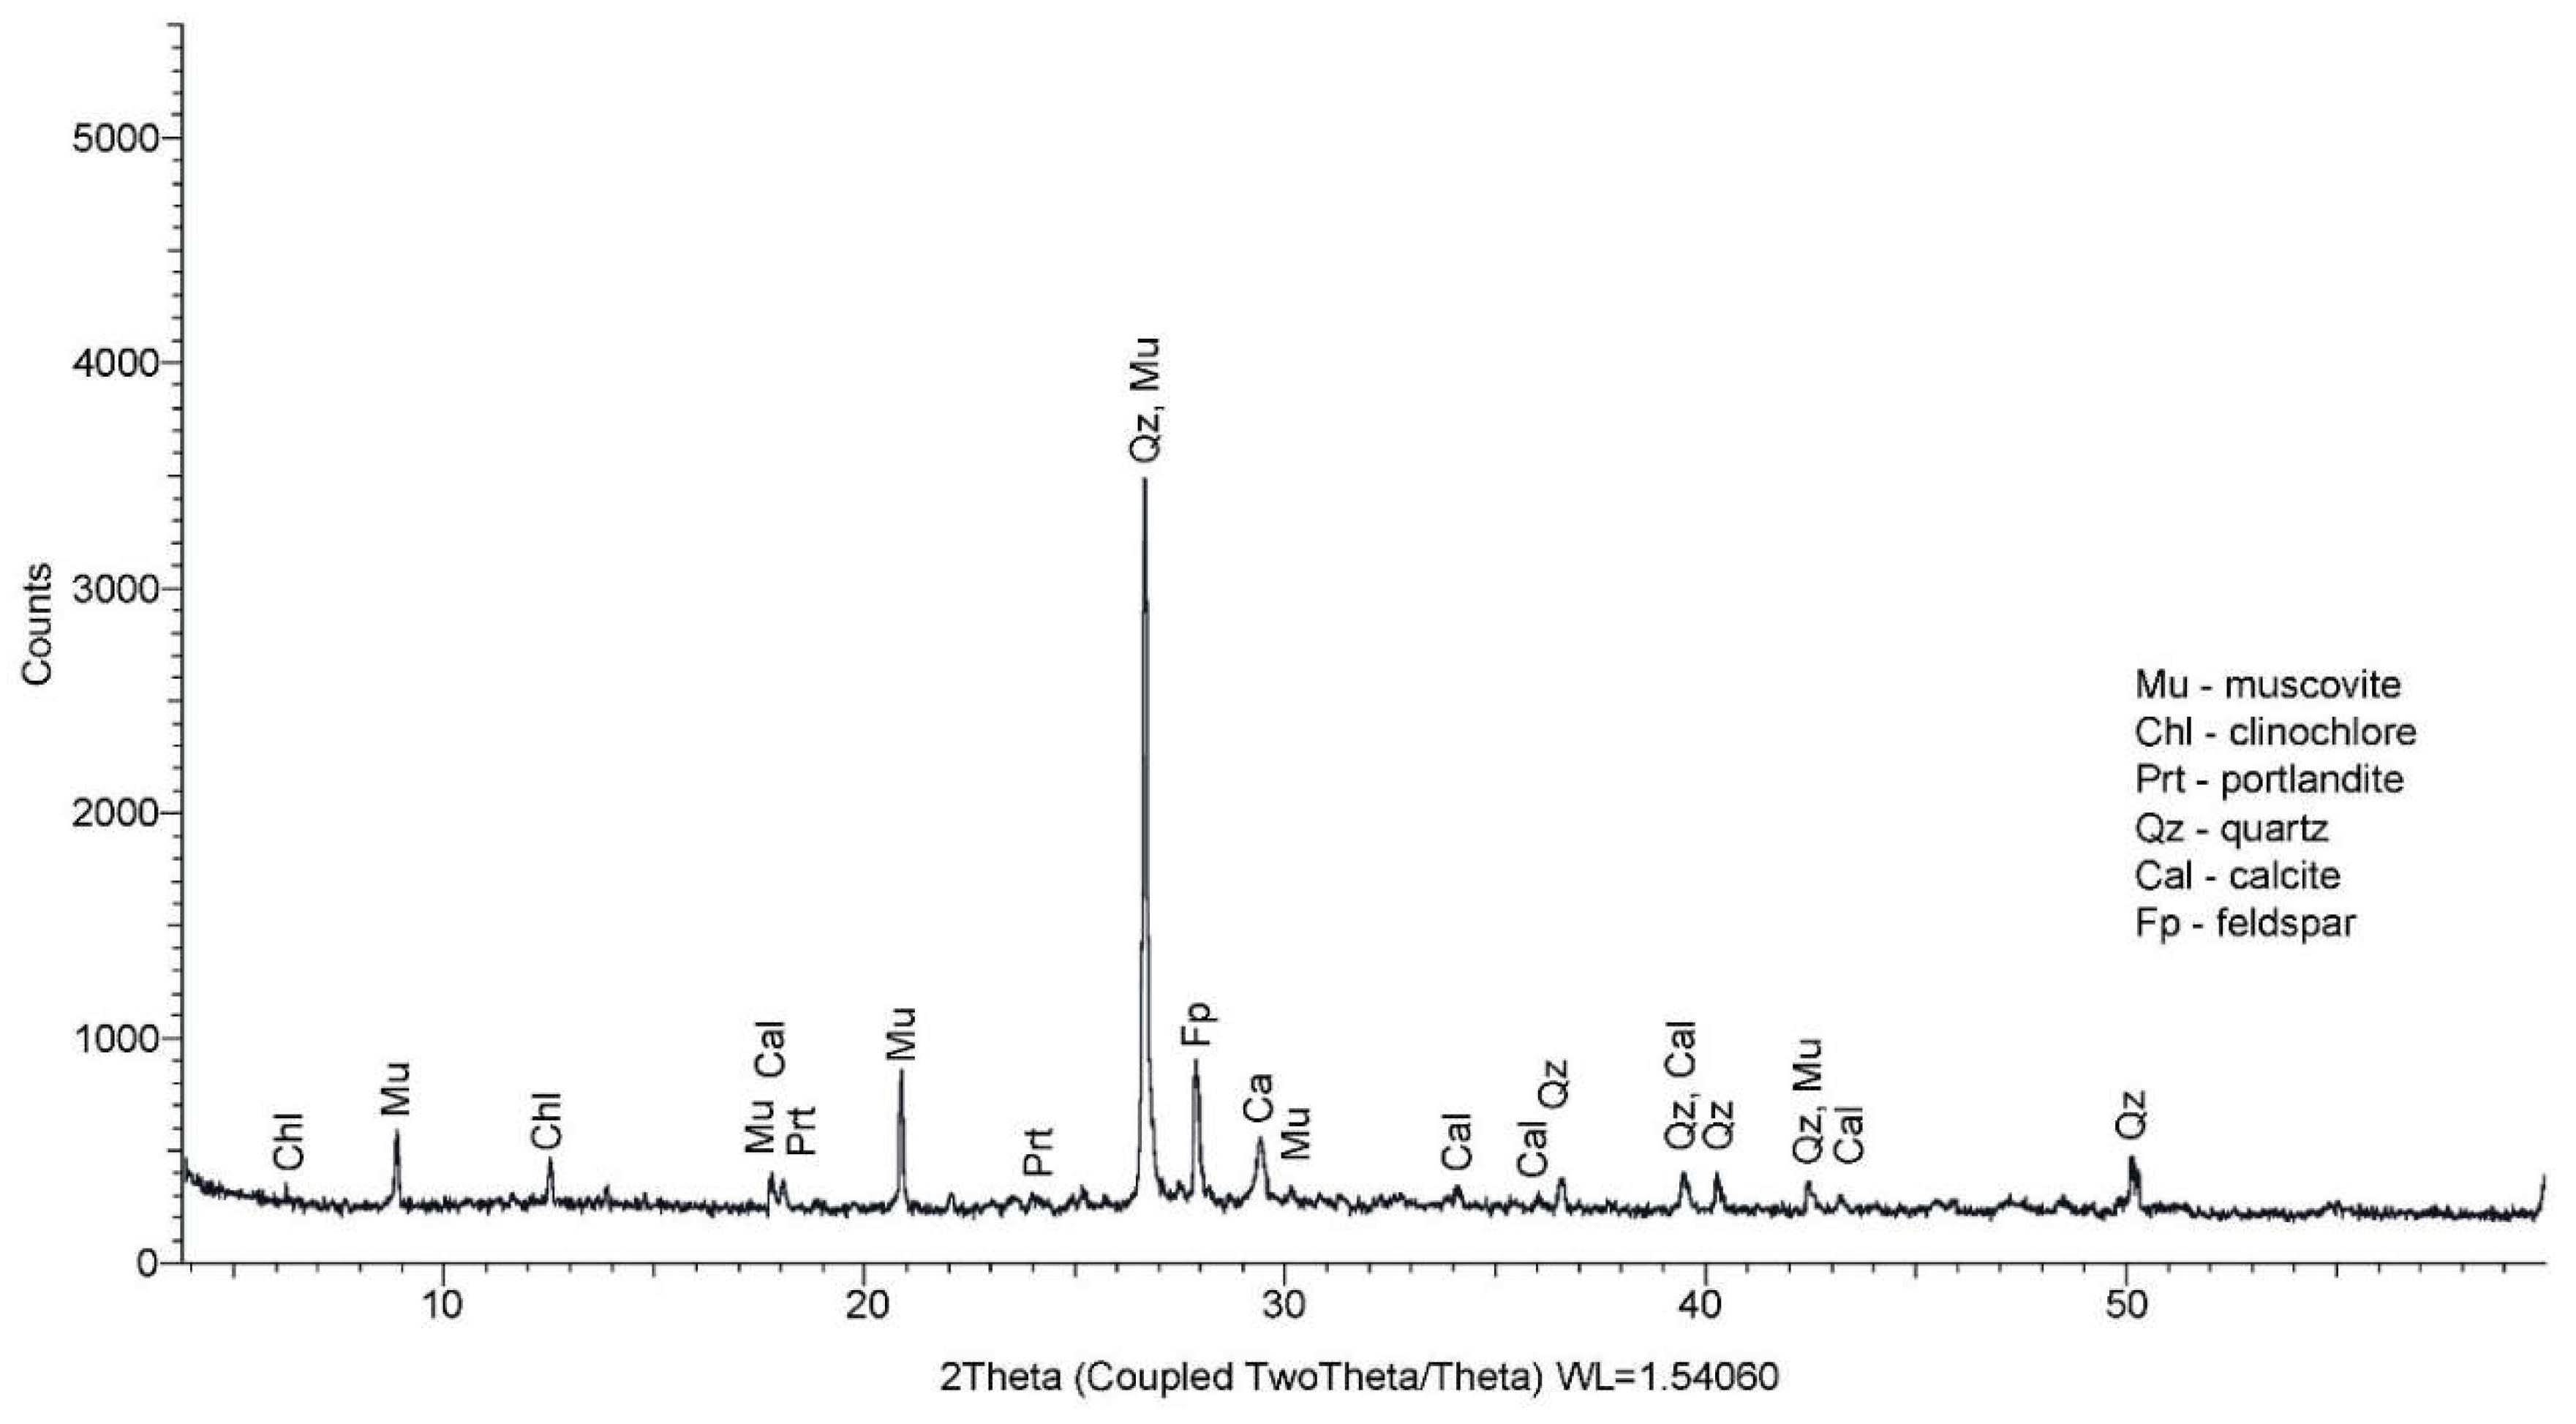
Both type of samples (BcR-NA and BcR-RCA-10%WGP) were investigated using x-Ray diffraction. The x-Ray spectra obtained on the whole sample powder are dominated by the presence of the minerals form the aggregates, especially by quartz. In order to in-vestigate the newly formed mineral phases of the matrix the elimination of the aggregates is crucial. Such a separation of the matrix and aggregates is almost impossible as long as some fragments of minerals are microscopic in size. The X ray investigation performed on the sample BcR-NA indicate the presence of mineral phases originated from the aggregates (quartz, muscovite, albite, clinochlore and orthoclase) as well as newly formed minerals as portlandite (Ca (OH)2) and gypsum (CaSO4·2H2O). The calcite (CaCO3) is also present as the result of carbonation of concrete (Figure 20).
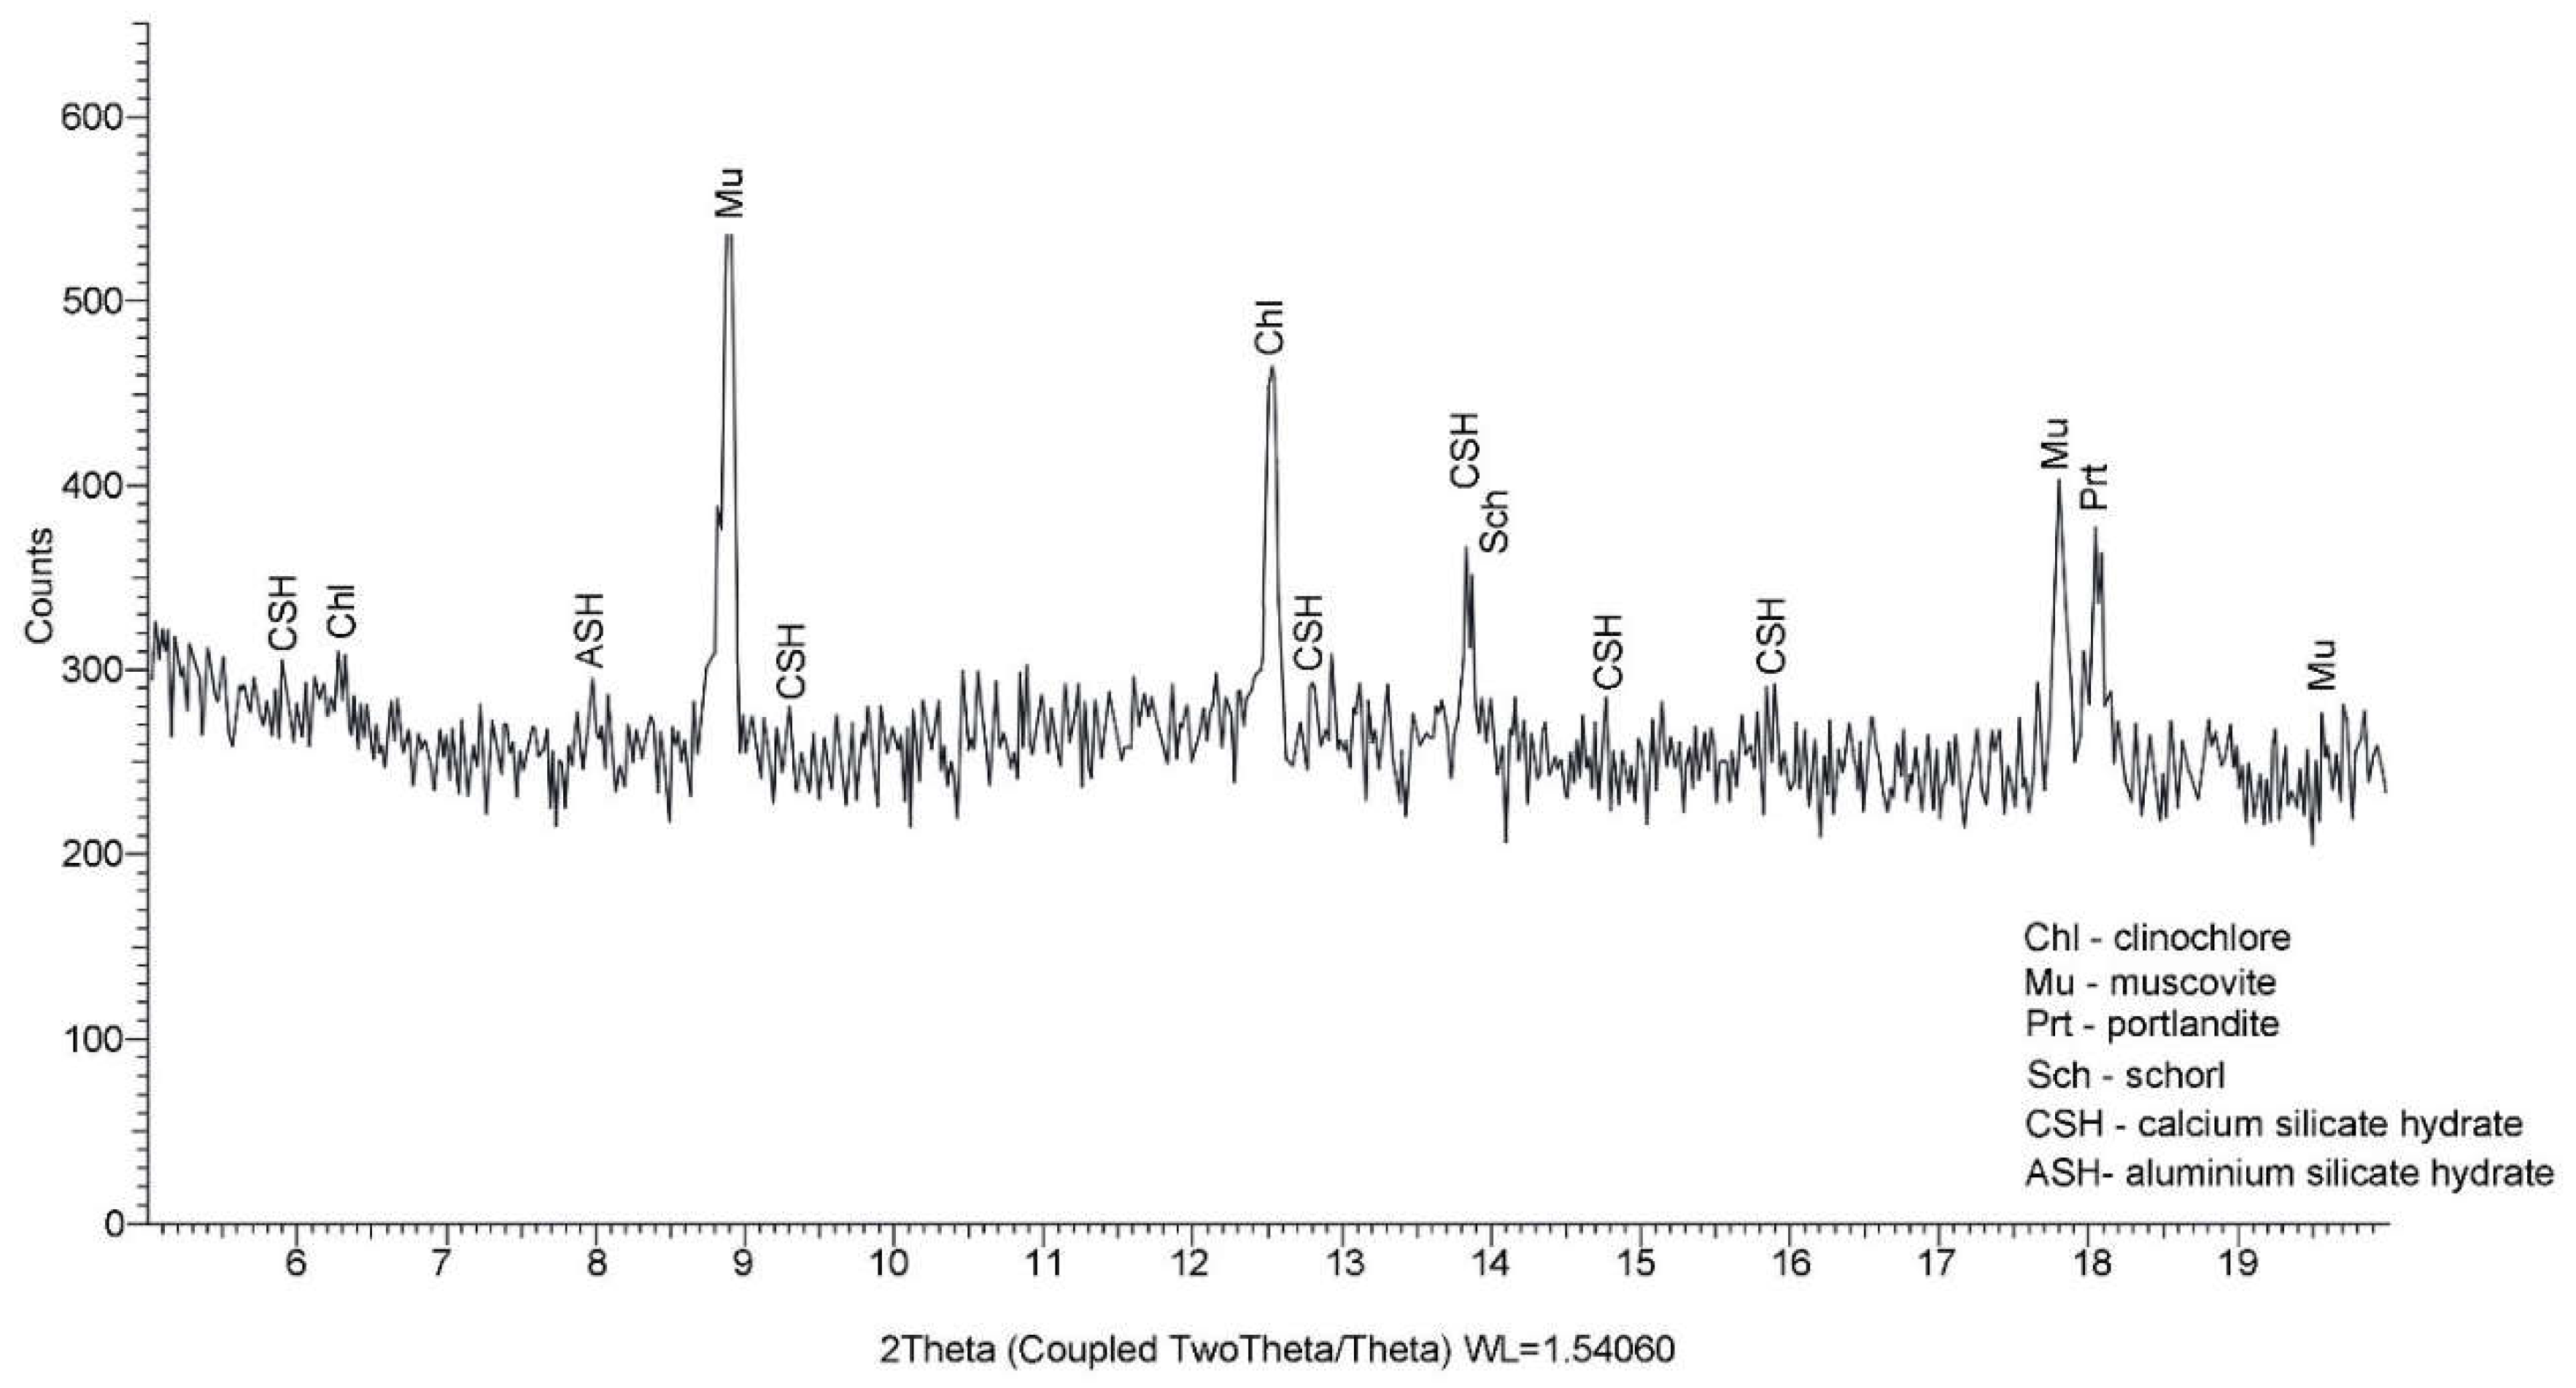
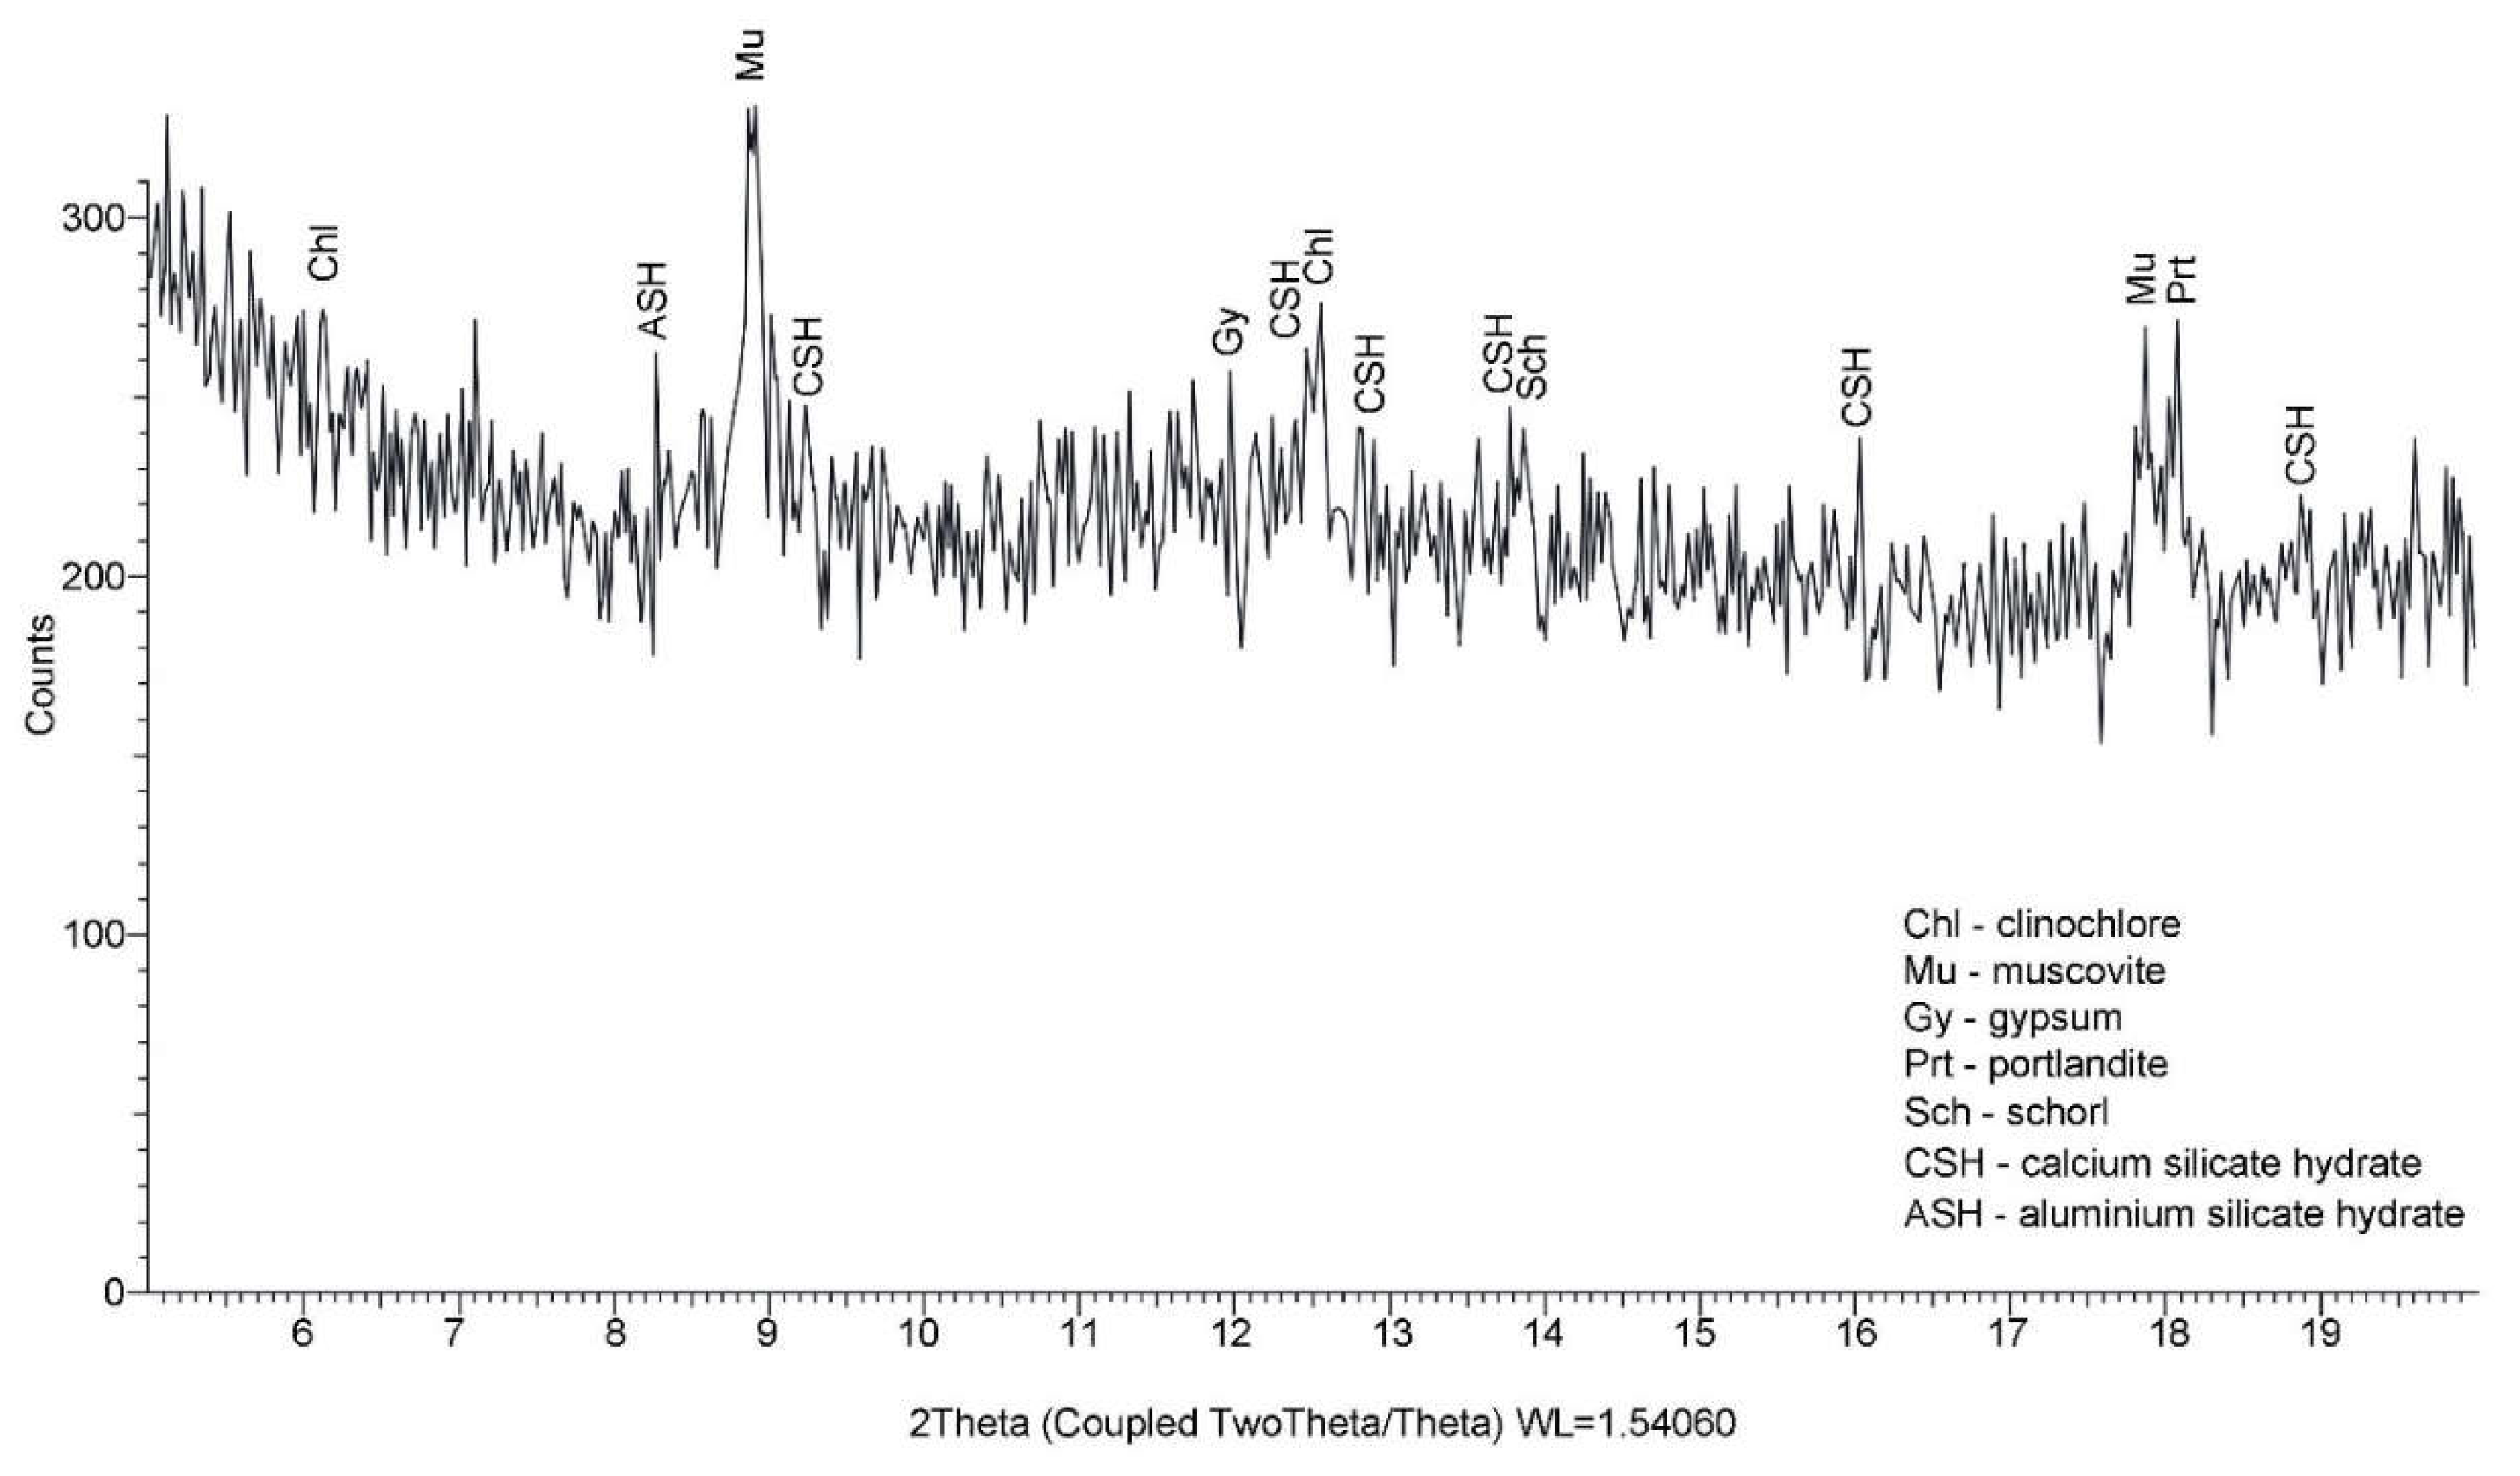
For a better highlighting of portlandite as well as for eliminate the strong signal of quartz, a limited X ray spectrum betweem 3.8÷20-degree 2 theta was collected (Figure 21). Beside portlandite, muscovite, clinochlore and tourmaline (var. Schol) some typical line for calcim silicate hydrate (CSH) and aluminium silicate hydrate (ASH) are well visible.
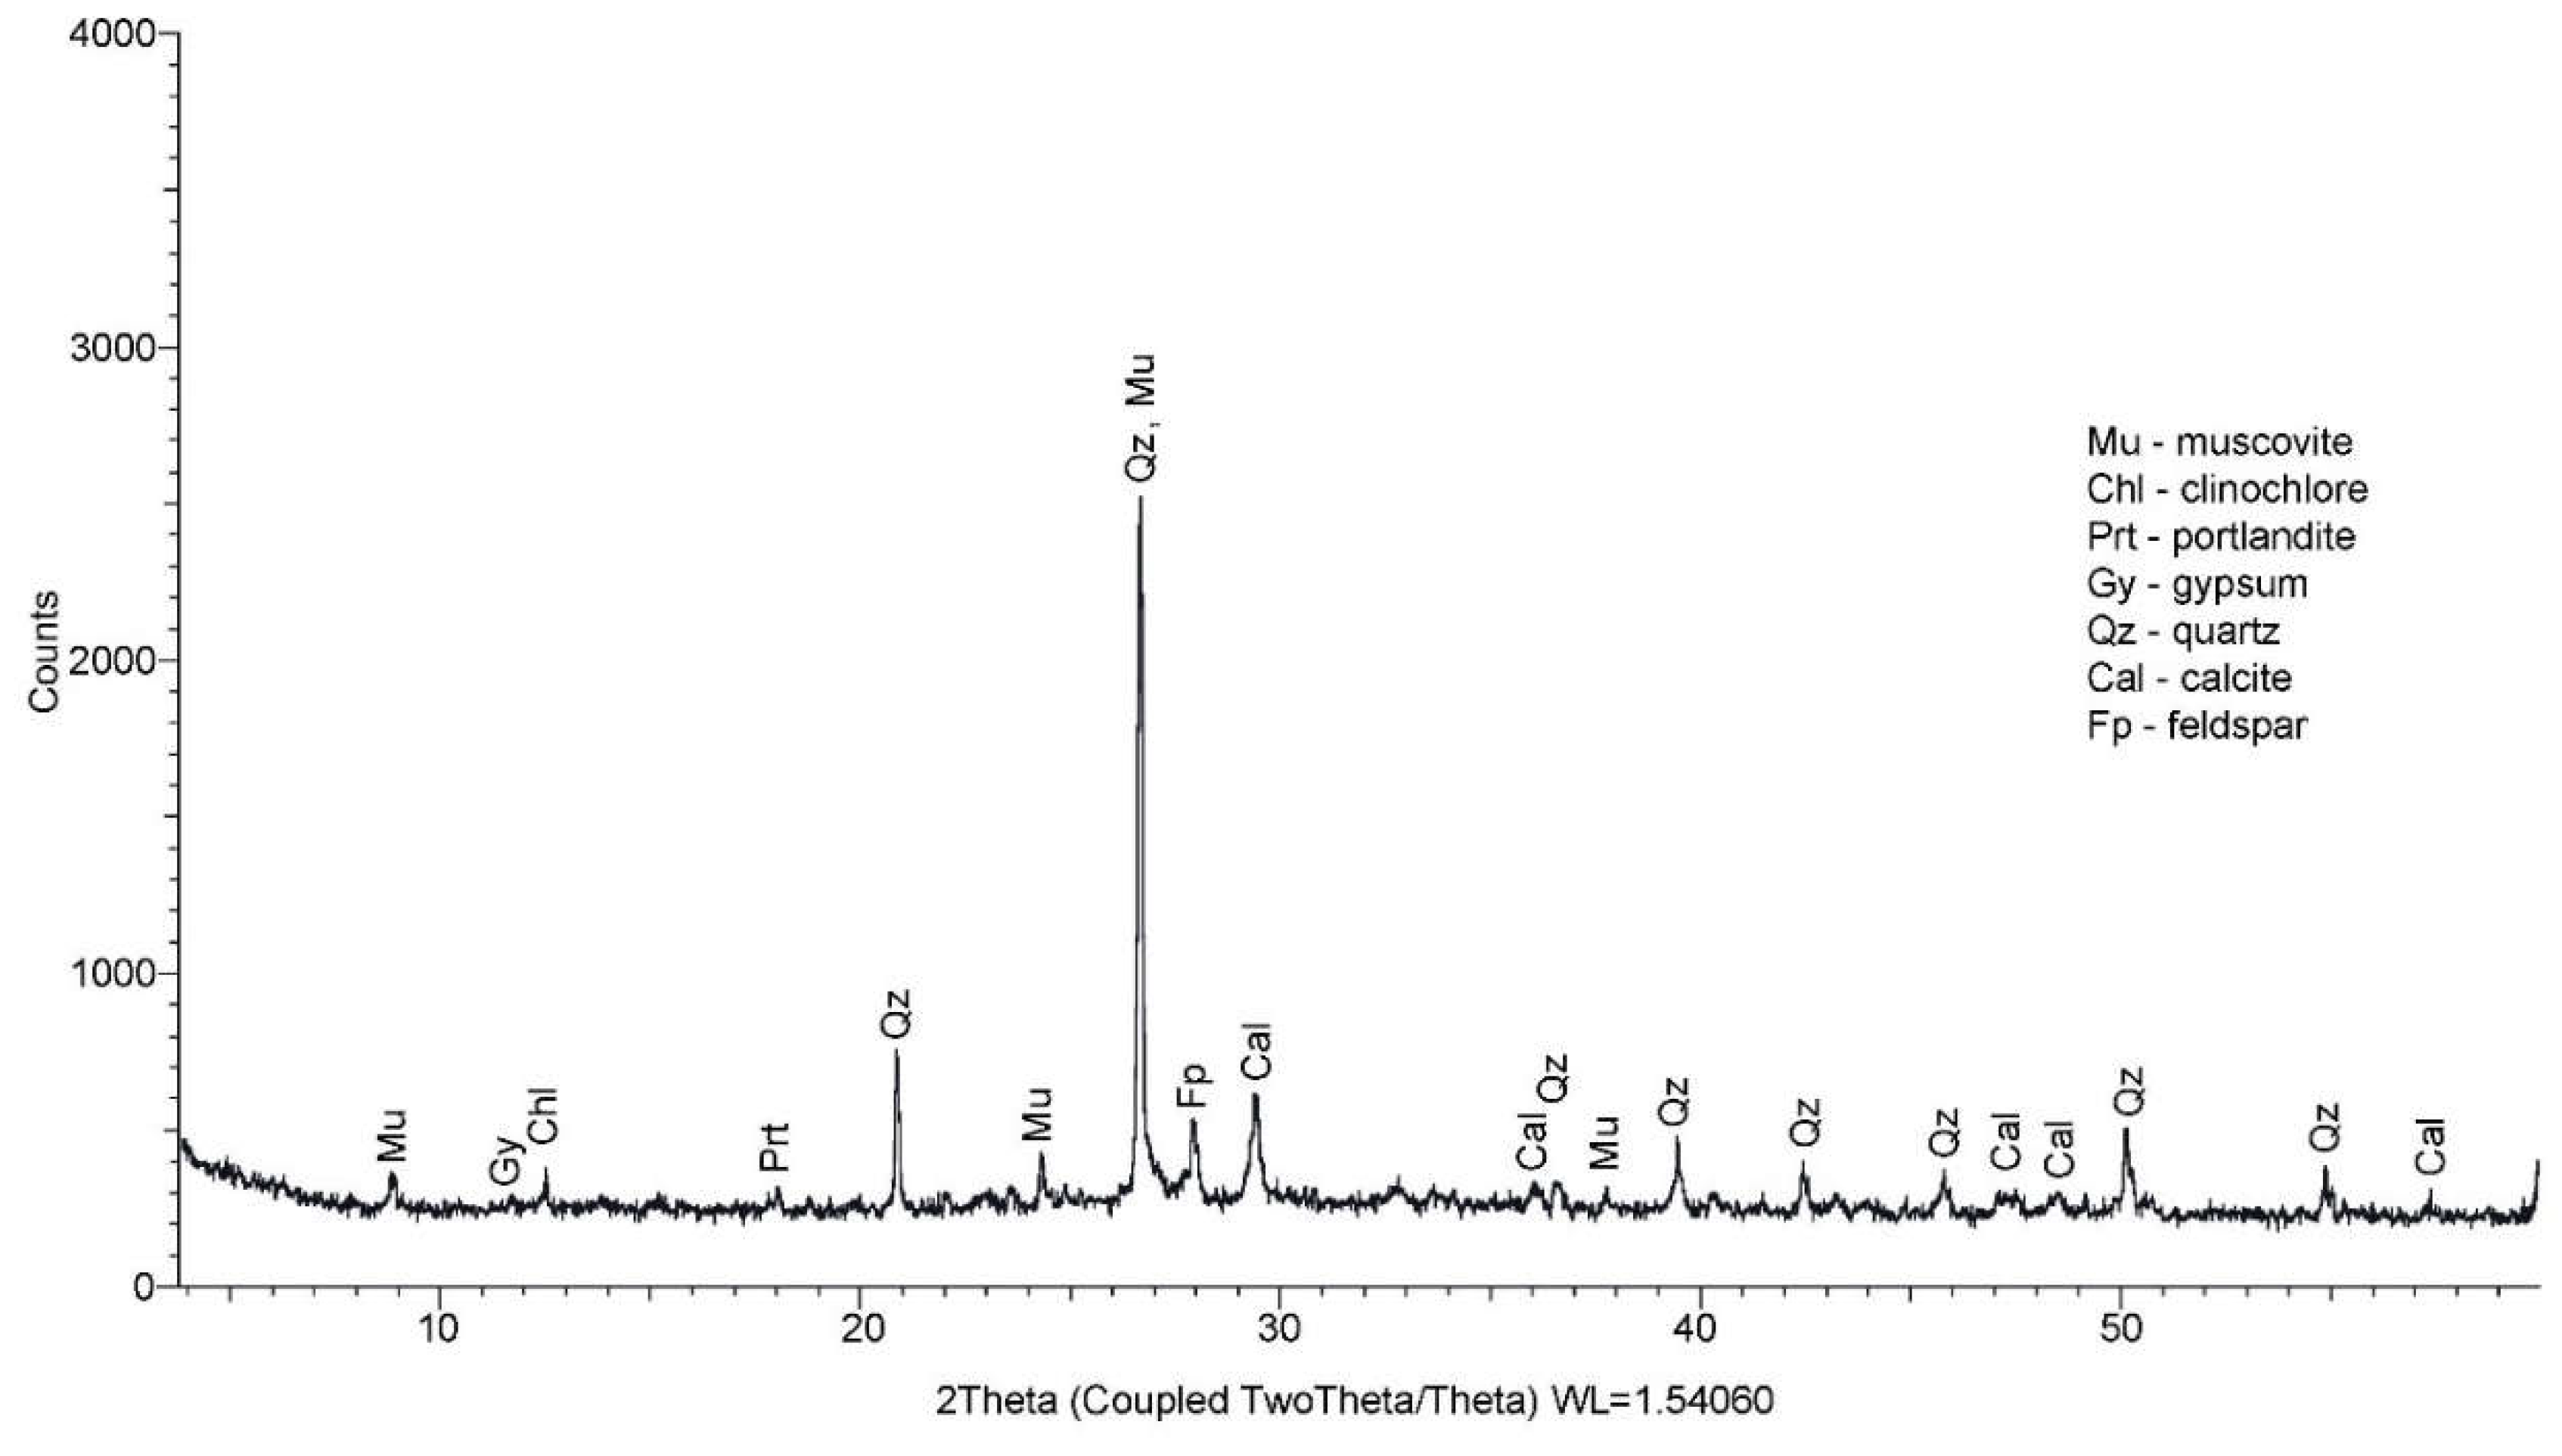
The X ray investigation performed on the sample BcR-RCA-10%WPG indicate the presence of mineral phases originated from the aggregates (quartz, muscovite, plagioclase feldspars, clinochlore and orthoclase) as well as newly formed minerals as portlandite and gypsum (Figure 22). The calcite is also present as the result of carbonation of concrete. The shape pf the spectrum indicates a high degree of matrix crystallization suggesting the puzzolanic reaction of the glass powder (WGP).
The X ray spectrum collected between 3.8÷20-degree 2 theta for the sample BcR-RCA-WPG show up the typical line for muscovite, clinochlore, gypsum, schorl and portlandite as well as for calcim silicate hydrate (CSH) and aluminium silicate hydrate (ASH) (Figure 23).

4. Discussion

4.1. Performance of the BcR composites fresh properties

Figure 24 shows the fresh properties of the investigated mixtures. As already known in the specialized literature, both WG particles and quarry aggregates have a detrimental effect on the workability of the material when both natural aggregates and high water-absorption recycled aggregates (RCA) are used [7,58,92,93].
The consistency is higher for the Var. II mixtures, where the W/C ratio increased from 0.45 to 0.55 and there has been an additional superplasticizer input from 1.8% to 2.3%, as well as the inclusion of 2% ARN 0/4 mm to support workability and 4% RCA. From Figure 9, it can be observed that the densities of Var. I mixtures are higher than those of Var. II, which is natural due to the percentage composition of the coarse quarry aggregate (8/16 mm) being 6% higher in Var. I than in Var. II.
The entrained air content follows the same trend as the consistency of the concrete. It leads to a decrease in mechanical strength but may favor the reduction in loss of strength during repeated freeze-thaw cycles (Table 19 and Table 20).

4.2. Performance of the BcR composites hard properties

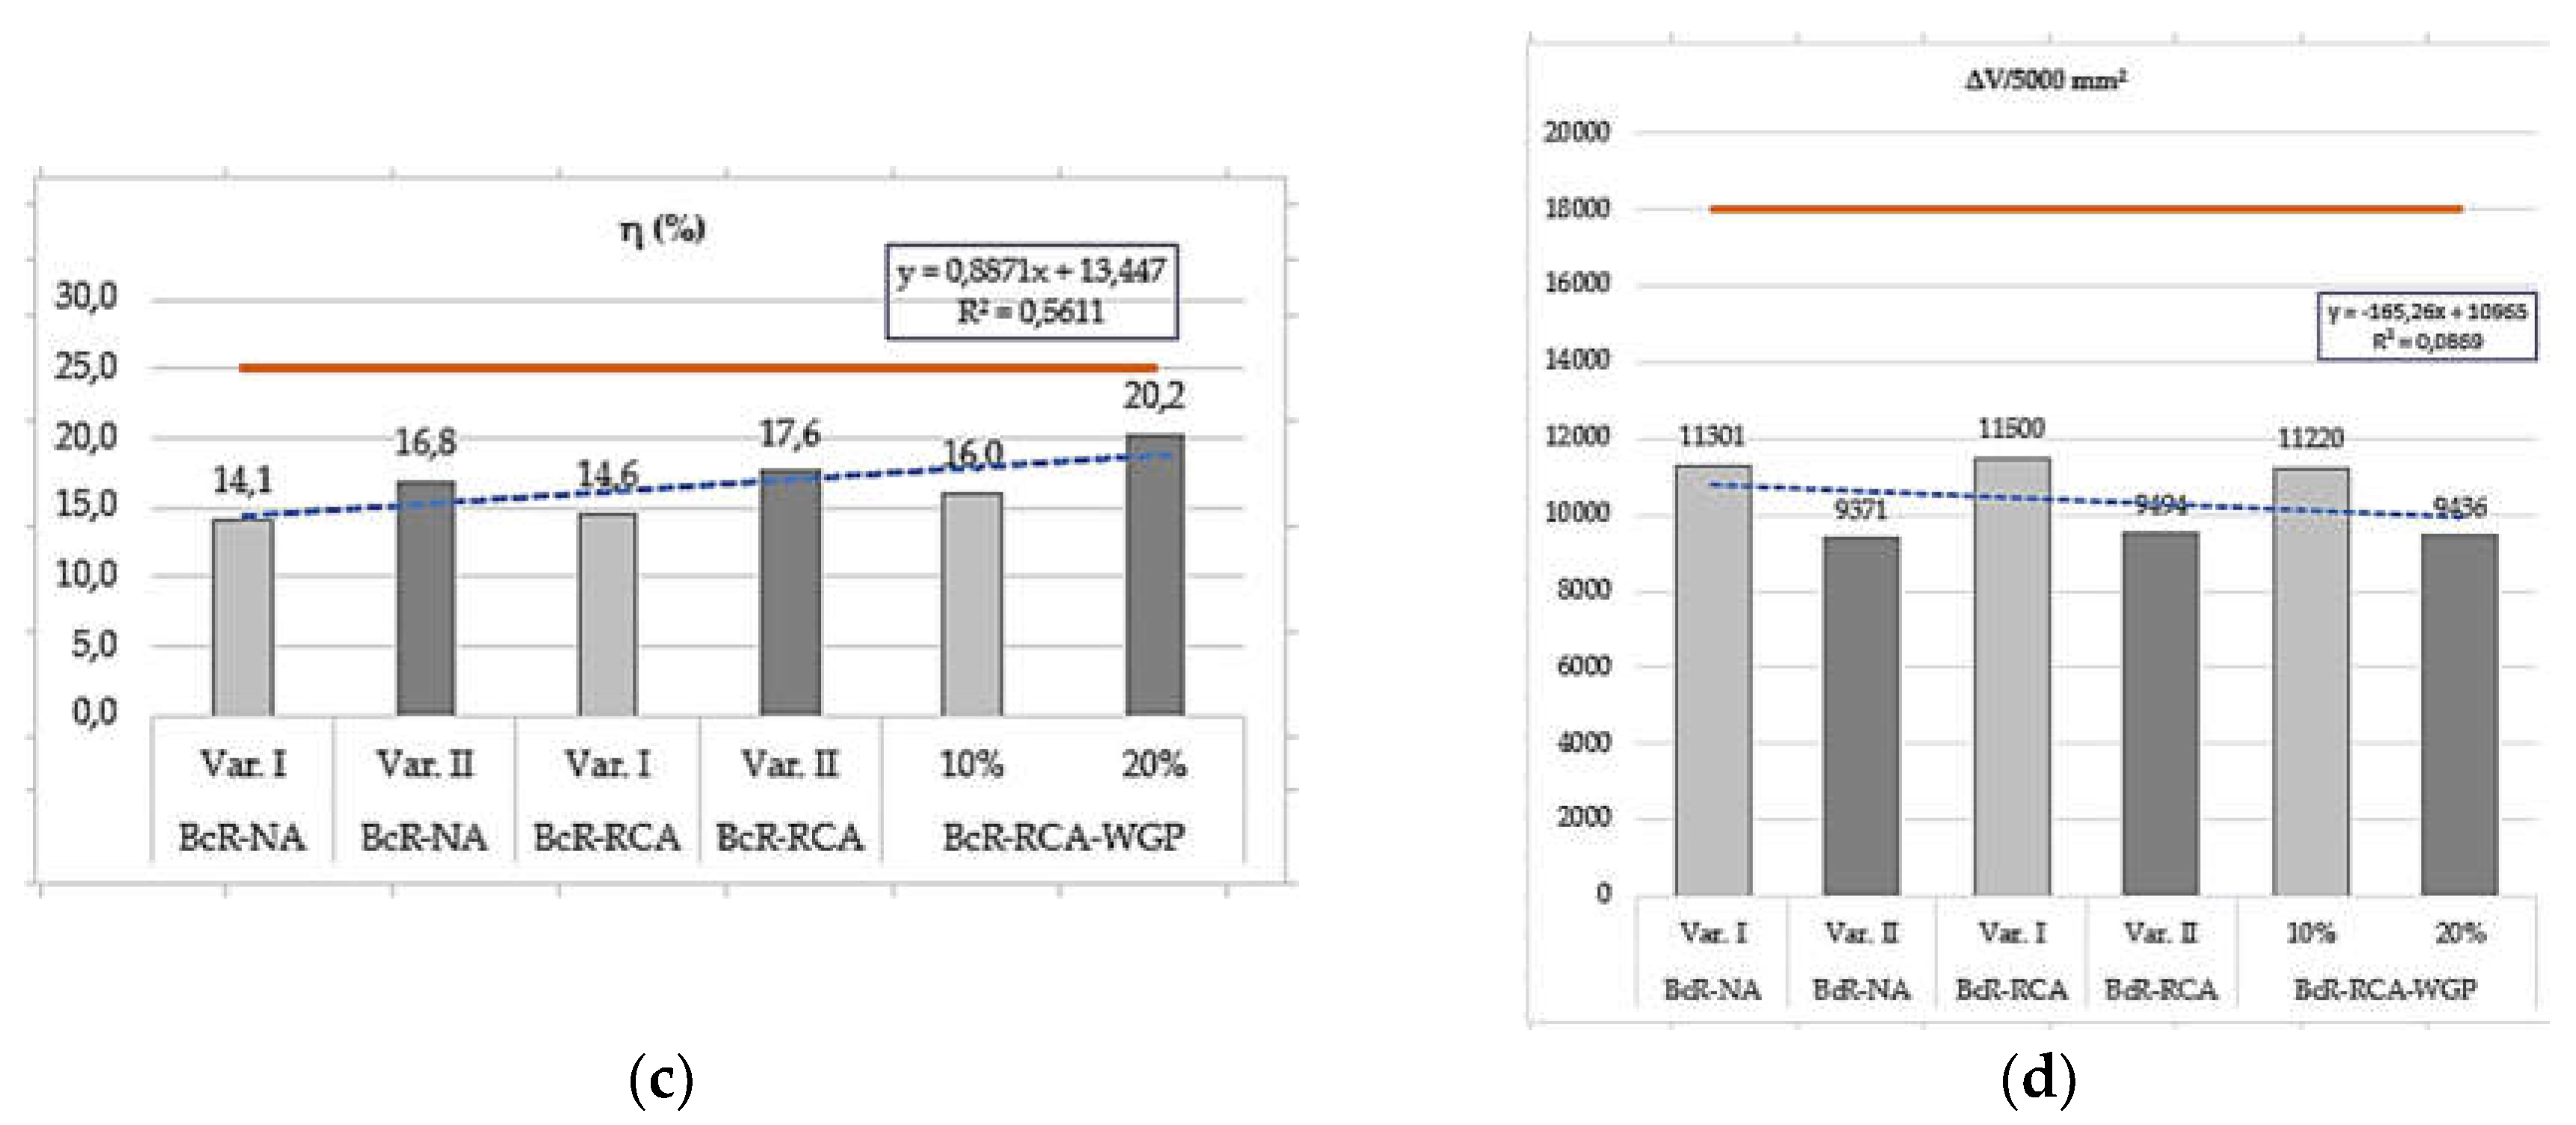
In Figure 25, the graphical representations of the values of road composite properties, the most relevant ones (fc,fl, fc, η, and ΔV), are shown. Also, the increasing or decreasing trends of these properties are illustrated with their corresponding equations, along with the limit value imposed by the NE 014 standard [38], highlighted by the orange line.
For road concrete, the flexural strength (fct,fl) classifies the concrete into BcR strength classes, which are presented in Table 21 for the composites created in this study.
The design of road concrete mixtures meets the requirements of national [NE 012-1:2022] [94] and European [fib Bulletin 42] [95] standards (Table 22), where the acceptable value of the mean compressive strength (fcm) is achieved by adding a value Δf ranging from 6 to 12 units (MPa) to the characteristic strength fck. Additionally, it is known that the flexural tensile strength (fct,fl) has values in the range of (1/10÷1/20) of fc, and the values from this study also meet this criterion.
The reported values of the properties of the control composite for each of the variants (Var. I and II), the alternatives with RCA, and the ones with both RCA and WGP, as well as the ratio of properties between the control composites, those with RCA, and those with WGP from the two variants, are expressed by the coefficient of variation (Cv1). In terms of the classification criteria (fct,fl > 5.0 (4.0) MPa; fc > 45 (35) MPa, loss of strength (η) after 100 freeze-thaw cycles < 25%, and the value of volume loss (ΔV) < 18000 mm³/5000 mm² for classification in the best wear resistance class), they are expressed by the coefficient of variation (Cv2) and presented in Table 23.
The analysis of the percentages of the evolution of the results regarding the obtained properties for each variant and the comparison between them is presented in the followings.
The value of fct,fl strength for Var. I obtained for BcR-NA is higher than that of BcR-RCA by 16.4% and compared to that of BcR-RCA-10%WGP by 19.4%. Considering the minimum required value of 5 MPa for classification in BcR5 Class, the value of BcR-NA exceeds the limit by 34%, BcR-RCA by 12%, and BcR-RCA-10%WGP by 8%.
The value of fct,fl strength for Var. II obtained for BcR-NA is lower than that of BcR-RCA by 1.9%, and compared to that of BcR-RCA-10%WGP, it is higher by 20.4%. Considering the minimum required value of 5 MPa for classification in BcR5 Class, the value of BcR-NA exceeds the limit by 8%, BcR-RCA by 10%, and BcR-RCA-10%WGP is reduced by 14%.
The comparative value of fct,fl strengths between Var. I and Var. II, obtained for BcR-NA Var. I compared to Var. II is higher by 19.4%, that of BcR-RCA by 1.79%, and for BcR-RCA-10%WGP compared to BcR-RCA-20%WGP is higher by 20.37%.
The tensile bending strengths at the reference age of 28 days of the concrete mixtures, except BcR-RCA-20%WGP, recorded values greater than >5.0 MPa, corresponding to the requirements for the very heavy traffic class BcR 5.0 [38], the same traffic class as the reference concrete. The increase in the ratio of 20% WGP led to a decrease in the tensile bending strength [97], which can be attributed to the higher absorption and porosity compared to natural sand, and consequently an increased water demand to maintain the desired workability [98,99].
With the exception of BcR-RCA-20%WGP (BcR4), all composites fit into the BcR5 class. The value of fc strengths for Var. I obtained for BcR-NA is higher than that one obtained for the BcR-RCA by 1.3%, and compared to that of BcR-RCA-10%WGP by 5.0%. Considering the minimum required value of 45 MPa for classification in BcR5 class, the value of BcR-NA exceeds the limit by 87.11%, BcR-RCA by 84.67%, and BcR-RCA-10%WGP by 77.78%.
The value of fc strengths for Var. II obtained for BcR-NA is lower than that of BcR-RCA by 0.3% and compared to that of BcR-RCA-20%WGP, it is higher by 10.4%. Considering the minimum required value of 45 MPa for classification in BcR5 class, the value of BcR-NA exceeds the limit by 53.78%, BcR-RCA by 54.22%, and BcR-RCA-20%WGP by 37.78%.
The comparative value of fc strengths between Var. I and Var. II, obtained for BcR-NA Var. I compared to Var. II is higher by 17.8%, that of BcR-RCA by 16.5%, and for BcR-RCA-10%WGP compared to BcR-RCA-20%WGP is higher by 22.5%.
The values of fc,sp strengths associated with Var. I compared to all the fc,sp values associated with composites in Var. II are 17.77% higher for BcR-NA, 15.90% for BcR-RCA, and 22.22% for those containing WGP.
The loss of strength (η) due to 100 repeated Freeze-Thaw cycles of the composites in Variant I is lower than that of those in Var. II, due to the presence of entrained air and the increased W/C ratio. The lower η is, the higher the resistance of the composites to freeze-thaw cycles.
The value of η for Var. I obtained for BcR-NA is lower than that of BcR-RCA by 3.47 % and compared to that of BcR-RCA-10%WGP by 13.39%. Considering the minimum required value of 25% for classification in BcR5 class, the value of BcR-NA is lower than the limit by 43.56%, BcR-RCA by 41.60%, and BcR-RCA-10%WGP by 36.00%.
The value of η for Var. II obtained for BcR-NA is lower than that of BcR-RCA by 4.76% and compared to that of BcR-RCA-20%WGP, it is lower by 20.24%. Considering the minimum required value of 25% for classification in BcR5 class, the value of BcR-NA is lower than the limit by 32.80%, BcR-RCA by 29.60%, and BcR-RCA-20%WGP by 19.20%.
The comparative value of η between Var. I and Var. II, obtained for BcR-NA Var. I compared to Var. II is lower by 19.06%, that of BcR-RCA by 20.55%, and for BcR-RCA-10%WGP compared to BcR-RCA-20%WGP is lower by 26.25%.
The results for the mechanical strengths indicate that, in general, they decrease as natural aggregate is replaced, cement is substituted with WGP, and the W/C ratio increases. However, all of them highlight better behavior than the limits imposed for classification into road concrete classes.
The volume loss (ΔV) of the composites in Var. I is greater than that of Var. II, due to the increased water content in the designed mixtures, but it is also influenced by the strength of the aggregate in the cement matrix and the content of WGP. Composites containing glass content performs the best in terms of wear, especially the BcR-RCA-20%WGP composite, confirming the effective influence of WGP in the composite and fulfilling the research purpose. Abbrasion behavior is also attributed to the characteristics of the constituent aggregates, which form the mineral skeleton incorporated by the cement matrix.
The lower the volume loss, the more resistant the sample is to wear. The greater the amount of FGS (Fine Glass Powder) in the concrete composition, the more resistant the sample subjected to Böhme wear, which means that it has the lowest volume loss due to the dense composition and the hardness of WGP. All obtained values classify the composites in the best performance class according to the criteria in SR EN 1338, 1339, 1340 [85,86,87], specifically in Class 4 - Mark I, which requires a volume loss < 18000 mm³/5000mm². Regarding the cement replacement variants with 10% and 20% WGP, all mechanical characteristics are higher in the 10% variant, except for the volume loss in the wear test (Table 20).
The value of ΔV for Var. I obtained for BcR-NA is lower than that of BcR-RCA by -1.76%, and compared to that of BcR-RCA-10%WGP, it is higher by 2.43%. Considering the minimum required value of 18000 mm³ for classification in Class 4 - Mark I, the value of BcR-NA is lower than the limit by 37.22%, BcR-RCA by 36.11%, and BcR-RCA-10%WGP by 37.67%.
The value of ΔV for Var. II obtained for BcR-NA is lower than that of BcR-RCA by 1.31%, and compared to that of BcR-RCA-20%WGP, it is higher by 0.69%. Considering the minimum required value of 18000 mm³ for classification in Class 4 - Mark I, the value of BcR-NA is lower than the limit by 47.94%, BcR-RCA by 47.26%, and BcR-RCA-20%WGP by 47.58%.
The comparative value of ΔV between Var. I and Var. II, obtained for BcR-NA Var. I compared to Var. II is higher by 17.08%, that of BcR-RCA by 17.44%, and for BcR-RCA-10%WGP compared to BcR-RCA-20%WGP is higher by 15.90%. The mixtures in Var. II are more resistant to wear. The best wear behavior among all composites is that of BcR-RCA-20%WGP.

4.2. Performance of the BcR by PXRD test

Microscopic studies have highlighted the fact that, from a matrix structure perspective, it is finely crystallized, supporting a compact composite with high mechanical strengths, both in the control mixture and especially in the one with 10% WGP. Microcrystalline mineral phases are visible, represented by Portlandite, calcite, hydrated calcium silicates, and hydrated calcium aluminates. X-ray diffraction indicates a high degree of crystallization in the concrete matrix containing 10% WGP, suggesting a pozzolanic reaction of WGP. Additionally, X-ray diffraction has revealed the presence of calcite, Portlandite, and gypsum, as well as the presence of calcium silicate hydrate and aluminum silicate hydrate. Thus, the effectiveness of WGP content in BcR composites is confirmed due to its efficient pozzolanic activity and hardness, contributing to durability characteristics [100,101].
A continuation of this study is planned, involving the assessment of long-term characteristics of the new road concrete with RCA and WGP.

5. Conclusions

This paper focuses on the development of road concrete that aims to use recycled materials from concrete and glass (WC and WG) at the end of their life cycle. These materials are incorporated into the cement matrix alongside natural aggregates, and there's a partial substitution of cement with WGP, intending to create a new, sustainable composite that has not been achieved until this moment. Microscopic determinations confirm the pozzolanic efficiency of WGP in concrete through its complete consumption. Additionally, the presence of CSH contributes to the enhancement of mechanical characteristics.
This new composite offers several advantages in terms of reducing existing and potential volumes of mineral waste, both economically and visually, reducing pollution, minimizing the consumption of natural resources, and energy (the production of RCA consumes less electrical energy than crushing natural aggregates, which are rapidly depleted in urban areas undergoing rapid development). Moreover, the potential for practical application is ensured due to meeting durability requirements. Typically, companies incur high fees for the removal, transportation, and disposal of this type of waste at landfills as inert solid waste, reasonable reuse of these waste being of high interest.
This study confirms the appropriate use of RCA and its integration into road concrete. Obviously, the characteristics of this type of aggregate need more frequent testing compared to natural crushed river aggregate, and they must have values close to those they replace. The fact that RCA contains a quantity of mortar signals the need for water in the mix (effective water) to ensure it's sufficient for a prescribed consistency, considering the increased absorption of RCA. The high absorption of RCA is not detrimental because it can promote the hydration of cement particles that remain un-hydrated for a longer period, contributing to increased mechanical strengths even at more advanced ages. This justifies the high characteristic values for composites with RCA content. Another confirmation of the study is the role of WGP in the composites. WGP significantly contributes to the favorable behavior of composites, particularly in terms of wear resistance, which is a key objective of this study. Consequently, these compositions can be used for roads with heavy traffic.
Even though the mechanical characteristic values experienced slight decreases for composites with alternative mixtures, all of them fall within the BcR 4 and mostly BcR 5 classes of road concrete (the highest class existimg in the Romanian standard).

6. Patents

Eco-innovative road concrete based on cement, glass powder and aggregates from recycled concrete waste for applications in the field of constructions “BcR-G”;
RO137345A0 • 2023-03-30 • UNIV TEHNICA DIN CLUJ NAPOCA [RO], Earliest priority: 2022-09-29 • Earliest publication: 2023-03-30. Inventors: CORBU OFELIA CORNELIA [RO]; PUSKAS ATTILA [RO]

Author Contributions

Conceptualization, O.C. and A.P.; methodology, O.C., A.P.and N.H.; validation, A.T., L.M.D., N.H. and I.O.T.; formal analysis, O.C.; investigation, O.C. and N.H.; resources, A.P. and O.C.; writing—original draft preparation, O.C.; writing—review and editing, A.T., L.M.D., N.H. and I.O.T; visualization, I.O.T; supervision, A.T.; project administration, O.C. All authors have read and agreed to the published version of the manuscript.

Institutional Review Board Statement

Not applicable.

Informed Consent Statement

Not applicable.

Data Availability Statement

All the required data that support the finding are presented in the manuscript.

Conflicts of Interest

All authors confirm that they have no conflict of interest.

References

  1. https://www.revistasinteza.ro/economia-de-la-liniar-la-circular. (Accessed on ). 24 May.
  2. https://legislatie.just.ro/Public/DetaliiDocumentAfis/253009. (Accessed on ). 24 May.
  3. Romanian Government, Strategia națională privind economia circulară. Proiect. https://sgg.gov.ro/1/wp-content/uploads/2022/08/Strategia-economie-circulara_18.08.2022.pdf. (accessed on 24 May 2023).
  4. Ionescu, B.A.; Barbu, A.M.; Lăzărescu, A.V.; Rada, S.; Gabor, T.; Florean, C. The Influ-ence of Substitution of Fly Ash with Marble Dust or Blast Furnace Slag on the Properties of the Alkali-Activated Geopolymer Paste. Coatings 2023, 13(2), 403. [Google Scholar] [CrossRef]
  5. Malhotra, V.M. ; Making Concrete “Greener” With Fly Ash. ACI Conc. Int. 1999, 21, 61–66. [Google Scholar]
  6. Corbu, O.C.; Magureanu, C.; Onet, T. ; Szilagy,H. Economia de energie la realizarea betoanelor performante (Energy saving in the production of high-performance concrete). Conference: SME 2010, 20-21, 10, Cluj-Napoca, Romania, 19, 343-354. www.cncs-uefiscdi. 20 May.
  7. Fadi, A.; Osama, Z.; Ali, M.; Fahad, A.; Saleh, A.; Mohamed, M.A.; Ain, S. Effect of fly ash and waste glass powder as a fractional substitute on the performance of natural fibers reinforced concrete. Eng. J. 2023. [Google Scholar] [CrossRef]
  8. Cement Technology Roadmap: Carbon Emissions Reductions up to 2050. https://www.iea. (accessed on 10 March 2023)2050.
  9. US Geological Survey. Mineral Commodity Summaries: Cement. 2012. Available online: https://d9-wret.s3.us-west-2.amazonaws.com/assets/palladium/production/mineral-pubs/mcs/mcs2012.pdf. 28 February.
  10. Cembureau. Available online: https://www.cembureau.eu/library/reports/2050-carbon-neutrality-roadmap/ (accessed on 21 February 2023).
  11. Aitcin, P.C. Cements of yesterday and today; Concrete of tomorrow. Cem. Concr. Res. 2000, 30, pp. 1349–1359.
  12. Sandu, A.V. Obtaining and Characterization of New Materials, Materials 2021, 14(21), 6606. [CrossRef]
  13. EU Construction & Demolition Waste Management Protocol, https://ec.europa. 2050.
  14. Corbu, O.; Chira, N.; Szilagyi, H.; Constantinescu, H. Ecological concrete by use of waste glass. In Proceedings of the 13th 13th SGEM GeoConference on Nano, Bio and Green – Technologies For A Sustainable Future, www.sgem.org SGEM 2013, Albena, Bulgaria, 2013, pp. 411–418, June 16-22.
  15. Corbu, A. Puskás, H. Szilágyi, C. Baeră. C16/20 CONCRETE STRENGTH CLASS DESIGN WITH RECYCLED AGGREGATES. JAES, 4(17), 2/2014, pp. 13-19. [CrossRef]
  16. Puskás, A.; Corbu, O.; Szilágyi, H.; Moga, L.M. Construction waste disposal practices: The recycling and recovery of waste. WIT Transactions on Ecology and the Environment, 2014, 191, 1313-1321. [CrossRef]
  17. Corbu, O.; Puskás, A.; Moga, L.; Szilagyi, H. Opportunities for increasing the recycling rate of mineral waste in construction industry, International Multidisciplinary Scientific Geo-Conference Surveying Geology and Mining Ecology Management, Albena, Bulgaria, SGEM 2015, 2(6), 203-210.
  18. Frondistou-Yannas, S. Waste Concrete as aggregate for new concrete. ACI Journal, 1977, 74, pp.
  19. Abhijeet, B.; Shadab, M. ; V.Vinayaka R. Utilization of waste glass powder and waste glass sand in the production of Eco-Friendly concrete. Con. Build. Mat. 2023. [Google Scholar] [CrossRef]
  20. John Ayibatunimibofa TrustGod,; Akosubo Iwekumo Stevyn.; Ann Diri Manfred. The Use of Calcined Waste Glass Powder as aPozzolanic Material, EJERS, 2019, Vol. 4, No. 12. [CrossRef]
  21. The Use of Calcined Waste Glass Powder as a Pozzolanic Material. Available from: https://www.researchgate. 21 May 3614.
  22. Raza, A. 2022; 10. [CrossRef]
  23. Lomesh, M.; Sariputt, R.B. R: Utilization of Pozzolanic Material and Waste Glass Powder in Concrete, 2022,, In book, 2022. [CrossRef]
  24. Zuheir, W.; Khalid, R.; Naji, N.; Mohammed, S. 2023. [CrossRef]
  25. Mohammed Maher Yaseen; Sheelan Hama; Akram S. Mahmoud. 1: Shear behavior of reinforced concrete beams incorporating waste glass powder as partial replacement of cement, European Journal of Environmental and Civil Engineering, 2022, 27(1), 2022; -16. [CrossRef]
  26. Manikandan, P.; Vasugi, V. The potential use of waste glass powder in slag based geopolymer concrete-An environmental friendly material. 2023. [Google Scholar] [CrossRef]
  27. Mohammad Mukhlis Behsoodi; Shafiullah Miakhil; Mohammad Mukhlis Behsoodi. Waste Glass Powder “An Alternative of Cement in Concrete” -A Review. IJCSRR 2022, ISSN: 2581-8341, Volume 05 Issue 07, page No. 2541. [CrossRef]
  28. Bompa, D.V.; Xu, B.; Corbu, O. 2022. [CrossRef]
  29. Ali Hassan Shalan; Mohamed M El-Gohary. Long-Term Sulfate Resistance of Blended Cement Concrete with Waste Glass Powder. 2022. [CrossRef]
  30. Sanni, S.H.; Hiremath, G.S.; Kambali, S.A.; Chavan, A.A. The Effect of Partial Replacement of Cement by Waste Green Glass Powder with Waste Plastic as Coarse Aggregate, i-manager’s Journal on Structural Engineering, 2022, 11(2), 1-6. [CrossRef]
  31. Muhammad Israr Pashtoon; Shafiullah Miakhil; Mohammad Mukhlis Behsoodi. Waste Glass Powder “An Alternative of Cement in Concrete”: A Review, IJCSRR, 2022, 5(7), 2541-2549. [CrossRef]
  32. Federico, M.; Chidiac, S.E. ; Waste glass as a supplementary cementitious material in concrete – Critical review of treatment methods. Cem. Concr. Compos., 2009, 31(8), 606–610. [CrossRef]
  33. Hogland, J.; Hogland, W. Waste glass in the production of cement and concrete – A review. J. Environ. Chem. Eng., 2014, 2(3), 1767–1775. [CrossRef]
  34. Zheng, S.; Zheng, K. A review on the use of waste glasses in the production of cement and concrete, Resour. Conserv. Recycl. 2007, 52(2), 234–247. [Google Scholar] [CrossRef]
  35. Abendeh, R.M.; AbuSalem, Z.T.; Bani Baker, M.I.; Khedaywi, T.S. Concrete containing recycled waste glass: strength and resistance to freeze–thaw action. Proceedings of the Institution of Civil Engineers – Construction Materials 2021, 174(2), 75-87. [CrossRef]
  36. Hornea, L.; Gorea, M.; Har, N. Study of (Pb, Ba) - CRT glass waste be-haviour as a partial aggregate replacement in cement mortars. Studia UBB Chemia 2017, Tom II, 343–356. [Google Scholar] [CrossRef]
  37. İlker Bekir Topçu.; Hasan Selim Şengel. Properties of concretes produced with waste concrete aggregate. Cem. Con. Res. 2004, 34(8), 1307-1312. [CrossRef]
  38. NE 014 The norm for the execution of cement concrete road pavements in a fixed and sliding formwork system. Matrix Romania, Bucharest 2002, ISBN 978-973-755-185-6, 2007.
  39. SR EN 206 Concrete - Specification, performance, production and conformity. 2014.
  40. Poteras, G. Reciclarea Materialelor Provenite Din Demolări și Dezafectări (Recycling Materials resulting from demolition and decommissioning). Revista Salubritatea 2006, 1(17)).
  41. Roy, S.; Ahmad, S.I.; Rahman, M.S.; Salauddin, M. Experimental investigation on the influence of induction furnace slag on the fundamental and durability properties of virgin and recycled brick aggregate concrete. R. in Eng., 2023, 17, 100832. [CrossRef]
  42. Tobo, H.; Miyamoto, Y.; Watanabe, K.; Kuwayama, M.; Ozawa, T.; Tanaka, T. Solidification conditions to reduce porosity of air-cooled blast furnace slag for coarse aggregate. Jurnal of the Iron and Steel Institute of Japan, 2013, 99(8), 532-541. [CrossRef]
  43. Verian, K.P.; Panchmatia, P.; Olek, J.; Nantung, T. Pavement concrete with air-cooled blast furnace slag and dolomite as coarse aggregates: Effects of deicers and freeze-thaw cycles. TRR 2015, 2508(1), 55–64. [Google Scholar] [CrossRef]
  44. Ta, Y.; Tobo, H.; Watanabe, K. Development of manufacturing process for blast furnace slag coarse aggregate with low water absorption, JFE Technical Report 2018, 23, 97-101.
  45. SR EN 933-1, Tests for geometrical properties of aggregates - Part 1: Determination of particle size distribution - Sieving method, ASRO Bucharest, 2012.
  46. SR EN 1097-6 Tests for mechanical and physical properties of aggregates. Part 6 Determination of particle density and water absorption, ASRO Bucharest, 2013.
  47. SR EN 1097-2 Tests for mechanical and physical properties of aggregates.. Part 2: Methods for the determination of resistance to fragmentation, ASRO Bucharest, 2010.
  48. SR EN 1097-1 Tests for mechanical and physical properties of aggregates. Part 1: Determination of the resistance to wear (micro-Deval), ASRO Bucharest, 2011.
  49. SR EN 933-3 Tests for geometrical properties of aggregates. Part 3: Determination of particle shape – Flakiness Index, ASRO Bucharest, 2012.
  50. SR EN 197-1 Standard Cement- Part 1: Composition, specification, and conformity criteria common cements; ASRO Bucharest, 2011.
  51. SR EN 196-1:2005 Methods of testing cement - Part 1: Determination of strength, ASRO Bucharest, 2005.
  52. SR EN 196-2:2014 Method of testing cement - Part 2: Chemical analysis of cement Métodos de ensayo de cementos, ASRO Bucharest, 2014.
  53. SR EN 196-3:2016 Methods of testing cement - Part 3: Determination of setting times and soundness, ASRO Bucharest, 2016.
  54. Corbu, O.; Ioani, A.M.; Abdullah, M.M.A.B.; Meiţă, V.; Szilagyi, H.; Sandu, A.V. “The pozzolanic activity level of powder waste glass in comparisons with other powders.” KEM 2015, 660, 237–243. [CrossRef]
  55. Taha, B.; Nounu, G. “Properties of concrete contains mixed colour waste recycled glass as sand and cement replacement.” Con. Build. Mat. 2008, 22 (5), 713–720. [CrossRef]
  56. Vafaei, M. ; Allahverdi. A. High strength geopolymer binder based on waste-glass powder.” Adv. Powder Technol. 2017, 28(1), 215–222. [CrossRef]
  57. Manoj Kumar Meena, Jagriti Gupta, Bharat Nagar. “PERFORMANCE OF CONCRETE BY USING GLASS POWDER” An Experimental Study. IRJET 2018, 5(9). www.irjet.
  58. Corbu, O.; Bompa, D.V.; Szilagyi, H. Eco-efficient cementitious composites with large amounts of waste glass and plastic. Proc.Inst. Civ. Eng.-Eng. Sustain. 2021, 175(2), 64–74. [CrossRef]
  59. Mohammed, A. Mansour, Mohd Hanif Bin Ismail, Qadir Bux alias Imran Latif, Abdullah Faisal Alshalif, Abdalrhman Milad, Walid Abdullah Al Bargi, A Systematic Review of the Concrete Durability Incorporating, Recycled Glass, Sustainability 2023, 15(4), 3568. [CrossRef]
  60. Available online: http://en.wikipedia.org/wiki/Pozzolanic_activity (accessed on 20 April 2023).
  61. ASTM C618, Standard Specification for Coal Fly Ash and Raw or Calcined Natural Pozzolan for Use in Concrete.
  62. Jercan, S. Concrete Roads. Corvin Publishing House, Deva, Romania: 2002.
  63. Raki, L.; Beaudoin, J.; Alizadeh, R.; Makar, J.; Sato, T. Cement and concrete nanoscience and nanotechnology. Materials 2010, 3(2), 918–942. [Google Scholar] [CrossRef]
  64. Shayan, A. ; Value-added Utilisation of Waste Glass in Concrete, IABSE SYMPOSIUM MEL-BOURNE 2002, Cem. Conc. Res. [CrossRef]
  65. Ismail Khairul, Nizar.; Mustafa Al Bakri, A.M. Ismail Khairul Nizar.; Mustafa Al Bakri, A.M.; Rafiza Abd Razak.; Hussin Kamarudin.; Alida Abdullah.; Yahya Zarina. Study on Physical and Chemical Properties of Fly Ash from Different Area in Malaysia. KEM 2014, 594-595, 985-989. [CrossRef]
  66. Dai, J.; Wang, Q.; Xie, C.; Xue, Y.; Duan, Y.; Cui, X. The Effect of Fineness on the Hydration Activity Index of Ground Granulated Blast Furnace Slag. Materials 2019, 12(18), 2984. [Google Scholar] [CrossRef] [PubMed]
  67. Liu, S.; Li, L. Influence of fineness on the cementitious properties of steel slag. J. Therm. Anal. Calorim. 2014, 117, 629–63. [Google Scholar] [CrossRef]
  68. [68] Matos, A.M.; Sousa-Coutinho, J. Waste glass powder in cement: macro and micro scale study. JACR 2016, 28(7), 423–432. [Google Scholar] [CrossRef]
  69. Bompa, D.V.; Xu, B.; Corbu, O. Evaluation of One-Part Slag–Fly-Ash Alkali-Activated Mortars Incorporating Waste Glass Powder. Journal of ASCE 2022, 34(12). [CrossRef]
  70. https://www.ct.upt.ro/studenti/cursuri/lucaci/Imbr_rutiere_rigide. 2023.
  71. SR EN 1008 Mixing water for concrete.; ASRO Bucharest, 2003.
  72. SR EN 934-2+A1 Concrete admixtures; ASRO Bucharest, 2012.
  73. SR EN 12620+A1 Aggregates for concrete; ASRO Bucharest, 2008.
  74. SR 667 Natural aggregates and processed stone for roads; ASRO Bucharest, 2001.
  75. Yadav, S.R. 2009.
  76. Hansen, T.D.; Narud, H. Strength of recycled concrete made from crushed concrete coarse aggregate. ACI Conc. Int., Design and Construction 1983, 5(1), 79-83. https://www.concrete.org/publications/internationalconcreteabstractsportal.aspx? 9140. [Google Scholar]
  77. SR EN 12350-2 Testing fresh concrete - Part 2. Slump-test, ASRO Bucharest, 2009.
  78. SR EN 12350-6 Testing fresh concrete - Part 6. Density ASRO Bucharest, 2009.
  79. SR EN 12350-7 Testing fresh concrete - Part 7. Air content - Pressure methods, ASRO Bucharest, 2009.
  80. SR EN 12390-5 Test on hardened concrete. Part 5. Bending tensile strength of specimens.; ASRO Bucharest, 2009.
  81. SR EN 12390-3 Standard for test-hardened concrete - Part 3. Compressive strength of test specimens; ASRO Bucharest, 2009.
  82. SR EN 12390-6 Testing hardened concrete - Part 6. Tensile splitting strength of test specimens, ASRO Bucharest, 2009.
  83. SR EN 12390-7Testing hardened concrete - Part 7. Density of hardened concrete, ASRO Bucharest, 2009.
  84. SR 3518 Tests on concrete. 2009.
  85. SR EN 1338 Concrete paving blocks – Requirements and test methods, ASRO Bucharest, 2004.
  86. SR EN 1339 Concrete paving flags.– Requirements and test methods, ASRO Bucharest, 2004.
  87. SR EN 1340 Concrete kerb units. – Requirements and test methods, ASRO Bucharest, 2004.
  88. SR CR 12793 Determination of the depth of the carbonation layer of hardened concrete; ASRO Bucharest, 2002.
  89. SR EN 12390-1 Testing hardened concrete - Part 1: Shape, dimensions and other requirements for specimens and moulds, ASRO Bucharest, 2012.
  90. Ahmad, J.; Tufail, R.F.; Aslam, F.; Mosavi, A.; Alyousef, R.; Javed, M.F.; Zaid, O.; Khan Niazi, M.S. A step towards sustainable self-compacting concrete by using partial substitution of wheat straw ash and bentonite clay instead of cement. Sustain 2021, 13, 1–17. [Google Scholar] [CrossRef]
  91. Hosseini, P.; Abolhasani, M.; Mirzaei, F.; Kouhi Anbaran, M.R.; Khaksari, Y.; Famili, H. Influence of two types of nanosilica hydrosols on short-term properties of sustainable white portland cement mortar. J. Mater. Civ. Eng. 2018, 30(2), 4017289. [Google Scholar] [CrossRef]
  92. Abendeh, R.M.; AbuSalem, Z.T.; Bani Baker, M.I.; Khedaywi, T.S. Concrete containing recycled waste glass: strength and resistance to freeze–thaw action. Proceedings of the JCOMA 2020, 174(2), 75–87. [Google Scholar] [CrossRef]
  93. Ismail, Z.Z.; Al-Hashmi, E.A. Recycling of waste glass as a partial replacement for fine aggregate in concrete. Was. Man. 2009, 29(2), 655–659. [Google Scholar] [CrossRef] [PubMed]
  94. NE 012 Normative for the production of concrete and the execution of works in concrete, reinforced concrete and prestressed concrete Part 1: Production of concrete; Ministry of Development, Public Works and Administration, 2004.
  95. fib-Bulletins N° 42. Constitutive modelling for high strength / high performance concrete.State-of-art report ( ISBN 978-2-88394-082-6, 08). https://www.afgc.asso.fr/app/uploads/2010/07/fib_Bull42_NMG. 20 January.
  96. Corbu, O.; Puskas, A.; Szilagyi, H. C16/20 concrete strength class design with recycled aggregates, JAES 2014, ISSN: 2247-3769 / e-ISSN: 2284-7197, 4 (17), 13-19.
  97. Mehta, P.K.; Monteiro, P.J.M. Concrete: microstructure, properties, and materials. 2014. [Google Scholar]
  98. Jain, S.; Santhanam, M.; Rakesh, S.; Kumar, A.; Gupta, A.K.; Kumar, R.; Sen, S.; Ramna, R. V. Utilization of Air-Cooled Blast Furnace Slag As a 100 % Replacement of River Sand in Mortar and Concrete. Indian Concr. J. 2022, 96, 6–21. [Google Scholar]
  99. Ionescu;T.Ispas The properties and technology of concrete. In Bucharest technical publishing house, Romania, Bucharest, 1997.
  100. Ahmad, J.; Aslam, F.; Martinez-Garcia, R.; de-Prado-Gil, J.; Qaidi, S.M.A.; Brahmia, A. Effects of waste glass and waste marble on mechanical and durability performance of concrete. 2021. [Google Scholar] [CrossRef]
  101. Pimienta, P.; Albert, B.; Huetb, B.; Dierkens, M.; Francisco, P.; Rougeaud, P. Durability performance assessment of non-standard cementitious materials for buildings: A general method applied to the French context. Fact sheet 1—Risk of steel corrosion induced by carbonation. RILEM Tech. Lett. 2016, 1, 102–108. [CrossRef]
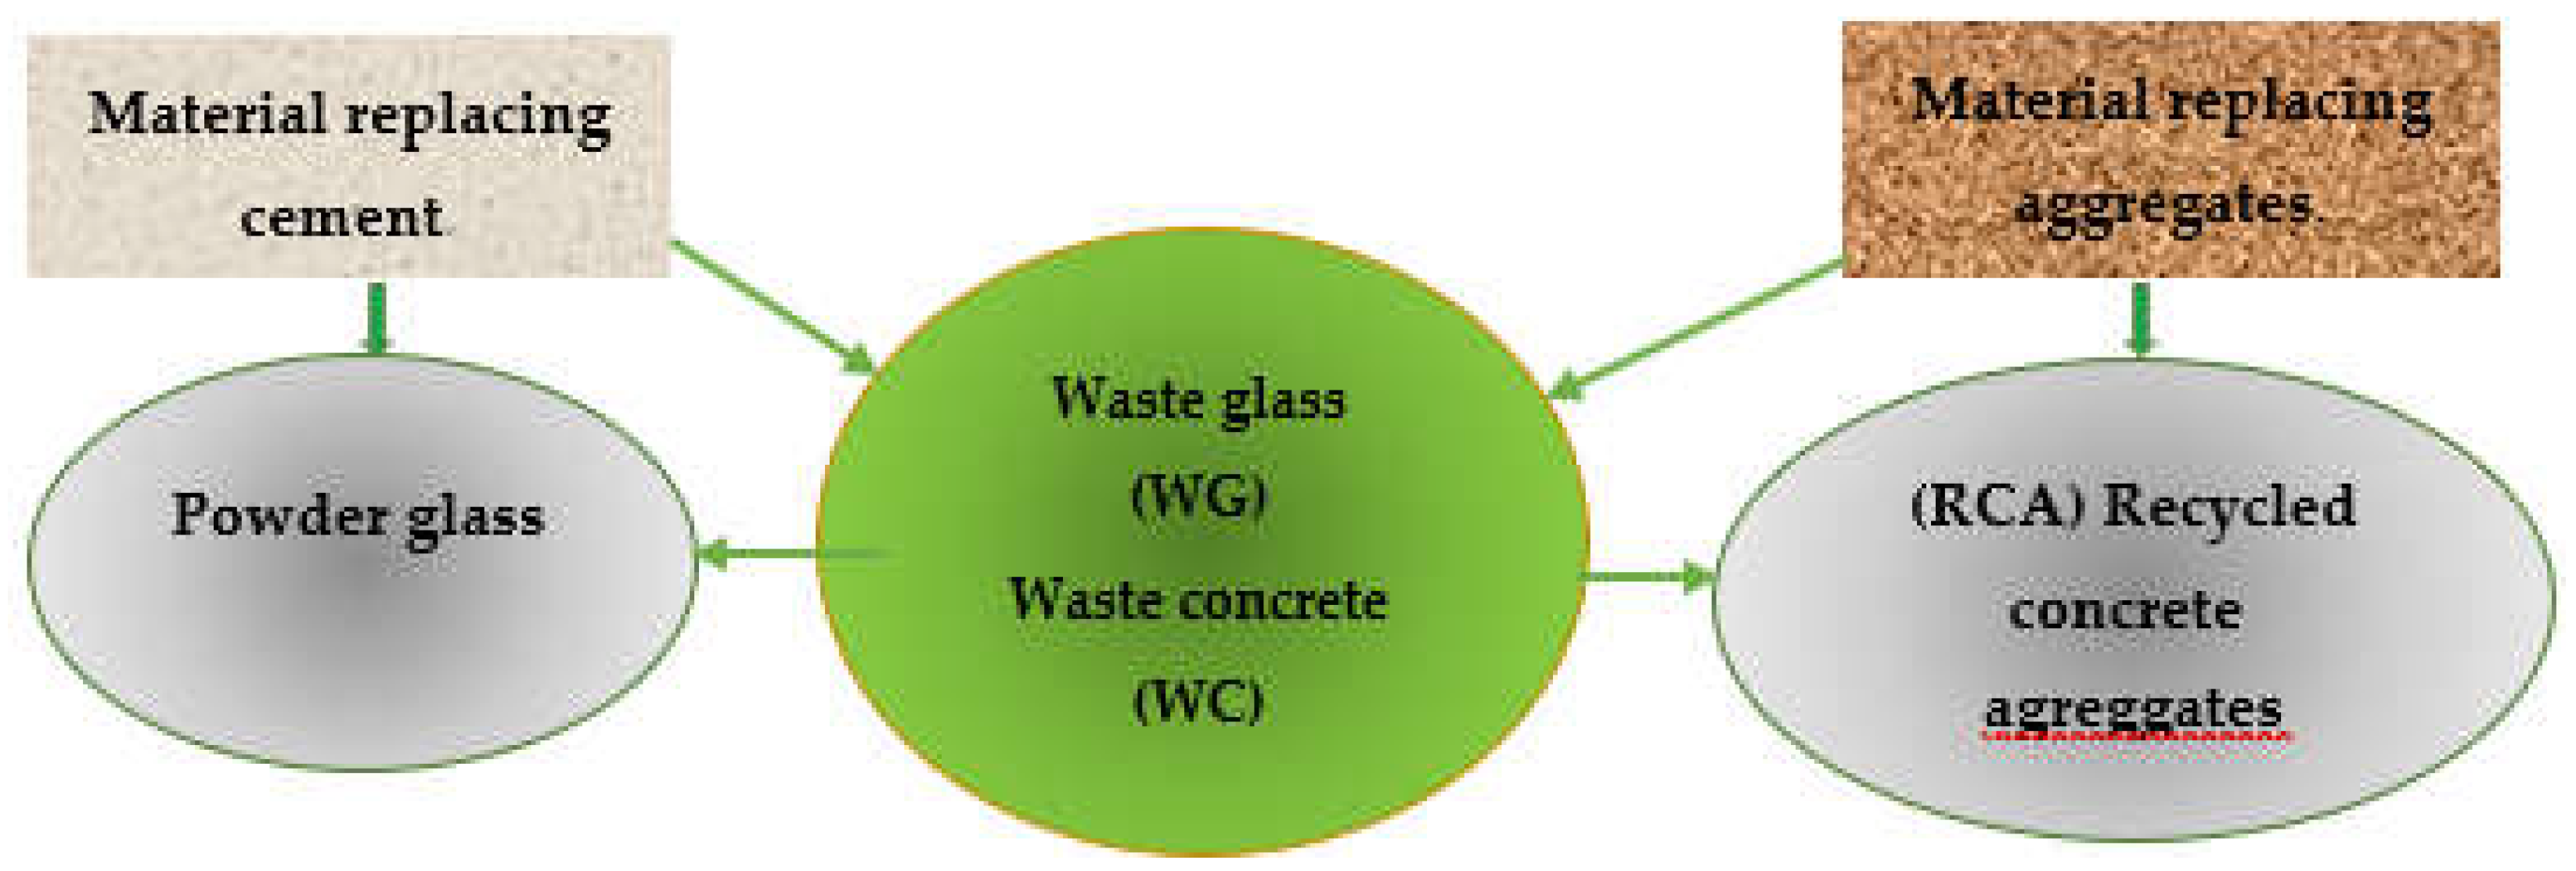
Figure 1. Diagram of raw material substitution.
Preprints 82784 g001
Figure 2. The appearance of the 4/8 aggregate used in RCA mixtures.
Preprints 82784 g002
Figure 3. SEM Microstructures of the mixes: (a) CEM_M Control; (b) CEM-10%WGP1; (c) CEM-20%WGP2 [54].
Preprints 82784 g003
Figure 4. Graphical representation for compressive strength of mixtures of study (Corbu 2015) [54].
Preprints 82784 g004
Figure 5. XRD pattern of the glass waste (a) and cement CEM I 42.5 R (b) [69].
Preprints 82784 g005
Figure 6. The total gradation curve for the control recipe of road concrete (BcR) in Var. I.
Preprints 82784 g006
Figure 7. Schematic representation of force positioning and action: (a) compression test, (b) bending test, (c) splitting test [58], and corresponding determinations: (df) in the laboratory.
Preprints 82784 g007aPreprints 82784 g007b
Figure 8. The Böhme equipment (a), the track sprinkled with standard abrasive material (b), and the positioning slot for the cubic specimen.
Preprints 82784 g008
Figure 9. The appearance of the specimens after spraying with phenolphthalein (a) BcR-NA; (b) BcR-RCA; (c) BcR-RCA-WGP-10%; (d) BcR-RCA-WGP-20%. .
Preprints 82784 g009
Figure 10. Microscopic image of the sample BcR-NA at crossed pollars with porphyroclastic texture and rounded pore into the matrix. The diameter of the pore is 0.184 mm. Qzt–quartzite, CSH-hydrated calcium silicates, CAH- hydrated aluminium silicates.
Preprints 82784 g010
Figure 11. Microscopic image of the sample BcR-RCA-10%WPG at crossed pollars with porphyroclastic texture and pores (P) into the matrix. Qzt–quartzite, CSH-hydrated calcium silicates, CAH- hydrated aluminium silicates. The scale bar id 1 mm.
Preprints 82784 g011
Figure 12. Microscopic image of the sample BcR-NA at crossed pollars showing porphyritic texture with aggregates embedded into a microcrystalline matrix (M), Agregates are consisting of dacite, quartzite (Qzt), crystalline schists (Sch), pyroxene (Pyr), quartz (Qz) and chlorite (Chl). The scale bar is 1 mm.
Preprints 82784 g012
Figure 13. Microscopic image of the sample BcR-NA at parallel pollars showing porphyritic texture aggregates embedded into a microcrystalline matrix (M), Agregates are consisting of dacite, quartzite (Qzt), crystalline schists (Sch), pyroxene (Pyr), quartz (Qz) and chlorite (Chl). The scale bar is 1 mm.
Preprints 82784 g013
Figure 14. Detalied microscopic image of the sample BcR-NA at crossed pollars with the matrix of concrete/mortar consisting of very fine crystallized mixture of hydrated calcium silicates (CSH), hydrated aluminium silicates (CAH) calcite (Cal), portlandite (Prt). Chl- chlorite, Qz – quartz. The scale bar is 0.100 mm.
Preprints 82784 g014
Figure 15. Microscopic image of the sample BcR-NA at crossed pollars with newly formed hydrated calcium silicates (CSH) and hydrated aluminium silicates (CAH) developed as coronas on the quartzite aggregate which represents the crystallization support. The scale bar is 1 mm.
Preprints 82784 g015
Figure 16. Microscopic image of the sample BcR-RCA-10%WGP at crossed pollars with porphyroclastic texture. The clasts consist of dacite, quartzite (Qzt), fragments of quartz etc. embedded into the matrix black in color. The scale bar is 1 mm.
Preprints 82784 g016
Figure 17. Microscopic image of the sample BcR-RCA-10%WGP at crossed pollars with porphyroclastic texture. The clasts consist of recycled concrete (RCA), quartzite (Qzt), fragments of quartz etc. embedded into the matrix black in color. The scale bar is 1 mm.
Preprints 82784 g017
Figure 18. Detalies microscopic image of the sample BcR-RCA-10%WGP at crossed pollars with aggregated of dacite and quartz, fragments of muscovite embedded into the black matrix with newly formed portlandite. The scale bar is 1 mm.
Preprints 82784 g018
Figure 19. Detalies microscopic image of the sample BcR-RCA-10%WGP at parallel pollars with aggregated of dacite and quartz, fragments of muscovite embedded into the black matrix with newly formed portlandite. The scale bar is 1 mm.
Preprints 82784 g019
Figure 20. The X ray spectra of the sample BcR-NA with the typical line for quartz, muscovite, calcite, albite, clonochlore, gypsum, portlandite and orthoclase.
Preprints 82784 g020
Figure 21. The X ray spectra of the sample BcR-NA collected between 3.8÷20-degree 2 theta with the typical line for muscovite, clino-chlore, portlandite, schorl, CSH and ASH.
Preprints 82784 g021
Figure 22. The X ray spectra of the sample BcR-RCA-10%WGP with the typical line for quartz, muscovite, calcite, plagioclase feldspar (anothite), clinochlore, gypsum and portlandite.
Preprints 82784 g022
Figure 23. The X ray spectra of the sample BcR-RCA-10%WGP collected between 3.8÷20-degree 2 theta with the typical line for muscovite, clinochlore, portlandite and gypsum.
Preprints 82784 g023
Figure 24. Fresh BcR composites properties: (a) Densitatea aparentă; (b) Consistența; (c) Conținut de Aer oclus.
Preprints 82784 g024
Figure 25. Hard BcR composites properties Var. I and Var. II; (a) Flexural Strength Var. I and Var. II; (b) Compressive Strength; (c) Loss of Strength after 100 Freeze-Thaw Cycles; (d) Volume Loss in Böhme Abrasion.
Preprints 82784 g025aPreprints 82784 g025b
Table 1. Types of aggregates used in the design of road concrete.
Size of aggregate [mm] Type of aggregate
0/4 Natural River Aggregate (NRA) for all mixes (gravel)
4/8 Crushed River Aggregates (CRA) (crushed gravel)
4/8 Recycled Concrete Aggregates (RCA)
8/16 mm, 16/25 Crushed aggregates / Chippings (CAC) for all mixes
Table 2. 0/4 mm Natural River Aggregate for all the mixes (NRA).
Aggregate Passes, in %, through the size sieve (mm):
0,125 0,250 0,500 1 2 4 8 16 31,5
0/4 mm 4.23 15.18 38.30 64.70 86.30 99.43 100 100 100
Table 3. 4/8 mm, 8/16 mm Crushed River Aggregates (CRA).
Aggregate Passes, in %, through the size sieve (mm):
0,125 0,250 0,500 1 2 4 8 16 31,5
4/8 mm 0.19 0.22 0.24 0.27 1.33 27.50 96.90 100 100
8/16 mm 0.05 0.06 0.06 0.07 0.07 0.09 1.76 94.62 100
Table 4. 4/8 mm, Recycled Concrete Aggregates (RCA).
Aggregate Passes, in %, through the size sieve (mm):
0,125 0,250 0,500 1 2 4 8 16 31,5
4/8 mm 0.02 0.02 0.03 0.03 0.04 0.12 79.90 100 100
Table 5. 8/16 mm, 16/25 mm Crushed aggregates/Chippings (CAC).
Aggregate Passes, in %, through the size sieve (mm):
0,125 0,250 0,500 1 2 4 8 16 25
8/16 mm 1.00 0.11 0.11 0.11 0.11 0.11 7.27 95.51 100
16/25mm 0.08 0.09 0.09 0.09 0.10 0.10 0.10 5.02 100
Table 6. Real volumetric mass and coefficient of water absorption of the aggregates.
Symbol_Sort agregat Characteristics of aggregates
(mm) ρa (mg/m3) ρrd (mg/m3) ρssd (mg/m3) WA24 (%)
NRA_0/4 2.700 2.570 2.630 3.00
RCA_4/8 2,703 2,320 2,462 6,00
CAC_8/16 2.650 2.560 2.610 1.40
CAC_16/25 2.670 2.590 2.620 1.20
Table 7. Los Angeles coefficient (LA) for the aggregates.
Symbol of aggregate Sorts of aggregates LAmed (%) Traffic class
RCA 4/8, mm 30,9 Reduced
CRA 4/8 mm 31,0 Reduced
CAC 8/16 mm 16,0 Intensive
CAC 16/25 mm 15,0 Intensive
Table 8. Micro-Deval (MDE) coefficient in presence of water for (RCA).
Symbol of aggregate Sorts of aggregates MDEmed (%) Traffic class
RCA 4/8 mm 20,8 Medium
CRA 4/8 mm 10,1 Intensive
CAC 8/16, 16/25 mm 14,0 Intensive
Table 9. Overall flattening coefficient (A) for (RCA) 4/8 mm.
Sorts/elementary aggregates di/Di The nominal opening of the grill slots, mm Ai M1 M2 A
4/8 mm 8/10 5 0 600 76 13
6.3/8 4 5
5/6.3 3.15 29
4/5 2.5 26
Table 10. Cement characteristics for CEM I 42, 5R.
Characteristics CEM I 42, 5R Value According to
Composition Clincher Portland (%) data data
Minor component (%) 95 ÷ 100 SR EN 197-1
Chemical Characteristics Sulphate content (in the form of SO, %) 0 ÷ 5 SR EN 197-1
Chloride content (%) < 4 SR EN 196-2
Loss of calcination (%) < 0,1 SR EN 196-2
Insoluble residue (%) < 5 SR EN 196-2
Physico-Mechanical Characteristics Setting time (min.) < 5 SR EN 196-2
Stability (mm) > 60 SR EN 196-3
Compressive strength at 2 days (MPa) < 10 SR EN 196-3
Compressive strength at 28 days (MPa) > 20 SR EN 196-1
Clincher Portland (%) > 42,5 < 62.5 SR EN 196-1
Table 11. XRF Analysis Result- Chemical composition (%) of the cement CEM I 42.5R and WGP/ Oxide content. /Chemical composition of Cement & Glass Waste Powder.
Oxides SiO2 K2O Fe2SiO3 CaO Al2O3 MgO Na2O Oder
CEM I 42.5R 14,30 1,08 3,70 71,46 2,90 0,86 5,70 -
WGP 77,70 1,01 0,44 13,6 0,06 0,01 5,27 1,92
Table 12. <0,125 mm Waste glass powder (WGP).
WGP Treceri, in %, prin sita de dimensiunea (mm):
0,63 0,125 0,250 0,500
< 0,125 mm 43,80 100,00 100 100
Table 13. Favorable behavior of the mineralogical component C3S of cement [70].
Properties Mechanical strength Shrinkage Abrasion resistance Freeze-Thaw resistance Modulus of elasticity Hydration rate
C3S Very high* Low Good Very good Very high Moderate
Table 14. Sorts of aggregates used in the layers of road clothing in accordance with [NE 014] [38].
Pavements realized Nature of Aggregates Sorts of Aggregates Gradation of Total Aggregates
Single layer Natural Sand 0/4
Two layers Crushed Gravel 4/8 0/25
Chipping 8/16
Wearing course Chipping 16/25
Table 15. The total gradation curves for the variant with natural aggregates and recycled aggregates.
Total gradation curves for the concrete mixtures Passing % through sieve with size [mm]
0,125 0,250 0,5 1 2 4 8 16 25
Concrete mixture with natural aggregates [38] 1.29 4.64 11.59 19.51 26.06 32.86 47.58 70.43 100
Concrete mixture with recycled aggregates 0.81 4.02 11.24 19.17 25.92 29.99 44.56 70.43 100
Lower limit 1,5 2 5 8 15 20 35 62 100
Upper limit 7,0 8,0 17,5 27 34 42 60 83 100
Table 16. Design parameters for road concrete BcR, impoed by NE 014 [38] norm.
Design parameters BcR4 Min. cement ratioCEM I 42,5 (w/c) Consistency Class S1 (mm) Air void content (%) Freeze-throw circles fc28 days MPa fct,fl 28 days MPa
NE 014 [38] andSR EN 206 [39] 330 kg/m3 max.0.45 10÷40 3.5+0.5 100 min. 35 max. 50 min.4 max.5
Table 17. The composition of the road concretes in Variant I (kg/m3).
Mix components for BcR-NA BcR-NA BcR-RCA BcR-RCA-WGP
Water/Cement ratio 0,45 0,45 0,45
Cement I 42,5R 330 330 297
DSP(WGP) < 0,125 mm – 10% - - 33
NRA – 0/4 mm 569 569 569
CRA – 4/8 mm 303 - -
RCA – 4/8 mm - 303 303
CAC – 8/16 mm 455 455 455
CAC – 16/25 mm 569 569 569
Admixture 1 (Master Glenium 115) – 1,80 % 5,94 5,94 5,94
Admixture 2 (MICROAir 107-2) - 0,25% 0,285 0,285 0,285
Table 18. Aggregate ratios for the control mixtures.
Aggregate proportions for the control mixtures BcR-NA Var. I BcR-NA Var. II
0/4 mm 30.0 % 32.0 %
4/8 mm 16.0 % 20.0 %
8/16 mm 24.0 % 18.0 %
16/25 mm 30.0 %; 30.0 %
Table 19. Fresh BcR composite properties.
Fresh property UM Performance level Mix design
BcR-NA/NA BcR-RCA BcR-RCA-WGP
Var. I Var. II Var. I Var. II 10% 20%
Temperature (T) °C 5÷30 23 22 22 21 23 22
Consistency (S) mm 10÷40 35 40 35 37 27 31
Apparent Density (ρ) Kg/m3 2400 2374 2370 2364 2352 2358 2347
Entrained Airfor Aggreg. dmax-25 mm % 3,5÷4,5 (+0,5) 4,0 4,2 3,7 3,9 3,8 4,2
Table 20. Hardened BcR composite properties.
Hard property UM Performance level Mix design
BcR-NA/NA BcR-RCA BcR-RCA-WGP
Var. I Var. II Var. I Var. II 10% 20%
Flexural strength (fct,fl) MPa 4.0÷5.0 6.7 5.4 5.6 5.5 5.4 4,3
Compressive strength (fc) MPa 35÷45 84.2 69.2 83.1 69.4 80 62.0
Splitting strength (fct,sp) MPa - 4.5 3.7 4.4 3,7 4.5 3,5
Density (ρa) Kg/m3 2400 + 40 2430 2417 2425 2410 2420 2406,6
Loss of strength (η) % < 25 14.11 16.8 14.60 17.6 16.0 20.2
Volume loss due to abrasion (η) ΔV/5000 mm2 ΔV ≤ 18 000 mm3 11301 9371 11500 9494 11220 9436
Depth of carbonation (dk) mm - 0.5 - 0.5 0.2 0.5
Table 21. BcR Classification Classes according to NE 014 Standard [38].
Hard property UM Performance level Mix design
BcR-NA BcR-RCA BcR-RCA-WGP
Var. I Var. II Var. I Var. II 10% 20%
Flexural Strength (fct,fl) MPa 4.0÷5.0 6.7 5.4 5.6 5.5 5.4 4,3
Compressive Strength (fc) MPa 35÷45 84.2 69.2 83.1 69.4 80.0 62.0
Loss of Strength (η) % 25 14.11 16.8 14.60 17.6 16.0 20.2
Achieved Strength Class BcR BcR4÷ BcR5 BcR 5 BcR 5 BcR 5 BcR 5 BcR 5 BcR 4
Table 22. Mathematical relation – comparison of European norms and national norms [96].
Source Mathematical relation (cylinders with H/ Φ- 300/150 or cube with l= 150 mm)
fib Bulletin 42 [95] fcm = fck + Δf, Δf = 8 MPa
NE 012-1: 2022 [94] fcm = fck + (6 ÷ 12) MPa
Table 23. Coefficients of variation of the properties of interest of road concrete composites.
Mix fct,fl Cv1 Cv2 fc Cv1 Cv2 η Cv1 Cv2 ΔV Cv1 Cv2
Var. I MPa MPa % /5000 mm2
BcR-NA 6.7 0.75 84.2 0.65 14.11 1.77 11301 1.59
BcR-RCA 5.6 1.20 0.89 83.1 1.01 0.66 14.60 0.97 1.71 11500 0.98 1.57
BcR-RCA-10%WGP 5.4 1.24 0.93 80.0 1.05 0.69 16.00 0.88 1.56 11220 1.01 1.60
Var. II
BcR-NA 5.4 0.93 69.2 0.79 16.80 1.49 9371 1.92
BcR-RCA 5.5 0.98 0.91 69.4 0.997 0.79 17.60 0.95 1.42 9494 0.98 1.90
BcR-RCA-20%WGP 4.3 1.26 0.93 62.0 1.12 0.89 20.20 0.83 1.24 9436 0.99 1.91
Var. I & II
BcR-NA 6.7 84.2 14.11 11301
5.4 1.24 69.2 1.22 16.80 0.84 9371 1.21
BcR-RCA 5.6 83.1 14.60 11500
5.5 1.02 69.4 1.20 17.60 0.83 9494 1.21
BcR-RCA-WGP 5.4 80.0 16.00 11220
4.3 1.26 62.0 1.29 20.20 0.79 9436 1.19
Disclaimer/Publisher’s Note: The statements, opinions and data contained in all publications are solely those of the individual author(s) and contributor(s) and not of MDPI and/or the editor(s). MDPI and/or the editor(s) disclaim responsibility for any injury to people or property resulting from any ideas, methods, instructions or products referred to in the content.
Copyright: This open access article is published under a Creative Commons CC BY 4.0 license, which permit the free download, distribution, and reuse, provided that the author and preprint are cited in any reuse.
Prerpints.org logo

Preprints.org is a free preprint server supported by MDPI in Basel, Switzerland.

Subscribe

© 2024 MDPI (Basel, Switzerland) unless otherwise stated