1. Introduction
There is a growing interest in the scientific community in immunoglobulin Y, found in large amounts in the egg yolk of immunized laying hens, for diagnostic and therapeutic purposes and in the most diverse applications. Egg yolk antibodies have no interactions with rheumatoid factors in serum of mammalians, and does not bind to protein A and G, to mammalian Fc receptors and mammalian complement (Larsson and Sjonquist, 1990). The use of IgY is attractive also for large amount found in egg yolk from immunized laying hens compared from serum of rats, rabbits, goats or sheep. Furthermore, the step of blood collecting can be replaced by egg collection and IgY extraction from egg yolk. The use and misuse of in-feed antibiotics has led to problems with drug residues in animal products and increased bacterial resistance, and in recent years the IgY have attracted considerable attention as an alternative to antibiotics to maintain animal health and performance. Oral administration of IgY as antibiotic alternative or for microbiome modulation, mostly in the polyclonal antibody (pAb) format, do not require IgY purification for large-scale production, and most current work use polyethylene glycol as PEG6000 for the precipitation and supernatants, which usually result in protein impurities and high level of biotin in the samples (Amro et al., 2018). Antibodies against Streptococcus equinus, Lactobacillus spp, Fusobacterium necrophorum, Escherichia coli, Clostridium aminophilum and sticklandii, Peptostreptococcus, Samonella enteridis, Samonella typhimurium, rotavirus, porcine transmissible gastroenteritis virus, porcine epidemic diarrhea virus, yeasts and more, have been studied (Balieiro et al. 2017; Blanch et al. 2009, Pacheco, et al 2012; Rodrigues et al., 2013, Li et al. 2015). However, when the IgY does not need to be purified prior assay, yet still delivers high sensitivity and specificity, is important to consider the high level of biotin in the egg yolk of 988 to 1050 ng/g according to Pennington (1989) and Meslar et al. (1978), respectively. All immunoassays that use streptavidin–biotin binding as part of the assay reaction are thought to be susceptible to interference from excess biotin in samples (Avery, 2019). Even for human-being diagnostics, laboratories using signal amplification through biotin-streptavidin interaction, are subject to misdiagnosis changed up or down due to biotin interference due the excessive biotin consumption (Liu D. et al, 2022; Kabiri P. et al., 2021). Approximately 85% of chemiluminescence immunoassay is based on biotin-avidin/streptavidin and are used by more than two-thirds of the laboratories in China (Ostrowska et al., 2019; Mrosewski et al., 2020). This study aimed to evaluate the biotin influence on Immunoglobulin Y quantification in egg yolk freeze dried no purified samples produced by antigen inoculated hens, through assays using biotin-avidin/streptavidin.
2. Materials and Methods
2.1. Antigen
The Streptococcus equinus was used as antigen to produce yolk antibodies. The stock culture was thawed and grown in blood plates for 24–48 hours at 38°C under semi-anaerobic conditions. Colonies were collected by scratching and aseptically transferring to a broth tube with 2,5 mL of culture media. Turbidity was checked and compared to the McFarland standards to obtain a final density of 5 × 10⁹ cells/mL and then transferred to Erlenmeyer of 50 mL of culture media, when the culture achieve turbidity at 0.5 McFarland it was transferred to Erlenmeyer with 150 mL of culture media with CO2, which was sealed and incubated for 48h at 38oC. The homogenized content of Erlenmyer was filtered through 4 layers of cheesecloth, then the solid into filter was washed with of 0.9% saline solution and total filtered was transferred to centrifuge containers. The containers with the filtrate was balanced in pairs and centrifuged at 1,000 × g for 10 min at 4°C. The supernatant was discarded and the precipitated was resuspended in 150 mL of McDougall's solution. The content was distributed in centrifuge containers and centrifuged at 11,250 g 20 min at 4°C. The supernatant from the 2nd centrifugation was discarded and the precipitate was transferred to a single container, using spatulas and as little deionized water as possible to obtain the final pellet of bacteria. The pellet of bacteria was resuspended in PBS pH 7.4 until 5.3 × 10⁸ colony-forming units/mL of S. equinus, turbidity at 0.5 McFarland. In this solution was added 4% of the formaldehyde solution (18.5%) and then 30% of Inject Alum adjuvant (TermoFisher Scientific, 77161). As control, was prepared other solution with the same amounts of PBS, formaldehyde and adjuvant, without pellet of bacteria. For adsorption of antigen, the adjuvant was added slowly and gradually, followed by 4 hours of constant agitation. These inductors of immunologic response were transferred to sterile serum bottles, capped, and stored at 4°C until further use.
2.2. Samples preparation
25-weeks-old white Leghorn hens were divided in two groups. Five hundred microliters of solution, with antigen or not, were deeply inoculated in the pectoral muscles each 14 days during 56 days in each group. Eggs were collected weekly, broken, and the shell, yolk, and egg white were separated. The yolk was subjected to freeze drying and delipidation according to Akita & Nakai (1993), just concentrating IgY and biotin in aqueous protein fraction. One gram of lyophilized yolk sample was weighted in 15 mL Falcon tube and 6 mL of PBS and 0.210 g of PEG6000 was added. Subsequently the total volume was shake per 1 min in vortex and then was incubated at 4oC in shake per 10 min. After that, all volume was centrifuged twice at 4oC, 10.000 rpm per 20 minutes. These procedures separated fractions, the precipitated consist of solids and fat, one fraction of yellow fat float above the supernatant, the transparent supernatant on the middle contain biotin and proteins. After the first centrifugation the supernatant containing protein and biotin was separated from solid and fat, and after second centrifugation the supernatant was collected by needle and syringe. The protein fraction was filtered using a funnel and paper filter about 40 microns, to remove the suspended insoluble solid residue particles and yellow fat from solutions and to clarified sample for analysis of IgY and biotin by ELISA test procedure ‘IDK Biotin ELISA’, manufactured by Immunodiagnostik AG.
2.3. Immunoassays procedures
To evaluate the interference of biotin in the detection of IgY, two commercial ELISA kits and two non-commercial plates, specific for this study, were used. In the ELISA kit IgY-Chicken ECH0032 from FineTest, the capture antibody was pre-coated onto 96- well plates and the biotin conjugated antibody was used as detection antibodies. The standards, test samples and biotin conjugated detection antibody were added to the wells subsequently and washed with wash buffer. Then HRP-Streptavidin was added and unbound conjugates were washed away.
To compare the results of IgY concentration without signal amplification through the interaction of biotin with streptavidin, was used ELISA kit IgY-Chicken IRKTAH1109-19371 from Innovative Research Incorporation, according to the manufacture instruction manual. In IRKTAH1109-19371 assay the IgY present in samples also reacts with the anti-IgY antibodies which have been adsorbed to the surface of polystyrene microtiter wells, however, after the removal of unbound proteins by washing, anti-IgY antibodies conjugated with horseradish peroxidase (HRP) were added and these enzyme-labeled antibodies from complexes with the previously bound IgY, following another washing step.
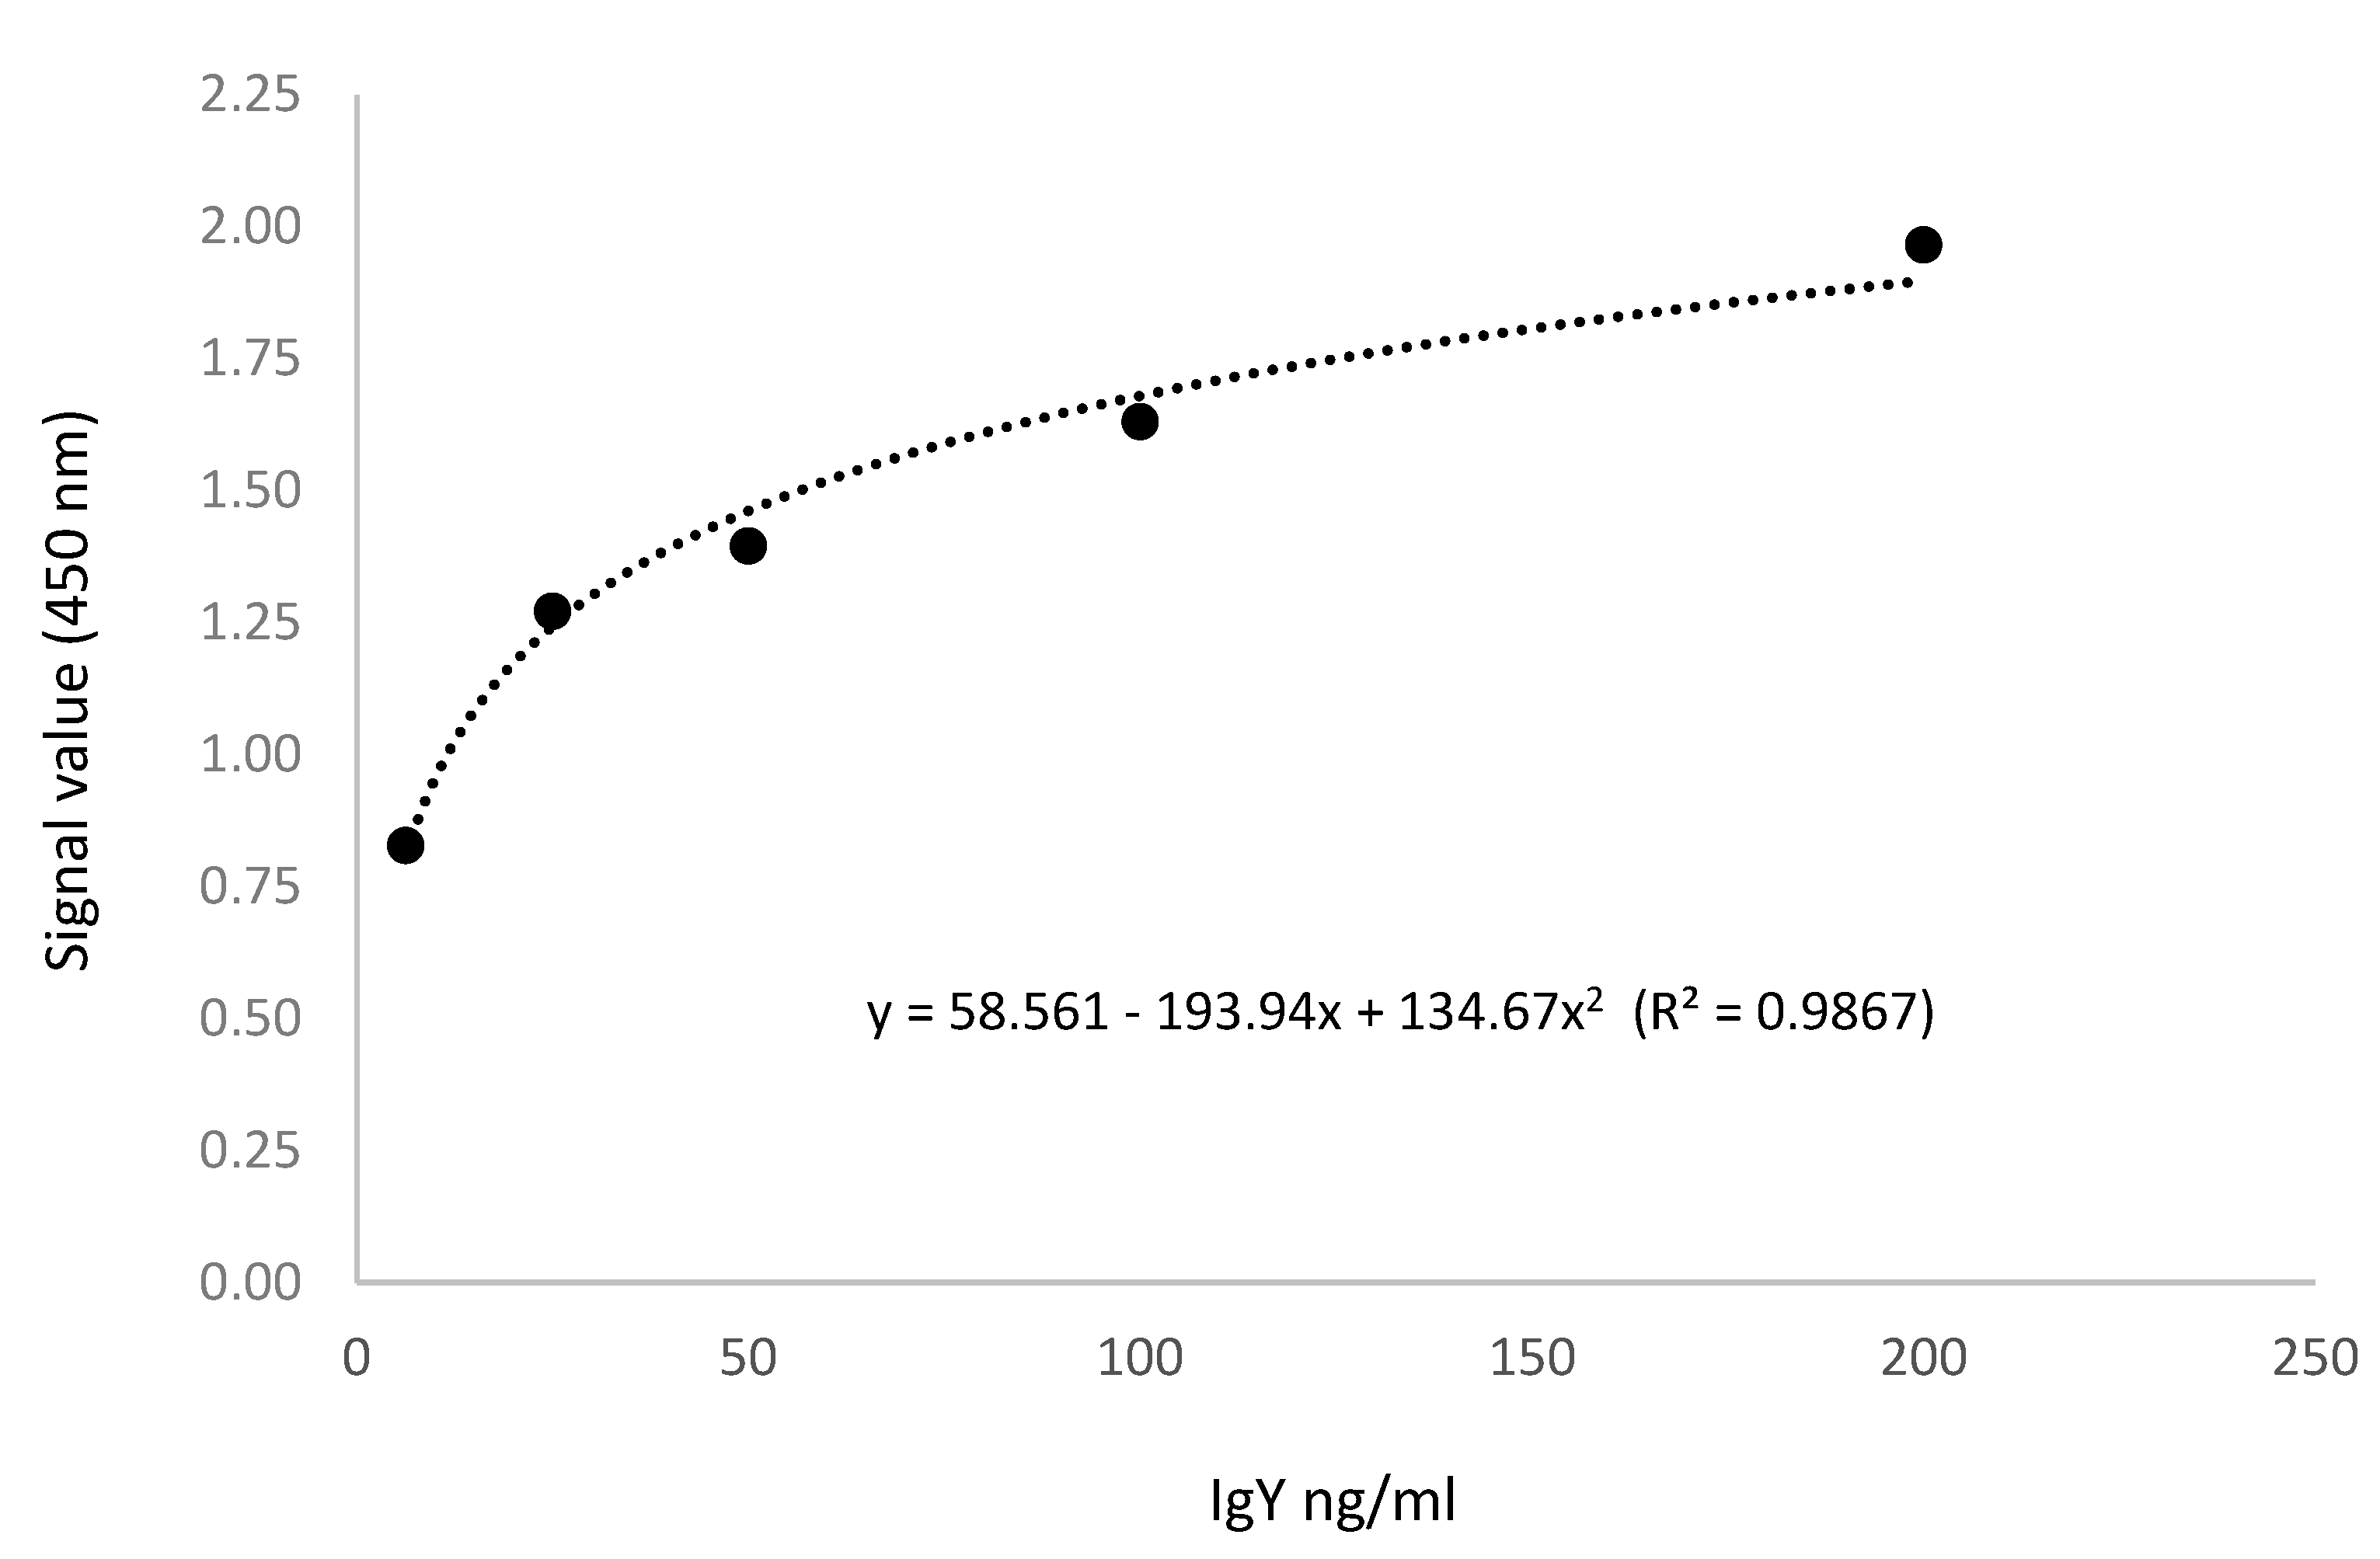
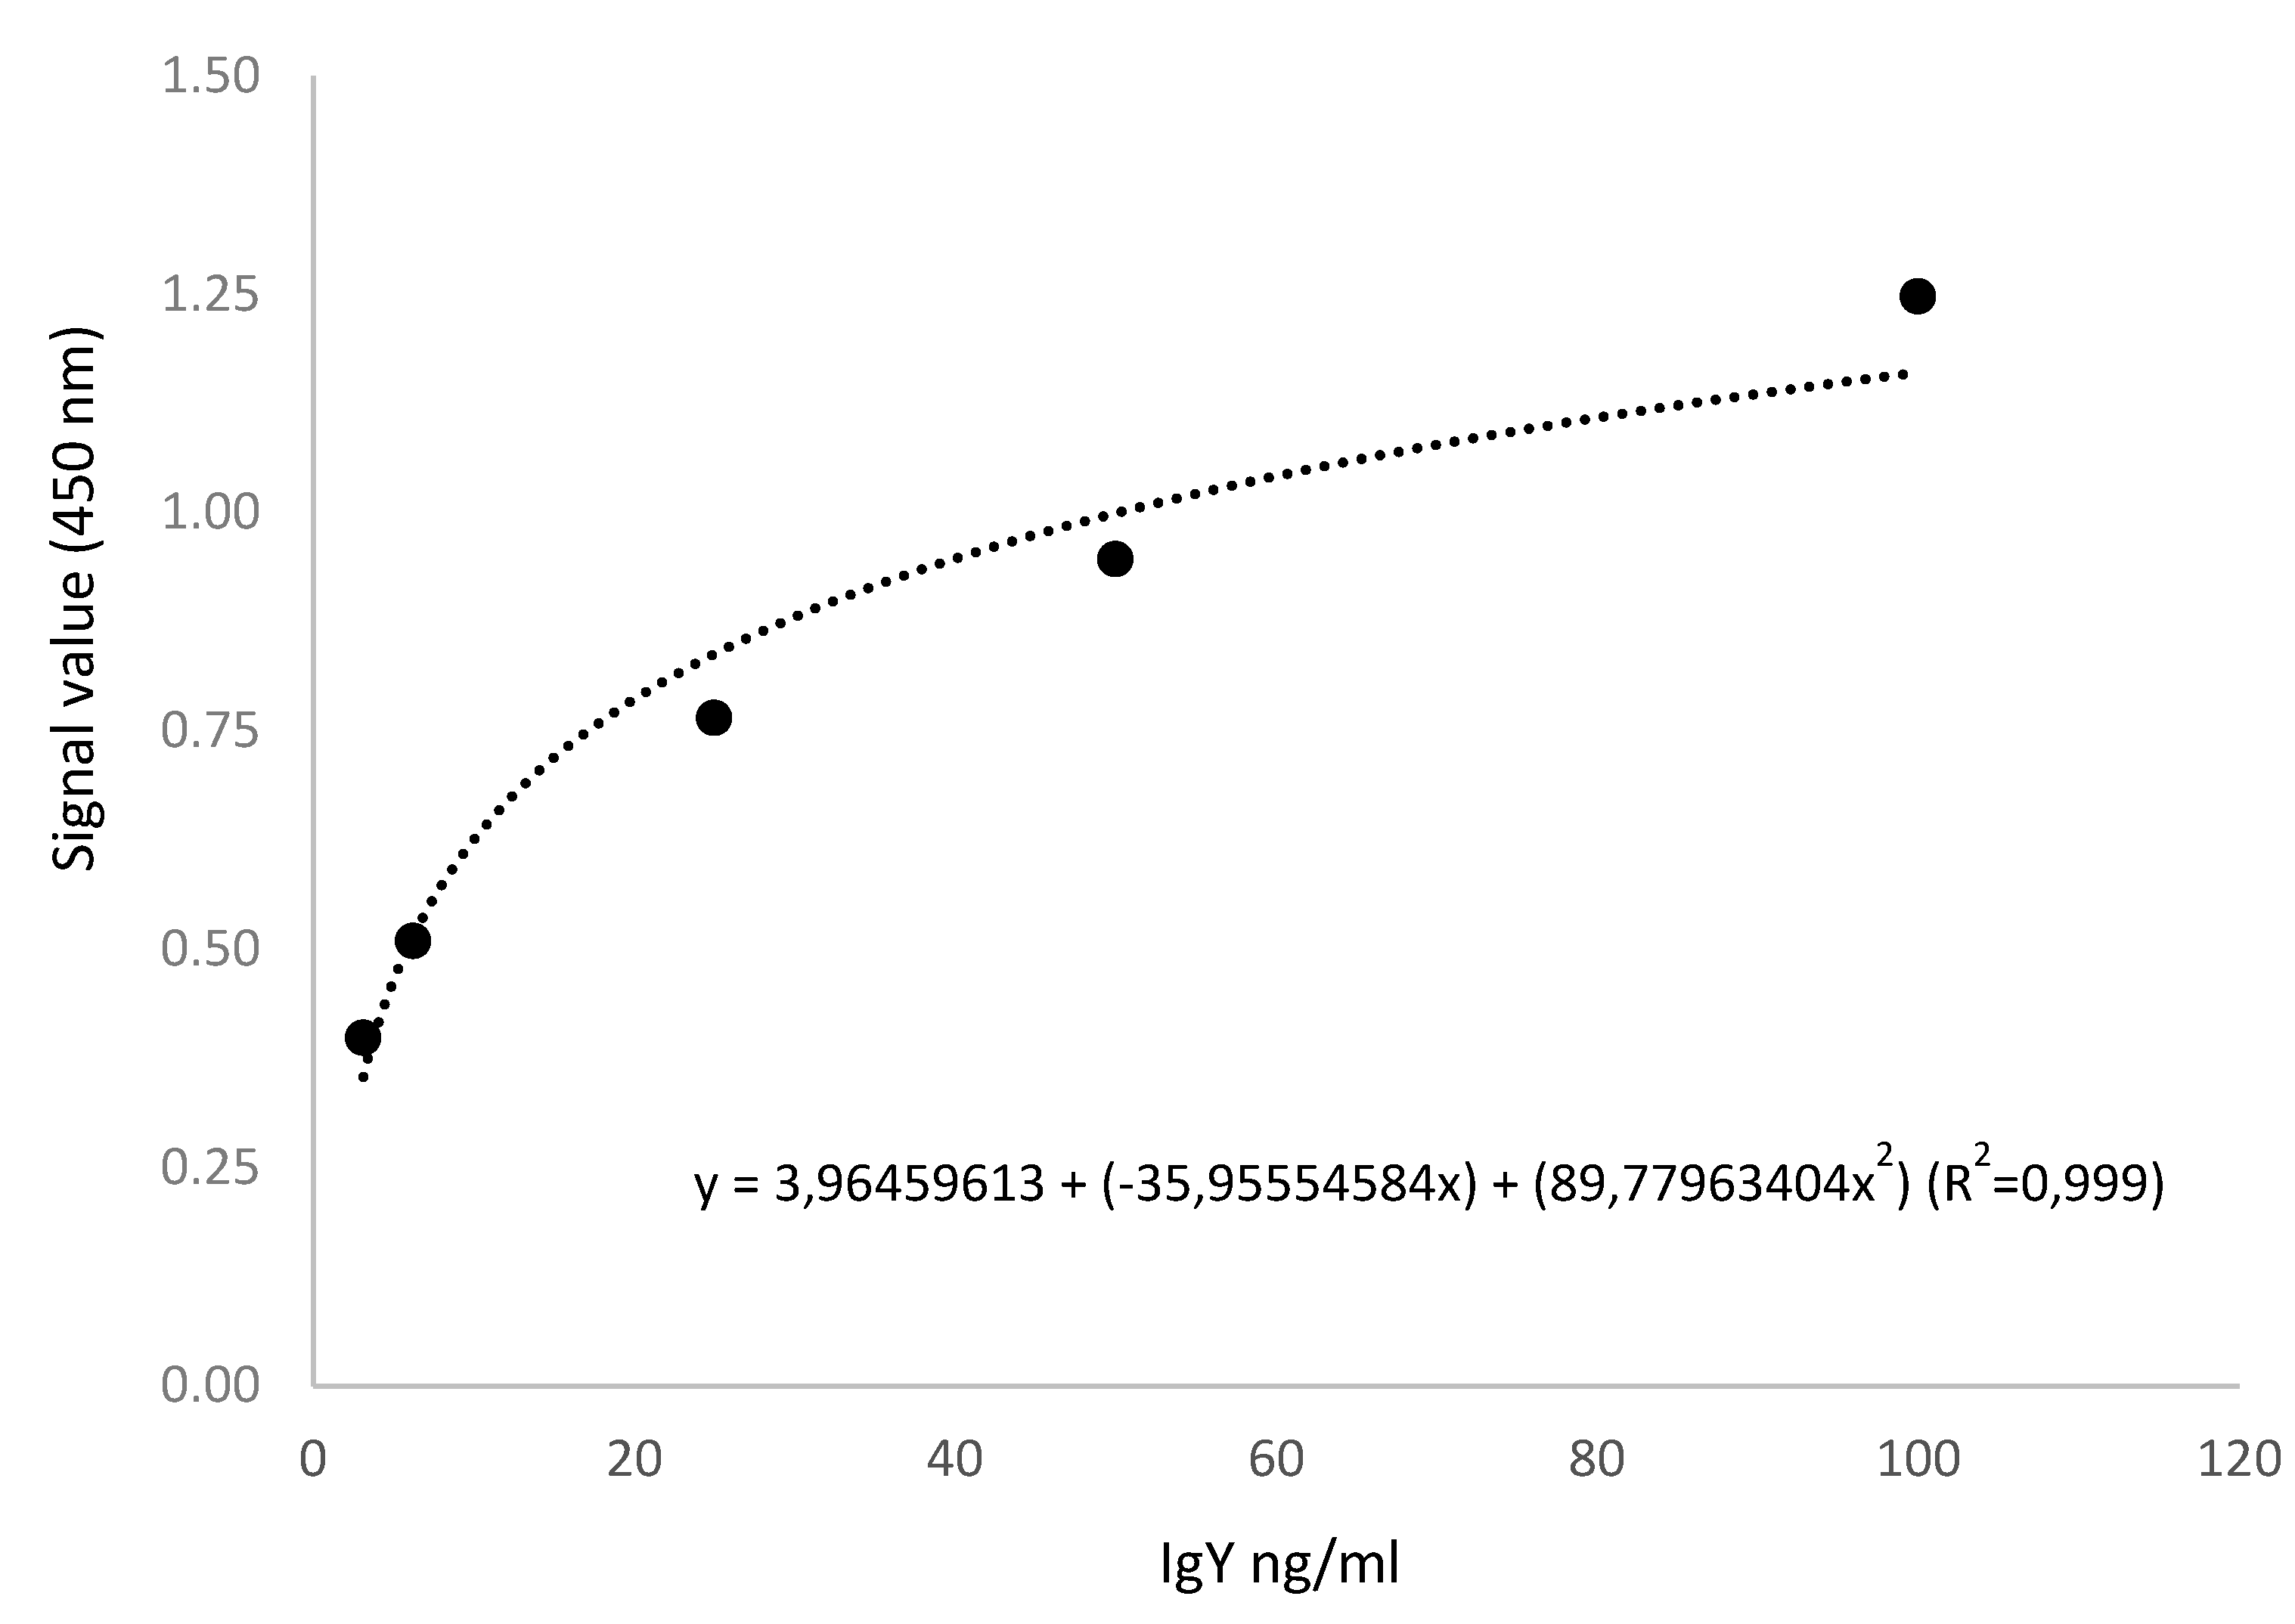
In these commercial ELISA kits, the detection antibodies are not specifics and the procedures of freeze drying became the sample most concentrated in proteins and biotin, for these reasons high dilution factor (1:1,000,000) was required to bring the sample reading signal within the standards curves (
Figure 1 and
Figure 2) and avoid exceeded the allowable range.
Two other immunoassays were used with the specific antigen pre-coated on the plate, in order to evaluate the interference of biotin on specific antibodies detection. The samples containing biotin and antibody (IgY) which has been raised against the antigen pre-coated on plate were incubated in duplicate to the plates trapped antigen-enzyme linked immunosorbent assay (PTA-ELISA) with signal amplification through the interaction of biotin with streptavidin in a serial dilution (
Table 1). After the pellet of bacteria had been resuspended in PBS pH 7.4 the microtiter plate was coated with the bacterial suspension solution 5.3 × 10
8 colony-forming units/mL of
S. equinus using 1 ul/100 ul of 0.05 M carbonate-bicarbonate-buffer (Sigma-Aldrich C3041), pH 9.6 at 4
oC overnight, on plate columns from 3 to 12. Columns 1 and 2 did not receive antigen to check undesirable cross reactions between blocking and antibodies. After that the plate was washed three times with PBS-Tween, and then was added a blocking buffer containing cold water fish skin gelatin 0.5% in PBS at 4
oC overnight.
After the blocking buffer was removed by washing a set of serial dilution was made (
Table 1). 100 ul of PBS was placed into wells, except on columns 1 and 4. 200 ul of sample was placed into wells of column 4 and then 100 ul was transferred from wells of column 4 to wells of column 5 (1:1), and then from wells of column 5 to wells of column 6 and subsequently (1:2; 1:4; 1:8; 1:16; 1:32; 1:64), until column 12 (1:128).

After serial dilutions in duplicate the plate was sealed with a cover and incubated at 37oC for 90 min on soft shake. In the sequence the content discarded, plate was washed twice and 100 ul of biotin-labeled antibody was added into above wells. The plate was sealed with a cover and incubated at 37°C for 60 min. Then the cover was removed, the plate washed 3 times with, and was added 0.1 ml of HRP-Streptavidin conjugate into each well, the plate was covered and incubated at 37°C for 30 minutes.
Another PTA-ELISA with the specific antigen pre-coated on the wells was carried out with the same procedures, but without use of signal amplification through the interaction of biotin with streptavidin. In which one, after removing unbound antibodies by washing, HRP-conjugated Anti-Chicken IgY (IgG) produced in rabbit (Sigma-Aldrich A9046) were added, following the same washing steps and procedures. After last step the plate was washed 5 times and in all of assays 90 ul chromogenic substrate, 3,3’,5,5’-tetramethylbenzidine (TMB) were added in dark within 15-30 min and 50 ul of stop solution (H2SO4 2N), to visualize horseradish peroxidase (HRP) enzymatic reaction, read the O.D. absorbance at 450 nm in a spectrophotometer and the density of yellow is proportional to the IgY amount of sample captured.
2.4. Statistical Analysis
The experimental design was complete randomized plots in 2 x 3 factorial arrangement (3 plates x 2 samples) for signal values and in 2 x 2 factorial arrangement (2 plates x 2 samples) for IgY concentration with eight replicates were used. Regression analysis on serial dilution assays from PTA-ELISA with streptavidin-biotin detection were made fitting a better model. Statistical analyses were performed using the GLM procedure of SAS 9.4 (SAS Institute Inc., Cary, NC), the 95th percentile was calculated, p < 0.05 was considered statistically significant, and least square means were adjusted for multiple comparisons using the Tukey-Kramer method.
3. Results
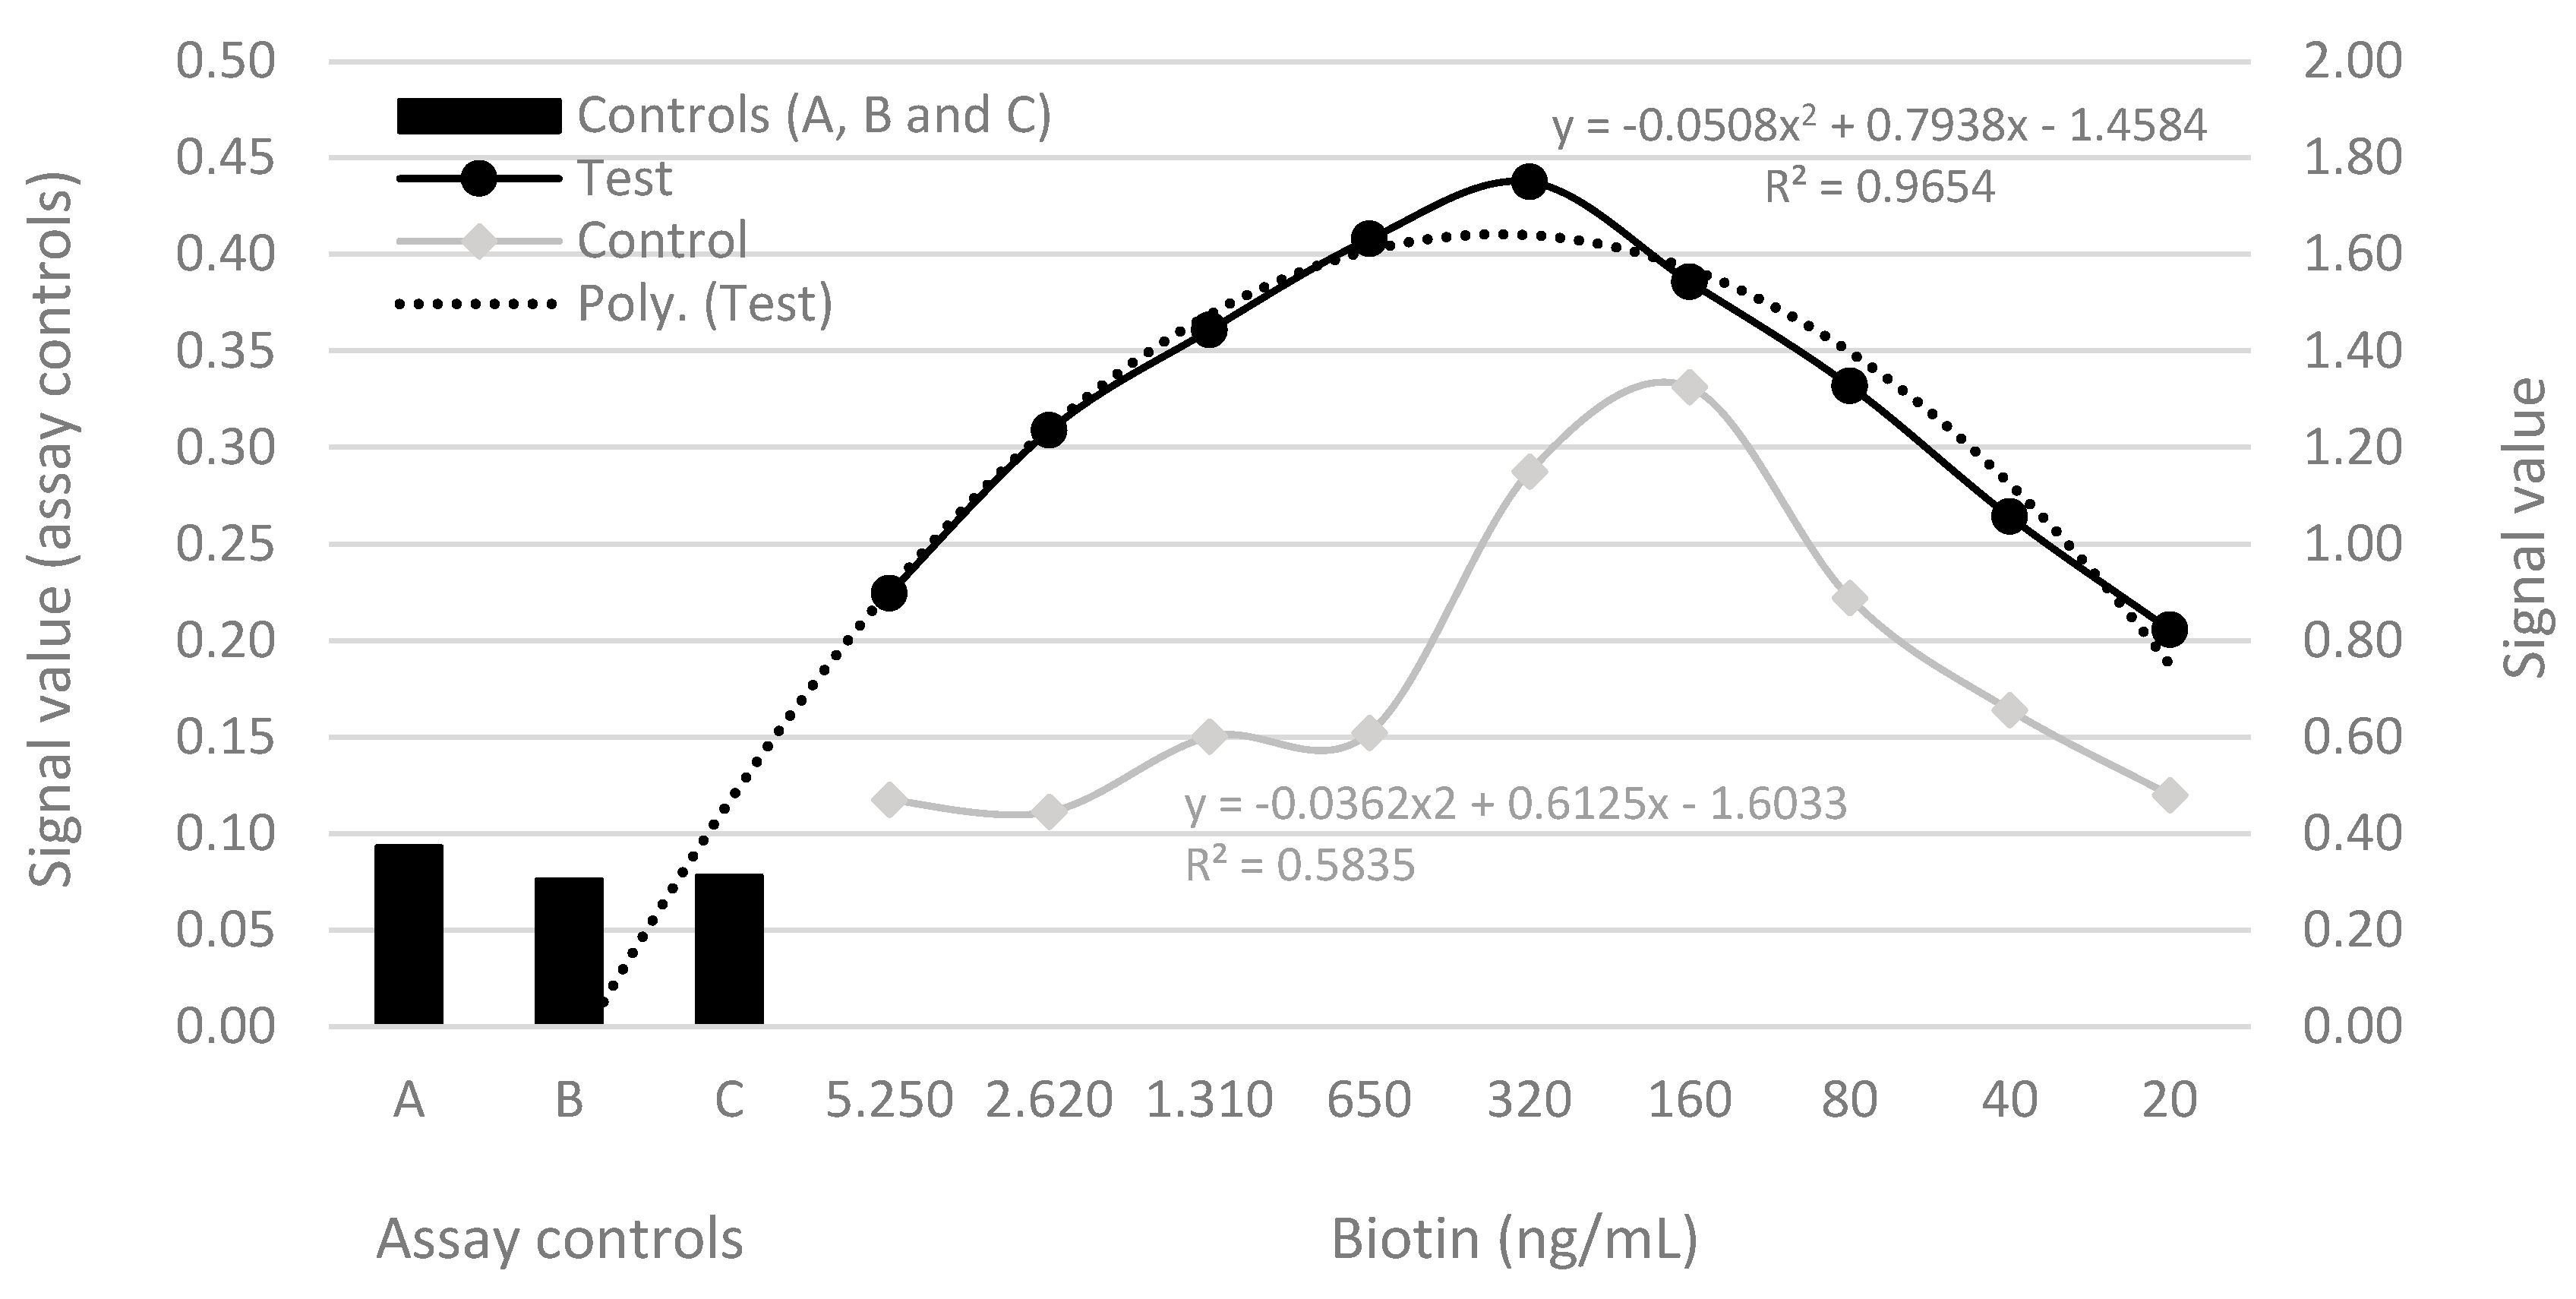
There signal values of yolk samples from hens inoculated with antigen was higher than samples from hens inoculated without antigen (p<0.001). The regression analysis on serial dilution assays from PTA-ELISA with streptavidin-biotin detection described the relationship between the observed signal and dilution levels indicated significant and higher relationship using samples from hens inoculated with antigen (R
2=0.96) compared to samples from hens inoculated without antigen (R
2=0.52), (
Figure 3). The signal values obtained on control wells demonstrated the blocking worked well, once antibodies no bound on plate without antigen, there was no cross reaction between blocking and secondary antibodies or between secondary antibodies and antigen pre-coated on plate (
Figure 3).
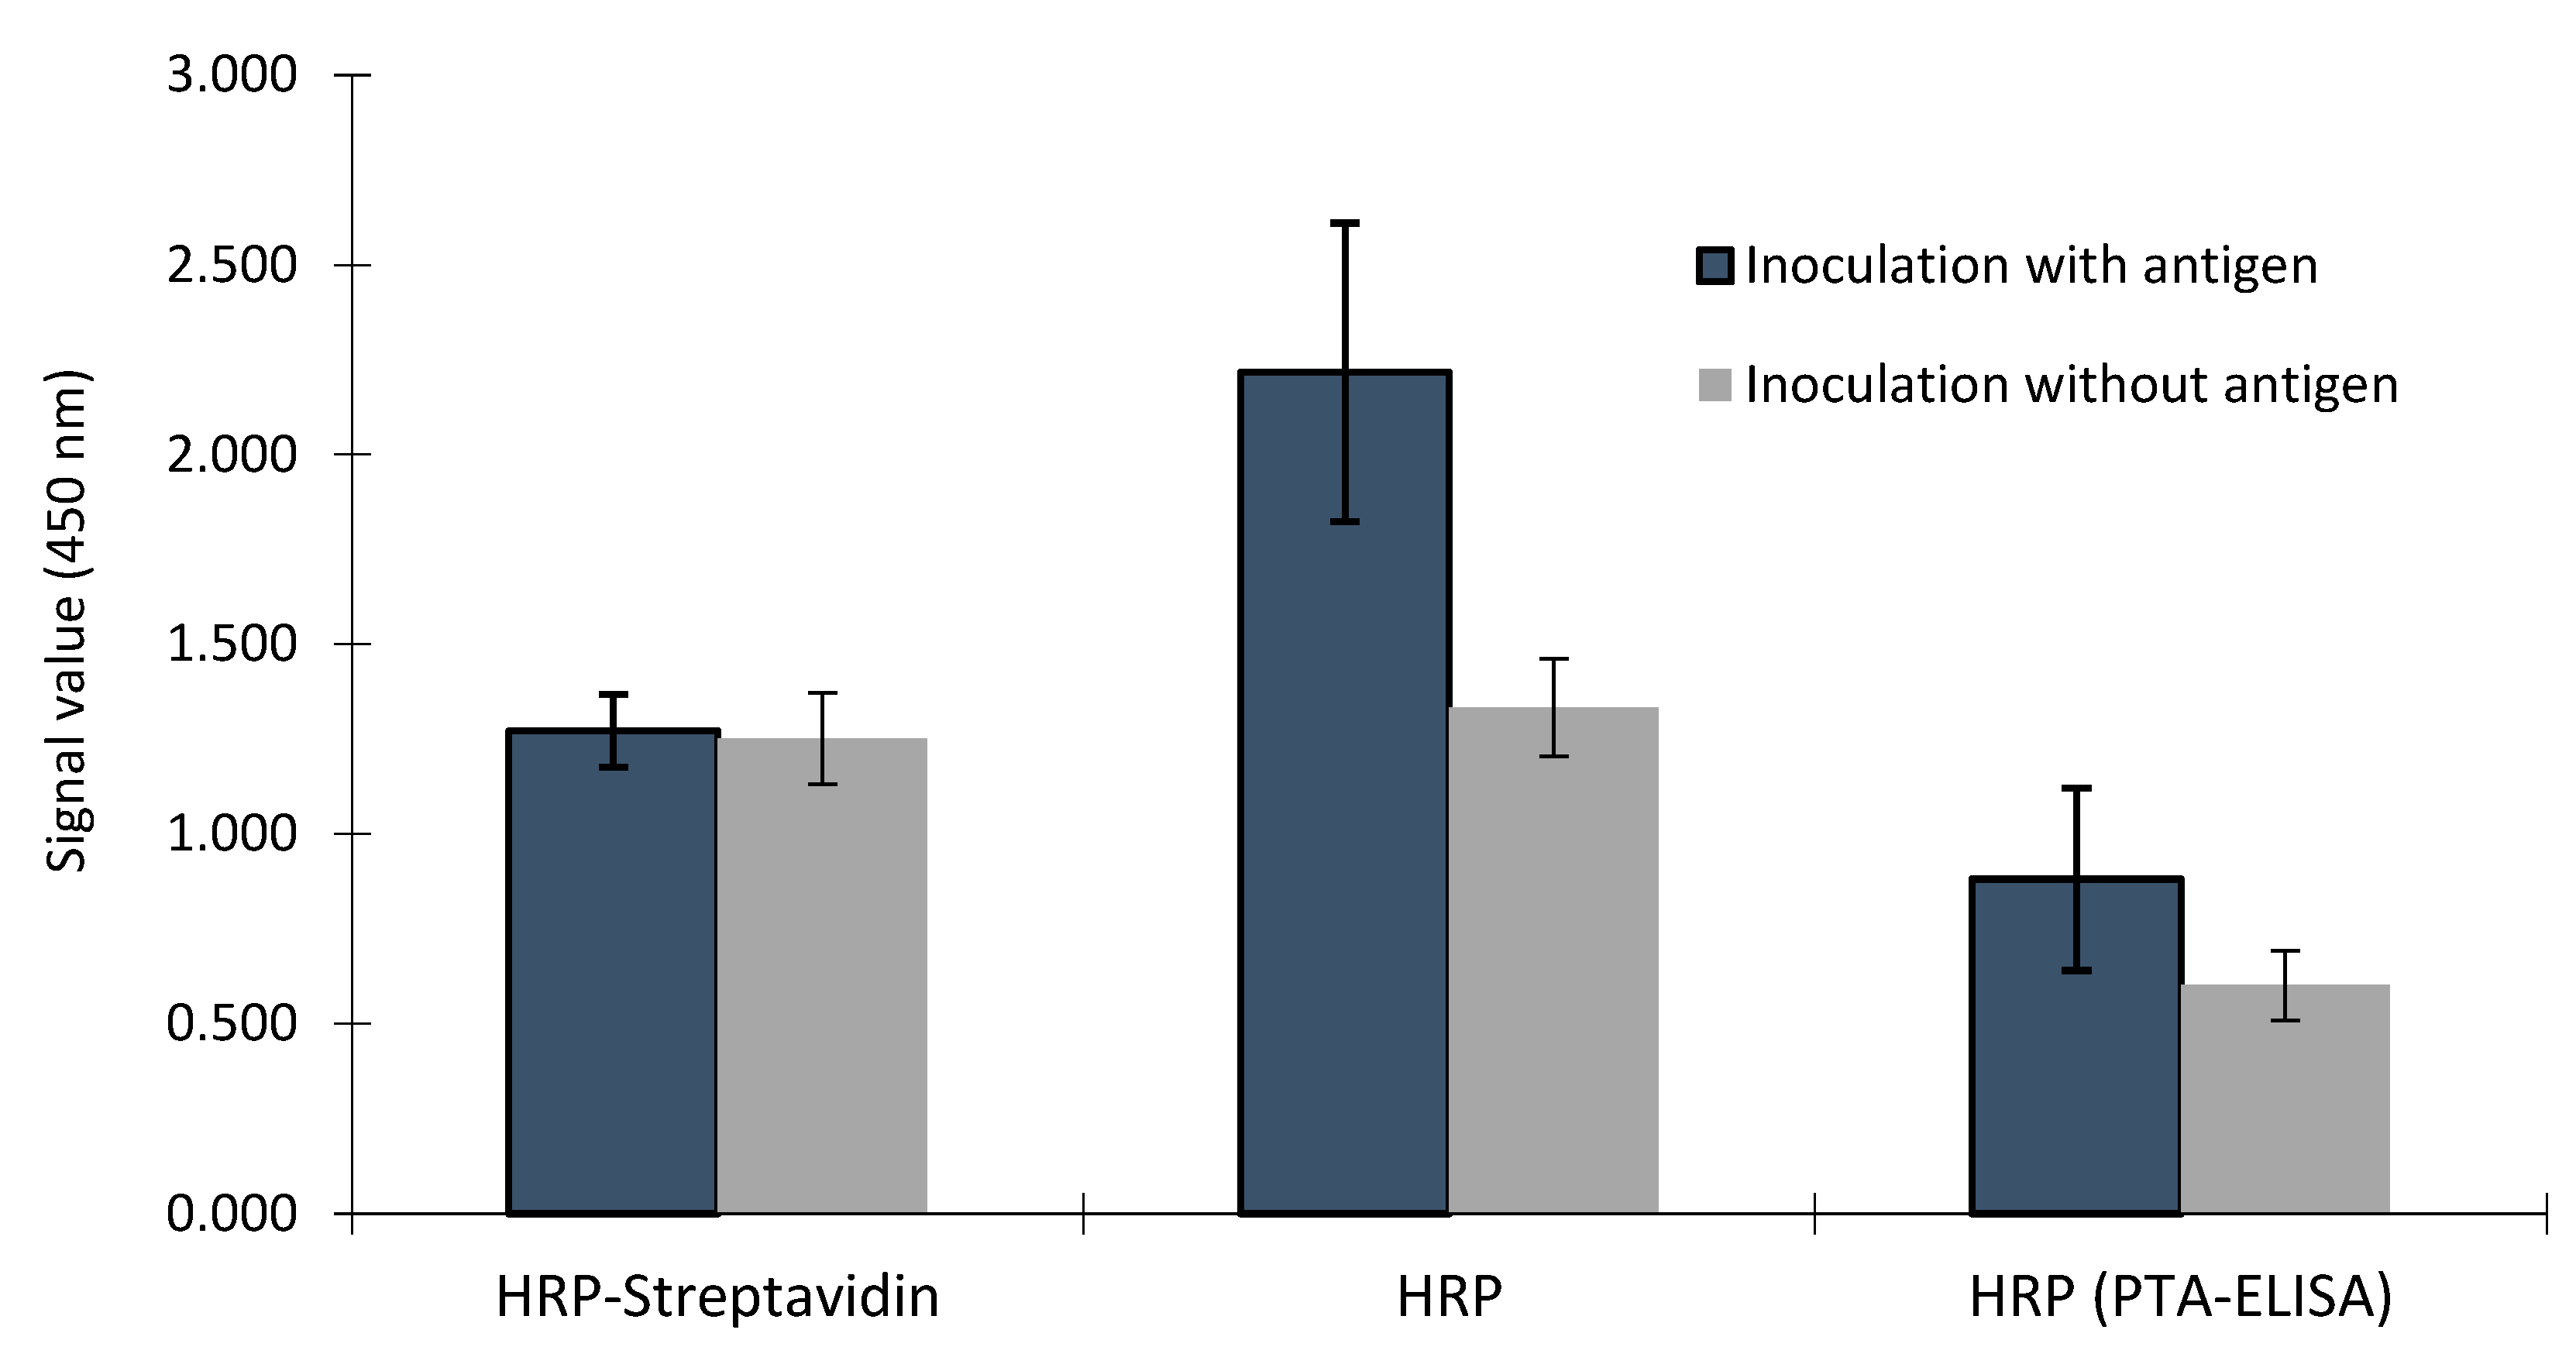
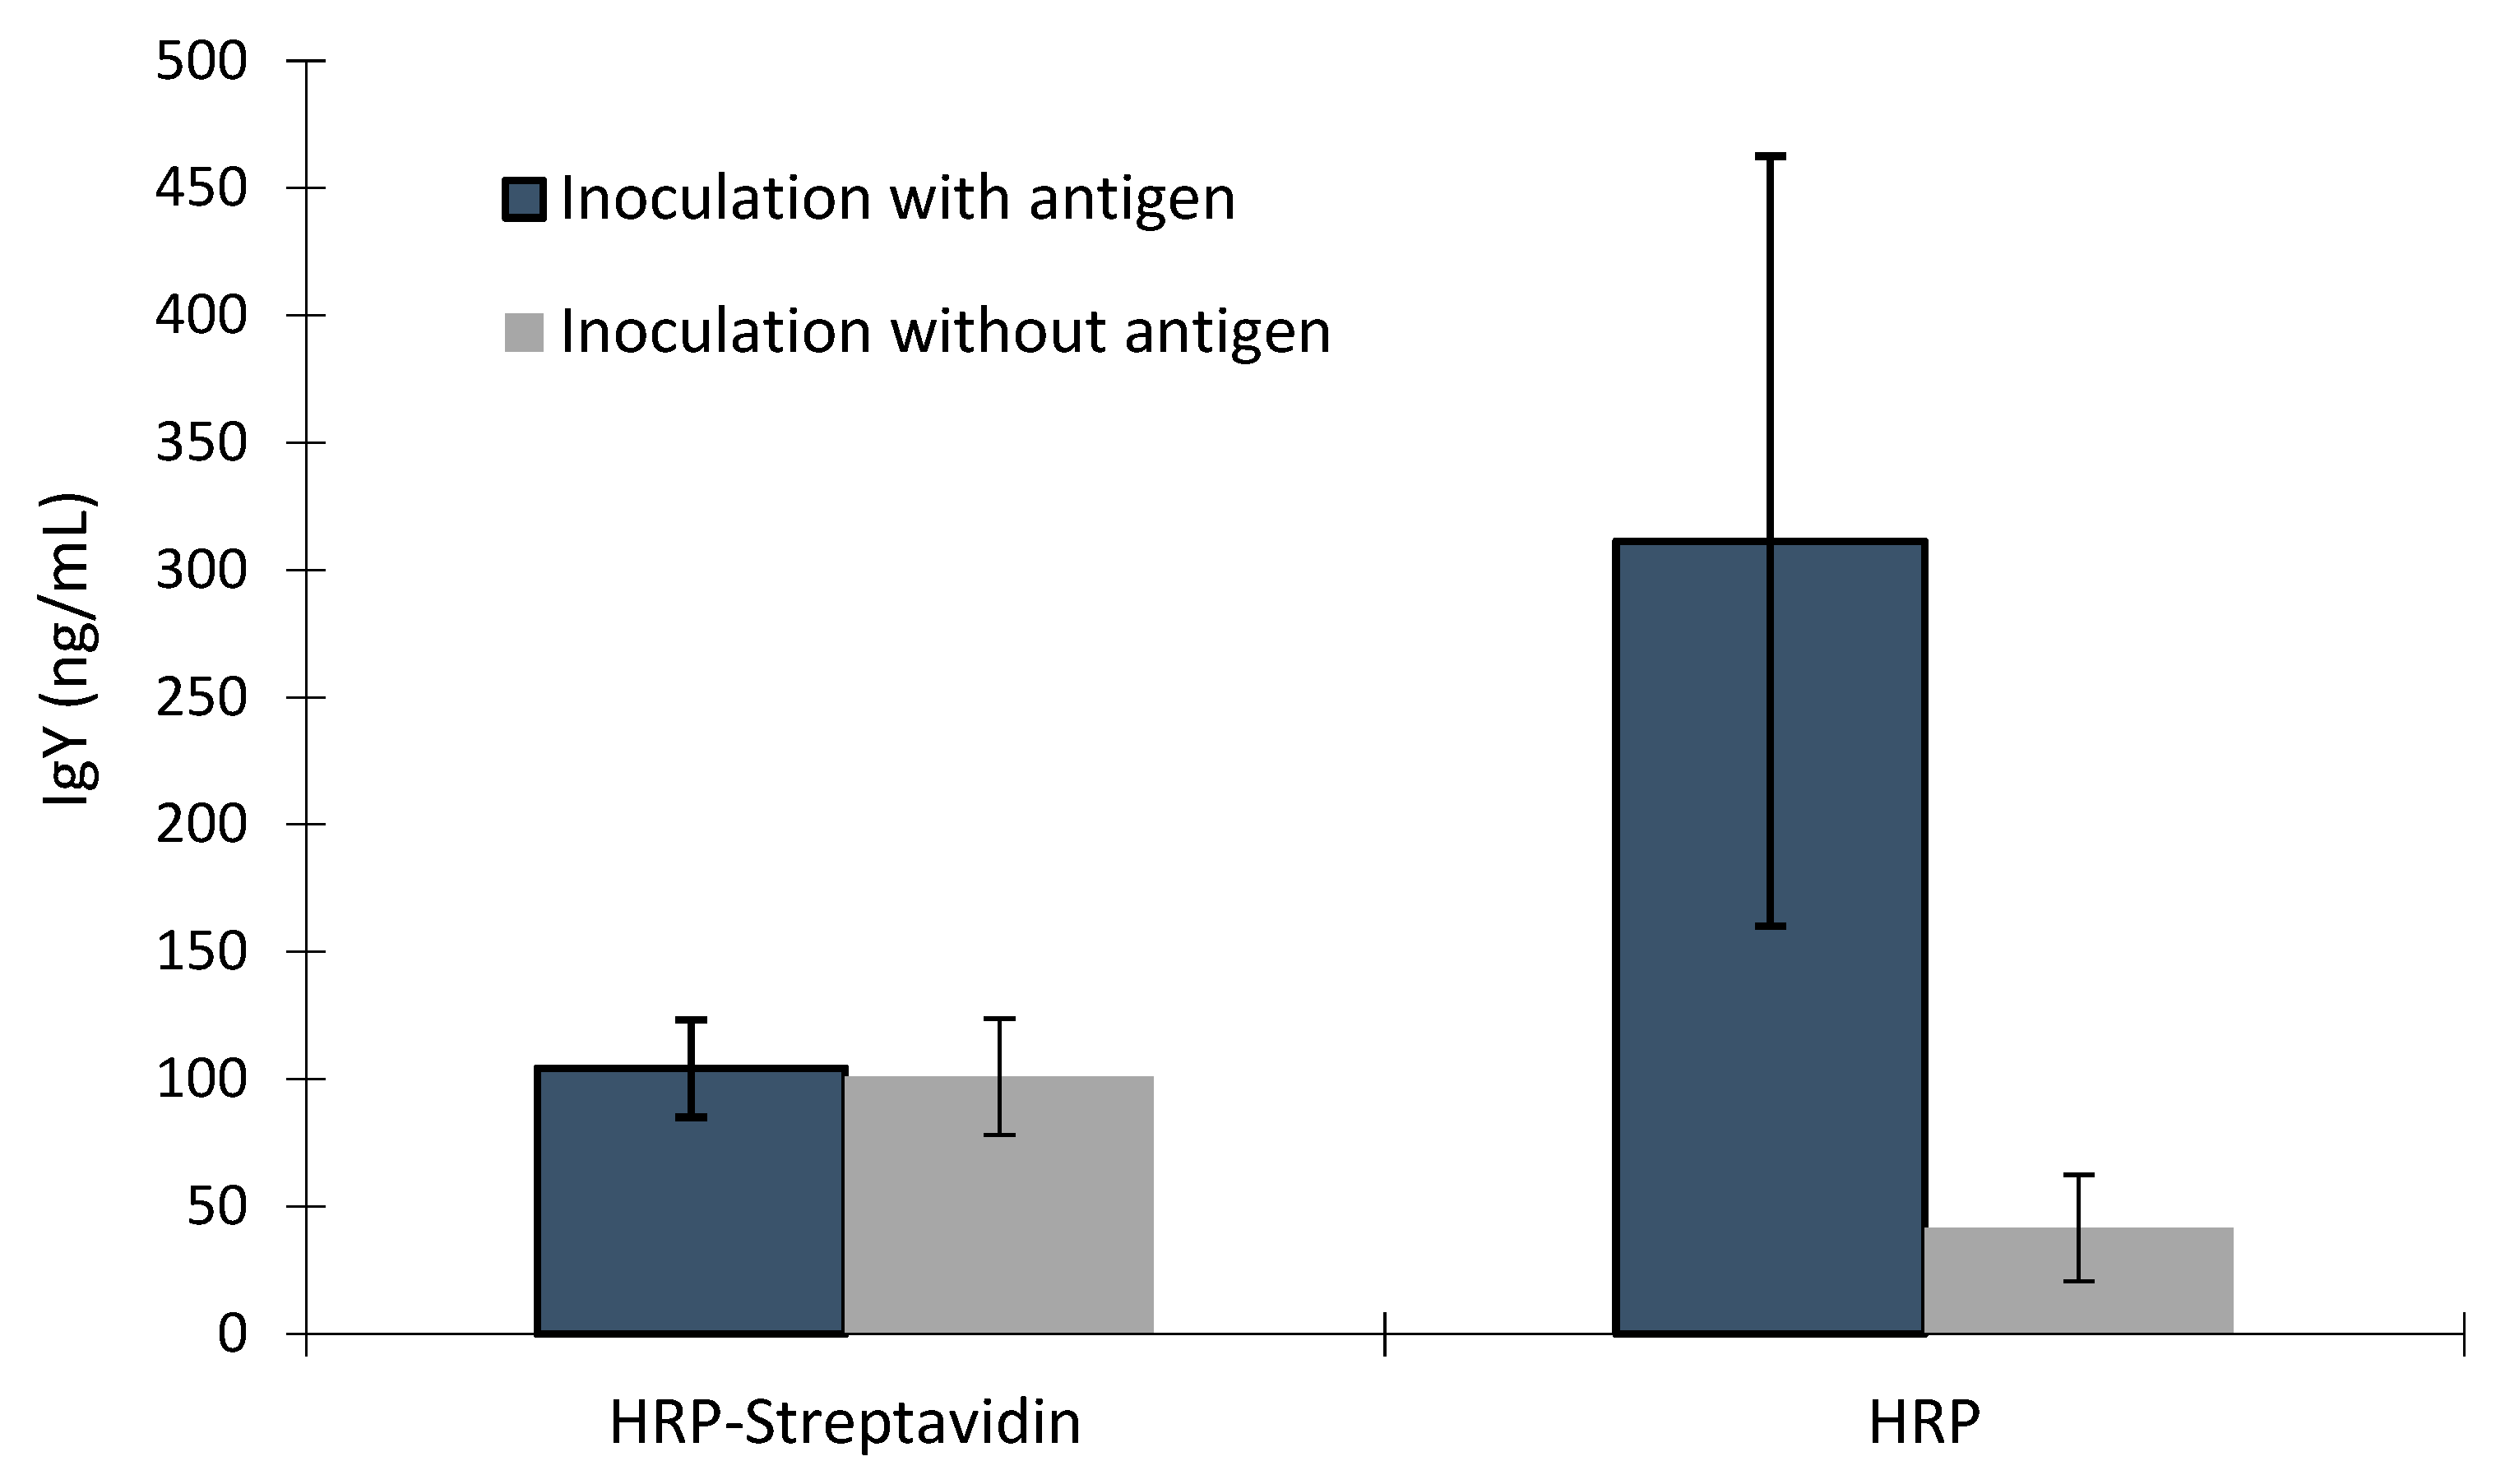
There was interaction between samples from hens inoculated with antigen or without antigen and plates using biotin-avidin/streptavidin or not (p<0.001). There was no difference on signal values or IgY concentration between samples from hens inoculated with antigen or without antigen in immunoassays using biotin-avidin/streptavidin, however, the signal values and IgY concentration of the samples from hens inoculated with antigen was higher than signal values and IgY concentration of the samples from hens inoculated without antigen (
Figure 4 and
Figure 5). There was a trend of higher signal values of samples from hens inoculated with antigen compared to samples from hens inoculated without antigen on PTA-ELISA without use of biotin-avidin/streptavidin (p<0.06), and the signal values in this plate were smaller than both commercial ELISA kits (p<0.001), except those signals obtained by control sample on plate using biotin-avidin/streptavidin.
4. Discussion
It is usually assumed that dilutions will decrease target protein concentrations, so the effect of decreasing signal values at initial points of serial dilutions was unexpected and is one of the most difficult types of interference to explain. The amounts of biotin can interfere on complex formations, as well the solubility and availability of Ab in different dilutions and Ag-Ab relationship. High concentration of Ab can lead to prozone phenomenon thereby resulting in a false negative result and increasing the signal value after dilution (Awake et al., 2022). However, considering the use of streptavidin–biotin binding as part of the assay methodology, prevails the hypothesis of high amounts of biotin on sample decrease the secondary antibody's biotin marker binding sites with the primary antibody, keeping these sites occupied.
Liu et al. (2022) testing levels of streptavidin-coated magnetic microparticles to neutralize high concentration of biotin in a sample observed difference results according to biotin and targets protein concentrations relationship on sample. Our results are matching with the Liu et al (2022), once until dilution factor 1:16, the smaller sample dilution does not result in higher immunocomplex formations, instead there was decreasing of biotin interference on higher dilutions, being the amount of IgY on samples from hens inoculated with antigen, enough to increase immunocomplex formations with less biotin interference. On the other hand, on results of control samples from hens inoculated without antigen, probably the smaller IgY concentration was not enough to allow that signal growing until dilution factor 1:16, although immediately after that some non-specific Ab had bound on antigen (
Figure 1). Cross-reactivities with irrelevant antigen targets are not uncommon due to multiple-epitope recognition of pAbs which may be accounted for by binding to common antigenic motifs (Lipman et al., 2005).
In accordance with our results, Liu et al. (2021) and Samarasinghe et al. (2017) found falsely decreased signals values due biotin interferences in a sandwich immunoassay. Liu et al. (2022), argued biotin in sample and biotin in the reagent compete for bindings sites on streptavidin reagents, and as a result, the luminescent substances cannot be captured by the streptavidin. The same authors, using streptavidin-coated magnetic microparticles to neutralize high concentration of biotin in a sample, found markedly greater when the concentrations of biotin were approximately 500 ng/mL and 1000 ng/mL, where the detection results differed by approximately 10% and more than 20% respectively, from those obtained in samples without biotin addition. In the same way, the results of this study the IgY detection was increasing according to reduction of biotin concentration from 5.250, 2.620, 1.310, 650 until to 320 ng/mL, from then on biotin interference no takes place and dilutions began to decrease the IgY detection (
Figure 1).
Biotin interference was likely due to a streptavidin insufficiency, leading to more IgY immune complex formations when biotin was diluted. On the other hand, considering that the essence of biotin interference is an insufficiency of streptavidin, in this study, the absence of difference between signal of samples from hens inoculated with antigen or not, on plate using biotin-avidin/streptavidin (
Figure 4), could be attributed the same amount of streptavidin deposited in all wells during assay, resulting in same signal even with different IgY concentrations. Kabiri et al. (2021) studying the biotin interference on proteins measurements concluded that the biotin in sample lead to false high results in sandwich immunoassays. In short, with high Ab concentrations all streptavidin added will bind with a biotin, ultimately leading to a decrease in the intensity of the optical signal, making the results of samples with different concentrations equal. On the other hand, if the amount of streptavidin will be sufficient for all Ab, when biotin–streptavidin binding is used as part of a ‘sandwich’ immunoassay format, excess biotin in the sample can block the binding of biotinylated antibodies to the biotin binding sites on the streptavidin-coated solid phase, resulting in falsely low results (Avery, 2019). In addition, streptavidin can combine with solid phase materials without affecting its binding ability with biotin. Thus, changes in the measured values of the sandwich immunoassays can lead to falsely low or high values in the measured results, depending on the concentrations and the relationship between the concentrations of proteins, biotin and reagents in assays using biotin-avidin/streptavidin.
The lower signal values of samples from hens inoculated with antigen in PTA-ELISA in relation to the signal of the same samples in commercial ELISA kits, occurs due to the measurement of specific Ab only, since other nonspecific Ab may not bind to the antigen pre-coated on plate. The egg yolk can provide 70-150 mg of Ab, being just 2-10% Ag specifics for inoculated antigen (Lee et al, 2017). The IgY concentrations found in this study were similar for most-cited papers. Losch et al (1986) described that one egg yolk can provide 40 – 500 mg of IgY, while Kowlaczyk et al (1985) showed the amount of IgY in the egg yolk of 15.7 mg/mL with a range from 5.3 mg/mL to 43.3 mg/mL, that means, in theory an amount of 120 mg Ig can be obtained from one egg. However, there is a wide range of results, and the results of analysis of samples with excess biotin by ELISA using signal amplification by the biotin-streptavidin interaction are subject to misdiagnosis by biotin interference, therefore, for better accuracy, methods to neutralize biotin or other methods who do not use biotin-avidin/streptavidin are the most advisable.
5. Conclusions
The detection of IgY in yolk samples by ELISA using streptavidin–biotin binding as part of the assay methodology changed down due to biotin interference, and therefore requires some technology to neutralize high concentration of biotin on sample or steps beyond delipidation to isolate the target protein. Otherwise, an ELISA without the use of streptavidin-biotin binding would be more advisable and should be selected as the preferred method to avoid the relationship between biotin and target proteins.
References
- Akita, E.M. & Nakai, S. 1993. Comparison of four purification methods for the production of immunoglobulins from eggs laid by hens immunized with an enterotoxigenic E. coli strain. J. Immunol. Methods. 160:207-214. [CrossRef]
- Amro et al. Production and purification f IgY antibodies from chicken egg yolk. Journal of Genetic Engineering and Biotechnology, 2018, v. 16, p 99-103. [CrossRef]
- Avery, G. Biotin interference in immunoassay: a review for the laboratory scientist. Annals of Clinical Biochemistry 2019, Vol. 56(4) 424–430 doi: 10.1177/0004563219842231 journals.sagepub.com/home/acb. [CrossRef]
- Awake P, Angadi K, Sen S, Bhadange P. Prozone phenomenon in secondary syphilis with HIV co-infection: Two cases. Indian J Sex Transm Dis AIDS. 2022 Jul-Dec; 43(2):183-185. [CrossRef]
- Balieiro, G.N. et al. Effects of IgY antibodies on Streptococcus equinus strain JB1 as an antibiotic alternative for improving feedlot performance, ruminal fermentation patterns, and ciliate protozoa counts. Proceedings, Western Section, American Society of Animal Science, vol 68, 2017, p,285-293. [CrossRef]
- Blanch, M. et al. Physiological changes in rumen fermentation during acidosis induction and its control using a multivalent polyclonal antibody preparation in heifers. Journal of Animal Science, v.87, p.1722-1730, 2009. [CrossRef]
- 7. Kabiri, P.; Weiskirchen, R.; Van Helden, J. The biotin interference within interference suppressed immunoassays. Journal of Clinical Laboratory Analysis.2021, 35, e23940. [CrossRef]
- Kowalczyk, K., Daiss, J., Halpern, J. and Roth, T.F. (1985). Quantitation of maternal-fetal IgG transport in the chicken. Immunology. 54, 755-762.
- Larsson, A. and Sjoquist, J. (1990), Chicken IgY: Utilizing the evolutionary difference. Comp. Immune. Microbiology Infect. Dis. 13, 199-201. [CrossRef]
- Lee, W. et al. Insights into the chicken IgY with emphasis on the generation and applications of chicken recombinant monoclonal antibodies. Journal of Immunological Methods, 2017, v. 447, p. 71–85. [CrossRef]
- Li, X. et al. Chicken egg yolk antibodies (IgY) as non-antibiotic production enhancers for use in swine production: A review. Journal of Animal Science and Biotechnology, 2015, v. 6, n. 1, p. 1–10. [CrossRef]
- Lipman NS, Jackson LR, Trudel LJ, Weis-Garcia F. Monoclonal versus polyclonal antibodies: distinguishing characteristics, applications, and information resources. ILAR J. 2005;46(3):258-68. [CrossRef]
- Liu, D.; Gebreab, Y.B.; Hu, J.; Zhou, L.; Zhang, N.; Tong, H.; Chen, B.; Wang, X. Development and Evaluation of an Anti-Biotin Interference Method in BiotinStreptavidin Immunoassays. Diagnostics 2022, 12, 1729. [CrossRef]
- Liu, D.; Tong, H.; Chen, B.; Zhang, N.; Hu, J.; Wang, X.Q. Research Progress of Exogenous Biotin Interference on Chemiluminescence Immunoassay Based on Biotin-Avidin System. J. Mod. Lab. Med. 2021, 36, 161–164.
- Losch, U., Schranner, I., Wanke, R, and Jurgens, L. (1986). The chicken egg and antibody source. J. Vet. Med. B 33, 609-619. [CrossRef]
- Meslar, H. W., Camper, S. A. and White, H. B. III (1978) J. Biol. Chem. 253, 6979-6982. Pharmacotherapy, 2017, v. 95, p. 1734–1742.
- Mrosewski, I.; Urbank, M.; Stauch, T.; Switkowski, R. Interference from High-Dose Biotin Intake in Immunoassays for Potentially Time-Critical Analytes by Roche. Arch. Pathol. Lab. Med. 2020, 144, 1108–1117.
- Ostrowska, M.; Bartoszewicz, Z.; Bednarczuk, T.; Walczak, K.; Zgliczy ´nski, W.; Glinicki, P. The Effect of Biotin Interference on the Results of Blood Hormone Assays. Endokrynol. Pol. 2019, 70, 102–121.
- Pacheco, R.D.L. et al. Effects of feeding a multivalent polyclonal antibody preparation on feedlot performance, carcass characteristics, rumenitis, and blood gas profi le in Bos indicus biotype yearling bulls. Journal of Animal Science, v.90, p.1898- 1909, 2012. [CrossRef]
- Pennington JAT. Bowes and Church’s Food Values of Portions Commonly Used 14th Edition. Lippincott Williams and Wilkins; Pennsylvania: 1989. [Google Scholar] (citado por Staggs, C.J. et al, 2004). J Food Compost Anal. 2004 Dec; 17(6): 767–776. [CrossRef]
- Rodrigues, E. et al. Performance, carcass characteristics and gain cost of feedlot cattle fed a high level of concentrate and different feed additives. Revista Brasileira de Zootecnia, v.42, n.1, p.61-69, 2013. [CrossRef]
- Samarasinghe, S.; Meah, F.; Singh, V.; Basit, A.; Emanuele, N.; Emanuele, M.A.; Mazhari, A.; Holmes, E.W. Biotin Interference with Routine Clinical Immunoassays: Understand the Causes and Mitigate the Risks. Endocr. Pract. 2017, 23, 989–998. [CrossRef]
|
Disclaimer/Publisher’s Note: The statements, opinions and data contained in all publications are solely those of the individual author(s) and contributor(s) and not of MDPI and/or the editor(s). MDPI and/or the editor(s) disclaim responsibility for any injury to people or property resulting from any ideas, methods, instructions or products referred to in the content. |
© 2023 by the authors. Licensee MDPI, Basel, Switzerland. This article is an open access article distributed under the terms and conditions of the Creative Commons Attribution (CC BY) license (http://creativecommons.org/licenses/by/4.0/).

