Submitted:
23 August 2023
Posted:
24 August 2023
You are already at the latest version
Abstract
Keywords:
1. Introduction
2. Methodology
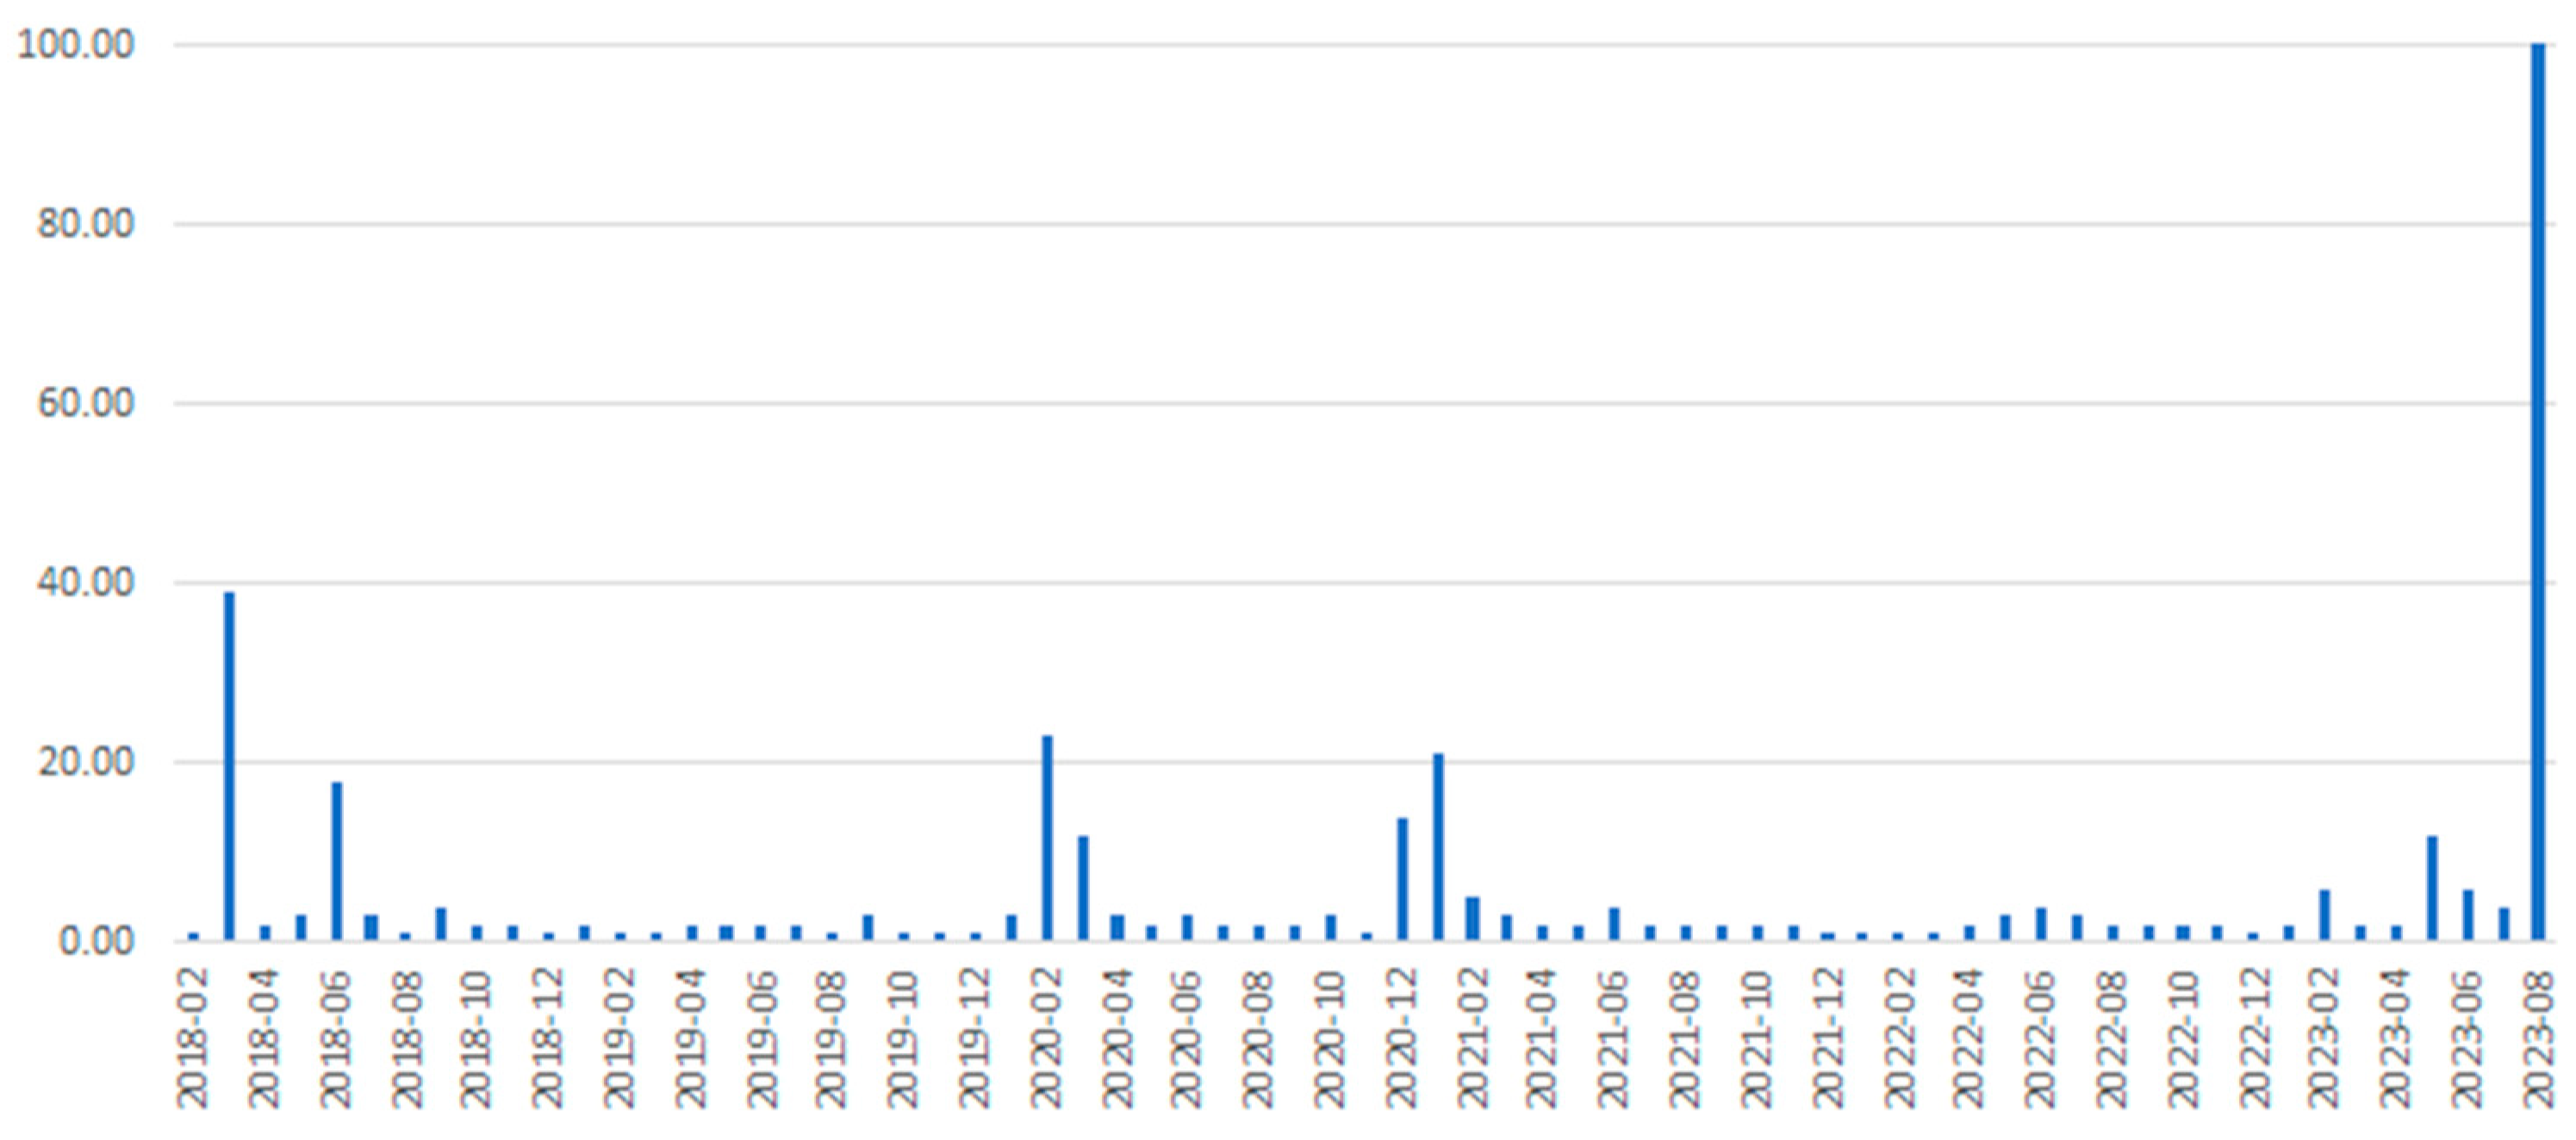
- Search Term Trends: This feature allows users to see how the popularity of a specific search term or keyword has changed over time. Google Trends provides a graphical representation to highlight these trends.
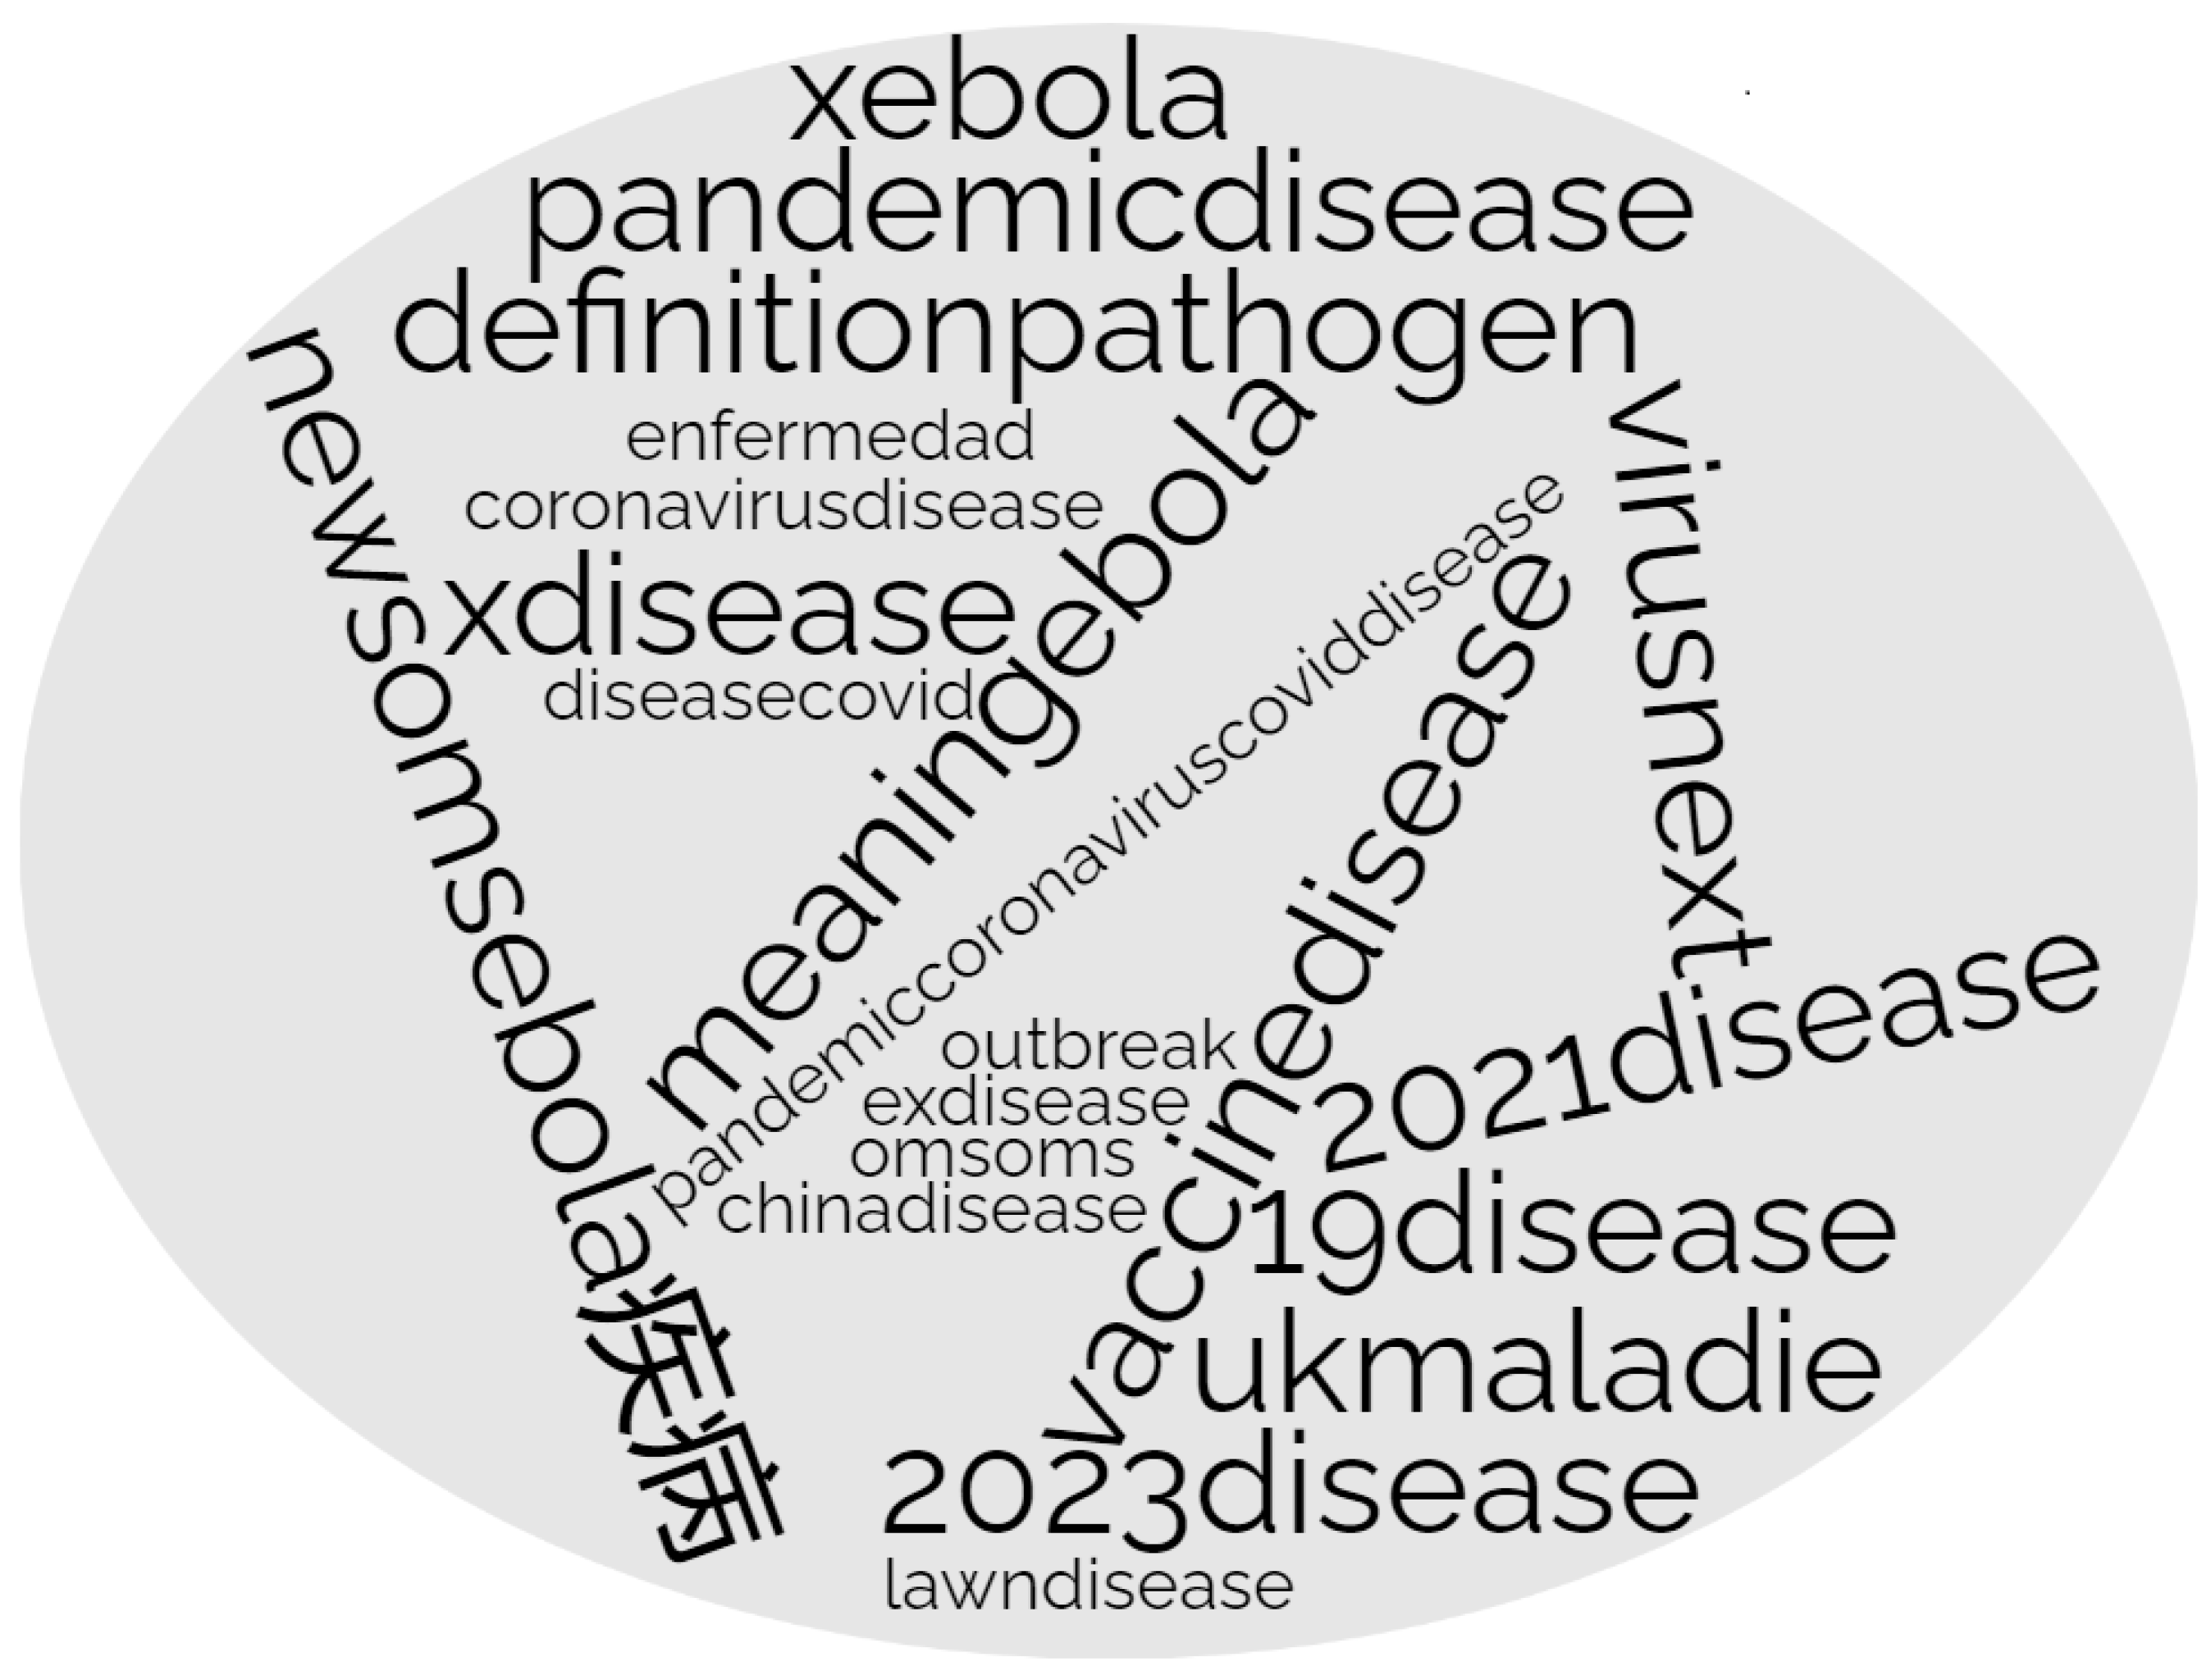
- Related Queries: Google Trends displays related queries that are frequently searched alongside the user’s primary search term. This can help identify related topics or terms relevant for data analysis.
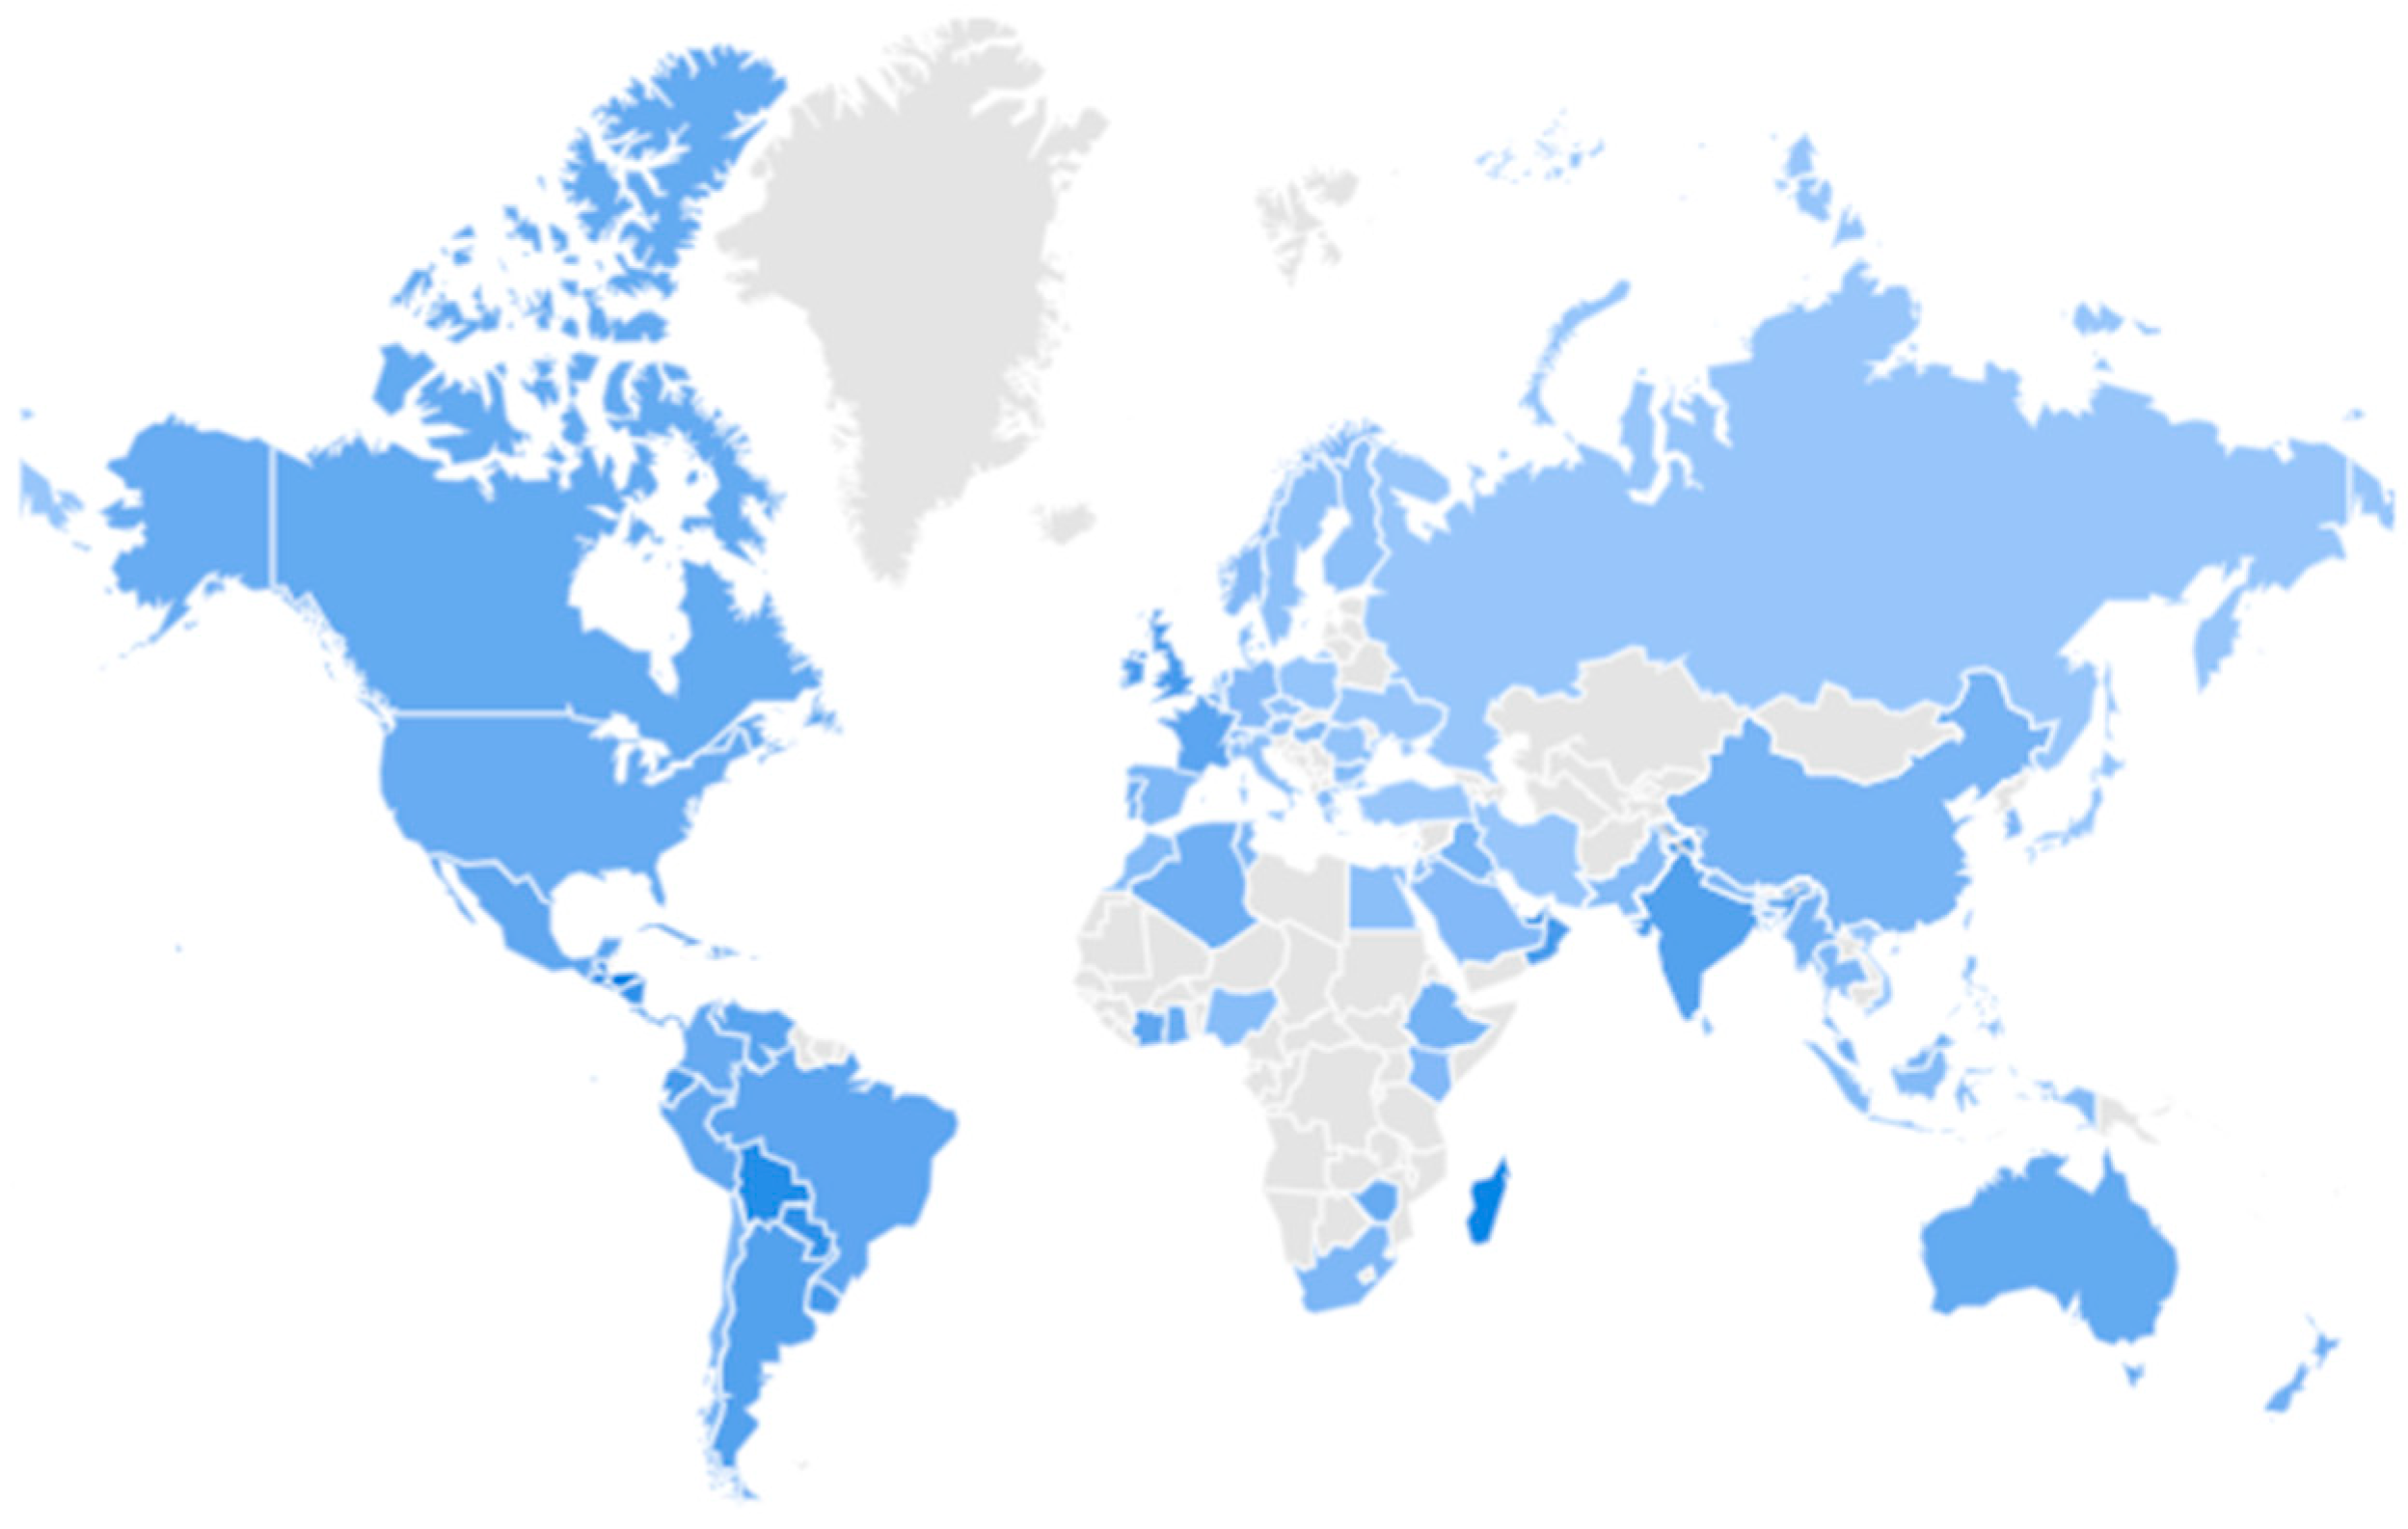
- Regional Interest: Users can view the geographical regions where a specific search term is most popular using Google Trends. Google Trends provides insights into regional differences in search interest for search terms.
- Trending Searches: This feature of Google Trends highlights the current and popular search queries or topics, providing real-time insights into what people are searching for on Google.
- Year in Search: Google Trends often releases a “Year in Search” report summarizing the top search queries from the past year. In this report, it offers an overview of significant events and trends.
- Category Comparison: Users can compare the search interest of different categories or topics on Google using Google Trends. This can be useful for understanding the relative popularity of various topics.
- Time Period Selection: Google Trends allows users to specify the time period for which they desire to query and analyze the data. This can range from a few hours to multiple years.
- Data Visualization: Google Trends provides interactive charts and graphs to visualize search data.
- Real-Time Data: Google Trends often updates in near real-time, making it valuable for tracking ongoing events.
- Data Export: Google Trends allows different options to export data related to search interests, related queries, and related topics for a search term on Google for further analysis.
3. Data Description and Analysis
4. Conclusions
Author Contributions
Funding
Institutional Review Board Statement
Informed Consent Statement
Data Availability Statement
Conflicts of Interest
References
- Fauci, A.S.; Lane, H.C.; Redfield, R.R. Covid-19 — Navigating the Uncharted. N. Engl. J. Med. 2020, 382, 1268–1269. [Google Scholar] [CrossRef] [PubMed]
- Prentice, M.B.; Rahalison, L. Plague. Lancet 2007, 369, 1196–1207. [Google Scholar] [CrossRef] [PubMed]
- Aassve, A.; Alfani, G.; Gandolfi, F.; Le Moglie, M. Epidemics and Trust: The Case of the Spanish Flu. Health Econ. 2021, 30, 840–857. [Google Scholar] [CrossRef] [PubMed]
- Joint United Nations Programme on HIV/AIDS. World Health Organization 2008 Report on the Global AIDS Epidemic; World Health Organization: Genève, Switzerland, 2008; ISBN 9789291737116. [Google Scholar]
- Jacob, S.T.; Crozier, I.; Fischer, W.A., II; Hewlett, A.; Kraft, C.S.; Vega, M.-A. de L.; Soka, M.J.; Wahl, V.; Griffiths, A.; Bollinger, L.; et al. Ebola Virus Disease. Nat. Rev. Dis. Primers 2020, 6, 1–31. [Google Scholar] [CrossRef]
- Sampath, S.; Khedr, A.; Qamar, S.; Tekin, A.; Singh, R.; Green, R.; Kashyap, R. Pandemics throughout the History. Cureus 2021, 13. [Google Scholar] [CrossRef]
- Chatterjee, P.; Nair, P.; Chersich, M.; Terefe, Y.; Chauhan, A.; Quesada, F.; Simpson, G. One Health, “Disease X” & the Challenge of “Unknown” Unknowns. Indian J. Med. Res. 2021, 153, 264. [Google Scholar] [CrossRef]
- Prioritizing Diseases for Research and Development in Emergency Contexts. Available online: https://www.who.int/activities/prioritizing-diseases-for-research-and-development-in-emergency-contexts (accessed on 17 August 2023).
- Barnes, T. World Health Organisation Fears New “Disease X” Could Cause a Global Pandemic. Available online: https://www.independent.co.uk/news/science/disease-x-what-is-infection-virus-world-health-organisation-warning-ebola-zika-sars-a8250766.html (accessed on 17 August 2023).
- Scutti, S. World Health Organization Gets Ready for ‘Disease X’. Available online: https://www.cnn.com/2018/03/12/health/disease-x-blueprint-who/index.html (accessed on 17 August 2023).
- Adalja, A.A.; Watson, M.; Toner, E.S.; Cicero, A.; Inglesby, T.V. Characteristics of Microbes Most Likely to Cause Pandemics and Global Catastrophes. In Current Topics in Microbiology and Immunology; Springer International Publishing: Cham, 2019; pp. 1–20. ISBN 9783030363109. [Google Scholar]
- Kreuder Johnson, C.; Hitchens, P.L.; Smiley Evans, T.; Goldstein, T.; Thomas, K.; Clements, A.; Joly, D.O.; Wolfe, N.D.; Daszak, P.; Karesh, W.B.; et al. Spillover and Pandemic Properties of Zoonotic Viruses with High Host Plasticity. Sci. Rep. 2015, 5, 1–8. [Google Scholar] [CrossRef]
- Jones, K.E.; Patel, N.G.; Levy, M.A.; Storeygard, A.; Balk, D.; Gittleman, J.L.; Daszak, P. Global Trends in Emerging Infectious Diseases. Nature 2008, 451, 990–993. [Google Scholar] [CrossRef]
- Carlson, C.J.; Albery, G.F.; Merow, C.; Trisos, C.H.; Zipfel, C.M.; Eskew, E.A.; Olival, K.J.; Ross, N.; Bansal, S. Climate Change Increases Cross-Species Viral Transmission Risk. Nature 2022, 607, 555–562. [Google Scholar] [CrossRef]
- Peiris, J.S.M.; Tu, W.-W.; Yen, H.-L. A Novel H1N1 Virus Causes the First Pandemic of the 21stCentury. Eur. J. Immunol. 2009, 39, 2946–2954. [Google Scholar] [CrossRef]
- Van Kerkhove, M.D.; Ryan, M.J.; Ghebreyesus, T.A. Preparing for “Disease X. ” Science 2021, 374, 377–377. [Google Scholar] [CrossRef] [PubMed]
- Iserson, K. The next Pandemic: Prepare for “Disease X. ” West. J. Emerg. Med. 2020, 21, 756. [Google Scholar] [CrossRef] [PubMed]
- Tahir, M.J.; Sawal, I.; Essar, M.Y.; Jabbar, A.; Ullah, I.; Ahmed, A. Disease X: A Hidden but Inevitable Creeping Danger. Infect. Control Hosp. Epidemiol. 2022, 43, 1758–1759. [Google Scholar] [CrossRef] [PubMed]
- Simpson, S.; Kaufmann, M.C.; Glozman, V.; Chakrabarti, A. Disease X: Accelerating the Development of Medical Countermeasures for the next Pandemic. Lancet Infect. Dis. 2020, 20, e108–e115. [Google Scholar] [CrossRef] [PubMed]
- Simpson, S.; Chakrabarti, A.; Robinson, D.; Chirgwin, K.; Lumpkin, M. Navigating Facilitated Regulatory Pathways during a Disease X Pandemic. NPJ Vaccines 2020, 5, 1–9. [Google Scholar] [CrossRef]
- Radanliev, P.; De Roure, D. Disease X Vaccine Production and Supply Chains: Risk Assessing Healthcare Systems Operating with Artificial Intelligence and Industry 4.0. Health Technol. (Berl.) 2023, 13, 11–15. [Google Scholar] [CrossRef] [PubMed]
- Singh, R.; Sarsaiya, S.; Singh, T.A.; Singh, T.; Pandey, L.K.; Pandey, P.K.; Khare, N.; Sobin, F.; Sikarwar, R.; Gupta, M.K. Corona Virus (COVID-19) Symptoms Prevention and Treatment: A Short Review. J. Drug Deliv. Ther. 2021, 11, 118–120. [Google Scholar] [CrossRef]
- Kooli, C. COVID-19: Public Health Issues and Ethical Dilemmas. Ethics Med. Public Health 2021, 17, 100635. [Google Scholar] [CrossRef]
- Golan, M.S.; Jernegan, L.H.; Linkov, I. Trends and Applications of Resilience Analytics in Supply Chain Modeling: Systematic Literature Review in the Context of the COVID-19 Pandemic. Environ. Syst. Decis. 2020, 40, 222–243. [Google Scholar] [CrossRef]
- Schuerger, C.; Batalis, S.; Quinn, K.; Adalja, A.; Puglisi, A. Viral Families and Disease X: A Framework for U.s. Available online: https://cset.georgetown.edu/wp-content/uploads/CSET-Viral-Families-and-Disease-X-A-Framework-for-U.S.-Pandemic-Preparedness-Policy.pdf (accessed on 17 August 2023).
- Fontanet, A.; Cauchemez, S. COVID-19 Herd Immunity: Where Are We? Nat. Rev. Immunol. 2020, 20, 583–584. [Google Scholar] [CrossRef]
- Frederiksen, L.S.F.; Zhang, Y.; Foged, C.; Thakur, A. The Long Road toward COVID-19 Herd Immunity: Vaccine Platform Technologies and Mass Immunization Strategies. Front. Immunol. 2020, 11. [Google Scholar] [CrossRef] [PubMed]
- Kiviniemi, M.T.; Orom, H.; Hay, J.L.; Waters, E.A. Prevention Is Political: Political Party Affiliation Predicts Perceived Risk and Prevention Behaviors for COVID-19. BMC Public Health 2022, 22. [Google Scholar] [CrossRef] [PubMed]
- Rabin, C.; Dutra, S. Predicting Engagement in Behaviors to Reduce the Spread of COVID-19: The Roles of the Health Belief Model and Political Party Affiliation. Psychol. Health Med. 2022, 27, 379–388. [Google Scholar] [CrossRef] [PubMed]
- Thakur, N.; Han, C.Y. Country-Specific Interests towards Fall Detection from 2004–2021: An Open Access Dataset and Research Questions. Data (Basel) 2021, 6, 92. [Google Scholar] [CrossRef]
- Adalja, A.A.; Watson, M.; Toner, E.S.; Cicero, A.; Inglesby, T.V. Characteristics of Microbes Most Likely to Cause Pandemics and Global Catastrophes. In Current Topics in Microbiology and Immunology; Springer International Publishing: Cham, 2019; pp. 1–20. ISBN 9783030363109. [Google Scholar]
- Kreuder Johnson, C.; Hitchens, P.L.; Smiley Evans, T.; Goldstein, T.; Thomas, K.; Clements, A.; Joly, D.O.; Wolfe, N.D.; Daszak, P.; Karesh, W.B.; et al. Spillover and Pandemic Properties of Zoonotic Viruses with High Host Plasticity. Sci. Rep. 2015, 5, 1–8. [Google Scholar] [CrossRef]
- Jones, K.E.; Patel, N.G.; Levy, M.A.; Storeygard, A.; Balk, D.; Gittleman, J.L.; Daszak, P. Global Trends in Emerging Infectious Diseases. Nature 2008, 451, 990–993. [Google Scholar] [CrossRef]
- Carlson, C.J.; Albery, G.F.; Merow, C.; Trisos, C.H.; Zipfel, C.M.; Eskew, E.A.; Olival, K.J.; Ross, N.; Bansal, S. Climate Change Increases Cross-Species Viral Transmission Risk. Nature 2022, 607, 555–562. [Google Scholar] [CrossRef]
- Nuti, S.V.; Wayda, B.; Ranasinghe, I.; Wang, S.; Dreyer, R.P.; Chen, S.I.; Murugiah, K. The Use of Google Trends in Health Care Research: A Systematic Review. PLoS One 2014, 9, e109583. [Google Scholar] [CrossRef]
- Cook, S.; Conrad, C.; Fowlkes, A.L.; Mohebbi, M.H. Assessing Google Flu Trends Performance in the United States during the 2009 Influenza Virus A (H1N1) Pandemic. PLoS One 2011, 6, e23610. [Google Scholar] [CrossRef]
- Bragazzi, N.L.; Alicino, C.; Trucchi, C.; Paganino, C.; Barberis, I.; Martini, M.; Sticchi, L.; Trinka, E.; Brigo, F.; Ansaldi, F.; et al. Global Reaction to the Recent Outbreaks of Zika Virus: Insights from a Big Data Analysis. PLoS One 2017, 12, e0185263. [Google Scholar] [CrossRef]
- Ginsberg, J.; Mohebbi, M.H.; Patel, R.S.; Brammer, L.; Smolinski, M.S.; Brilliant, L. Detecting Influenza Epidemics Using Search Engine Query Data. Nature 2009, 457, 1012–1014. [Google Scholar] [CrossRef] [PubMed]
- Kapitány-Fövény, M.; Ferenci, T.; Sulyok, Z.; Kegele, J.; Richter, H.; Vályi-Nagy, I.; Sulyok, M. Can Google Trends Data Improve Forecasting of Lyme Disease Incidence? Zoonoses Public Health 2019, 66, 101–107. [Google Scholar] [CrossRef] [PubMed]
- Verma, M.; Kishore, K.; Kumar, M.; Sondh, A.R.; Aggarwal, G.; Kathirvel, S. Google Search Trends Predicting Disease Outbreaks: An Analysis from India. Healthc. Inform. Res. 2018, 24, 300. [Google Scholar] [CrossRef] [PubMed]
- Young, S.D.; Torrone, E.A.; Urata, J.; Aral, S.O. Using Search Engine Data as a Tool to Predict Syphilis. Epidemiology 2018, 29, 574–578. [Google Scholar] [CrossRef]
- Young, S.D.; Zhang, Q. Using Search Engine Big Data for Predicting New HIV Diagnoses. PLoS One 2018, 13, e0199527. [Google Scholar] [CrossRef] [PubMed]
- Morsy, S.; Dang, T.N.; Kamel, M.G.; Zayan, A.H.; Makram, O.M.; Elhady, M.; Hirayama, K.; Huy, N.T. Prediction of Zika-Confirmed Cases in Brazil and Colombia Using Google Trends. Epidemiol. Infect. 2018, 146, 1625–1627. [Google Scholar] [CrossRef] [PubMed]
- Ortiz-Martínez, Y.; Garcia-Robledo, J.E.; Vásquez-Castañeda, D.L.; Bonilla-Aldana, D.K.; Rodriguez-Morales, A.J. Can Google® Trends Predict COVID-19 Incidence and Help Preparedness? The Situation in Colombia. Travel Med. Infect. Dis. 2020, 37, 101703. [Google Scholar] [CrossRef]
- Google Trends. Available online: https://trends.google.com/trends/ (accessed on 18 August 2023).
- Mavragani, A.; Ochoa, G. Google Trends in Infodemiology and Infoveillance: Methodology Framework. JMIR Public Health Surveill. 2019, 5, e13439. [Google Scholar] [CrossRef]
- Arora, V.S.; McKee, M.; Stuckler, D. Google Trends: Opportunities and Limitations in Health and Health Policy Research. Health Policy 2019, 123, 338–341. [Google Scholar] [CrossRef]
- Mulero, R.; García-Hiernaux, A. Forecasting Spanish Unemployment with Google Trends and Dimension Reduction Techniques. SERIEs (Berl) 2021, 12, 329–349. [Google Scholar] [CrossRef]
- IEEE DataPort. Available online: https://ieee-dataport.org/ (accessed on 18 August 2023).
- Wilkinson, M.D.; Dumontier, M.; Aalbersberg, I.J.; Appleton, G.; Axton, M.; Baak, A.; Blomberg, N.; Boiten, J.-W.; da Silva Santos, L.B.; Bourne, P.E.; et al. The FAIR Guiding Principles for Scientific Data Management and Stewardship. Sci. Data 2016, 3, 1–9. [Google Scholar] [CrossRef] [PubMed]
- Wishart, D.S.; Guo, A.; Oler, E.; Wang, F.; Anjum, A.; Peters, H.; Dizon, R.; Sayeeda, Z.; Tian, S.; Lee, B.L.; et al. HMDB 5.0: The Human Metabolome Database for 2022. Nucleic Acids Res. 2022, 50, D622–D631. [Google Scholar] [CrossRef] [PubMed]
- Slenter, D.N.; Kutmon, M.; Hanspers, K.; Riutta, A.; Windsor, J.; Nunes, N.; Mélius, J.; Cirillo, E.; Coort, S.L.; Digles, D.; et al. WikiPathways: A Multifaceted Pathway Database Bridging Metabolomics to Other Omics Research. Nucleic Acids Res. 2018, 46, D661–D667. [Google Scholar] [CrossRef] [PubMed]
- Banda, J.M.; Tekumalla, R.; Wang, G.; Yu, J.; Liu, T.; Ding, Y.; Artemova, E.; Tutubalina, E.; Chowell, G. A Large-Scale COVID-19 Twitter Chatter Dataset for Open Scientific Research—an International Collaboration. Epidemiologia. (Basel) 2021, 2, 315–324. [Google Scholar] [CrossRef]
- Thakur, N. A Large-Scale Dataset of Twitter Chatter about Online Learning during the Current COVID-19 Omicron Wave. Data (Basel) 2022, 7, 109. [Google Scholar] [CrossRef]
- Thakur, N. MonkeyPox2022Tweets: A Large-Scale Twitter Dataset on the 2022 Monkeypox Outbreak, Findings from Analysis of Tweets, and Open Research Questions. Infect. Dis. Rep. 2022, 14, 855–883. [Google Scholar] [CrossRef]
- Gjerding, M.N.; Taghizadeh, A.; Rasmussen, A.; Ali, S.; Bertoldo, F.; Deilmann, T.; Knøsgaard, N.R.; Kruse, M.; Larsen, A.H.; Manti, S.; et al. Recent Progress of the Computational 2D Materials Database (C2DB). 2d Mater. 2021, 8, 044002. [Google Scholar] [CrossRef]
- Kearnes, S.M.; Maser, M.R.; Wleklinski, M.; Kast, A.; Doyle, A.G.; Dreher, S.D.; Hawkins, J.M.; Jensen, K.F.; Coley, C.W. The Open Reaction Database. J. Am. Chem. Soc. 2021, 143, 18820–18826. [Google Scholar] [CrossRef]
- Goodsell, D.S.; Zardecki, C.; Di Costanzo, L.; Duarte, J.M.; Hudson, B.P.; Persikova, I.; Segura, J.; Shao, C.; Voigt, M.; Westbrook, J.D.; et al. RCSB Protein Data Bank: Enabling Biomedical Research and Drug Discovery. Protein Sci. 2020, 29, 52–65. [Google Scholar] [CrossRef]
- Urban, M.; Cuzick, A.; Seager, J.; Wood, V.; Rutherford, K.; Venkatesh, S.Y.; De Silva, N.; Martinez, M.C.; Pedro, H.; Yates, A.D.; et al. PHI-Base: The Pathogen–Host Interactions Database. Nucleic Acids Res. 2019, 48, D613–D620. [Google Scholar] [CrossRef]


| List of Regions |
|---|
| Singapore, Haiti, Honduras, El Salvador, Madagascar, Panama, Bolivia, Reunion, Guatemala, Cuba, United Arab Emirates, Paraguay, Nicaragua, Hong Kong, Macao, Qatar, United Kingdom, Brunei, Ecuador, Uruguay, Oman, Bahrain, Ireland, Kuwait, Costa Rica, Argentina, India, Puerto Rico, Venezuela, France, St. Helena, Brazil, Mexico, Côte d’Ivoire, Peru, Canada, Australia, Zimbabwe, Colombia, United States, Luxembourg, Lebanon, Ghana, Algeria, New Zealand, Portugal, Malaysia, Myanmar (Burma), Ethiopia, Dominican Republic, China, Chile, Nepal, Belgium, Iraq, Taiwan, South Africa, Tunisia, Sri Lanka, Thailand, Switzerland, Spain, Bangladesh, Saudi Arabia, Kenya, South Korea, Germany, Norway, Pakistan, Indonesia, Hungary, Morocco, Austria, Israel, Nigeria, Bulgaria, Philippines, Netherlands, Denmark, Greece, Italy, Jordan, Egypt, Sweden, Finland, Czechia, Romania, Poland, Iran, Türkiye, Russia, Vietnam, Ukraine, Japan |
Disclaimer/Publisher’s Note: The statements, opinions and data contained in all publications are solely those of the individual author(s) and contributor(s) and not of MDPI and/or the editor(s). MDPI and/or the editor(s) disclaim responsibility for any injury to people or property resulting from any ideas, methods, instructions or products referred to in the content. |
© 2023 by the authors. Licensee MDPI, Basel, Switzerland. This article is an open access article distributed under the terms and conditions of the Creative Commons Attribution (CC BY) license (https://creativecommons.org/licenses/by/4.0/).


