Preprint
Article

Analysis of 14 β-Agonists in Pork Using Automated Wooden Tip Based SPME Device and UPLC-MS/MS

Altmetrics

Downloads

130

Views

34

Comments

0

This version is not peer-reviewed

Submitted:

23 August 2023

Posted:

24 August 2023

You are already at the latest version

Alerts
Abstract
This study presents an innovative analytical method for the detection and quantification of 14 β-agonists in pork using liquid chromatography-tandem mass spectrometry (LC-MS/MS). The method involves the use of a solid phase microextraction (SPME) probe, consisting of a wooden tip coated with polyacrylonitrile (PAN) and molecularly imprinted polymer (MIP). This probe has been integrated into an automated extraction device, designed in our laboratory to extract the target analytes prior to LC-MS/MS analysis. Compared to the traditional solid-phase extraction (SPE) procedure, the proposed approach significantly reduces the costs related to adsorbent ma-terial and solvent consumption, and shortens purification time, thereby reducing both the tech-nical workload and associated expenses. The methodology has been carefully validated in ac-cordance with the National Standard of the People's Republic of China (GB/T 22286-2008), evalu-ating key parameters including the limit of detection (LOD), limit of quantification (LOQ), matrix effects, linearity, and both intra-day and inter-day precision. The average recovery rates for all β-agonists were observed to lie between 71.6% and 82.2%, with relative standard deviations (RSDs) consistently below 15% for both types of precision. The LOD and LOQ values were found to range from 0.09 to 0.39 μg/kg and 0.27 to 0.99 μg/kg, respectively. In terms of accurate detection of positive samples, the developed method demonstrated a closer approximation to the true value of the sample compared to the National Standard method GB/T 31658.22-2022. Overall, the proposed method exhibits substantial promise for the routine assessment of β-agonists in pork and presents a practical alternative for compliance monitoring in regulatory settings.
Keywords: 
Subject: Chemistry and Materials Science  -   Analytical Chemistry

1. Introduction

β-agonists represent a class of drugs that are characterized by their phenylethanolamine structure, and are primarily used to treat bronchial diseases[1]. Extensive studies in animal models indicate that administration of β-agonists at levels 5-10 times greater than the recommended therapeutic dose can significantly enhance feed conversion rates and lipolysis, while increasing protein synthesis[2]. Prolonged use of β-agonists-supplemented feeds has been observed to improve feed conversion efficiency while increasing animal body weight and muscle tissue content, thereby boosting the rate of lean meat production[3]. This demonstrates the ability of β-agonists to redirect nutrients within the organism. Therefore, in the livestock industry, β-agonists are often incorporated into feeds or drinking water to accelerate animal growth and increase lean meat yield. Clenbuterol, ractopamine, and salbutamol are the most used compounds. Recently, with the advent of additional β-agonists, drugs such as semantrol and bambuterol have also been exploited in animal husbandry to stimulate growth. Nevertheless, these compounds may accumulate in the animal's body over time, leading to potential toxicity and adverse side effects from prolonged exposure. Excessive use of β-agonists in pigs, cattle, sheep, and other livestock has led to the bioaccumulation of these compounds in the animals. Consequently, when humans consume food derived from these animals, residues of β-agonists may pose significant health risks[4]. In severe cases, acute toxic reactions can even occur, with common symptoms including muscle tremor or pain, tachycardia, headache, dizziness, and nausea. In extremely serious situations, the toxicity may induce shock and potentially lead to death[5,6].
To ensure food safety, the use of clenbuterol as a growth promoter is currently prohibited in several jurisdictions, including China, the United States, and the European Union[7]. European legislation sets a maximum residue limit (MRL) of 0.5 μg/kg for clenbuterol in horse and bovine liver[8]. This threshold is consistent with China's national standard, GB/T5009.192-2003, which stipulates a limit of detection (LOD) for clenbuterol in animal food of 0.5 μg/kg[9]. Moreover, ractopamine (RAC) is also forbidden as a feed additive in the European Union, Japan, China, and most countries worldwide[10]. However, its use is permitted in Canada, the United States, and Brazil, where it is approved for utilization in cattle, turkey, and swine[10]. According to the recommendations of the Joint FAO/WHO Expert Committee on Food Additives (JECFA), the MRLs for ractopamine in muscle, fat, liver, and kidney tissues are set at 10, 10, 40, and 90 μg/kg, respectively[10]. They also establish the acceptable daily intake (ADI) at a range of 0-1 μg/kg body weight per day[10]. Furthermore, China and the European Union have generally proscribed the use of all β-agonists as growth promoters and have instituted several regulations to deter and manage their illicit use in the animal husbandry industry. These policies collectively underscore the global commitment to mitigating potential public health risks associated with the consumption of animal products containing β-agonist residues. Under these circumstances, it is of paramount importance to develop rapid, precise, and reliable method for the detection of residues of β-agonists in animal foods.
In modern analytical chemistry, several instruments, including capillary electrophoresis (CE)[11], gas chromatography-tandem mass spectrometry (GC-MS/MS)[12], liquid chromatography-tandem mass spectrometry (LC-MS/MS)[13,14], and nanosensors[15] have proven themselves preferred techniques for the detection of β-agonists. Among these technology, LC-MS/MS is characterized by its superior sensitivity, precision, and reproducibility, making it mostly adopted[1,16,17]. To improve the detection and quantification limits of LC-MS/MS and to mitigate matrix effects that could bias the detection results, several sample pretreatment methods have been developed. These include the Quick, Easy, Cheap, Effective, Rugged, and Safe (QuEChERS) method[18], solid-phase extraction (SPE)[19-21], disposable Pipette Extraction (DPX)[22], and solid-phase micro-extraction (SPME)[23]. While these strategies are effectively in reducing matrix interferences and enabling higher sample throughput, they are not without challenges. For example, these methods often require significant sample and solvent usage, incur high cost for purification material costs, and are labor-intensive to perform.
In a previous study, our team presented a rough, cost-effective, and easily fabricated wooden-tip-based SPME probe designed for detecting veterinary drug residues in complex matrices[24]. This SPME was constructed using a simple dip-coating method, applying adsorbents to the surface of the wooden tip. Compared to the more ubiquitous SPE techniques, our SPME methodology offers several advantages: it streamlines the sample clean-up process, reduces solvent consumption, requires less adsorption material, and lowers the overall cost of the assay. Moreover, the SPME probe can be reused after cleaning. To further increase the effectiveness of this SPME probe, we have designed and developed an automated apparatus to complement its operations. The aim of this study is to increase detection efficiency and save analysis costs. This is achieved by integrating our automated pre-treatment device with LC-MS/MS for the simultaneous detection of 14 β-agonists in pork samples.

2. Materials and Methods

2.1. Chemicals and Reagents

The mixed standard solution for 14 β-agonists (including salbutamol, ractopmine, cimbuterol, clenbuterol, terbutaline, bambuterol, mapenterol, penbuterol, mabuterol,brobuterol, phenethanolamine A, tobuterol, clorprenaline, and formoterol) was obtained from TMRM (China) (100 μg/mL). A Milli-Q purification system (Millipore, USA) was used to produce deionized water. The polyacrylonitrile (PAN) powder was obtained from Macklin (Shanghai, China). The molecularly imprinted polymers (MIP) were bought from Persee (China) (template molecule: clenbuterol). Analytically pure reagents ammonium acetate, acetic acid, dimethyl sulfoxide was purchased from Kermel (China). HPLC-grade methanol, acetonitrile, isopropanol, and ethyl acetate were obtained from Merk (German). β-glucuronidase/sulfatase (>100,000 units/mL) was purchased from Anpel (China). The proficiency test sample was provided by China National Accreditation Service for Conformity Assessment (CNAS) (Poject No. PT-FATA-2022-5; sample No. 058). Medical cotton swabs to prepare wooden tip based SPME were purchased from a local medical store in Weifang (China). Pork was bought at a local supermarket.

2.2. Standard Solutions

Standard Stock Solution: Accurately weigh 100 μL of the mixed standard solution accurately and make up the concentration of 1 μg/mL with methanol. A series of working solutions (mixed standard solutions and matrix-matched standard solutions) were prepared at concentrations of 1, 2, 5, 10, 15, 20 ng/L. All stock and working standard solutions were stored at −20°C until further use.

2.3 Preparation of PAN/MIP-Coated Wooden-Tip-Based SPME

Dissolve 10 g of PAN powder in 100 mL of dimethylformamide (DMF) at room temperature, stirring constantly to ensure uniform dissolution. Mix 1g MIP and 10 mL of PAN solution to obtain a PAN-MIP slurry. Remove the cotton from the tip of the medicinal swab, dip the wooden stick into the PAN-MIP slurry about 1 cm deep so that the glue is evenly coated on the wooden tip, and then dip and coat again after it has dried slightly.

2.4 Sample Preparation

For sample preparation, 2 g of a homogenized sample (accurate to 0.01 g) was weighed and transferred to a 10 mL polypropylene centrifuge tube. Thereto was added 5 mL of extraction solution consisting of an aqueous ammonium acetate/acetic acid solution (0.77 g ammonium acetate and 0.03 mL acetic acid) together with 100 μL of β-glucuronidase/sulfatase. The mixture was then vortexed at 2000 rpm for 1 minute. Subsequently, it was incubated in a water bath at 37℃ for 2 hours, shielded from light. Following incubation, the solution was centrifuged 4℃ and 12000 rpm for 5 minutes and 2 mL of upper solution containing the sample was collected for further purification.

2.5 Automated Wooden-tip SPME Procedure
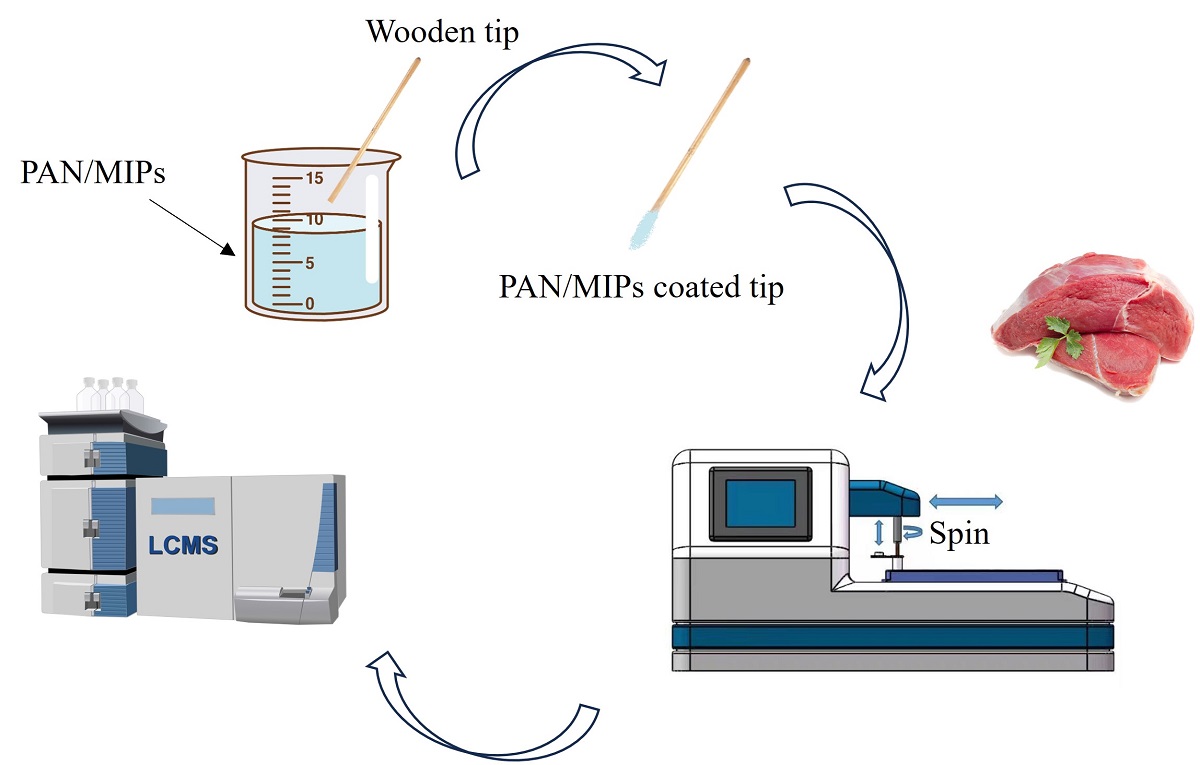
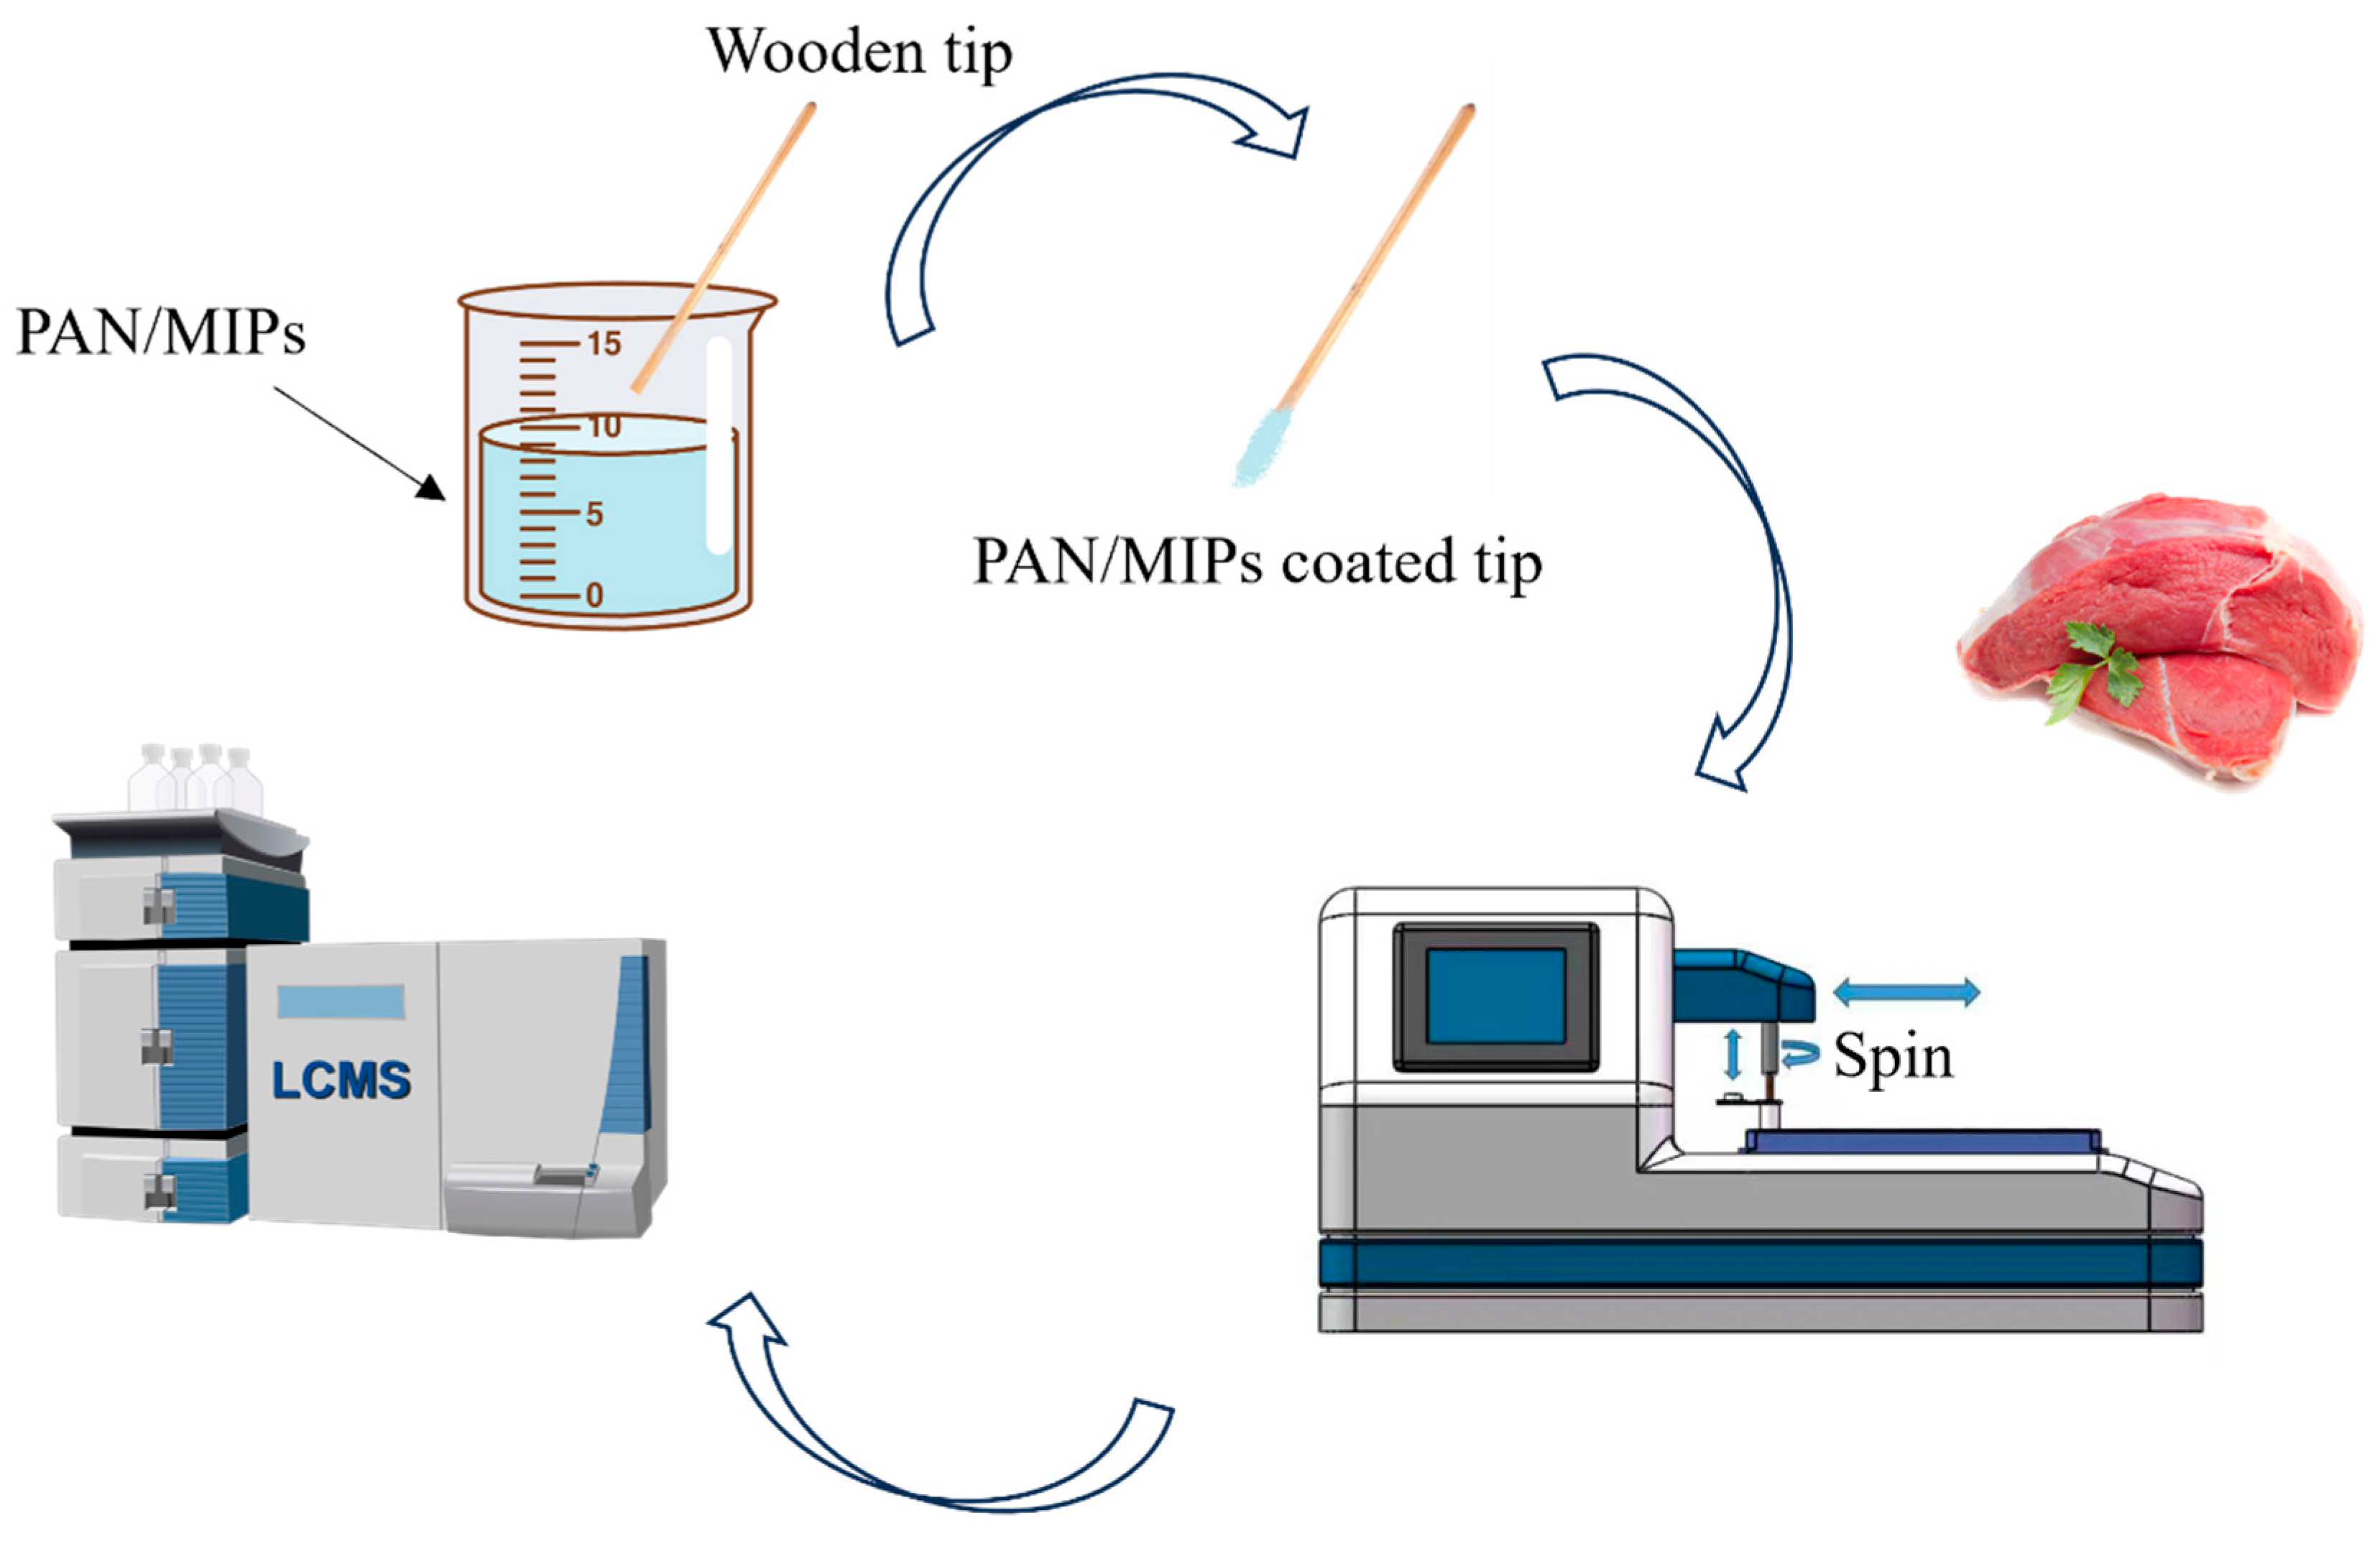
Attach the prepared PAN-MIP tips to the automated extraction device and program the device to automatically perform the following sequence:
a. Activation: 0.5 mL of solvent consisting of a mixture of acetic acid and methanol in a 1:9 ratio, spinning at 1000 rpm for 1 minute. Subsequently, spin in 0.5 mL of methanol solution at 1000 rpm for 1 minute.
b. Equilibration: 0.5 mL of water, spinning at 1000 rpm for 1 minute.
c. Adsorption: 2 mL of the sample, spinning at 1000 rpm for 2 minutes.
d. Wash: 0.5 mL of water, spinning at 1000 rpm for 1 minute.
e. Desorption: 0.5 mL (mixture of acetic acid and methanol in a 1:9 ratio), spinning at 1000 rpm for 2 minutes.
The sequential extraction steps are depicted schematically in Figure 2. After the desorption process, the samples were dried with nitrogen gas. The volume was then brought to 0.5 mL with a solution of 0.1% aqueous formic acid in a 30:70 methanol/formic acid ratio for LC-MS/MS analysis.
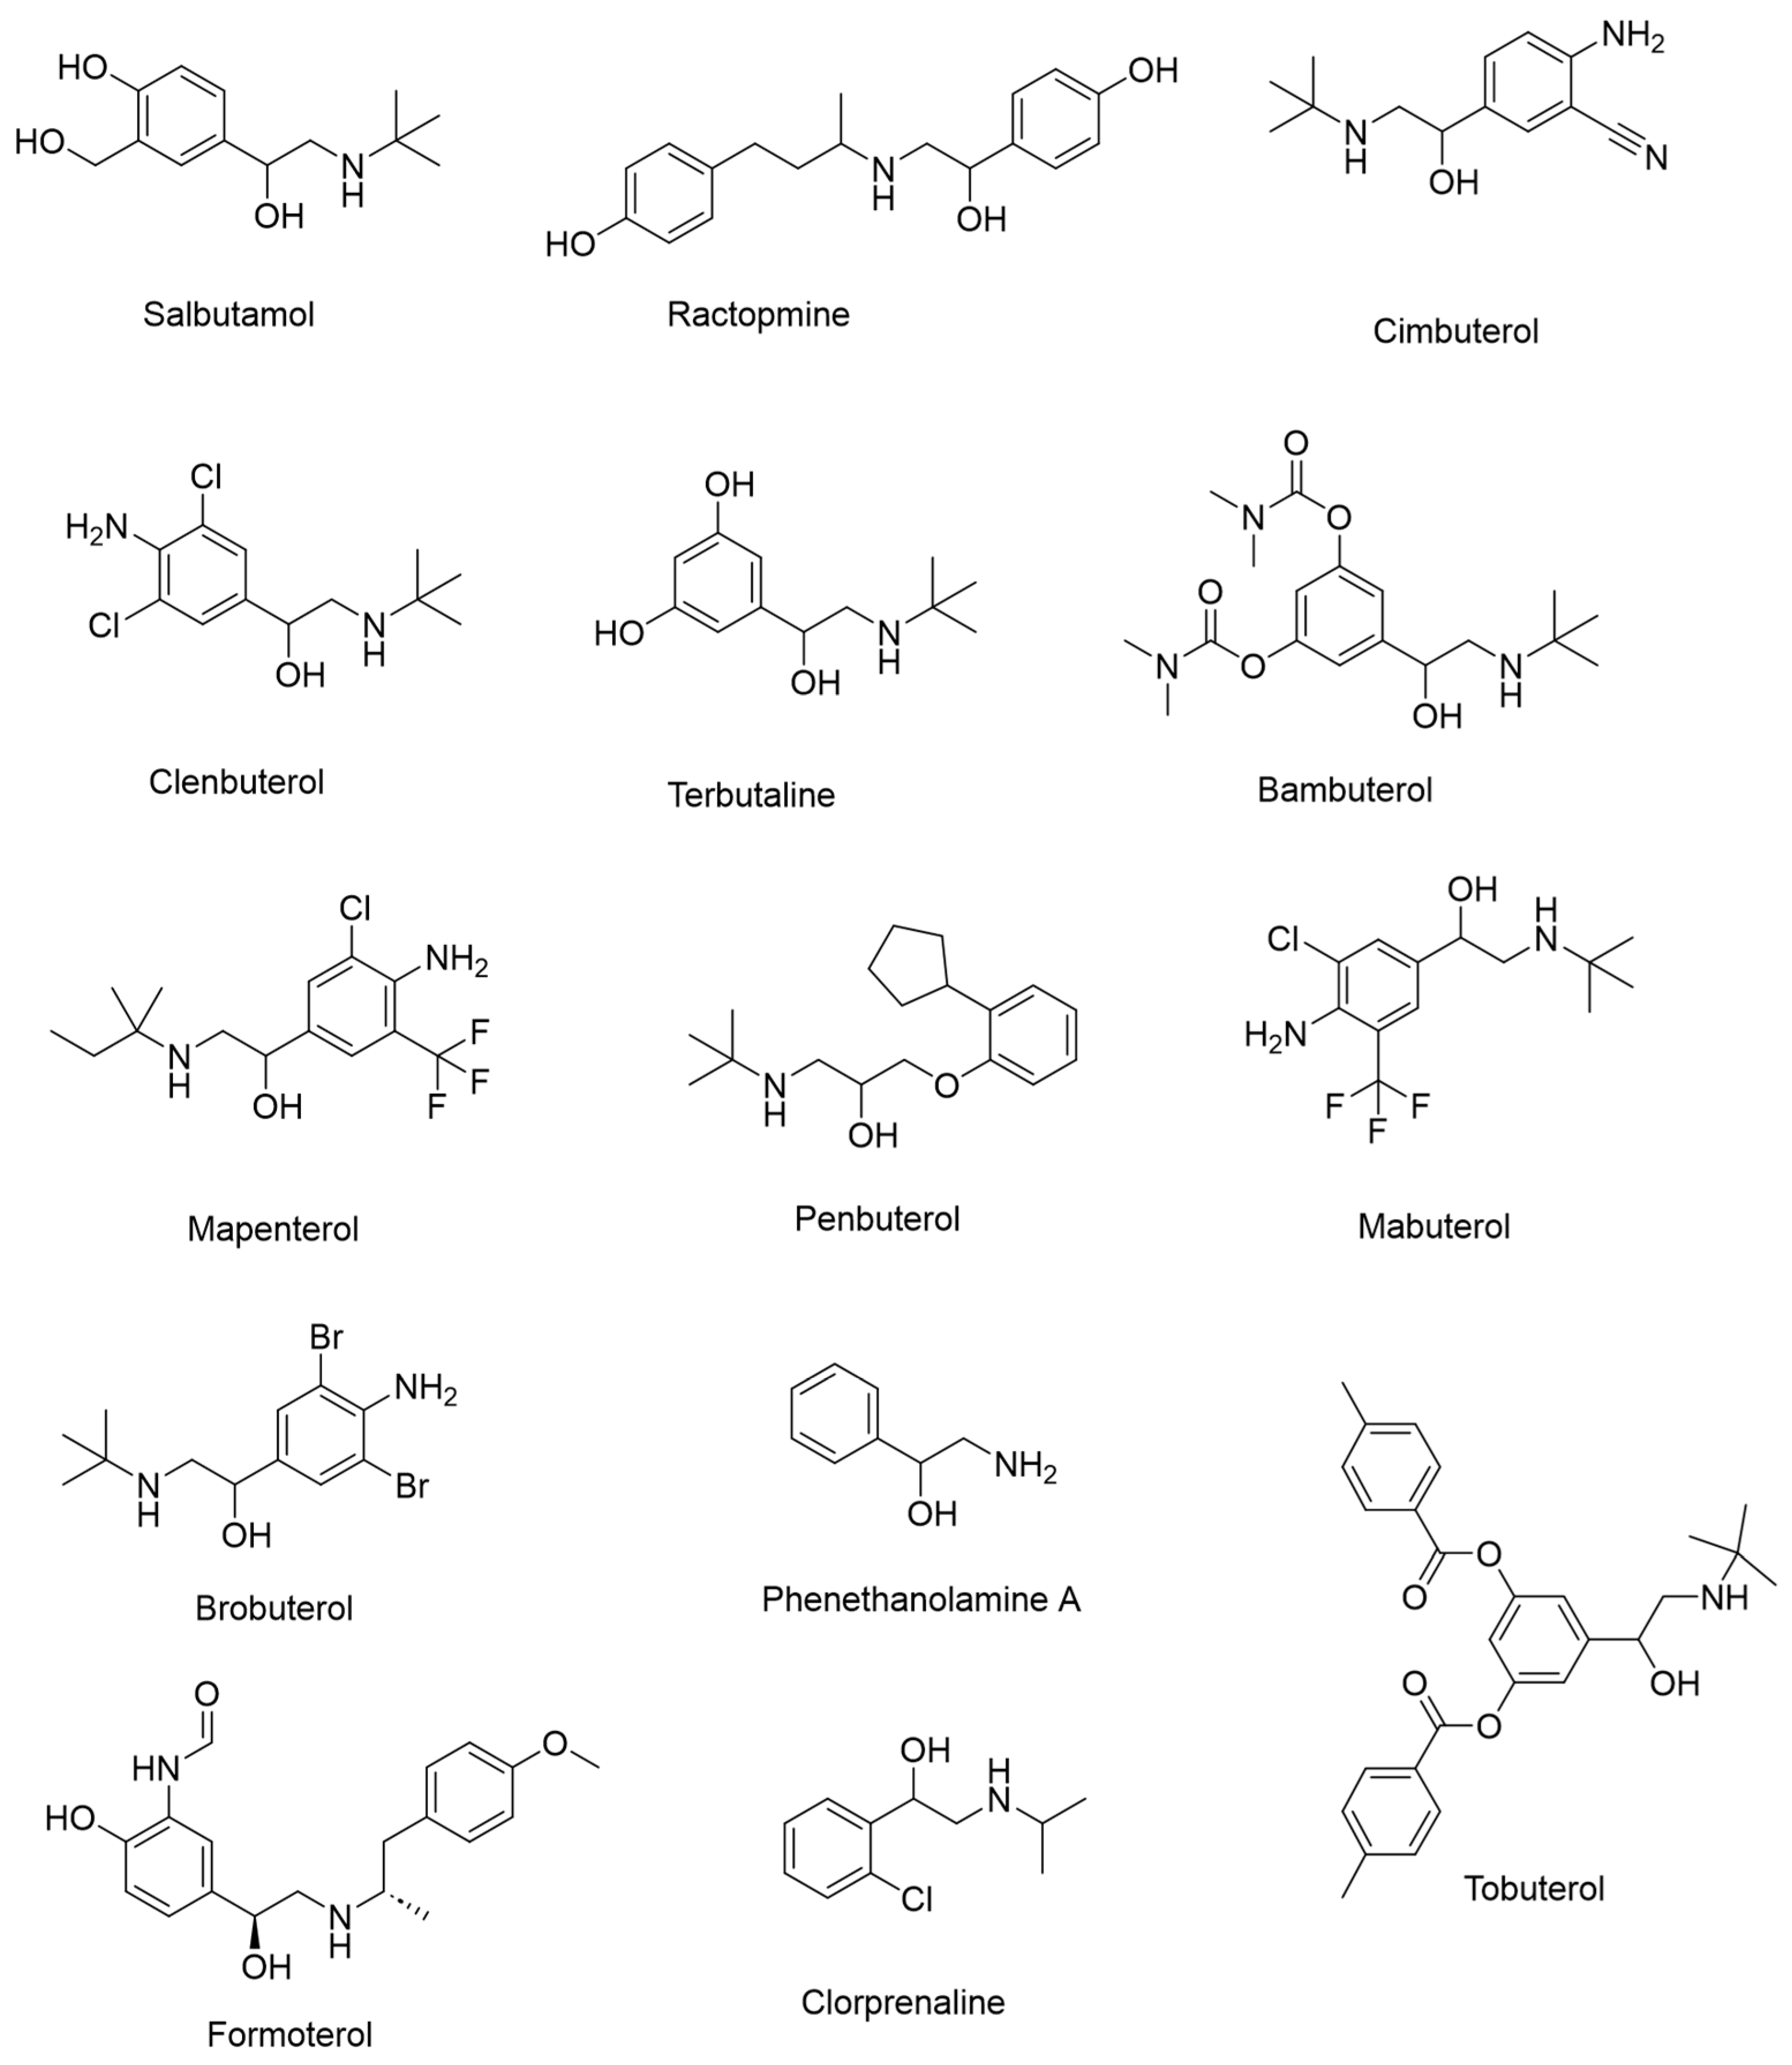
Figure 1. Structures of 14 β-agonists.
Preprints 83115 g001
Figure 2. Schematic diagram of the procedure of automated SPME device in combination with LC-MS/MS for the detection of β-agonists in pork samples.
Preprints 83115 g002

2.6 LC-MS/MS Analysis

Samples were analyzed on the AB Science Qtrap 5500 system equipped with a Waters UPLC. The LC instrument is coupled with a binary pump, an autosampler and an Agilent C18 (3.0 mm×100mm×1.8μm). The column oven was kept at 40 ℃ during operation. The analytes were separated using a mobile phase consisting of 0.1% formic acid in water (eluent A) and acetonitrile (eluent B) at a flow rate of 0.3 mL/min. Gradient elution program: 0~0.5 min, 10% B; 0.5~3.0 min, 50% B; 3.0~5.0 min, 50~60% B; 5.0~5.1 min, 60~90% B; 5.1~6.0 min, 90% B; 6.0~8.0 min, 90~10% B. The injection volume was 10 μL.
A triple quadrupole mass spectrometer (AB Science Qtrap 5500) was used for quantification of the target compounds. Data collection was monitored using the Analyst 1.6.2 software. The optimized source parameters are as follows:
• spry voltage of 5.5 kV
• vaporizer temperature of 450 ℃
• curtain gas (CUR) pressure of 35 psi
• ion-source gas 1 (GS1, nebulizer gas) pressure of 55 psi
• ion-source gas 2 (GS2, turbo gas) pressure of 55 psi
All β-agonists were tested in the MRM mode with positive ESI. The compound dependent parameters are listed in Table 1.

3. Results and Disscussion

3.1 Wooden tip SPME surface coating optimization

It has been reported that PAN, a biocompatible polymer, is combined with HLB to provide excellent extraction of a wide range of compounds[25]. The MIP used in this work exhibit a robust selectivity for β-agonists. Therefore, the ratio of PAN to MIP needs to be optimized to enhance the adsorption rate of the target compounds. In this study, the MIP were initially dosed at 1g, and PAN was then mixed with 10 mL of DMF at 1:5, 1:10, 1:20, and 1:30 (g:mL) ratios. It was observed that the 1:5 PAN to DMF mixture was overly viscous, leading to coatings on the tips that were prone to breakage. In contrast, a ratio of 1:30 resulted in a less viscous mixture, and the coating formed could be easily peeled off. A 1:10 ratio gave a suspension of suitable viscosity and allowed the wooden tip to be coated relatively evenly. Thus, the ratio of PAN to DMF was fixed at 1:10 (10 mL), and MIP were added at dosages of 0.25g, 0.50g, 0.75g and 1 g. In the dip-coating process, the amount of MIP added significantly influenced the coating characteristics. When the MIP level was 0.25g, 0.50g, or 0.75g, the slurry was thinner, requiring double application of the coating. Conversely, when incorporating 1g of MIP, a single application was sufficient. From a visual perspective, it was observed that the coating was more uniform when the MIP addition amount were 0.50g, 0.75g, and 1g (Figure S1).
To further evaluate the adsorption efficiencies of four SPME tips (a: 0.25 g MIP, b:0.50 g MIP, c:0.75 g MIP, d:1g MIP) for all agonists, an experimental investigation was conducted (Figure S1). The blank matrix spiked sample solution, after pretreatment and at a spiked concentration of 20 μg/kg, was divided into two parts. The first part was analyzed using the method prescribed in GB31658.22-2022[26], resulting in the quantification of agonists content, denoted as W0. The second part was initially treated with the method established in this study, followed by further purification step as mentioned in GB31658.22-2022, which allowed the calculation of the agonist drugs content, W1. The adsorption rate k then derived using the formula k=(W0-W1)/W0×100%. The results demonstrated that the tip c yielded satisfactory outcomes, and further increase in MIP content did not consistently enhance the adsorption rate of SPME. Consequently, tip c was selected for subsequent studies and the absorption rate ranged from 70% to 89% for all 14 drugs, as detailed in Table S2. The desorption rates of 14 β-agonists adsorbed on tip c, as assessed in mixed solvents, are detailed in Table S2. These rates ranged from 85.6% to 97.0%, signifying that the target substances could be adequately eluted.

3.2 Method validation

The method proposed in this work has been validated according to the Chinese national standard (GB/T 27404-2008)[27]. Validation including matrix effect, linearity, accuracy, precision, limit of detection (LOD), and limit of quantification (LOQ).
Matrix effect (ME): The slope of the solvent calibration curve and the matrix-matched blank extract calibration curve were used to determine the ME in pork samples, according to the equation: ME (%) = [(slope of matrix-matched calibration curve-slope of solvent standard calibration curve)/slope of solvent standard calibration curve] ×100. When the matrix effect (ME) value exceeded 120%, this indicated an enhancing effect, reflecting an augmentation in the analytical signal. On the other hand, if the ME was below 80%, this denoted an inhibitory effect, signifying a suppression of the signal. A ME value in the range of 80% to 120% was considered statistically insignificant, meaning that the matrix did not significantly affect the analytical response. On specific analysis of the 14 β-agonists, it was found that the ME values were all within this range, confirming that the matrix effect was not a significant factor in the observed results (Table 2).
Linearity: Calibration curves were established by plotting the peak area ratios of the target compounds versus the concentrations of the corresponding calibration standards at six concentrations (1, 2, 5, 10, 15, 20 ng/L) with six replicates at each level. The linearity was determined by the correlation coefficients of the calibration curves. For each analyte, plots of instrument response versus concentration were generated and the linear equations and correlation coefficients determined by linear regression analysis. For all 14 analytes, regression lines with coefficient of determination (r2) above 0.9993 were obtained as shown in Table 2.
Accuracy and precision: Accuracy was measured by spiking samples with three different levels of mixed β-agonists standards (1, 5, and 10 μg/kg) and calculating the recoveries. Both intra-day precision (repeatability) and inter-day (reproducibility) precision were evaluated and expressed as relative standard deviation (RSD). Intra-day precision was assessed using the same concentrations (1, 5, and 10 μg/kg), with six parallel tests performed for each level. Inter-day precision was explored by spiking six samples at 1, 5, and 10 μg/kg on different days. As can be seen in Table 3, the intraday average recovery of all analytes ranges from 71.6%~82.2% (RSD: 9.2%~12.9%). The interday recoveries were from 72.5%~82.3% (RSD: 9.8%~13.4%).
of Detection and Quantification: The LODs and LOQs for the method were defined corresponding to the signal-to-noise ratios of 3 and 10, respectively. LODs for the 14 targets ranged from 0.09 to 0.39 μg/kg, and the LOQs varied from 0.27 to 0.99 μg/kg. These ranges are sufficient to meet the demands of both qualitative and quantitative analyses.
Chromatograms of 14 kinds of β-agonists are shown in Figure 3.

3.3 Analysis of positive sample

To assess the accuracy of the method with respect to positive samples, the method developed in this study was utilized to analyze proficiency test sample provided by CNAS (No. ACAS-PT-1048) for the determination of 3 β-agonists in pork. The results, presented in Table 4, demonstrate that the method described here is in better agreement with the actual values than the Chinese national GB standard method (GB/T 31658.22-2022), which employs a solid-phase extraction (SPE) purification step. Furthermore, the method proposed in this study offers distinct advantages over the GB/T 31658.22-2022 standard, particularly in aspects such as the reduction of adsorbent material cost, minimization of solvent consumption, decrease in purification time, and enhancement in automation, as detailed in Table 5.

4. Conclusions

In alignment with the principles of green analytical chemistry (GAC), which emphasizes sustainability and environmental responsibility, we have developed an automated SPME technique for the detection of 14 β-agonists in pork. This innovative approach offers several distinct advantages over the conventional national standard method GB31658.22-2022, currently prevalent in China. Specifically, our method reduces adsorbent material costs, minimizes organic solvent consumption, decreases purification time, and lowers labor costs. Additionally, the accuracy of our method has been shown to be closer to ture values when testing real samples compared to GB31658.22-2022. Considering these factors, our method presents a viable and more efficient alternative that could be adopted by regulatory agencies and applied in analytical laboratories.

Supplementary Materials

The following supporting information can be downloaded at the website of this paper posted on Preprints.org. Figure S1: title; Table S1: title; Video S1: title.

Author Contributions

Kai Li and Xiaoming Gong contributed equally to this work. Project management: Kai Li; experiment and analysis: Xiaoming Gong, Liming Jin, Mengxiao Liu, Mengmeng Hua; writing manuscript: Kai Li; revising: Kai Li; All authors have read and agreed to the published version of the manuscript.

Funding

This research was funded by General Administration of Customs P. R. China, grant number 2022HK030 and 2020HK201. And from the Key Laboratory of Biotechnology and Resource Utilization, Ministry of Education, grant number KF2023003.

Institutional Review Board Statement

Not applicable.

Informed Consent Statement

Not applicable.

Data Availability Statement

All data that support the findings of this study are included within the article.

Conflicts of Interest

The authors state that they have no known conflict of interest or personal relationships that could have influenced the work reported in this paper.

References

  1. Yan, Y.; Ning, J.; Cheng, X.; Lv, Q.; Teng, S.; Wang, W. Rapid and High-Throughput Determination of Sixteen β-agonists in Livestock Meat Using One-Step Solid-Phase Extraction Coupled with UHPLC-MS/MS. Foods 2022, 12, 76. [Google Scholar] [CrossRef]
  2. Juan, C.; Igualada, C.; Moragues, F.; León, N.; Mañes, J. Development and validation of a liquid chromatography tandem mass spectrometry method for the analysis of β-agonists in animal feed and drinking water. J. Chromatogr. A. 2010, 1217, 6061–6068. [Google Scholar] [CrossRef]
  3. Centner, T.J.; Alvey, J.C.; Stelzleni, A.M. Beta agonists in livestock feed: Status, health concerns, and international trade. J. Anim. Sci. 2014, 92, 4234–4240. [Google Scholar] [CrossRef]
  4. Brambilla, G.; Cenci, T.; Franconi, F.; Galarini, R.; Macrı, A.; Rondoni, F.; Strozzi, M.; Loizzo, A. Clinical and pharmacological profile in a clenbuterol epidemic poisoning of contaminated beef meat in Italy. Toxicol. Lett. 2000, 114, 47–53. [Google Scholar] [CrossRef]
  5. Giannetti, L.; Ferretti, G.; Gallo, V.; Necci, F.; Giorgi, A.; Marini, F.; Gennuso, E.; Neri, B. Analysis of beta-agonist residues in bovine hair: Development of a UPLC–MS/MS method and stability study. J. Chromatogr. B. 2016, 1036-1037, 76–83. [Google Scholar] [CrossRef]
  6. Guo, P.; Wan, J.; Zhan, C.; Zhu, C.; Jiang, W.; Ke, Y.; Ding, S.; Wang, D. A simplified sample pretreatment for the rapid determination of 22 β-agonist residues in swine muscle and liver tissues by ultra-high-performance liquid chromatography tandem mass spectrometry. J. Chromatogr. B. 2018, 1096, 122–134. [Google Scholar] [CrossRef]
  7. Kuiper, H.A.; Noordam, M.Y.; van Dooren-Flipsen, M.M.H.; Schilt, R.; Roos, A.H. Illegal use of β-adrenergic agonists: European Community. J. Anim. Sci. 1998, 76, 195–207. [Google Scholar] [CrossRef]
  8. Commission Regulation (EU) No 37/2010 of 22 December 2009 on pharmacologically active substances and their classification regarding maximum residue limits in foodstuffs of animal origin (Text with EEA relevance).
  9. GB/T5009.192-2003 Determination of 4-Amino-3,5-dichloro-alpha-[(tert-butylamino)methyl]-benzyl alcohol (clenbuterol) residues in animal foods.
  10. Zhang, W.; Wang, P.; Su, X. Current advancement in analysis of β-agonists. TrAC Trends Analyt. Chem. 2016, 85, 1–16. [Google Scholar] [CrossRef]
  11. He, Z.; Fan, H. Research progress of Electrochemical Detection of β-Agonists: a mini-review. Int. J. Electrochem. Sci. 2019, 14, 9449–9458. [Google Scholar] [CrossRef]
  12. Cao, Z.; Cao, G.; Zhang, Y.; Liu, X.; Hua, Z. Determination of multi-residue β-agonists in cooked meat by isotope dilution-gas chromatography-tandem mass spectrometry. J. Food Saf. Qual. 2020, 11, 9140–9146. [Google Scholar]
  13. Zhu, B.; Cai, L.; Jiang, Z.; Li, Q.; Guo, X. Simultaneous stereoselective determination of seven β-agonists in pork meat samples by ultra-performance liquid chromatography-tandem mass spectrometry. Microchem. J. 2019, 150, 104082. [Google Scholar] [CrossRef]
  14. Kaufmann, A.; Widmer, M.; Maden, K.; Butcher, P.; Walker, S. High resolution mass spectrometry-based detection and quantification of β-agonists at relevant trace levels in a variety of animal-based food matrices. Food Addit. Contam. Part A 2021, 38, 1350–1363. [Google Scholar] [CrossRef]
  15. Li, G.; Zhang, X.; Zheng, F.; Liu, J.; Wu, D. Emerging nanosensing technologies for the detection of β-agonists. Food Chem. 2020, 332, 127431. [Google Scholar] [CrossRef]
  16. Castilla-Fernández, D.; Moreno-González, D.; Beneito-Cambra, M.; Molina-Díaz, A. Critical assessment of two sample treatment methods for multiresidue determination of veterinary drugs in milk by UHPLC-MS/MS. Anal. Bioanal. Chem. 2019, 411, 1433–1442. [Google Scholar] [CrossRef]
  17. Hsieh, Y.-H.; Jung, W.-T.; Lee, H.-L. Novel vinylene-based covalent organic framework as a promising adsorbent for the rapid extraction of beta-agonists in meat samples. Anal. Chim. Acta 2023, 341492. [Google Scholar] [CrossRef]
  18. Yang, M.; Yi, J.; Hu, X.; Dong, Q.; Xu, Q.; Li, S.; Lu, Y.; Jiang, X.; Tu, F. Determination of 14 β-agonists in infant formulas using QuEChERS-high performance liquid chromatography-tandem mass spectrometry. China Dairy Ind. 2019, 47, 52–64. [Google Scholar]
  19. Wang, L.-Q.; Zeng, Z.-L.; Su, Y.-J.; Zhang, G.-K.; Zhong, X.-L.; Liang, Z.-P.; He, L.-M. Matrix effects in analysis of β-agonists with LC-MS/MS: influence of analyte concentration, sample source, and SPE type. J. Agric. Food Chem. 2012, 60, 6359–6363. [Google Scholar] [CrossRef]
  20. Wang, L.; Zeng, Z.; Wang, X.; Yang, J.; Chen, Z.; He, L. Multiresidue analysis of nine β-agonists in animal muscles by LC-MS/MS based on a new polymer cartridge for sample cleanup. J. Sep. Sci. 2013, 36, 1843–1852. [Google Scholar] [CrossRef]
  21. Kulikovskii, A.V.; Lisitsyn, A.B.; Gorlov, I.F.; Slozhenkina, M.I.; Savchuk, S.A. Determination of growth hormones (β-agonists) in muscle tissue by HPLC with mass spectrometric detection. J. Anal. Chem. 2016, 71, 1052–1056. [Google Scholar] [CrossRef]
  22. Mastrianni, K.R.; Metavarayuth, K.; Brewer, W.E.; Wang, Q. Analysis of 10 β-agonists in pork meat using automated dispersive pipette extraction and LC-MS/MS. J. Chromatogr. B. 2018, 1084, 64–68. [Google Scholar] [CrossRef]
  23. Peng, C.; Zhang, S.; Wu, C.; Feng, Y.; Zhao, X.; Li, J.; Zhang, Q. Self-assembly preparation of Zn2+-immobilized silica hybrid monolith and application in solid-phase micro-extraction of β-agonists. J. Sep. Sci. 2022, 45, 4460–4468. [Google Scholar] [CrossRef]
  24. Gong, X.; Li, K.; Xu, W.; Jin, L.; Liu, M.; Hua, M.; Tian, G. Determination of Nitrofuran Metabolites in Complex Food Matrices Using a Rough, Cheap, Easy-Made Wooden-Tip-Based Solid-Phase Microextraction Probe and LC-MS/MS. J. Chem. 2022, 2022. [Google Scholar] [CrossRef]
  25. Reyes-Garcés, N.; Bojko, B.; Pawliszyn, J. High throughput quantification of prohibited substances in plasma using thin film solid phase microextraction. J. Chromatogr. A. 2014, 1374, 40–49. [Google Scholar] [CrossRef]
  26. GB/T 31658.22-2022 National food safety standard-Determination of β-agonists residues in animal derived food by liquid chromatograpy-tandem mass spectrometric method.
  27. GB/T 27404-2008 Criterion on quality control of laboratories-Chemical testing of food.
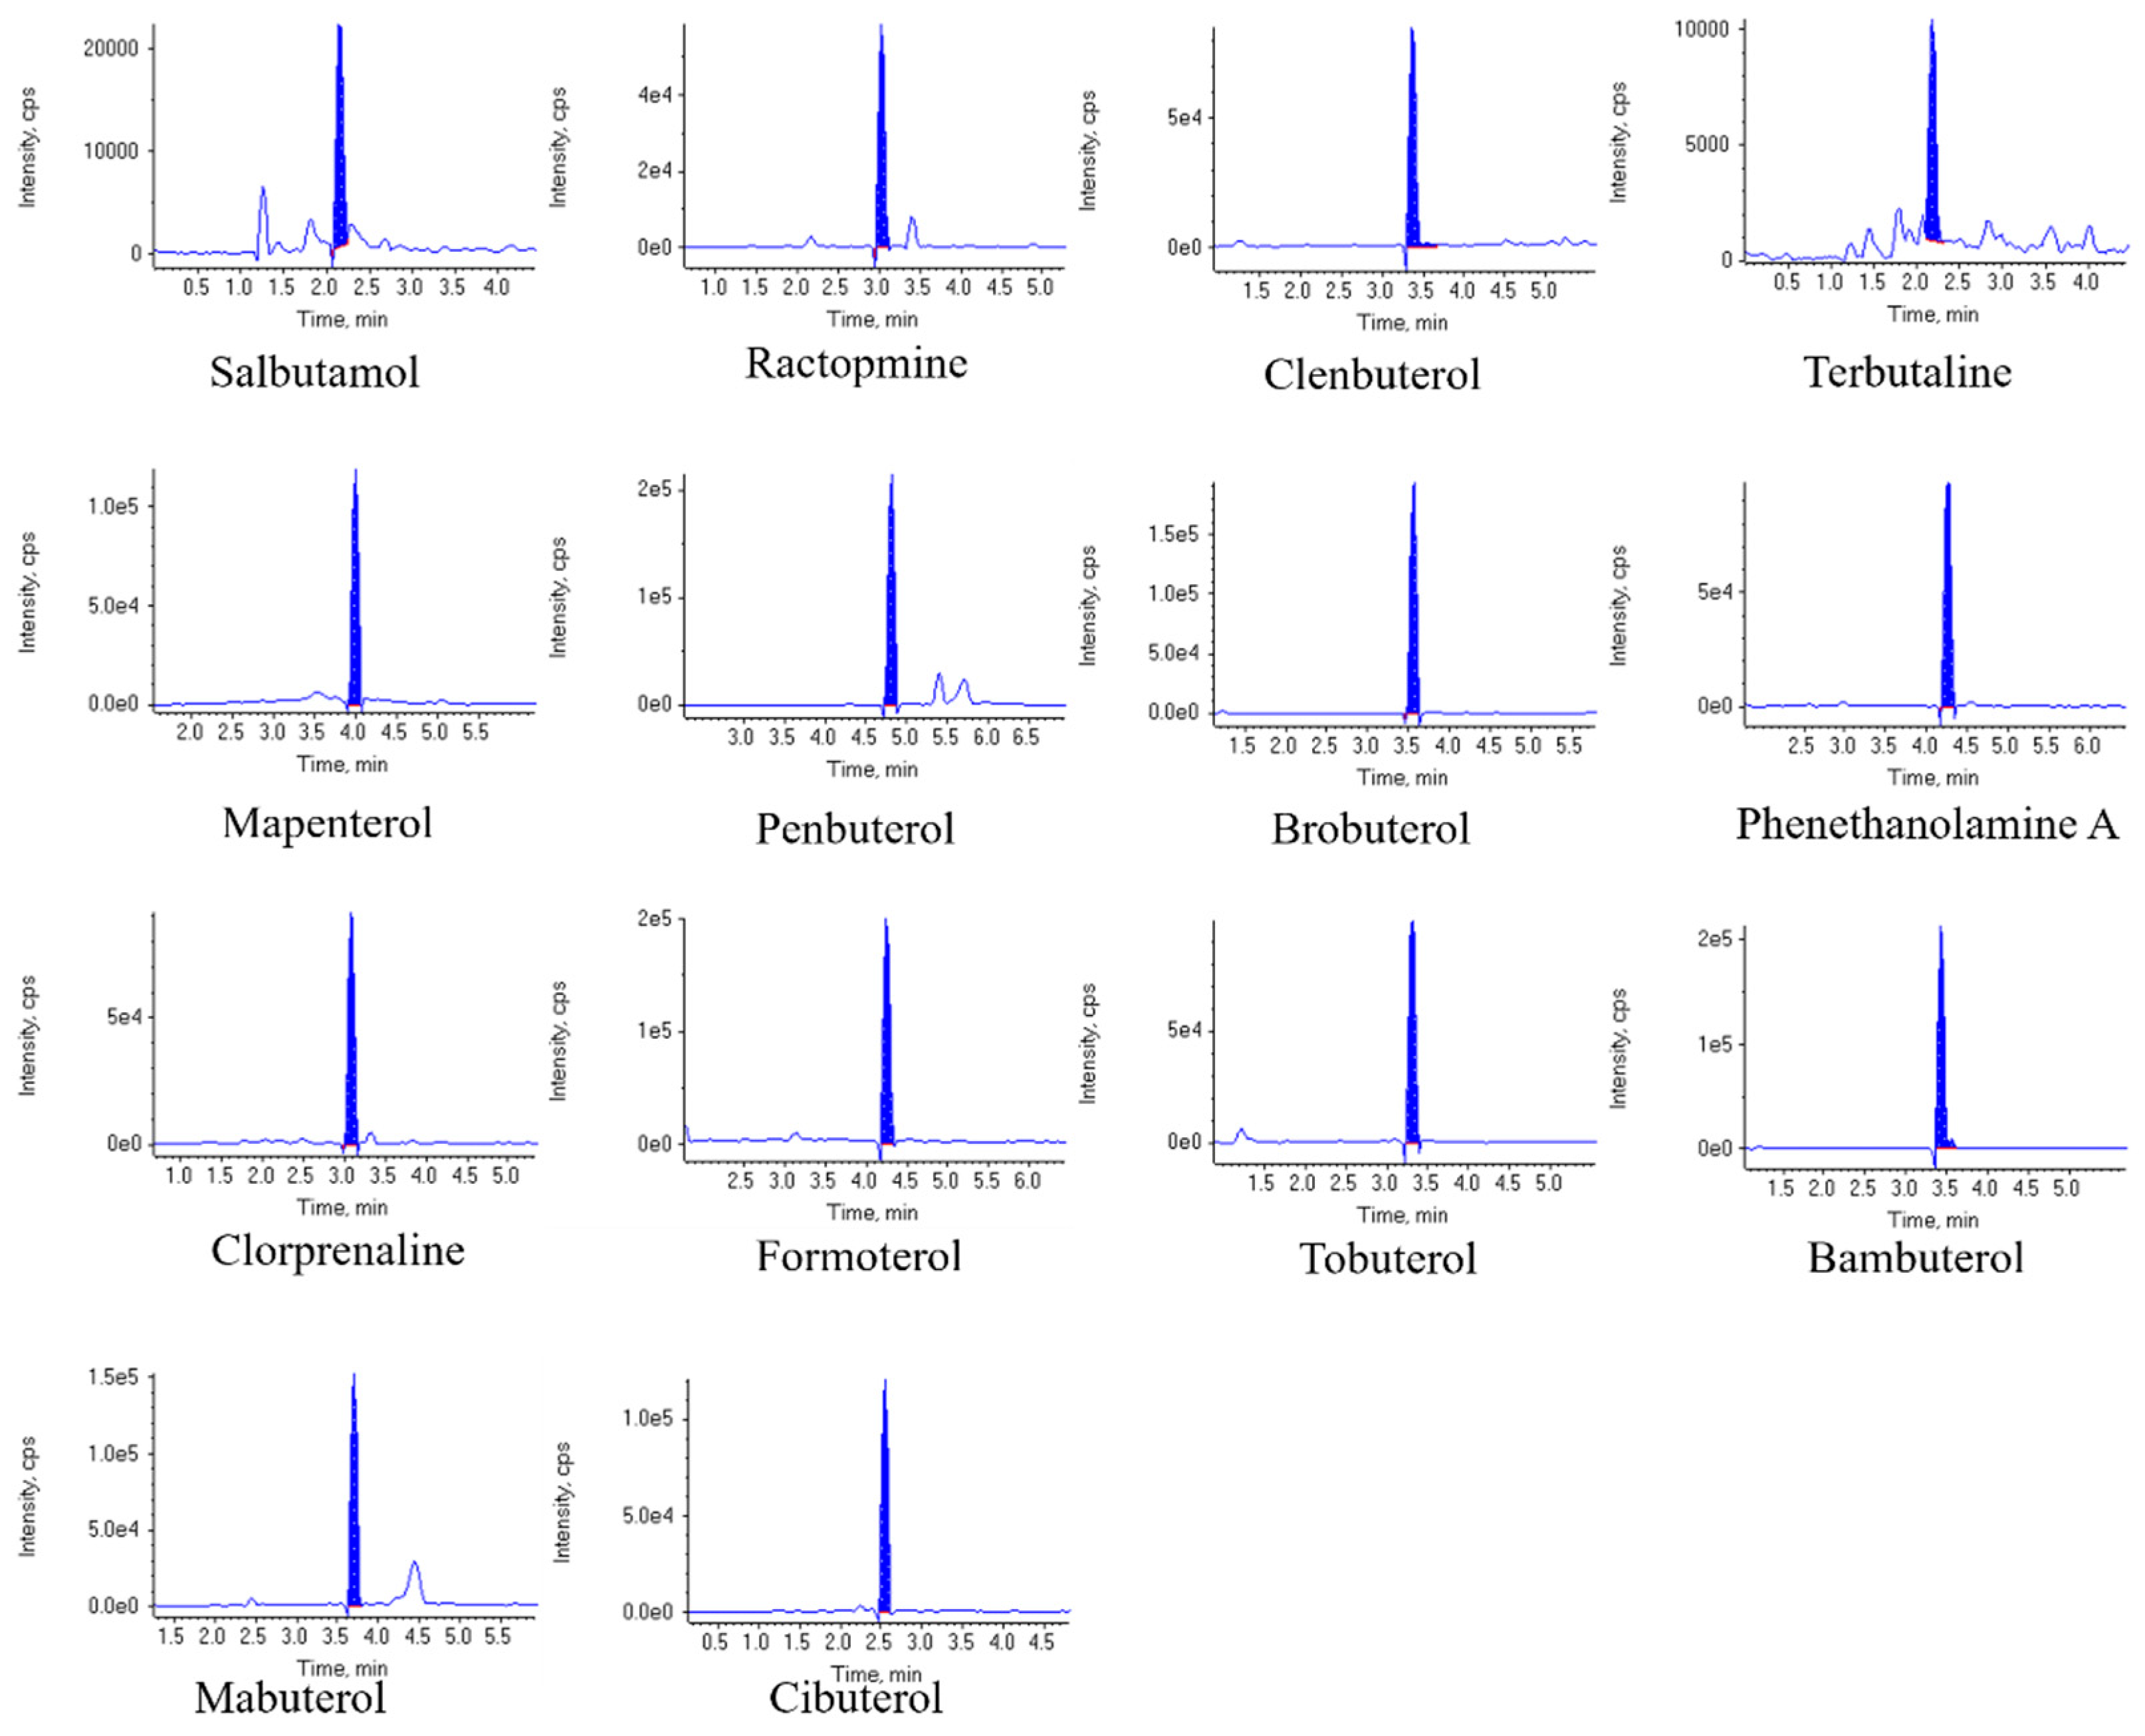
Figure 3. Chromatograms of 14 β-agonists in pork samples (spiked at 5 μg/kg).
Preprints 83115 g003
Table 1. Mass spectrometry parameters for the analysis of 14 β-agonists
Analyte Precursor ion (m/z) Product ion (m/z) CE(V) DP(V)
salbutamol 240.1 148.2*, 222.1 30, 15 80
ractopmine 302.2 164.0*,284.1 25, 15 80
clenbuterol 277.1 203.1*,258.9 25, 15 120
terbutaline 226.2 152.1*,107.1 23, 43 45
mapenterol 324.8 237.1*,217.1 27, 25 65
penbuterol 293.2 236.2*,201.1 22, 28 65
brobuterol 367.0 293.0*,348.9 26, 17 65
phenethanolamine A 345.2 150.2*,327.0 33, 19 65
clorprenaline 214.1 154.1*,195.9 27, 18 65
formoterol 345.1 148.9*,326.8 27, 19 65
tobuterol 228.1 153.8*,172.2 22, 16 65
bambuterol 368.2 294.1*,312.1 27, 21 65
mabuterol 311.0 237.1*, 217.1 24, 37 65
cibuterol 234.2 159.8*,143.2 21, 35 65
* Quantitation ion.
Table 2. Linear range, correlation coefficient, and calibration curves of 14 β-agonists
Analytes Linear range
(ng/L)
Calibration equation Correlation coefficient (r2) Matrix effect
(%)
LOD
(μg/kg)
LOQ
(μg/kg)
salbutamol 1-20 Y=1.08×106X 0.9993 93 0.22 0.52
ractopmine 1-20 Y=7.63×105X 0.9996 81 0.18 0.49
clenbuterol 1-20 Y=7.4×105X 0.9999 82 0.09 0.36
terbutaline 1-20 Y=4.46×105X 0.9997 85 0.39 0.98
mapenterol 1-20 Y=9.72×105X 0.9995 95 0.15 0.45
penbuterol 1-20 Y=1.38×104X 0.9989 120 0.12 0.29
brobuterol 1-20 Y=1.49×106X 0.9999 87 0.18 0.38
phenethanolamine A 1-20 Y=1.12×106X 0.9999 99 0.22 0.49
clorprenaline 1-20 Y=1.32×106X 0.9998 82 0.28 0.52
formoterol 1-20 Y=4.55×104X 0.9997 81 0.13 0.28
tobuterol 1-20 Y=1.45×106X 1.0000 81 0.36 0.99
bambuterol 1-20 Y=2.78×106X 0.9994 93 0.11 0.27
mabuterol 1-20 Y=2.02×106X 0.9999 83 0.18 0.37
cibuterol 1-20 Y=2.17×106X 0.9994 84 0.19 0.42
Table 3. Average recovery rates of all target compounds spiked in pork at three different concentrations (n=6)
Analyte Intraday Interday
1.0 μg/kg 5.0 μg/kg 10.0 μg/kg 1.0 μg/kg 5.0 μg/kg 10.0 μg/kg
Recovery (%) RSD (%) Recovery (%) RSD (%) Recovery (%) RSD (%) Recovery (%) RSD (%) Recovery (%) RSD (%) Recovery (%) RSD (%)
salbutamol 78.3 10.8 79.5 9.7 79.6 9.4 77.2 11.1 78.2 10.4 78.1 10.2
ractopmine 74.3 11.2 74.5 10.6 73.4 10.8 73.3 11.9 73.9 11.2 73.1 10.9
clenbuterol 75.2 11.3 77.3 10.7 74.5 9.6 74.7 10.9 76.8 10.2 74.2 9.9
terbutaline 80.9 12.5 77.4 10.3 78.2 10.1 79.2 13.4 76.7 10.9 77.9 11.6
mapenterol 81.1 11.1 81.1 10.3 80.1 10.1 80.8 12.1 81.8 10.9 81.9 10.7
penbuterol 76.8 12.1 73.1 11.8 72.3 10.4 76.5 12.5 73.5 11.9 72.5 11.1
brobuterol 82.2 12.9 79.3 10.1 78.1 9.2 82.3 12.1 79.1 10.6 78.9 9.8
phenethanolamine A 80.3 11.3 78.1 11.6 76.1 10.9 80.4 11.6 78.9 11.4 77.1 11.6
clorprenaline 79.4 12.2 76.8 11.4 73.6 11.1 79.2 11.3 76.3 10.2 74.1 10.4
formoterol 77.4 12.9 74.1 11.7 76.1 10.9 77.2 12.2 75.2 12.1 76.2 10.8
tobuterol 76.1 12.8 75.1 10.3 73.3 10.9 75.2 12.6 73.9 11.2 73.8 10.6
bambuterol 77.2 12.1 76.5 12.3 71.6 10.9 78.1 12.7 76.9 12.7 72.9 11.7
mabuterol 79.8 11.8 74.8 10.2 72.6 9.7 79.1 12.8 74.1 11.3 73.1 10.8
cibuterol 79.8 12.3 74.8 11.6 72.6 10.8 79.1 11.3 75.1 11.1 73.4 11.4
Table 4. Results of 3 β-agonists determination in CNAS proficiency test samples measured by the GB method and the present method
Analyte Sample NO. Concentration (μg/kg) True value
GB method This work (μg/kg)
clenbuterol 58 4.05 4.18 4.20
ractopmine 5.12 5.44 5.40
salbutamol 40.71 42.70 43.37
Table 5. Comparison of Adsorbent Material Cost, Solvent Consumption, Purification Time, and Automation Between the Proposed Method and the GB/T 31658.22-2022 Standard
Parameter Proposed method (per sample) GB/T 31658.22-2022
adsorbent material cost 3 CNY 30 CNY
solvent consumption 3.5 mL solvent + 1.0 mL water 9 mL solvent
purification time 8 min 40-60 min
automation Yes No
Disclaimer/Publisher’s Note: The statements, opinions and data contained in all publications are solely those of the individual author(s) and contributor(s) and not of MDPI and/or the editor(s). MDPI and/or the editor(s) disclaim responsibility for any injury to people or property resulting from any ideas, methods, instructions or products referred to in the content.
Copyright: This open access article is published under a Creative Commons CC BY 4.0 license, which permit the free download, distribution, and reuse, provided that the author and preprint are cited in any reuse.
Prerpints.org logo

Preprints.org is a free preprint server supported by MDPI in Basel, Switzerland.

Subscribe

© 2024 MDPI (Basel, Switzerland) unless otherwise stated