Submitted:
22 August 2023
Posted:
24 August 2023
You are already at the latest version
Abstract
Keywords:
1. Introduction
2. Results
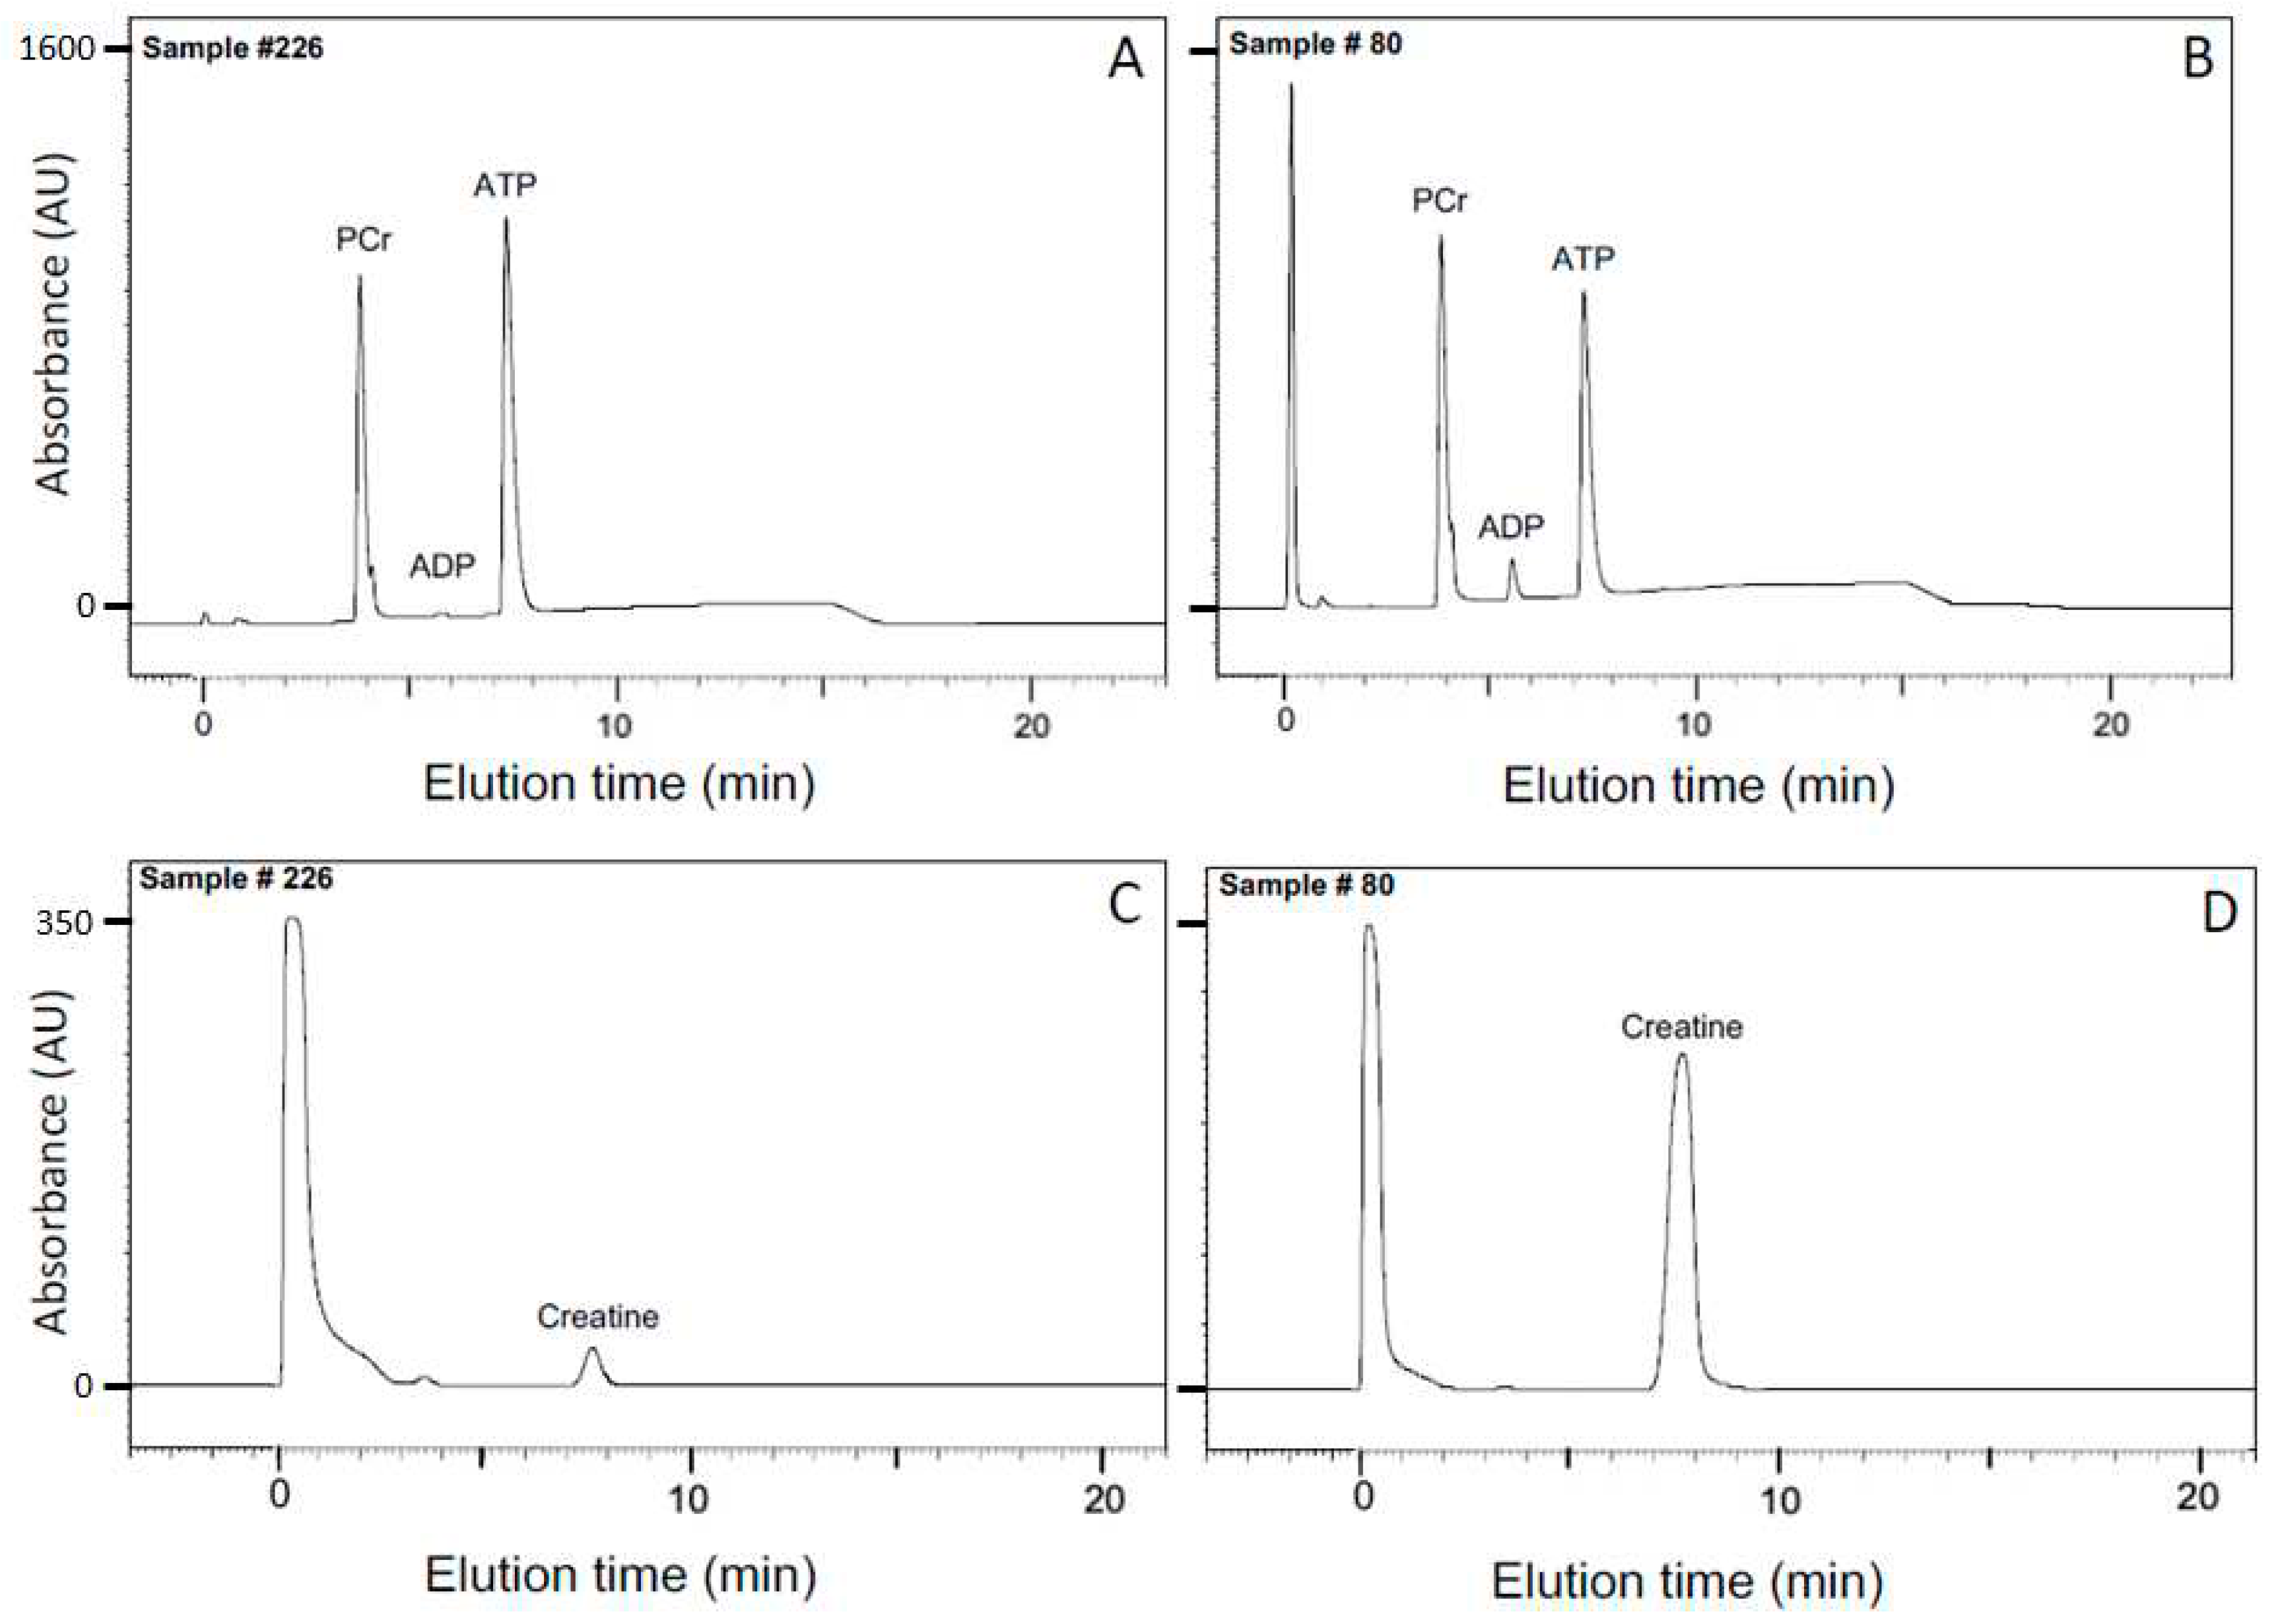
2.2. Determination of the equilibrium constant for the creatine kinase reaction from HPLC analyses of solutions
2.2.1. Apparent equilibrium constant Keq”
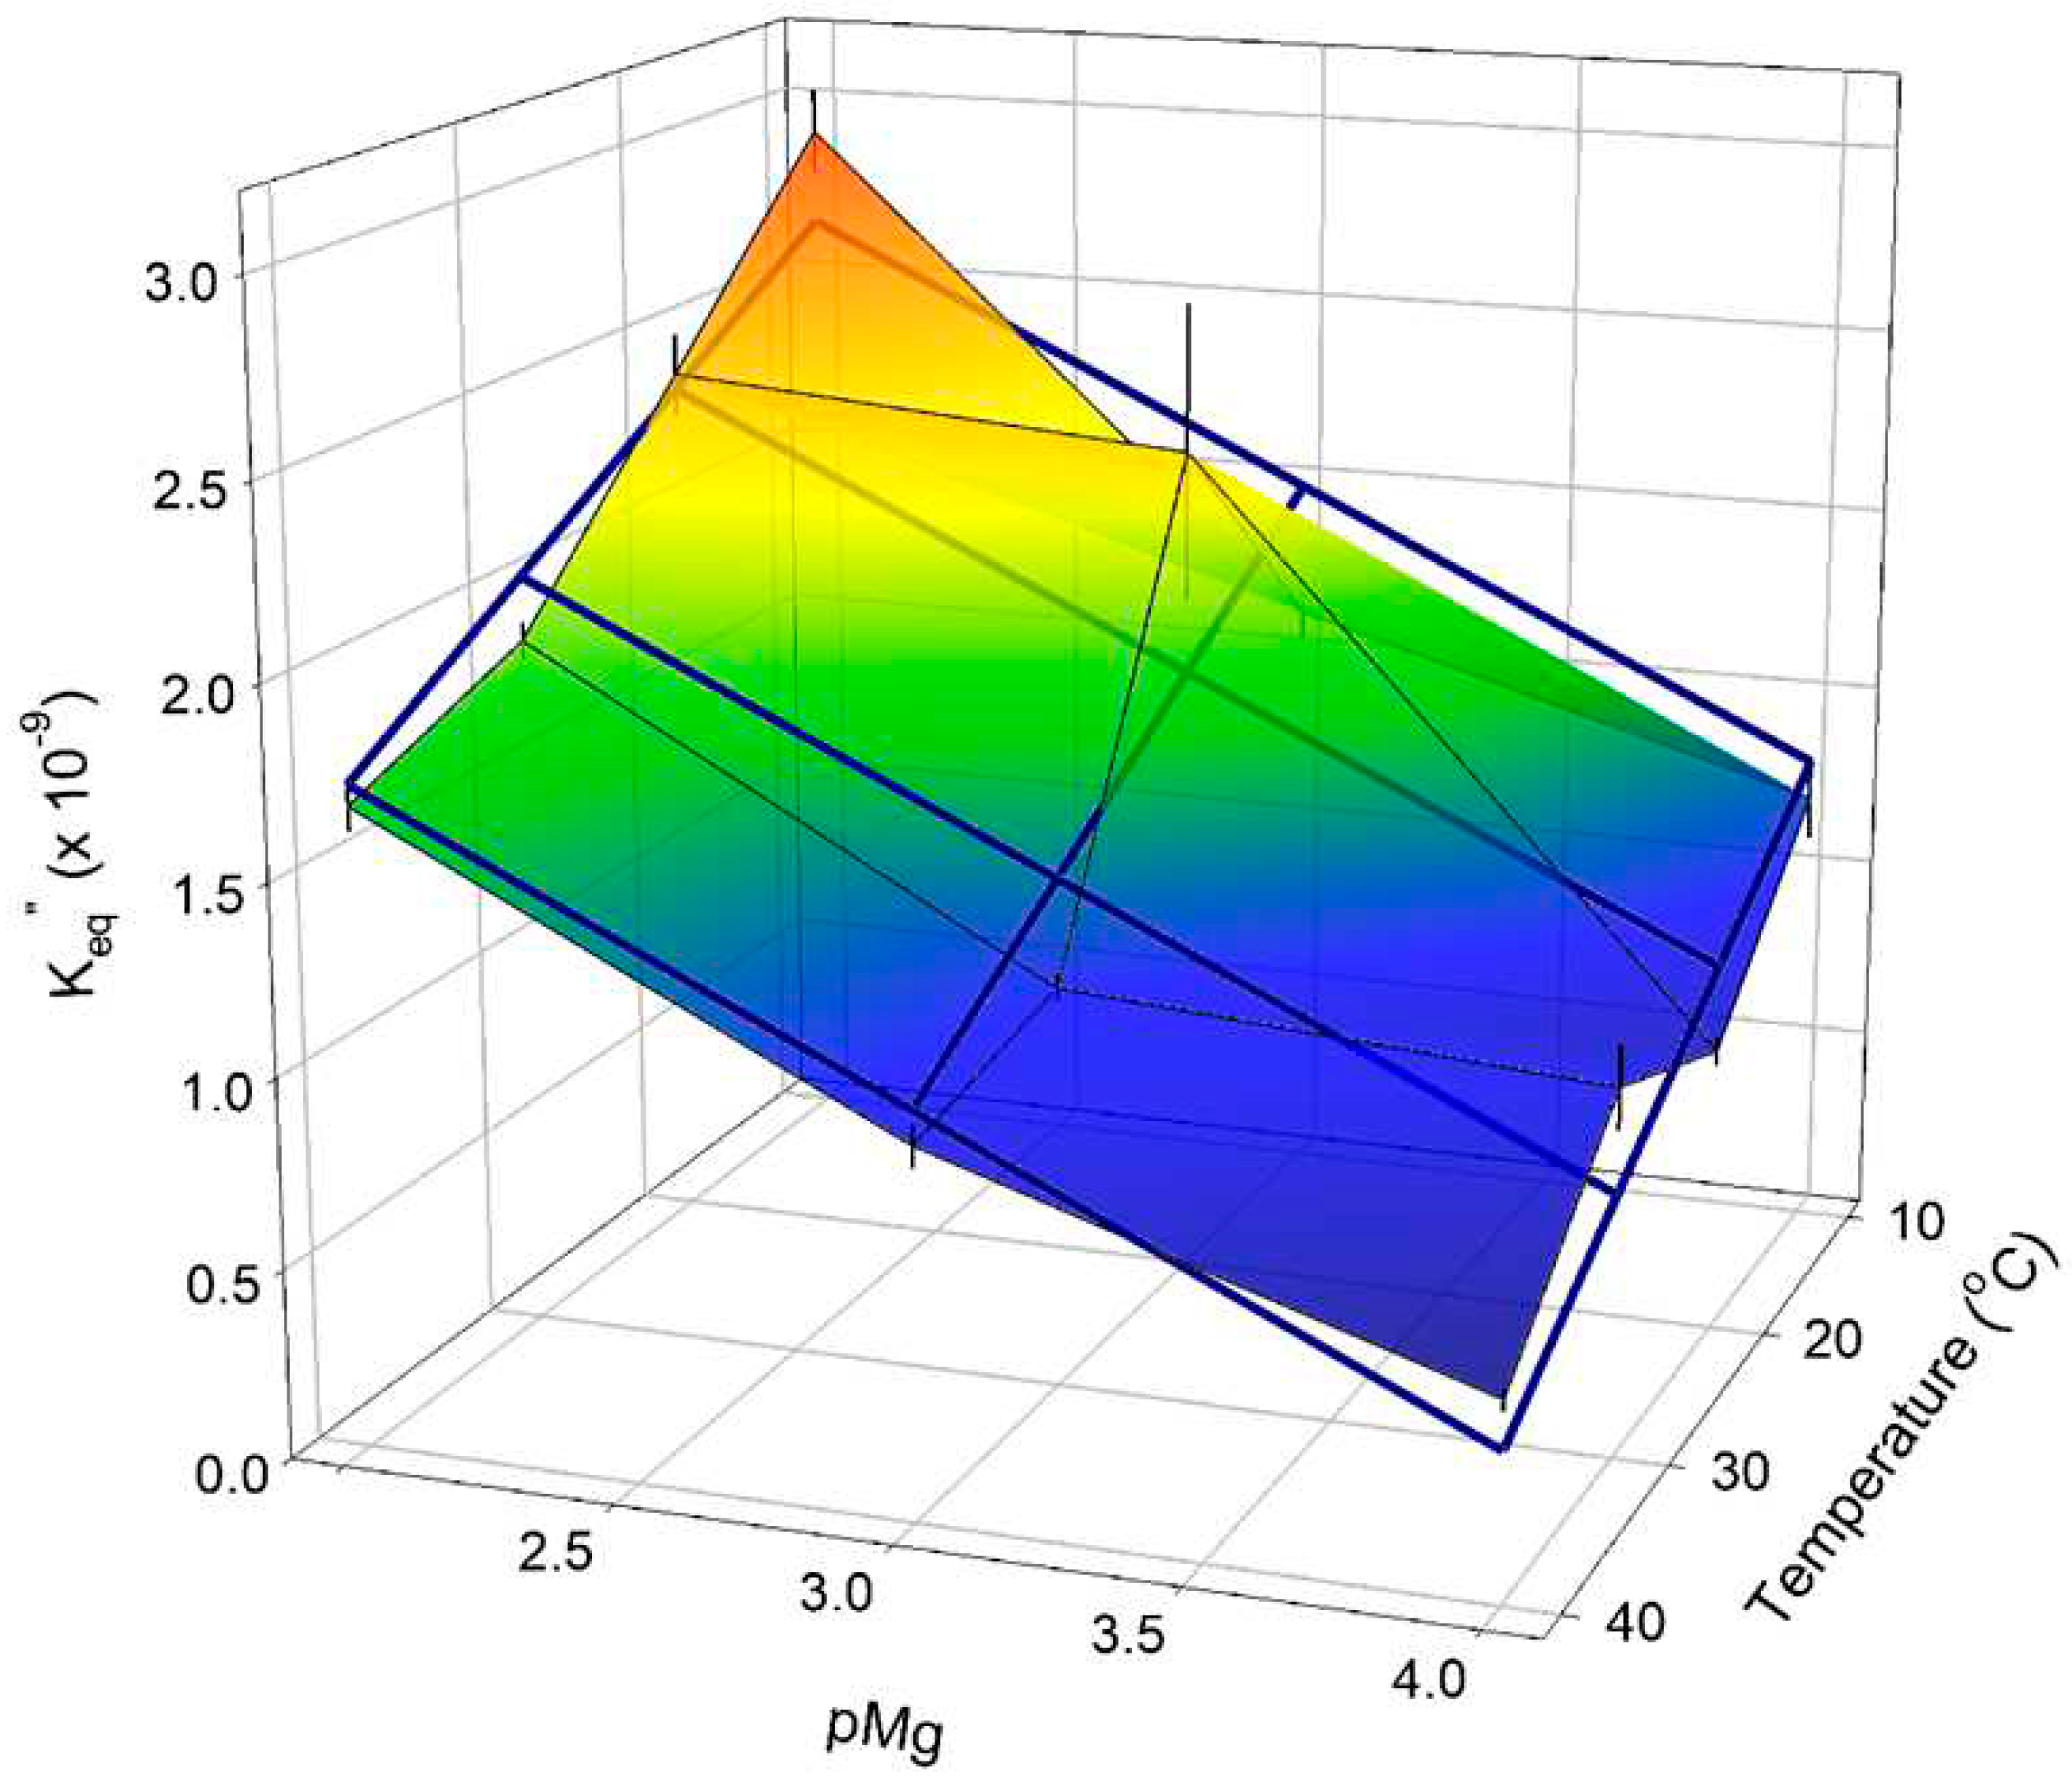
2.2.2. Dependence of Keq’’ for the creatine kinase reaction on Mg2+ and temperature
2.3. Estimation of ΔGATP
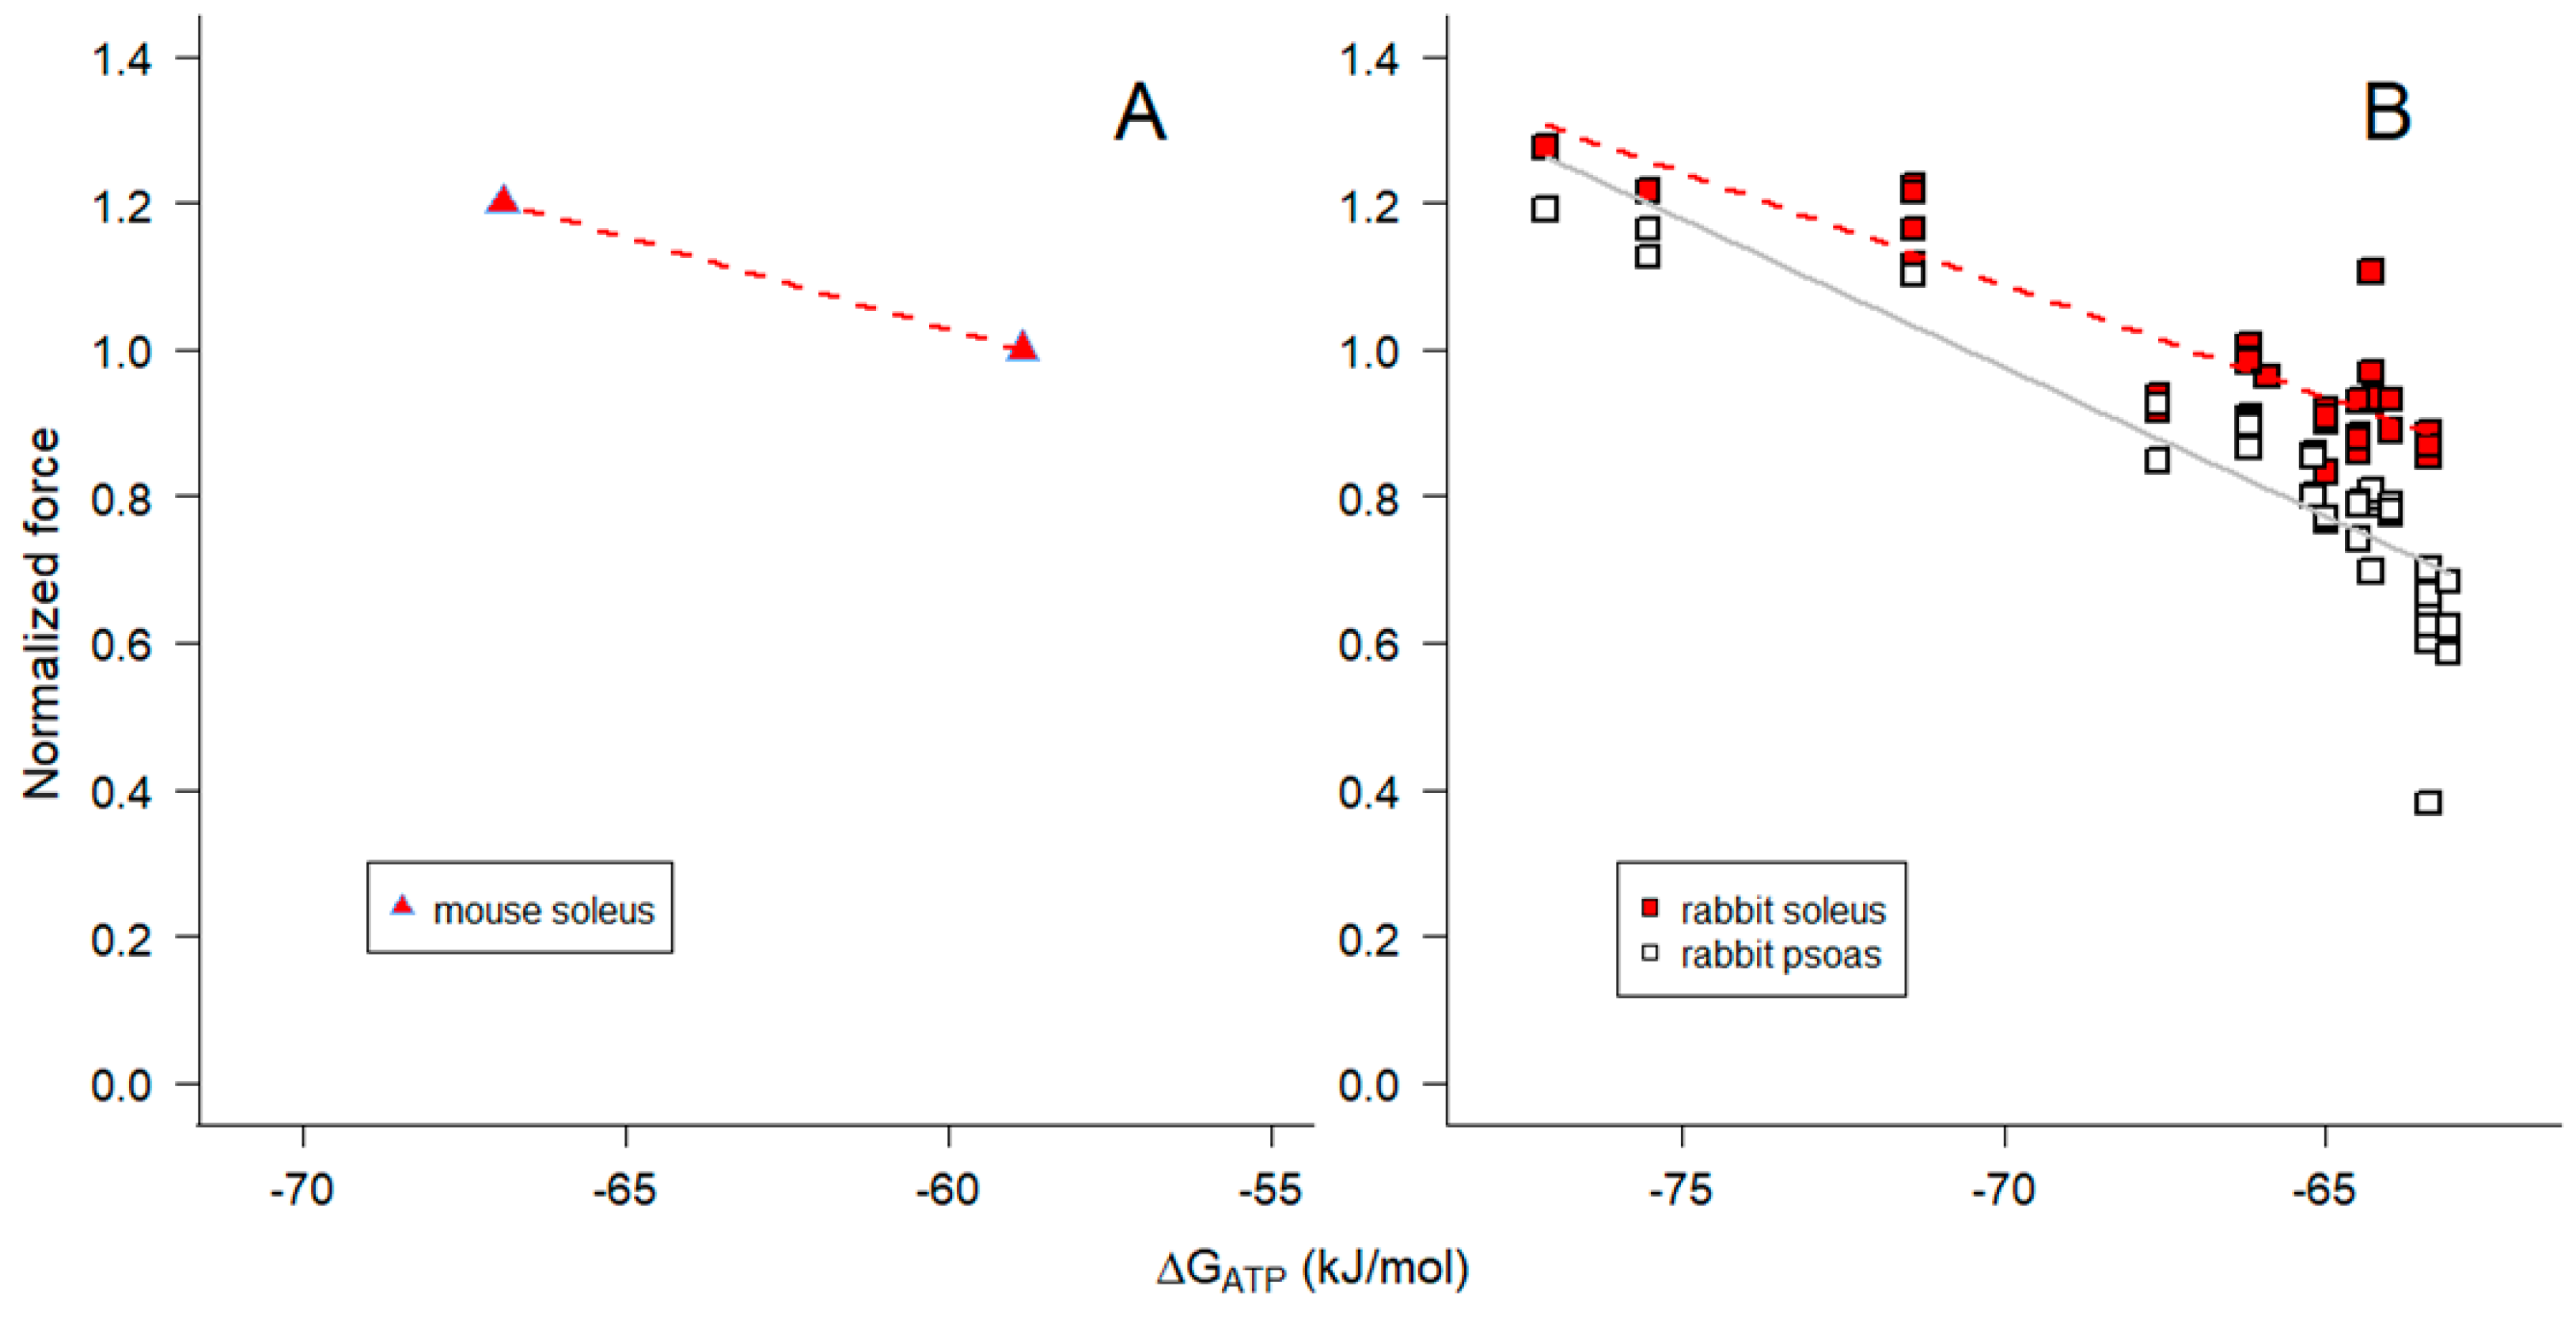
2.4. Influence of [Pi] on ΔGATP and muscle force
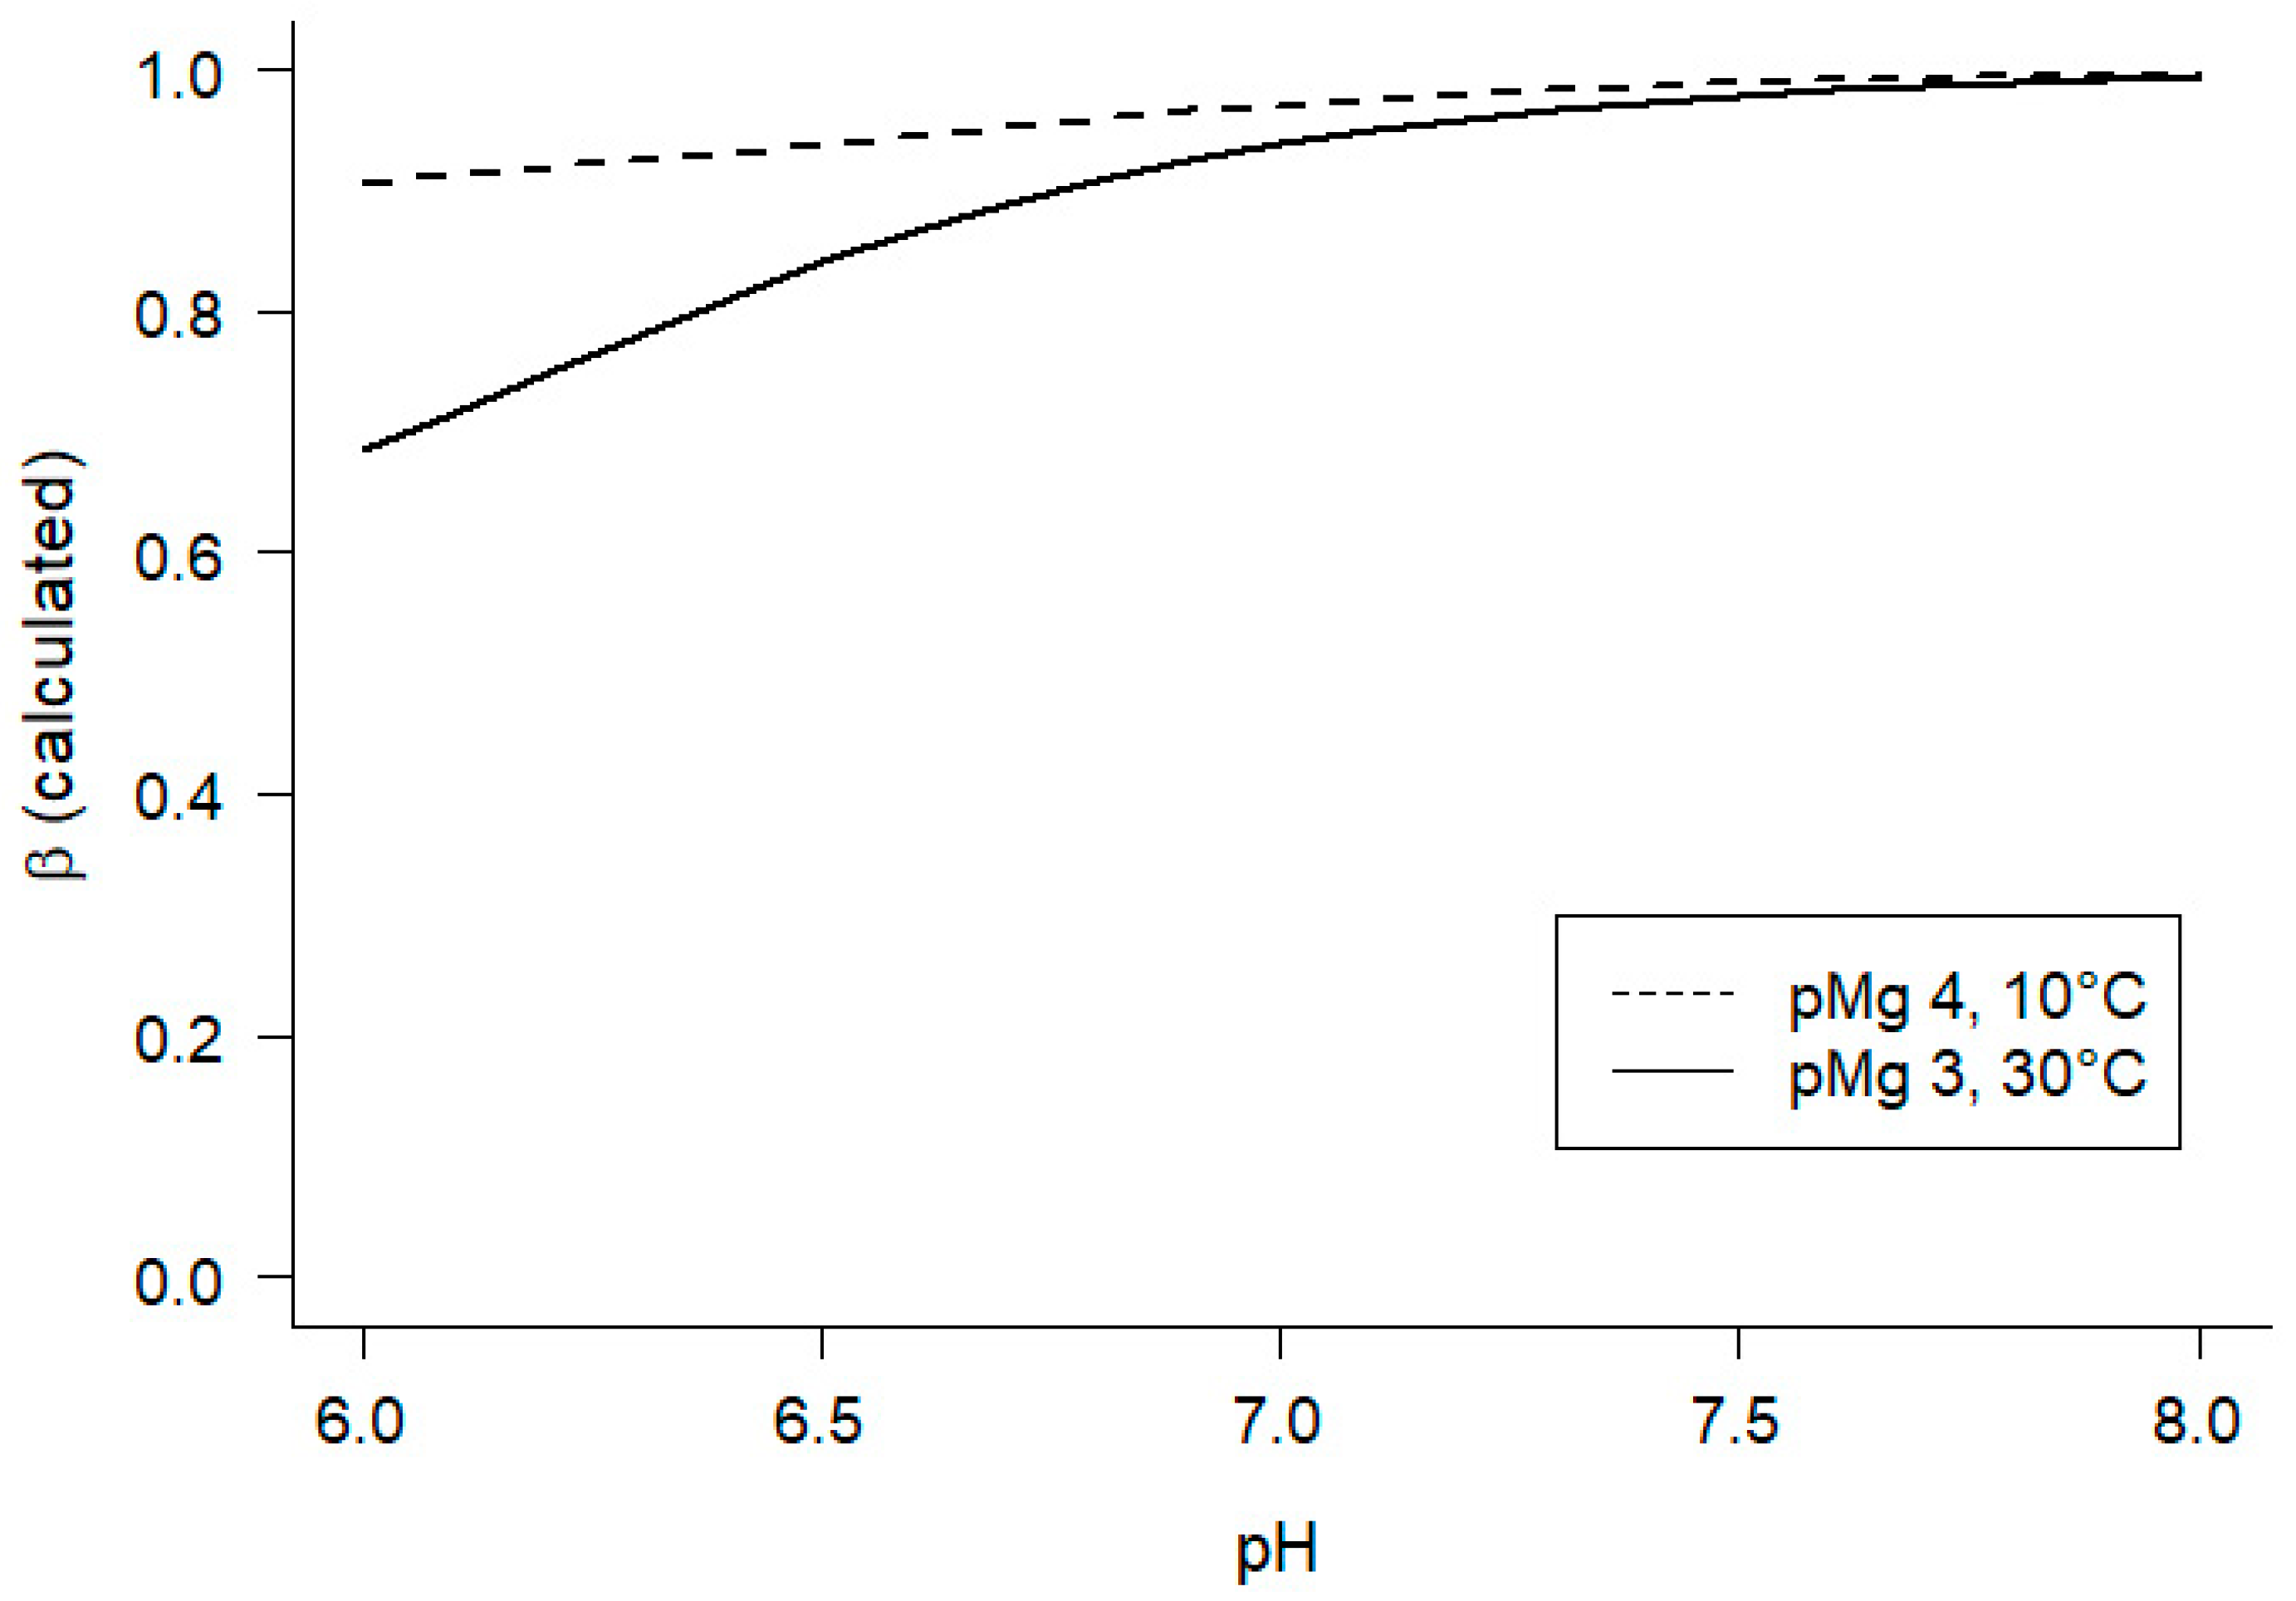
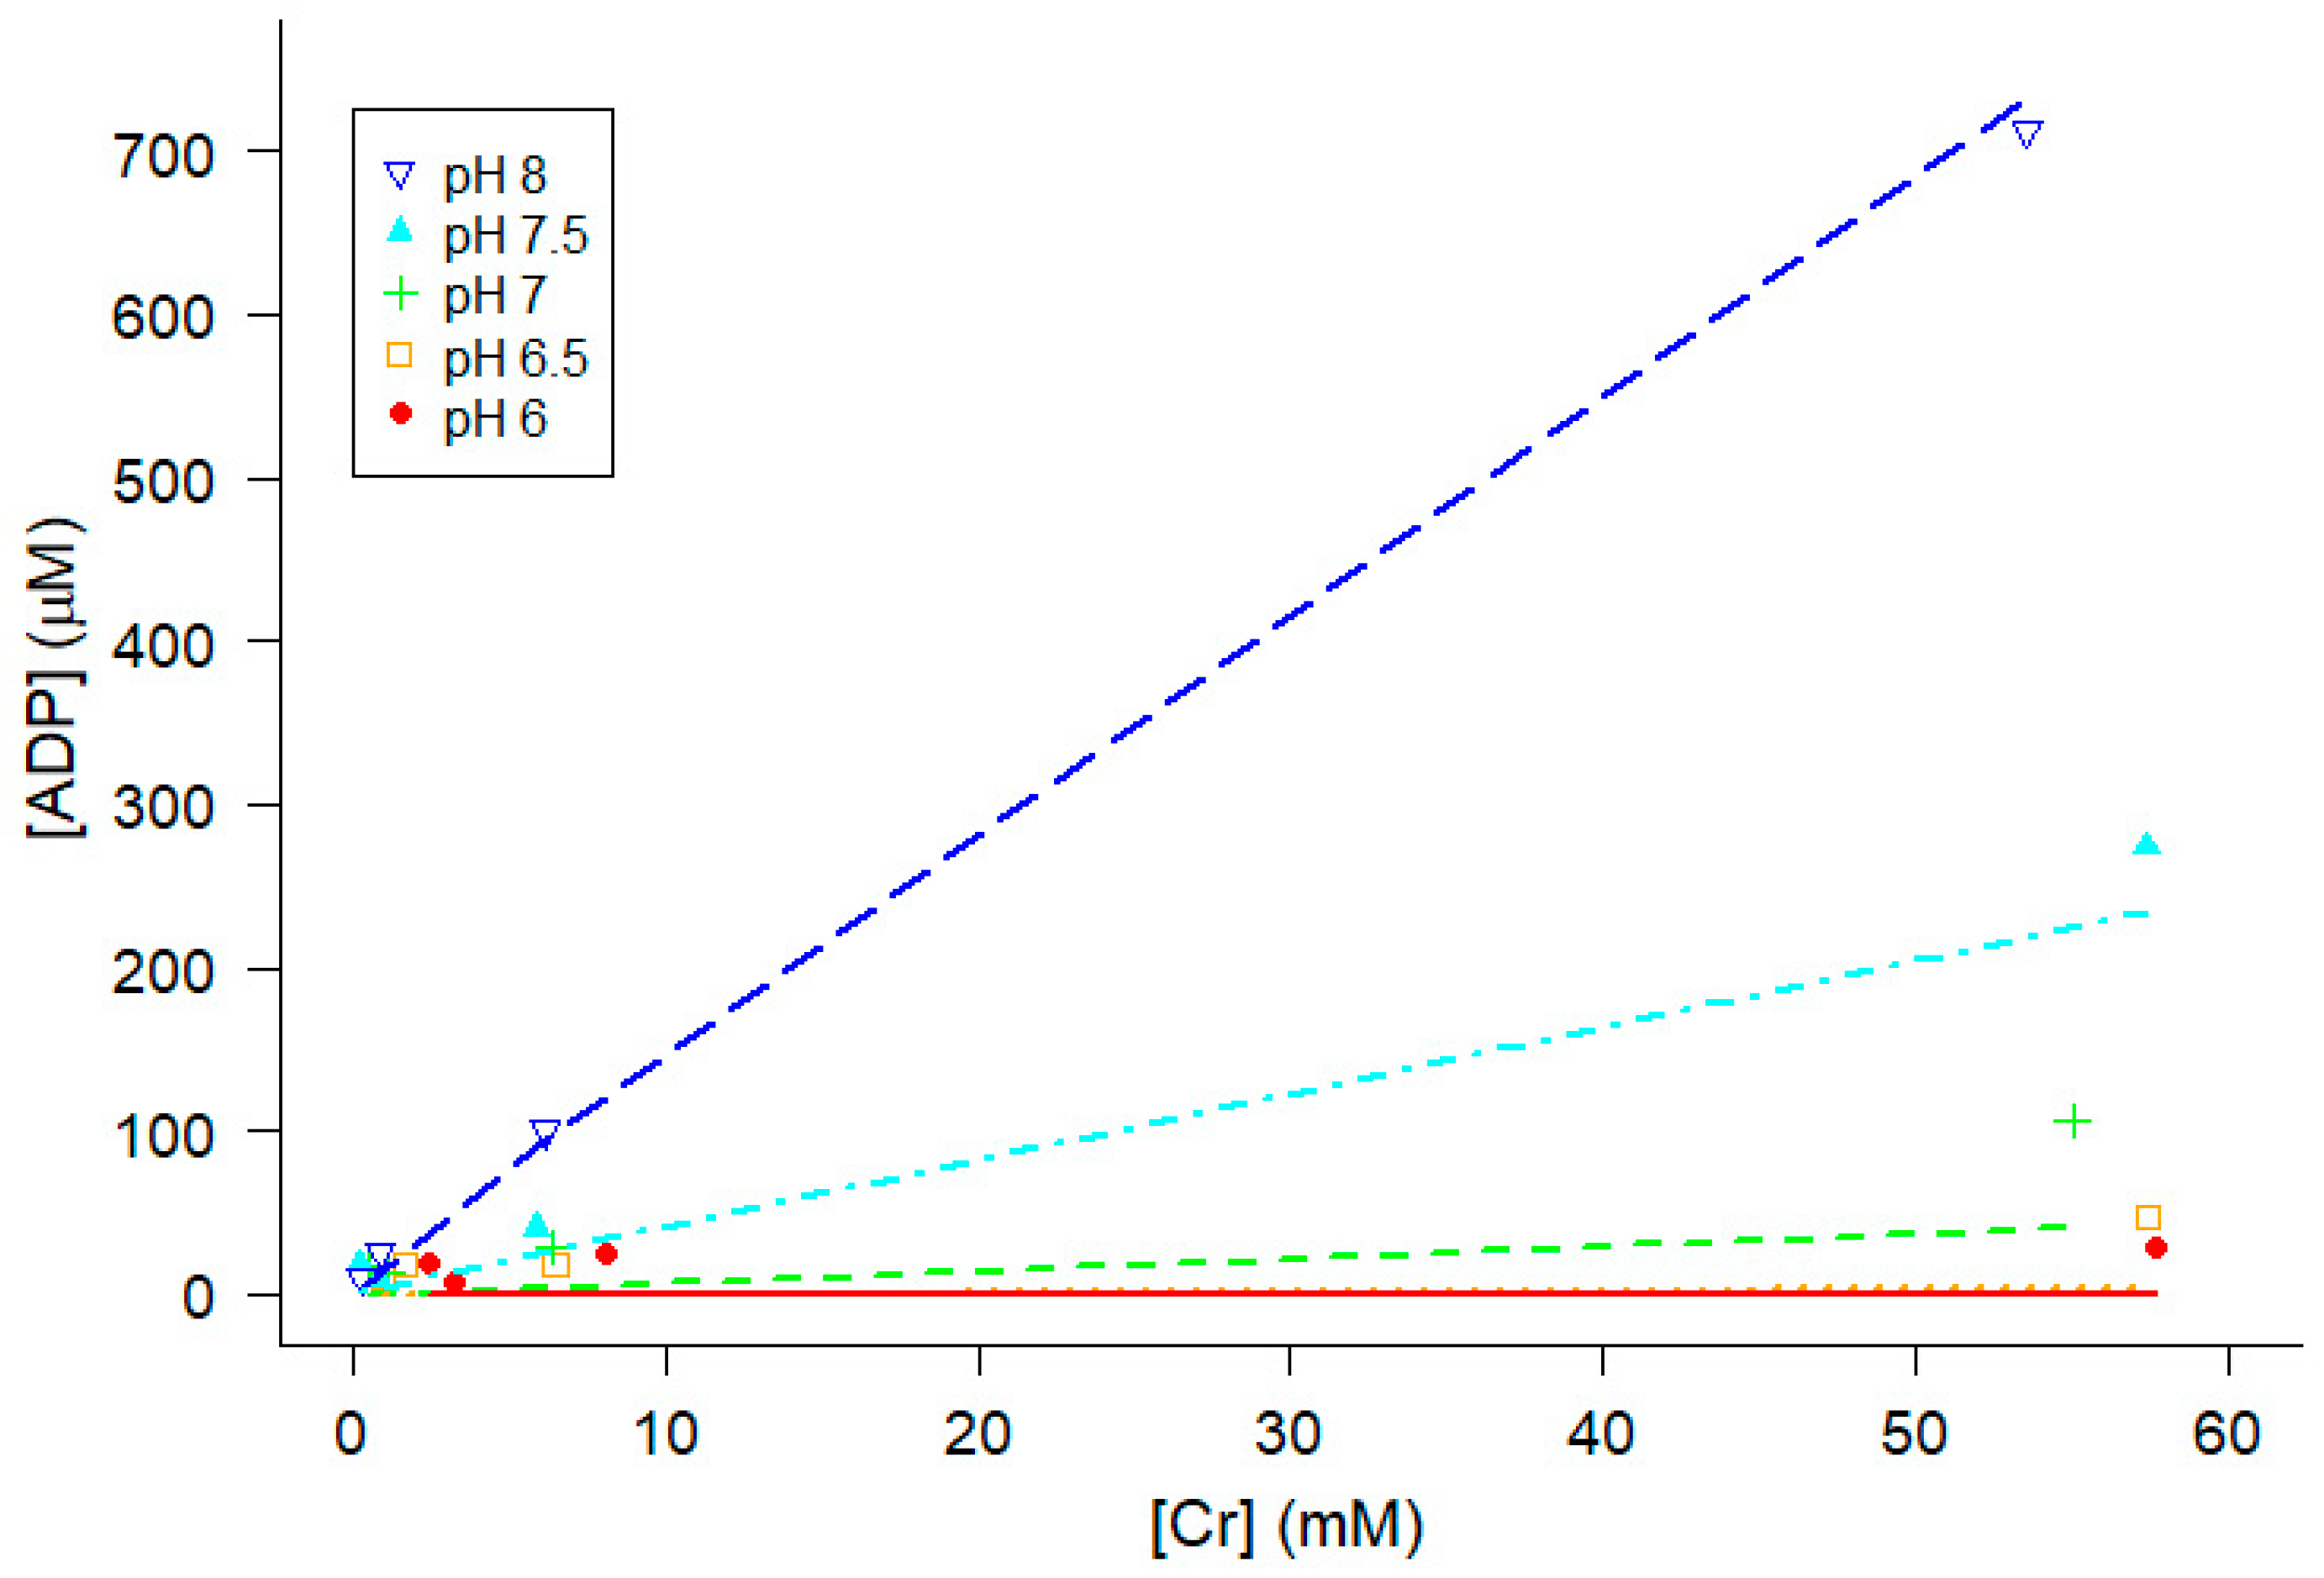
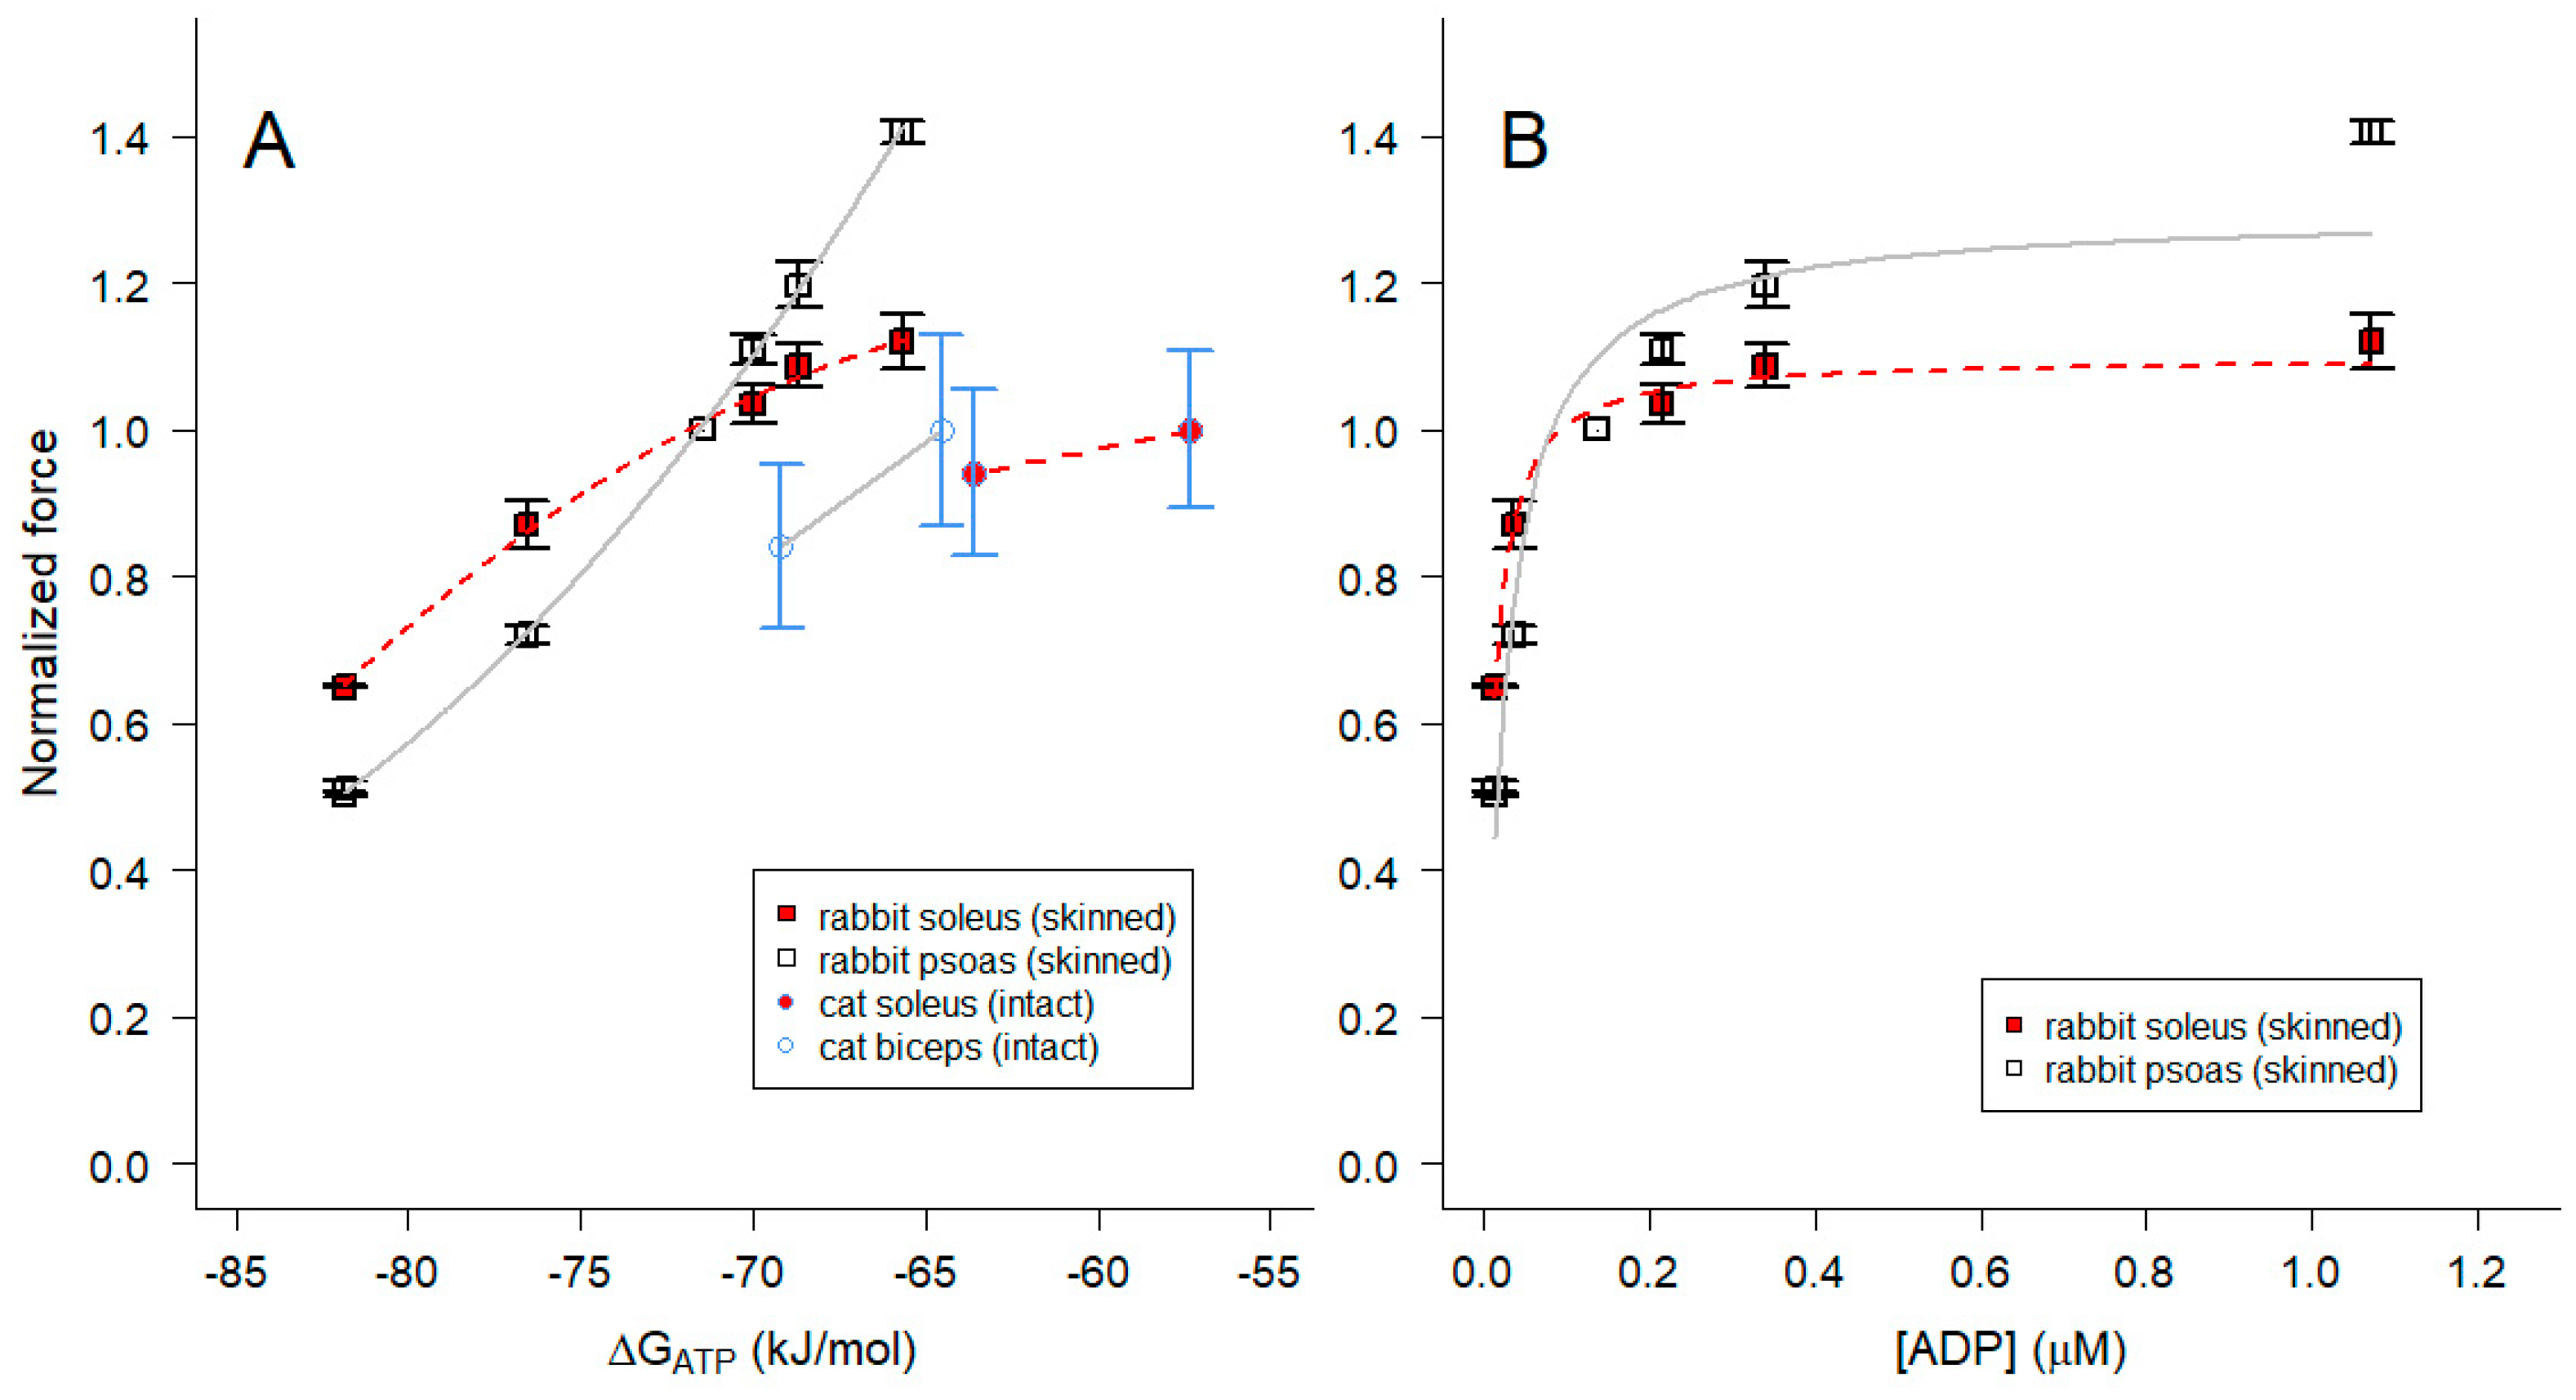
2.5. Influence of pH on ΔGATP, [ADP] and muscle force
3. Discussion
3.1. Estimation of Keq” for the creatine kinase reaction and cytoplasmic free ADP
3.2. Estimation of ΔGATP
3.3. Implications for actomyosin interactions and the physiology of skeletal muscle
4. Materials and Methods
4.1. Solution Composition for Biochemical Analyses
4.2. Nuclear Magnetic Resonance Spectroscopy
4.3. HPLC Analysis
4.4. Muscle Mechanics
4.4.1. Single Permeabilized Muscle Fiber Studies
4.4.2. Studies on Intact Muscles from Mice
4.5. Statistical Analysis
Author Contributions
Funding
Institutional Review Board Statement
Data Availability Statement
Acknowledgments
Conflicts of Interest
Appendix A
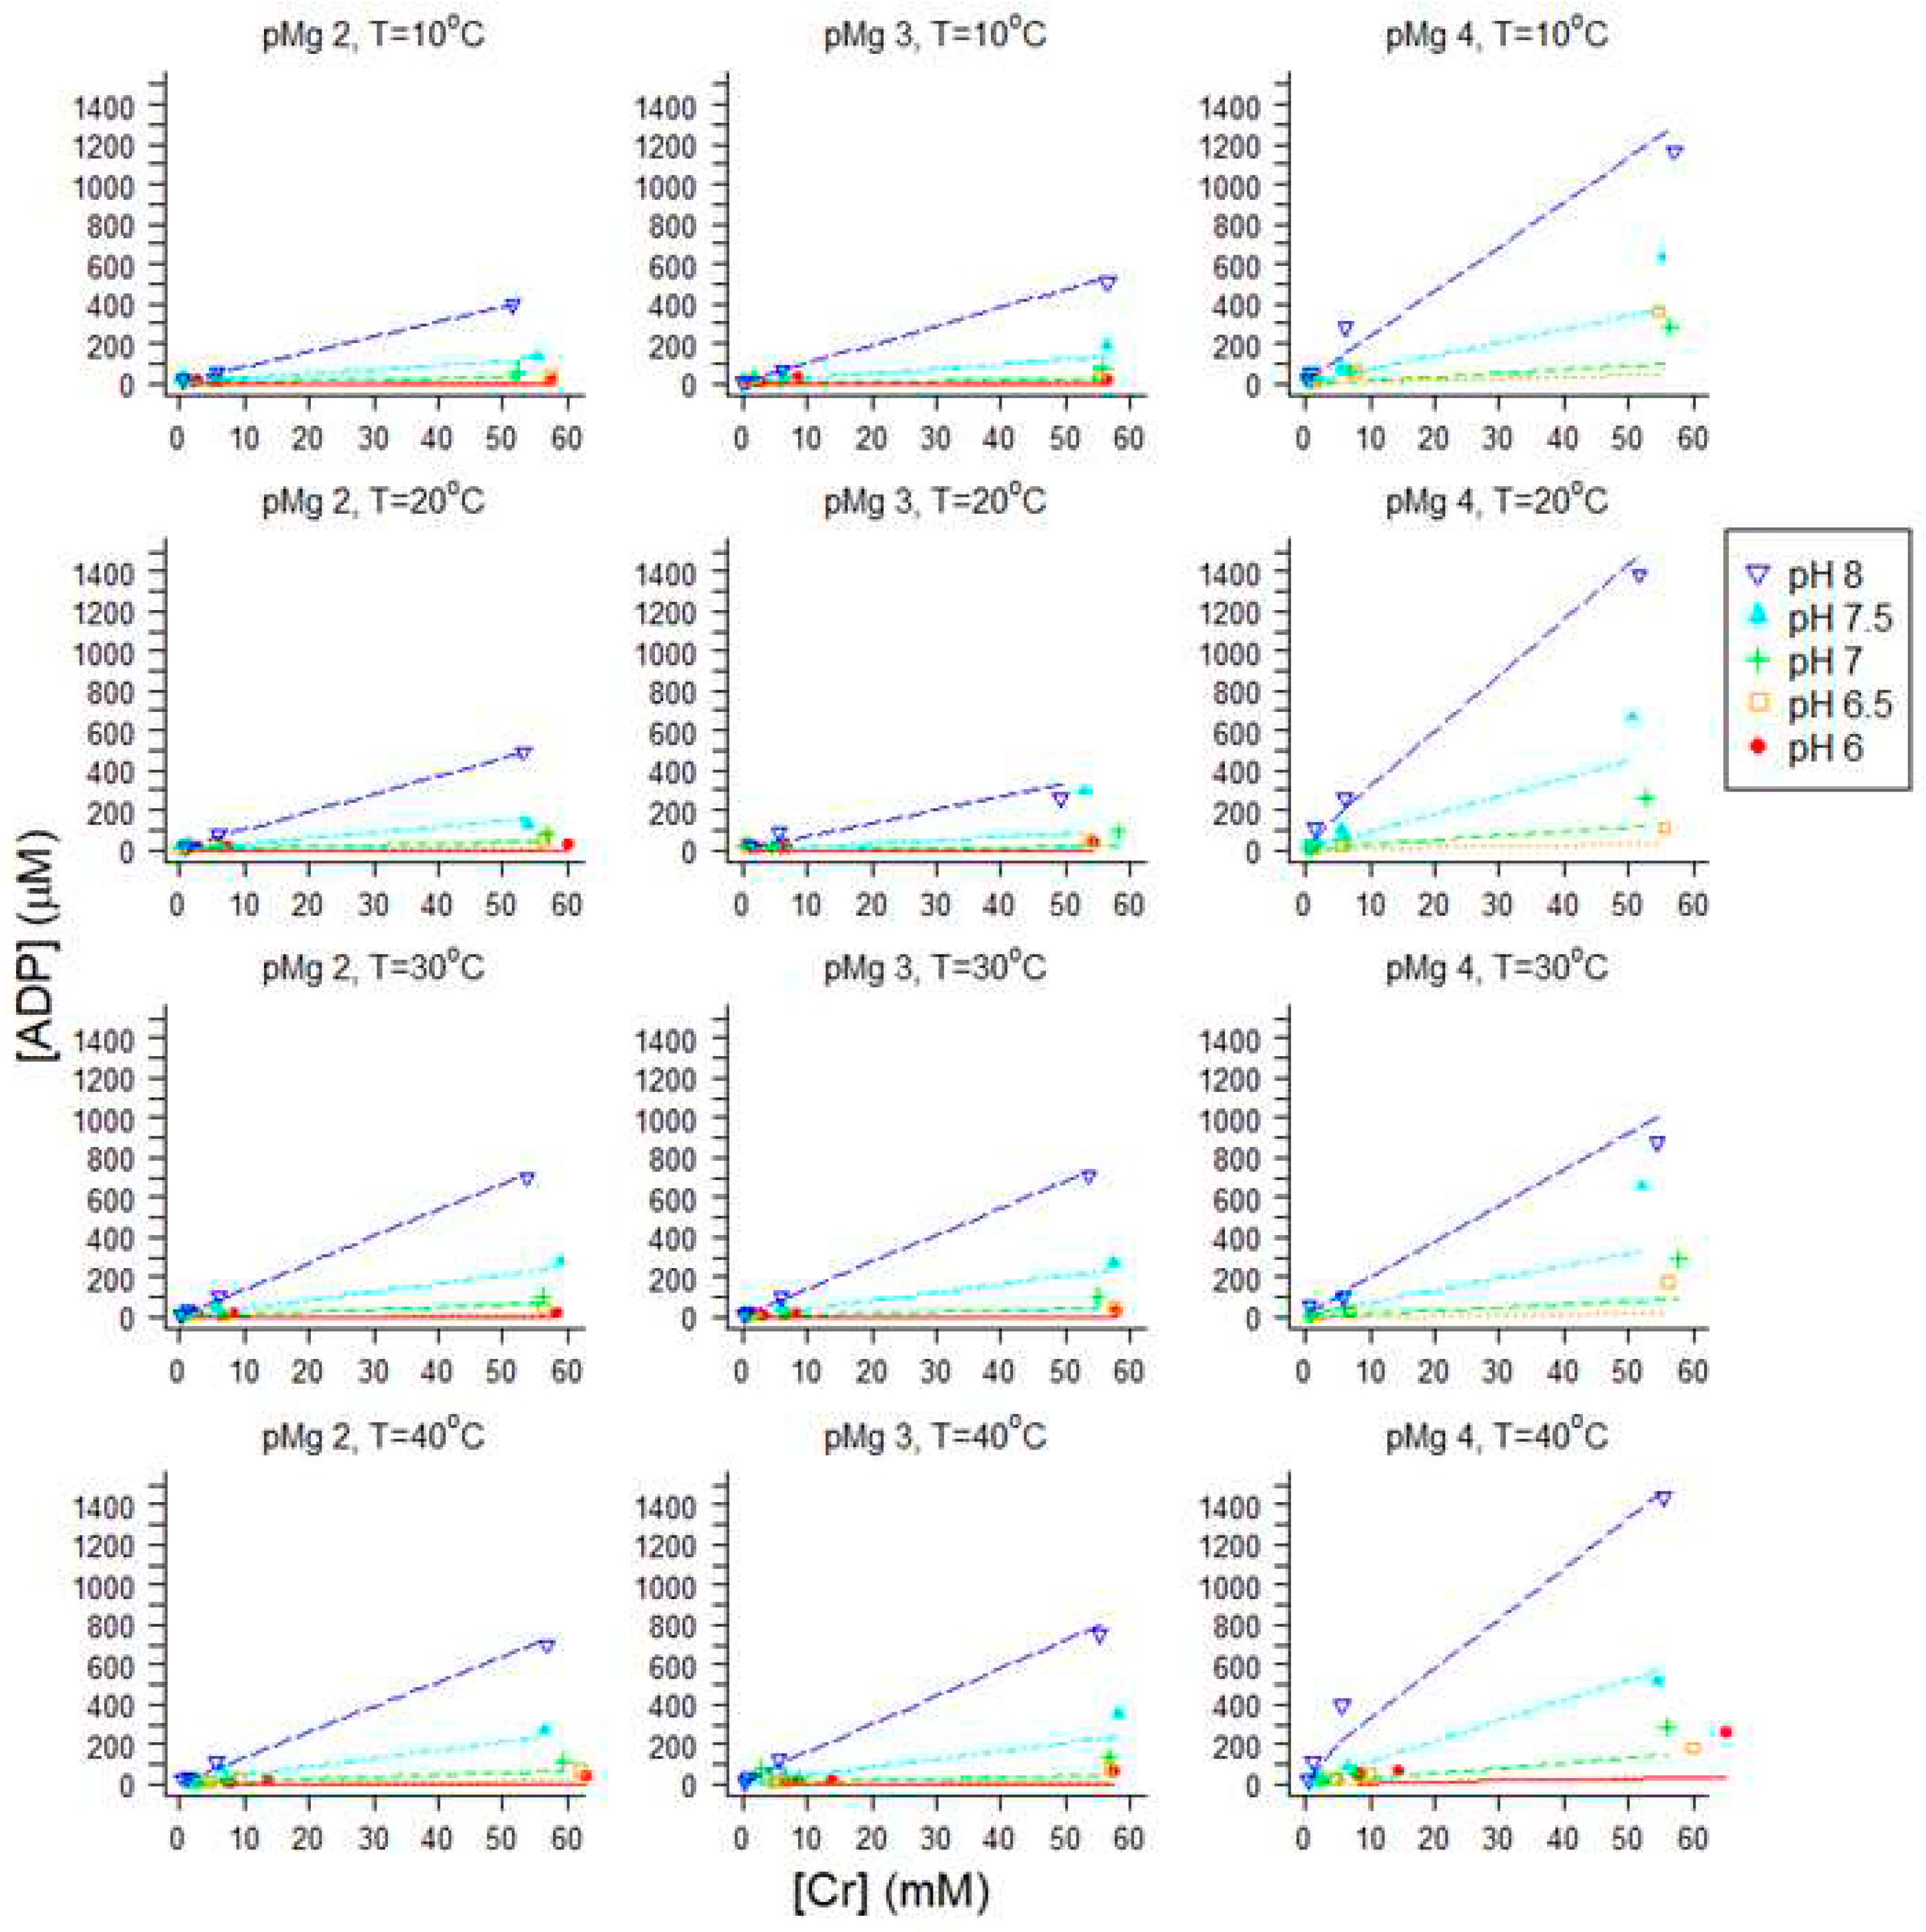
Appendix B
Appendix C

| [Pi] (mM) | Fmax | pCa50 | nHill | |
| Rabbit psoas | 0.1 | 1.0 | 5.90 + 0.01 | 2.85 + 0.18 |
| 20.0 | 0.67 + 0.01 | 5.79 + 0.01 | 3.89 + 0.52 | |
| Rabbit soleus | 0.1 | 1.0 | 5.88 + 0.02 | 1.95 + 0.17 |
| 20.0 | 0.77 + 0.02 | 5.75 + 0.03 | 2.14 + 0.25 |
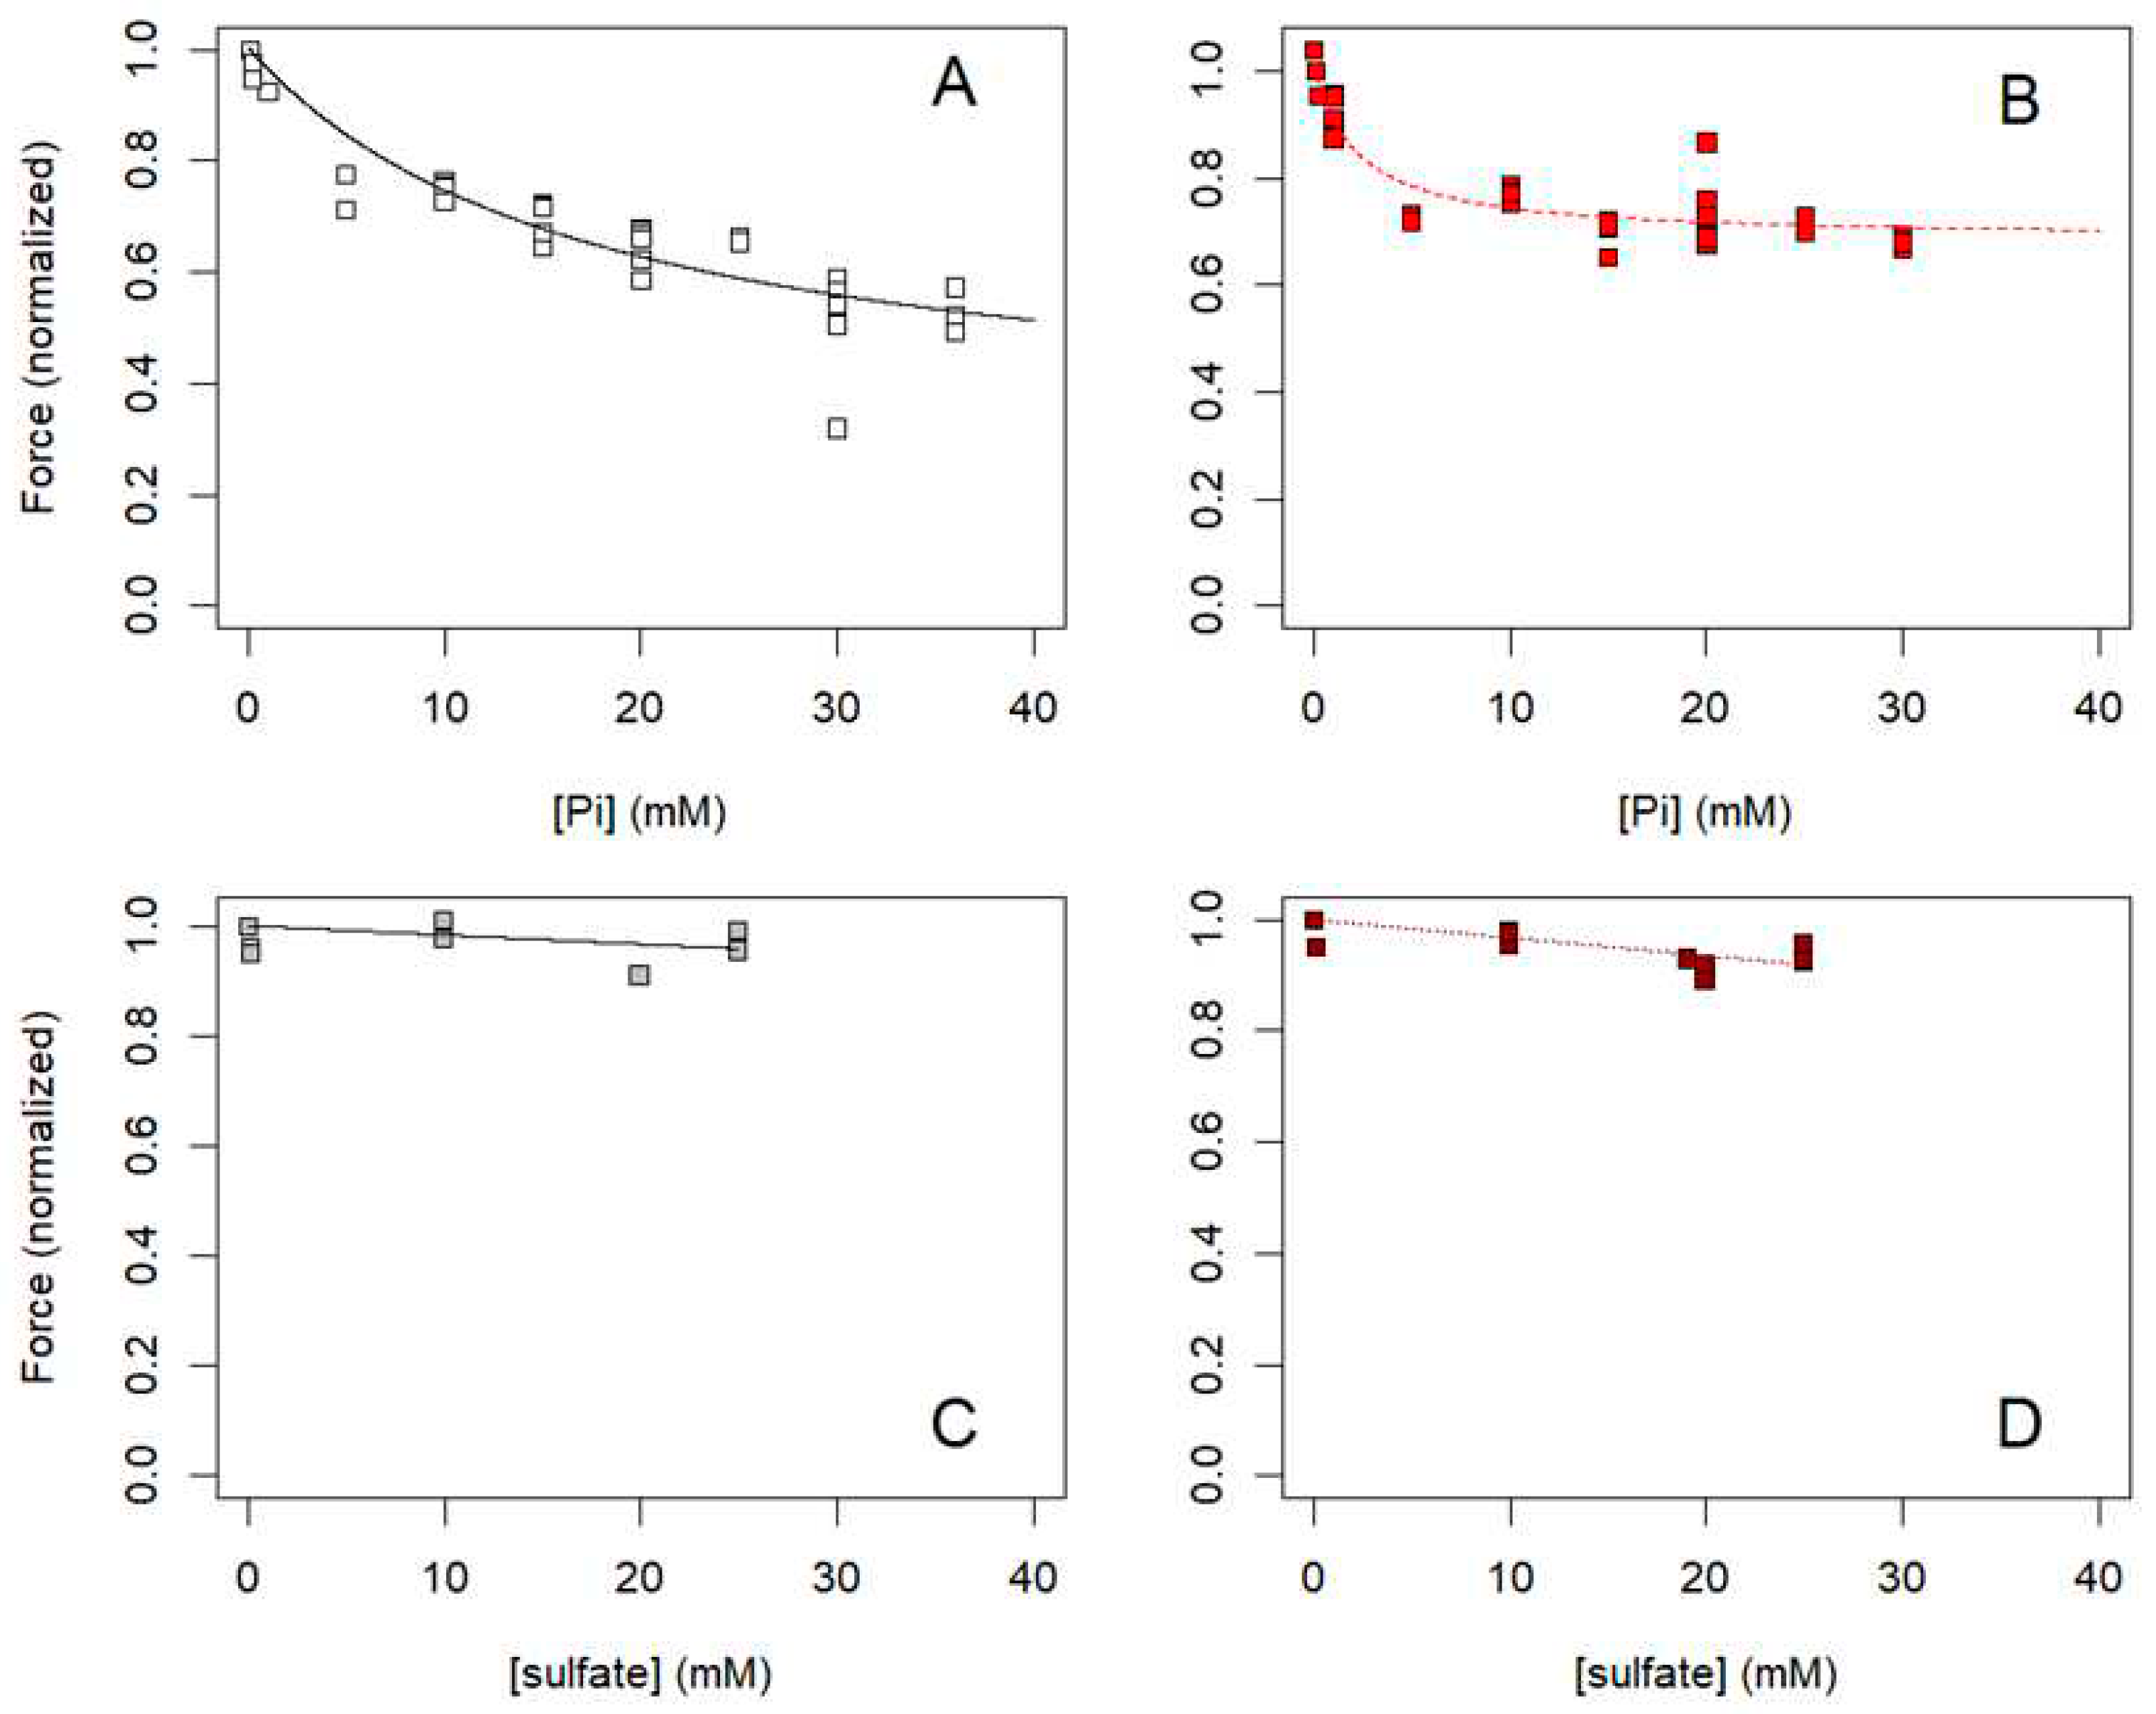

Appendix D
| Equilibrium | log Keq | log Keq | log Keq | log Keq | Reference(s) |
| 10oC | 20oC | 30oC | 40oC | ||
| [HATP3-]/[H+][ATP4-] | 6.71 | 6.72 | 6.72 | 6.73 | [114,115] |
| [H2ATP2-]/[H+][HATP3-] | 3.87 | 3.88 | 3.89 | 3.90 | [114,115] |
| [H3ATP-]/[H+][H2ATP2-] | 1.80 | 1.80 | 1.80 | 1.80 | [115] |
| [MgATP2-]/[Mg2+][ATP4-] | 4.37 | 4.38 | 4.39 | 4.40 | [114,115] |
| [MgHATP-]/[Mg2+][HATP3-] | 2.11 | 2.13 | 2.14 | 2.15 | [114,115] |
| [Mg2ATP]/[Mg2+][MgATP2-] | 1.70 | 1.70 | 1.70 | 1.70 | [115] |
| [CaATP2-]/[Ca2+][ATP4-] | 4.06 | 4.07 | 4.08 | 4.09 | [114,115] |
| [CaHATP-]/[Ca2+][HATP3-] | 1.95 | 1.97 | 1.98 | 1.99 | [114,115] |
| [NaATP3-]/[Na+][ATP4-] | 1.23 | 1.24 | 1.24 | 1.25 | [114,115] |
| [KATP3-]/[K+][ATP4-] | 1.09 | 1.10 | 1.10 | 1.11 | [114,115] |
| [HADP2-]/[H+][ADP3-] | 6.47 | 6.48 | 6.48 | 6.49 | [114,115] |
| [H2ADP-]/[H+][HADP2-] | 3.82 | 3.83 | 3.84 | 3.85 | [114,115] |
| [MgADP-]/[Mg2+][ADP3-] | 3.25 | 3.26 | 3.27 | 3.28 | [114,115] |
| [MgHADP]/[Mg2+][HADP2-] | 1.40 | 1.42 | 1.43 | 1.44 | [114,115] |
| [CaADP-]/[Ca2+][ADP3-] | 2.90 | 2.91 | 2.92 | 2.93 | [114,115] |
| [CaHADP]/[Ca2+][HADP2-] | 1.44 | 1.46 | 1.47 | 1.48 | [114,115] |
| [NaADP2-]/[Na+][ADP3-] | 1.04 | 1.05 | 1.05 | 1.06 | [114,115] |
| [KADP2-]/[K+][ADP3-] | 0.92 | 0.93 | 0.93 | 0.94 | [114,115] |
| [HPO42-]/[H+][PO43-] | 12.24 | 12.15 | 12.07 | 11.98 | [86,115] |
| [H2PO4-]/[H+][HPO42-] | 6.96 | 6.94 | 6.92 | 6.90 | [86,115] |
| [H3PO4]/[H+][H2PO4-] | 1.81 | 1.86 | 1.90 | 1.95 | [86,115] |
| [MgHPO4]/[Mg2+][HPO42-] | 2.25 | 2.33 | 2.40 | 2.48 | [86,115,116] |
| [CaHPO4]/[Ca2+][HPO42-] | 2.11 | 2.19 | 2.26 | 2.34 | [86,115,116] |
| [NaPO42-]/[Na+][PO43-] | 0.75 | 0.75 | 0.75 | 0.75 | [115] |
| [NaHPO4-]/[Na+][HPO42-] | 0.49 | 0.49 | 0.49 | 0.49 | [115] |
| [KPO42-]/[K+][PO43-] | 0.60 | 0.60 | 0.60 | 0.60 | [115] |
| [KHPO4-]/[K+][HPO42-] | 0.35 | 0.35 | 0.35 | 0.35 | [115] |
| [HCP-]/[H+][CP2-] | 4.58 | 4.58 | 4.58 | 4.58 | [117,118,119] |
| [H2CP]/[H+][HCP-] | 2.70 | 2.70 | 2.70 | 2.70 | [117,118,119] |
| [H3CP+]/[H+][H2CP] | 2.00 | 2.00 | 2.00 | 2.00 | [117,118,119] |
| [MgCP]/[Mg2+][CP2-] | 1.60 | 1.60 | 1.60 | 1.60 | [116,117] |
| [CaCP]/[Ca2+][CP2-] | 1.30 | 1.30 | 1.30 | 1.30 | [116,117] |
| [NaCP-]/[Na+][CP2-] | 0.74 | 0.74 | 0.74 | 0.74 | [117] |
| [NaHCP]/[Na+][HCP-] | 0.31 | 0.31 | 0.31 | 0.31 | [117] |
| [KCP-]/[K+][CP2-] | 0.74 | 0.74 | 0.74 | 0.74 | [117] |
| [KHCP]/[K+][HCP-] | 0.31 | 0.31 | 0.31 | 0.31 | [117] |
| [HCr+]/[H+][Cr] | 2.63 | 2.63 | 2.63 | 2.63 | [117] |
| [HEGTA3-]/[H+][EGTA4-] | 9.39 | 9.25 | 9.11 | 8.96 | [118,120] |
| [H2EGTA2-]/[H+][HEGTA3-] | 8.83 | 8.69 | 8.55 | 8.41 | [118,120] |
| [H3EGTA-]/[H+][H2EGTA2-] | 2.57 | 2.57 | 2.57 | 2.57 | [118,120] |
| [H4EGTA]/[H+][H3EGTA-] | 1.97 | 1.97 | 1.97 | 1.97 | [118,120] |
| [MgEGTA2-]/[Mg2+][EGTA4-] | 4.65 | 4.77 | 4.90 | 5.02 | [118,120] |
| [MgHEGTA-]/[Mg2+][HEGTA3-] | 2.98 | 2.98 | 2.98 | 2.98 | [118,120] |
| [CaEGTA2-]/[Ca2+][EGTA4-] | 10.65 | 10.45 | 10.26 | 10.06 | [115,118,119,120,121] |
| [CaHEGTA-]/[Ca2+][HEGTA3-] | 4.91 | 4.91 | 4.91 | 4.91 | [115,118,119,120,121] |
| [NaEGTA3-]/[Na+][EGTA4-] | 1.66 | 1.66 | 1.66 | 1.66 | [120] |
| [KEGTA3-]/[K+][EGTA4-] | 0.96 | 0.96 | 0.96 | 0.96 | [120] |
| [HMES]/[H+][MES-] | 6.29 | 6.18 | 6.07 | 5.96 | [115,122] |
| [HMOPS]/[H+][MOPS-] | 7.28 | 7.13 | 6.98 | 6.83 | [115,122] |
| [HTES]/[H+][TES-] | 7.71 | 7.51 | 7.31 | 7.11 | [115,122] |
| [HTris+]/[H+][Tris] | 8.68 | 8.37 | 8.06 | 7.75 | [115,122] |
| [HOAc]/[H+][OAc-] | 4.56 | 4.56 | 4.56 | 4.56 | [115] |
| [MgOAc+]/[Mg2+][OAc-] | 0.55 | 0.55 | 0.55 | 0.55 | [115] |
| [CaOAc+]/[Ca2+][OAc-] | 0.57 | 0.57 | 0.57 | 0.57 | [115] |
| [NaOAc]/[Na+][OAc-] | -0.26 | -0.26 | -0.26 | -0.26 | [115] |
| [KOAc]/[K+][OAc-] | -0.41 | -0.41 | -0.41 | -0.41 | [115] |
References
- Kushmerick, M. J. , Energetics of muscle contraction. In Handbook of Physiology—Skeletal Muscle, Peachey, L. D., Ed. American Physiological Society: Bethesda, MD, 1983; pp 189-236.
- Dumas, J. F.; Simard, G.; Flamment, M.; Ducluzeau, P. H.; Ritz, P. , Is skeletal muscle mitochondrial dysfunction a cause or an indirect consequence of insulin resistance in humans? Diabetes Metab 2009, 35, 159–167. [Google Scholar] [CrossRef] [PubMed]
- Petersen, K. F.; Shulman, G. I. , New insights into the pathogenesis of insulin resistance in humans using magnetic resonance spectroscopy. Obesity (Silver Spring) 2006, 14 Suppl 1, 34S–40S. [Google Scholar] [CrossRef]
- Wallis, R. H.; Collins, S. C.; Kaisaki, P. J.; Argoud, K.; Wilder, S. P.; Wallace, K. J.; Ria, M.; Ktorza, A.; Rorsman, P.; Bihoreau, M. T.; Gauguier, D. , Pathophysiological, genetic and gene expression features of a novel rodent model of the cardio-metabolic syndrome. PLoS One 2008, 3, e2962. [Google Scholar] [CrossRef] [PubMed]
- Befroy, D. E.; Petersen, K. F.; Dufour, S.; Mason, G. F.; de Graaf, R. A.; Rothman, D. L.; Shulman, G. I. , Impaired mitochondrial substrate oxidation in muscle of insulin-resistant offspring of type 2 diabetic patients. Diabetes 2007, 56, 1376–1381. [Google Scholar] [CrossRef] [PubMed]
- Johnson, G.; Roussel, D.; Dumas, J. F.; Douay, O.; Malthiery, Y.; Simard, G.; Ritz, P. , Influence of intensity of food restriction on skeletal muscle mitochondrial energy metabolism in rats. Am J Physiol Endocrinol Metab 2006, 291, E460–E467. [Google Scholar] [CrossRef] [PubMed]
- Petersen, K. F.; Befroy, D.; Dufour, S.; Dziura, J.; Ariyan, C.; Rothman, D. L.; DiPietro, L.; Cline, G. W.; Shulman, G. I. , Mitochondrial dysfunction in the elderly: possible role in insulin resistance. Science 2003, 300, 1140–1142. [Google Scholar] [CrossRef]
- Oltmanns, K. M.; Melchert, U. H.; Scholand-Engler, H. G.; Howitz, M. C.; Schultes, B.; Schweiger, U.; Hohagen, F.; Born, J.; Peters, A.; Pellerin, L. , Differential energetic response of brain vs. skeletal muscle upon glycemic variations in healthy humans. Am J Physiol Regul Integr Comp Physiol 2008, 294, R12–R16. [Google Scholar] [CrossRef]
- Mathur, M. C.; Chase, P. B.; Chalovich, J. M. , Several cardiomyopathy causing mutations on tropomyosin either destabilize the active state of actomyosin or alter the binding properties of tropomyosin. Biochem Biophys Res Commun 2011, 406, 74–78. [Google Scholar] [CrossRef]
- Muoio, D. M.; Newgard, C. B. , Obesity-related derangements in metabolic regulation. Annu Rev Biochem 2006, 75, 367–401. [Google Scholar] [CrossRef]
- Mandavia, C. H.; Aroor, A. R.; Demarco, V. G.; Sowers, J. R. , Molecular and metabolic mechanisms of cardiac dysfunction in diabetes. Life Sci 2012, 92, 601–608. [Google Scholar] [CrossRef]
- Catania, C.; Binder, E.; Cota, D. , mTORC1 signaling in energy balance and metabolic disease. Int J Obes (Lond) 2011, 35, 751–761. [Google Scholar] [CrossRef]
- Mudd, J. O.; Kass, D. A. , Tackling heart failure in the twenty-first century. Nature 2008, 451, 919–928. [Google Scholar] [CrossRef] [PubMed]
- Gafurov, B.; Fredricksen, S.; Cai, A.; Brenner, B.; Chase, P. B.; Chalovich, J. M. , The Δ14 mutation of human cardiac troponin T enhances ATPase activity and alters the cooperative binding of S1-ADP to regulated actin. Biochemistry 2004, 43, 15276–15285. [Google Scholar] [CrossRef]
- Bai, F.; Weis, A.; Takeda, A. K.; Chase, P. B.; Kawai, M. , Enhanced active cross-bridges during diastole: molecular pathogenesis of tropomyosin’s HCM mutations. Biophys J 2011, 100, 1014–1023. [Google Scholar] [CrossRef] [PubMed]
- Köhler, J.; Chen, Y.; Brenner, B.; Gordon, A. M.; Kraft, T.; Martyn, D. A.; Regnier, M.; Rivera, A. J.; Wang, C. K.; Chase, P. B. , Familial hypertrophic cardiomyopathy mutations in troponin I (K183Δ, G203S, K206Q) enhance filament sliding. Physiol Genomics 2003, 14, 117–128. [Google Scholar] [CrossRef] [PubMed]
- Kataoka, A.; Hemmer, C.; Chase, P. B. , Computational simulation of hypertrophic cardiomyopathy mutations in troponin I: influence of increased myofilament calcium sensitivity on isometric force, ATPase and [Ca2+]i. J Biomech 2007, 40, 2044–2052. [Google Scholar] [CrossRef]
- Loong, C. K. P.; Zhou, H.-X.; Chase, P. B. , Familial hypertrophic cardiomyopathy related E180G mutation increases flexibility of human cardiac a-tropomyosin. FEBS Letters 2012, 586, 3503–3507. [Google Scholar] [CrossRef]
- Loong, C. K. P.; Badr, M. A.; Chase, P. B. , Tropomyosin flexural rigidity and single Ca2+ regulatory unit dynamics: implications for cooperative regulation of cardiac muscle contraction and cardiomyocyte hypertrophy. Front Physiol 2012, 3, 80. [Google Scholar] [CrossRef] [PubMed]
- Gonzalez-Martinez, D.; Johnston, J. R.; Landim-Vieira, M.; Ma, W.; Antipova, O.; Awan, O.; Irving, T. C.; Chase, P. B.; Pinto, J. R. , Structural and functional impact of troponin C-mediated Ca2+ sensitization on myofilament lattice spacing and cross-bridge mechanics in mouse cardiac muscle. J Mol Cell Cardiol 2018, 123, 26–37. [Google Scholar] [CrossRef]
- Montessuit, C.; Lerch, R. , Regulation and dysregulation of glucose transport in cardiomyocytes. Biochim Biophys Acta 2013, 1833, 848–856. [Google Scholar] [CrossRef]
- Landim-Vieira, M.; Ma, W.; Song, T.; Rastegarpouyani, H.; Gong, H.; Leite Coscarella, I.; Bogaards, S. J. P.; Conijn, S. P.; Ottenheijm, C. A. C.; Hwang, H. S.; Papadaki, M.; Knollmann, B. C.; Sadayappan, S.; Irving, T. C.; Galkin, V. E.; Chase, P. B.; Pinto, J. R. , Cardiac troponin T N-domain variant destabilizes the actin interface resulting in disturbed myofilament function. Proc Natl Acad Sci 2023, 120, e2221244120. [Google Scholar] [CrossRef]
- Phillips, R. C.; George, P.; Rutman, R. J. , Thermodynamic data for the hydrolysis of adenosine triphosphate as a function of pH, Mg2+ ion concentration, and ionic strength. J Biol Chem 1969, 244, 3330–3342. [Google Scholar] [CrossRef] [PubMed]
- George, P.; Rutman, R. J. , The “high energy phosphate bond” concept. Prog Biophys Mol Biol 1960, 10, 1–53. [Google Scholar] [CrossRef] [PubMed]
- Alberty, R. A. , Standard Gibbs free energy, enthalpy, and entropy changes as a function of pH and pMg for several reactions involving adenosine phosphates. J Biol Chem 1969, 244, 3290–3302. [Google Scholar] [CrossRef] [PubMed]
- Alberty, R. A. , Equilibrium calculations on systems of biochemical reactions at specified pH and pMg. Biophys Chem 1992, 42, 117–131. [Google Scholar] [CrossRef]
- Alberty, R. A.; Cornish-Bowden, A. , The pH dependence of the apparent equilibrium constant, K’, of a biochemical reaction. Trends Biochem Sci 1993, 18, 288–291. [Google Scholar] [CrossRef]
- Schief, W. R.; Howard, J. , Conformational changes during kinesin motility. Curr Opin Cell Biol 2001, 13, 19–28. [Google Scholar] [CrossRef]
- Lawson, J. W. R.; Veech, R. L. , Effects of pH and free Mg2+ on the Keq of the creatine kinase reaction and other phosphate hydrolyses and phosphate transfer reactions. J Biol Chem 1979, 254, 6528–6537. [Google Scholar] [CrossRef]
- Kushmerick, M. J.; Dillon, P. F.; Meyer, R. A.; Brown, T. R.; Krisanda, J. M.; Sweeney, H. L. , 31P NMR spectroscopy, chemical analysis, and free Mg2+ of rabbit bladder and uterine smooth muscle. J Biol Chem 1986, 261, 14420–14429. [Google Scholar] [CrossRef]
- Kushmerick, M. J.; Moerland, T. S.; Wiseman, R. W. , Two classes of mammalian skeletal muscle fibers distinguished by metabolite content. Adv Exp Med Biol 1993, 332, 749–760, discussion 760-1. [Google Scholar]
- Wiseman, R. W.; Kushmerick, M. J. , Creatine kinase equilibration follows solution thermodynamics in skeletal muscle. 31P NMR studies using creatine analogs. J Biol Chem 1995, 270, 12428–12438. [Google Scholar] [CrossRef] [PubMed]
- Wiseman, R. W.; Kushmerick, M. J. , Phosphorus metabolite distribution in skeletal muscle: quantitative bioenergetics using creatine analogs. Mol Cell Biochem 1997, 174, 23–28. [Google Scholar] [CrossRef] [PubMed]
- Brault, J. J.; Abraham, K. A.; Terjung, R. L. , Phosphocreatine content of freeze-clamped muscle: influence of creatine kinase inhibition. J Appl Physiol (1985) 2003, 94, 1751–1756. [Google Scholar] [CrossRef] [PubMed]
- Chase, P. B.; Kushmerick, M. J. , Effects of pH on contraction of rabbit fast and slow skeletal muscle fibers. Biophys J 1988, 53, 935–946. [Google Scholar] [CrossRef]
- Chase, P. B.; Kushmerick, M. J. , Effect of physiological ADP concentrations on contraction of single skinned fibers from rabbit fast and slow muscles. Am J Physiol 1995, 268 Pt 1 Pt 1, C480–9. [Google Scholar] [CrossRef]
- Meyer, R. A.; Kushmerick, M. J.; Brown, T. R. , Application of 31P-NMR spectroscopy to the study of striated muscle metabolism. Am J Physiol 1982, 242, C1–C11. [Google Scholar] [CrossRef]
- Eisenberg, E.; Hill, T. L. , A cross-bridge model of muscle contraction. Prog Biophys Mol Biol 1978, 33, 55–82. [Google Scholar] [CrossRef]
- Eisenberg, E.; Hill, T. L. , Muscle contraction and free energy transduction in biological systems. Science 1985, 227, 999–1006. [Google Scholar] [CrossRef]
- Howard, J. , Mechanics of Motor Proteins and the Cytoskeleton. Sinaur Associates: Sunderland, MA, 2001; p 367.
- Pate, E.; Cooke, R. , A model of crossbridge action: the effects of ATP, ADP, and Pi. J Muscle Res Cell Motil 1989, 10, 181–196. [Google Scholar] [CrossRef]
- Jeneson, J. A. L.; Westerhoff, H. V.; Brown, T. R.; Van Echteld, C. J. A.; Berger, R. , Quasi-linear relationship between Gibbs free energy of ATP hydrolysis and power output in human forearm muscle. Am J Physiol 1995, 268 Pt 1 Pt 1, C1474–84. [Google Scholar] [CrossRef]
- Westerhoff, H. V.; van Echteld, C. J. A.; Jeneson, J. A. L. , On the expected relationship between Gibbs energy of ATP hydrolysis and muscle performance. Biophys Chem 1995, 54, 137–142. [Google Scholar] [CrossRef] [PubMed]
- Godt, R. E.; Nosek, T. M. , Changes in intracellular milieu with fatigue or hypoxia depress contraction of skinned rabbit skeletal and cardiac muscle. J Physiol 1989, 412, 155–180. [Google Scholar] [CrossRef] [PubMed]
- Karatzaferi, C.; Chinn, M. K.; Cooke, R. , The force exerted by a muscle cross-bridge depends directly on the strength of the actomyosin bond. Biophys J 2004, 87, 2532–2544. [Google Scholar] [CrossRef] [PubMed]
- Nosek, T. M.; Fender, K. Y.; Godt, R. E. , It is diprotonated inorganic phosphate that depresses force in skinned skeletal muscle fibers. Science 1987, 236, 191–193. [Google Scholar] [CrossRef]
- Cooke, R.; Franks, K.; Luciani, G. B.; Pate, E. , The inhibition of rabbit skeletal muscle contraction by hydrogen ions and phosphate. J Physiol 1988, 395, 77–97. [Google Scholar] [CrossRef] [PubMed]
- Debold, E. P.; Dave, H.; Fitts, R. H. , Fiber type and temperature dependence of inorganic phosphate: implications for fatigue. Am J Physiol Cell Physiol 2004, 287, C673–C681. [Google Scholar] [CrossRef]
- Phillips, S. K.; Wiseman, R. W.; Woledge, R. C.; Kushmerick, M. J. , The effect of metabolic fuel on force production and resting inorganic phosphate levels in mouse skeletal muscle. J Physiol 1993, 462, 135–146. [Google Scholar] [CrossRef]
- Pate, E.; Lin, M.; Franks-Skiba, K.; Cooke, R. , Contraction of glycerinated rabbit slow-twitch muscle fibers as a function of MgATP concentration. Am J Physiol Cell Physiol 1992, 262, C1039–C1046. [Google Scholar] [CrossRef]
- Cooke, R.; Bialek, W. , Contraction of glycerinated muscle fibers as a function of the ATP concentration. Biophys J 1979, 28, 241–258. [Google Scholar] [CrossRef]
- Cooke, R.; Pate, E. , The effects of ADP and phosphate on the contraction of muscle fibers. Biophys J 1985, 48, 789–798. [Google Scholar] [CrossRef]
- Wiseman, R. W.; Beck, T. W.; Chase, P. B. , Effect of intracellular pH on force development depends on temperature in intact skeletal muscle from mouse. Am J Physiol 1996, 271 Pt 1, C878–C886. [Google Scholar] [CrossRef] [PubMed]
- Vinnakota, K. C.; Beard, D. A.; Dash, R. K. , Design of experiments for identification of complex biochemical systems with applications to mitochondrial bioenergetics. Conf Proc IEEE Eng Med Biol Soc 2009, 2009, 4171–4174. [Google Scholar]
- Kost, G. J. , pH standardization for phosphorus-31 magnetic resonance heart spectroscopy at different temperatures. Magn Reson Med 1990, 14, 496–506. [Google Scholar] [CrossRef]
- Adams, G. R.; Foley, J. M.; Meyer, R. A. , Muscle buffer capacity estimated from pH changes during rest-to-work transitions. J Appl Physiol 1990, 69, 968–972. [Google Scholar] [CrossRef] [PubMed]
- Harkema, S. J.; Meyer, R. A. , Effect of acidosis on control of respiration in skeletal muscle. Am J Physiol 1997, 272 Pt 1, C491–500. [Google Scholar] [CrossRef]
- Kushmerick, M. J.; Moerland, T. S.; Wiseman, R. W. , Mammalian skeletal muscle fibers distinguished by contents of phosphocreatine, ATP, and Pi. Proc Natl Acad Sci USA 1992, 89, 7521–7525. [Google Scholar] [CrossRef]
- Pate, E.; Franks-Skiba, K.; Cooke, R. , Depletion of phosphate in active muscle fibers probes actomyosin states within the powerstroke. Biophys J 1998, 74, 369–380. [Google Scholar] [CrossRef]
- Nosek, T. M.; Leal-Cardoso, J. H.; McLaughlin, M.; Godt, R. E. , Inhibitory influence of phosphate and arsenate on contraction of skinned skeletal and cardiac muscle. American Journal of Physiology 1990, 259, C933–C939. [Google Scholar] [CrossRef]
- Brune, M.; Hunter, J. L.; Corrie, J. E. T.; Webb, M. R. , Direct, real-time measurement of rapid inorganic phosphate release using a novel fluorescent probe and its application to actomyosin subfragment 1 ATPase. Biochemistry 1994, 33, 8262–8271. [Google Scholar] [CrossRef]
- Debold, E. P.; Romatowski, J. G.; Fitts, R. H. , The depressive effect of Pi on the force-calcium relationship in skinned single muscle fibers is temperature dependent. Am J Physiol Cell Physiol 2006, 290, C1041–C1050. [Google Scholar] [CrossRef]
- Fryer, M. W.; Owen, V. J.; Lamb, G. D.; Stephenson, D. G. , Effects of creatine phosphate and Pi on Ca2+ movements and tension development in rat skinned skeletal muscle fibres. J Physiol 1995, 482 Pt 1, 123–140. [Google Scholar] [CrossRef] [PubMed]
- Martyn, D. A.; Gordon, A. M. , Force and stiffness in glycerinated rabbit psoas fibers. Effects of calcium and elevated phosphate. J Gen Physiol 1992, 99, 795–816. [Google Scholar] [CrossRef] [PubMed]
- Millar, N. C.; Homsher, E. , The effect of phosphate and calcium on force generation in glycerinated rabbit skeletal muscle fibers. J Biol Chem 1990, 265, 20234–20240. [Google Scholar] [CrossRef] [PubMed]
- Palmer, S.; Kentish, J. C. , The role of troponin C in modulating the Ca2+ sensitivity of mammalian skinned cardiac and skeletal muscle fibres. J Physiol 1994, 480, 45–60. [Google Scholar] [CrossRef] [PubMed]
- Harkema, S. J.; Adams, G. R.; Meyer, R. A. , Acidosis has no effect on the ATP cost of contraction in cat fast- and slow-twitch skeletal muscles. Am J Physiol 1997, 272 Pt 1 Pt 1, C485–90. [Google Scholar] [CrossRef]
- Golding, E. M.; Golding, R. M. , Interpretation of 31P MRS spectra in determining intracellular free magnesium and potassium ion concentrations. Magn Reson Med 1995, 33, 467–474. [Google Scholar] [CrossRef]
- Iotti, S.; Frassineti, C.; Alderighi, L.; Sabatini, A.; Vacca, A.; Barbiroli, B. , In vivo assessment of free magnesium concentration in human brain by 31P MRS. A new calibration curve based on a mathematical algorithm. NMR in Biomedicine 1996, 9, 24–32. [Google Scholar] [CrossRef]
- Headrick, J. P.; Willis, R. J. , Effect of inotropic stimulation on cytosolic Mg2+ in isolated rat heart: a 31P magnetic resonance study. Magn Reson Med 1989, 12, 328–338. [Google Scholar] [CrossRef]
- Teague, W. E., Jr.; Dobson, G. P. , Effect of temperature on the creatine kinase equilibrium. J Biol Chem 1992, 267, 14084–14093. [Google Scholar] [CrossRef]
- Teague, W. E., Jr.; Golding, E. M.; Dobson, G. P. , Adjustment of K’ for the creatine kinase, adenylate kinase and ATP hydrolysis equilibria to varying temperature and ionic strength. J Exp Biol 1996, 199 Pt 2 Pt 2, 509–512. [Google Scholar] [CrossRef]
- Golding, E. M.; Teague, W. E., Jr.; Dobson, G. P. , Adjustment of K’ to varying pH and pMg for the creatine kinase, adenylate kinase and ATP hydrolysis equilibria permitting quantitative bioenergetic assessment. J Exp Biol 1995, 198 Pt 8 Pt 8, 1775–1782. [Google Scholar] [CrossRef]
- Kushmerick, M. J. , Multiple equilibria of cations with metabolites in muscle bioenergetics. Am J Physiol 1997, 272 Pt 1 Pt 1, C1739–47. [Google Scholar] [CrossRef]
- Fabiato, A. , Computer programs for calculating total from specified free or free from specified total ionic concentrations in aqueous solutions containing multiple metals and ligands. Methods Enzymol 1988, 157, 378–417. [Google Scholar] [PubMed]
- Regnier, M.; Rivera, A. J.; Wang, C. K.; Bates, M. A.; Chase, P. B.; Gordon, A. M. , Thin filament near-neighbour regulatory unit interactions affect rabbit skeletal muscle steady-state force-Ca2+ relations. J Physiol 2002, 540 Pt 2 Pt 2, 485–497. [Google Scholar] [CrossRef]
- Dweck, D.; Reyes-Alfonso Jr, A.; Potter, J. D. , Expanding the range of free calcium regulation in biological solutions. Anal Biochem 2005, 347, 303–315. [Google Scholar] [CrossRef] [PubMed]
- Hardin, C. D.; Wiseman, R. W.; Kushmerick, M. J. , Vascular oxidative metabolism under different metabolic conditions. Biochim Biophys Acta 1992, 1133, 133–141. [Google Scholar] [CrossRef]
- Kunzelmann, S.; Webb, M. R. , A fluorescent, reagentless biosensor for ADP based on tetramethylrhodamine-labeled ParM. ACS Chem Biol 2010, 5, 415–425. [Google Scholar] [CrossRef]
- Botman, D.; van Heerden, J. H.; Teusink, B. , An Improved ATP FRET Sensor For Yeast Shows Heterogeneity During Nutrient Transitions. ACS Sens 2020, 5, 814–822. [Google Scholar] [CrossRef] [PubMed]
- Alberty, R. A. , Effect of pH and metal ion concentration on the equilibrium hydrolysis of adenosine triphosphate to adenosine diphosphate. J Biol Chem 1968, 243, 1337–1343. [Google Scholar] [CrossRef] [PubMed]
- Alberty, R. A. Calculation of the standard Gibbs free energy, enthalpy, and entropy changes for the hydrolysis of ATP at 0°C, 25°C, 37°C, and 75°. In Horizons of Bioenergetics, San Pietro, A.; Gest, H., Eds. Academic Press: New York, 1972. [Google Scholar]
- Alberty, R. A. , Change in the binding of hydrogen ions and magnesium ions in the hydrolysis of ATP. Biophys Chem 1998, 70, 109–119. [Google Scholar] [CrossRef]
- Alberty, R. A.; Goldberg, R. N. , Standard thermodynamic formation properties for the adenosine 5′-triphosphate series. Biochemistry 1992, 31, 10610–10615. [Google Scholar] [CrossRef] [PubMed]
- Rosing, J.; Slater, E. C. , The value of ΔG° for the hydrolysis of ATP. Biochim Biophys Acta 1972, 267, 275–290. [Google Scholar] [CrossRef] [PubMed]
- Phillips, R. C.; George, P.; Rutman, R. J. , Potentiometric studies of the secondary phosphate ionizations of AMP, ADP, and ATP, and calculations of thermodynamic data for the hydrolysis reactions. Biochemistry 1963, 2, 501–508. [Google Scholar] [CrossRef]
- Cooke, R. , Actomyosin interaction in striated muscle. Physiol Rev 1997, 77, 671–697. [Google Scholar] [CrossRef] [PubMed]
- Millar, N. C.; Homsher, E. , Kinetics of force generation and phosphate release in skinned rabbit soleus muscle fibers. Am J Physiol Cell Physiol 1992, 262, C1239–C1245. [Google Scholar] [CrossRef] [PubMed]
- Dantzig, J. A.; Goldman, Y. E.; Millar, N. C.; Lacktis, J.; Homsher, E. , Reversal of the cross-bridge force-generating transition by photogeneration of phosphate in rabbit psoas muscle fibres. J Physiol 1992, 451, 247–278. [Google Scholar] [CrossRef]
- Tesi, C.; Colomo, F.; Nencini, S.; Piroddi, N.; Poggesi, C. , The effect of inorganic phosphate on force generation in single myofibrils from rabbit skeletal muscle. Biophys J 2000, 78, 3081–3092. [Google Scholar] [CrossRef]
- Pate, E.; Cooke, R. , Addition of phosphate to active muscle fibers probes actomyosin states within the powerstroke. Pflügers Arch 1989, 414, 73–81. [Google Scholar] [CrossRef]
- Pate, E.; Cooke, R. , Energetics of the actomyosin bond in the filament array of muscle fibers. Biophys J 1988, 53, 561–573. [Google Scholar] [CrossRef]
- Tesi, C.; Colomo, F.; Piroddi, N.; Poggesi, C. , Characterization of the cross-bridge force-generating step using inorganic phosphate and BDM in myofibrils from rabbit skeletal muscles. J Physiol 2002, 541 Pt 1 Pt 1, 187–199. [Google Scholar] [CrossRef]
- Takagi, Y.; Shuman, H.; Goldman, Y. E. , Coupling between phosphate release and force generation in muscle actomyosin. Philos Trans R Soc Lond B Biol Sci 2004, 359, 1913–1920. [Google Scholar] [PubMed]
- Caremani, M.; Dantzig, J.; Goldman, Y. E.; Lombardi, V.; Linari, M. , Effect of inorganic phosphate on the force and number of myosin cross-bridges during the isometric contraction of permeabilized muscle fibers from rabbit psoas. Biophys J 2008, 95, 5798–5808. [Google Scholar] [CrossRef] [PubMed]
- Muretta, J. M.; Rohde, J. A.; Johnsrud, D. O.; Cornea, S.; Thomas, D. D. , Direct real-time detection of the structural and biochemical events in the myosin power stroke. Proc Natl Acad Sci U S A 2015, 112, 14272–14277. [Google Scholar] [CrossRef] [PubMed]
- Woody, M. S.; Winkelmann, D. A.; Capitanio, M.; Ostap, E. M.; Goldman, Y. E. , Single molecule mechanics resolves the earliest events in force generation by cardiac myosin. eLife 2019, 8. [Google Scholar] [CrossRef]
- Pate, E.; Bhimani, M.; Franks-Skiba, K.; Cooke, R. , Reduced effect of pH on skinned rabbit psoas muscle mechanics at high temperatures: implications for fatigue. J Physiol 1995, 486, 689–694. [Google Scholar] [CrossRef]
- Liang, B.; Chen, Y.; Wang, C. K.; Luo, Z.; Regnier, M.; Gordon, A. M.; Chase, P. B. , Ca2+ regulation of rabbit skeletal muscle thin filament sliding: role of cross-bridge number. Biophys J 2003, 85, 1775–1786. [Google Scholar] [CrossRef] [PubMed]
- Csernoch, L.; Bernengo, J. C.; Szentesi, P.; Jacquemond, V. , Measurements of intracellular Mg2+ concentration in mouse skeletal muscle fibers with the fluorescent indicator mag-indo-1. Biophys J 1998, 75, 957–967. [Google Scholar] [CrossRef] [PubMed]
- Meyer, R. A.; Brown, T. R.; Krilowicz, B. L.; Kushmerick, M. J. , Phosphagen and intracellular pH changes during contraction of creatine-depleted rat muscle. Am J Physiol 1986, 250 Pt 1 Pt 1, C264–74. [Google Scholar] [CrossRef]
- Margossian, S. S.; Lowey, S. , Preparation of myosin and its subfragments from rabbit skeletal muscle. Methods Enzymol 1982, 85, 55–71. [Google Scholar]
- White, H. D. , Special instrumentation and techniques for kinetic studies of contractile systems. Meth Enzymol 1982, 85, 698–708. [Google Scholar]
- Butcher, M. T.; Chase, P. B.; Hermanson, J. W.; Clark, A. N.; Brunet, N. M.; Bertram, J. E. , Contractile properties of muscle fibers from the deep and superficial digital flexors of horses. Am J Physiol Regul Integr Comp Physiol 2010, 299, R996–R1005. [Google Scholar] [CrossRef]
- Khoo, R. H., R. W. Ramette, C.H. Culberson, R.G. Bates., Determination of hydrogen ion concentrations in sea water from 5 to 40 oC: Standard potentials at salinities from 20 to 45%. Anal Chem 1977, 49, 29–34. [Google Scholar] [CrossRef]
- Wiseman, R. W.; Moerland, T. S.; Chase, P. B.; Stuppard, R.; Kushmerick, M. J. , High-performance liquid chromatographic assays for free and phosphorylated derivatives of the creatine analogues β-guanidopropionic acid and 1-carboxy-methyl-2-iminoimidazolidine (cyclocreatine). Anal Biochem 1992, 204, 383–389. [Google Scholar] [CrossRef] [PubMed]
- Schoffstall, B.; Clark, A.; Chase, P. B. , Positive inotropic effects of low dATP/ATP ratios on mechanics and kinetics of porcine cardiac muscle. Biophys J 2006, 91, 2216–2226. [Google Scholar] [CrossRef] [PubMed]
- Schoffstall, B.; Kataoka, A.; Clark, A.; Chase, P. B. , Effects of rapamycin on cardiac and skeletal muscle contraction and crossbridge cycling. J Pharmacol Exp Ther 2005, 312, 12–18. [Google Scholar] [CrossRef]
- Edman, K. A. P. , The velocity of unloaded shortening and its relation to sarcomere length and isometric force in vertebrate muscle fibres. J Physiol 1979, 291, 143–159. [Google Scholar] [CrossRef]
- Phillips, S. K.; Wiseman, R. W.; Woledge, R. C.; Kushmerick, M. J. , Neither changes in phosphorus metabolite levels nor myosin isoforms can explain the weakness in aged mouse muscle. J Physiol 1993, 463, 157–167. [Google Scholar] [CrossRef]
- Dentel, J. N.; Blanchard, S. G.; Ankrapp, D. P.; McCabe, L. R.; Wiseman, R. W. , Inhibition of cross-bridge formation has no effect on contraction-associated phosphorylation of p38 MAPK in mouse skeletal muscle. Am J Physiol Cell Physiol 2005, 288, C824–C830. [Google Scholar] [CrossRef]
- Jayaraman, R. C.; Latourette, M. T.; Siebert, J. E.; Wiseman, R. W. , A rapid algorithm for processing digital physiologic signals: Application to skeletal muscle contractions. Biomed Signal Process Control 2006, 1, 307–313. [Google Scholar] [CrossRef]
- Hill, A. V. , The possible effects of the aggregation of the molecules of haemoglobin on its dissociation curves. J Physiol 1910, 40, iv–vii. [Google Scholar]
- De Robertis, A.; De Stefano, C.; Sammartano, S.; Calì, R.; Purrello, R.; Rigano, C. , Alkali-metal and alkaline-earth-metal ion complexes with adenosine 5′-triphospate in aqueous solution. Thermodynamic parameters and their dependence on temperature and ionic strength. J Chem Res 1986, 164–165. [Google Scholar]
- Smith, R. M.; Martell, A. E.; Motekaitis, R. J. NIST Critically Selected Stability Constants of Metal Complexes Database.
- O’Sullivan, W. J.; Smithers, G. W. , Stability constants for biologically important metal-ligand complexes. Methods Enzymol 1979, 63, 294–336. [Google Scholar] [PubMed]
- Dawson, R. M. C.; Elliott, D. C.; Elliott, W. H.; Jones, K. M. , Data for Biochemical Research, 2nd ed.; Oxford University Press: London, 1974. [Google Scholar]
- Martell, A. E.; Smith, R. M. , Critical Stability Constants, Vol. 1: Amino Acids. Plenum Press: New York, 1974; Vol. 1, p 469.
- Martell, A. E.; Smith, R. M. , Critical Stability Constants, Vol. 5: First Supplement. Plenum Press: New York, 1982; Vol. 5, p 604.
- Harrison, S. M.; Bers, D. M. , Correction of proton and Ca association constants of EGTA for temperature and ionic strength. Am J Physiol Cell Physiol 1989, 256, C1250–C1256. [Google Scholar] [CrossRef] [PubMed]
- Robinson, R. A.; Stokes, R. H. , Electrolyte Solutions. Butterworth and Co. Ltd: London, 1965.
- Ellis, K. J.; Morrison, J. F. , Buffers of constant ionic strength for studying pH dependent processes. Methods Enzymol 1982, 87, 405–435. [Google Scholar]
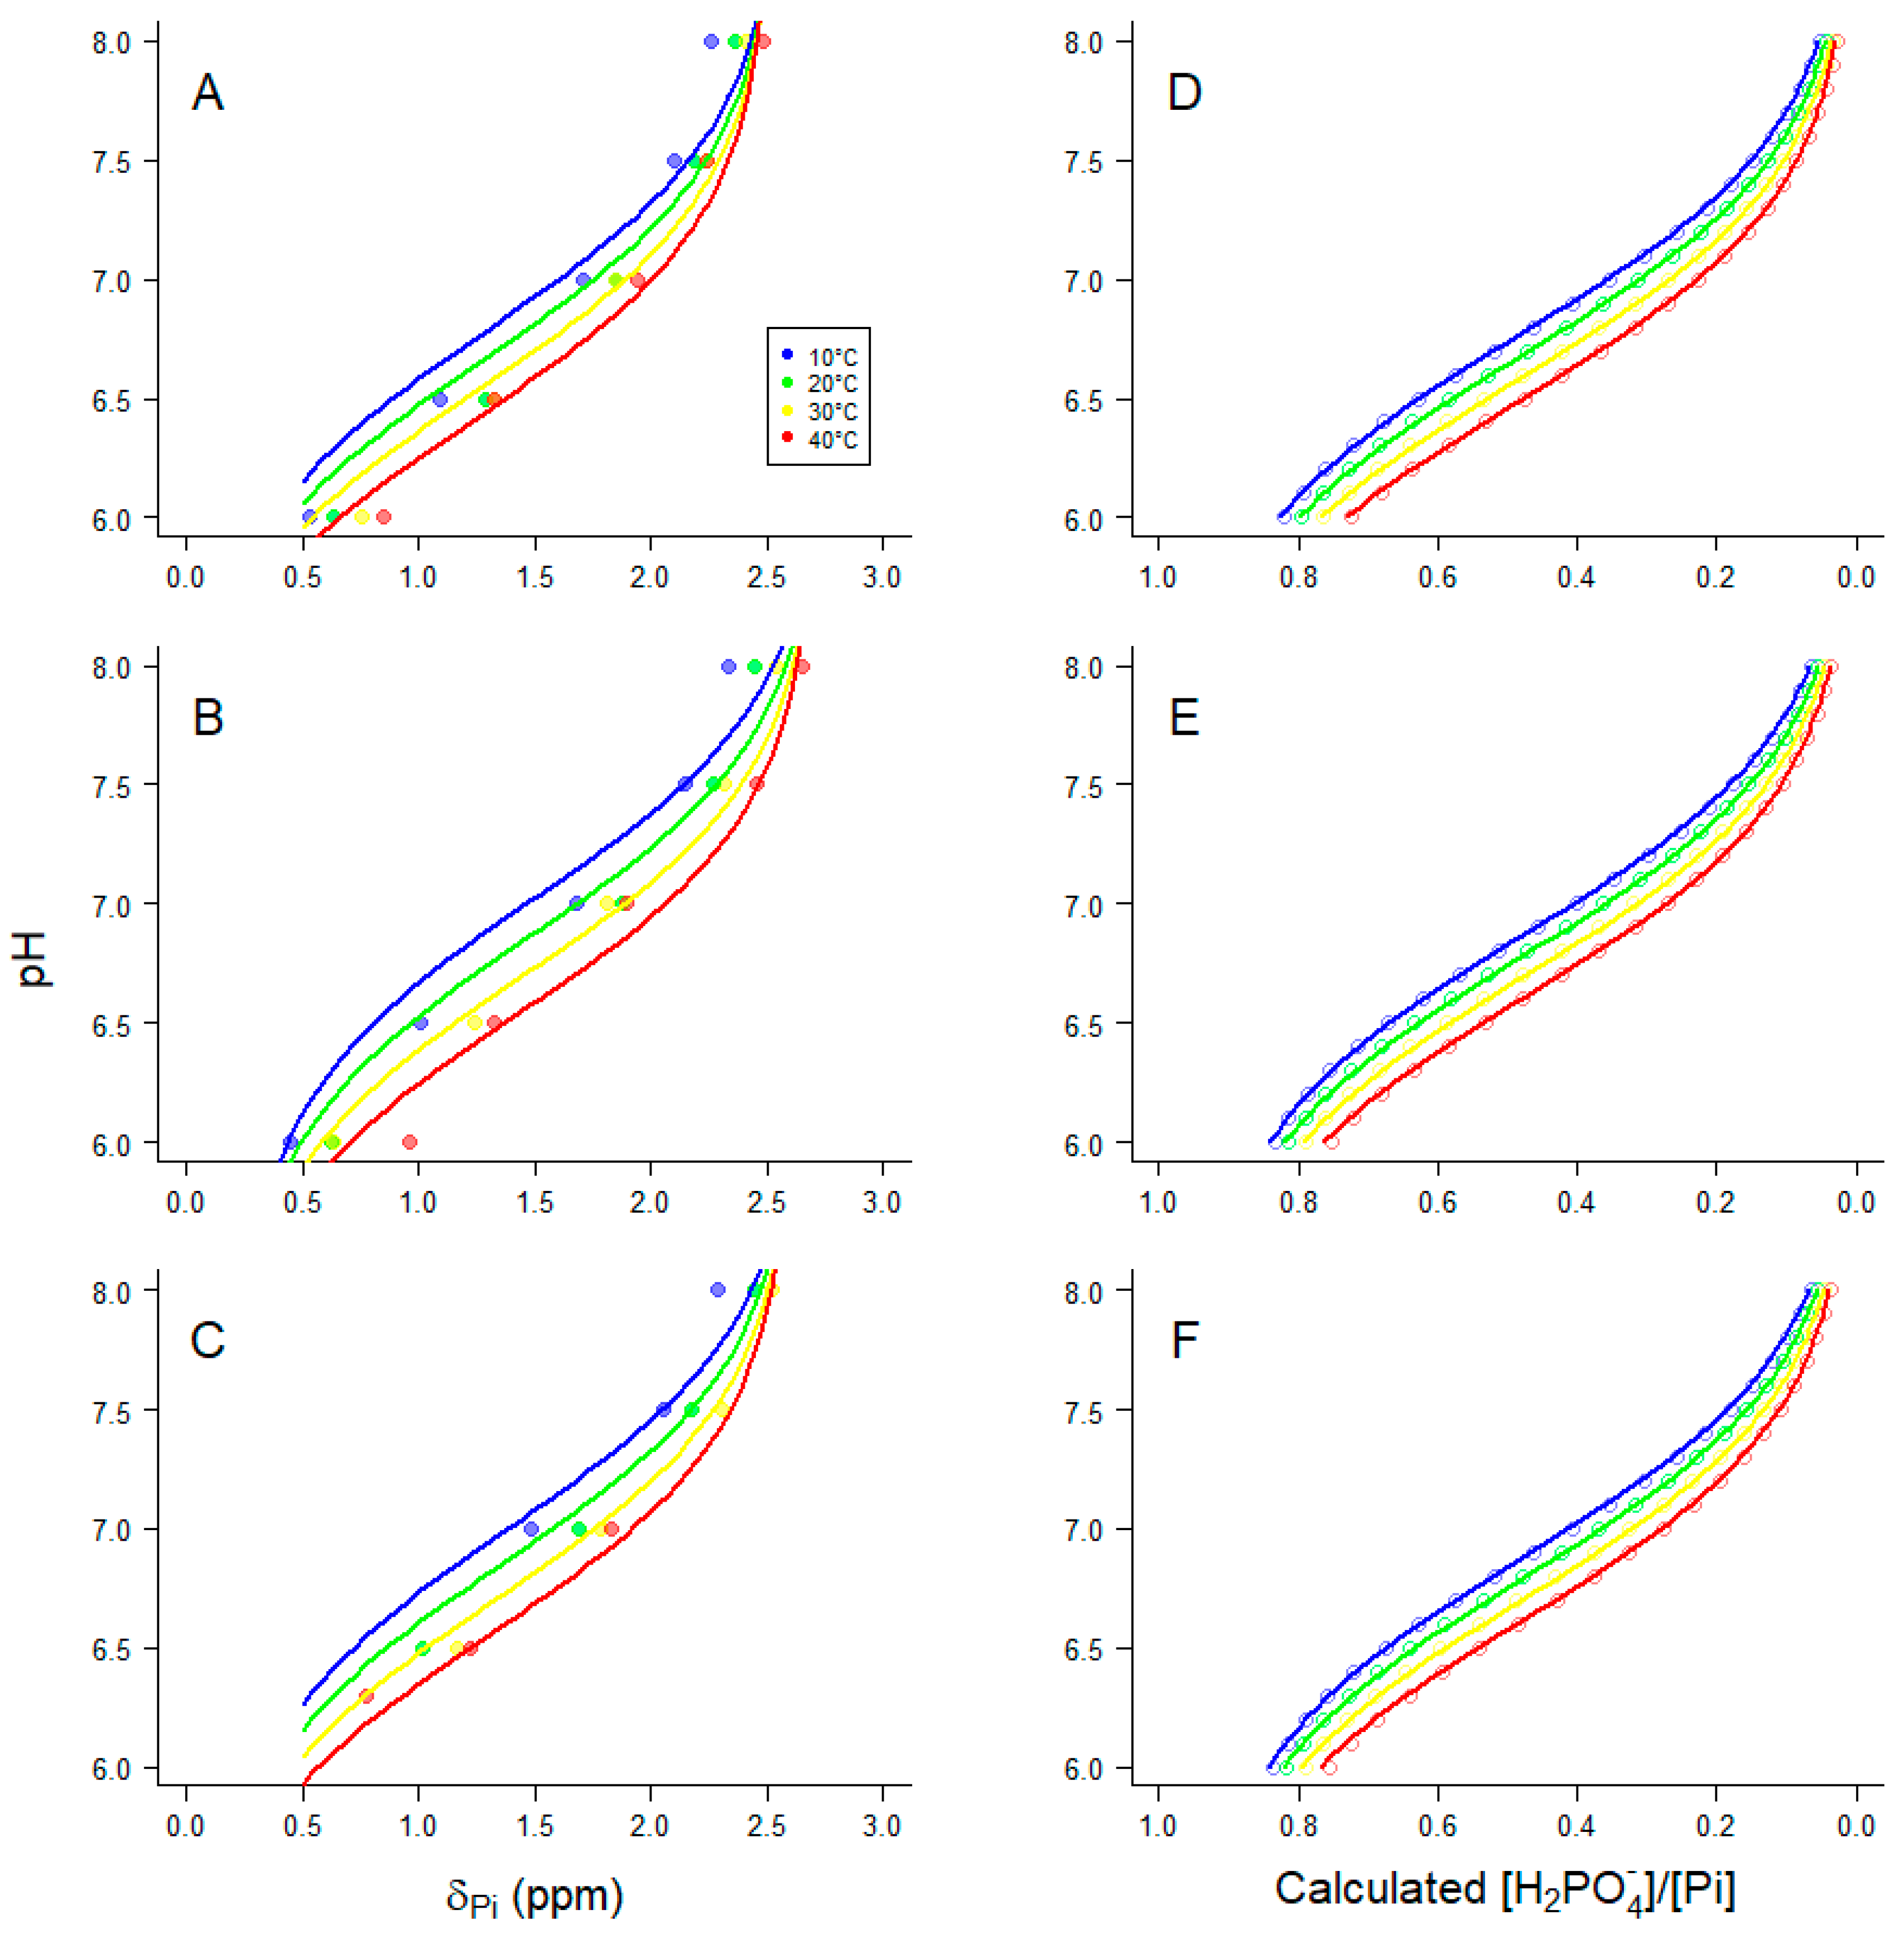
| pMg | ||||
| 2 | 3 | 4 | ||
| pKa | NMR | 6.66 + 0.05 | 6.85 + 0.05 | 6.85 + 0.05 |
| calc | 6.674 + 0.002 | 6.781 + 0.002 | 6.796 + 0.003 | |
| dpKa/dT | NMR | -0.013 + 0.004 | -0.016 + 0.003 | -0.015 + 0.003 |
| calc | -0.0092 + 0.0001 | -0.0089 + 0.0001 | -0.0088 + 0.0001 | |
| Δ | NMR | 0.06 + 0.02 | 0.25 + 0.03 | 0.15 + 0.03 |
| A | calc | 0.967 + 0.002 | 0.955 + 0.002 | 0.953 + 0.002 |
Disclaimer/Publisher’s Note: The statements, opinions and data contained in all publications are solely those of the individual author(s) and contributor(s) and not of MDPI and/or the editor(s). MDPI and/or the editor(s) disclaim responsibility for any injury to people or property resulting from any ideas, methods, instructions or products referred to in the content. |
© 2023 by the authors. Licensee MDPI, Basel, Switzerland. This article is an open access article distributed under the terms and conditions of the Creative Commons Attribution (CC BY) license (http://creativecommons.org/licenses/by/4.0/).


