1. Introduction
Climate and land-use changes have made Mediterranean-climate regions increasingly prone to extreme fire events and aridity, leading to carbon emissions and land degradation [
1,
2,
3,
4,
5,
6,
7]. On the one side, the terrestrial ecosystems are a global greenhouse gas (GHG) sink, but in contrast, agriculture and forestry are major sources of anthropogenic emissions, making land-use change the key driver of every terrestrial environmental syndrome including wildfires, desertification, and climate change [
8]. As such, land-use may paradoxically prevent or contribute to wildfires, desertification, and climate change, depending on the quantity and longevity of either the carbon that is emitted into the atmosphere or stored in ecosystems [
2,
6,
9,
10]. Most Mediterranean countries have experienced a forest transition, which resulted in forest expansion. Still, in some regions, such as mainland Portugal, the effect is being reversed as severe wildfires are mostly affecting the northern regions, and desertification is growing in the southern half of the country, leading to large carbon emissions [
2,
11,
12,
13,
14,
15].
In Portugal, as in other Mediterranean countries, wildfires are becoming more frequent, larger, and hazardous in the last decades, due to land-use changes and warmer and dryer climate [
2]. In fact, its mainland territory is mostly affected by two types of fires, the very frequent ones, and the extraordinary wildfires, that also tend to be extreme in size and severity [
16]. Extraordinary wildfires become extremely large, intense, and above suppression capacity causing significant ecological and socio-economic impacts, including relevant human fatalities and carbon emissions [
7,
14,
17]. Frequent fire impacts include forest regeneration shortage, even for fire adapted species, and transformation of forests in shrublands, since fire recurrence might be shorter than trees reproductive maturity [
12,
18]. Beside direct ecological effects, frequent wildfires greatly contribute to lack of forestry practices and rural abandonment [
19,
20].
Landscape specialization, in Portugal and other Mediterranean countries, is characterized by agricultural intensification on fertile lands and farmland retreat on marginal lands, where forests have regenerated or were installed, often with fast growing species in large patches, increasing fuel continuity and fire risks [
6,
10,
21]. Nowadays, agricultural and forest plantations have created large scale specialized landscapes, while the rest of the territory is abandoned where no viable socioecological solution is possible [
22]. Native forests became only residual, and mixed landscapes with agroforestry systems or non-timber forestry systems - silvopastoralism, cork, nuts, fruits - appeared in marginal lands [
23]. Although intensive production systems provide a significant part of food and timber to society, the specialized landscapes produce negative impacts on the environment and society [
24]. Without regulation services, like fire protection (in plantation-dominated landscapes) or carbon storage (in farmland-dominated landscapes), these specialized landscapes are prone to disturbances like extreme wildfires, floods, droughts, and ecosystem degradation like biodiversity loss, desertification, and land degradation which are all amplified by climate change [
3,
25]. In long run, the entire territory including the intensively used lands, will be affected by the loss of regulating services [
26], resulting in more land abandonment.
Land-use is the only driver directly changeable to address fire protection and carbon storage, while other drivers cannot or can only at the global scale (e.g topography, climate, weather)[
16,
27,
28,
29,
30,
31].
Previous research has pointed out the advantages of using landscape approaches to address climate and fire issues [
32,
33,
34,
35]. In this sense, nature-based solutions (NbS), under the wider range of land-use measures, have been recommended to explore trade-offs and synergies across multiple ecosystem services [
36]. Most studies using NbS for fire regulation and climate services, in Mediterranean regions, focus on land-use, land-cover (LULC) changes as major solutions [
5,
34,
35,
37,
38]. According to those studies, trade-offs between these ecosystem services are expected since climate services are based on carbon storage increasing with forest and shrubland expansion, which may lead to increased fire risks [
5,
35,
38,
39]. However, because of geographic scope’s limitations of such studies, fire regimes (FR) related to specific LULC are not sufficiently developed. And this is critical because controversy still exists on LULC roles on FRs. Actually, some studies point to a strong association of extreme wildfire events with some LULC types [
3,
40,
41,
42,
43], while others attributed LULC a minor influence on fire severity and size [
44,
45]. A wider region on central Portugal was recently studied focusing on landscape level (represented by parishes), and the authors found an expressive association of LULC with FRs, but even in these cases there was a limited number and range of landscape types [
21,
30,
46]. In another recent study for all mainland Portugal assessing twelve FR drivers, the role of land-cover was variable, depending on FRs, but very influential in extremely hazardous regimes [
16].
This paper is aimed at comparing different landscape types, at the national level, as regards the FR and carbon storage levels that characterize each type. Therefore, the objective of the paper is not to explore the dynamics of FR and carbon stock (CS), but rather to analyse how they change across landscape types. This is expected to help identifying which landscape types strike the best trade-off between more favourable FR and higher CS. Considering the composition, diversity, and configuration of each landscape type, we are also enables to discuss the relationship between landscape specialization and these trade-offs. Then, to apply LULC proportions as modelling variables to support a better understanding of landscape behaviour at both fire protection and CS. This framework involves a three-step approach: 1) it starts with an extensive characterisation of FR and CS, to find landscapes association with both ecosystem services; 2) secondly, following previous results, building a predictive model associating LULC with the most hazardous FR, coupled with a CS model; and finally, 3) using the models to simulate scenarios of LULC change to promote wildfire mitigation and carbon storage. The results are used to explore potential NbS to improve FR, also integrating CS to find trade-offs at landscape level [
5,
34,
35,
38].
In this study FR is following
sensu stricto concept from [
47] including only temporal and spatial distribution to determine fire characteristics. FR characteristics on our modelling setup were cumulative percentage of burned area (CPBA) over a 36 year period (1984-2019), and a temporal concentration index in such burned area at the landscape level, assessed through the Gini Concentration Index (GCI), following other studies [
21,
46], but integrating both variables to establish meaningful FR categories [
30] at the landscape level.
For landscape assessment, we characterized LULC based on five major classes: farmland, shrubland, forest plantations, native forests, and agroforestry. The weight of these five classes in land cover provides a simple description of landscape composition, and the data to compute landscape diversity variables. Additionally, we also considered the way these categories are spatially distributed in the landscape to compute landscape configuration variables. The associations between landscape composition, diversity and configuration, on the one hand, and FR, on the other, have been explored [
6,
10]. We assumed CS as a proxy of climate-resilience ecosystem services [
39], considering the maximization of carbon storage in the biosphere as a main objective of climate change mitigation [
36]. For CS setup, we attributed to each LULC class a figures for three carbon pools, namely the above- and below-ground biomass, and litter.
To our knowledge, the simultaneous assessment of FRs and CS at such a wide regional (national) level is innovative and valuable in NbS for wildfire mitigation research, and by dint of its extensive geographical scope it may contribute to disentangle most relevant landscape associations with both FR and CS.
Our results are expected to bring new insights in landscape planning policy-making and contribute to revert the reinforcing feedback loops of climate change, wildfires, and desertification, particularly in Mediterranean regions.
3. Results
3.1. Landscape characteristics
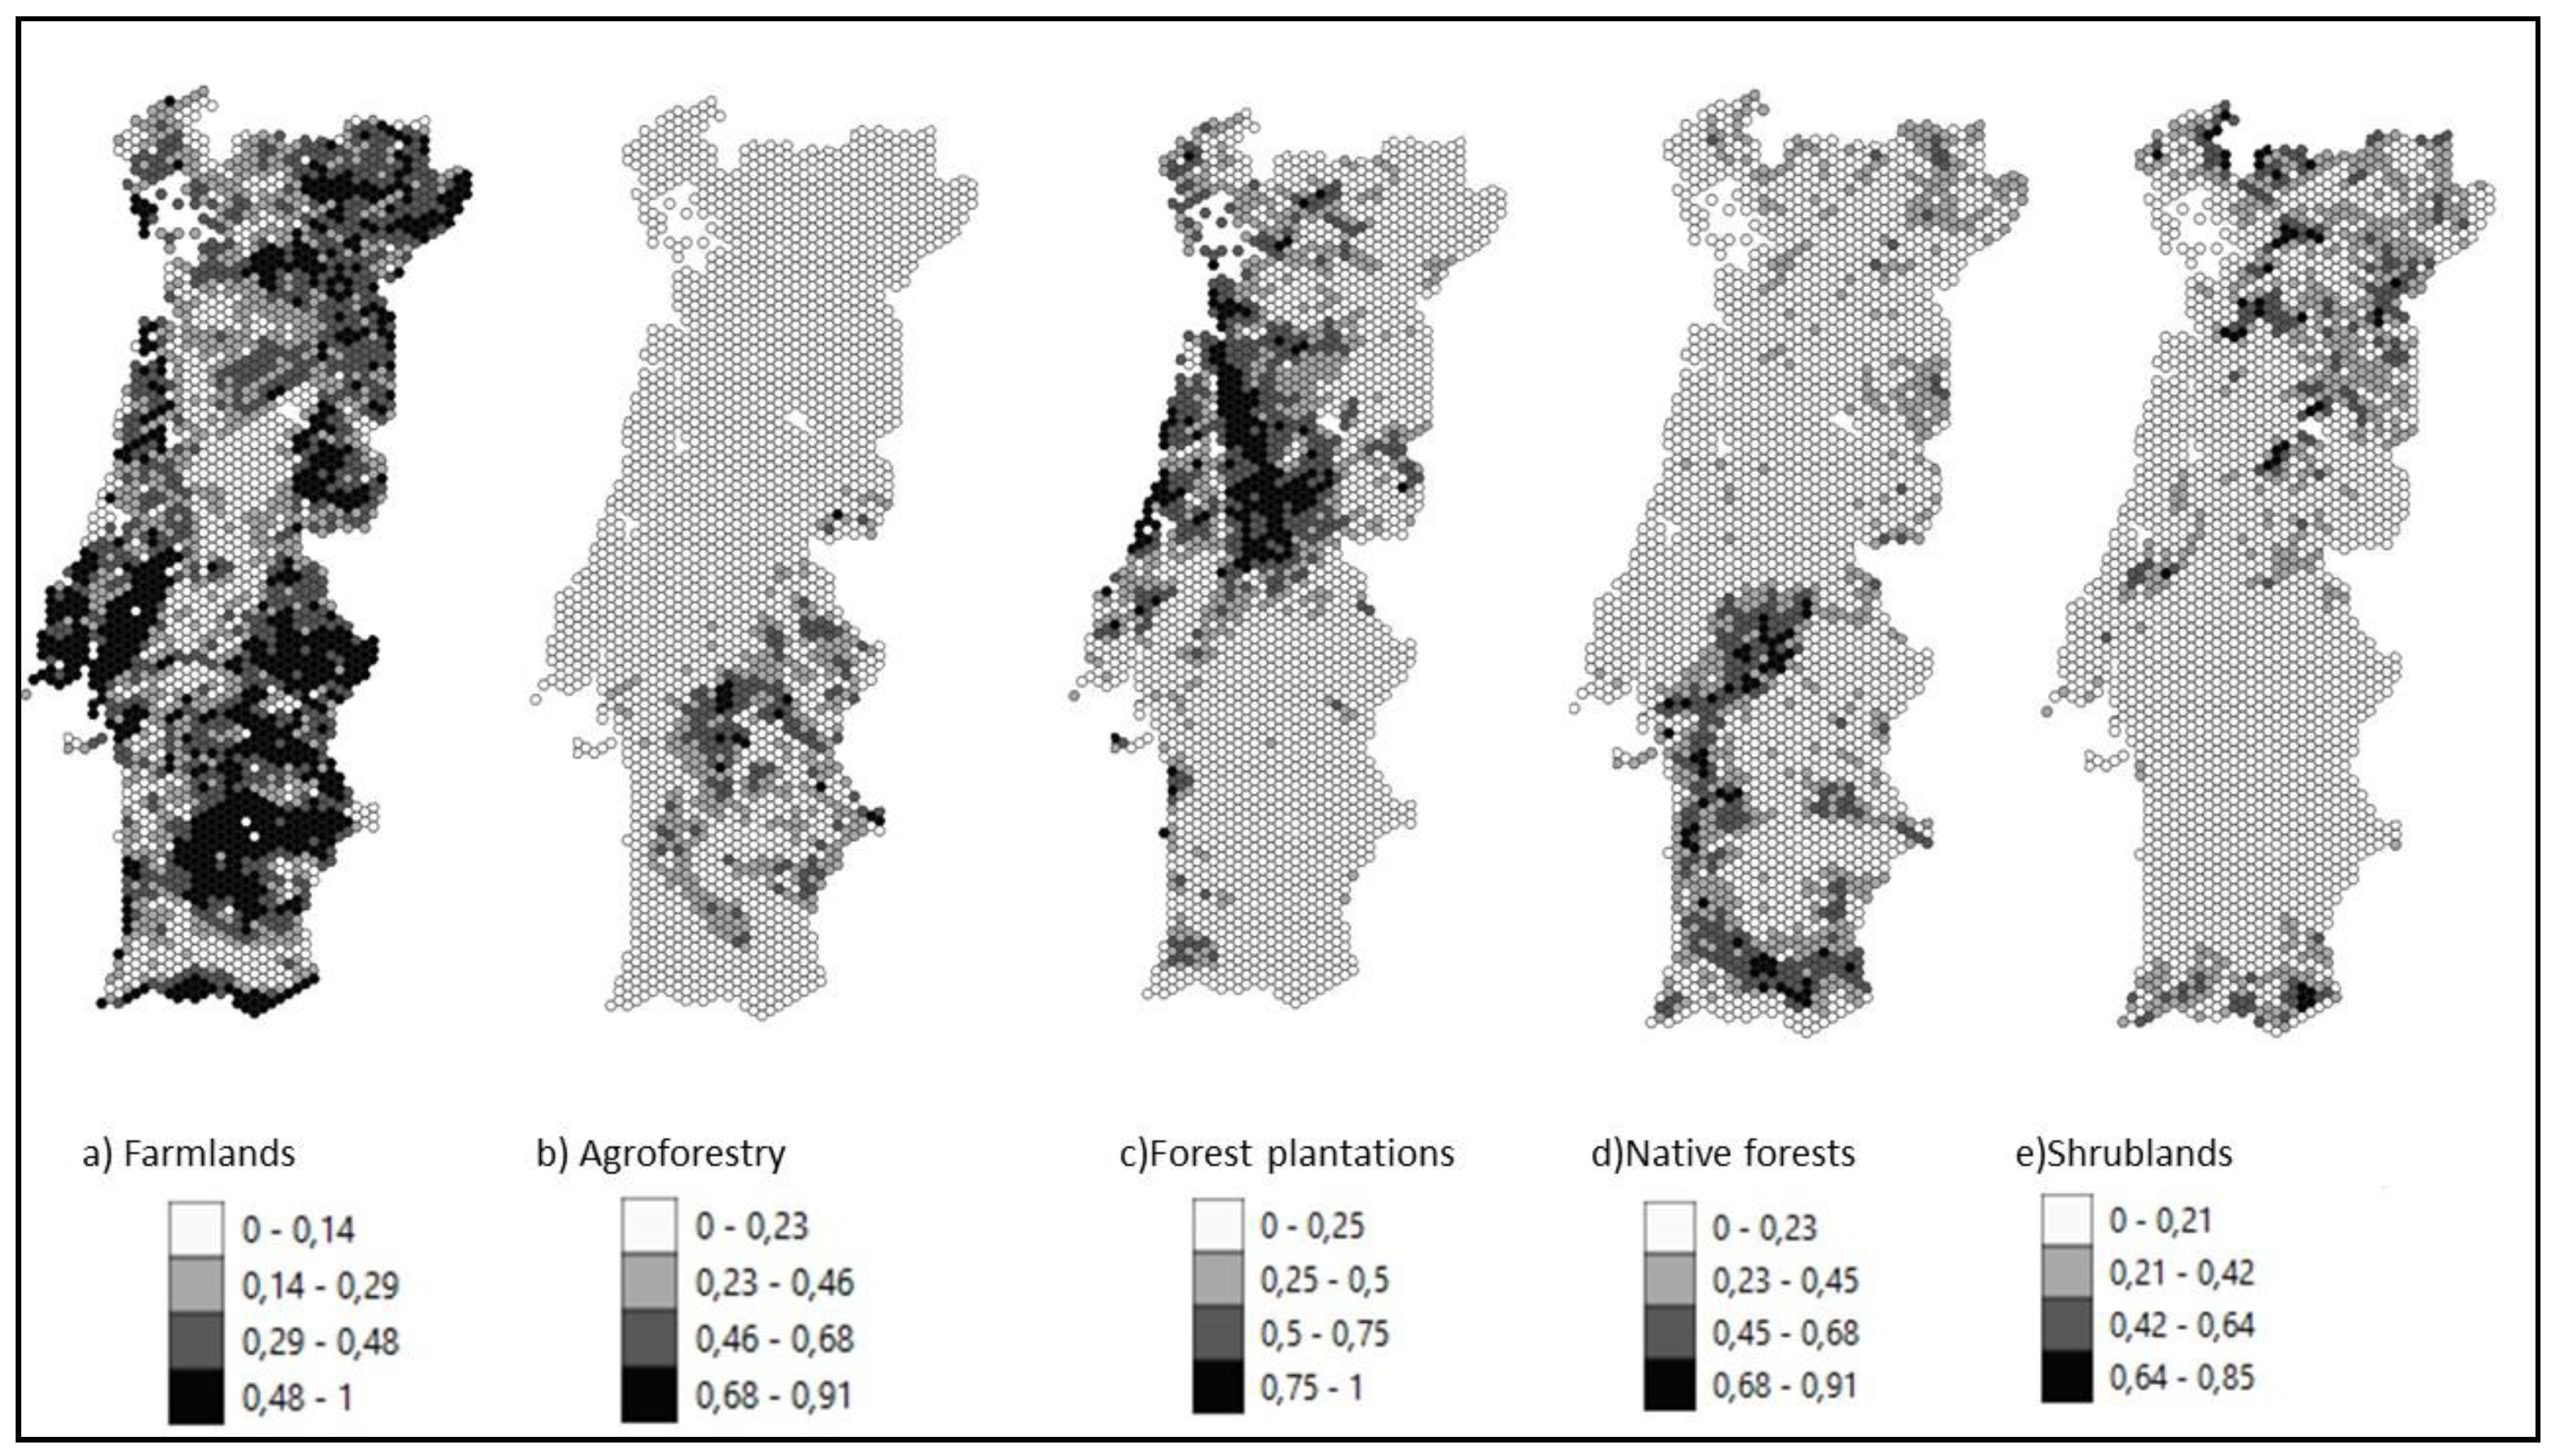
The landscape composition results are presented in five maps representing the proportion (0-1) of each of the main LULC classes (
Figure 2).
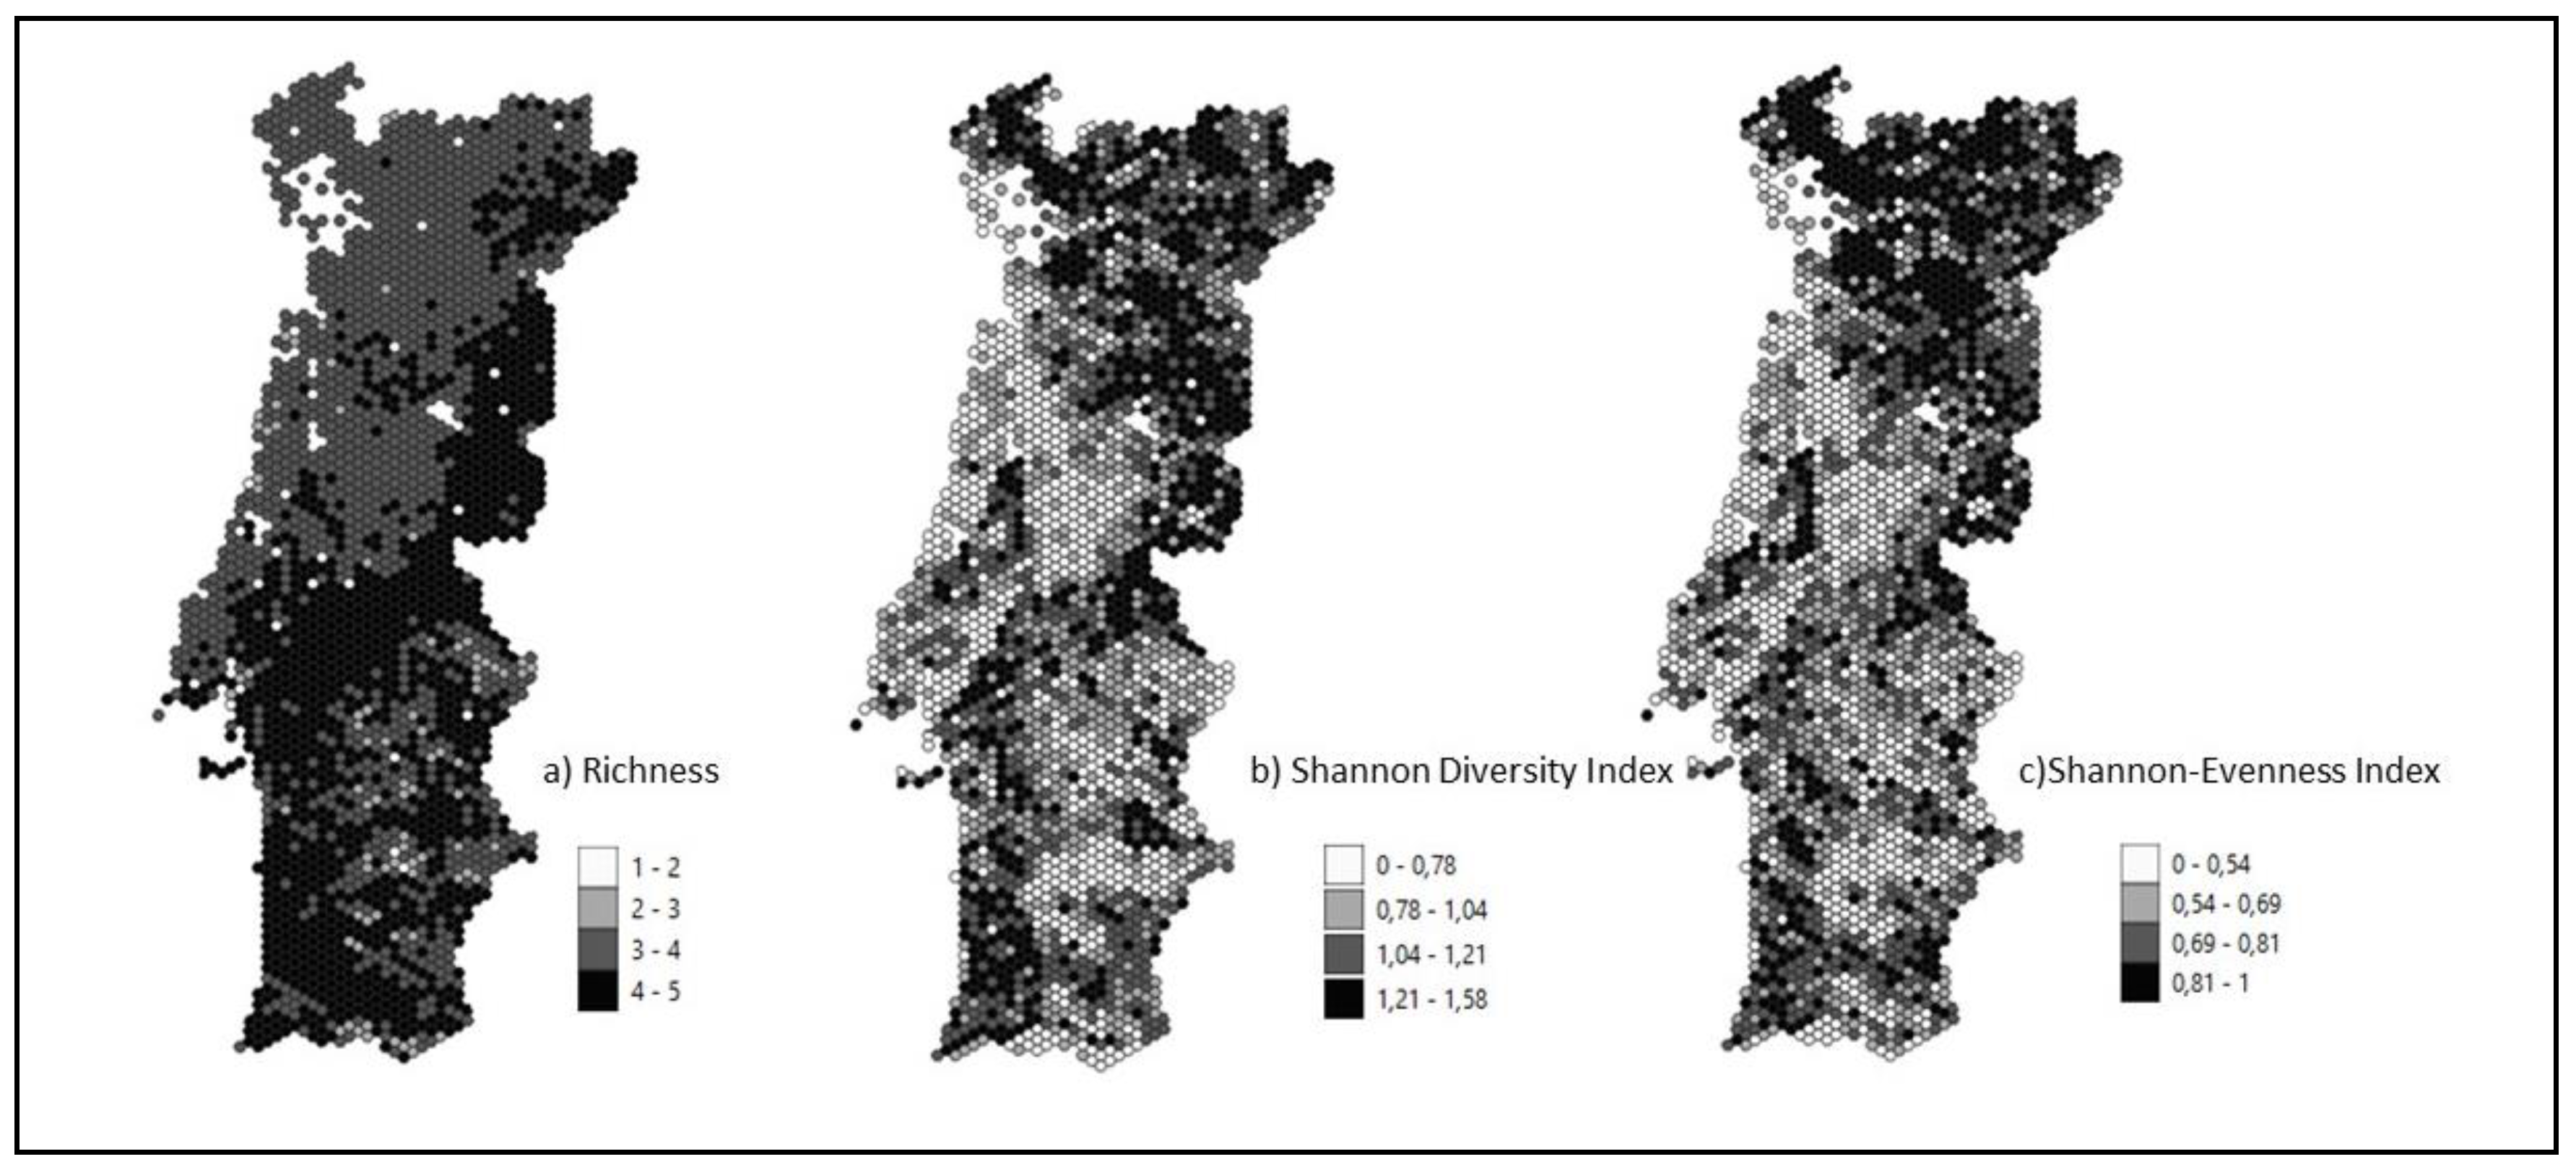
Landscape diversity results are represented in three maps, corresponding to Richness, Shannon Index and Shannon-Evenness (
Figure 3).
Configuration metrics were plotted and yielded two PCA’s which explained 85.2% of total cumulative variance. PCA resulted in 2 principal axes (components) with eigenvalue > 1.0, which were retained to describe the landscape configuration in subsequent statistical analysis (
Table 2)
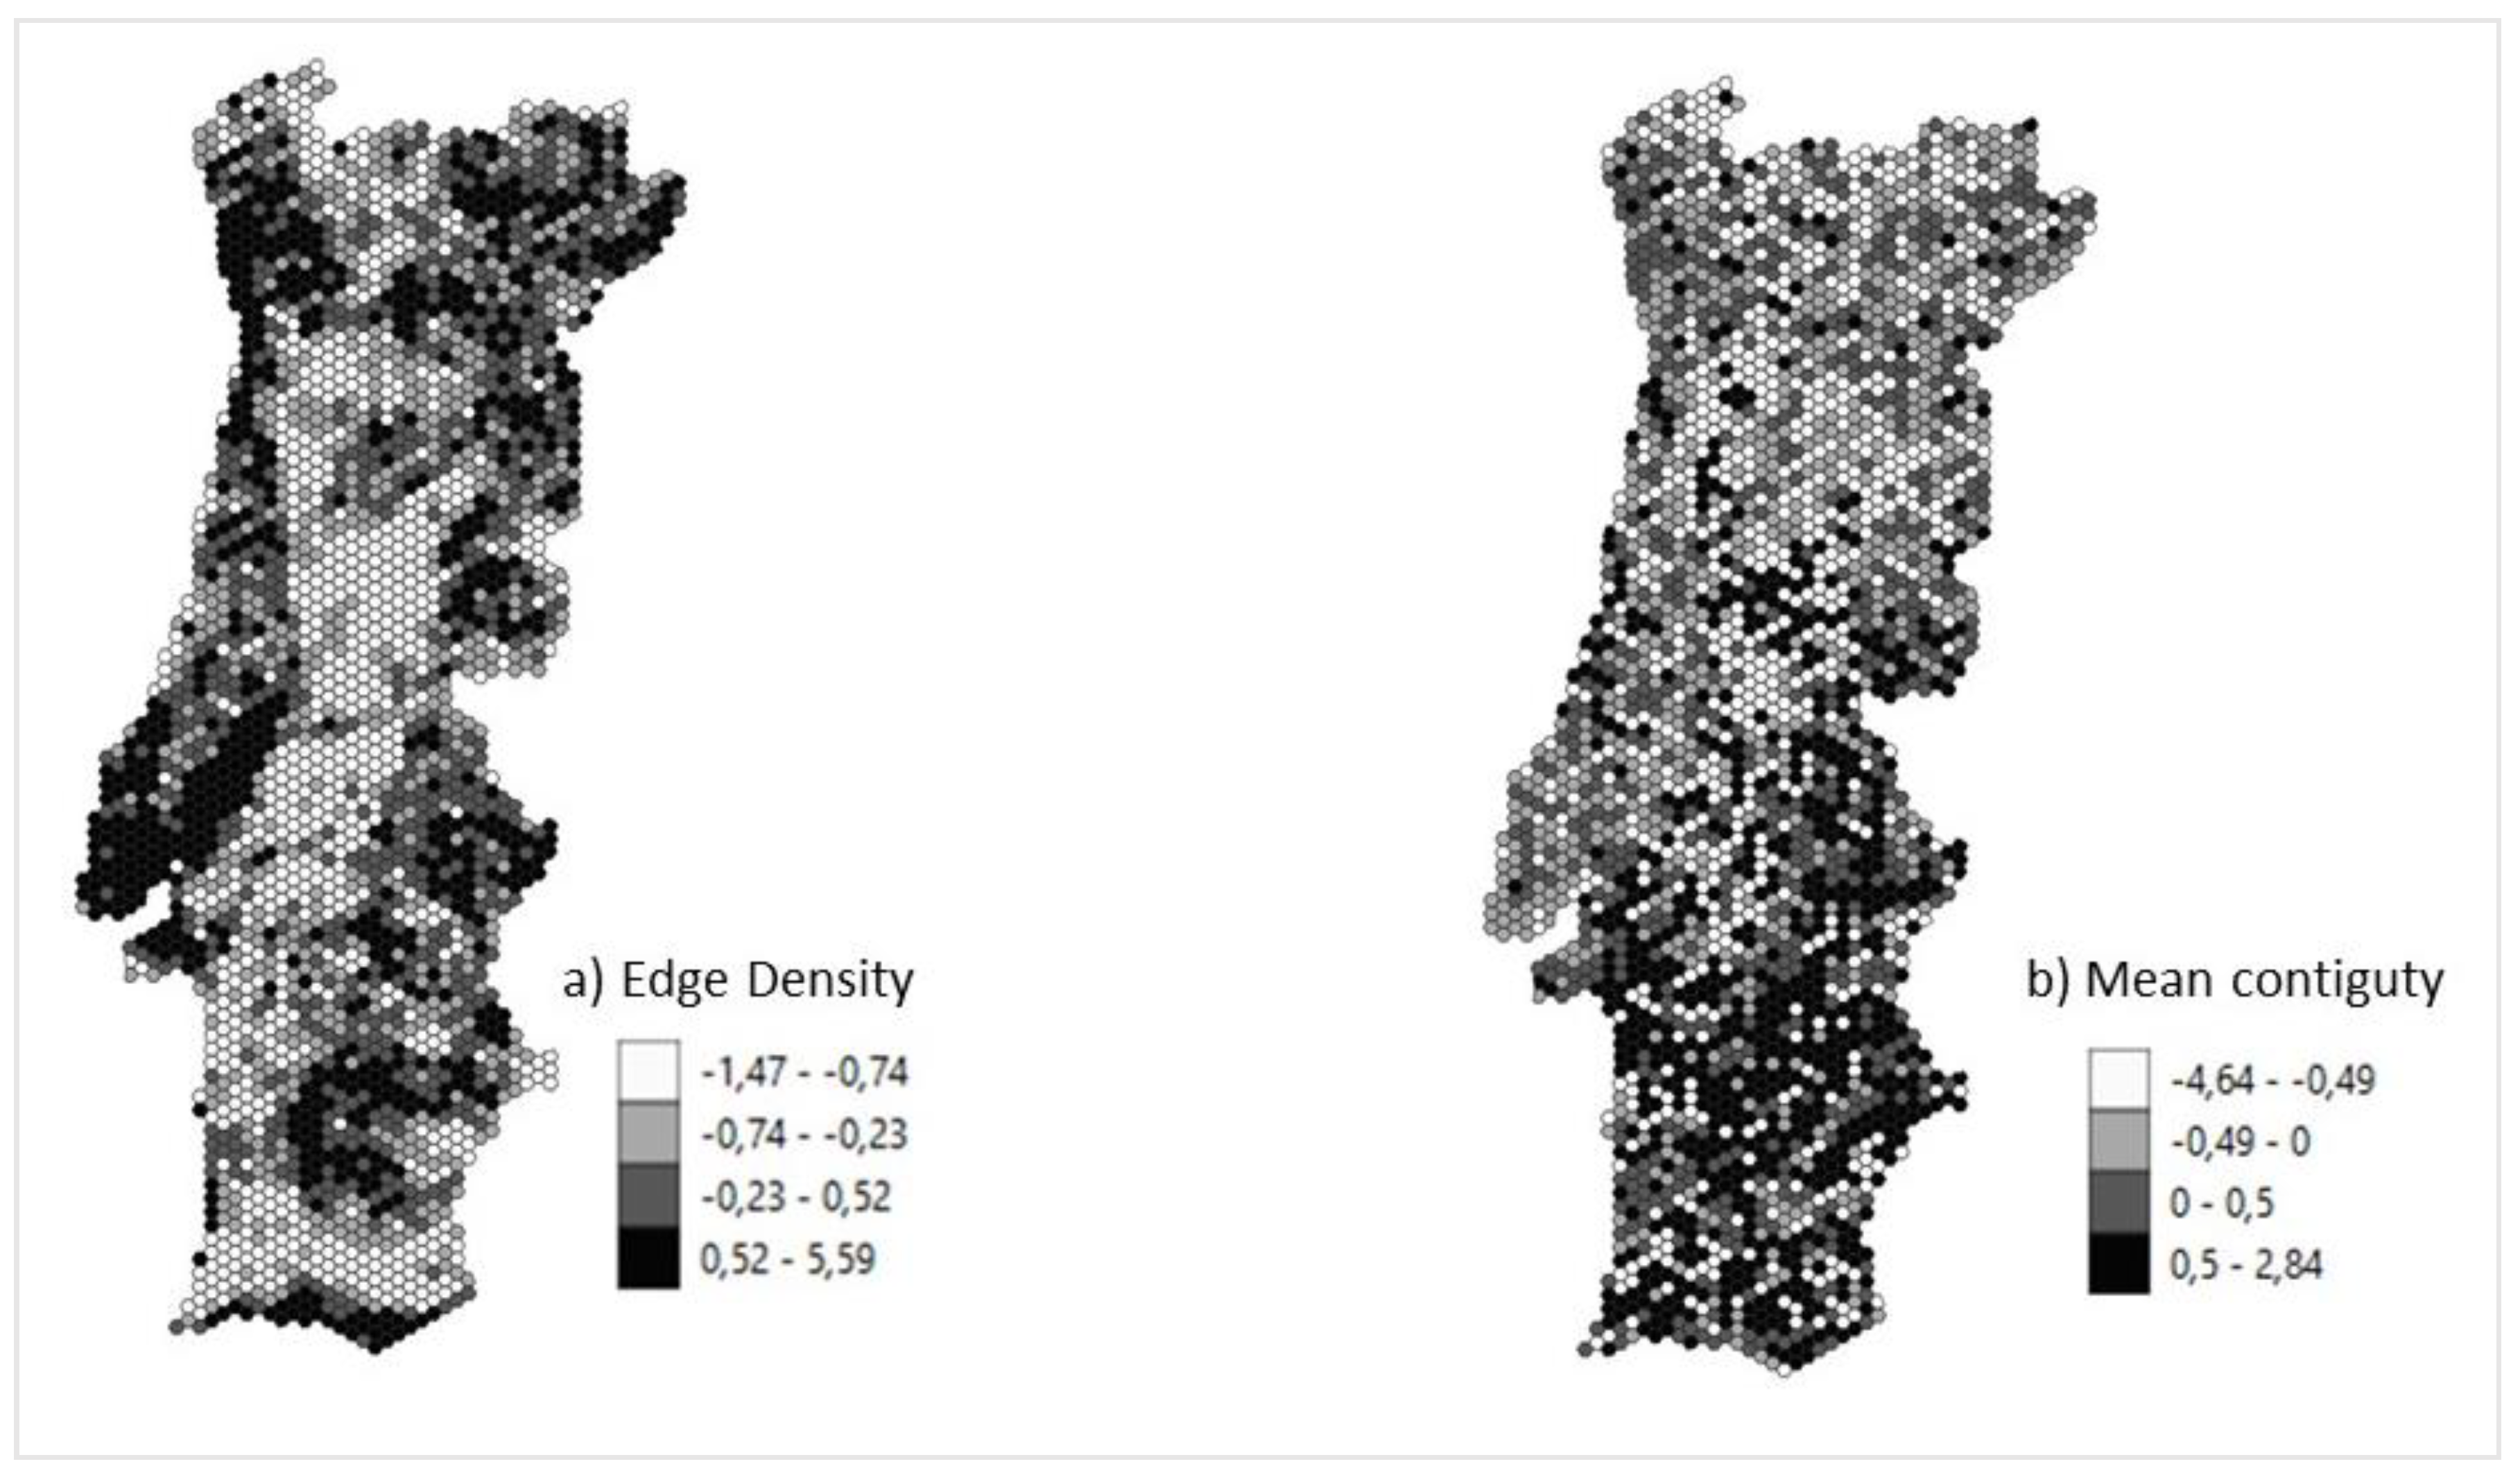
Sampling adequacy was proved, (KMO=0.754) and there is significant correlation within the variables, as Bartlett (Chi-squared=9810.9;<0.0001). Also, all communalities extracted above 0.5 confirmed adequacy of the process. The first component explained 65% of variance, while the second only 20%, hereafter represented by Regression factors 1 and 2, renamed Edge Density (ED) and Mean Contiguity, respectively. The landscape configuration results are presented after dimension reduction of the five landscape metrics used in two maps Edge Density (ED), and Mean Contiguity Index (
Figure 4).
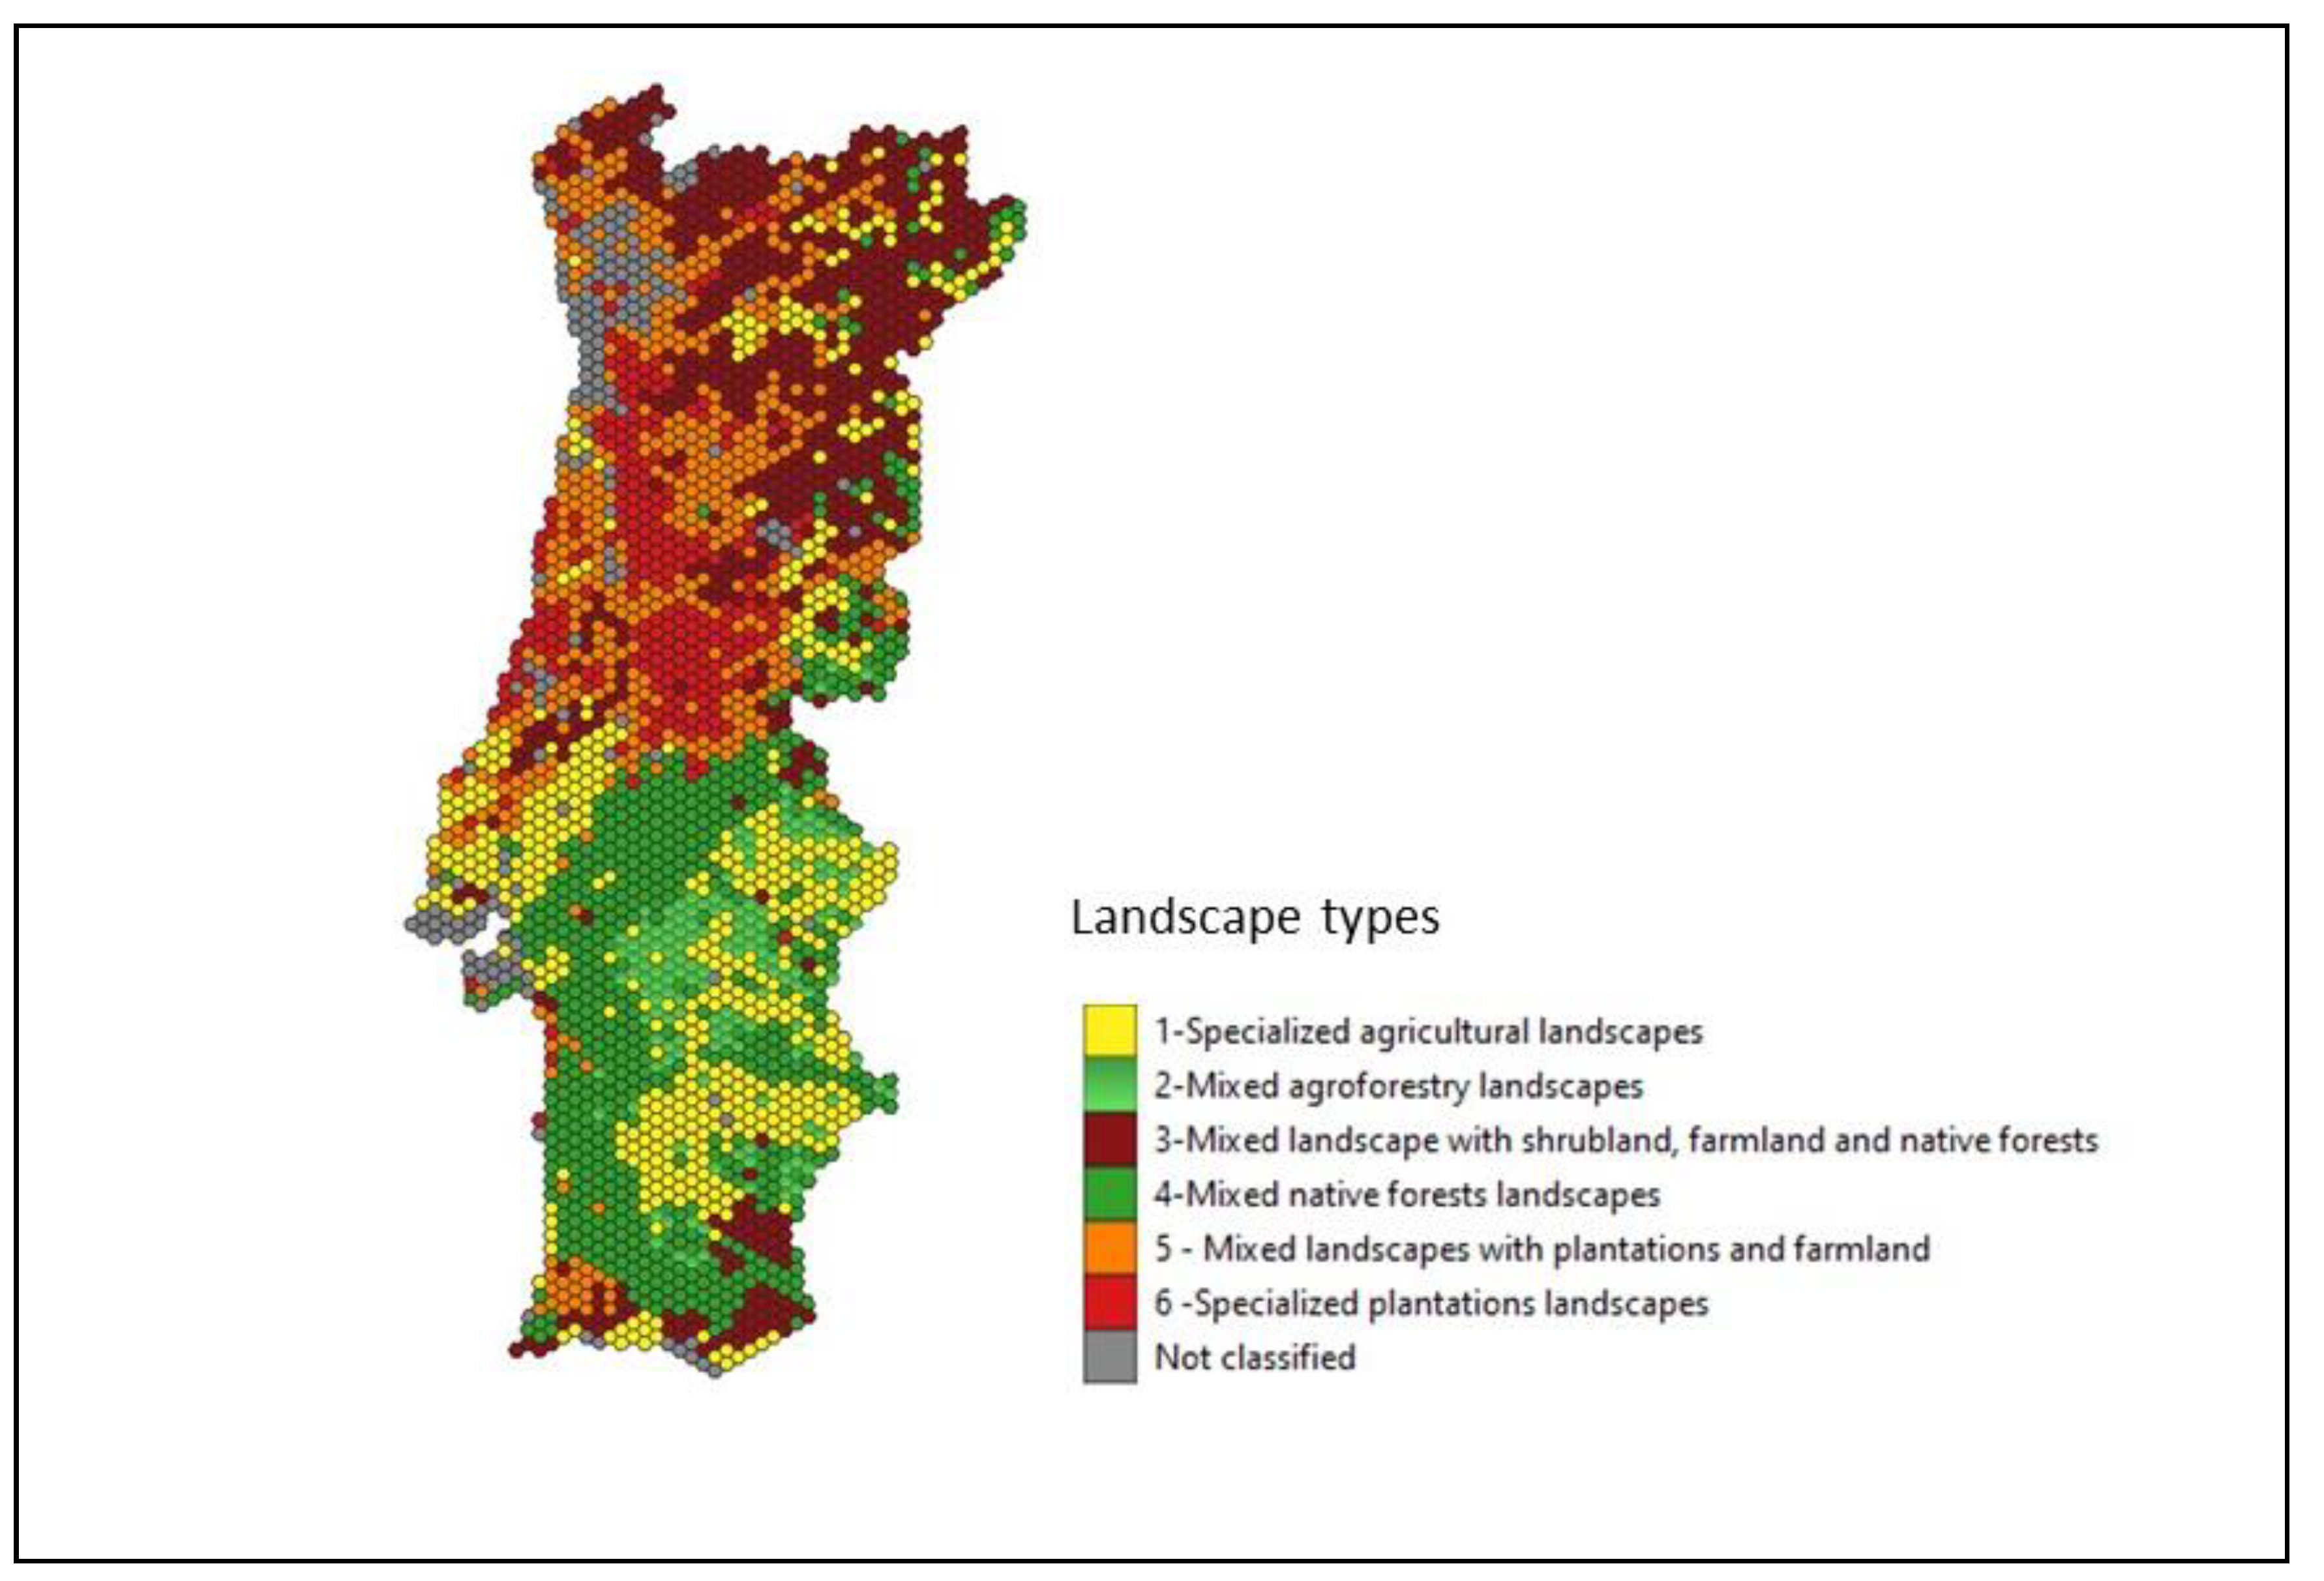
The 6-cluster solution was selected from the results of the hierarchical cluster analysis, based on the inspection of the resulting dendrogram and expert judgment, with each cluster representing a landscape type (
Table 3,
Figure 5,
Figure S1).
Cluster 1 is grouping landscapes, with farmland covering 72% of the landscape, agroforestry 10%, and native forests 9%, with very low values at both Shannon (0.78) and Shannon-Evenness (0.52) indexes and medium landscape richness (4.4), being designated specialized agricultural landscapes. Note that this assessment is not including diversity within agricultural crops, but only between farmland and other LULC’s. Specialized agricultural landscapes are mostly found in the central and southern parts of the country, namely in the Tagus floodplains, Alentejo and Algarve, including intensive irrigated areas as well as dryland low-intensity farming. This landscape type is associated to the highest average edge density, reflecting high patch perimeter to area ratios and patches number (woody patches).
In cluster 2 agroforestry represents 55% of land, farmland, 32% and native forests, 11%. These landscapes occur in the southern half of the country and have low richness and diversity (LR=4.2; SDI =0.92; SHEI=0.65), and intermediate ED, although it must be highlighted that agroforestry often includes two different vegetation strata, and thus is vertically diversified if not horizontally diversified. It is, therefore, designated mixed agroforestry landscapes.
Cluster 3 corresponds to a mixed landscape, combining shrubland (36%), farmland (29%), native forests (18%) and forest plantations (16%). It is a cluster with very high diversity (LR=4.3; SDI=1.18; SHEI=0.82;), and medium ED, because it is contrasting only farmland composition with all other LULC, having all the later the same values for this purpose. This landscape type is distributed mainly in the N-NE of the country, but it also occurs next to the central board with Spain and South.
In cluster 4, native forests cover 42% of land, agroforestry 16%, and farmland 25%. This landscape typology has the highest richness and high diversity (LR=4.9; SHA=1.16; SHEI= 0.73), and an intermediate negative ED, revealing a small exposure to farmland border. It was therefore named mixed native forests landscapes, and they are found mainly in the southern half of the country, and also at Central and NE boarder at a minor scale. This landscape cluster corresponds mostly to evergreen oak woodlands (Q. suber and Q. rotundifolia) and umbrella pine (Pinus pinea), but also to the rest of woodlands such as deciduous oaks (Q. robur, Q. pyrenaica, Q. faginea, Q. canariensis), chestnut, other pines, and riparian species.
In cluster 5, forest plantations represent 49% of all land, although farmlands represent 29% and native forests and shrubs about 11% each, and has low diversity, richness and edge density, which are probably related to the size of the patches, and therefore was designated mixed landscapes with plantations and farmland. This landscape type is found at Northern and Central part of the country and SW mountains.
Cluster 6 is the most specialized landscape type, with 78% of land covered with forest plantations, while 12.5% are farmlands, and all the other LULC residual. This landscape type holds the lowest scores on diversity, richness, and edge density (SHA=0.67; SHEI=0.48; LR=4.03; ED=-0.83), and therefore was named specialized plantations. Specialized plantations landscapes are found in the Atlantic climate part of the country, which includes mainly NW but also central regions.
3.2. Fire Regime
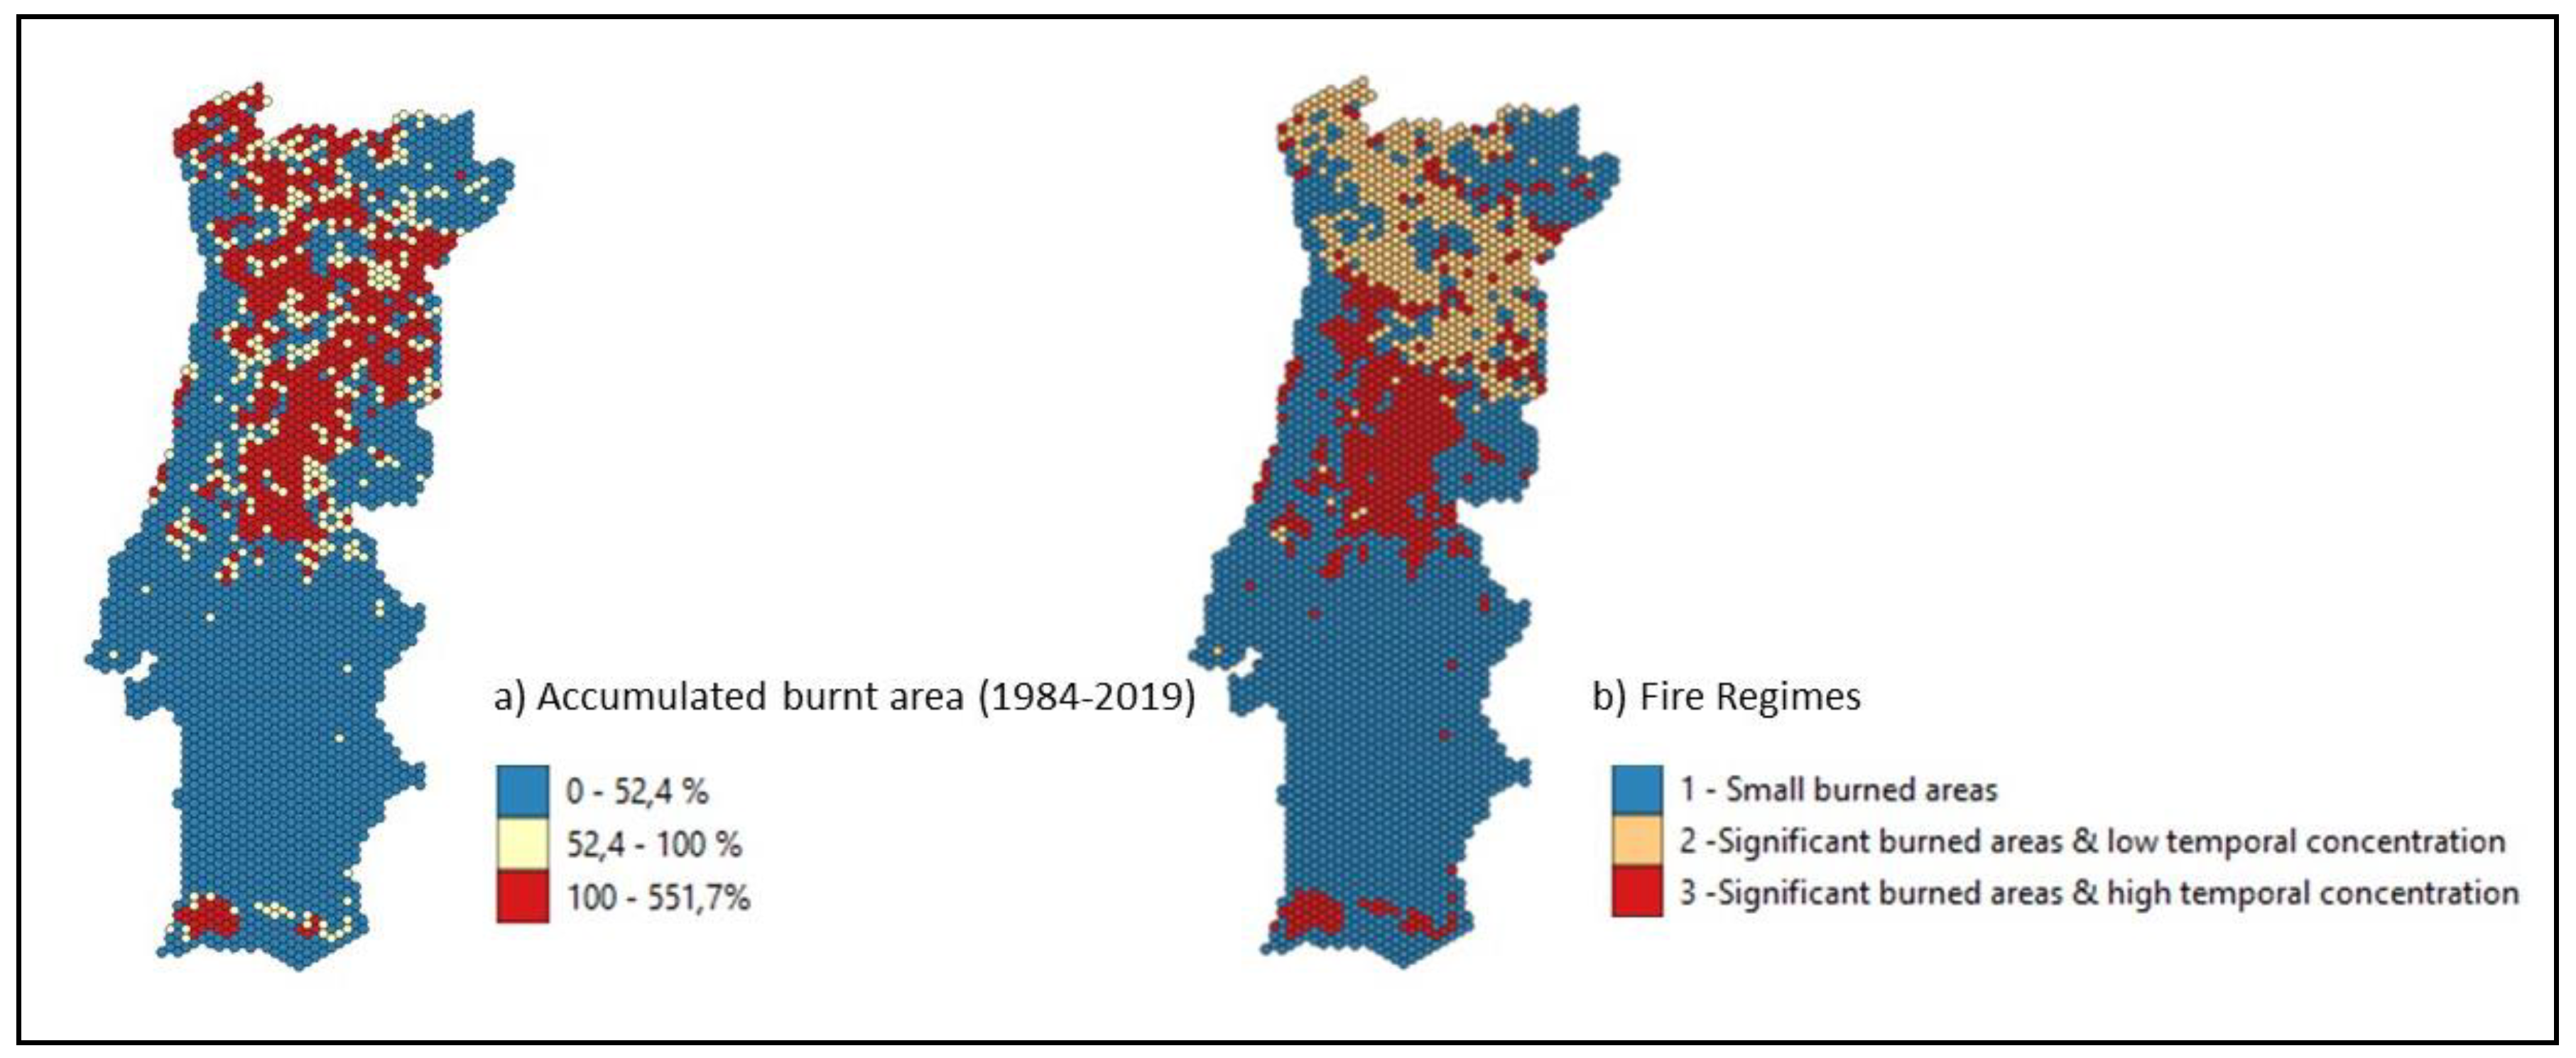
Burnt areas from years 1984 to 2019 shows a divided country where Northern half landscapes are burning much more than the Southern. SW mountains are the only exception in the Southern half (
Figure 6a).
FR1, here designated small burned areas, is occurring at most of the southern half of the country, but also in coastal areas in the Centre and North and the extreme NE. FR2, meaning frequent but not concentrated fire events, related with less hazard effects mostly occurs in the northern parts of the country. FR3 is present at central and SW mountains and is related to significant burned areas that are highly concentrated in time, which are associated with the most hazardous effects on environment and societies (
Figure 6b).
3.3. Associations of fire regimes with landscape types
According to our cross tabulations results, we reject the null hypothesis that landscape types and FRs are independent events with a low probability of error [X
2(10) =1332.769; p<0.001]. In addition, a strong association was found between landscape types and FRs (Cramér’s V=0.52). The adjusted standardized residuals show that, for all cells, the magnitude of the deviation between the observed value and the value that would be expected based on the independent events hypothesis is such that we can reject also that hypothesis for each cell; the signal of the residual tells us whether the observed is above (+) or below (-) the expected value (
Table 4). Our results show that specialized agricultural landscapes and mixed agroforestry landscapes are mostly associated with FR1, which represents 97% and 100% of the hexagons in these two landscape types, respectively. The positive signs of the adjusted standardized residuals show that FR1 is more frequent in these landscape types than would be expected if FR and landscape types were independent events. Mixed landscapes with shrubland, farmland and native forest are mostly associated to FR2, with 46% of hexagons in this landscape type having this FR, and a positive sign of the residual; FR1 only represents 31% of the cases and occurs less than expected (negative residual). The most hazardous FR3 represents 22.2% of the cases in this type but occurs there more often than could be expected based on random alone (positive residual).
Mixed native forests landscapes are mostly associated with FR1, which occurs in 90% of the cases and exhibits a positive residual; the other two FRs occur less often in this landscape type than would be expected by chance and represent a small frequency of cases. In mixed landscapes with plantations and farmland, FR1 represents 46% of the cases, but is less frequent here than expected (negative residual); the other two FRs are here more frequent than expected if we assume FR and landscape types are independent of each other (positive residuals) and represent 30% (FR3) and 24% (FR2) of the cases. Specialized plantations landscapes are mostly associated with FR3 (64% of the cases), which is here more frequent than expected by chance. The other two FRs have lower frequency in this landscape type and represent less than what could be expected if FR and landscape types are independent of each other. Comparing the two last landscape types suggest that increasing the weight of forest plantations in the landscape clearly increases the probability of occurrence of FR3.
3.4. Carbon stock
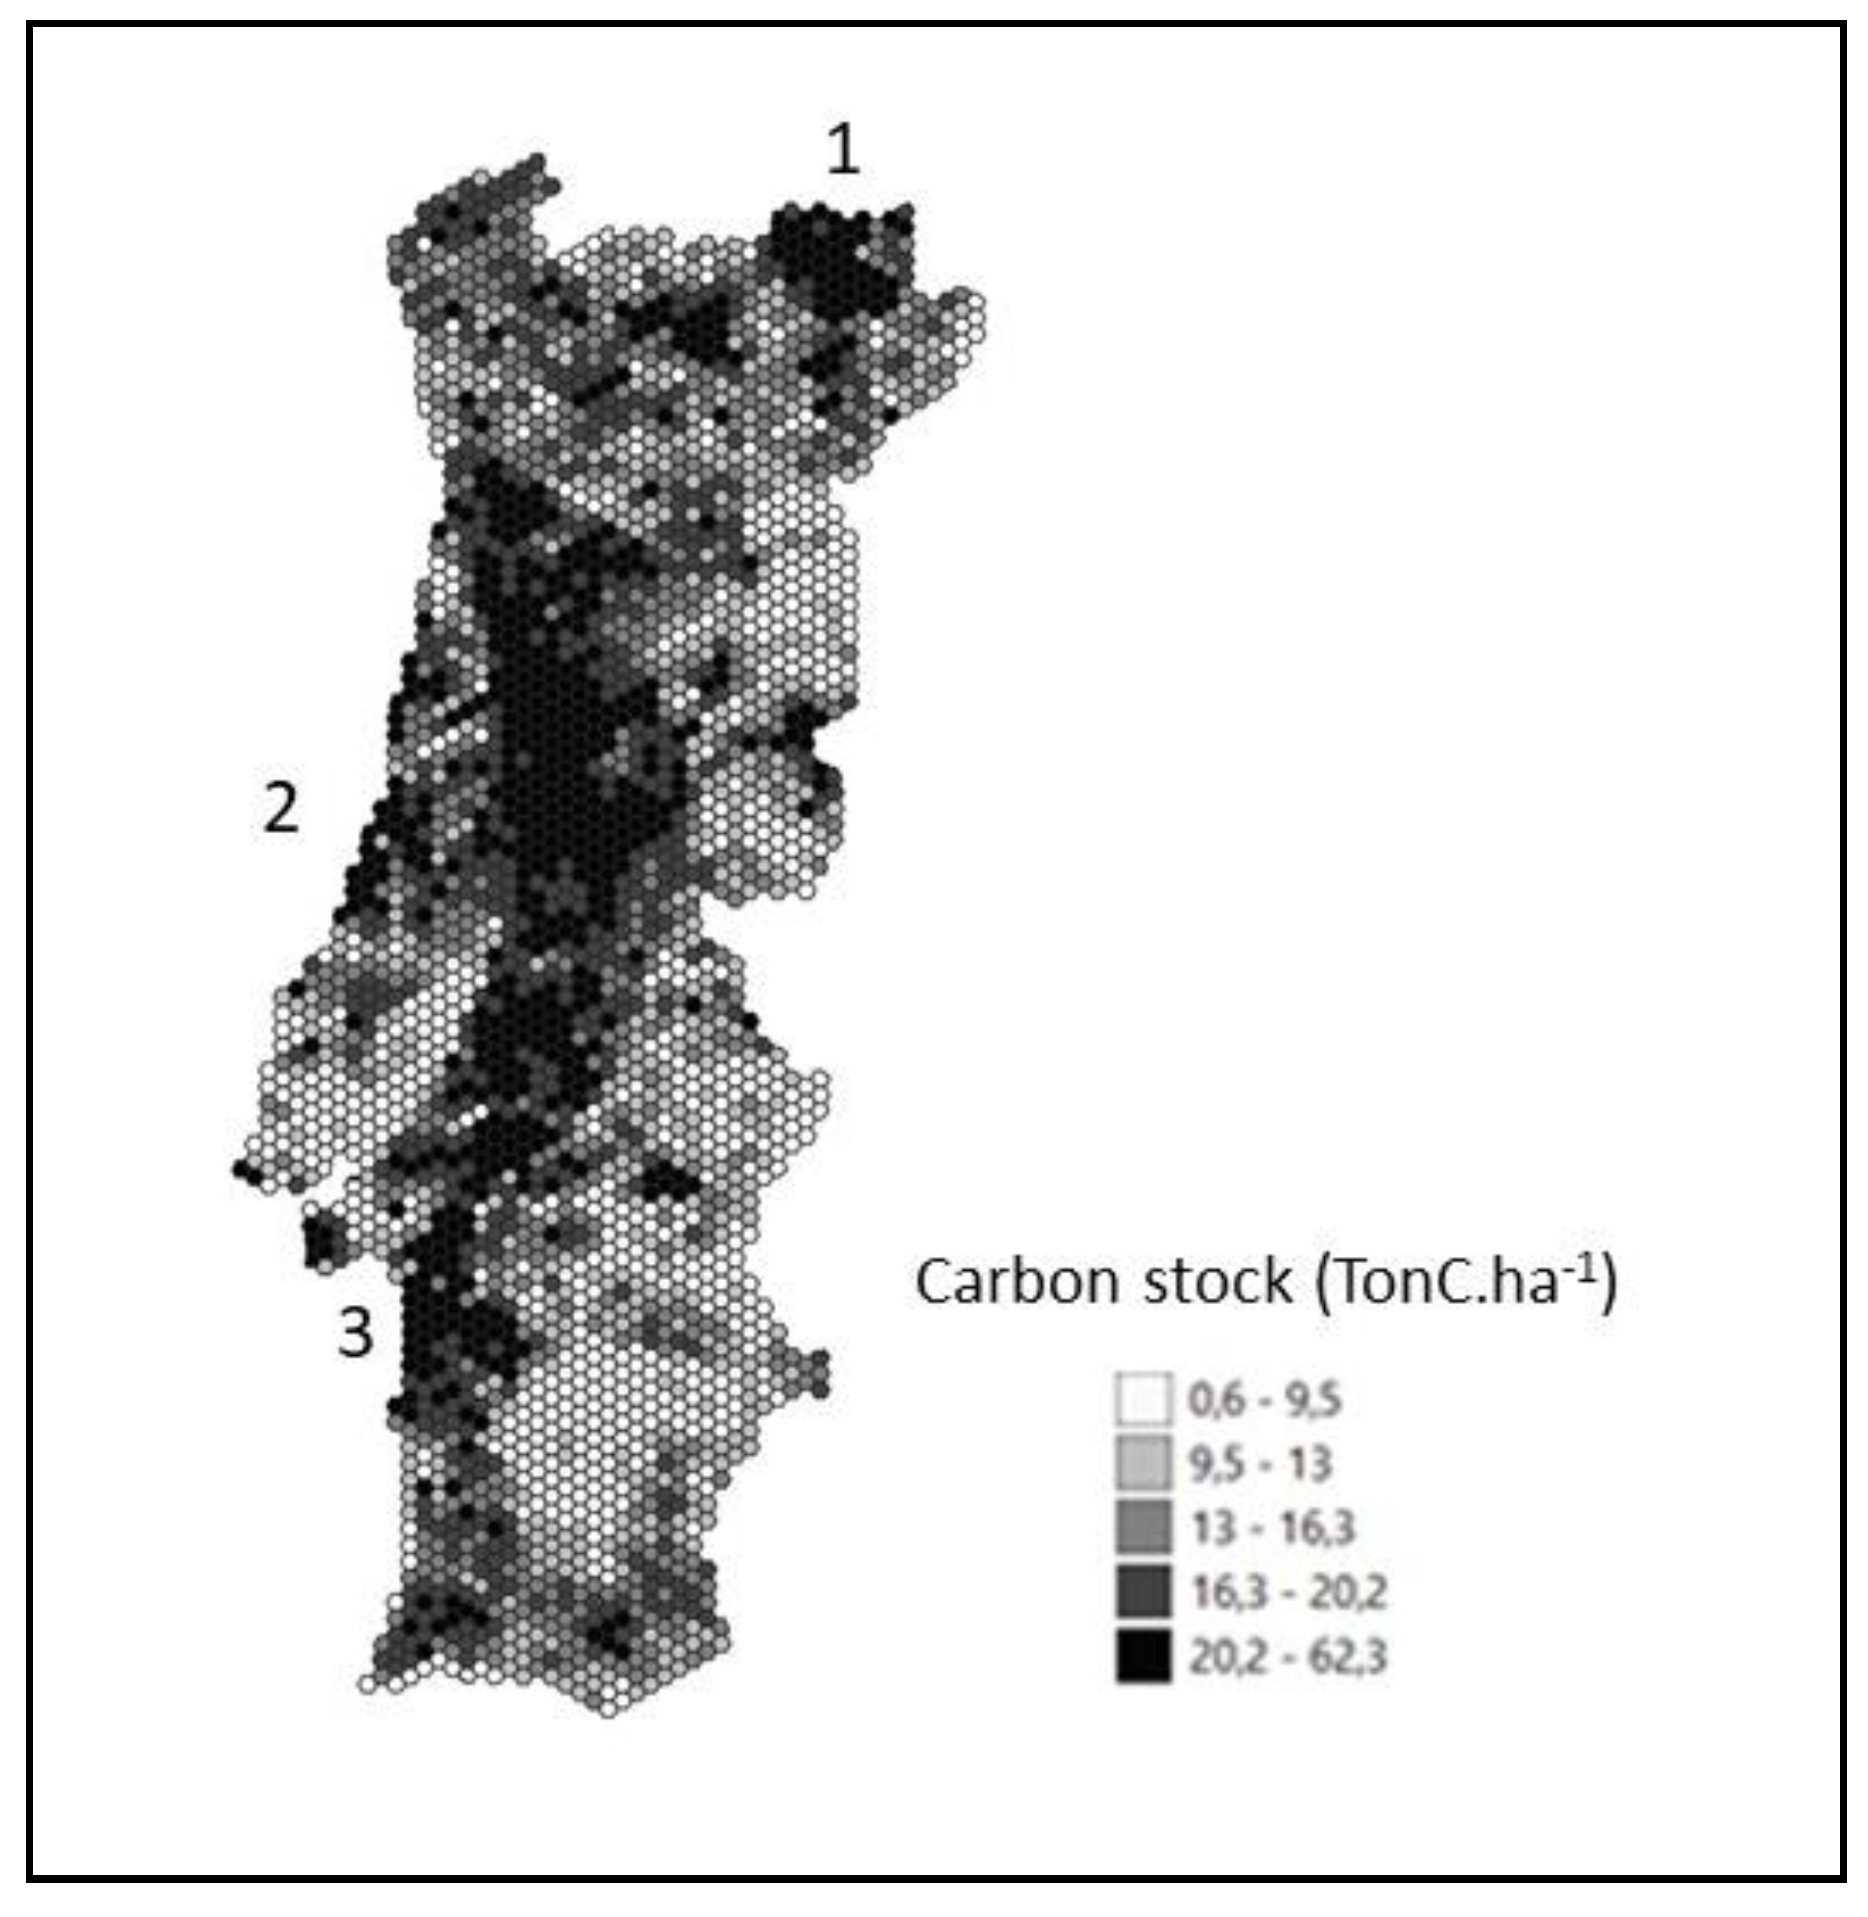
Computed values of landscape-level CS vary between 0.6 TonC.ha
−1 and 62.3 Ton C.ha
−1. (
Figure 7).
Carbon is peaking in the NE region of the country, corresponding to mixed landscape with chestnut, oak and maritime pine stands (1), followed by coastal centre region up to 31.7 Ton C.ha
−1 dominated by maritime pine (2), and coastal triangle (3), mainly composed with mixed pine stands (
P. pinea and
P. pinaster) and including eucalypt, up to 29 Ton C.ha
−1. Comparing CS averages across landscape types reveals that all landscape types have statistically different average CSs (p-value < 0.001). Almost half of the variance of CSs across hexagons (ETA
2=0.45) is explained by the landscape type (
Table 2). The lowest CS average is found in specialized agricultural landscapes (8.3 Ton C ha
−1) and the maximum is in specialized plantations (22.8 Ton C ha
−1), being medium in mixed agroforestry landscapes (13.4 Ton C ha
−1), mixed landscape with shrubland, farmland and native forest (14.6 Ton C ha
−1), mixed native forests landscapes (16.2 Ton C ha
−1) and mixed landscapes with plantations and farmland (17.8 Ton C ha
−1).
3.5. Associations between forest plantations, hazardous fire regimes and carbon stock
Our binary logistic regression results show that there is a positive and significant relation between the most hazardous FR3 and the proportion of forest plantations in the landscape (
Table 5). The estimated model enables a correct prediction of the occurrence or not of this fire regime based on the proportion of forest plantations alone in 85% of the cases. The Nagelkerke’s-R
2 indicates that 27% of the variance is explained by the independent variable.
Based on the estimated parameters of the logistic model, the probability of fire regime FR3 occurring in a hexagon (dependent on the proportion of forest plantations, PLA%) is given by:
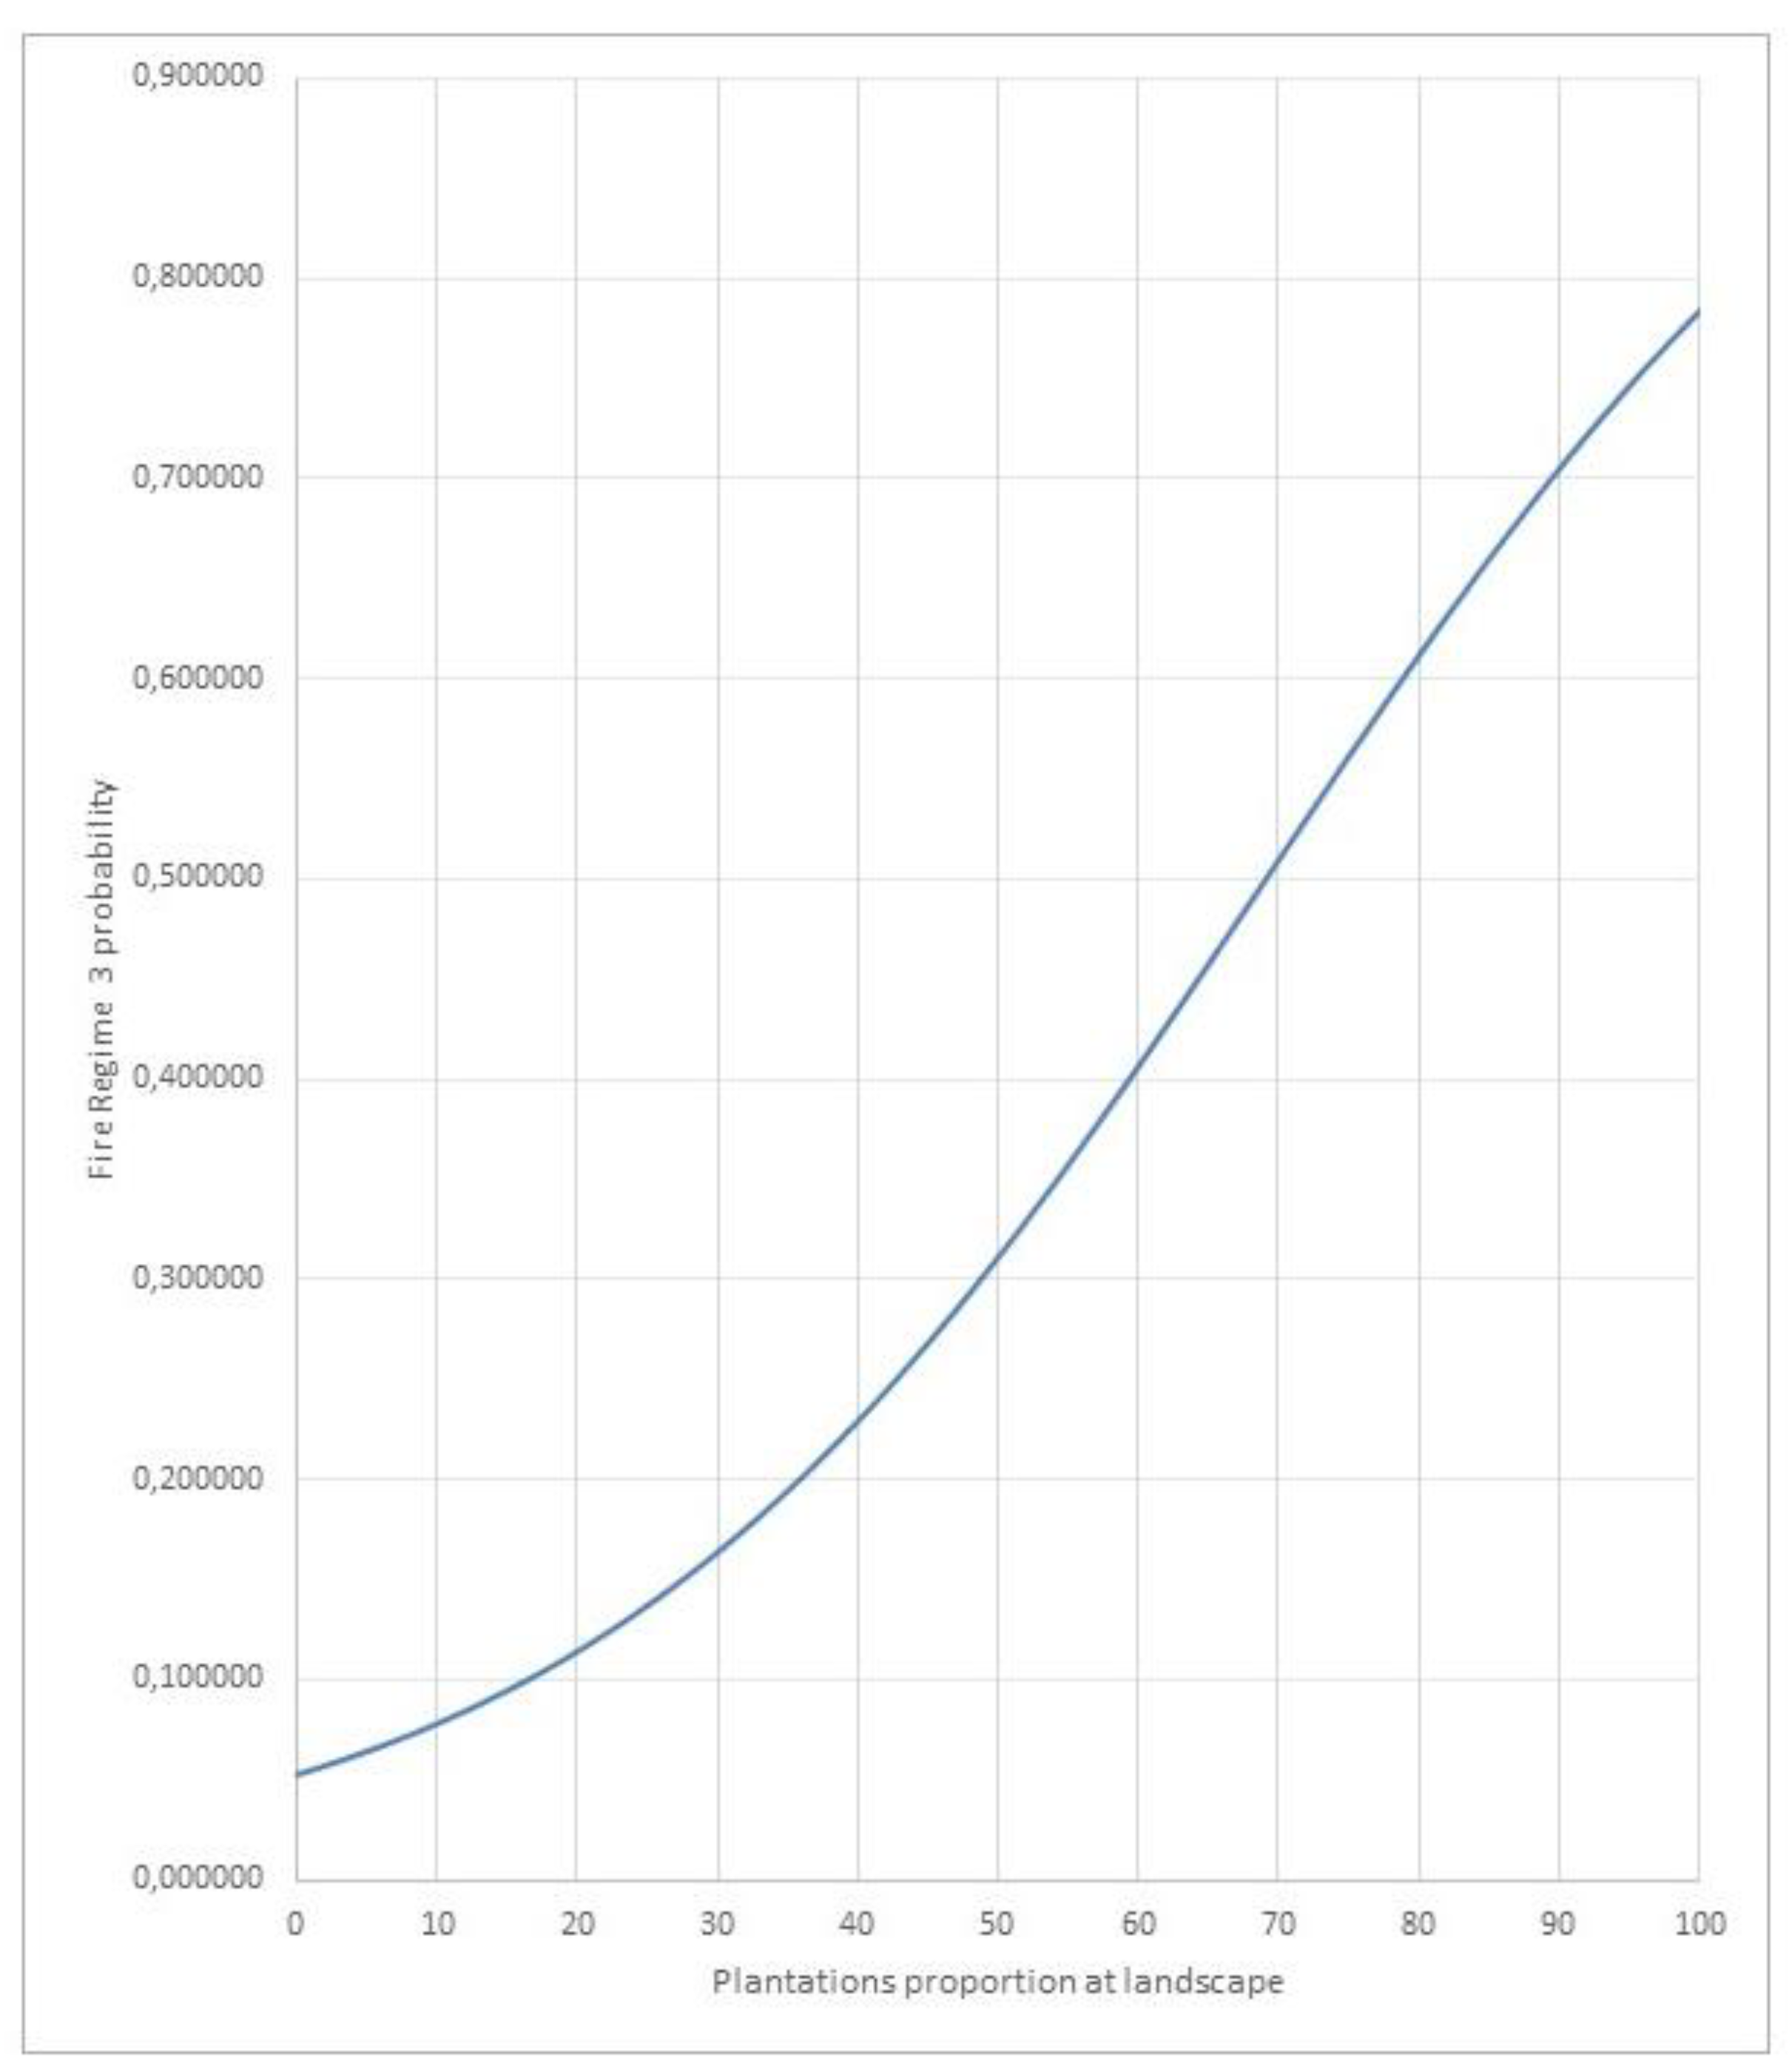
A graphical representation of the fitted values for plantations proportion up to 100%, shows a positive association with FR3 rising in line with the specialization of the landscape in forest plantations (
Figure 8).
Results of linear regression show that the CS of the landscape increases linearly with the proportion of forest plantations in land cover, as indicate by the estimated function:
[F(1.2764)=1567.596; p<0.001;R2=0.362]
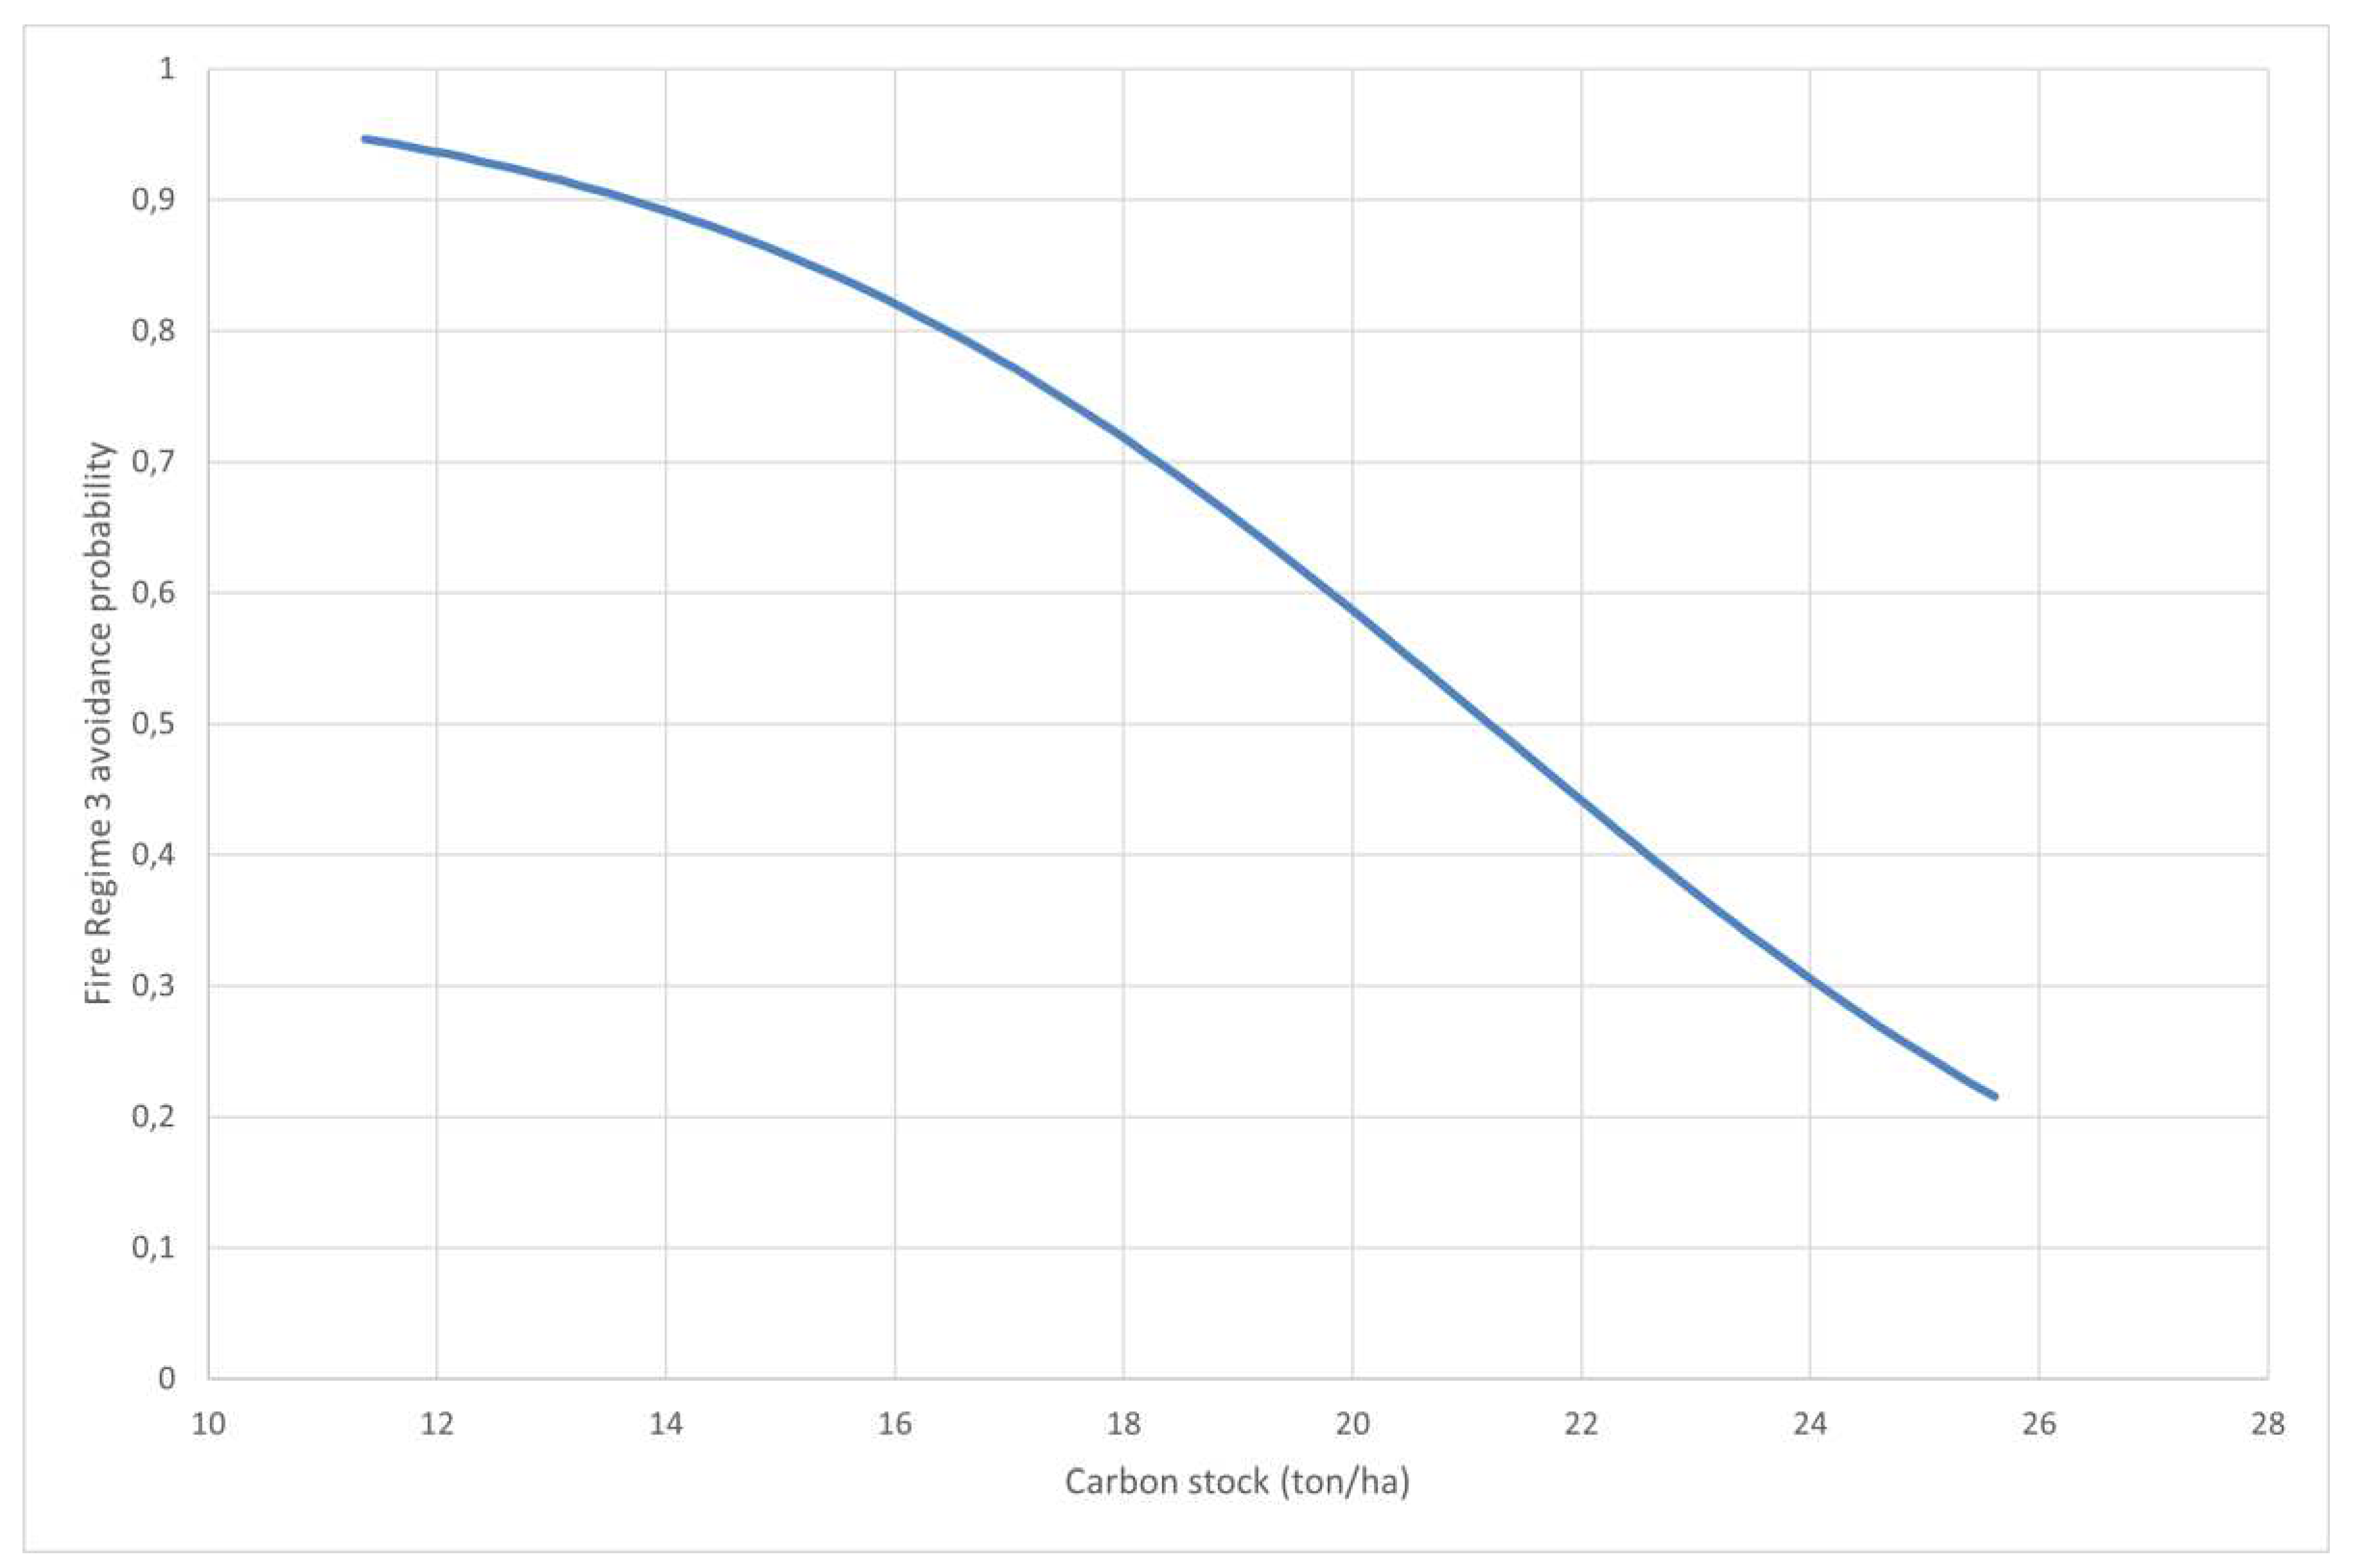
Using functions (2) and (3), we simulated the joint change in the probability of avoiding (not having) FR3 and the expected value (average) CS as we increase the proportion of forest plantations in a landscape. This simulation results in a trade-off curve (
Figure 9), where we see that increasing the CS by raising the proportion of forest plantations in land cover is get at an increasing cost - the reduction in the probability of having a fire regime more benign than FR3.
The results of the multiple logistic binary regression revealed a significant relation between FR3 and LULC (chi squared =778.083; p< 0.001) with a percentage of correct predictions of FR3 occurring (or not) of 87%, and a Nagelkerke’s-R2 of about 40% (
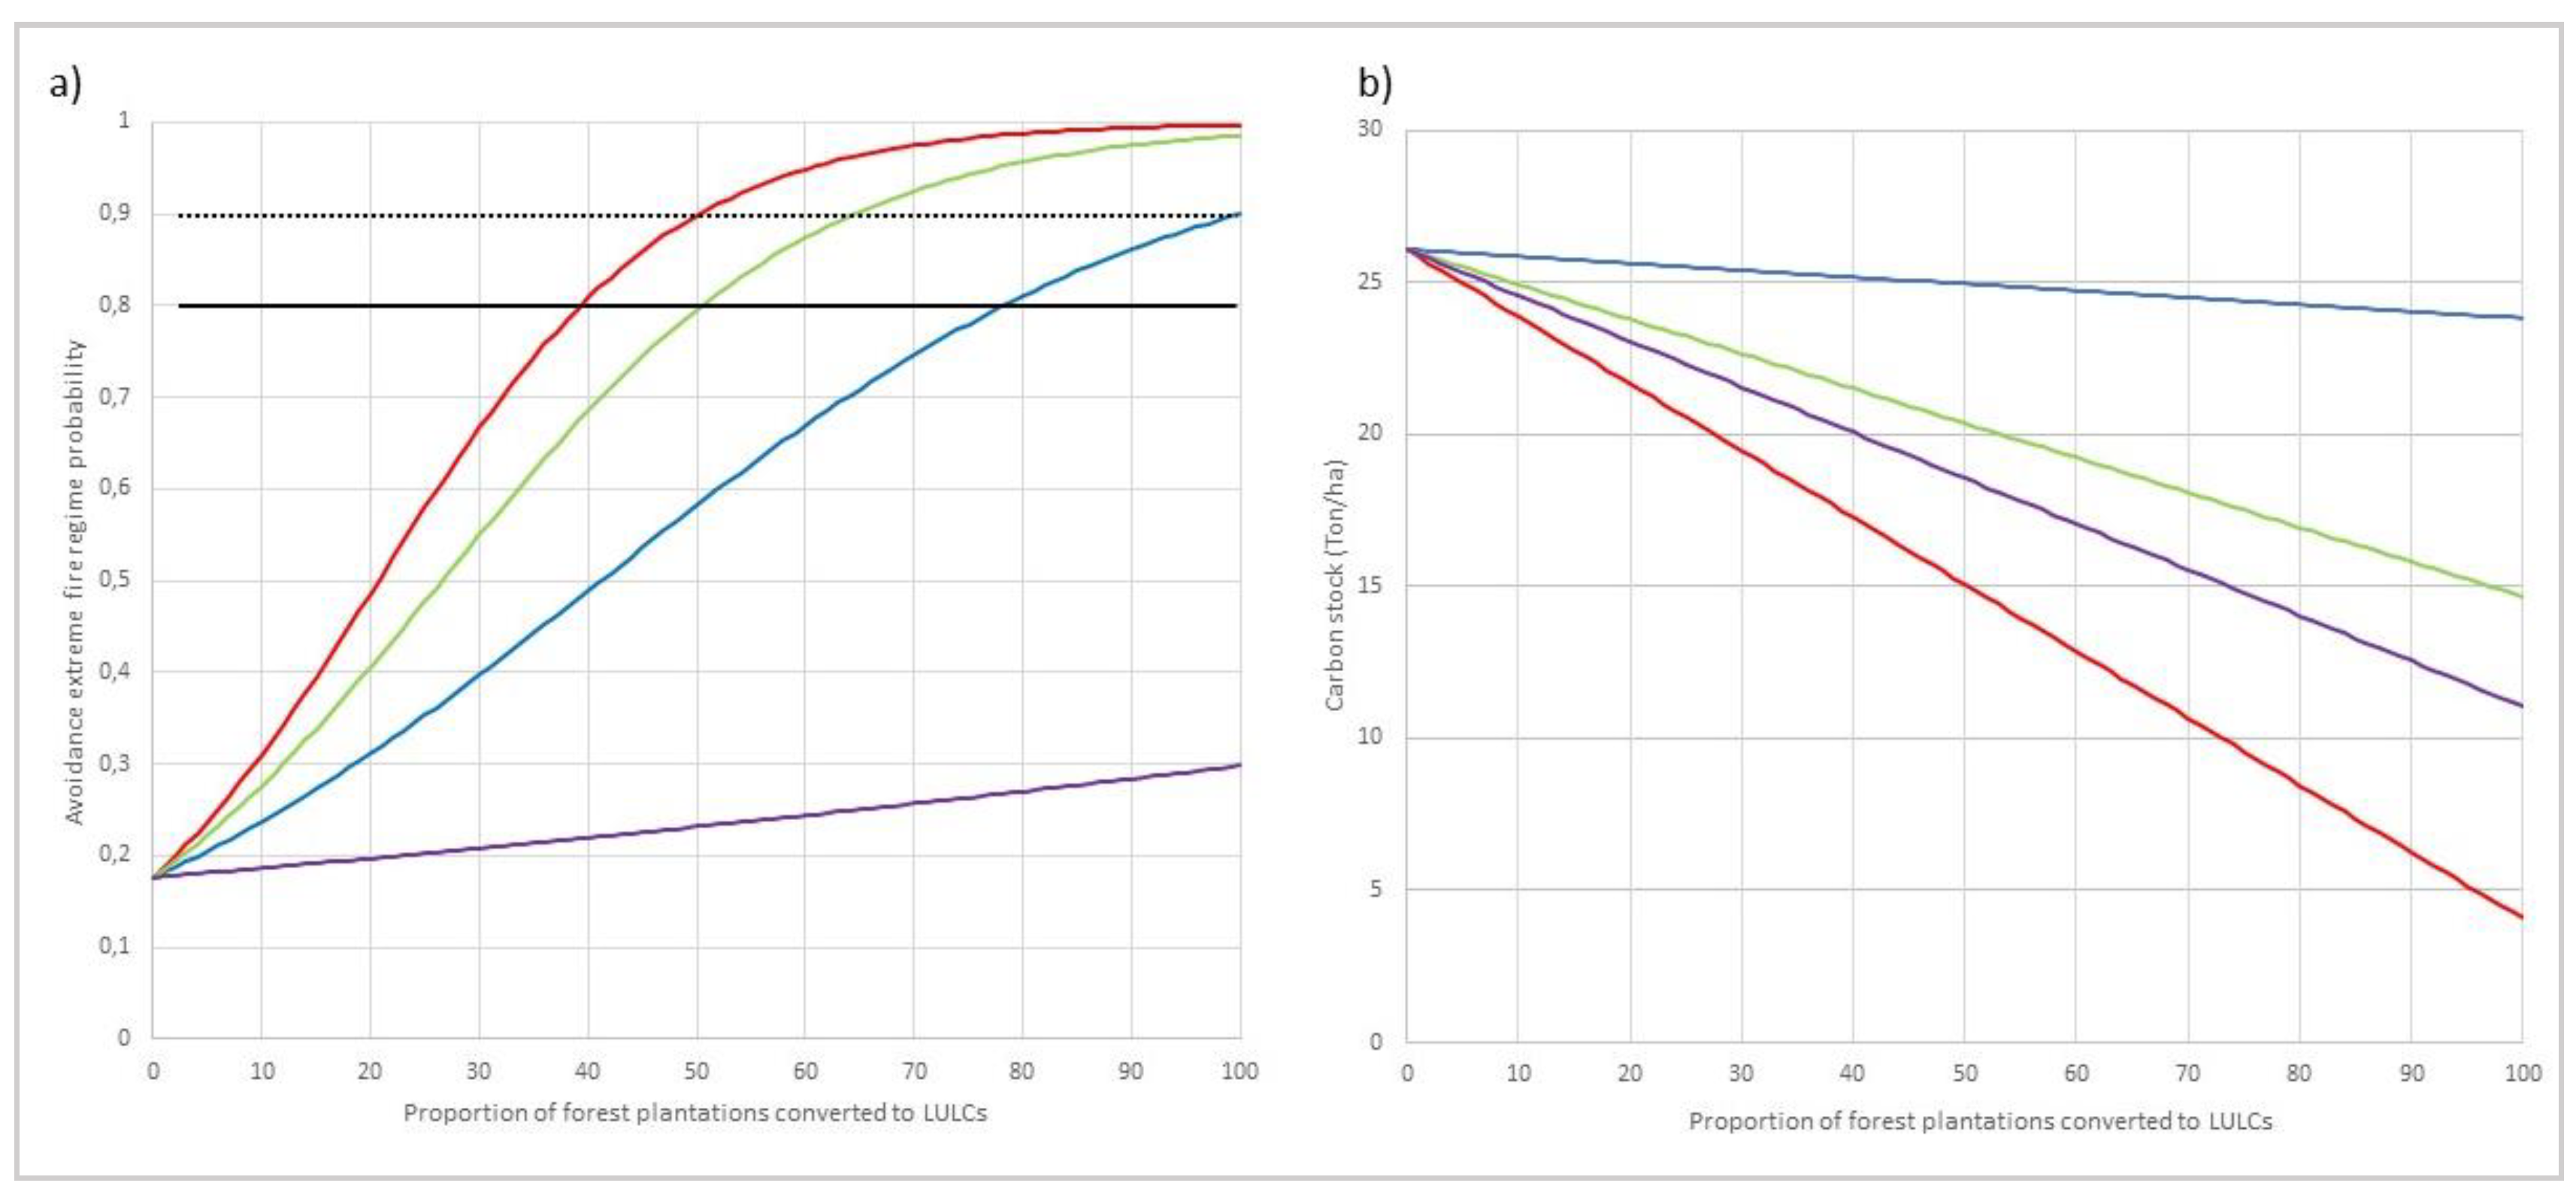
Table S1). Graphical representation of the fitted values confirms that increasing plantation conversion to the other LULCs improves the probabilities of landscapes avoiding FR3 (
Figure 10a). However, according to these results, the improvement of forest plantations FR can be reached differently, according to the LULC classes they are converted on, and it also depends on the plantations proportion present on landscapes. In fact, it is important to achieve the best effect on fire regime at a minor cost on land converted, considering the actual market value of land activities.
Thus, converting forest plantations to farmlands requires the minimum conversion area to achieve a significant effect of 80% on probabilities of avoiding FR3, until plantations are present in 60% of the landscapes, as can be seen from the slope of the curve. After that point, line slopes show that agroforestry became the best conversion option until 50% of landscape is covered by forest plantations, where the 90% threshold line is reached, meaning that the probabilities of association landscape with FR3 is 10%. When forest plantations occupy half of the landscapes, as much as farmlands plus agroforestry proportion, the improvement in fire regime is better achieved by converting the former to native forests. Following our results, converting forest plantations to shrublands is not a good option to improve fire regime, compared with all other LULC’s. A reference line is included as the 10% probability of association of the native forest with the FR3, represented in the graphs by 90%, and another that represents twice this probability (80%).
A significant relation between CS and converted LULC proportion classes was also found by multiple linear regression [F (4,2761) =1251,644; p<0,001; R
2=0,645] (
Table S2). The graphical representation shows that increasing forest plantations conversion always implies a reduction in CS, but the rate of such decrease depends on the LULCs they are converted on. In fact, this decrease is only slight converting plantations to native forests, but very relevant converting to farmland. See details at
Figure 10b).
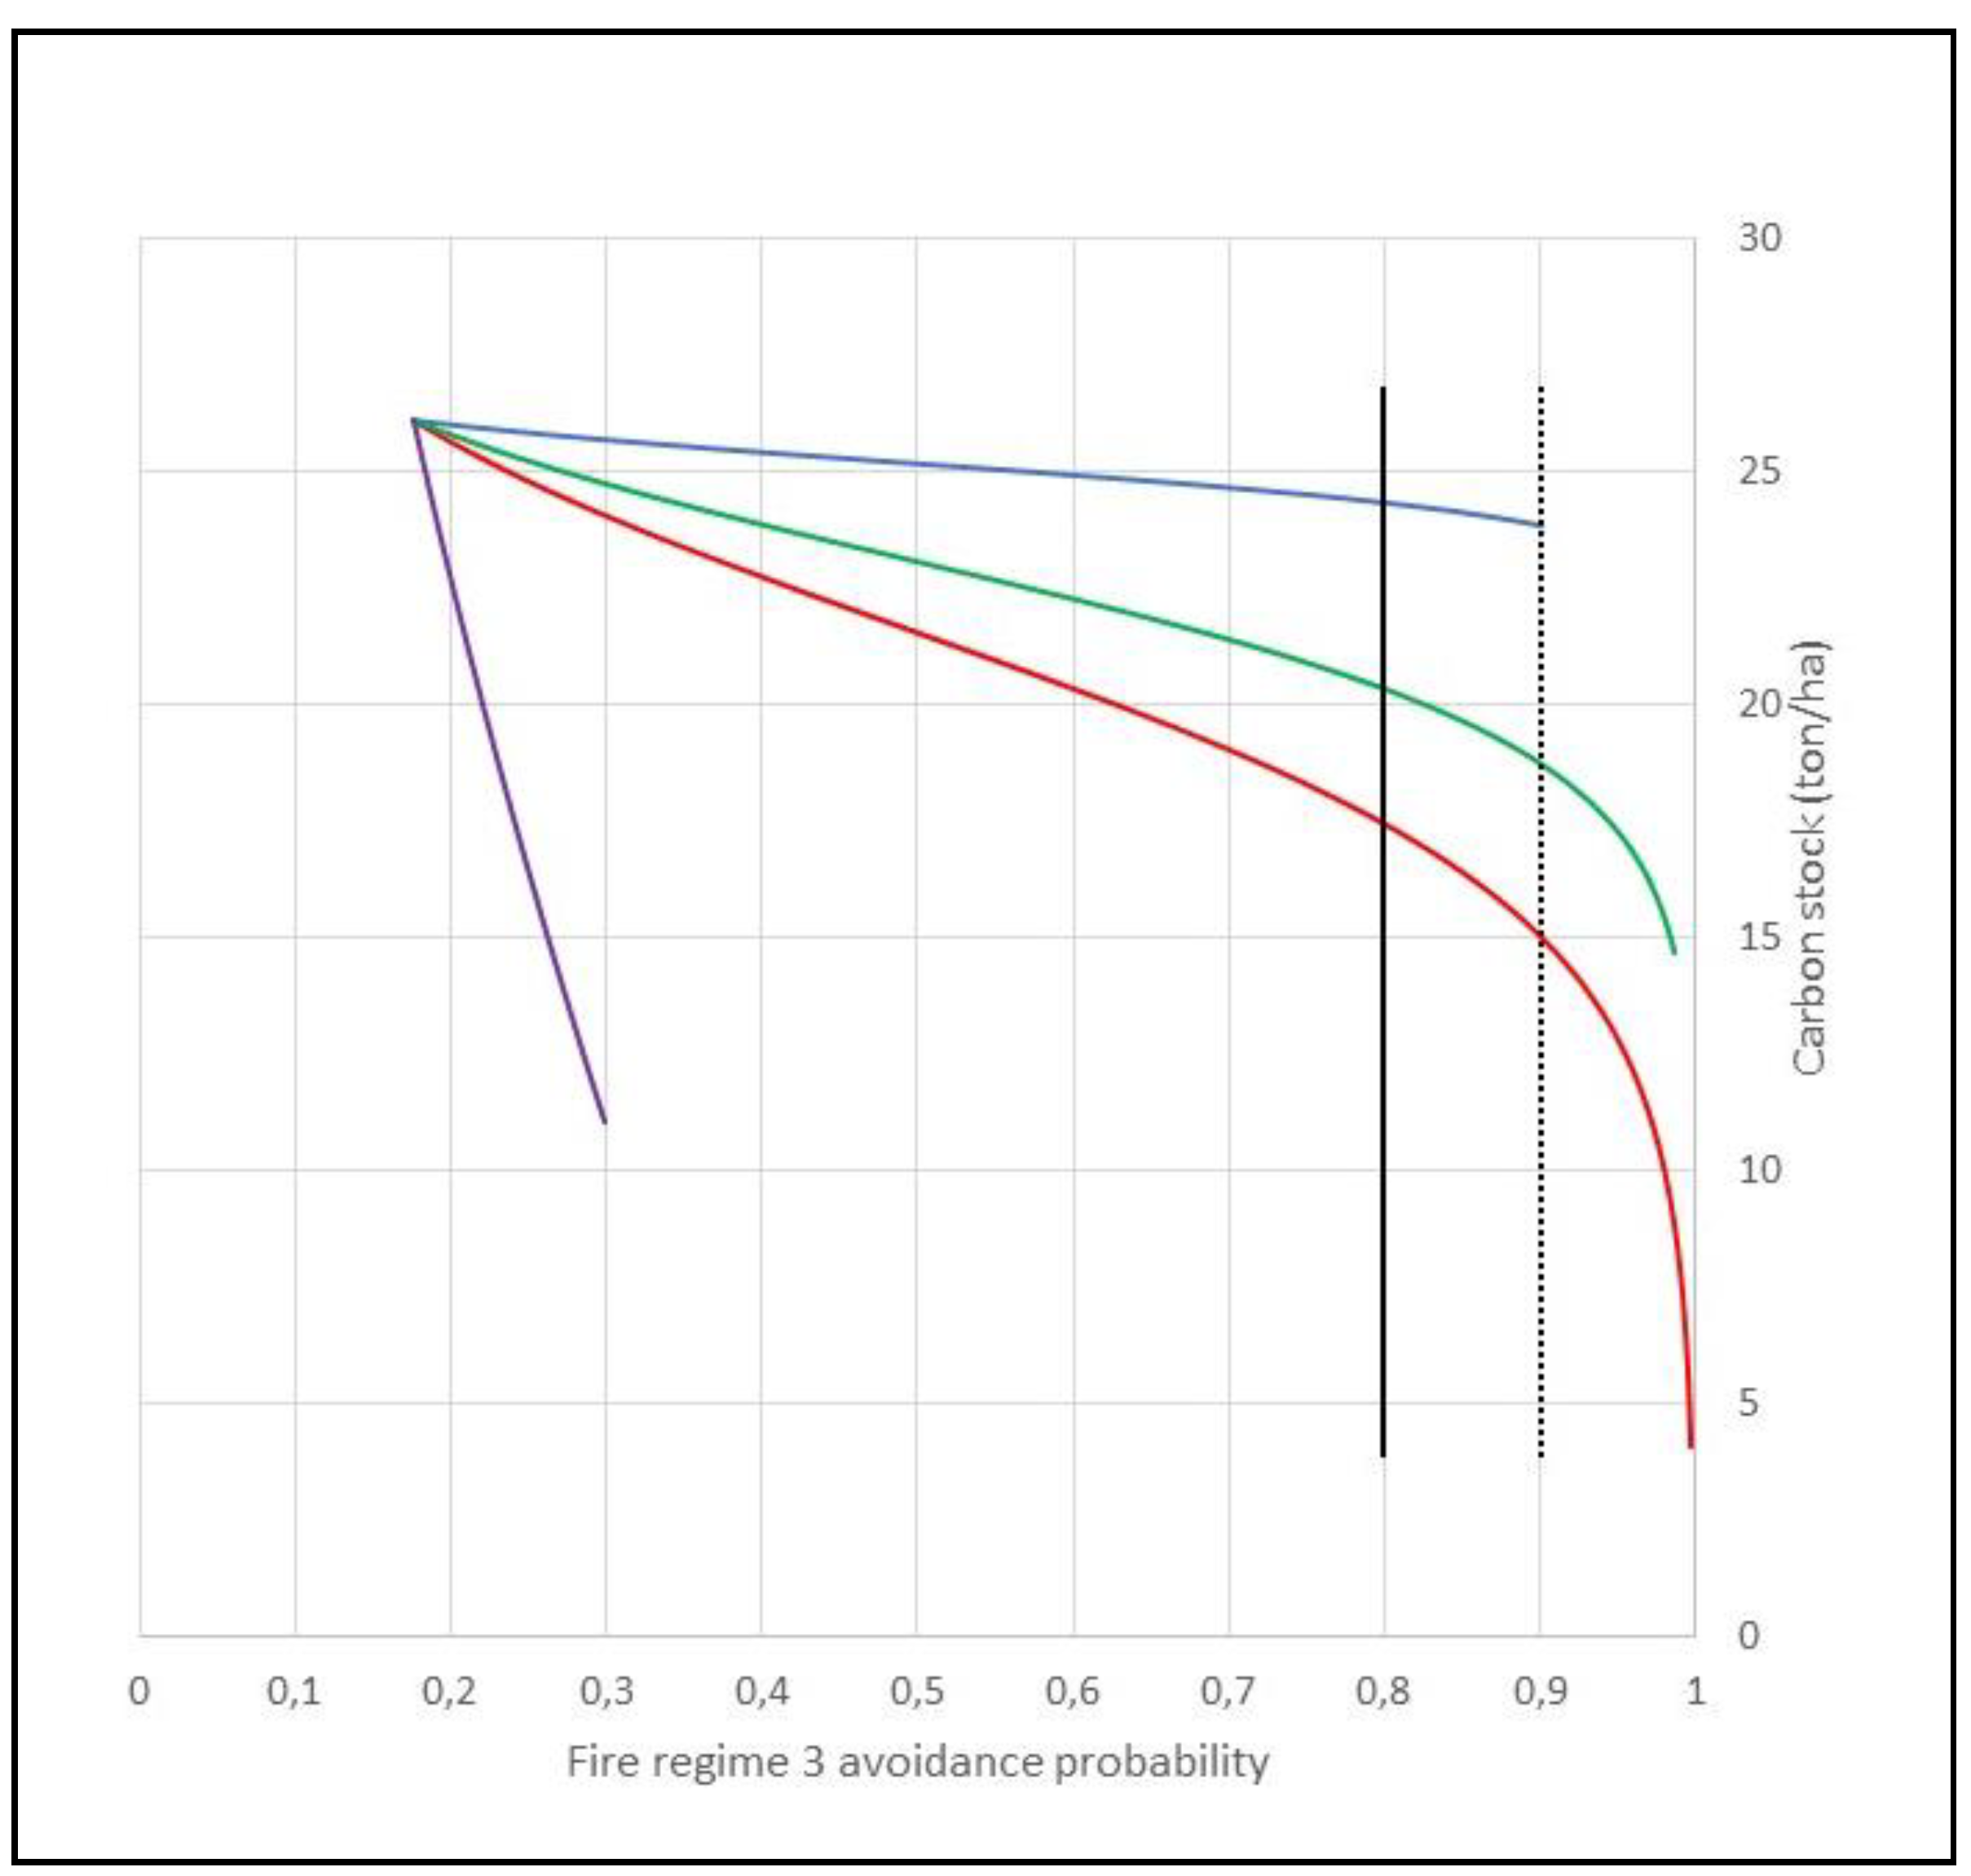
Using same functions without the plantations LULC class, as reference class, we simulated the joint change in probability of avoiding FR3 and the expected average CS value, as we increase the proportion of forest plantations converted to other LULC. This simulation results in four trade-offs curves (
Figure 11), where we see that raising the proportion of forest plantations converted has a LULC specific increasing probability of avoiding FR3, at a cost on CS reduction, which is also specific for each LULC class.
The integration of CS with the FR3 prevention solution described above, confirms its viability in terms of trade-off between the two ecosystem services. In fact, it is clear from the slopes of the lines, that converting forest plantation into farmlands makes sense to reach the 80% probability of avoiding FR3, but from that point the CS cost would drop considerably. Agroforestry became then the better conversion solution until the 90% FR3 avoiding threshold line is reached, having a minor cost on CS than farmlands. When forest plantations equally share the landscapes with the sum of farmland and agroforestry classes, the best conversion option is native forests, which has only a negligible cost on CS, as suggested by the slope of the curves. It is also confirmed that converting plantations to shrubs is not a good option because it has a relevant CS reduction and could only reach a negligible reduction in FR3 probabilities.
4. Discussion
4.1. Methodological prospects
Our methodological approach proved its suitability to explore how NbS can be implemented to address land degradation problems and revert the reinforcing feedback loops fed by climate change, particularly in Mediterranean-climate regions. In fact, our results suggest that robust models representing landscape’s fire protection and carbon storage performance can be built with basic fire and carbon information, which are usually easily available in Mediterranean regions. This approach allowed the decoupling of the two studied ecosystem services to optimize models for each component, and then integrate them to explore trade-offs in respect to different LULC classes. Understanding trade-offs between the most hazardous FR and CS is a priority step to address climate change mitigation in the land system as a whole [
59].
Our findings on FRs confirmed the advantages of integrating total burned area (CPBA) with temporal concentration of fires (GCI), and the use of averages in both indicators, following [
30]. Our FR map fully agrees with studies with different scales and periods [
21,
29] and correctly highlights the regions where all the extreme wildfire events occurred during the examined period. Full agreement is also found with [
16], who designed a complete and detailed FR map for mainland Portugal, which was accepted by the Portuguese fire authority Agency for Integrated Rural Fire Management. Our focus on the most hazardous FR comes from the recent 2017 extreme wildfires events which had extensive impacts, including over 100 casualties [
28]. We note that although both assessed ecosystem services are priorities, FR should be significantly valued, reflecting all direct implications for society and the environment.
Regarding landscape types, our cross-tabulation results have shown that FRs is highly dependent on landscape composition, diversity and configuration, in agreement with most previous studies [
3,
16,
21,
30,
42,
43]. Our CS results, including above- and below-ground biomass and litter, confirmed their robustness as a proxy for climate research, where soil carbon information is not accurate enough. Despite the innovative approach of joining forest and agriculture biomass carbon does not allow direct comparisons, our findings confirmed their dual relevance in sourcing soil organic carbon, in line with desertification and aridification studies [
56,
57,
60,
61], and also feeding GHG emissions [
59].
In respect to LULC performance at both ecosystem services the results of a logistic binary regression and a linear regression, proved their efficiency modelling forest plantations relation with the most hazardous FR and CS, confirming positive and significant results with each one, and a strong negative trade-off between them. Similar but multiple models (multiple logistic binary regression and multiple linear regression) were also correctly assessing the joint effect on FR3 and CS of forest plantation conversion to the other LULC classes.
4.2. Fire regime and carbon stock associations across landscapes
Our results show that landscape types can be divided in three groups according to FRs: the most hazardous FR is strongly associated with forest plantations, suggesting the effects of its massive distribution with very low diversity and a fire-prone configuration; the less hazardous FR is associated with mixed landscapes with shrubland, farmland and native forests; a third group including specialized agricultural landscapes, mixed agroforestry landscapes and mixed native forests landscapes is associated with small burned areas.
Our findings on forest plantations agree with most of previous research, namely [
16,
21,
30,
40,
41,
43,
62,
63] and [
18] only for maritime pine evaluation. Assessing only eucalyptus [
44] found no effect on burned area within three decades of its expansion, but attributed regional forest specificities including extension, continuity, and homogeneity to the prevalence of eucalyptus on mega-fires (>10Kha). A partial agreement is found with [
46] who did not find the eucalyptus contribution to increase the GCI, although it was justified by its high post-fire regeneration rate. However, comparison with our study should be done with caution because they grouped different forest classes [
46]. Landscapes dominated by forest plantations reach the highest average landscape CS of 22,8 tonC.ha
−1 due to their massive presence, although the individual values for each of the species (maritime pine and eucalypt) are only intermediate compared with other forest species. On the contrary, country’s carbon peaks are found in a few hexagons dominated by native forests, but they are too scarce to constitute a landscape typology.
Mixed landscape with shrubland, farmland and native forests showed-up mostly associated with less hazardous FR, in agreement with other authors [
16], who found this very frequent FR associated with traditional fire use on pastures and shrublands. Although being a mosaic builder preventing forest encroachment, this FR may also start wildfires if uncontrolled [
16], as these landcovers are strongly associated with wildfire initiation, especially in peri-urban or farmland territories [
44].
Our results found a strong association of specialized agricultural landscapes with small burned areas, in full agreement with previous research in the Iberian Peninsula, which attributed farmland a strong role in decreasing fire risk, burned area and fire hazards [
16,
21,
41,
46,
64]. However, as specialized agricultural landscapes are massively occupied by farmlands, they hold the minimum CS and the lowest diversity and the poorer richness, which may contribute to amplify desertification processes in most of the semiarid Southern half of Portugal and the NE region [
15,
60].
Mixed agroforestry landscapes have a similar FR as agricultural landscapes, followed by mixed native forest landscapes, having the later a higher CS, in full agreement with previous literature [
40,
41,
46,
62].
4.3. Implications of carbon stock and fire protection trade-offs for Nature Based Solutions
The outcomes of our research suggest that NbS should be based on changing LULC, towards a better-balanced distribution of closed and open landscapes, decreasing their specialization and contributing to less hazardous FRs and increasing CS to prevent land degradation processes.
Specifically, in forest plantation specialized landscapes, our findings show that converting forest plantations to farmland could have a successful and immediate effect on fire prevention but with a strong negative trade-off with CS, which would be better-off if conversion is done to agroforestry or to native forests, instead. However, this native forest solution is not so efficient improving FR when forest plantations are massively dominating landscapes, as more converted area is required for such improvement.
Thus, according to our results, improving forest plantations landscapes on both ecosystem services, depends on the proportion of landscape they occupy. Above 60% of landscapes proportion, our findings recommend that forest plantations should be converted to farmlands to reach 80% probability avoiding FR3. From that dominance level (60%) agroforestry become a priority conversion option for forest plantations because of better trade-off between FR and CS, reaching then 90% probabilities avoiding FR3. When forest plantations divide the landscape, in the same proportion as the sum of agriculture and agroforestry, then native forests are the best conversion solution improving both FR and CS. Our results on farmlands performance in wildfires prevention agree with other authors [
21], who found a minimum threshold of ca. 40-50% of farmland for the Central Portugal region to keep FR in low-hazard levels. Our findings also agree with previous research, considering that relevant spatial compartmentation is needed to enhance landscape heterogeneity and resilience, and minimise wildfire impacts on ecosystem services, not mere fuel brakes, and further conversion to native forests for which species have much lower flammability [
2,
3,
16,
21,
31,
33,
34,
35,
65].
Concerning specialized agriculture landscapes, our results suggest that increasing forestlands proportions would improve diversity and provide carbon inputs to soils [
56], as biomass limitation is a land degradation indicator present in all Mediterranean and semi-arid regions [
12,
60]. Native forests are the best LULC to include because, besides having the highest unitary CS, they also increase landscape diversity [
50]. These outcomes on specialized agricultural landscape CS allow relevant NbS planning, considering improvement of most fragile soils demand carbon sourcing from vegetal residues like composts, biochar, or manures [
56]. However, a holistic solution to prevent land degradation would also need field and farm-level approach, to effectively coupling carbon with biogeochemical cycles within vegetation, organic matter, and microbial biomass [
66], which is beyond the scope of the present study.
In respect to shrublands class, considering it does not provide any relevant FR or CS effect, our results advise for the mixed landscape with shrubland, farmland and native forests, the promotion of natural succession, and the fuel connection interruption segregating shrublands from forestlands to prevent small fires to expand. Regulating traditional fire use and complementing it with prescribed burning seems a broad recommendation from specific studies [
67].
Regarding the mixed agroforestry landscapes and native forests, our findings suggest increasing the forest proportion would improve CS without a significant decrease in fire regulation indicators, keeping all the advantages of the mosaic diversity and configuration [
68]. Native forests are, according to our results, the best land-use solution for FR, CS and diversity, but is however time demanding to regain market value, for which priority should be given.
Together, the effects of landscape specializations are increasing GHG emissions by both extreme fire events, and soil fertility decay, implying a net territorial decarbonization which already affects half of the country, and tend to form positive feedbacks loops with climate change and desertification processes [
2,
3,
15,
25,
60]. In addition to wildfires prevention, climate change may imply broad bioclimatic shifts on forests involving productivity reduction on forest plantations and development of evergreen oaks, carob tree, and umbrella pine in Atlantic areas where they would substitute forest plantations [
69]. Public perception [
44], and official reports from the last very large 2017-2018 wildfires in Portugal are in general agreement with our findings [
63,
70,
71]. Forestry and climate policies have already been approved for stopping eucalyptus expansion [
72], and decreasing plantation areas within the Portuguese Carbon Neutrality Roadmap [
73], but are still very modest to address the problem. To reverse rural abandonment, another policy step was the creation of integrated areas of landscape management AIGP [
74], which formalized in only 2 years, on 70 units with a total area of 140K ha (
https://www.dgterritorio.gov.pt/paisagem/ptp/aigp accessed on January 18th 2023)
4.4. Limitations and uncertainties
The scope of this research included the provision of new evidence on the performance of different landscape types as regards wildfire avoidance and carbon stocks. The landscape level is represented by hexagonal polygons dimensioned to mimic the average area of Portuguese parishes, which is the unit analysis for all calculations. In the case of FRs, some bias may result if the burned areas are divided by several polygons, or it concentrates in only one. As such, results should be considered for a group of polygons rather than one isolated polygon.
In terms of statistical limitations, the values of the Nagelkerke’s R
2 for the two logistic regressions revealed that an important part of the FR variance is dependent on other factors besides LULC, which were not considered in this work (e.g. topography, weather, anthropic factors). In fact, these relatively low accuracy values obtained were expected since similar studies demonstrated that other biophysical and human factors significantly affect FR, although LULC were predominant in most hazardous FR modelled by our regressions, in agreement with [
16].
Further attention on the FRs should be given to potential uncertainty due to the temporal mismatch between the fire information over a 36-year period (1984–2019), and the FR characterization because the LULC data is only from year 2018. This question may be minimized, however, as relevant species implied at most hazardous regime, were changing mostly within plantation LULC classes, with eucalypt replacing mostly maritime pine [
44]. Other authors also refer to the fact that past fire history shape the current landscape [
20,
30].
Our carbon research is focused on the terrestrial phase of the carbon cycle, referring to the current average (assumed close to steady state) biomass of each LULC, so it does not include the forest’s lifetime, forestry carbon footprint or forest-based generated products. Forest products, have very diverse carbon storage lifetimes depending on their specificities; short-lived forest products include bioenergy, pulp & paper, while building, furniture and non-timber products are associated with longer carbon lifetimes. Life cycle assessments should be done to provide robust information on complete carbon cycles, which is out of the scope of this paper.
5. Conclusions
We showed that land-use changes improving fire regulation and carbon storage may contribute to revert Mediterranean land degradation trend. Three main findings seem relevant when implementing NbS at the landscape level, to effectively address both ecosystem services.
Firstly, pragmatic information may source individual analysis (e.g. integrating Gini Index and total burned area), while land-use should be kept as independent variable, considering it is driving both FR and CS. Only assessing several interrelated ecosystem services allows for integrated solutions for environmental problems, which are prone to complex trade-offs and feedbacks.
Secondly, the key role of landscape type, showing highly specialized landscapes are degrading at least one of the studied ecosystem services, in contrast with mixed landscapes, which seem to strike a better balance between ecosystem services. Specialized maritime pine and eucalypt plantation landscapes stock higher carbon but are strongly associated to most hazardous FR, transforming carbon in atmospheric emissions and strongly damaging people and ecosystems. Agricultural dominated landscapes do not burn, but do not store carbon enough and do not help preventing desertification.
Finally, LULC trade-off analysis confirmed the need to drastically reduce forest plantations proportion to improve its fire profile, keeping at least 50% of landscapes in farmlands (crops and grasslands) and agroforestry. From that point, conversion to native forests seems the long-term solution, because they strike the best trade-off between CS and FR, followed by agroforestry, also associated to minimal fires. The major opportunity cost for forest owners of conversion to native forests may be the loss of market value of the systems’ output, which may require public support. Shrublands have low to intermedial CS and are mostly associated to frequent but less hazardous FR. These five major LULC classes are needed to conveniently monitor improvement at both ecosystem services at landscape level: farmlands, forest plantations, native forests, agroforestry and shrublands.
More than individual fire or desertification measures, all these findings should integrate nature-based solutions, to promote a resilient landscape to cope with climate change and effectively revert extreme wildfire and land degradation syndromes.
Figure 2.
Landscape composition – proportion of each of the five LULC classes: a) farmlands (cropland and grassland); b) agroforestry; c) forest plantations; d) native forests; e) shrublands.
Figure 2.
Landscape composition – proportion of each of the five LULC classes: a) farmlands (cropland and grassland); b) agroforestry; c) forest plantations; d) native forests; e) shrublands.
Figure 3.
Landscape diversity: a) Richness; b) Shannon Diversity Index; c) Shannon-Evenness Index.
Figure 3.
Landscape diversity: a) Richness; b) Shannon Diversity Index; c) Shannon-Evenness Index.
Figure 1.
Landscape configuration: a) Edge Density (ED); b) Mean Contiguity.
Figure 1.
Landscape configuration: a) Edge Density (ED); b) Mean Contiguity.
Figure 5.
Landscape type distribution.
Figure 5.
Landscape type distribution.
Figure 6.
a) Accumulated burnt area from 1984 to 2019 (% of the hexagon area); b) Fire regimes integrating Cumulative Percentage Burned Area and Gini Concentration Index (see section 2.3).
Figure 6.
a) Accumulated burnt area from 1984 to 2019 (% of the hexagon area); b) Fire regimes integrating Cumulative Percentage Burned Area and Gini Concentration Index (see section 2.3).
Figure 7.
Carbon stock at landscape level (TonC.ha −1).
Figure 7.
Carbon stock at landscape level (TonC.ha −1).
Figure 8.
Dependency relationship between the probability of FR3 occurrence and the proportion of forest plantations.
Figure 8.
Dependency relationship between the probability of FR3 occurrence and the proportion of forest plantations.
Figure 9.
Trade-off between the probability of avoiding fire regime FR3 and carbon stock as the proportion of forest plantations raises (using the estimated models (2) and (3)).
Figure 9.
Trade-off between the probability of avoiding fire regime FR3 and carbon stock as the proportion of forest plantations raises (using the estimated models (2) and (3)).
Figure 2.
a) Avoidance of FR 3 as a function of the proportion of plantation converted to other LULC classes: native forest (blue), agroforestry system (green), shrubland (purple), farmland (red). Avoidance thresholds: dashed line 90%; solid line 80%; and carbon stock (ton/ha) as a function of the proportion of plantation converted to other LULC classes; b) Simulations based on the estimated multivariate models for carbon stock and probability of avoiding FR3, taking as departure point (left extreme of horizontal axis) a landscape with 100% proportion of forest plantations.
Figure 11.
Joint variation of carbon stock (ton/ha) and probability of avoiding FR3 as a landscape initially 100% composed of forest plantations is converted to other LULC classes: native forest (blue), agroforestry system (green), shrubland (purple), farmland (red). Avoidance thresholds: dashed line 90%; solid line 80%.
Table 1.
Above and below-ground Carbon values (Ton C ha −1 ) and sources
Table 1.
Above and below-ground Carbon values (Ton C ha −1 ) and sources
| Species |
ton C.ha −1
|
Source |
| Chestnut tree |
86.76 |
IFN 1
|
| Acacia |
54.54 |
|
| Oaks (deciduous) |
45.8 |
|
| Other conifers |
41.06 |
|
| Other broadleaf |
33.5 |
|
| Umbrella pine |
32.39 |
|
| Maritime pine |
31.32 |
|
| Eucalyptus |
25.76 |
|
| Cork oak |
25.53 |
|
| Holm oak |
22.97 |
|
| Carob tree |
16.99 |
|
| Shrubs |
13.72 |
NIR, 2020 [14] |
| Olive orchards |
10.72 |
|
| Other permanent cultures |
9.94 |
|
| Vineyards |
3.67 |
|
| Grasslands |
1.47 |
|
| Annual agriculture crops |
0.62 |
|
Table 2.
Loadings and percentage of variance explained for the 2 principal components extracted to express landscape configuration. The total percentage of variance explained was 85.2%.
Table 2.
Loadings and percentage of variance explained for the 2 principal components extracted to express landscape configuration. The total percentage of variance explained was 85.2%.
| Variable |
PC1 |
PC2 |
| Cohesion |
-0.880 |
0 |
| Mean Contiguity |
0.121 |
0.990 |
| Largest Patch Index |
-0.905 |
0 |
| Edge density |
0.958 |
-0.106 |
| Number of Patches |
0.856 |
0 |
| Explained variance (%) |
64.843 |
20.436 |
Table 3.
Six landscape types with composition, diversity and configuration. Maximum values in bold.
Table 3.
Six landscape types with composition, diversity and configuration. Maximum values in bold.
| Landscape types |
N |
Composition |
Diversity |
Configuration |
| Farmland |
Agroforestry |
Plantations |
Native Forests |
Shrubland |
Shannon |
Sha-Eveness |
Richness |
Edge Density |
MeanContiguity |
| 1-Specialized agricultural landscapes |
524 |
0.718 |
0.095 |
0.052 |
0.085 |
0.050 |
0.776 |
0.522 |
4.416 |
1.231 |
0.267 |
| 2-Mixed agroforestry landscapes |
153 |
0.322 |
0.552 |
0.008 |
0.114 |
0.004 |
0.924 |
0.650 |
4.235 |
-0.445 |
-0.094 |
| 3-Mixed landscape with shrubland, farmland and native forest |
609 |
0.290 |
0.009 |
0.162 |
0.183 |
0.356 |
1.183 |
0.817 |
4.291 |
-0.266 |
-0.283 |
| 4- Mixed native forests landscapes |
598 |
0.250 |
0.155 |
0.123 |
0.416 |
0.056 |
1.164 |
0.733 |
4.906 |
-0.564 |
0.286 |
| 5-Mixed landscapes with plantations and farmland |
459 |
0.287 |
0.003 |
0.494 |
0.108 |
0.109 |
1.065 |
0.738 |
4.283 |
-0.177 |
0.039 |
| 6-Specialized plantations landscapes |
252 |
0.125 |
0.001 |
0.778 |
0.048 |
0.048 |
0.671 |
0.481 |
4.032 |
-0.830 |
-0.541 |
| Total |
2595 |
|
|
|
|
|
|
|
|
|
|
Table 4.
Comparison of observed frequency of the three fire regimes and average carbon stock across landscape types.
Table 4.
Comparison of observed frequency of the three fire regimes and average carbon stock across landscape types.
| Landscape types |
|
FR |
ton. C.ha −1
|
| 1-Specialized agricultural landscape |
|
1 |
2 |
3 |
|
| Proportion of FRs |
97.1% |
1.5% |
1.3% |
8.3 |
| Adjusted Residuals |
+ |
- |
- |
|
| 2-Mixed agroforestry landscape |
Proportion of FRs |
100% |
0% |
0% |
13.4 |
| Adjusted Residuals |
+ |
- |
- |
|
| 3-Mixed landscape with shrubland, farmland and native forest |
Proportion of FRs |
31.4% |
46.5% |
22.2% |
14.6 |
| Adjusted Residuals |
- |
+ |
+ |
|
| 4- Mixed native forests landscapes |
Proportion of FRs |
90.0% |
1.7% |
8.4% |
16.2 |
| Adjusted Residuals |
+ |
- |
- |
|
| 5-Mixed landscapes with plantations and farmland |
Proportion of FRs |
46.2% |
24.0% |
29.8% |
17.8 |
| Adjusted Residuals |
- |
+ |
+ |
|
| 6-Specialized plantations landscapes |
Proportion of FRs |
28.2% |
8.3% |
63.5% |
22.8 |
| |
Adjusted Residuals |
- |
- |
+ |
|
| TOTAL |
Proportion of FRs |
64.5% |
16.6% |
18.8% |
|
Table 5.
Estimated coefficients of the binary logistic regression.
Table 5.
Estimated coefficients of the binary logistic regression.
| Variable |
Beta |
SE |
95% CI |
EXP (B) |
p |
| LL |
UL |
| (Intercept) |
-2.88 |
0.098 |
|
|
0.056 |
0.000 |
| PLA % |
0.042 |
0.002 |
1.038 |
1.047 |
1.043 |
0.000 |
| |
|
|
|
|
|
|
| N |
2766 |
|
|
|
|
|
| Nagelkerke’s R2 |
0.268 |
|
|
|
|
|
| Prediction Accuracy |
0.846 |
|
|
|
|
|
| Chi square sign. |
0.000 |
|
|
|
|
|
