Submitted:
25 August 2023
Posted:
28 August 2023
You are already at the latest version
Abstract
Keywords:
1. Introduction
2. Materials and Methods
2.1. Materials
2.1.1. Soil material
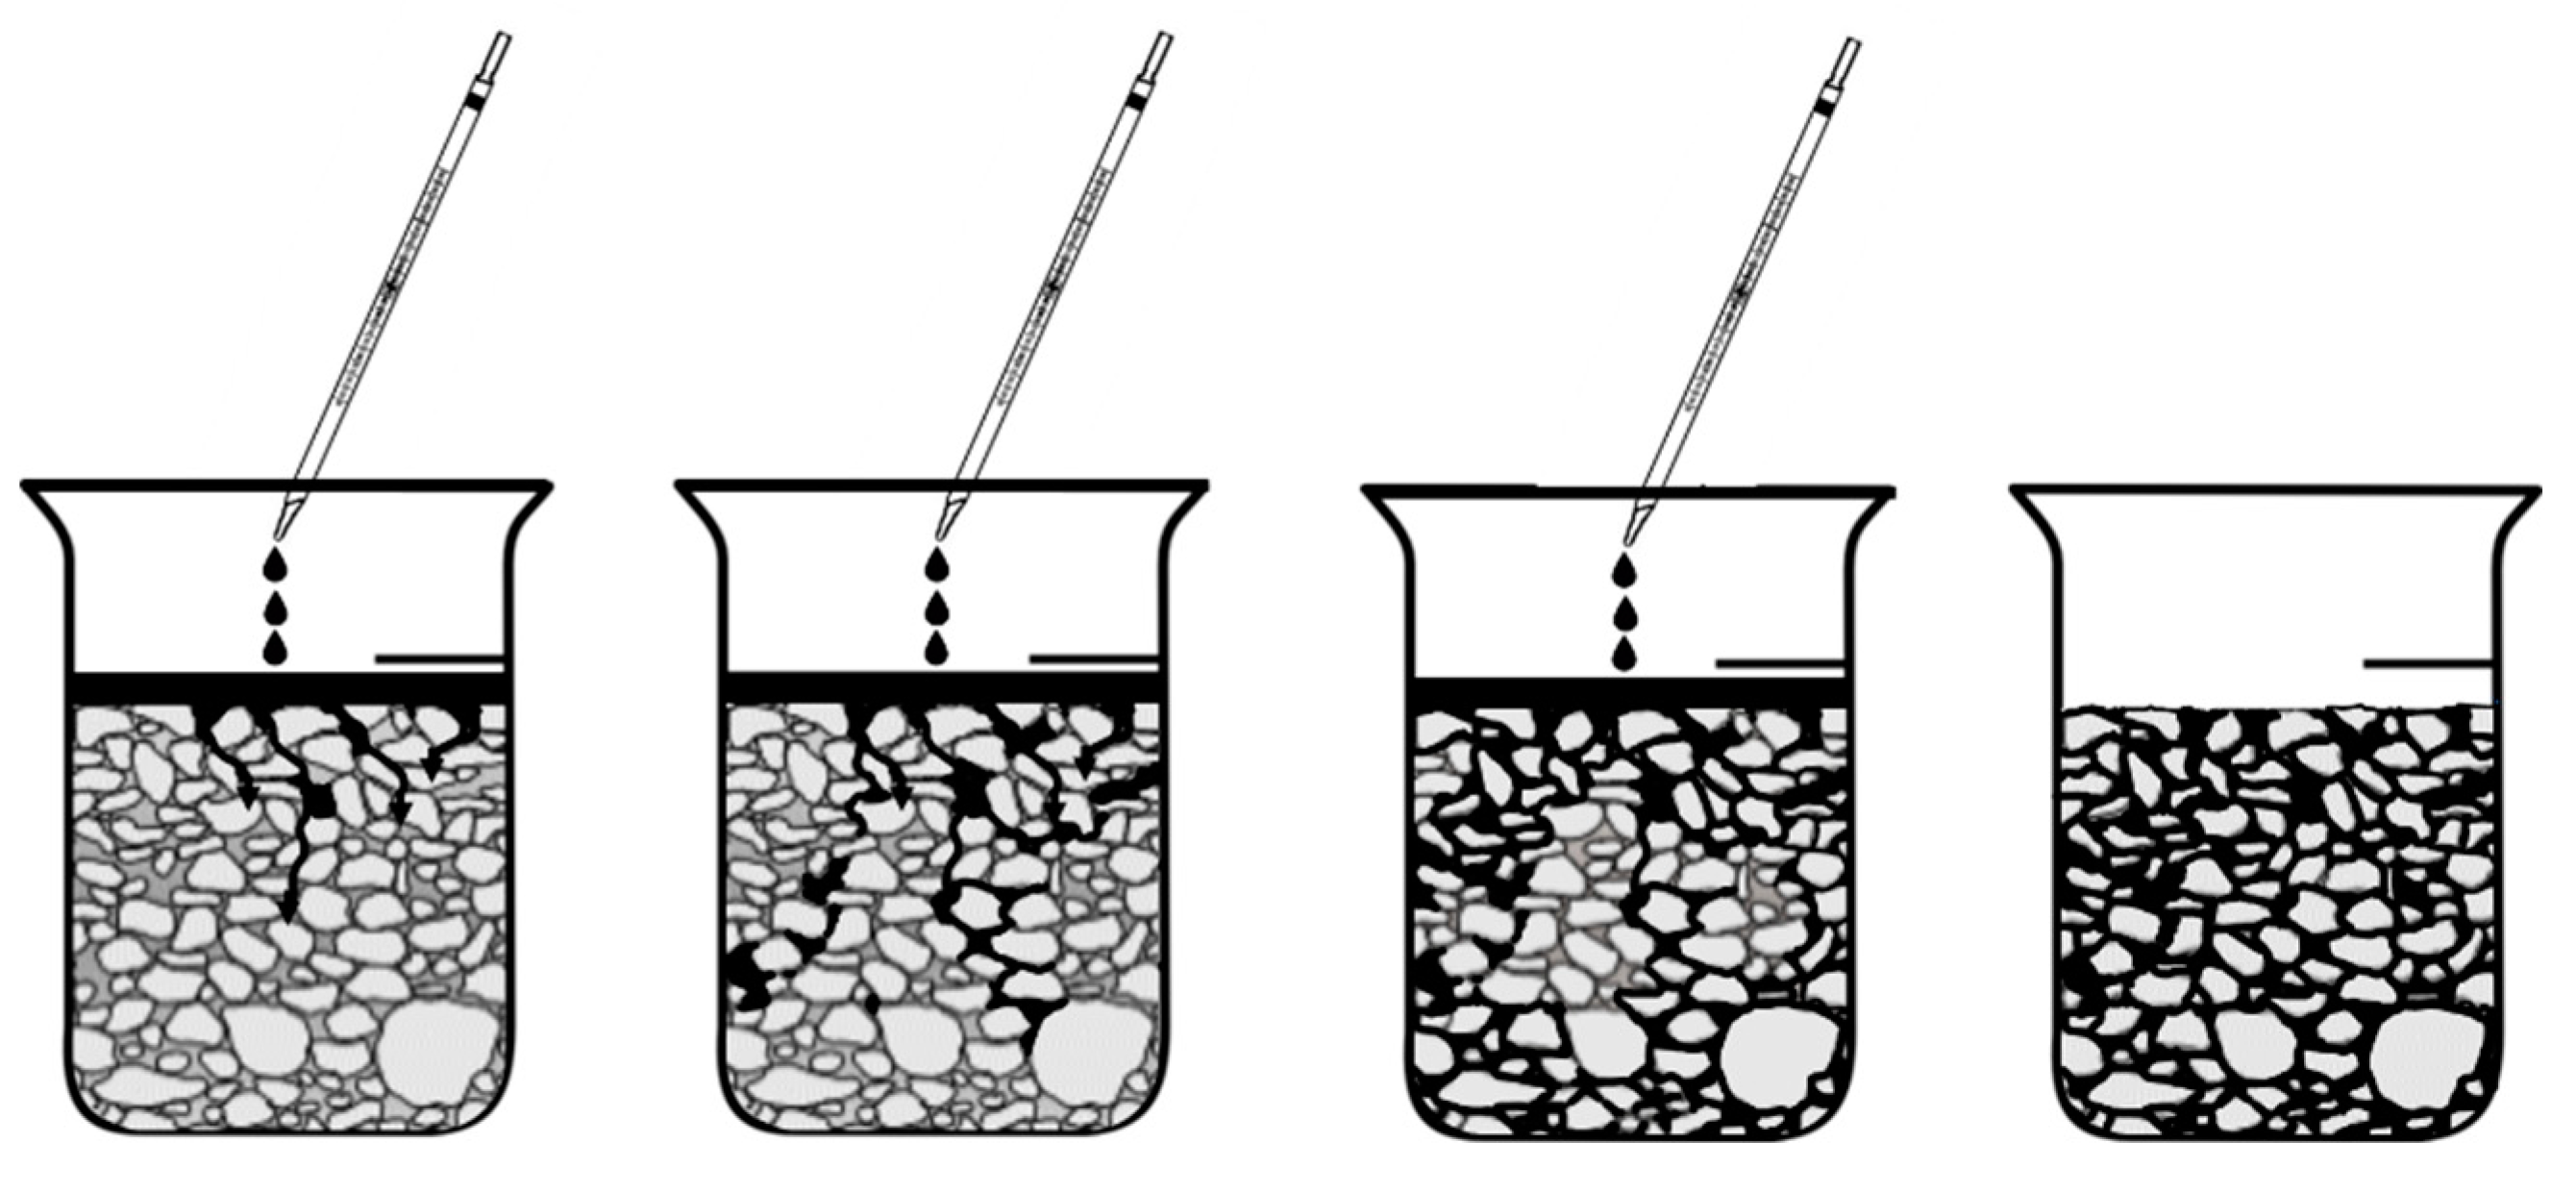
2.1.2. Experimental organic materials and soil incubation

2.2. Analytical methods
2.2.1. Basic soil chemical characteristic
2.2.2. P-sorption isotherms
2.2.3. Statistical analyses
3. Results and Discussion
3.1. Soils chemical characteristics
3.1.1. Initial properties and P status
3.1.2. DOM impact on soil chemical properties
3.2. Process of P sorption
3.2.1. P sorption in unsaturated soils (S1, S2, S3)
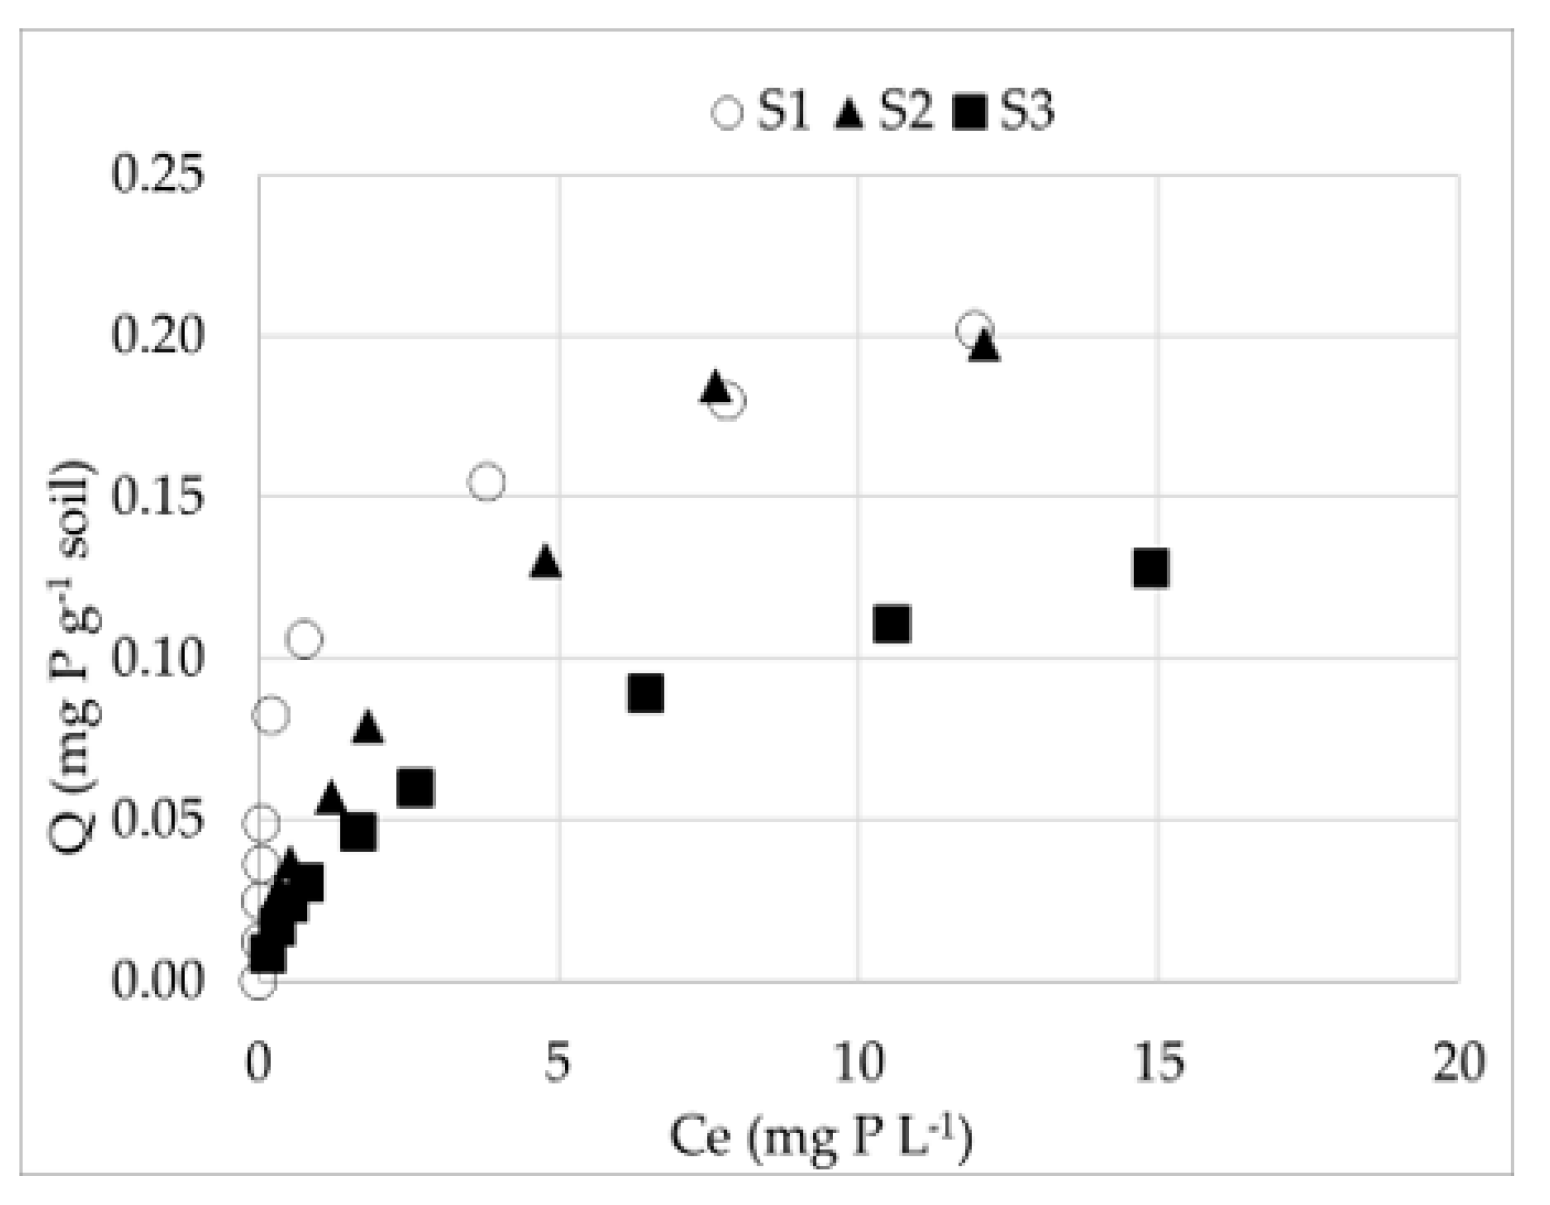
3.2.2. DOM effect on P sorption in soils
3.3. The P adsorption indices
| Soil sample / amendment | Freundlich isotherm | Langmuir isotherm | MBC mg g-1 |
||||||||
|---|---|---|---|---|---|---|---|---|---|---|---|
| Kf | nf | sum SE | Variance | R2 | KL | Qm | sum SE | variance | R2 | ||
| S1 (CONTROL) | 0.1 | 0.27 | 0.001 | 0.0053 | 0.99 | 3.68 | 0.18 | 0.003 | 0.0053 | 0.95 | 0.662 |
| S1-CPT | 0.12 | 0.34 | 0.003 | 0.0089 | 0.97 | 2.78 | 0.24 | 0.003 | 0.0089 | 0.97 | 0.667 |
| S1-BD | 0.1 | 0.43 | 0.002 | 0.0085 | 0.98 | 1.05 | 0.26 | 0.003 | 0.0085 | 0.96 | 0.273 |
| S1-CM | 0.09 | 0.40 | 0.002 | 0.0069 | 0.97 | 1.25 | 0.23 | 0.002 | 0.0069 | 0.97 | 0.288 |
| S1-HM | 0.03 | 0.67 | 0.001 | 0.0035 | 0.98 | 0.12 | 0.26 | 0 | 0.0035 | 0.99 | 0.031 |
| S2 (CONTROL) | 0.05 | 0.56 | 0.001 | 0.0053 | 0.98 | 0.23 | 0.27 | 0 | 0.0053 | 0.99 | 0.062 |
| S2-CPT | 0.06 | 0.63 | 0.001 | 0.0083 | 0.98 | 0.22 | 0.37 | 0.002 | 0.0082 | 0.98 | 0.081 |
| S2-BD | 0.05 | 0.70 | 0.002 | 0.0068 | 0.98 | 0.13 | 0.39 | 0.001 | 0.0068 | 0.99 | 0.051 |
| S2-CM | 0.05 | 0.66 | 0.002 | 0.0064 | 0.97 | 0.16 | 0.34 | 0.001 | 0.0064 | 0.99 | 0.054 |
| S2-HM | 0.008 | 1.12 | 0.005 | 0.004 | 0.88 | 0.01 | 1.34 | 0.005 | 0.004 | 0.87 | 0.012 |
| S3 (CONTROL) | 0.03 | 0.49 | 0 | 0.002 | 0.99 | 0.27 | 0.15 | 0 | 0.002 | 0.99 | 0.041 |
| S3-CPT | 0.04 | 0.55 | 0.001 | 0.0037 | 0.98 | 0.24 | 0.22 | 0 | 0.0037 | 0.99 | 0.053 |
| S3-BD | 0.04 | 0.73 | 0.001 | 0.0064 | 0.98 | 0.09 | 0.45 | 0.002 | 0.0064 | 0.97 | 0.041 |
| S3-CM | 0.04 | 0.64 | 0.001 | 0.004 | 0.98 | 0.15 | 0.26 | 0.001 | 0.004 | 0.98 | 0.039 |
| S3-HM | 0.002 | 1.51 | 0.004 | 0.003 | 0.85 | 0.07 | 0.2 | 0.009 | 0.003 | 0.67 | 0.010 |
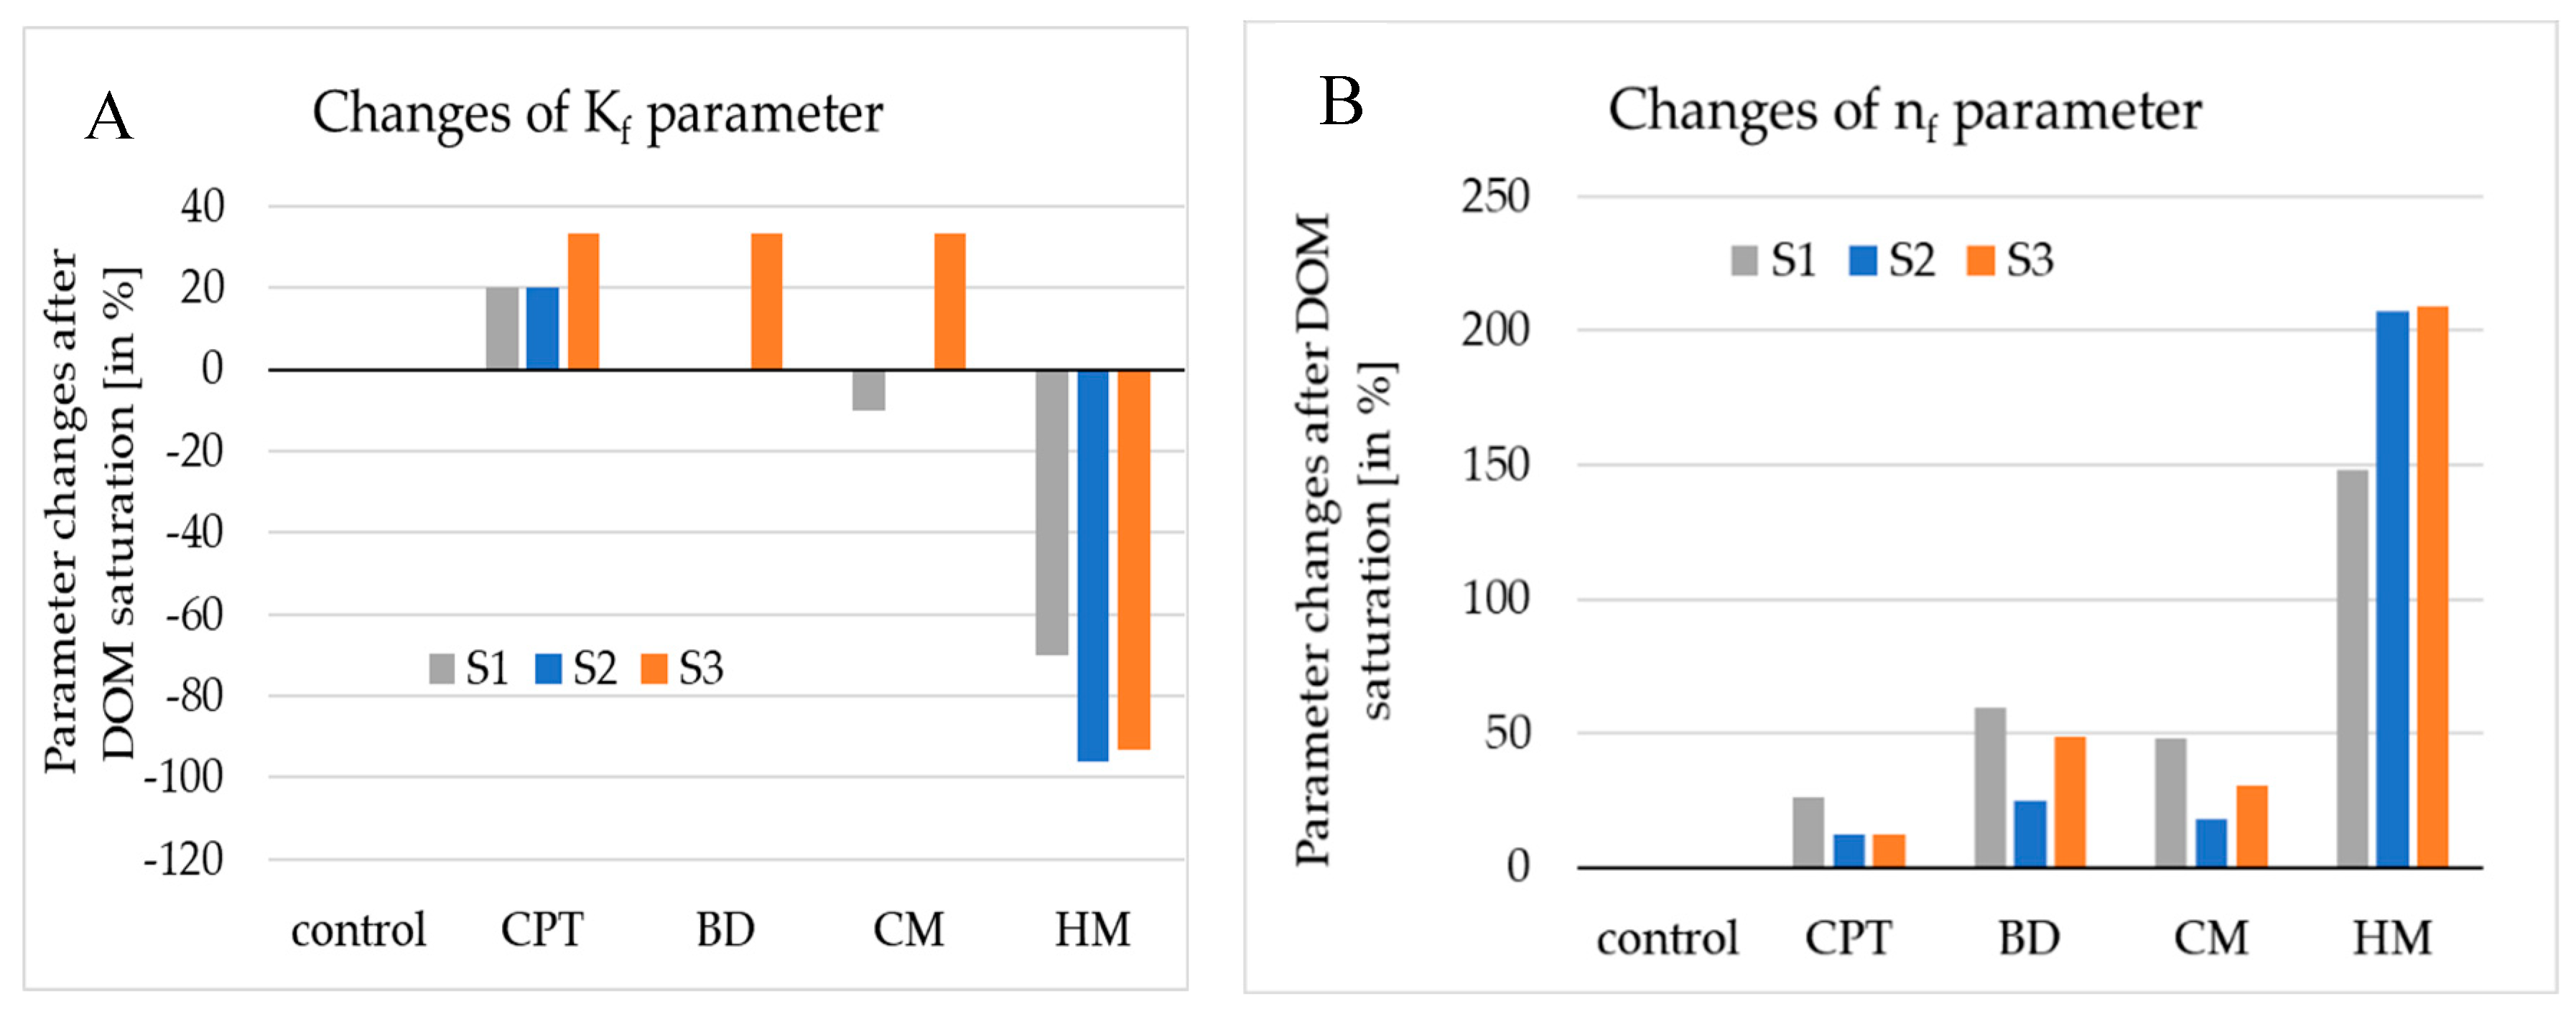
3.3.1. Freundlich equation parameters
3.3.2. Langmuir equation parameters
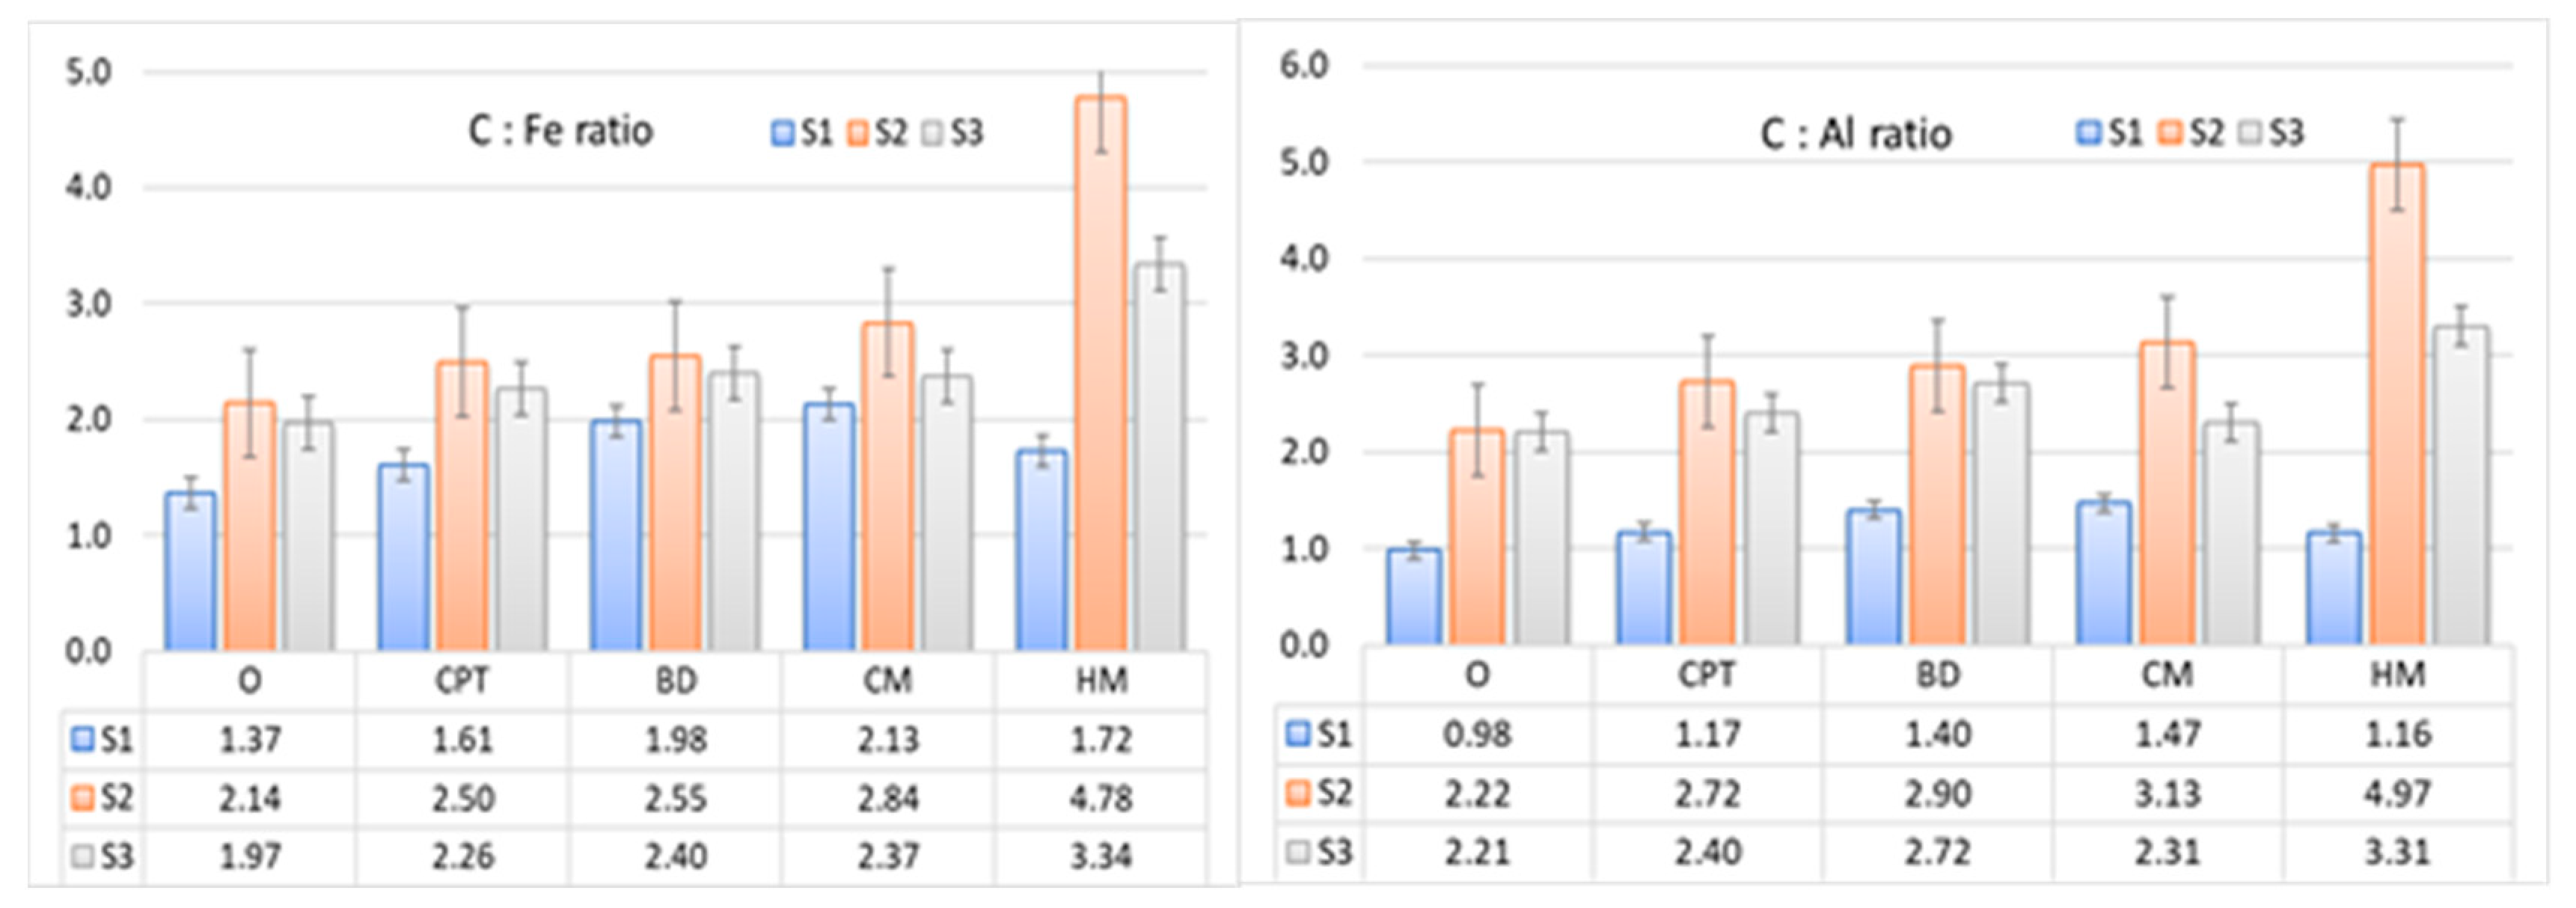
3.4. Relationships affecting P sorption in DOM-treated soils
4. Conclusions
Author Contributions
Funding
Institutional Review Board Statement
Data Availability Statement
Acknowledgments
Conflicts of Interest
References
- Grigatti, M.; Cavani, L.; di Biase, G.; Ciavatta, C. Current and Residual Phosphorous Availability from Compost in a Ryegrass Pot Test. Sci. Total Environ. 2019, 677, 250–262. [Google Scholar] [CrossRef]
- Heymann, K.; Xing, B.; Keiluweit, M.; Ebdon, J.S. Influence of Dissolved Organic Carbon from Natural and Synthetic Fertilizers on Phosphate Leaching from a Sand-Based Golf Green. Itsrj 2017, 13, 103. [Google Scholar] [CrossRef]
- Hooda, P.S.; Truesdale, V.W.; Edwards, A.C.; Withers, P.J.A.; Aitken, M.N.; Miller, A.; Rendell, A.R. Manuring and Fertilization Effects on Phosphorus Accumulation in Soils and Potential Environmental Implications. Adv. Environ. Res. 2001, 5, 13–21. [Google Scholar] [CrossRef]
- Horta, C. Fertilisation with Compost: Effects on Soil Phosphorus Sorption and on Phosphorus Availability in Acid Soils. Open J. Soil Sci. 2019, 09, 255–268. [Google Scholar] [CrossRef]
- Jindo, K.; Audette, Y.; Olivares, F.L.; Canellas, L.P.; Smith, D.S.; Voroney, R.P. Biotic and Abiotic Effects of Soil Organic Matter on the Phytoavailable Phosphorus in Soils : A Review. Chem. Biol. Technol. Agric. 2023, 1–12. [Google Scholar] [CrossRef]
- Regelink, I.C.; Egene, C.E.; Tack, F.M.G.; Meers, E. Speciation of P in Solid Organic Fertilisers from Digestate and Biowaste. Agronomy 2021, 11. [Google Scholar] [CrossRef]
- Garbowski, T.; Bar-Michalczyk, D.; Charazińska, S.; Grabowska-Polanowska, B.; Kowalczyk, A.; Lochyński, P. An Overview of Natural Soil Amendments in Agriculture. Soil Tillage Res. 2023, 225. [Google Scholar] [CrossRef]
- Wright, A.L.; Provin, T.L.; Hons, F.M.; Zuberer, D.A.; White, R.H. Compost Impacts on Dissolved Organic Carbon and Available Nitrogen and Phosphorus in Turfgrass Soil. Waste Manag. 2008, 28, 1057–1063. [Google Scholar] [CrossRef] [PubMed]
- Dou, Z.; Ramberg, C.F.; Toth, J.D.; Wang, Y.; Sharpley, A.N.; Boyd, S.E.; Chen, C.R.; Williams, D.; Xu, Z.H. Phosphorus Speciation and Sorption-Desorption Characteristics in Heavily Manured Soils. Soil Sci. Soc. Am. J. 2009, 73, 93–101. [Google Scholar] [CrossRef]
- Horta, C. Bioavailability of Phosphorus from Composts and Struvite in Acid Soils | Biodisponibilidade Do Fósforo Em Compostos e Struvite Aplicados Em Solos Ácidos. Rev. Bras. Eng. Agric. e Ambient. 2017, 21, 459–464. [Google Scholar] [CrossRef]
- Vanden Nest, T.; Amery, F.; Fryda, L.; Boogaerts, C.; Bilbao, J.; Vandecasteele, B. Renewable P Sources: P Use Efficiency of Digestate, Processed Animal Manure, Compost, Biochar and Struvite. Sci. Total Environ. 2021, 750, 141699. [Google Scholar] [CrossRef]
- Abdala, D.B.; da Silva, I.R.; Vergütz, L.; Sparks, D.L. Long-Term Manure Application Effects on Phosphorus Speciation, Kinetics and Distribution in Highly Weathered Agricultural Soils. Chemosphere 2015, 119, 504–514. [Google Scholar] [CrossRef]
- Rakshit, A.; Singh, H.B.; Sen, A. Nutrient Use Efficiency: From Basics to Advances; 2015; ISBN 9788132221692. [Google Scholar]
- Christel, W.; Bruun, S.; Magid, J.; Jensen, L.S. Phosphorus Availability from the Solid Fraction of Pig Slurry Is Altered by Composting or Thermal Treatment. Bioresour. Technol. 2014, 169, 543–551. [Google Scholar] [CrossRef]
- Komiyama, T.; Niizuma, S.; Fujisawa, E.; Morikuni, H. Phosphorus Compounds and Their Solubility in Swine Manure Compost. Soil Sci. Plant Nutr. 2013, 59, 419–426. [Google Scholar] [CrossRef]
- Chase, A.J.; Erich, M.S.; Ohno, T. Bioavailability of Phosphorus on Iron (Oxy)Hydroxide Not Affected by Soil Amendment–Derived Organic Matter. Agric. Environ. Lett. 2018, 3, 170042. [Google Scholar] [CrossRef]
- Prüter, J.; Strauch, S.M.; Wenzel, L.C.; Klysubun, W.; Palm, H.W.; Leinweber, P. Organic Matter Composition and Phosphorus Speciation of Solid Waste from an African Catfish Recirculating Aquaculture System. Agric. 2020, 10, 1–14. [Google Scholar] [CrossRef]
- Syers, J.K.; Johnston, A.E.; Curtin, D. Efficiency of Soil and Fertilizer Phosphorus Use: Reconciling Changing Concepts of Soil Phosphorus Behaviour with Agronomic Information. P. Exp. Agric. 2009, 45, 128–128. [Google Scholar] [CrossRef]
- Gao, Y.; Zhu, B.; He, N.; Yu, G.; Wang, T.; Chen, W.; Tian, J. Phosphorus and Carbon Competitive Sorption-Desorption and Associated Non-Point Loss Respond to Natural Rainfall Events. J. Hydrol. 2014, 517, 447–457. [Google Scholar] [CrossRef]
- Hua, Q.-X.; Li, J.-Y.; Zhou, J.-M.; Wang, H.-Y.; Du, C.-W.; Chen, X.-Q. Enhancement of Phosphorus Solubility by Humic Substances in Ferrosols. Pedosphere 2008, 18, 533–538. [Google Scholar] [CrossRef]
- McDowell, R.W.; Sharpley, A.N. Approximating Phosphorus Release from Soils to Surface Runoff and Subsurface Drainage. J. Environ. Qual. 2001, 30, 508–520. [Google Scholar] [CrossRef]
- Zang, L.; Tian, G.M.; Liang, X.Q.; He, M.M.; Bao, Q.B.; Yao, J.H. Profile Distributions of Dissolved and Colloidal Phosphorus as Affected by Degree of Phosphorus Saturation in Paddy Soil. Pedosphere 2013, 23, 128–136. [Google Scholar] [CrossRef]
- Nair, V.D.; Portier, K.M.; Graetz, D.A.; Walker, M.L. An Environmental Threshold for Degree of Phosphorus Saturation in Sandy Soils. J. Environ. Qual. 2004, 33, 107. [Google Scholar] [CrossRef] [PubMed]
- Nair, V.D. Soil Phosphorus Saturation Ratio for Risk Assessment in Land Use Systems. Front. Environ. Sci. 2014, 2, 1–4. [Google Scholar] [CrossRef]
- Warrinnier, R.; Goossens, T.; Amery, F.; Vanden Nest, T.; Verbeeck, M.; Smolders, E. Investigation on the Control of Phosphate Leaching by Sorption and Colloidal Transport: Column Studies and Multi-Surface Complexation Modelling. Appl. Geochemistry 2019, 100, 371–379. [Google Scholar] [CrossRef]
- Yang, X.; Chen, X.; Yang, X. Effect of Organic Matter on Phosphorus Adsorption and Desorption in a Black Soil from Northeast China. Soil Tillage Res. 2019, 187, 85–91. [Google Scholar] [CrossRef]
- Wang, C.; Wang, Z.; Lin, L.; Tian, B.; Pei, Y. Effect of Low Molecular Weight Organic Acids on Phosphorus Adsorption by Ferric-Alum Water Treatment Residuals. J. Hazard. Mater 2012, 203–204, 145–150. [Google Scholar] [CrossRef]
- Ahmed, A.A.; Leinweber, P.; Kühn, O. Advances in Understanding the Phosphate Binding in Soil : A Computational Chemistry Perspective. Theor. Comput. Chem. 2022, 1–34. [Google Scholar] [CrossRef]
- Guppy, C.N.; Menzies, N.W.; Moody, P.W.; Blamey, F.P.C. Competitive Sorption Reactions between Phosphorus and Organic Matter in Soil: A Review. Aust. J. Soil Res. 2005, 43, 189–202. [Google Scholar] [CrossRef]
- Strawn, D.G. Sorption Mechanisms of Chemicals in Soils. Soil Syst. 2021, 5, 1–22. [Google Scholar] [CrossRef]
- Lützow, M. V.; Kögel-Knabner, I.; Ekschmitt, K.; Matzner, E.; Guggenberger, G.; Marschner, B.; Flessa, H. Stabilization of Organic Matter in Temperate Soils: Mechanisms and Their Relevance under Different Soil Conditions - A Review. Eur. J. Soil Sci. 2006, 57, 426–445. [Google Scholar] [CrossRef]
- Singh, M.; Sarkar, B.; Biswas, B.; Churchman, J.; Bolan, N.S. Adsorption-Desorption Behavior of Dissolved Organic Carbon by Soil Clay Fractions of Varying Mineralogy. Geoderma 2016, 280, 47–56. [Google Scholar] [CrossRef]
- Kaiser, K.; Guggenberger, G. Mineral Surfaces and Soil Organic Matter. Eur. J. Soil Sci. 2003, 54, 219–236. [Google Scholar] [CrossRef]
- Wang, Y.T.; Zhang, T.Q.; O’Halloran, I.P.; Tan, C.S.; Hu, Q.C. A Phosphorus Sorption Index and Its Use to Estimate Leaching of Dissolved Phosphorus from Agricultural Soils in Ontario. Geoderma 2016, 274, 79–87. [Google Scholar] [CrossRef]
- Wang, Y.; Whalen, J.K.; Chen, X.; Cao, Y.; Huang, B.; Lu, C.; Shi, Y. Mechanisms for Altering Phosphorus Sorption Characteristics Induced by Low-Molecular-Weight Organic Acids. Can. J. Soil Sci. 2016, 96, 289–298. [Google Scholar] [CrossRef]
- Hunt, J.F.; Ohno, T.; He, Z.; Honeycutt, C.W.; Dail, D.B. Inhibition of Phosphorus Sorption to Goethite, Gibbsite, and Kaolin by Fresh and Decomposed Organic Matter. Biol. Fertil. Soils 2007, 44, 277–288. [Google Scholar] [CrossRef]
- Mikutta, C.; Lang, F.; Kaupenjohann, M. Citrate Impairs the Micropore Diffusion of Phosphate into Pure and C-Coated Goethite. Geochim. Cosmochim. Acta 2006, 70, 595–607. [Google Scholar] [CrossRef]
- Goyne, K.W.; Jun, H.; Anderson, S.H.; Motavalli, P.P. Phosphorus and Nitrogen Sorption to Soils in the Presence of Poultry Litter-Derived. 2008, 154–163. [Google Scholar] [CrossRef]
- Fu, Z.; Wu, F.; Song, K.; Lin, Y.; Bai, Y.; Zhu, Y.; Giesy, J.P. Competitive Interaction between Soil-Derived Humic Acid and Phosphate on Goethite. Appl. Geochemistry 2013, 36, 125–131. [Google Scholar] [CrossRef]
- Yang, X.; Chen, X.; Yang, X. Effect of Organic Matter on Phosphorus Adsorption and Desorption in a Black Soil from Northeast China. Soil Tillage Res. 2019, 187, 85–91. [Google Scholar] [CrossRef]
- Hunt, J.F.; He, Z. Characteristics of Plant-Derived Water-Extractable Organic Matter and Its Effects on Phosphorus Sorption Behavior. Labile Org. Matter Chem. Compos. Funct. Significance Soil Environ. 2015, 70124, 99–118. [Google Scholar] [CrossRef]
- Ohno, T.; Crannell, B.S. Green and Animal Manure-Derived Dissolved Organic Matter Effects on Phosphorus Sorption. J. Environ. Qual. 1996, 25, 1137–1143. [Google Scholar] [CrossRef]
- Hunt, J.F.; Ohno, T.; He, Z.; Honeycutt, C.W.; Dail, D.B. Influence of Decomposition on Chemical Properties of Plant- and Manure-Derived Dissolved Organic Matter and Sorption to Goethite. J. Environ. Qual. 2007, 36, 135–143. [Google Scholar] [CrossRef] [PubMed]
- Negassa, W.; Dultz, S.; Schlichting, A.; Leinweber, P. Influence of Specific Organic Compounds on Phosphorus Sorption and Distribution in a Tropical Soil. Soil Sci. 2008, 173, 587–601. [Google Scholar] [CrossRef]
- Borggaard, O.K.; Raben-Lange, B.; Gimsing, A.L.; Strobel, B.W. Influence of Humic Substances on Phosphate Adsorption by Aluminium and Iron Oxides. Geoderma 2005, 127, 270–279. [Google Scholar] [CrossRef]
- Debicka, M.; Kocowicz, A.; Weber, J.; Jamroz, E. Organic Matter Effects on Phosphorus Sorption in Sandy Soils. Arch. Agron. Soil Sci. 2015, 62, 840–855. [Google Scholar] [CrossRef]
- Hiradate, S.; Uchida, N. Effects of Soil Organic Matter on Ph-Dependent Phosphate Sorption by Soils. Soil Sci. Plant Nutr. 2004, 50, 665–675. [Google Scholar] [CrossRef]
- Du, Z.Y.; Wang, Q.H.; Liu, F.C.; Ma, H.L.; Ma, B.Y.; MalhI, S.S. Movement of Phosphorus in a Calcareous Soil as Affected by Humic Acid. Pedosphere 2013, 23, 229–235. [Google Scholar] [CrossRef]
- Sims, T.; Pierzynski, G.M.; Tabatabai, A.M.; Sparks, D.L.; Sims, T.; Pierzynski, G. M.; Tabatabai, A.M.; Sparks, D.L. Chemical Processes in Soil; SSSA Book Series 8; 2005. [Google Scholar]
- IUSS Working Group WRB. World Reference Base for Soil Resources. International Soil Classification System for Naming Soils and Creating Legends for Soil Maps, 4th Edition edInternational Union of Soil Sciences (IUSS): Vienna, Austria, 2022; Vol. 4, ISBN 9798986245119. [Google Scholar]
- Pansu, M.; Gautheyrou, J. Handbook of Soil Analysis: Mineralogical, Organic and Inorganic Methods; Springer: Berlin, Heidelberg, ; 2006; ISBN 9783540312109. [Google Scholar]
- McKeague, J.A.; Day, J.H. Dithionite and Oxalate Fe and Al as Aids in Differentiating Various Classes of Soils. Can. J. Soil Sci. 1966, 46, 13–22. [Google Scholar] [CrossRef]
- van der Zee, S.E.A.T.M.; Fokkink, L.G.J.; van Riemsdijk, W.H. A New Technique for Assessment of Reversibly Adsorbed Phosphate. Soil Sci. Soc. Am. J. 1987, 51, 599–604. [Google Scholar] [CrossRef]
- van der Zee, S.E.A.T.M.; van Riemsdijk, W.H. Model for Long-Term Phosphate Reaction Kinetics in Soil. J. Environ. Qual. 1988, 17, 35–41. [Google Scholar] [CrossRef]
- Freese, D.; van der Zee, S.E.A.T.M.; van Riemsdijk, W.H. Comparison of Different Models for Phosphate Sorption as a Function of the Iron and Aluminium Oxides of Soils. J. Soil Sci. 1992, 43, 729–738. [Google Scholar] [CrossRef]
- Bolster, C.H.; Hornberger, G.M. On the Use of Linearized Langmuir Equations. Soil Sci. Soc. Am. J. 2007, 71, 1796–1806. [Google Scholar] [CrossRef]
- TIBCO Software Inc. Statistica (Data Analysis Software System), 2017, Version 13. Available online: Http://Statistica.Io (accessed on 29 September 2021).
- Leinweber, P.; Lünsmann, F.; Eckhardt, K.U. Phosphorus Sorption Capacities and Saturation of Soils in Two Regions with Different Livestock Densities in Northwest Germany. Soil Use Manag. 1997, 13, 82–89. [Google Scholar] [CrossRef]
- Abdala, D.B.; Ghosh, A.K.; da Silva, I.R.; de Novais, R.F.; Alvarez Venegas, V.H. Phosphorus Saturation of a Tropical Soil and Related P Leaching Caused by Poultry Litter Addition. Agric. Ecosyst. Environ. 2012, 162, 15–23. [Google Scholar] [CrossRef]
- Limousin, G.; Gaudet, J.P.; Charlet, L.; Szenknect, S.; Barthès, V.; Krimissa, M. Sorption Isotherms: A Review on Physical Bases, Modeling and Measurement. Appl. Geochemistry 2007, 22, 249–275. [Google Scholar] [CrossRef]
- Hinz, C. Description of Sorption Data with Isotherm Equations. Geoderma 2001, 99, 225–243. [Google Scholar] [CrossRef]
- Wang, L.; Liang, T. Effects of Exogenous Rare Earth Elements on Phosphorus Adsorption and Desorption in Different Types of Soils. Chemosphere 2014, 103, 148–155. [Google Scholar] [CrossRef]
- Lai, D.Y.F.; Lam, K.C. Phosphorus Sorption by Sediments in a Subtropical Constructed Wetland Receiving Stormwater Runoff. Ecol. Eng. 2009, 35, 735–743. [Google Scholar] [CrossRef]
- Amarh, F.; Voegborlo, R.B.; Essuman, E.K.; Agorku, E.S.; Tettey, C.O.; Kortei, N.K. Effects of Soil Depth and Characteristics on Phosphorus Adsorption Isotherms of Different Land Utilization Types: Phosphorus Adsorption Isotherms of Soil. Soil Tillage Res. 2021, 213, 105139. [Google Scholar] [CrossRef]
- Shafqat, M.N.; Pierzynski, G.M. The Freundlich Adsorption Isotherm Constants and Prediction of Phosphorus Bioavailability as Affected by Different Phosphorus Sources in Two Kansas Soils. Chemosphere 2014, 99, 72–80. [Google Scholar] [CrossRef]
- Baumann, K.; Shaheen, S.M.; Hu, Y.; Gros, P.; Heilmann, E.; Morshedizad, M.; Wang, J.; Wang, S.L.; Rinklebe, J.; Leinweber, P. Speciation and Sorption of Phosphorus in Agricultural Soil Profiles of Redoximorphic Character. Environ. Geochem. Health 2020, 0123456789. [Google Scholar] [CrossRef] [PubMed]
- Huang, W.; Peng, P.; Yu, Z.; Fu, J. Effects of Organic Matter Heterogeneity on Sorption and Desorption of Organic Contaminants by Soils and Sediments. Appl. Geochemistry 2003, 18, 955–972. [Google Scholar] [CrossRef]
- Ganta, P.B.; Morshedizad, M.; Kühn, O.; Leinweber, P.; Ahmed, A.A. The Binding of Phosphorus Species at Goethite: A Joint Experimental and Theoretical Study. Minerals 2021, 11, 1–18. [Google Scholar] [CrossRef]
- Füleky, G.; Tolner, L. Determination of the Phosphate Content Originally Adsorbed on the Soil by Fitting an Adsorption Isotherm Model. Appl. Ecol. Environ. Res. 2006, 4, 39–45. [Google Scholar] [CrossRef]
- Ahmed, A.A.; Leinweber, P.; Kühn, O. Advances in Understanding the Phosphate Binding to Soil Constituents: A Computational Chemistry Perspective. Sci. Total Environ. 2023, 163692. [Google Scholar] [CrossRef] [PubMed]
- Yan, X.; Wang, D.; Zhang, H.; Zhang, G.; Wei, Z. Organic Amendments Affect Phosphorus Sorption Characteristics in a Paddy Soil. Agric. Ecosyst. Environ. 2013, 175, 47–53. [Google Scholar] [CrossRef]
- Kang, J.; Hesterberg, D.; Osmond, D.L. Soil Organic Matter Effects on Phosphorus Sorption: A Path Analysis. Soil Sci. Soc. Am. J. 2009, 73, 360–366. [Google Scholar] [CrossRef]
- Wang, S.; Jin, X.; Zhao, H.; Zhou, X.; Wu, F. Effect of Organic Matter on the Sorption of Dissolved Organic and Inorganic Phosphorus in Lake Sediments. Colloids Surfaces A Physicochem. Eng. Asp. 2007, 297, 154–162. [Google Scholar] [CrossRef]
- Arai, Y.; Sparks, D.L. Phosphate Reaction Dynamics in Soils and Soil Components: A Multiscale Approach. Adv. Agron. 2007, 94, 135–179. [Google Scholar] [CrossRef]
- Miller, A.P.; Arai, Y. Geoderma E Ff Ects of Extraction Time and Phosphorus Speciation on Soil Test Phosphorus Data : A Case Study of Illinois Agricultural Soils. Geoderma 2017, 305, 62–69. [Google Scholar] [CrossRef]
- van Riemsdijk, W.H.; Lyklema, J. Reaction of Phosphate with Gibbsite (AI(OH)3) beyond the Adsorption Maximum. J. Colloid Interface Sci. 1980, 76, 55–66. [Google Scholar] [CrossRef]
- Gérard, F. Clay Minerals, Iron/Aluminum Oxides, and Their Contribution to Phosphate Sorption in Soils - A Myth Revisited. Geoderma 2016, 262, 213–226. [Google Scholar] [CrossRef]
- Derenne, S.; Nguyen Tu, T.T. Characterizing the Molecular Structure of Organic Matter from Natural Environments: An Analytical Challenge. Comptes Rendus - Geosci. 2014, 346, 53–63. [Google Scholar] [CrossRef]
- Fialho, L.L.; da Silva, W.T.L.; Milori, D.M.B.P.; Simões, M.L.; Martin-Neto, L. Characterization of Organic Matter from Composting of Different Residues by Physicochemical and Spectroscopic Methods. Bioresour. Technol. 2010, 101, 1927–1934. [Google Scholar] [CrossRef] [PubMed]
- Chefetz, B.; Hatcher, P.G.; Hadar, Y.; Chen, Y. Chemical and Biological Characterization of Organic Matter during Composting of Municipal Solid Waste. J. Environ. Qual. 1996, 25, 776–785. [Google Scholar] [CrossRef]



| Soil sample / DOM type | no DOM (control) |
DOM-CPT* (ml kg-1) |
DOM-BD (ml kg-1) |
DOM-CM (ml kg-1) |
DOM-HM (ml kg-1) |
|---|---|---|---|---|---|
| S1 | 0 | 300 | 300 | 300 | 300 |
| S2 | 0 | 520 | 560 | 480 | 520 |
| S3 | 0 | 400 | 480 | 480 | 480 |
| Sample | pH CaCl2 |
pH H2O |
C | N | P | Al | Fe | C:N | C:P | N:P | |
|---|---|---|---|---|---|---|---|---|---|---|---|
| in % | |||||||||||
| S1 | 4.65 | 4.81 | 0.36 | 0.03 | 0.02 | 0.37 | 0.26 | 13.9 | 15.3 | 1.3 | |
| S1-CPT | 4.84 | 5.21 | 0.39 | 0.02 | 0.02 | 0.33 | 0.24 | 19.5 | 17.3 | 0.9 | |
| S1-BD | 5.84 | 6.28 | 0.49 | 0.05 | 0.03 | 0.35 | 0.25 | 10.0 | 18.6 | 1.9 | |
| S1-CM | 5.78 | 6.17 | 0.59 | 0.03 | 0.02 | 0.40 | 0.28 | 17.5 | 23.8 | 1.2 | |
| S1-HM | 5.66 | 6.11 | 0.46 | 0.03 | 0.04 | 0.40 | 0.27 | 18.0 | 11.1 | 0.7 | |
| S2 | 5.65 | 6.03 | 1.29 | 0.12 | 0.05 | 0.58 | 0.60 | 10.6 | 25.4 | 2.4 | |
| S2-CPT | 5.85 | 6.32 | 1.32 | 0.11 | 0.05 | 0.48 | 0.53 | 11.7 | 27.5 | 2.3 | |
| S2-BD | 6.10 | 6.55 | 1.40 | 0.14 | 0.05 | 0.48 | 0.55 | 10.3 | 27.4 | 2.7 | |
| S2-CM | 6.41 | 6.79 | 1.59 | 0.14 | 0.05 | 0.51 | 0.56 | 11.4 | 30.7 | 2.7 | |
| S2-HM | 6.25 | 6.76 | 2.23 | 0.17 | 0.07 | 0.45 | 0.47 | 12.8 | 33.4 | 2.6 | |
| S3 | 6.20 | 6.61 | 1.07 | 0.11 | 0.05 | 0.48 | 0.54 | 9.7 | 21.4 | 2.2 | |
| S3-CPT | 6.28 | 6.66 | 1.14 | 0.11 | 0.05 | 0.47 | 0.50 | 10.4 | 23.5 | 2.4 | |
| S3-BD | 6.38 | 6.72 | 1.21 | 0.12 | 0.05 | 0.45 | 0.50 | 10.1 | 25.4 | 2.5 | |
| S3-CM | 6.49 | 6.83 | 1.25 | 0.11 | 0.05 | 0.54 | 0.53 | 11.0 | 26.1 | 2.3 | |
| S3-HM | 6.40 | 6.80 | 1.70 | 0.15 | 0.07 | 0.51 | 0.51 | 11.4 | 25.4 | 2.2 | |
| Soils | Feox | Alox | Pox | PSC | DPS | ||||
| mg kg-1 |
mmol kg-1 | mg kg-1 |
mmol kg-1 |
mg kg-1 |
mmol kg-1 |
mmol kg-1 |
% | ||
| S1 | 1054.7 | 18.9 | 1301.9 | 48.3 | 191.5 | 6.2 | 43.0 | 18.5 | |
| S2 | 2029.7 | 36.3 | 1021.9 | 37.9 | 464.5 | 15.0 | 55.3 | 40.5 | |
| S3 | 1747.2 | 31.3 | 804.4 | 29.8 | 352.0 | 11.4 | 46.2 | 37.2 | |
| Variable | C | N | pH H2O | pH CaCl2 | Al | Fe | P | C:Al | C:Fe | Al:P | Fe:P | C:P | N:P |
|---|---|---|---|---|---|---|---|---|---|---|---|---|---|
| Kf | -0.53* | -0.60* | -0.66* | -0.60* | -0.46 | -0.33 | -0.66* | -0.52* | -0.5 | 0.82* | 0.43 | -0.28 | -0.30 |
| nf | 0.78* | 0.80* | 0.69* | 0.64* | 0.46 | 0.41 | 0.78* | 0.78* | 0.81* | -0.91* | -0.59* | 0.61* | 0.58* |
| KL | -0.74* | -0.76* | -0.67* | -0.61* | -0.43 | -0.36 | -0.73* | -0.73* | -0.76* | 0.90* | 0.60* | -0.58* | -0.53* |
| Qm | 0.54* | 0.5 | 0.23 | 0.22 | 0.14 | 0.28 | 0.38 | 0.53* | 0.59* | -0.44 | -0.32 | 0.71* | 0.62* |
| MBC | -0.57* | -0.63* | -0.71* | -0.65* | -0.45 | -0.31 | -0.67* | -0.55* | -0.56* | 0.86* | 0.54* | -0.34 | -0.35 |
Disclaimer/Publisher’s Note: The statements, opinions and data contained in all publications are solely those of the individual author(s) and contributor(s) and not of MDPI and/or the editor(s). MDPI and/or the editor(s) disclaim responsibility for any injury to people or property resulting from any ideas, methods, instructions or products referred to in the content. |
© 2023 by the authors. Licensee MDPI, Basel, Switzerland. This article is an open access article distributed under the terms and conditions of the Creative Commons Attribution (CC BY) license (https://creativecommons.org/licenses/by/4.0/).


