Submitted:
28 August 2023
Posted:
30 August 2023
You are already at the latest version
Abstract
Keywords:
1. Introduction
2. Materials and Methods
| Sjogren’s Syndrome (n = 34) | |
|---|---|
| Male/female ratio | 2/32 |
| Age, years, median (IQR) | 46 [41; 55] |
| Disease duration (years), median (IQR) | 8 [2,5; 11] |
| ESSDAI, median (IQR) | 5 [2; 9] |
| ESSPRI, median (IQR) | 6,7 [5,6; 7,3] |
| Clinical manifestations / ESSDAI domain (percentage) | |
| Constitutional domain | 5 (14,7) |
| Lymphadenopathy and lymphoma domain | 6 (17,7) |
| Glandular domain | 5 (14,7) |
| Articular domain | 17 (50) |
| Cutaneous domain | 5 (14,7) |
| Pulmonary domain | 2 (5,8) |
| Renal domain | 0 |
| Muscular domain | 2 (5,8) |
| PNS domain | 4 (11,6) |
| Central nervous system domain | 0 |
| Haematological domain | 14 (41,2) |
| Biological domainSchirmer test, mm/5 min., median (IQR)Unstimulated sialometry, ml/15 min., median (IQR) | 3 (9,7)3 [1; 9]1,5 [1;3] |
| Laboratory manifestations (percentage) | |
| Complement C3 levels below the lower limit of normal value | 6 (17,6) |
| Complement C4 levels below the lower limit of normal value | 3 (8,7) |
| Anti-DNA Ab | 4 (11,8) |
| Rheumathoid factor | 10 (29,4) |
| Ro-52 Ab | 20 (58,8) |
| SSA Ab | 25 (73,5) |
| SSB Ab | 10 (29,4) |
| CENT B Ab | 2 (5,8) |
| Medications | 28 (82,4) |
| Prednisone dose, mg/day, median (IQR) | 3,75 [0,0; 10,0] |
| Hydroxychloroquine (percentage) | 23 (67,7) |
| Azathioprine (percentage) | 1 (2,9) |
| Cyclosporine (percentage) | 1 (2,9) |
| Mycophenolate mofetil (percentage) | 1 (2,9) |
| Leflunomide (percentage) | 2 (5,8) |
| Methotrexate (percentage) | 5 (14,7) |
2.2. Laboratory and Pathological Determination
2.3. Sample Collection
2.4. Immunophenotyping of Peripheral Blood CD8+ T Cell Subset Maturation Stages and ‘Polarized’ CD8+ T Cell Subsets
2.5. Cytokine and Chemokine Measurement
2.6. Statistical Analysis
3. Results
3.1. Main Peripheral Blood CD3+ T Cell Subsets in Patients with Sjögren’s Syndrome
3.2. Alterations in CD8+ T Cell Maturation Subsets in Patients with Sjögren’s Syndrome
3.3. Imbalance in EM and TEMRA CD8+ T Cell Subsets Inpatients with Sjögren’s Syndrome
3.4. Imbalance in Peripheral Blood CD8+ T cells ‘Polarization’ in Patients with Sjögren’s Syndrome
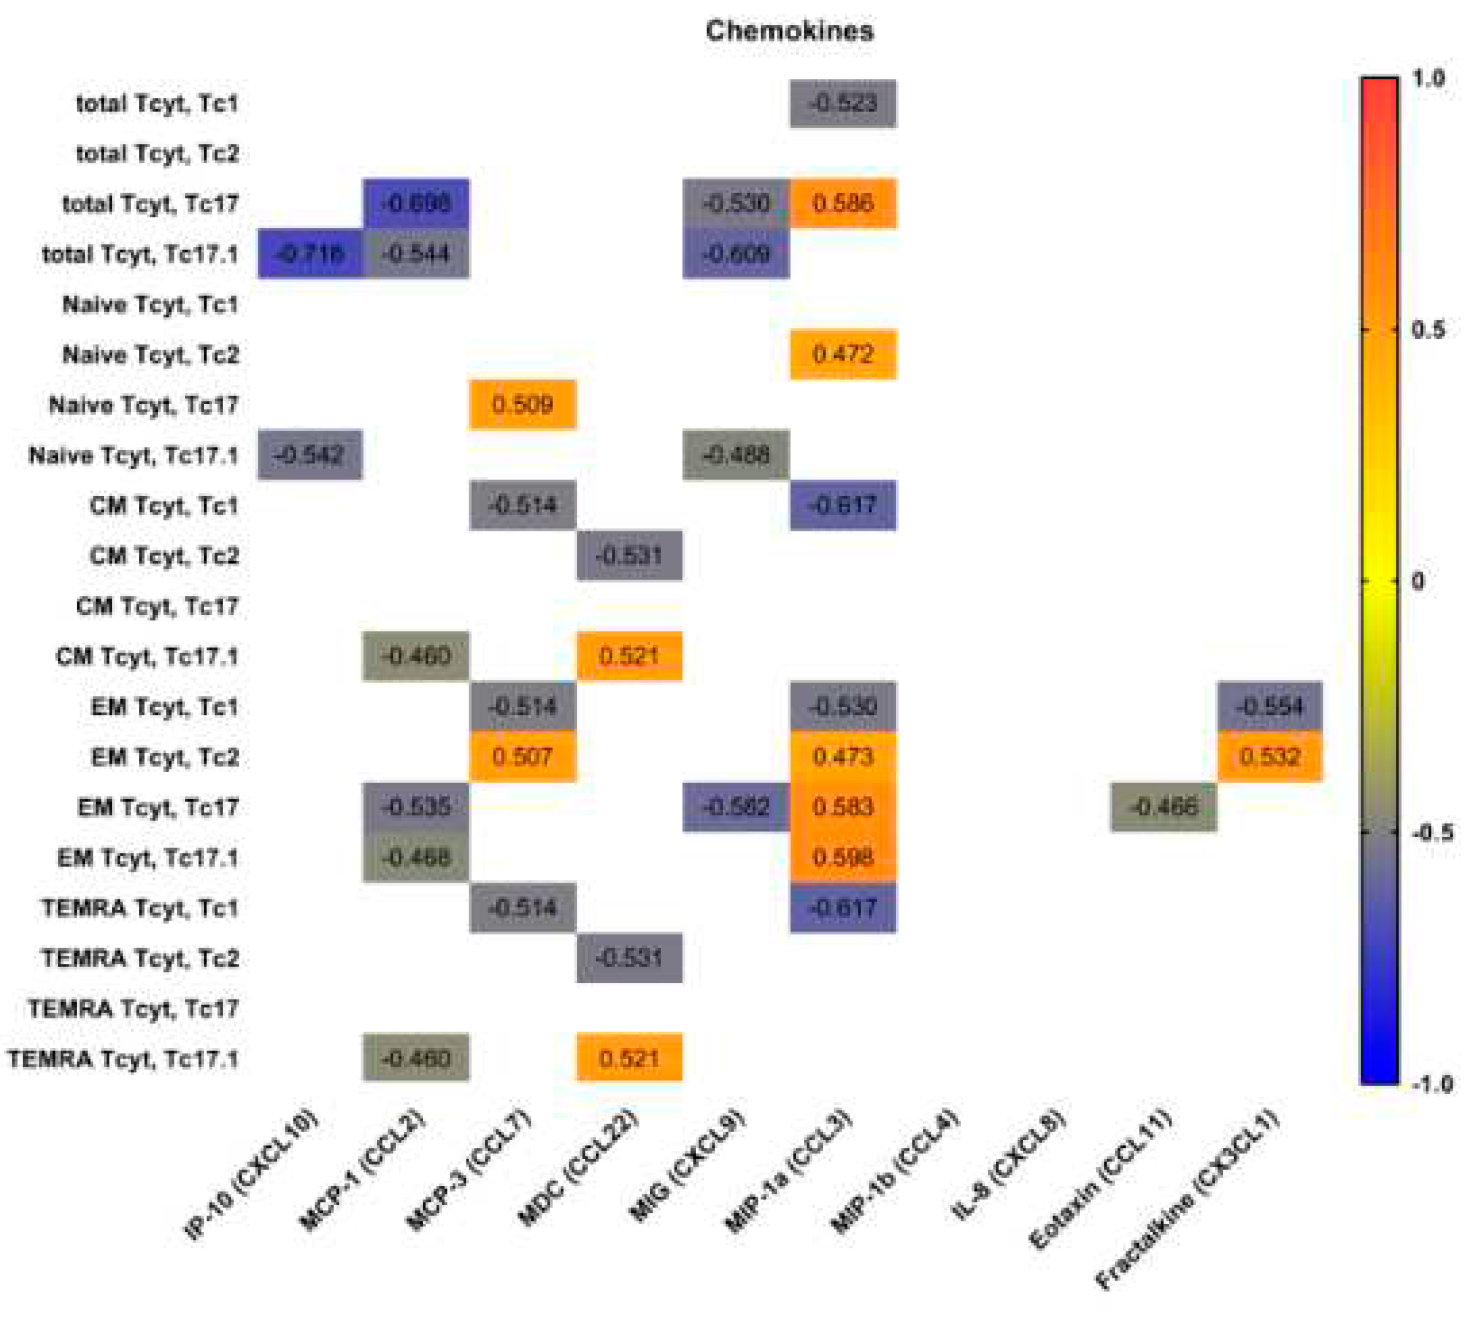
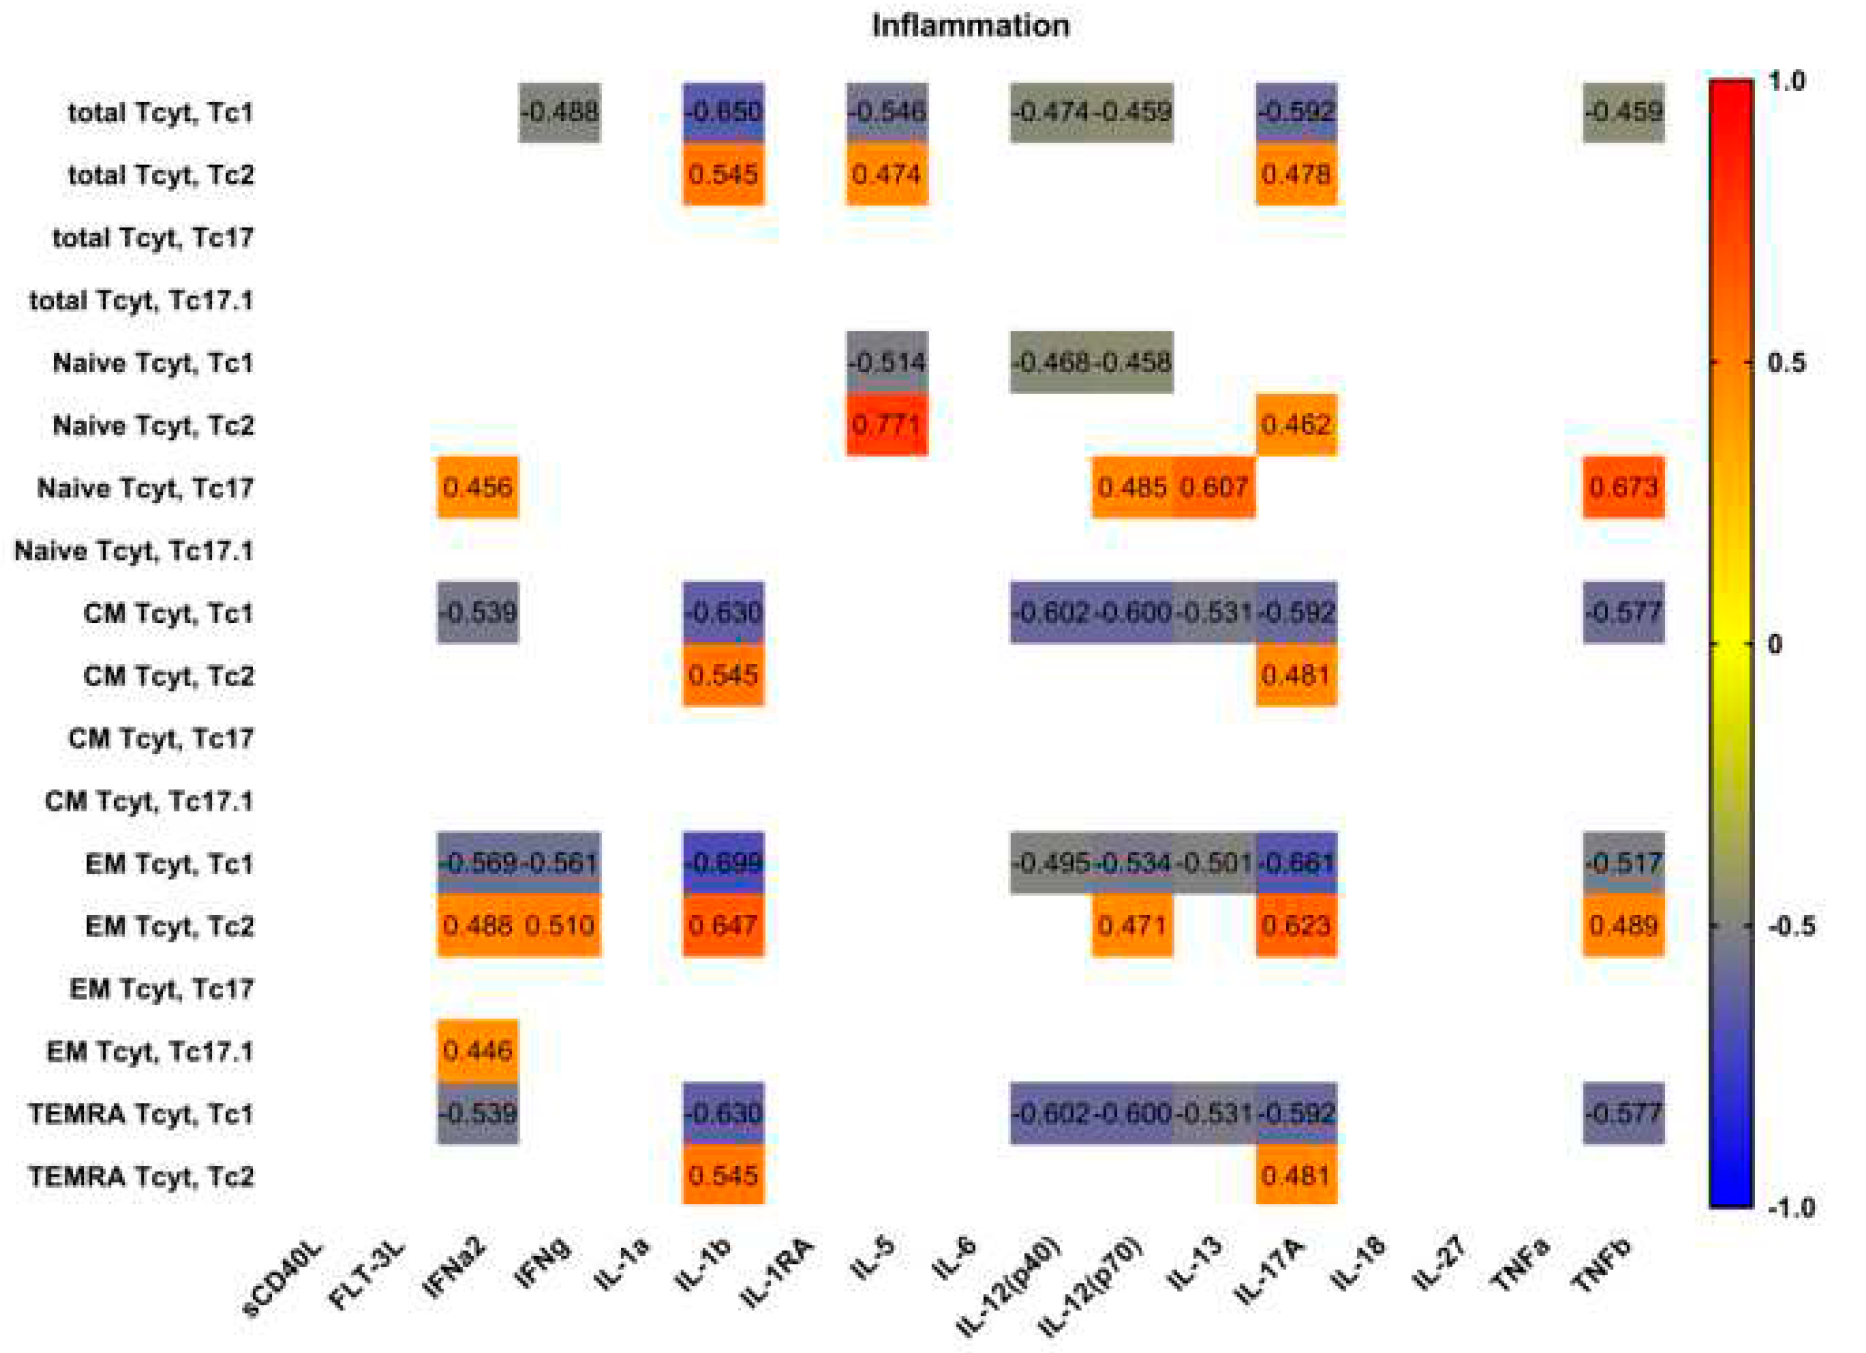
3.5. Blood Level of ‘Polarized’ CD8+ T Cell Subsets and Correlations with Cytokines and Chemokines
4. Discussion
6. Conclusions
Author Contributions
Funding:
Institutional Review Board Statement
Informed Consent Statement
Data Availability Statement
Conflicts of Interest
References
- Gary S. Firestein, Ralph C Budd, Sherine E. Gabriel, Iain B. McInnes, James R. O’Dell,Kelley and Firestein’s Textbook of Rheumatology, 10th ed.Elsevier Health Sciences,Philadelphia, USA, 2017,pp. 1221- 1244.
- Nocturne, G. , & Mariette, X. B cells in the pathogenesis of primary Sjögren syndrome. Nature Reviews Rheumatology, 2018, 14, 133–145. [Google Scholar] [PubMed]
- Fisher, B. A. , Brown, R. M. et al. A review of salivary gland histopathology in primary Sjögren’s syndrome with a focus on its potential as a clinical trials. Ann Rheum Dis, 2015, 74, 1645–1650. [Google Scholar] [CrossRef] [PubMed]
- Kassan, S.S.; Moutsopoulos, H.M. Clinical manifestations and early diagnosis of Sjogren syndrome. Arch. Intern. Med. 2004, 164, 1275–1284. [Google Scholar] [CrossRef] [PubMed]
- Zhou H, Yang J, et al. CD8+ T Lymphocytes: Crucial Players in Sjögren’s Syndrome. Front. Immunol. 2021 11:602823.
- Jennifer, Y. Barr, Xiaofang Wang et al. CD8 T cells contribute to lacrimal gland pathology in the nonobese diabetic mouse model of Sjögren syndrome. Immunol Cell Biol. 2017, 95, 684–694. [Google Scholar]
- Mingueneau M, Boudaoud S, Haskett S, et al. Cytometry by time-of-flight immunophenotyping identifies a blood Sjögren’s signature correlating with disease activity and glandular inflammation. J Allergy Clin Immunol. 2016, 137, 1809–1821. [Google Scholar] [CrossRef]
- Fujihara T, Fujita H, Tsubota K, et al. Preferential localization of CD8+ alpha E beta 7+ T cells around acinar epithelial cells with apoptosis in patients with Sjögren’s syndrome. J Immunol. 1999, 163, 2226–2235. [Google Scholar] [CrossRef]
- Kaneko N, Chen H, Perugino CA, et al. Cytotoxic CD8+ T cells may be drivers of tissue destruction in Sjögren’s syndrome. Sci Rep. 2022, 12, 15427. [Google Scholar] [CrossRef]
- Zhang X, Schaumburg CS, Coursey TG, Siemasko KF, Volpe EA, Gandhi NB, et al. CD8(+) cells regulate the T helper-17 response in an experimental murine model of Sjogren syndrome. Mucosal Immunol 2014, 7, 417–27. [Google Scholar] [CrossRef]
- Caroline, H. Shiboski, Stephen C. Shiboski, Raphaèle Seror, et al. ACR-EULAR Classification Criteria for primary Sjögren’s Syndrome: A Consensus and Data-Driven Methodology Involving Three International Patient Cohorts. Arthritis Rheumatol. 2017, 69, 35–45. [Google Scholar]
- : Seror R, Bowman SJ, Brito-Zeron P, et al. EULAR Sjögren’s syndrome disease activity index (ESSDAI): a user guide. RMD Open 2015, 1, e000022. [Google Scholar] [CrossRef]
- Seror R, Ravaud P, Mariette X, et al. EULAR Sjögren’s Syndrome Patient Reported Index (ESSPRI): development of a consensus patient index for primary Sjögren’s syndrome. Annals of the Rheumatic Diseases 2011, 70, 968–972. [Google Scholar] [CrossRef] [PubMed]
- Navazesh M, Kumar SKS. Measuring salivary flow. Dent Assist J. 2008, 139, 35S–40S. [Google Scholar]
- Kudryavtsev, I.V.; Arsentieva, N.A.; Korobova, Z.R.; Isakov, D.V.; Rubinstein, A.A.; Batsunov, O.K.; Khamitova, I.V.; Kuznetsova, R.N.; Savin, T.V.; Akisheva, T.V.; et al. Heterogenous CD8+ T Cell Maturation and ‘Polarization’ in Acute and Convalescent COVID-19 Patients. Viruses 2022, 14, 1906. [Google Scholar] [CrossRef] [PubMed]
- Kalinina, O.; Golovkin, A.; Zaikova, E.; Aquino, A.; Bezrukikh, V.; Melnik, O.; Vasilieva, E.; Karonova, T.; Kudryavtsev, I.; Shlyakhto, E. Cytokine Storm Signature in Patients with Moderate and Severe COVID-19. Int. J. Mol. Sci. 2022, 23, 8879. [Google Scholar] [CrossRef]
- Sallusto, F; Lenig, D; Förster, R; Lipp, M; Lanzavecchia, A. Two subsets of memory T lymphocytes with distinct homing potentials and effector functions. Nature. 1999, 401, 708–712. [Google Scholar] [CrossRef]
- Romero, P.; Zippelius, A.; Kurth, I.; Pittet, M.J.; Touvrey, C.; Iancu, E.M.; Corthesy, P.; Devevre, E.; Speiser, D.E.; Rufer, N. Four functionally distinct populations of human effector-memory CD8+ T lymphocytes. J. Immunol. 2007, 178, 4112–4119. [Google Scholar] [CrossRef]
- Rufer N, Zippelius A, Batard P, Pittet MJ, Kurth I, Corthesy P, Cerottini JC, Leyvraz S, Roosnek E, Nabholz M, Romero P. Ex vivo characterization of human CD8+ T subsets with distinct replicative history and partial effector functions. Blood. 2003, 102, 1779–87. [Google Scholar] [CrossRef]
- Koch S, Larbi A, Derhovanessian E, Ozcelik D, Naumova E, Pawelec G. Multiparameter flow cytometric analysis of CD4 and CD8 T cell subsets in young and old people. Immun Ageing. 2008, 5, 6. [Google Scholar] [CrossRef] [PubMed]
- Loyal L, Warth S, Jürchott K, Mölder F, Nikolaou C, Babel N, Nienen M, Durlanik S, Stark R, Kruse B, Frentsch M, Sabat R, Wolk K, Thiel A. SLAMF7 and IL-6R define distinct cytotoxic versus helper memory CD8+ T cells. Nat Commun. 2020, 11, 6357. [Google Scholar] [CrossRef]
- Trombke, J.; Loyal, L.; Braun, J.; Pleyer, U.; Thiel, A.; Pohlmann, D. Analysis of peripheral inflammatory T cell subsets and their effector function in patients with Birdshot Retinochoroiditis. Sci. Rep. 2021, 11, 8604. [Google Scholar] [CrossRef]
- Gschwandtner M, Derler R, Midwood KS. More Than Just Attractive: How CCL2 Influences Myeloid Cell Behavior Beyond Chemotaxis. Front Immunol. 2019, 10, 2759. [Google Scholar] [CrossRef] [PubMed]
- Chang TT, Chen C, Chen JW. CCL7 as a novel inflammatory mediator in cardiovascular disease, diabetes mellitus, and kidney disease. Cardiovasc Diabetol. 2022, 21, 185. [Google Scholar] [CrossRef] [PubMed]
- Schaller TH, Batich KA, Suryadevara CM, Desai R, Sampson JH. Chemokines as adjuvants for immunotherapy: implications for immune activation with CCL3. Expert Rev Clin Immunol. 2017, 13, 1049–1060. [Google Scholar] [CrossRef] [PubMed]
- Annunziato F, Romagnani C, Romagnani S. The 3 major types of innate and adaptive cell-mediated effector immunity. J Allergy Clin Immunol. 2015, 135, 626–35. [Google Scholar] [CrossRef] [PubMed]
- Martin-Gutierrez L, Peng J, Thompson NL, Robinson GA, Naja M, Peckham H, Wu W, J’bari H, Ahwireng N, Waddington KE, Bradford CM, Varnier G, Gandhi A, Radmore R, Gupta V, Isenberg DA, Jury EC, Ciurtin C. Stratification of Patients With Sjögren’s Syndrome and Patients With Systemic Lupus Erythematosus According to Two Shared Immune Cell Signatures, With Potential Therapeutic Implications. Arthritis Rheumatol. 2021, 73, 1626–1637. [Google Scholar] [CrossRef]
- Narkeviciute I, Sudzius G, Mieliauskaite D, Mackiewicz Z, Butrimiene I, Viliene R, Dumalakiene I. Are cytotoxic effector cells changes in peripheral blood of patients with Sjögren’s syndrome related to persistent virus infection: Suggestions and conundrums. Cell Immunol. 2016, 310, 123–130. [Google Scholar] [CrossRef]
- Mingueneau M, Boudaoud S, Haskett S, Reynolds TL, Nocturne G, Norton E, Zhang X, Constant M, Park D, Wang W, Lazure T, Le Pajolec C, Ergun A, Mariette X. Cytometry by time-of-flight immunophenotyping identifies a blood Sjögren’s signature correlating with disease activity and glandular inflammation. J Allergy Clin Immunol. 2016, 137, 1809–1821. [Google Scholar] [CrossRef]
- Sudzius G, Mieliauskaite D, Siaurys A, Viliene R, Butrimiene I, Characiejus D, Dumalakiene I. Distribution of Peripheral Lymphocyte Populations in Primary Sjögren’s Syndrome Patients. J Immunol Res. 2015, 2015, 854706. [Google Scholar]
- Li H, Zhou Y, Wang P, Wang Y, Feng Y, Zhang Y, Wu Z. Alterations of CD8+ T cells in the blood and salivary glands of patients with primary Sjögren’s syndrome. Clin Rheumatol. 2023 May, 42, 1327-1338. 1327.
- Murata O, Suzuki K, Takeuchi T. Thymus variants on imaging of patients with primary Sjögren’s syndrome and polymyositis/dermatomyositis: clinical and immunological significance. Immunol Med. 2023, 46, 25–31. [Google Scholar] [CrossRef]
- Kobayashi H, Ozeki Y, Aida S. Pulmonary and thymic lymphoid hyperplasia in primary Sjögren’s syndrome. Jpn J Radiol. 2009, 27, 107–10. [Google Scholar] [CrossRef]
- Kondo K, Miyoshi T, Sakiyama S, Shimosato Y, Monden Y. Multilocular thymic cyst associated with Sjögren’s syndrome. Ann Thorac Surg. 2001, 72, 1367–9. [Google Scholar] [CrossRef] [PubMed]
- Xin Y, Cai H, Li Y, Cui Y. Thymic hyperplasia associated with primary Sjogren’s syndrome cured by thymectomy. J Thorac Dis. 2017, 9, E130–E132. [Google Scholar] [CrossRef] [PubMed]
- Minato H, Kinoshita E, Nakada S, Nojima T, Tanaka M, Usuda K, Sagawa M, Iwao H, Tanaka M, Doai M, Takahashi T, Shibata N. Thymic lymphoid hyperplasia with multilocular thymic cysts diagnosed before the Sjögren syndrome diagnosis. Diagn Pathol. 2015, 10, 103. [Google Scholar] [CrossRef] [PubMed]
- Izumi H, Nobukawa B, Takahashi K, Kumasaka T, Miyamoto H, Yamazaki A, Sonobe S, Uekusa T, Suda K. Multilocular thymic cyst associated with follicular hyperplasia: clinicopathologic study of 4 resected cases. Hum Pathol. 2005, 36, 841–4. [Google Scholar] [CrossRef]
- Narkeviciute I, Sudzius G, Mieliauskaite D, Mackiewicz Z, Butrimiene I, Viliene R, Dumalakiene I. Are cytotoxic effector cells changes in peripheral blood of patients with Sjögren’s syndrome related to persistent virus infection: Suggestions and conundrums. Cell Immunol. 2016, 310, 123–130. [Google Scholar] [CrossRef]
- Nizharadze T, Becker NB, Höfer T. Quantitating CD8+ T cell memory development. Trends Immunol. 2023, 44, 519–529. [Google Scholar] [CrossRef]
- Mittrücker HW, Visekruna A, Huber M. Heterogeneity in the differentiation and function of CD8+ T cells. Arch Immunol Ther Exp (Warsz). 2014, 62, 449–58. [Google Scholar] [CrossRef]
- Jing Zhou, Toshihisa Kawai, and Qing Yu. Pathogenic role of endogenous TNF-α in the development of Sjögren’s-like sialadenitis and secretory dysfunction in nonobese diabetic mice. Lab Invest. 2017, 97, 458–467. [Google Scholar] [CrossRef]
- N M Moutsopoulos 1, G E Katsifis, N Angelov, R A Leakan, V Sankar, S Pillemer, S M Wahl. Lack of efficacy of etanercept in Sjögren syndrome correlates with failed suppression of tumour necrosis factor alpha and systemic immune activation. Ann Rheum Dis. 2008, 67, 1437–43.
- Yoon KC, Park CS, You IC, Choi HJ, Lee KH, Im SK, Park HY, Pflugfelder SC. Expression of CXCL9, -10, -11, and CXCR3 in the tear film and ocular surface of patients with dry eye syndrome. Invest Ophthalmol Vis Sci. 2010, 51, 643–50. [Google Scholar] [CrossRef]
- Martínez Allo VC, Hauk V, Sarbia N, Pinto NA, Croci DO, Dalotto-Moreno T, Morales RM, Gatto SG, Manselle Cocco MN, Stupirski JC, Deladoey Á, Maronna E, Marcaida P, Durigan V, Secco A, Mamani M, Dos Santos A, Catalán Pellet A, Pérez Leiros C, Rabinovich GA, Toscano MA. Suppression of age-related salivary gland autoimmunity by glycosylation-dependent galectin-1-driven immune inhibitory circuits. Proc Natl Acad Sci U S A. 2020, 117, 6630–6639. [Google Scholar] [CrossRef] [PubMed]
- Michael, St. Paul1,2 and Pamela S. Ohashi1,2,* The Roles of CD8+ T Cell Subsets in Antitumor Immunity. Trends Cell Biol 2020, 30, 695–704. [Google Scholar]
- Cho BA, Sim JH, Park JA, Kim HW, Yoo WH, Lee SH, Lee DS, Kang JS, Hwang YI, Lee WJ, Kang I, Lee EB, Kim HR. Characterization of effector memory CD8+ T cells in the synovial fluid of rheumatoid arthritis. J Clin Immunol. 2012, 32, 709–20. [Google Scholar] [CrossRef] [PubMed]
- Huber M, Heink S, Pagenstecher A, Reinhard K, Ritter J, Visekruna A, Guralnik A, Bollig N, Jeltsch K, Heinemann C, Wittmann E, Buch T, Prazeres da Costa O, Brüstle A, Brenner D, Mak TW, Mittrücker HW, Tackenberg B, Kamradt T, Lohoff M. IL-17A secretion by CD8+ T cells supports Th17-mediated autoimmune encephalomyelitis. J Clin Invest. 2013, 123, 247–60. [Google Scholar] [CrossRef]

Disclaimer/Publisher’s Note: The statements, opinions and data contained in all publications are solely those of the individual author(s) and contributor(s) and not of MDPI and/or the editor(s). MDPI and/or the editor(s) disclaim responsibility for any injury to people or property resulting from any ideas, methods, instructions or products referred to in the content. |
© 2023 by the authors. Licensee MDPI, Basel, Switzerland. This article is an open access article distributed under the terms and conditions of the Creative Commons Attribution (CC BY) license (http://creativecommons.org/licenses/by/4.0/).


