Preprint
Article

RHIZOPHORA MANGLE as a Bioindicator of Environmental Exposure to Heavy Metals in the Navachiste Lagoon Complex, Sinaloa, Mexico

Submitted:

29 August 2023

Posted:

30 August 2023

You are already at the latest version

Abstract
The objective of this work was to analyze the potential of Rhizophora mangle as a bioindicator of seven heavy metals, Fe, Cu, Zn, Mn, Ni, Cr, and Cd, in the mangrove sediments of the Navachiste lagoon complex (NAV). The concentration of trace metals (TM) in sediments and tis-sues (leaf, stembark, and root of R. mangle) were determined by digestion with nitric acid (HNO3), whereas the metal absorbance was measured by atomic absorption spectrophotometry with an air-acetylene flame. The enrichment factor, the bioavailable fraction, the seasonal varia-tion of heavy metal concentrations and their correlation with those determined in R. mangle tissues were assessed. Metal concentrations found in sediments were as following: Fe>Mn>Zn>Cr>Ni>Cu>Cd, and for tissues: Mn>Fe>Zn>Cu>Cr>Ni>Cd, and regarding the roots, the findings were as following: Fe>Mn>Zn>Cu>Cr>Ni>Cd. The highest trace metal concentra-tions were correlated with silt, clay, and organic matter in sediments with basic pH. The highest salinities were found adjacent to R. mangle trees. Of all the trace metals analyzed, there was only a positive linear regression between the bioavailability of Mn in the sediment with the concen-tration of Mn in leaf tissue consistently throughout the year. The Cu bioavailability in the sedi-ment showed similar positive linear regressions except for winter, where it did not show this pattern. These results suggest that the concentrations of Mn and Cu in the R. mangle leaf could be a potential bioindicator of environmental exposure to anthropogenic sources of contamination by these trace metals in sediments
Keywords: 
Subject: 
Biology and Life Sciences  -   Toxicology

1. Introduction

Worldwide mangrove coverage has been estimated to be over 154,000 km2 [1]. In Mexico, more than 775,000 ha of mangrove forests have been recorded [2]; in the Navachiste lagoon complex (NAV), there are about 12,000 ha of mangrove forest, in which Avicennia germinans, Laguncularia racemosa, Rhizophora mangle and Conocarpus erectus species predominate [3]. The sediments of these ecosystems provide various environmental benefits, among the most important is the mitigation of pollution through the retention of pollutants [4]. This plays an important role because tracer metals (TM) residues are among the most critical pollutants due to their persistence and toxicity. Mangrove trees have physiological capacities to adsorb metal ions through sediment biosorption and accumulation of metal ions in their tissues [5,6].
Several mangrove species of the genus Rhizophora have been reported as organisms with the capacity to retain persistent pollutants, such as polycyclic aromatic hydrocarbons (PAHs) and trace metal residues, in their tissues [7,8,9]. Therefore, the present work determined the potential of Rhizophora mangle as a bioindicator of seven heavy metals, Fe, Cu, Zn, Mn, Ni, Cr, and Cd, in the mangrove sediments of the NAV lagoon complex.

2. Materials and Methods

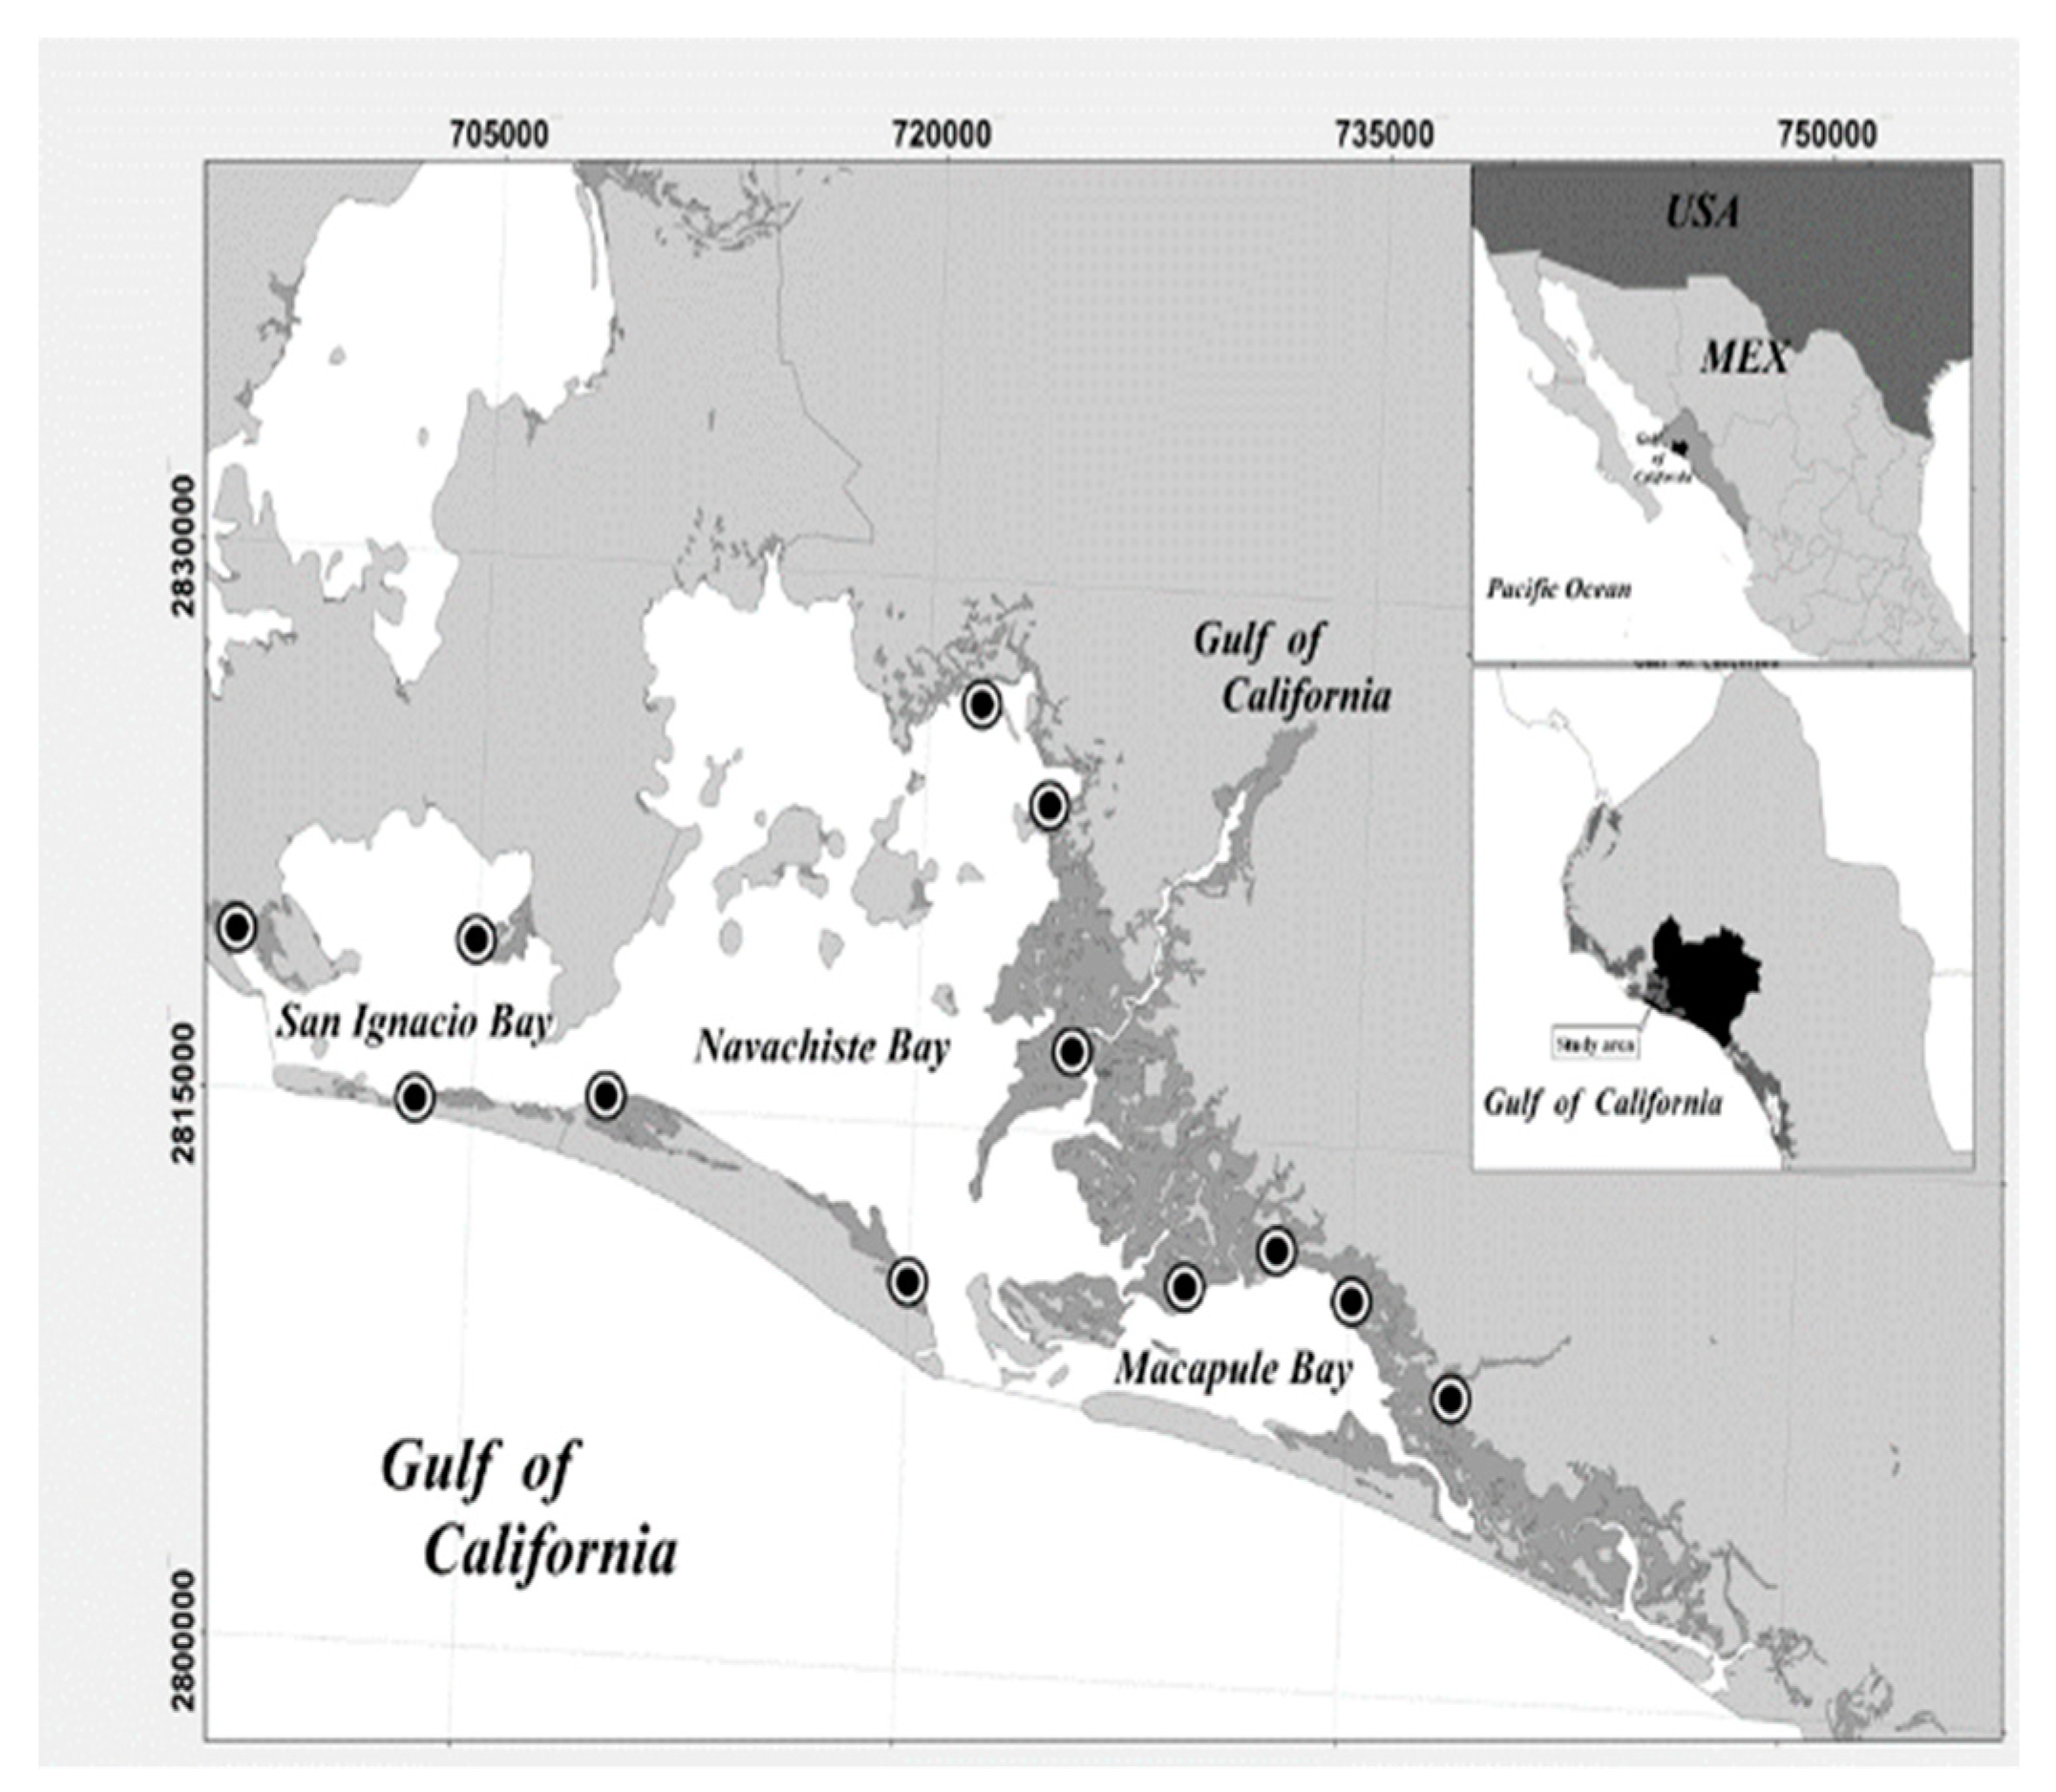
The NAV mangrove ecosystem is listed as RAMSAR #1826 in 2008 [10]. It is located in the southeastern part of the Gulf of California where mangrove species [3] (Figure 1). To determine the capacity of R. mangle as a heavy metal contamination bioindicator, sediment samples within the NAV lagoon complex were collected in four points adjacent to mangrove tree roots in areas with high density of R. mangle tree roots in areas with high density of R. mangle trees. At each point, a sediment sample was taken during the months of March, June, September, and December of 2013 using a Peterson-type dredge in places deeper than 1 m or by hand in shallow places. Also, three R. mangle trees taller than 1 m were selected from which 3 stem samples, 3 root samples, and 3 leaf samples (of 20 pieces each, and were green without lesions). Submerged root samples were taken (> 2.5 cm depth), as well as the stem samples, with the help of a with the help of a stainless-steel knife to extract the tissue from the internal part of the samples. The samples were stored in previously labeled polyethylene bags, kept in a cooler (~ 4°C), until their processing in the laboratory (Figure 1). All collection sites were georeferenced (Garmin® GPS); trees were marked with a red tape for identification and the physicochemical values of temperature, pH, and water salinity were recorded using a HANNA® HI-9828 multiparameter (HANNA Instruments, USA).

2.1. Sample analysis

Sediment samples were oven dried at 45°C. Each sample was divided into two parts, one for granulometric analysis and the other was homogenized in a porcelain mortar to analyze heavy metals and organic matter. Root, stem, and leaf samples were dried separately in a stove at 60°C and processed with a grain crusher for acid digestion.
The textural characteristics of the sediment were determined according sieving technique to Tucker and Jones [11]. The first 50 g of sediment dry samples were placed in 63, 105, 125, 149, 250 500- µm separated sieves, with a size between 1 and 4.75 mm. The sieves were placed in a RO-TAP sieve shaker and shaken for 10 min. Then, the sediment retained in each sieve was weighed and the percentage of sand, silt, and clay was determined:
          X φ = f m n  
where, f = weight percent for each grain size class, m = number of grain size classes, n = 100 when f is in percent.
For the texture according to Bouyoucos method [12], sediment dry was weighed, 60 g of fine or 120 g of coarse textured, and placed in a beaker (500 mL) and added 40 mL of hydrogen peroxide (H2O2) at 30% were added and the dry was carried out (the process is repeated until there is no reaction to hydrogen peroxide). Subsequently, the dry soil without organic matter was weighed (50 g for clayey texture or 100 g for sandy texture), placed in a 250 mL beaker, and added distilled water until the surface was covered with a 2-cm sheet, and was add 25 mL of sodium hexametaphosphate, 5 mL of sodium oxalate and 5 mL of sodium metasilicate, and left to settle for 5 min to be mechanically stirred by 5 min. The content was poured into a 1 L cylinder with a hydrometer inside, adding distilled water until reaching 1000 mL and out hydrometer, and stirred 10 times with a stirring rod to homogenize. The readings with hydrometer of the samples were made at 40 s for the separation of particles larger than 0.05 mm (sand) and at 2 h for particles with a diameter larger than 0.002 mm (silt and sand). The temperature was taken and for each degree centigrade variation of 19.5°C it was corrected with 0.36 (adding/subtracting). The estimation of sand, silt, and clay was calculated using the corrected data and the following equations (Eqs. 2, 3, 4, and 5):
C l a y + S i l t   % = ( L 1   × 2 ) × 100  
S a n d   % = % Clay   + Silt 100
C l a y   % = L 2 × 2 × 100
S i l t   % = %   S a n d %   C l a y
where, L1 = reading at 40 s, L 2 = reading after 2 h, T1 = temperature at 40 s, and T2 = temperature after 2 h.
Organic matter (OM) was determined by oxidation of organic carbon [13], taking 0.5 g of each sample, straining them through a 0.5-mm sieve with a 10-mL solution of potassium dichromate (1 N, K2Cr2O7) and added 20 mL of sulfuric acid (H2SO4) letting them rest for 30 min on asbestos sheet or wood. Later they were added 200 mL of distilled water, and added 5 mL of phosphoric acid (H3PO4), then adding 5 to 10 drops of the diphenylamine indicator (0.5 g of diphenylamine in 20 mL of distilled water and 100 mL of H2SO4). The sample was titrated with ferrous sulfate (278 g of FeSO4.7H2O in distilled water with 80 mL of H2SO4) until reaching a light green color. A blank sample was processed in triplicate for every 10 samples analyzed, detecting between 70% and 84% of the organic matter (OM), for which a correction factor of 1.298 (1/0.77) was introduced and, finally, determining the percentage of organic carbon using the following equation (eq. 6):
C o r g a n i c   % = B T g   N 0.39   m c f
where, B = volume of ferrous sulfate spent to titrate the white solution (ml), T = ferrous sulfate spent to titrate the sample (ml), N = exact normality of ferrous sulfate, g = weight of sample used (g), and mcf = moisture correction factor. Once the percentage of organic carbon was obtained, the percentage of OM was determined (Eq. 7):
O r g a n i c   m a t t e r = C o r g a n i c × 1.274

2.2. Sediment metal concentration

Using the Breder [14] technique, after acid digestion, each sample was placed in an Erlenmeyer flask (500 ml) with 5 ml of aqua regia (1:3, hydrogen chloride: nitric acid). The flasks were placed on heating plates, and the reaction was allowed to reflux (6-7 hr) until dry. After three h of digestion, aqua regia (5 ml) was added to the sediments for the total extraction of the trace metals (TM). The digested samples were allowed to cool, reaching close to dryness, and for their conservation they were placed in polypropylene tubes inside a volumetric flask (50 ml) with deionized water.
The metal concentration in R. mangle tissues obtained a correlation coefficient of 0.999 in the Cu, Zn, Mn, and Fe calibration curves of the certified reference standards of marine sediment (PACS-2, MESS-3), spinach leaves (1570a), and recovery percentages between 93% and 120% for PACS-2 and 100% for MESS-3 75 (NRC SRM Marine Sediment) and between 75% and 100% for 1570a (NIST SRM Trace Elements in Spinach Leaves).

2.3. Bioavailable fraction

Following the technique described by Luoma and Bryan [15] modified by Szefer, et al. [16] a sample of dry and homogenized sediment (1 g) was taken, placed in an Erlenmeyer flask (50 ml), then supplemented with 1 N HCl (10 ml) and left stirring for 15 min in an ultrasonic bath. The solution was stored in test tubes (15 ml) and allowed to settle to later calculate the metal content. With individual dry samples (0.5 g) of root, stem, and leaf of R. mangle, the concentration of metals was calculated from the acid digestion and homogenized in Erlenmeyer flasks (500 ml), to which 5 ml of concentrated nitric acid (HNO3) were added. The flasks were placed on reflux heating plates (4-5 h) until cool and then stored in polypropylene tubes with 50 ml of deionized water.
Subsequently, tissue or sediment samples were analyzed using an atomic spectrophotometer AVANTA GBC ® (GBC Scientific Equipment, Keysborough, Australia) with an air/acetylene flame burner. Calibration curves were made with Perkin Elmer® (Perkin Elmer, Inc., Waltham, MA, US) certified standards for Cu, Zn, Mn, Fe, Ni, and Cr at temperatures between 2100 and 2400°C. Six calibration curves (0.125, 0.25, 0.5, 1, 2, and 4 mg L-1) were prepared, calculating the absorbance with individual hollow cathode lamps and a specific wavelength, calculating the individual concentrations of each sample (Eq. 8). The absorbances of each element were processed in Microsoft Excel® 2010.
X = Y b a   × V w
where, X = concentration of metals; Y = absorbance of the samples; a = slope (absorbance coefficient); b = intersection with the Y axis; V = volume of the digested sample; and W = dry weight of the sample.
The reliability of the technique was validated using blanks, analysis of duplicate samples and with certified reference materials. Sedimentary reference materials were SRM MESS-03 and PACS-2 (National Research Council of Canada Marine Sediment Reference Materials for Trace Metals and Other Constituents). For R. mangle tissue, the spinach leaf reference material SRM 1570a (Trace Metals in Spinach Leaf from the National Institute of Standards and Technology) was used. The samples with values below the detection limit and the concentrations of Cd and Sc were determined by inductive emission spectrophotometry coupled with plasma, using a Perkin Elmer ® brand ICP-AES, with the spectral lines of 228.802 nm (Cd), 267.716 nm (Cr), 361.383 nm (Sc), 327.393 (Cu), and 231.604 nm (Ni).

2.4. Sediment metal enrichment factor (EF)

Scandium was used as the normalizing element and, for reference, we used the average values of the continental crust determined by Taylor in 1964. We performed calculations with the formula described by Windom, et al. [17] (Eq. 9):
E F = M i E i M r E r
where, M1 = Metal “x” concentration in the sediment sample; E1 = Fe concentration in the sediment sample; Mr = Concentration of metal “x” in the earth's crust; Er = Fe concentration in the earth´s crust
The reference intervals were ≤ 2 as a conservative element, 2 < Fe ≤ 10 as an enriched element, and > 10 as a highly enriched element.

2.5. Statistical analysis

Differences between metal concentrations in sediments and tissue sample were determined per season using the ANOVA test (p ˂ 0-05, α = 0.05). In case of significant differences, the Tukey HSD test was applied with multiple comparisons of Scheffé, Bonferroni, and Holm (p > 0,05, α = 0,05) [18]. The Pearson test (p ˂ 0.05) was used to determine the correlations between metal concentrations in sediment's size, OM, and the seawater's salinity, temperature, and oxygen per collecting site [19].

3. Results

3.1. Bioavailable fraction of metal

The bioavailable fraction (BioF) of Cu in the sediment showed a strong significant correlation in summer with the concentration of Cu in leaves. The concentration of Mn in leaves showed a significant correlation with the BioF of the sediment throughout the whole year, and the concentration in the root during spring and winter. The BioF of Zn in the sediment showed a significant correlation with stem tissue in spring and leaf tissue in summer. Fe, Cd, Cr, and Ni did not show correlations between their BioF in the sediment and the R. mangle tissues.

3.2. Metal concentration in R. mangle

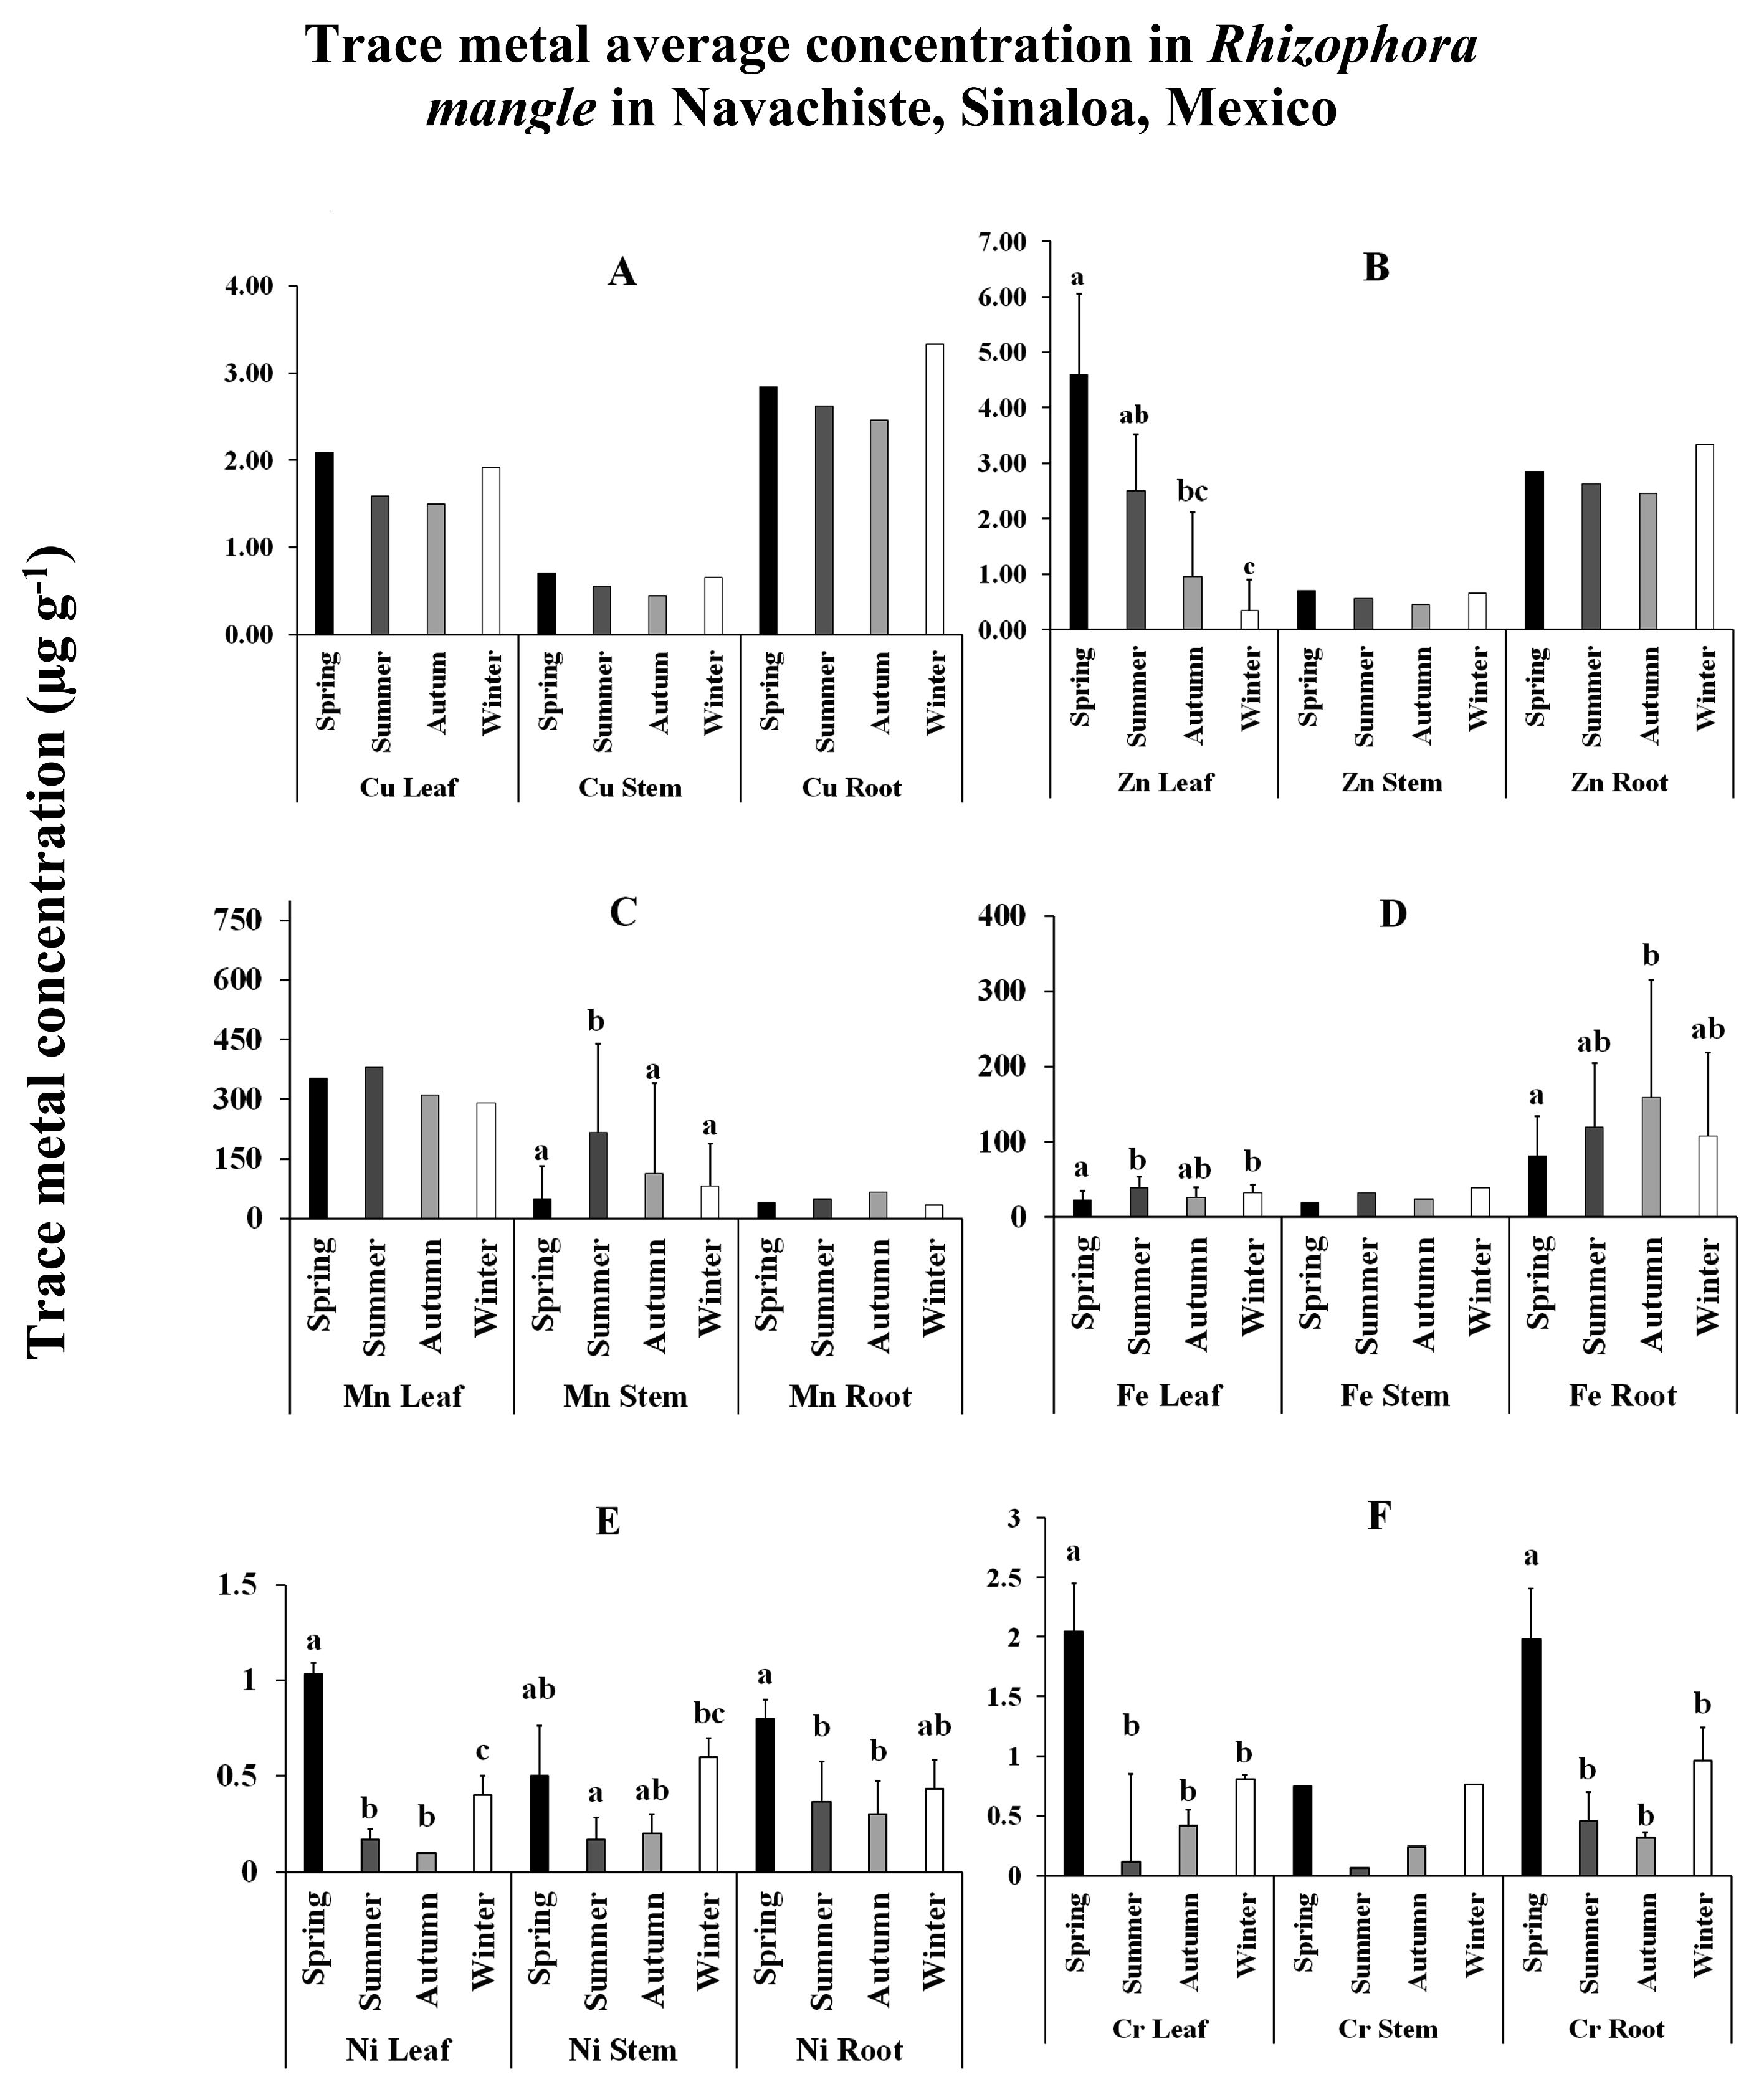
The metal content in leaf and stem tissue was in the order Mn> Fe> Zn> Cu> Cr> Ni> Cd and in root Fe> Mn> Zn> Cu> Cr> Ni> Cd. The Cu concentration in R. mangle tissues was found in the following order: root> leaf> stem between 0.44 ± 0.17 and 3.33 ± 1.84 µg g-1, with an annual mean of 1.72 ± 0.76 µg g-1. There were no significant differences between Cu concentrations in leaf, stem and root in spring, summer, autumn, or winter. The leaf showed Cu concentrations throughout the seasons ranging from 2.09 ± 1.56 to 1.92 ± 1.47 µg g-1, the stem from 0.44 ± 0.17 to 0.70 ± 0.34 µg g-1, and the root from 2.46 ± 1.29 to 3.33 ± 1.84 µg g-1. The Cu concentration throughout the season showed no significant differences (p = 0.21) (Figure 2A). Mn was found in the following order: leaf > stem > root. Mn average concentrations throughout the seasons varied in leaf from 289.96 to 381.07 µg g-1, in stem from 48.28 to 215.49 µg g-1, and in root from 32.64 to 67.21 µg g-1, showing higher significant Mn concentrations (215.49 µg g-1) in the stem throughout the four seasons (p < 0.05) (Figure 2C). Fe average concentrations varied in the leaf from 23.08 (March) to 39.18 µg g-1 (June), in the stem from 19.01 (March) to 39.36 µg g-1 (December), and in the root from 80.97 (March) to 158.93 µg g-1 (September). The Fe concentrations in leaf, stem, and root varied from 19.01 to 39.18, 19.01 to 39.6, and 80.97 to 158.93 µg g-1. Throughout the four seasons the leaf and root showed significant higher Fe concentrations in June and September, respectively (p < 0.05) (Figure 2D). Ni concentrations showed significant differences throughout the seasons in the tissues (p < 0.05). The leaf showed higher significant concentrations in summer with respect to winter (0.16 µg g-1) and root showed significantly higher Ni concentrations in spring (0.8 µg g-1) with respect to summer and autumn (Figure 2E). Cr content in R. mangle tissues was observed in the following order: root>leaf>stem, and Cr concentrations in leaf and root showed higher significant concentrations (2.04 and 1.97 µg g-1, respectively) in the spring (p < 0.05) (Figure 2F) (Table 1).

3.3. Trace metal concentrations in adjacent sediments to R. mangle trees

The Fe concentrations (23.304.43 ± 8.460.29 µg g -1) were the most concentrated TM in the sediments collected close to R. mangle trees, followed by Mn (56.21 ± 101.05 µg g -1) and Zn (59.1 ± 7.76 µg g -1) as the second and third most concentrated elements. They varied throughout the seasons and were related to textures and OM concentrations in sediments. In general, the concentration of heavy metals in sediments changed in decreasing order as follows: Fe > Mn > Zn > Cr > Ni > Cu > Cd (Table 2).
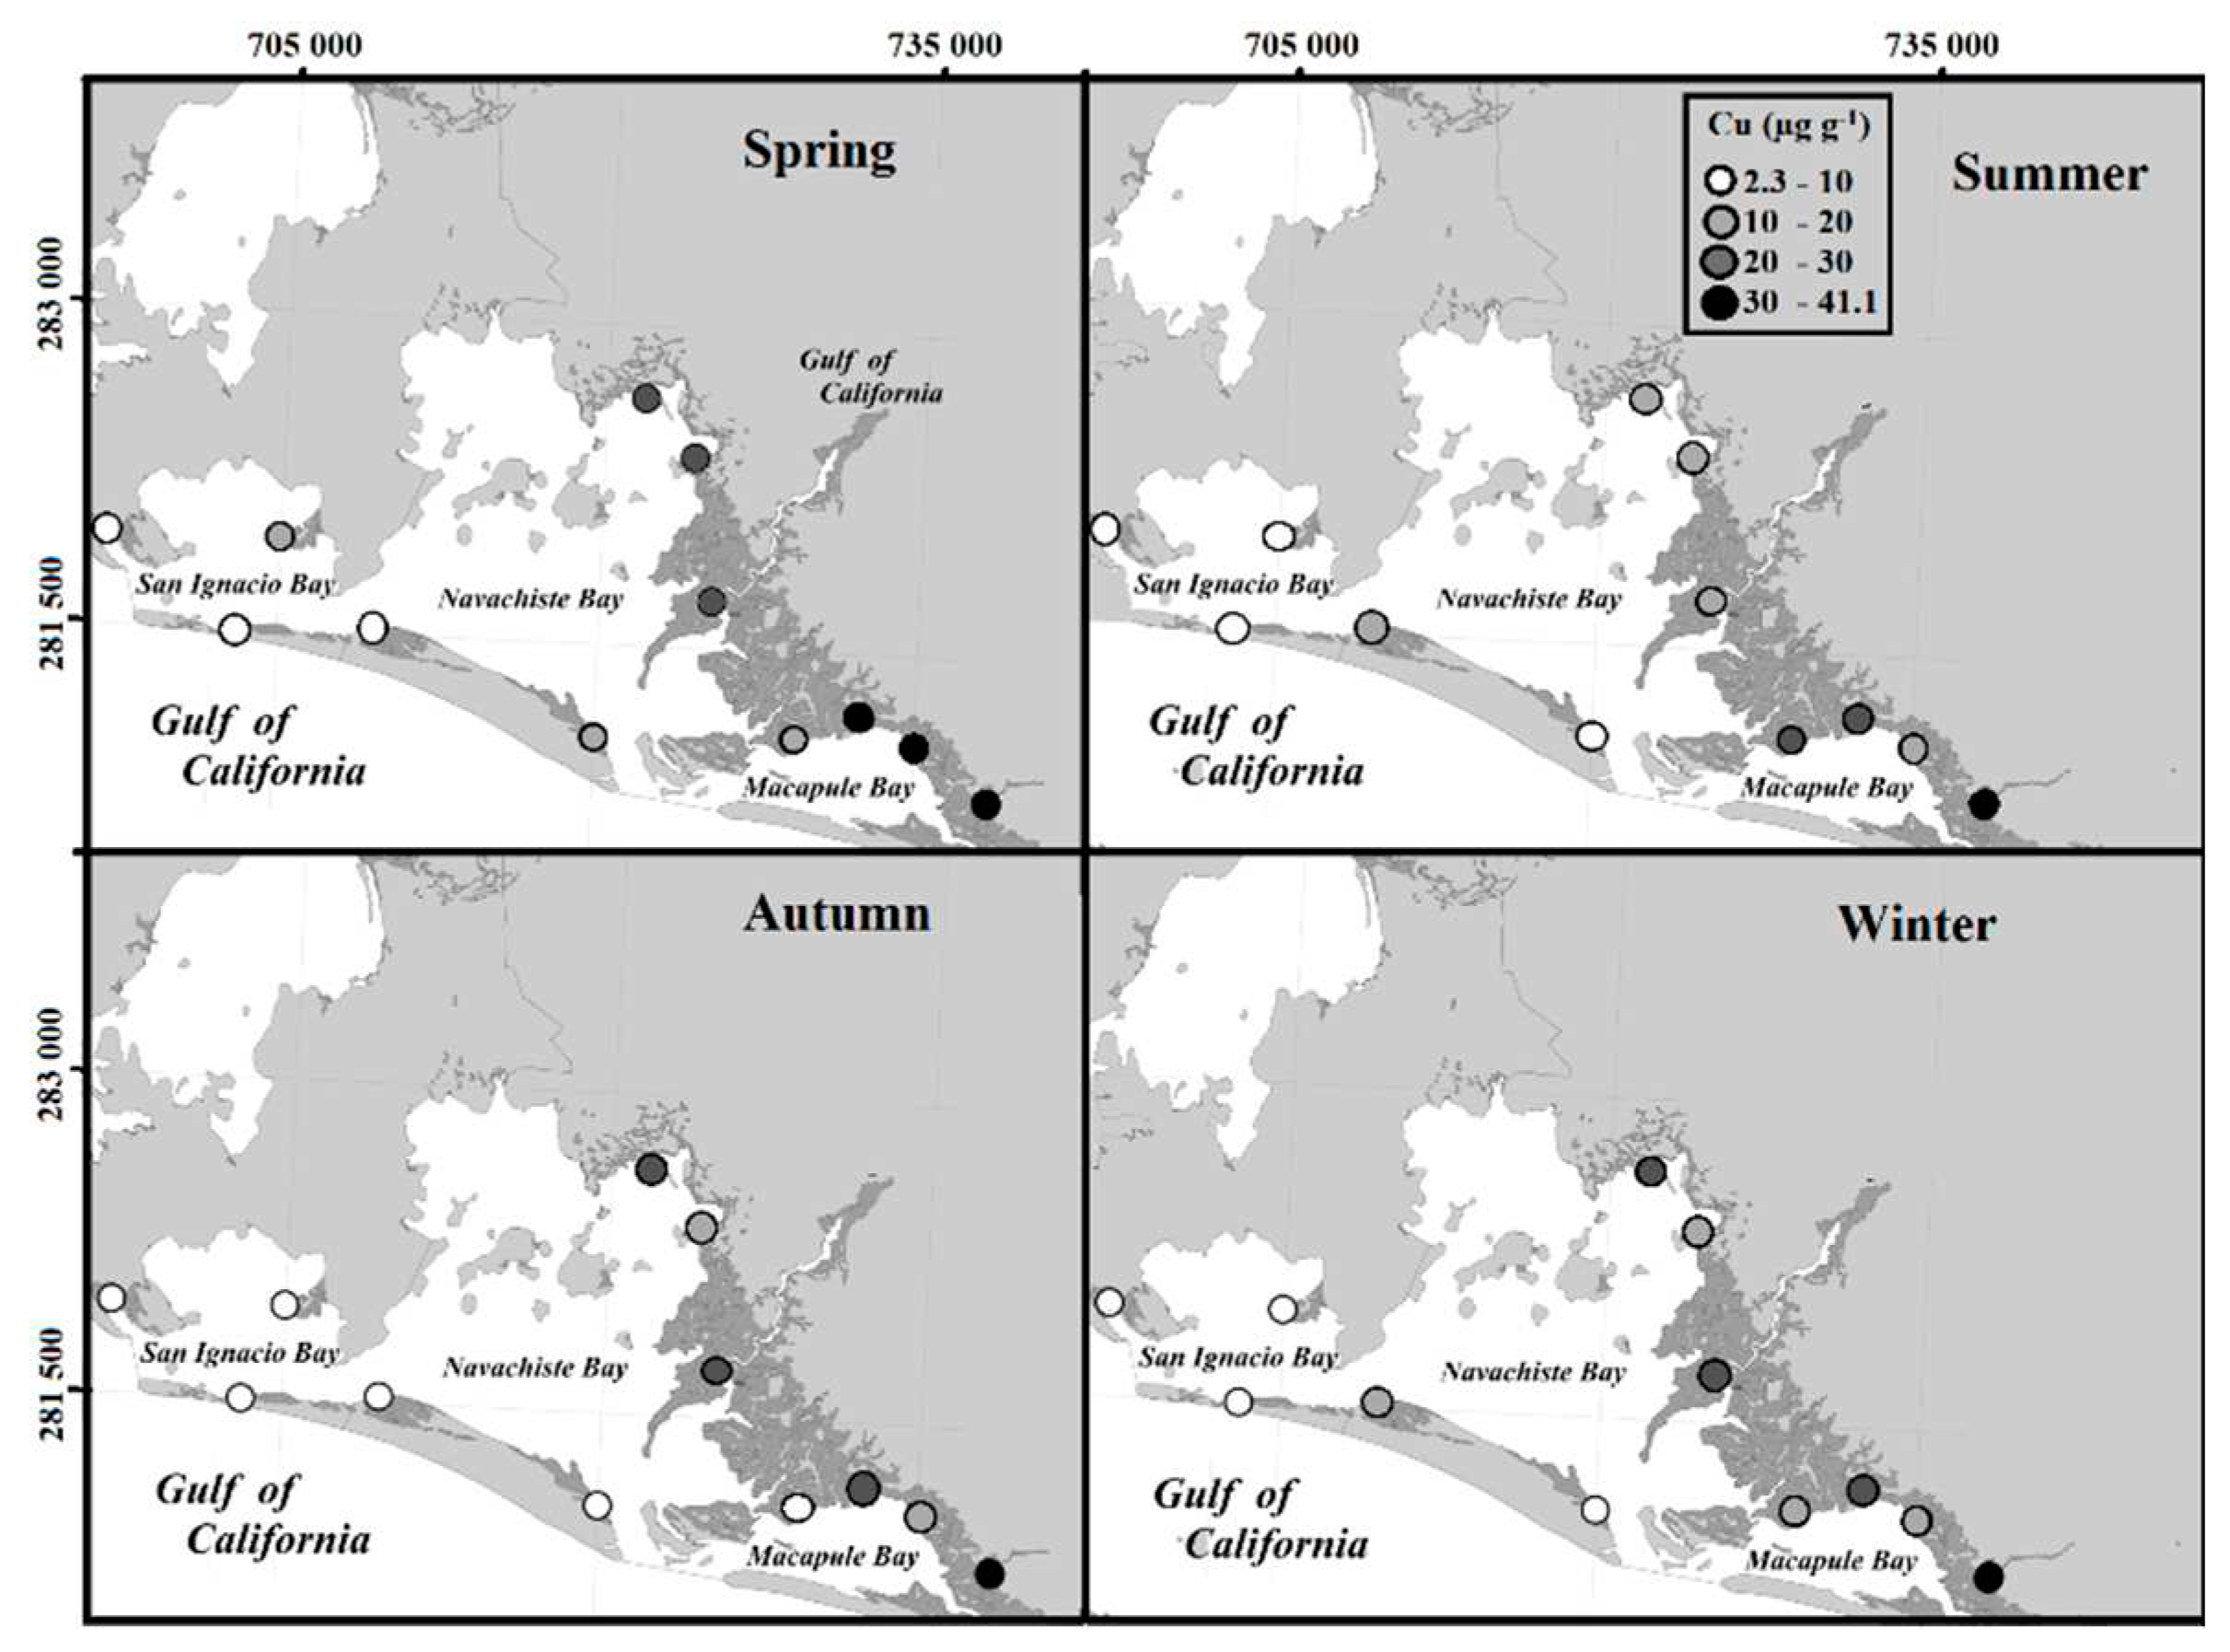
Individually, the concentration of Cu in sediments of the Navachiste lagoon complex varied according to the seasons, but was closely related to their proximity to the R. mangle forest, where the highest concentrations of Cu were found (Figure 3).
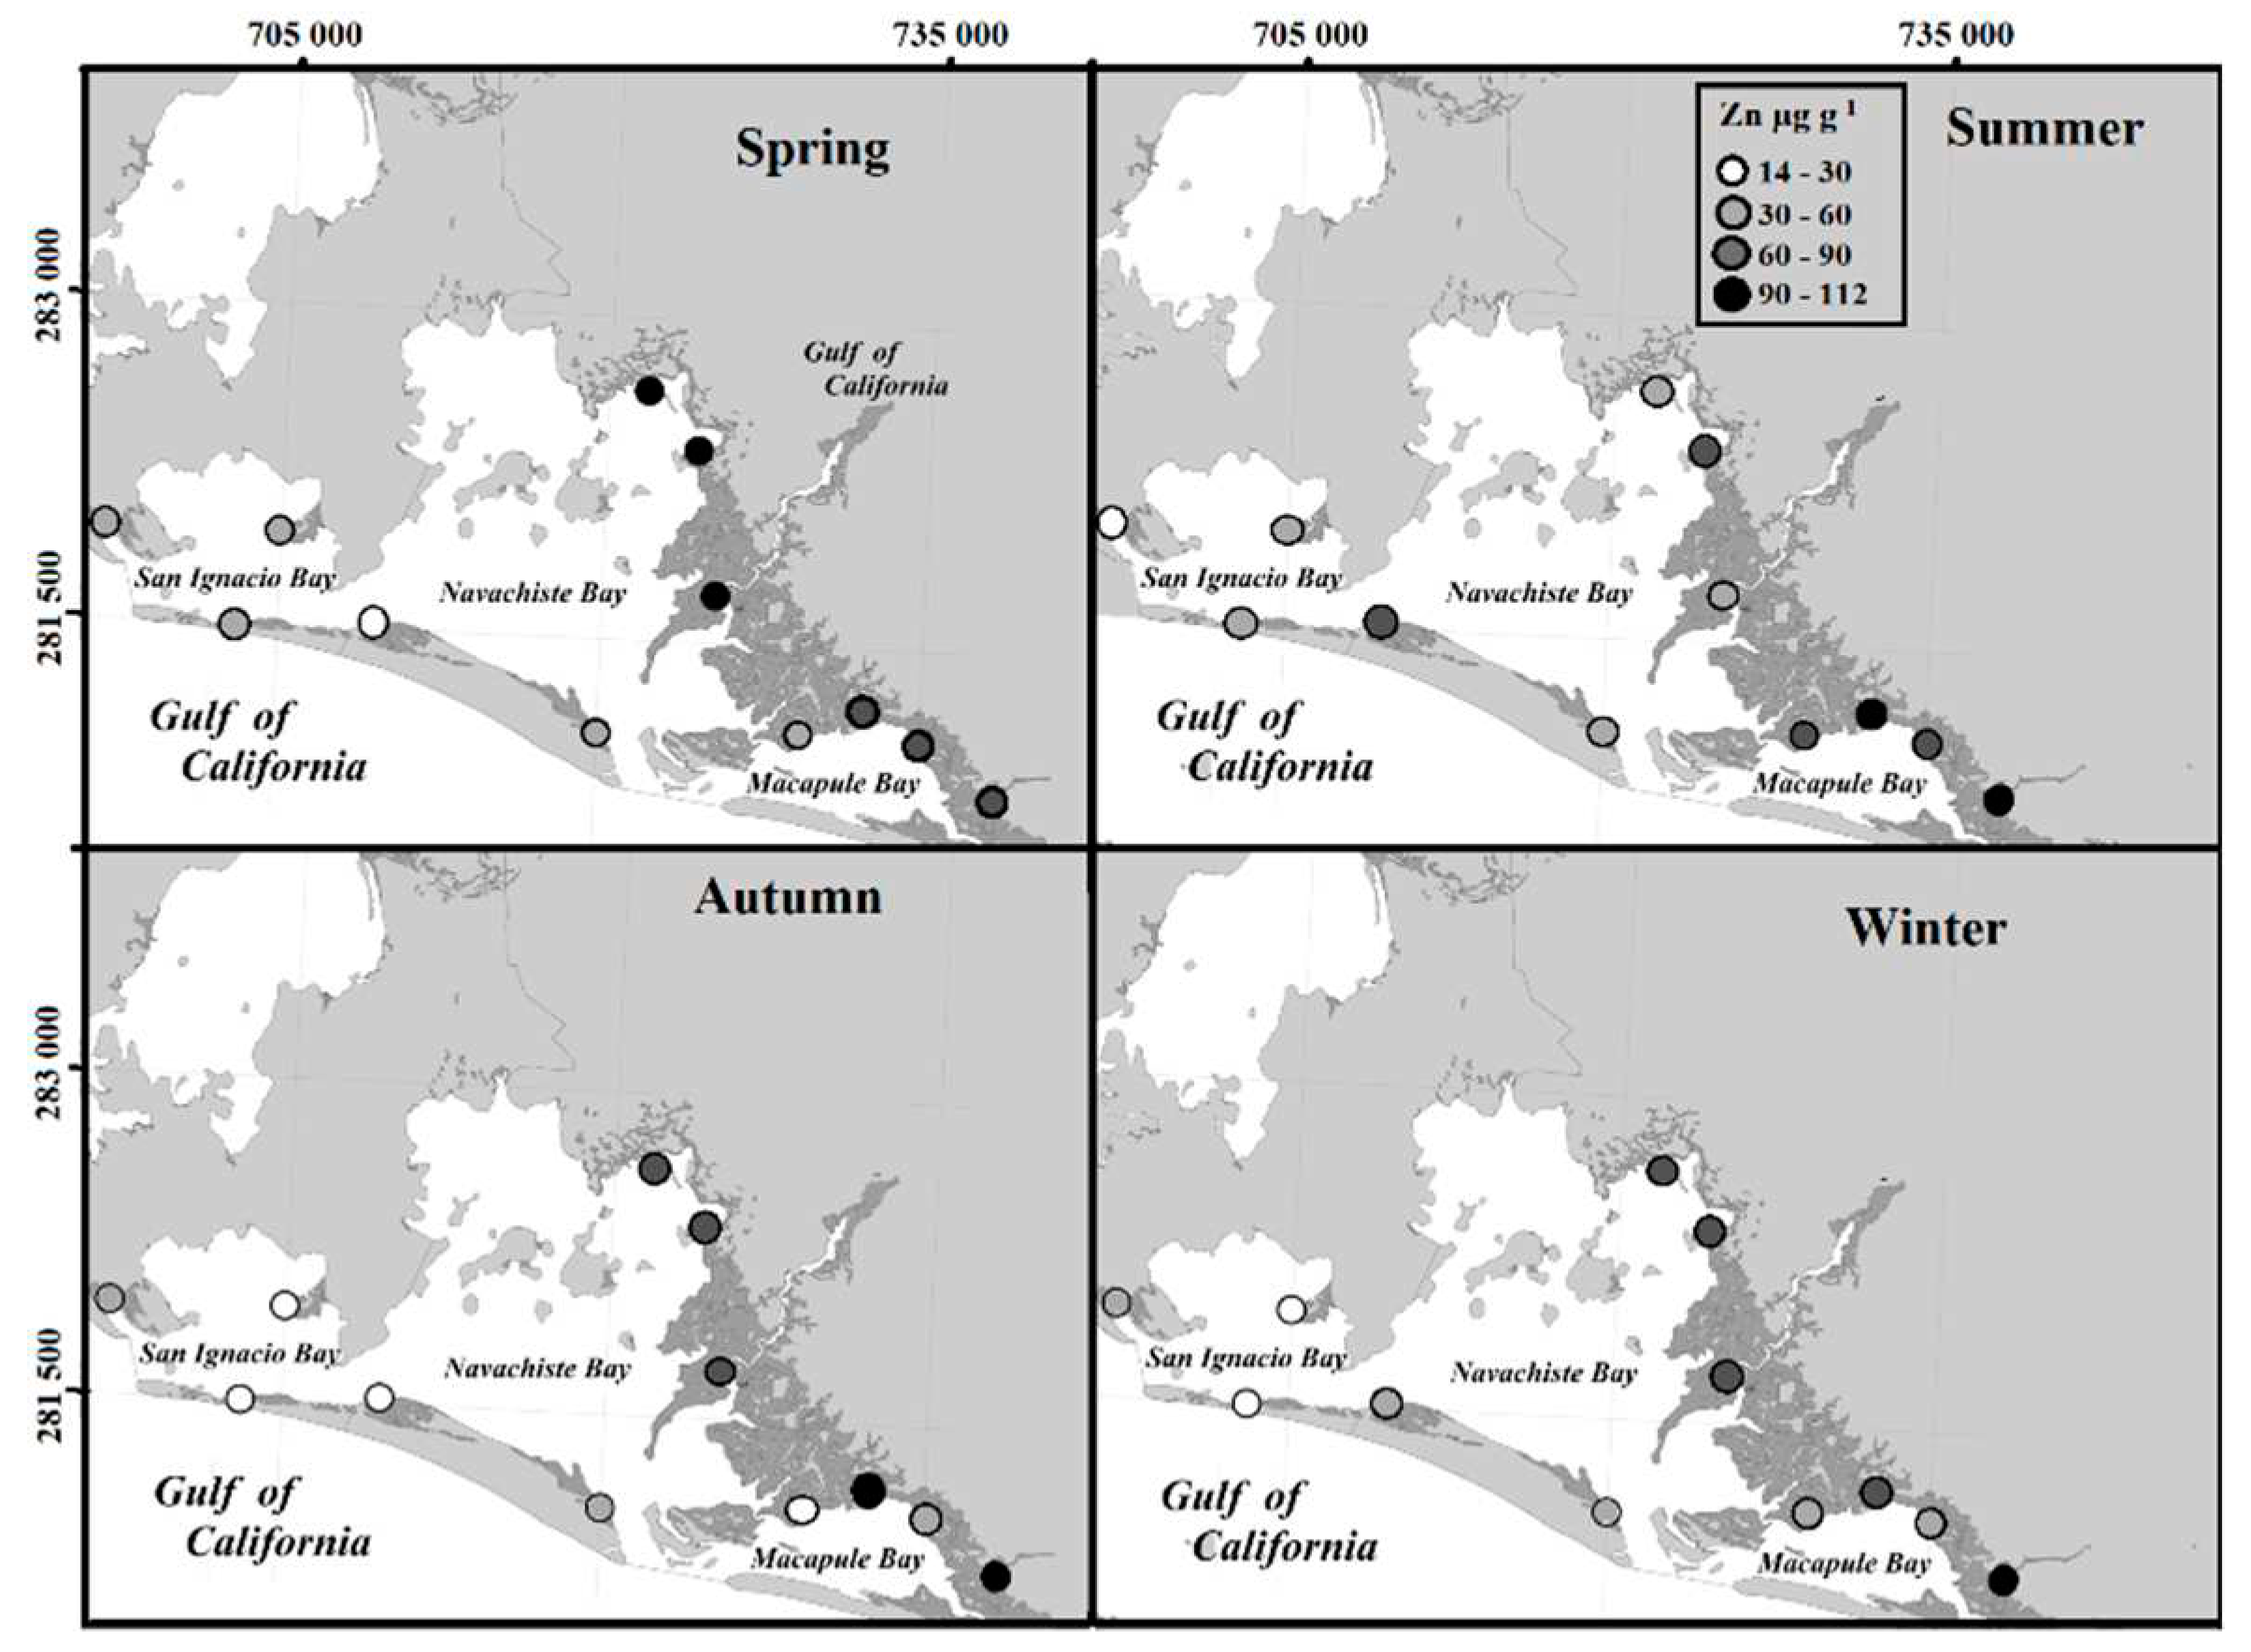
The average annual concentration of Zn in the total fraction of sediment in the NAV was of 60 μg g-1), where Macapule Bay (MAB) registered an average of 75 μg g-1, Navachiste Bay (NAB) 64 μg g-1, and San Ignacio Bay (SIB) 41 μg g-1. The Zn content was mostly associated with Fe and Mn (r > 0.83) and with the silt and clay fraction (r > 0.70) of the sediment (Figure 4), besides to Cu (r > 0.92) in the summer-winter. During spring-summer, a higher correlation was found with organic matter content (r = 0.75), which explains why NAB and SIB present higher Zn concentrations in spring (Figure 7), which coincides with the highest registration of OM content, NAB (6.1−8.5 %) and SIB (1.3−2.5 %), whereas MAB registered higher Zn concentrations and OM content (1.74−8.47 %) during summer. However, in the seasonal variations, no significant differences (KW, p < 0.5) were determined for the Zn concentration in the total fraction of the sediment.
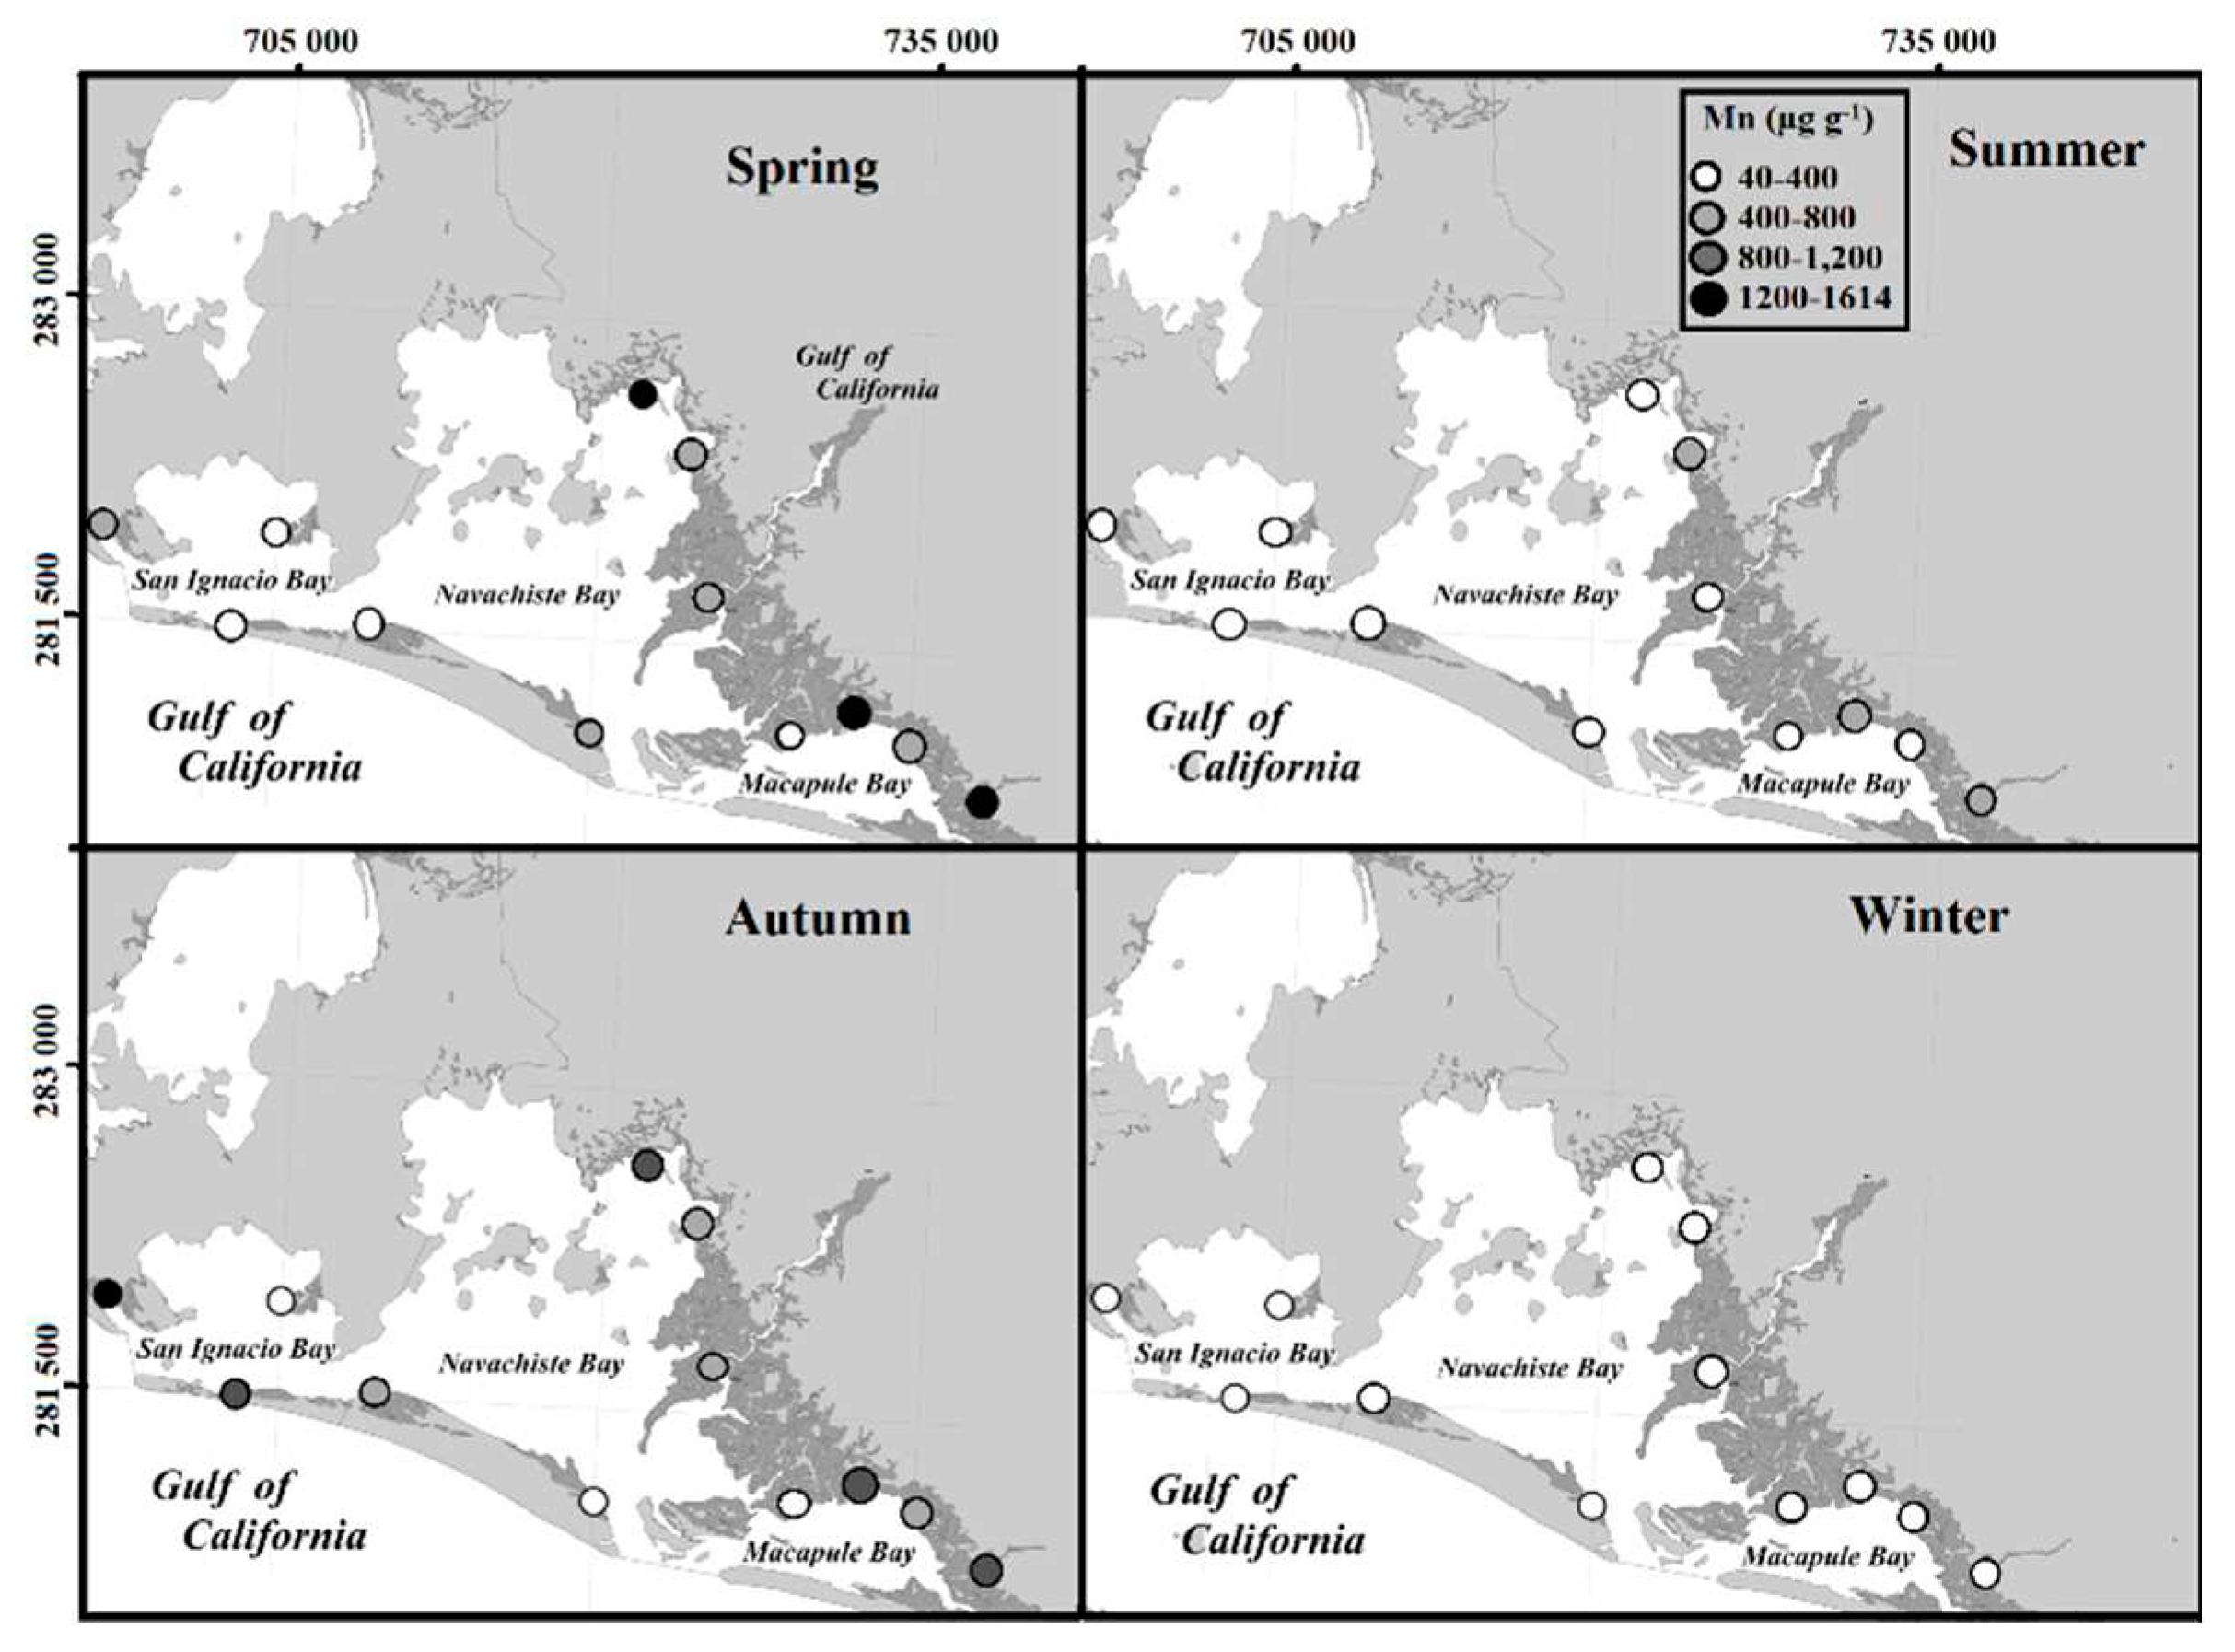
In the sediments from NAV, Mn concentrations were more homogeneous among collection sites during summer and winter. Mn concentrations were higher in sampling sites close to mangrove trees during spring and autumn than summer and winter (Figure 5).
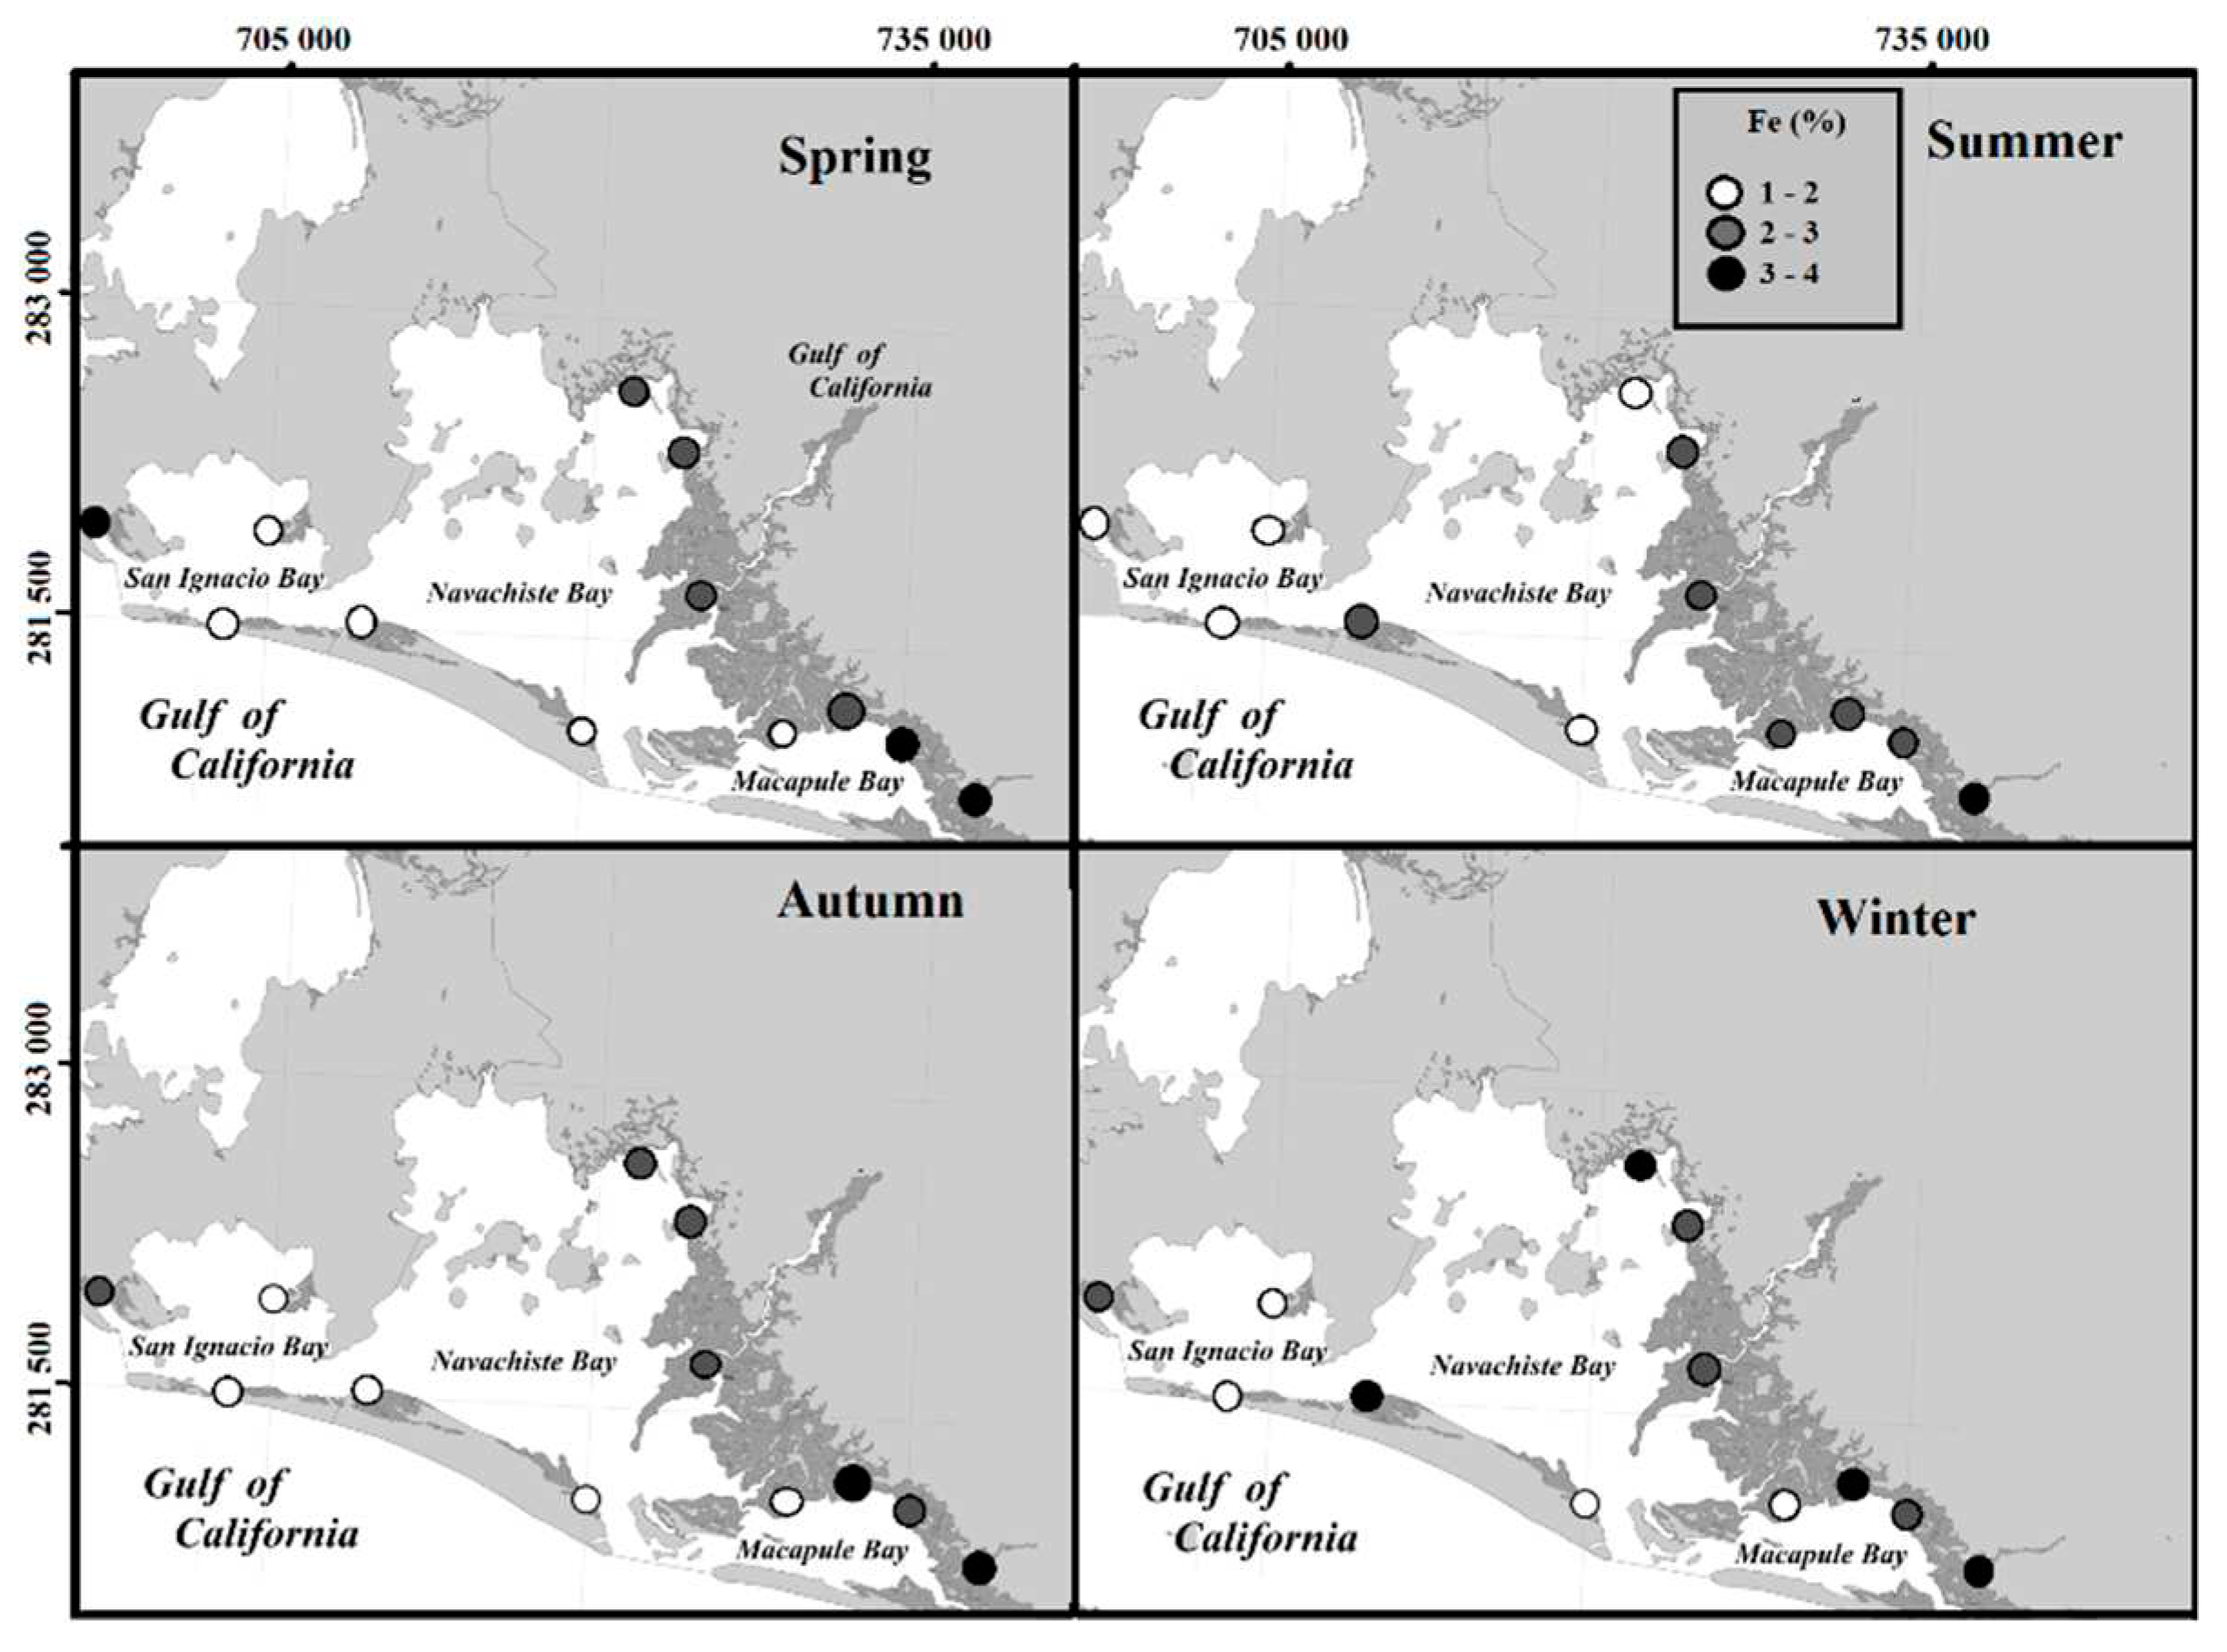
Fe was the most concentrated TM within the NAV lagoon complex in the sediments collected close to the R. mangle trees. In addition, the Fe concentrations were homogeneous thought all sampling sites in the mangrove adjacent areas in the three bays analyzed but highest Fe concentrations were determined in MAB (Figure 6).
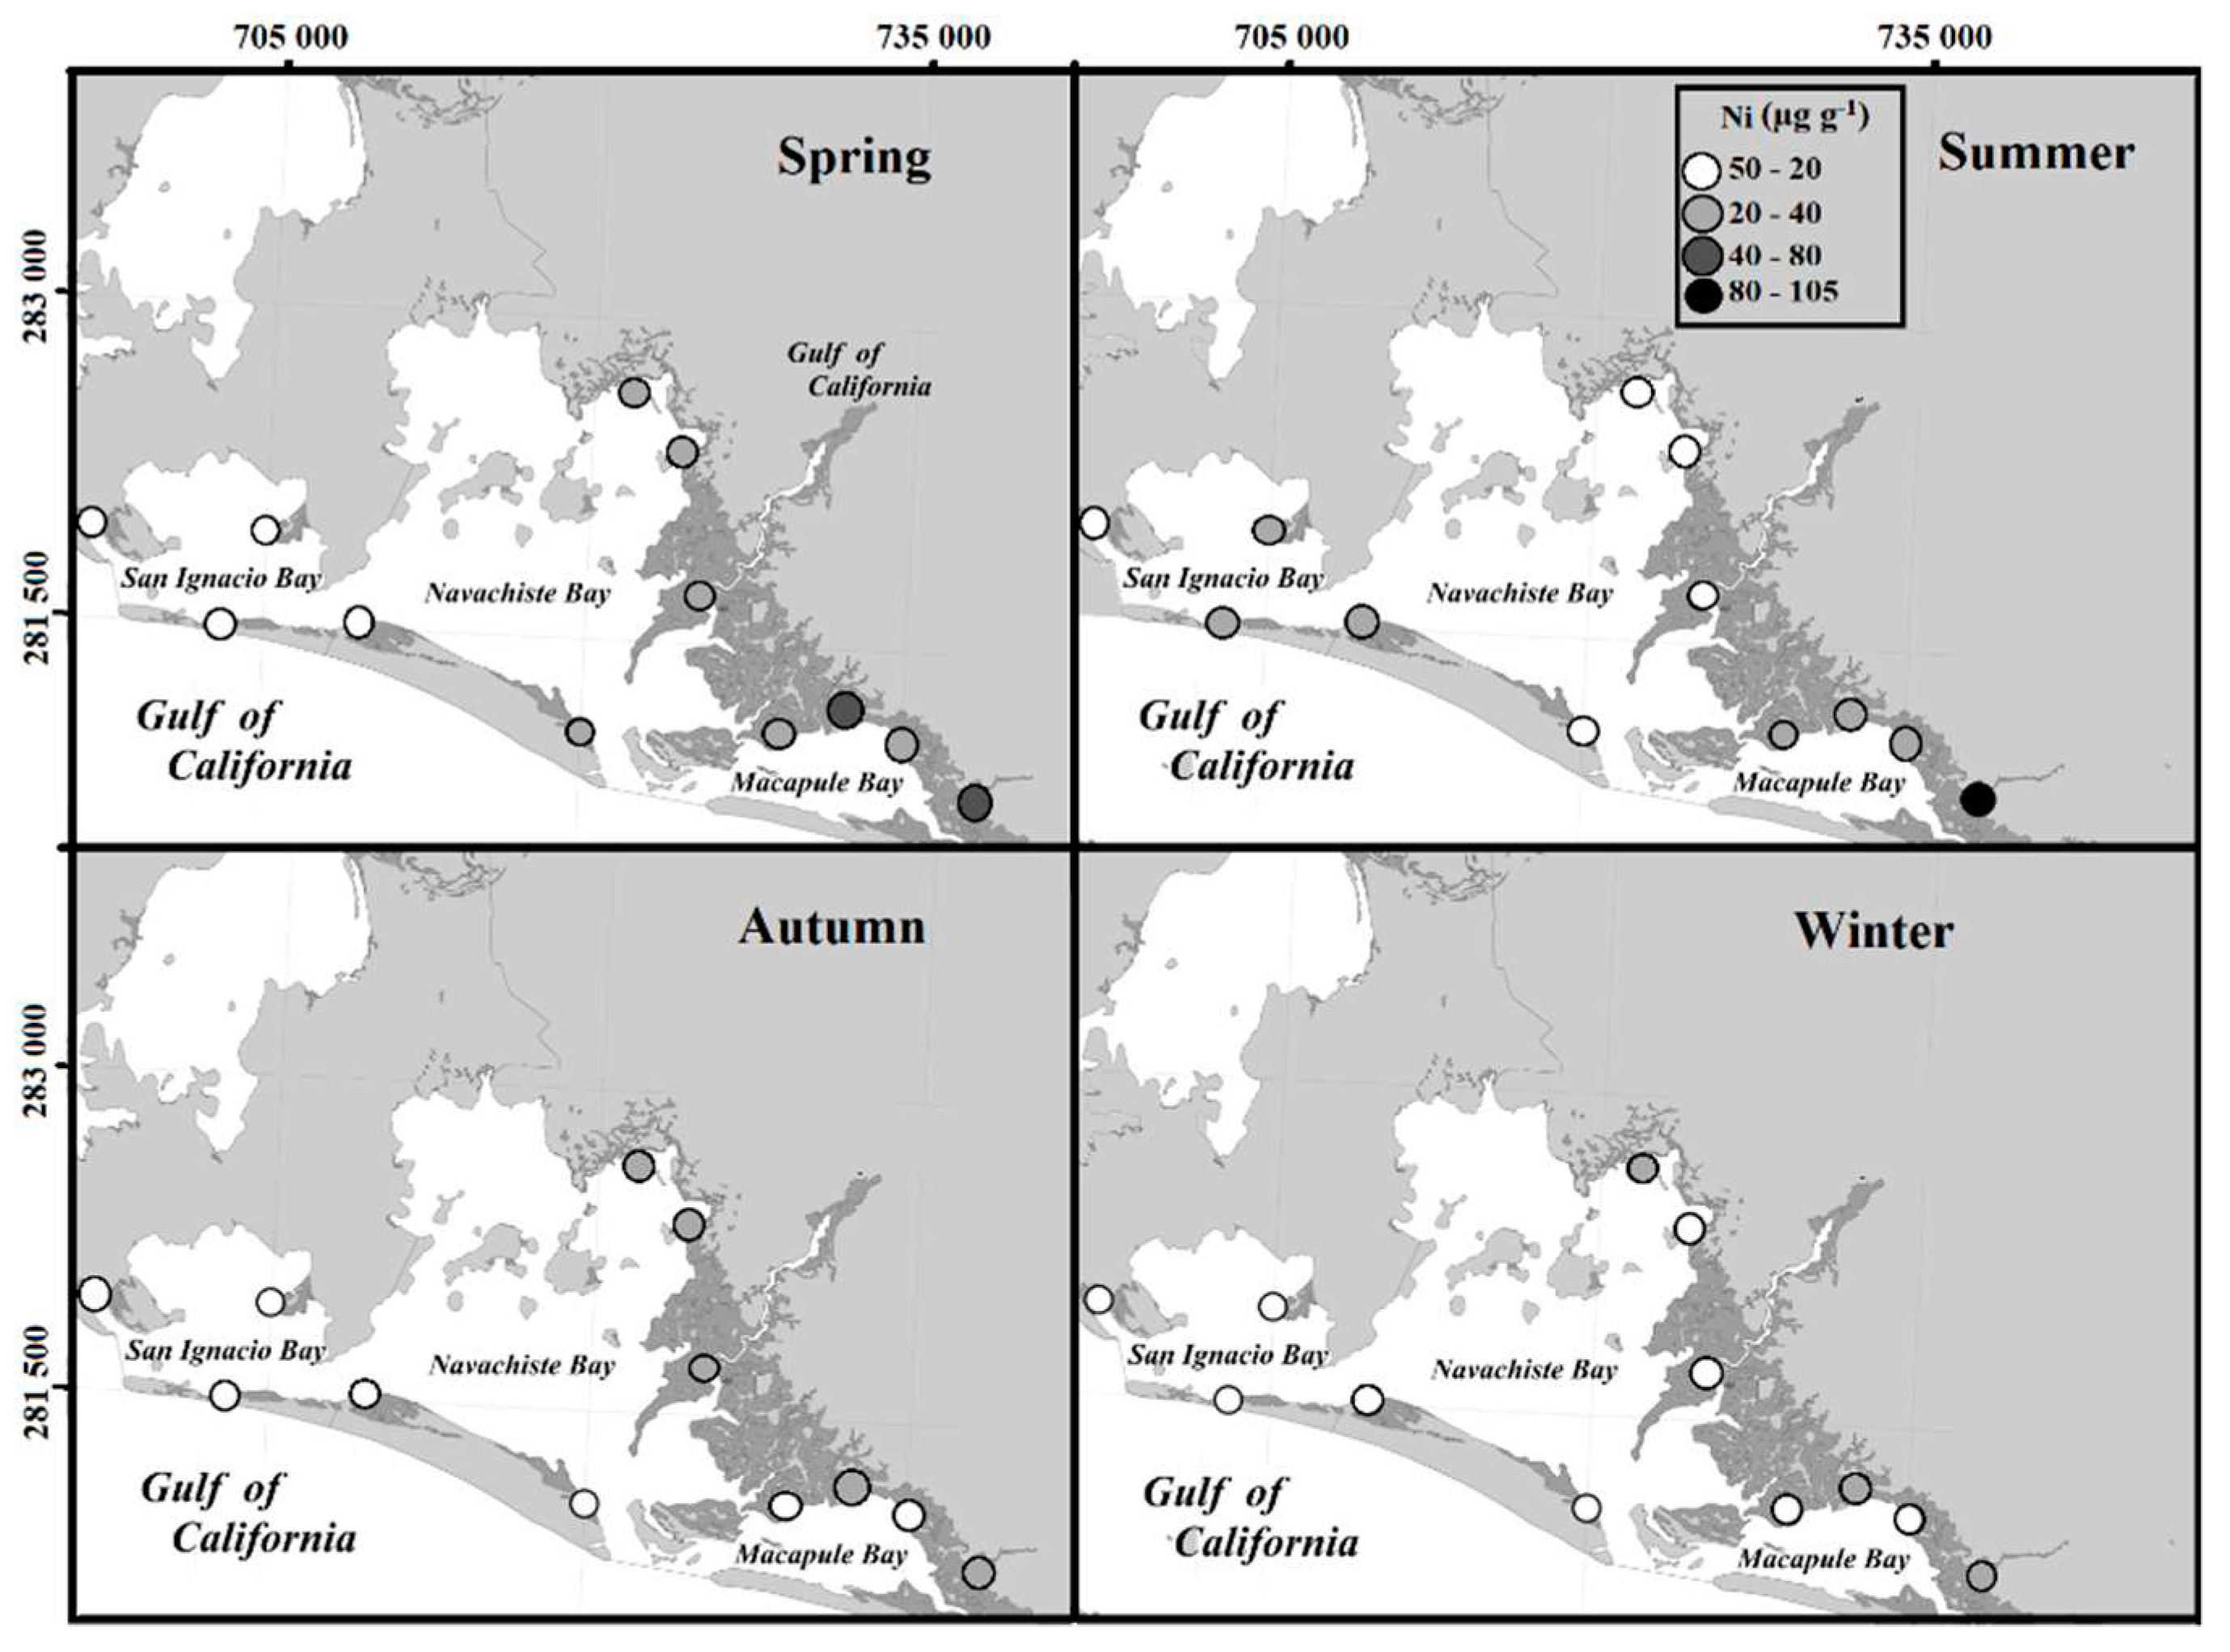
The annual average Ni concentration in the total fraction of sediment pertaining to NAV was 23 μg g-1, MAB recorded an average of 34 μg g-1, NAB 22 μg g-1, and SIB 14 μg g-1. The spatiotemporal variation shows that MAB and SIB registered higher concentrations during the summer and NAB in the spring. In NAB and SIB, significant differences (KW, p < 0.05) were determined, among the different seasons of the year, in the Ni concentration of the total fraction of sediment; in NAB, the Ni content is higher in spring compared to the rest of the year, and in SI it is higher during the summer (Figure 7).
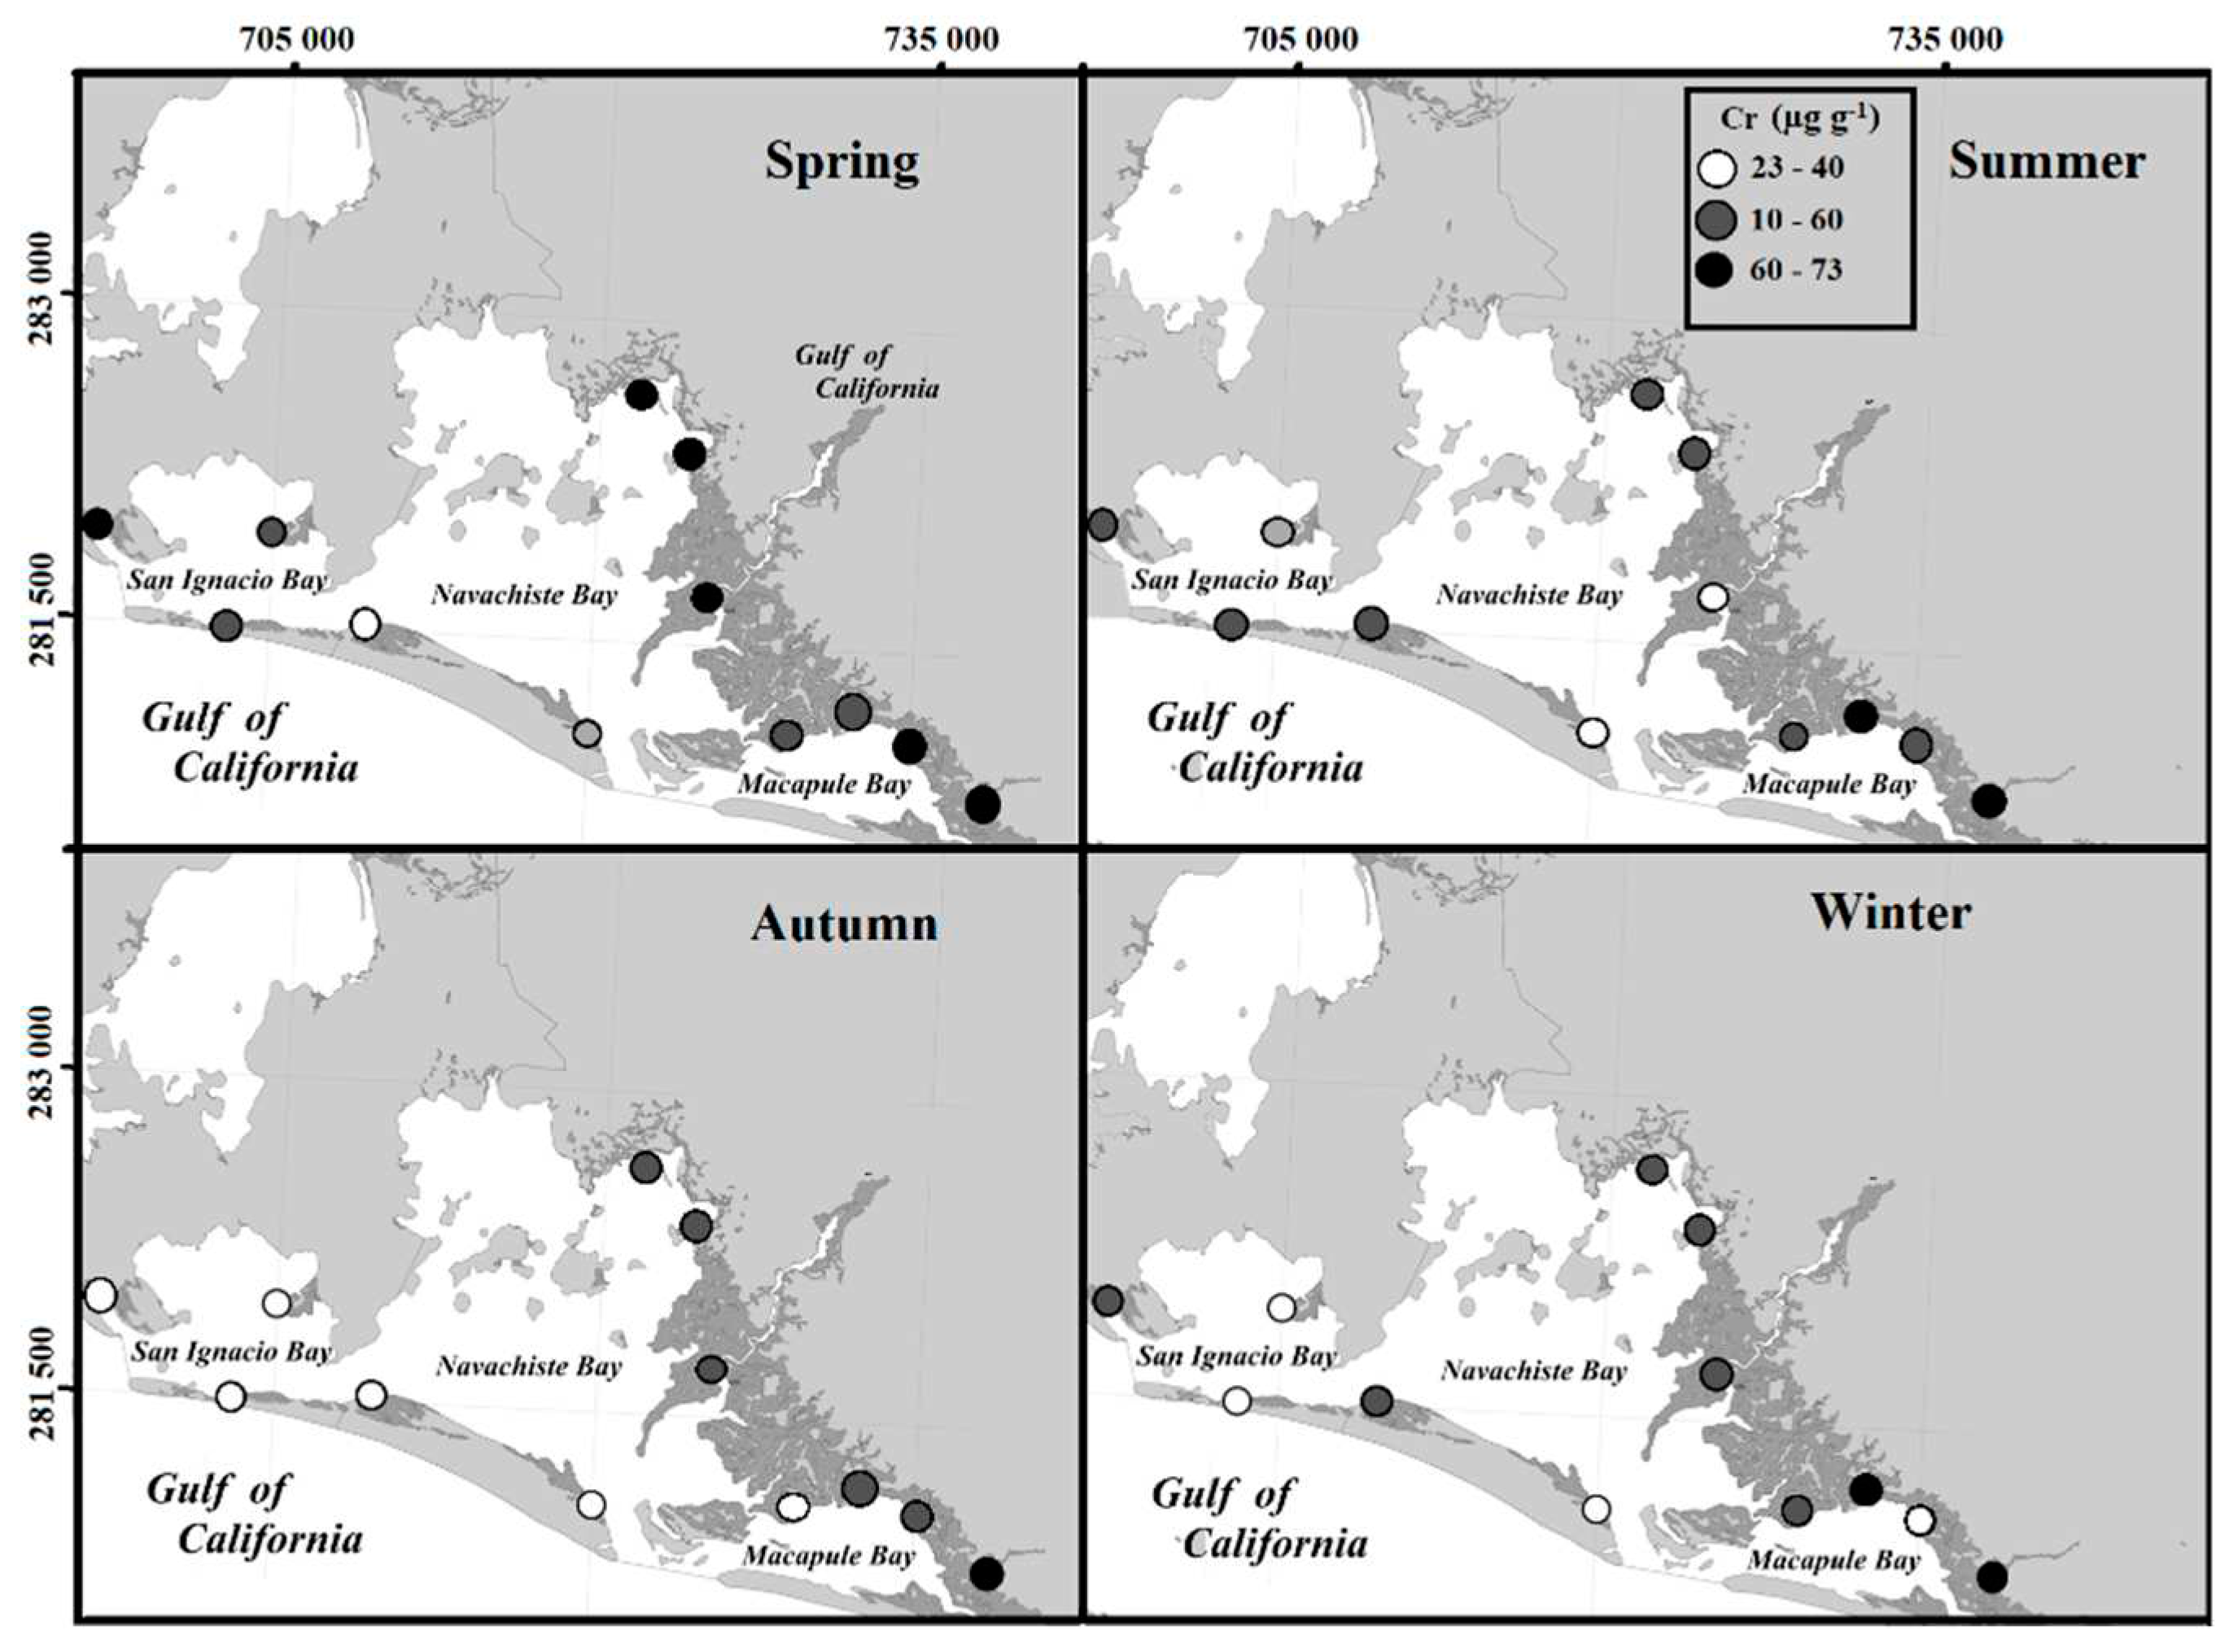
In summer, autumn, and winter, Cr exhibited homogeneous concentrations in the collection sites near the R. mangrove sediments. However, in spring, the highest concentrations were observed in the collection sites closer to the mangrove areas (Figure 8).
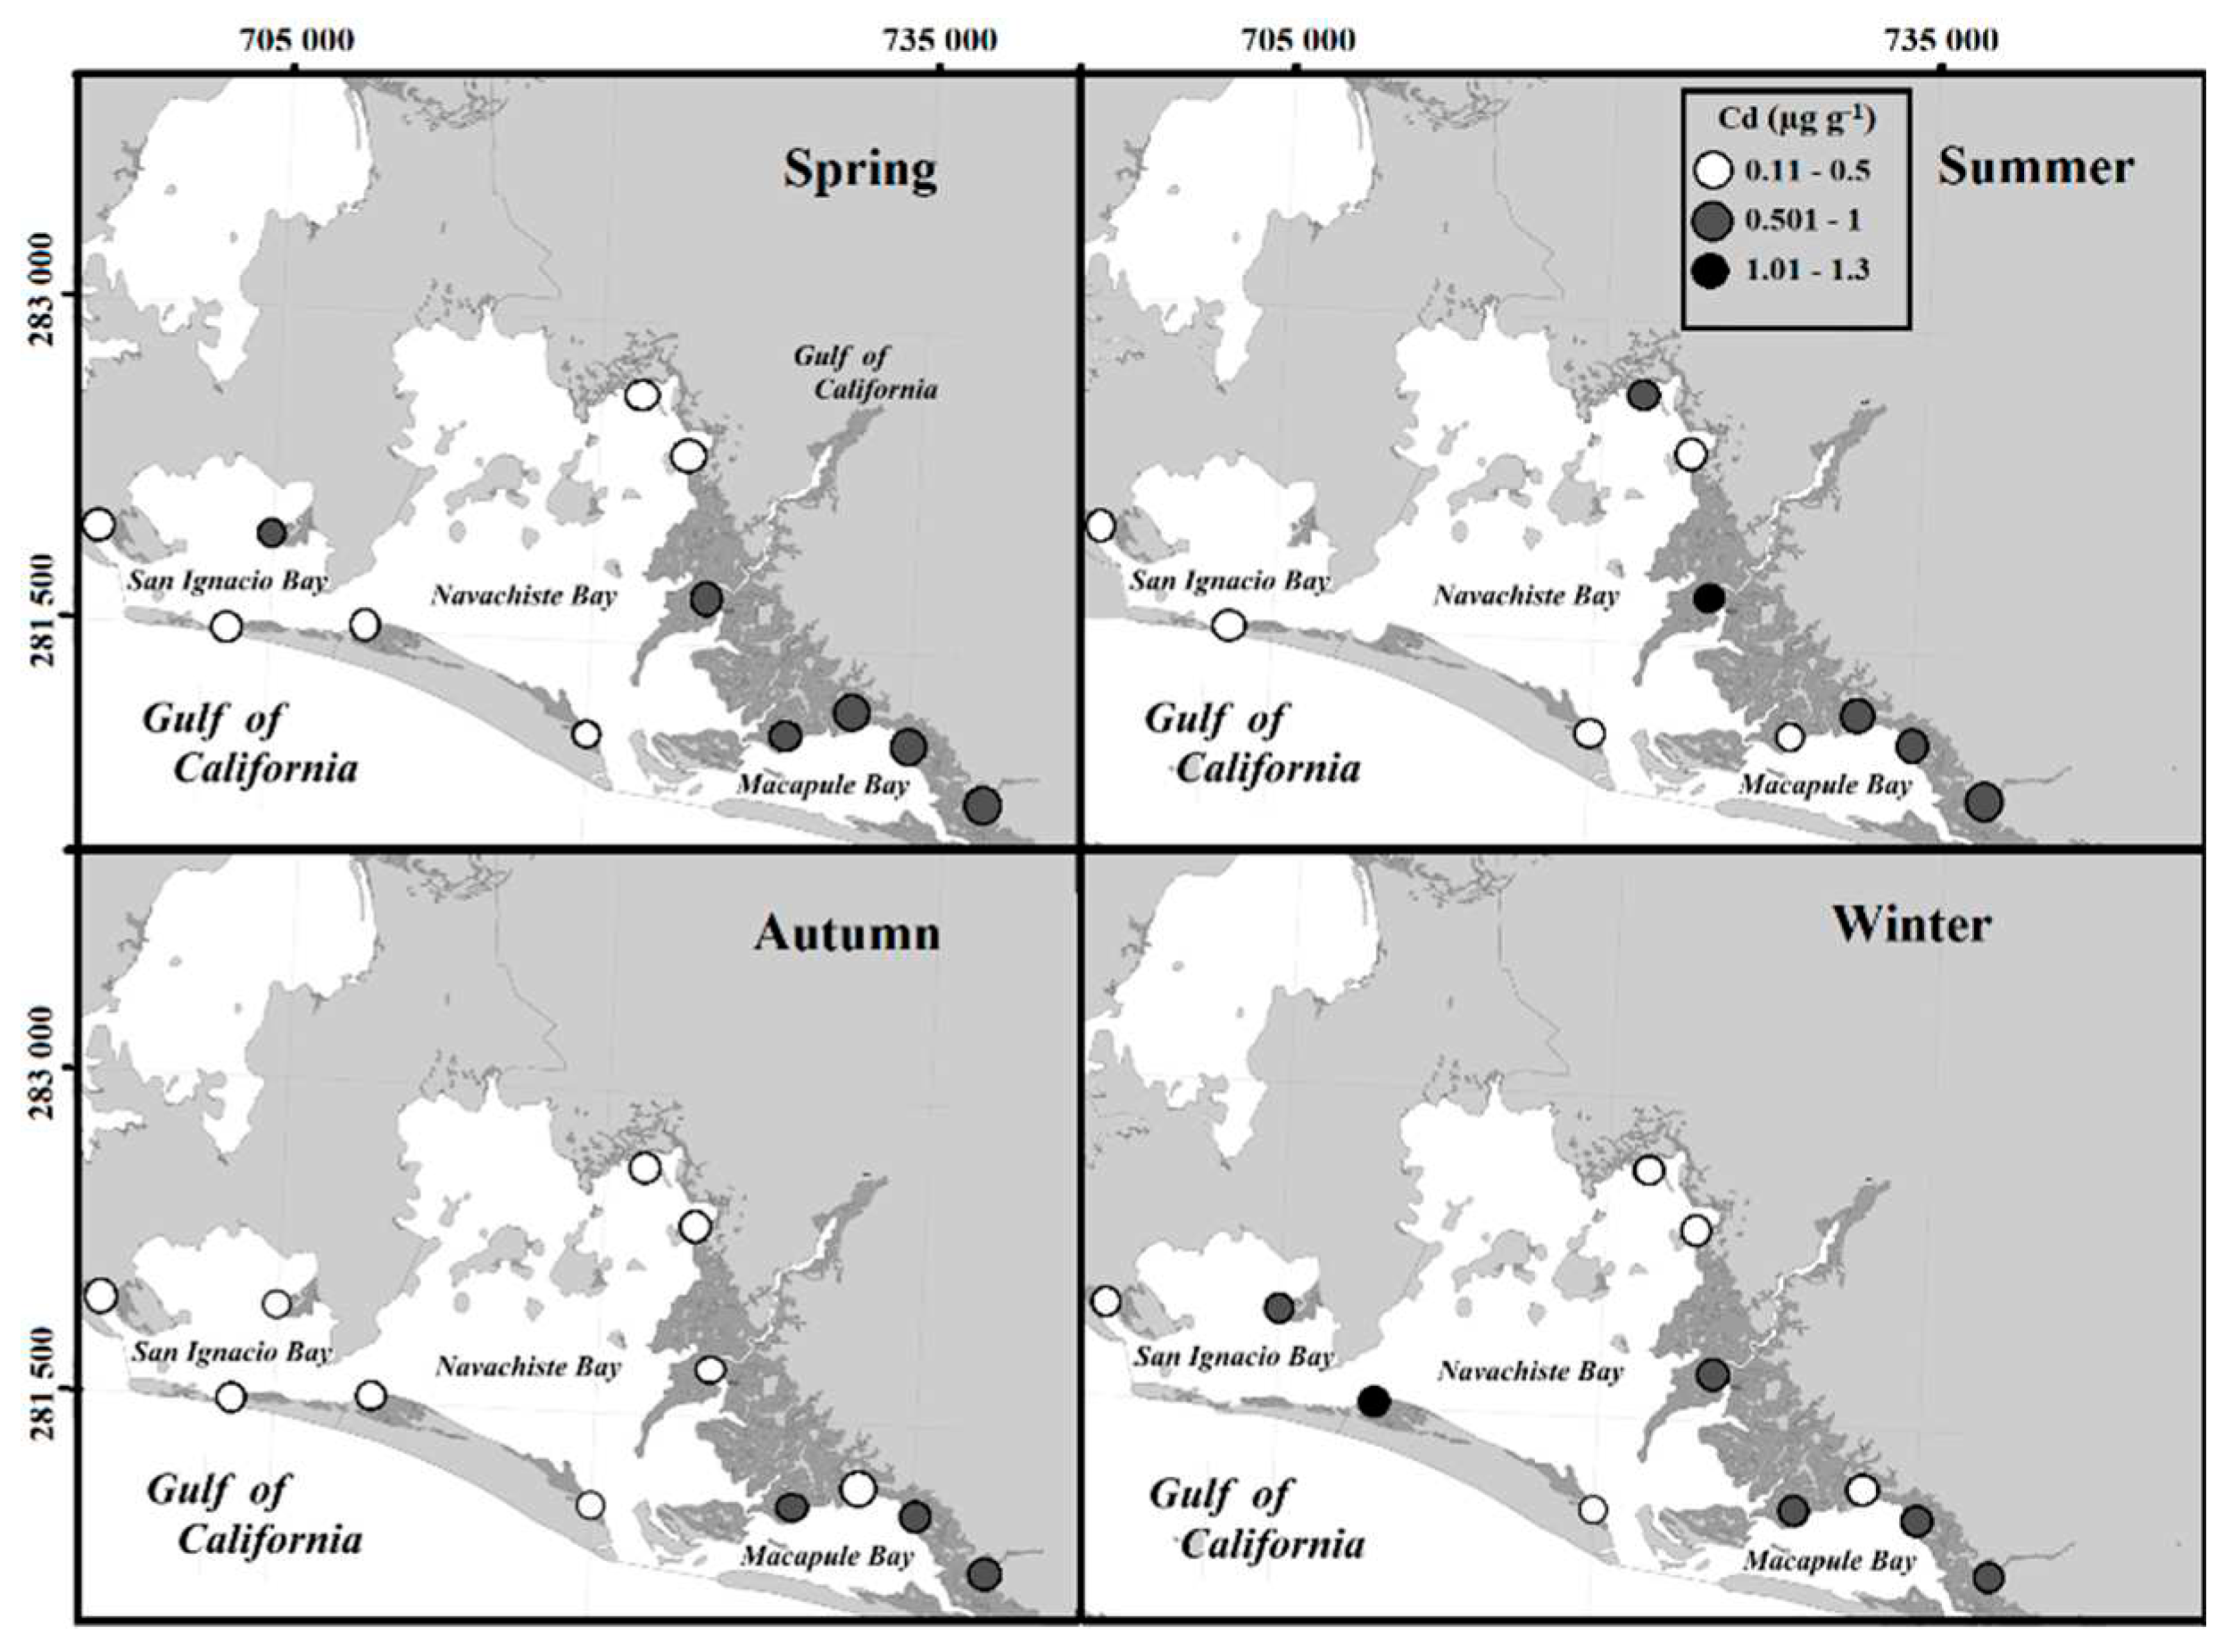
The average annual concentration of Cd in the total fraction of sediments within the NAV was 0.45 μg-1. Among the specific bays, MAB recorded an average of 0.58 μg g-1, NAB, 0.43 μg g-1; and SIB, 0.34 μg g-1 (Figure 12). The spatio-temporal variation indicated that Cd content in MAB remained constant throughout the year. However, NAB exhibited higher concentrations during the summer, whereas SIB showed elevated levels during spring and winter. Regarding the different seasons, no significant differences (KW, p < 0.05) were found in the Cd concentration in the total sediment fraction. In spring and winter, the Cd content in the sediment showed no correlation with other metals, OM content, sediment texture, and physicochemical parameters of seawater. However, during summer, it showed a positive association with organic matter content (r = 0.68, p < 0.05) and Ni (r = 0.81, p < 0.05). In autumn, Cd concentration registered a high correlation with Zn (r = 0.92, p < 0.05), Fe (r = 0.91, p < 0.05), and Cu (r = 0.60, p < 0.05), as well as with the silt fraction (r = 0.61, p < 0.05) and salinity (r = 0.82, p < 0.05).

3.4. Sediment texture

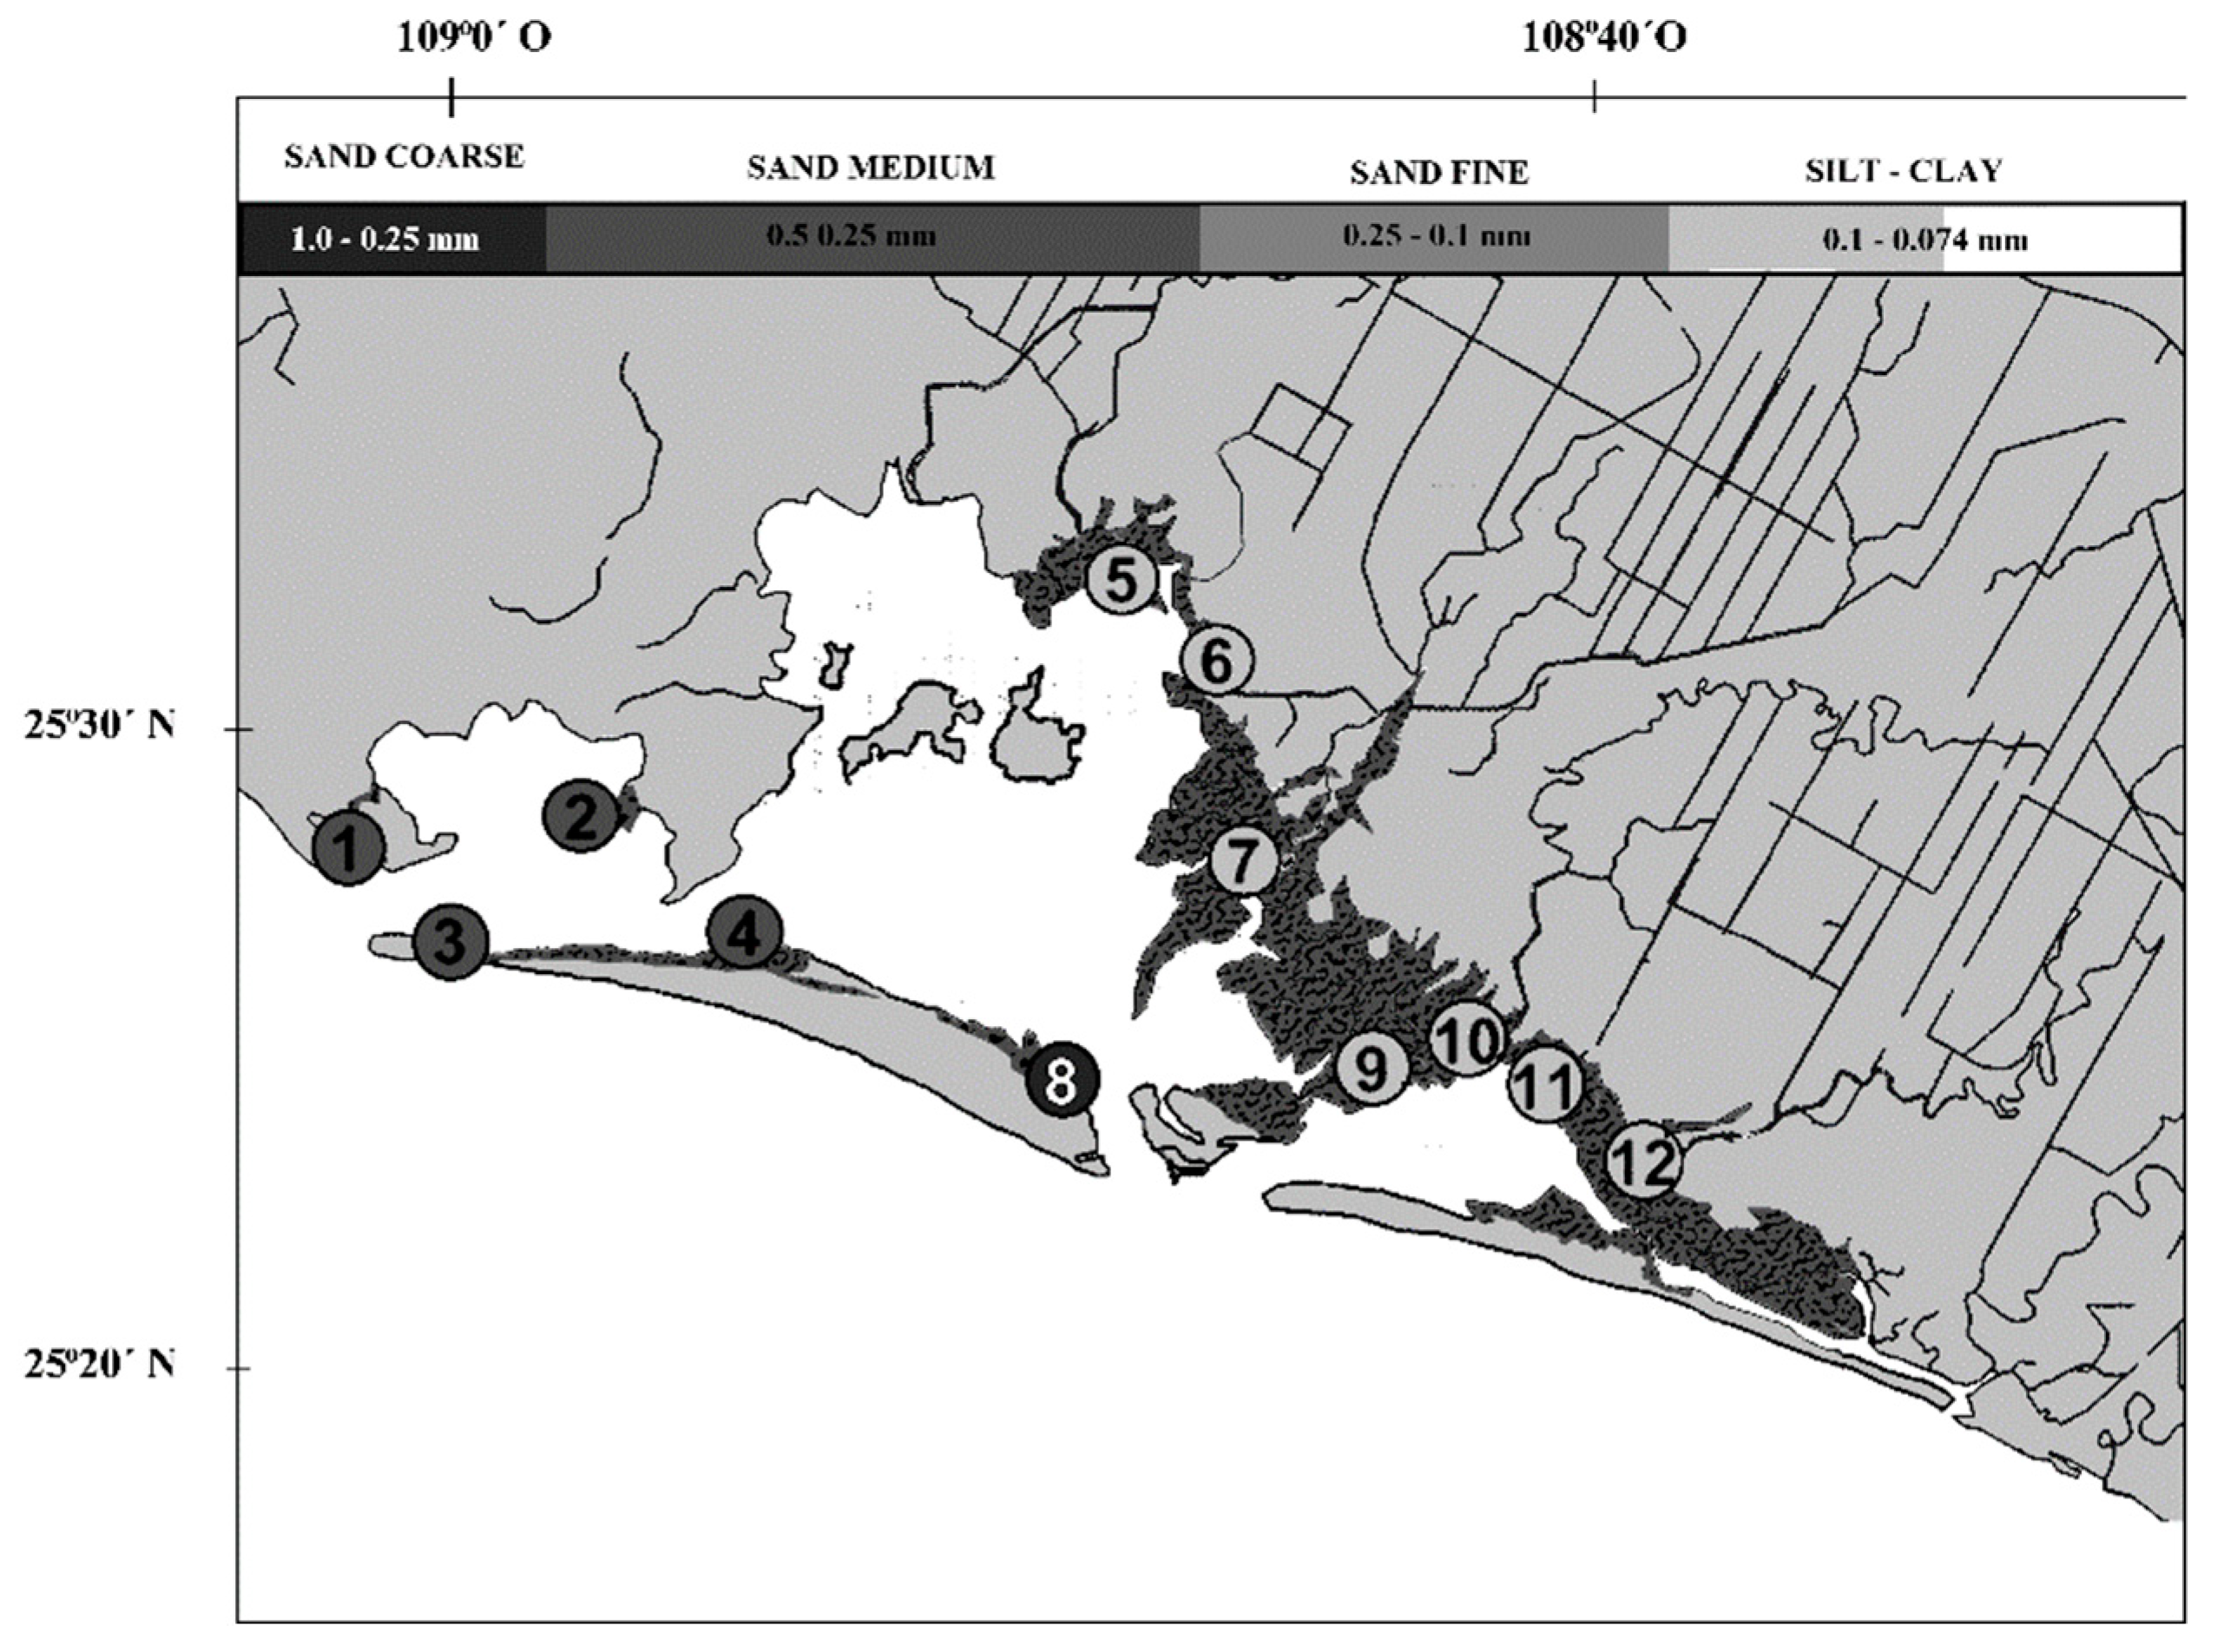
The sediment texture analysis revealed that the sample points in the continental crust and those adjacent to the mangrove exhibited lime-clay textures (points 5-7, 9-12), whereas the sample points on the islands were composed of fine to coarse sandy soil (points 1-4, and 8) (Figure 10).

3.5. Sea water physicochemical parameters

The values of temperature, salinity, and pH (mean ± standard deviation, n = 4) were recorded during each annual collection season in each bay of the NAV lagoon complex (Table 3).

3.6. Enrichment Factor (EF)

The enrichment factor showed that Zn and Mn exhibited enrichment in spring and autumn, respectively (shaded cells), and Zn along the year. These elements were classified as enriched in the NAV lagoon complex (Table 4).

3.7. Seasonal correlation of trace metals between bioavailable and total fractions with physicochemical parameters

The average concentration of Zn in the total sediment fraction from the lagoon complex was 60 μg g-1, showing high correlations with Fe and Mn (r > 0.83), the fraction of silts and clays (r > 0.70), and Cu (r > 0.92) during summer-winter. In spring-summer, a stronger correlation with the OM content was observed (r = 0.75). However, no significant seasonal variations were determined (KW, p < 0.05). Mn presented an average concentration of 563 μg g-1, showing the highest concentrations during spring and autumn. It also correlated highly with Cu, Zn, Cr, Ni (r > 0.85, p < 0.05), Fe (r = 0.77, p < 0.05), clays (r = 0.87, p < 0.05), and had a negative correlation with pH (r = -0.59, p < 0.05). In summer, Mn was correlated with Cu, Zn, Fe (r > 0.83, p < 0.05), silts (r = 0.83), and had a negative correlation with pH (r = -0.62).
In autumn, no significant correlation was found between Mn and the total fraction, sediment texture, organic matter, or the physicochemical parameters. During winter, Mn content correlated significantly with Zn, Cr, Cu, and Ni (r > 0.80, p < 0.05). Fe exhibited an average annual concentration of 23,304.78 µg g1 and showed correlations with Cr, Cu, and Ni during spring. Furthermore, throughout the rest of the year, Fe correlated with organic matter, sandy and silty sediments, temperature, salinity, and pH (r > 0.7, p < 0.05). Ni had an average annual concentration of 23 µg g1 and did not show significant correlations with other metals. Throughout the year, Ni was negatively correlated with sandy sediments, salinity, and pH (r > 0,8) and correlated positively with silty sediments and OM (r > 0,6). Cr presented an average annual concentration of 48 μg g1 with high correlations during the different seasons with Cu, Ni (r > 0.7), silty sediments (r > 0.7), and OM (r > 0.6), and correlated negatively with sandy sediments (r > -0.7). The annual average concentration of Cd was 0.45 μg g1, showing significantly high correlations in summer with OM, silty sediments, temperature, and salinity of the water (r = 0.7), and significant negative correlations in summer and autumn with sandy sediments and pH (Table 5).

3.8. Trace metal bioavailable fraction in sediments

The average concentrations of Cu, Zn, Mn, Fe, Ni, Cr, and Cd in sediment close to R. mangle trees in the NAV lagoon complex were in the following order: Fe > Mn > Zn > Cr > Ni > Cu > Cd. The concentrations of metals in the bioavailable and total fractions of sediments during the seasons, along with OM, sediment texture, and physicochemical parameters of seawater, showed high Spearman correlations in some parameters. In spring, the BioF of Zn exhibited high significant correlations (p < 0.05) with clay soils (r = 0.8) and high negative correlations with salinity and pH (r = -0.9). In summer, Zn showed positive correlations with OM, lime, and salinity (r = 0.7), and negative correlations with sandy soils and pH (r = -0.8 and r = -0.7, respectively). In autumn, Zn demonstrated high positive correlations with organic matter, lime soils (r = 0.7, r = 0.8, r = -0.8, respectively) and negative correlations with sandy soils, temperature, and salinity (r = -0,7, and r = -0,8, respectively). In winter, Zn showed medium positive correlations with OM, lime soils, and temperature (r = 0.6, r = 0.7, and r = 0.7, respectively), and medium negative correlation with sandy soils (r = -0.8) (Table 6).
Correlation between Cu, Zn, Mn, and Fe and R. mangrove tissue concentration during different seasons of the year.
The Spearman correlation showed some positive significant correlation coefficients (P < 0.05) among the BioF of Cu, Zn and Mn with the trace metal concentrations in the leaves, stem, and root of R. mangle during the different seasons of the year (Table 7).
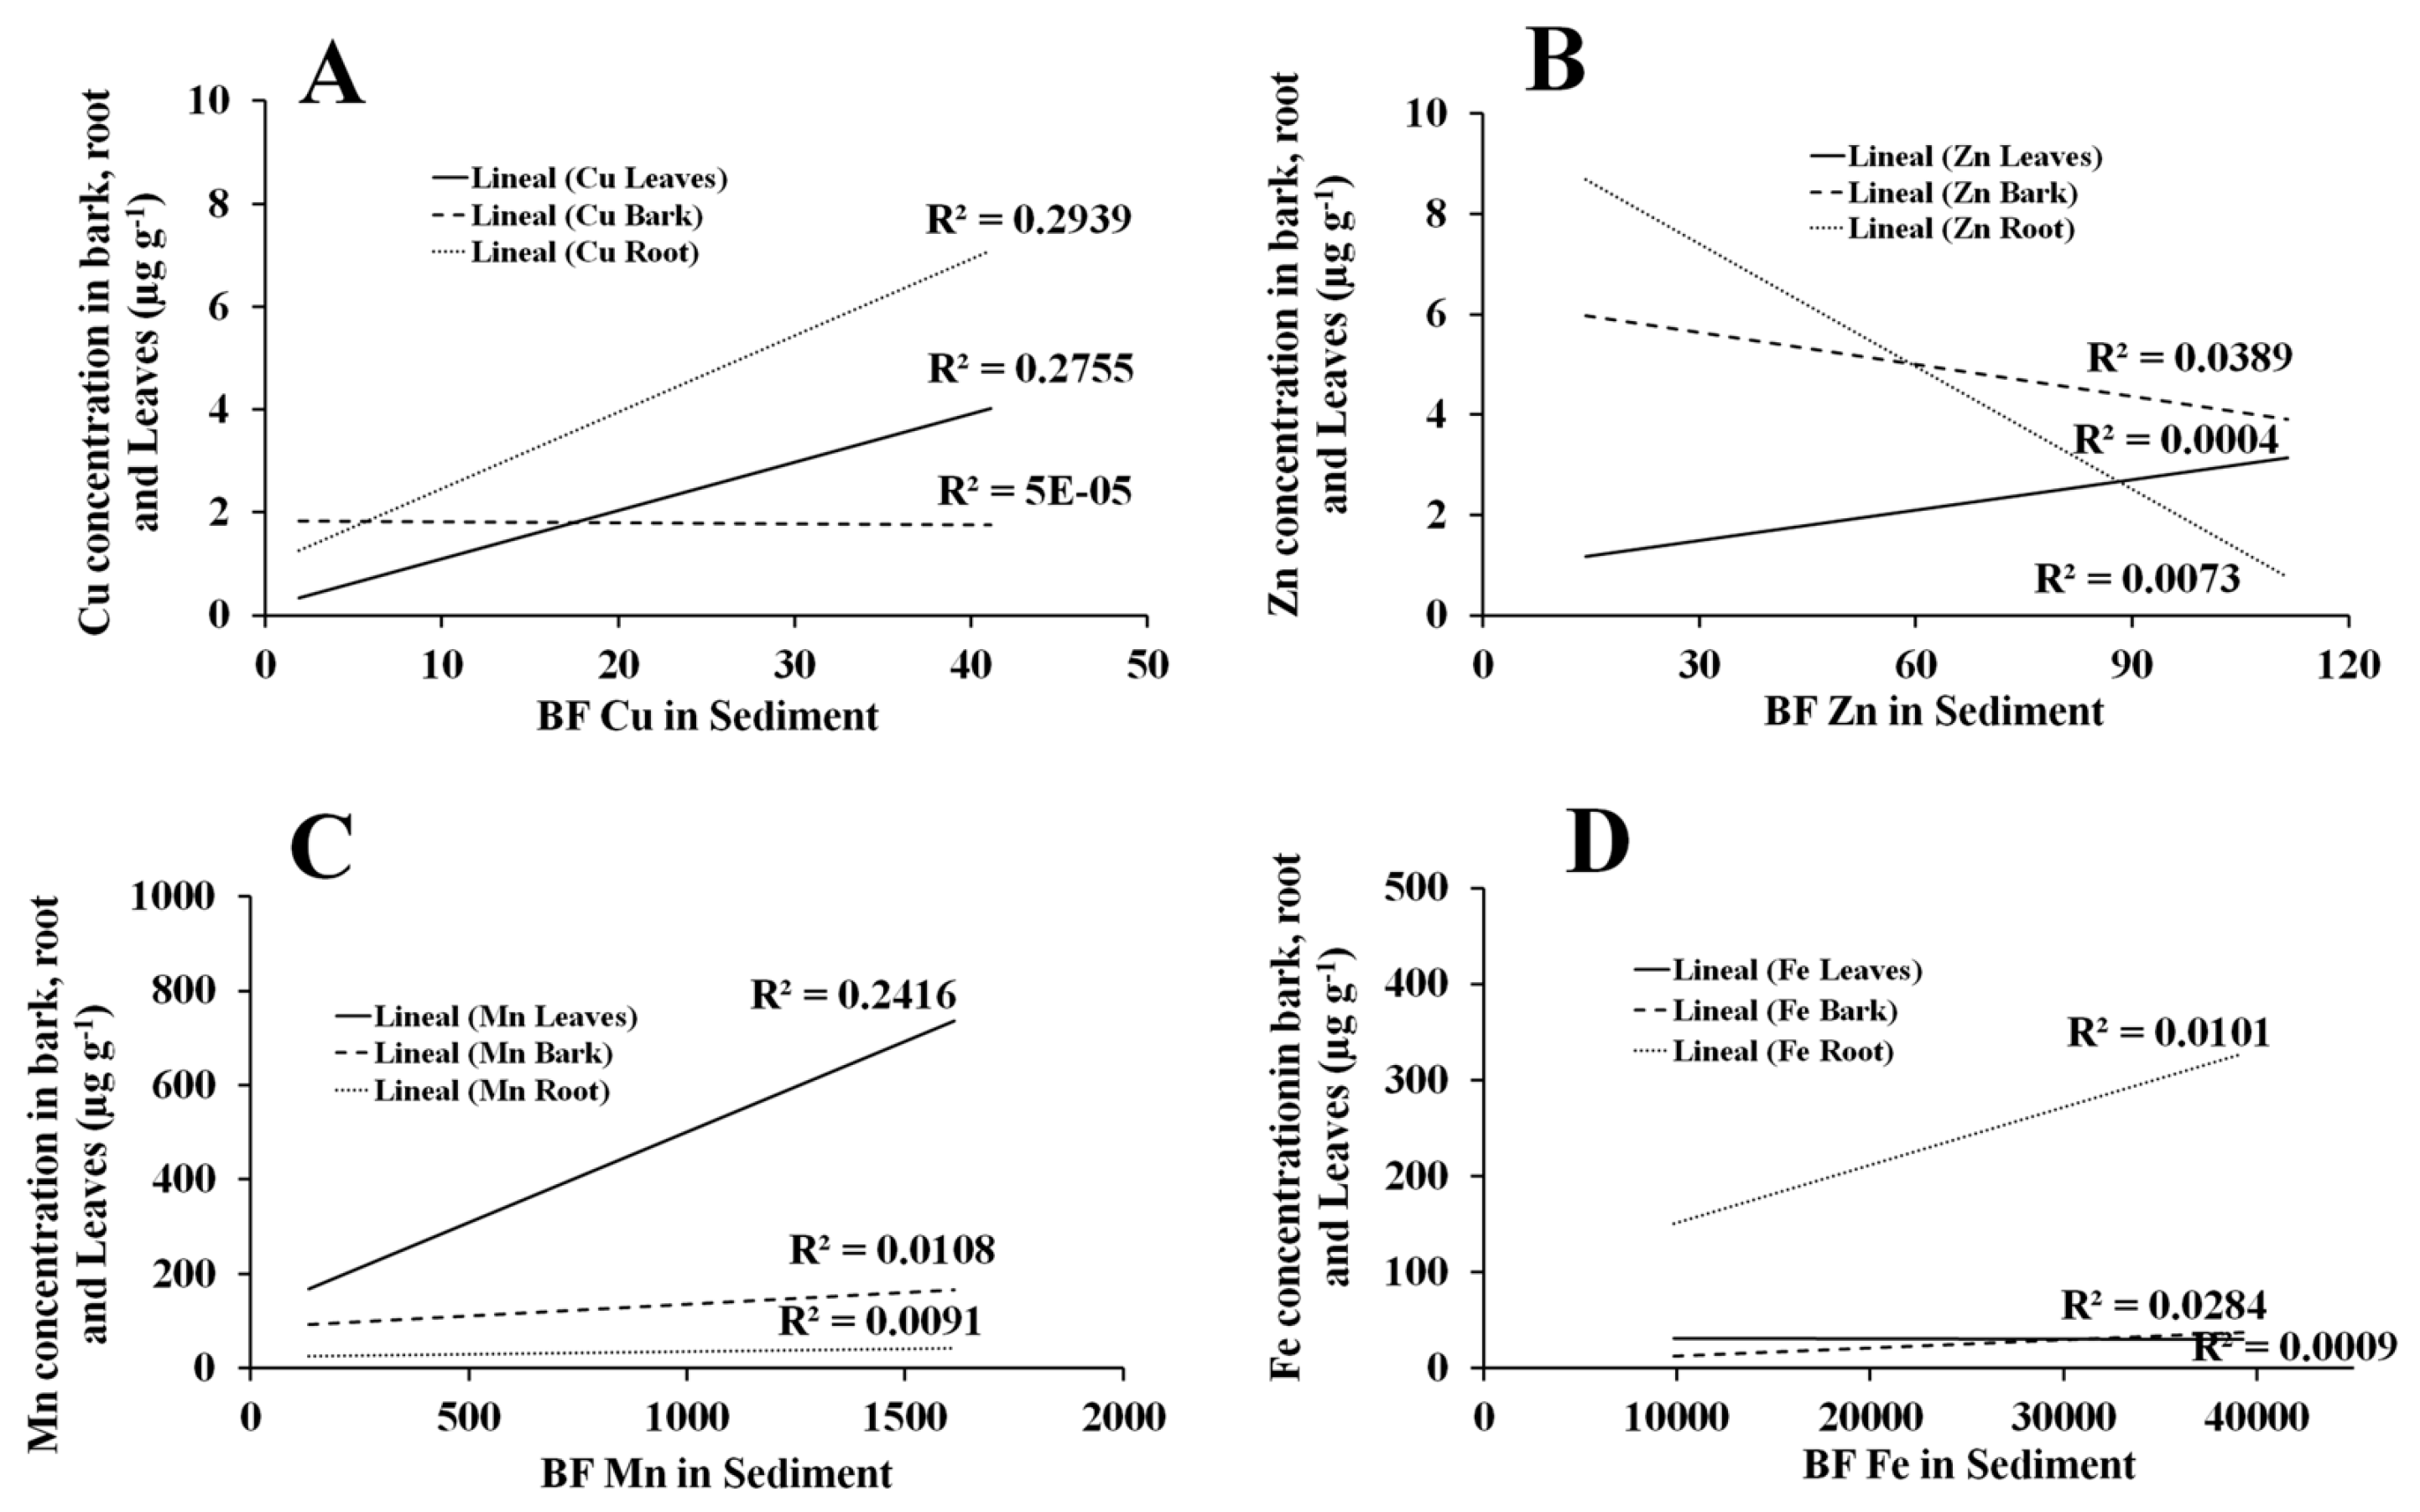
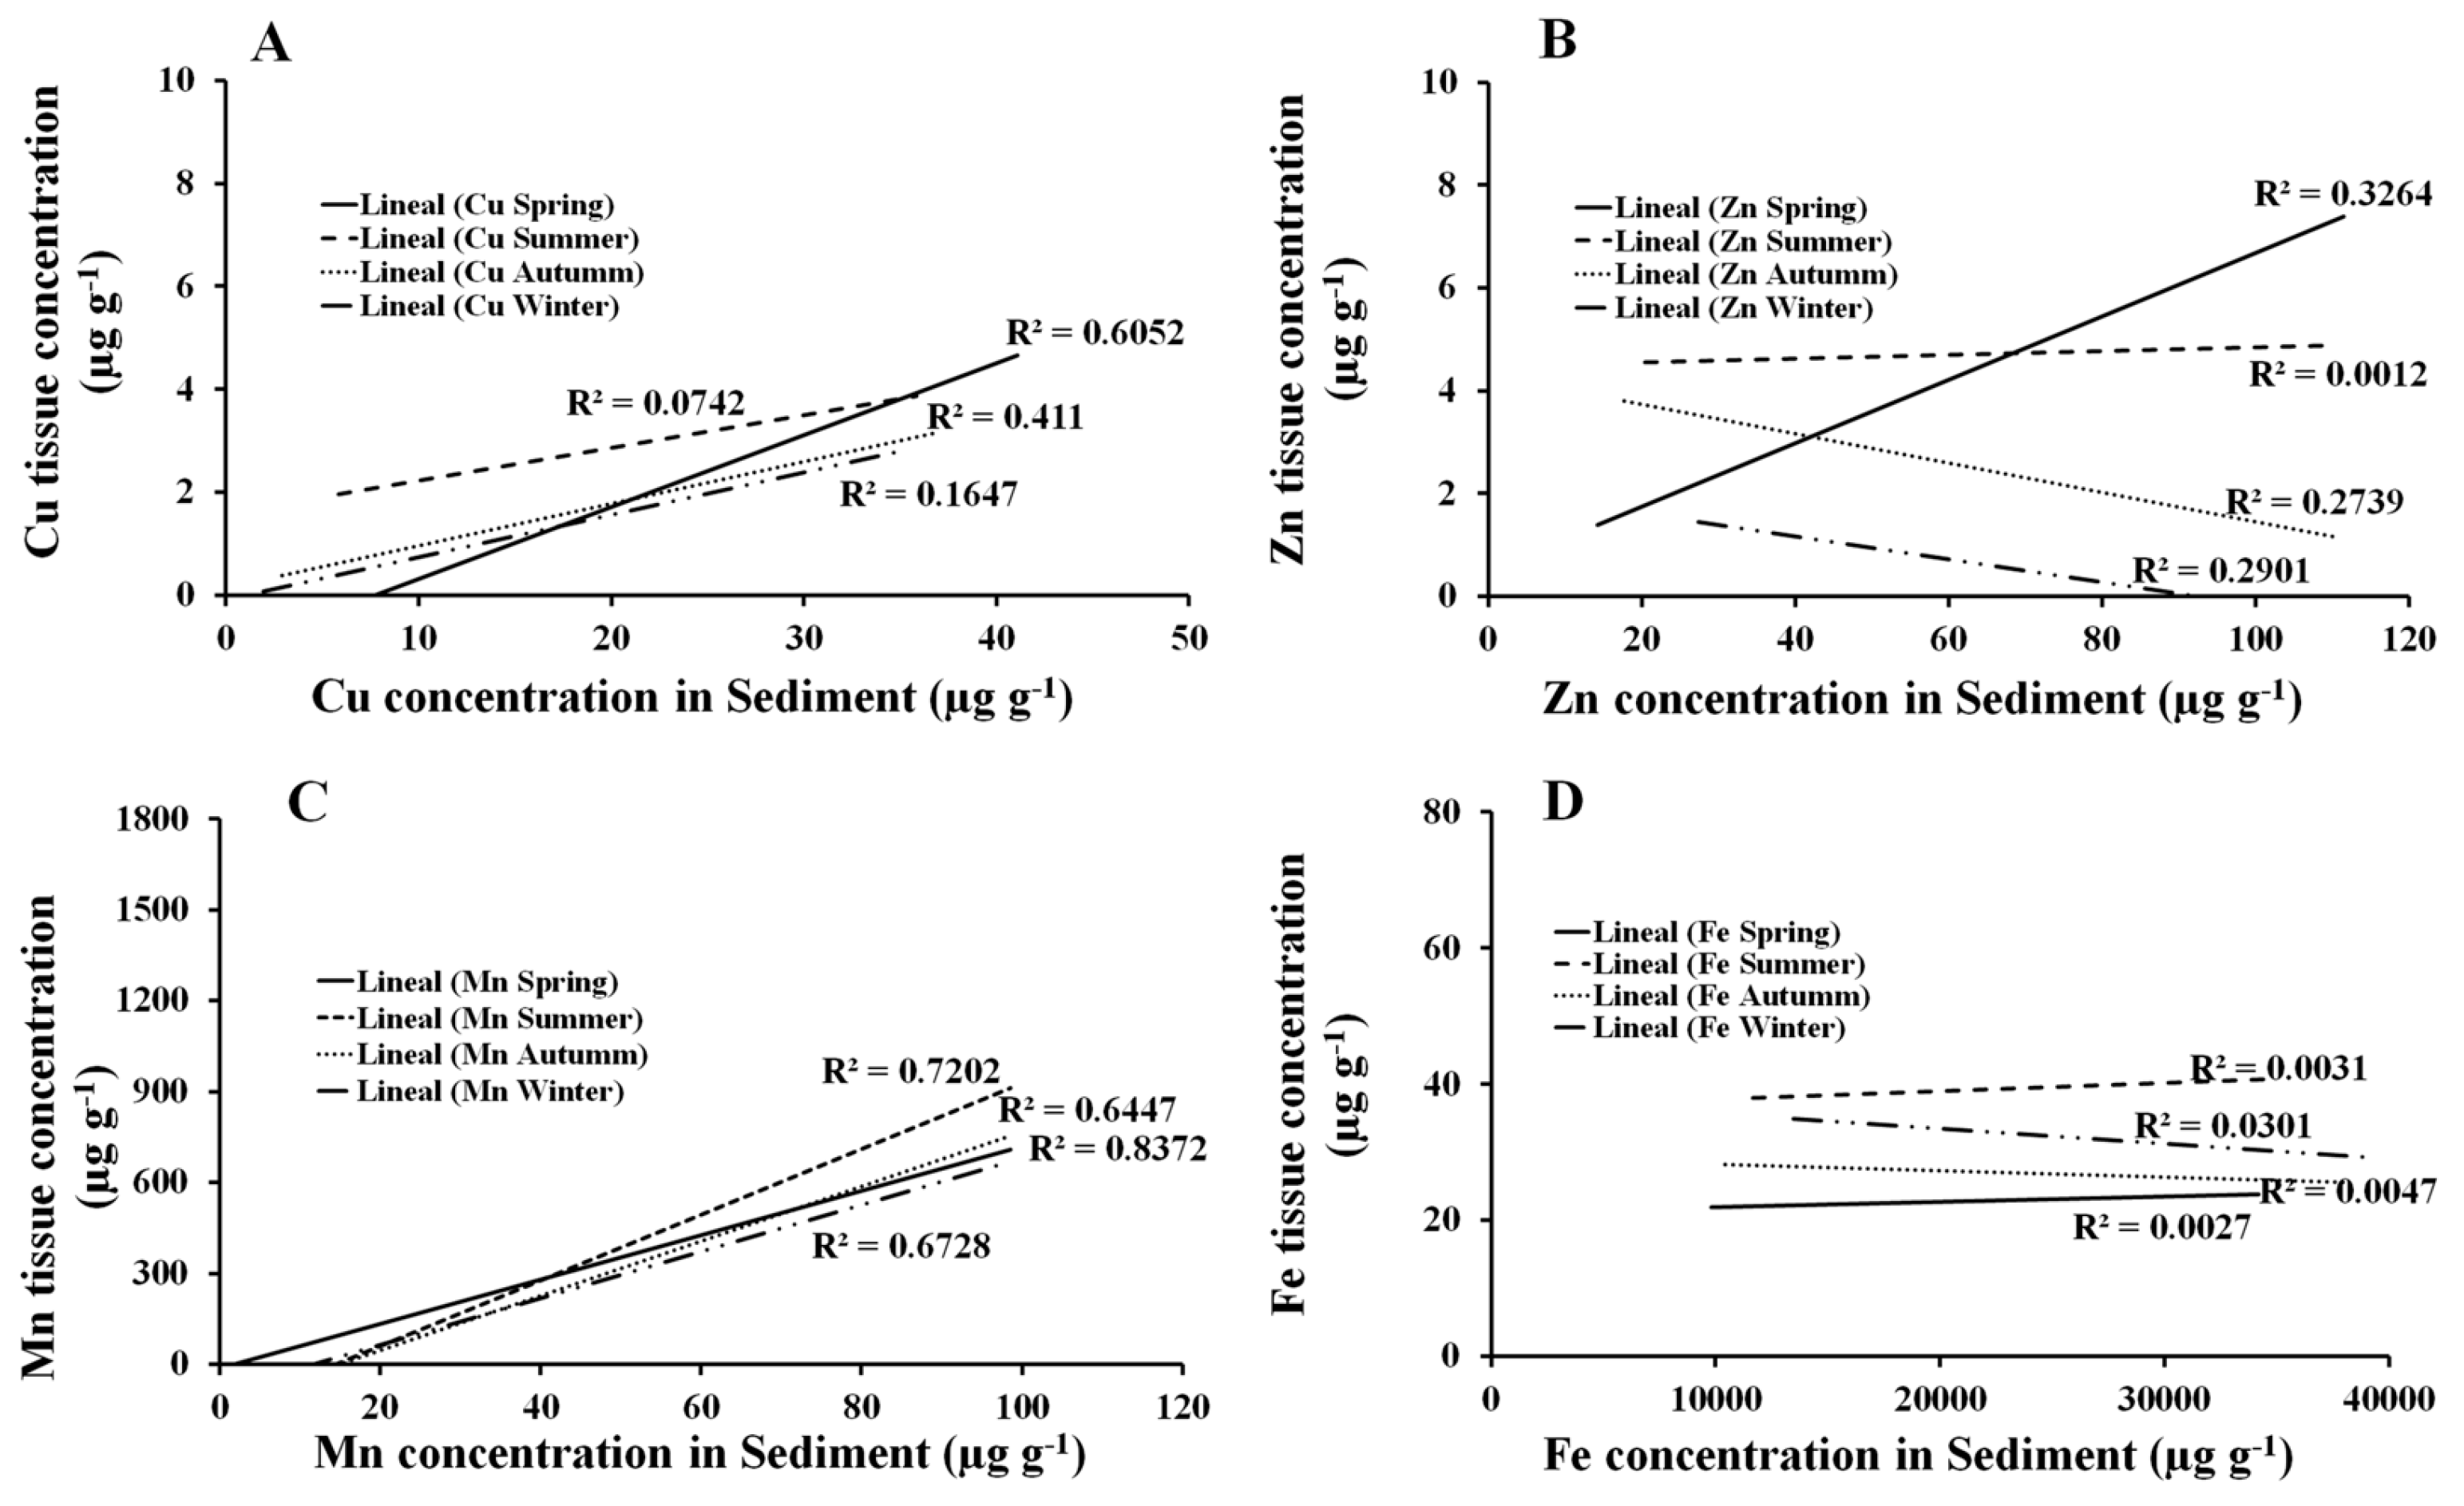
More specifically, a positive linear regression was found between the BioF of Mn in the sediment and the Mn concentration in leaf tissue in all seasons. Cu bioavailability in the sediment showed similar positive linear regressions except for winter, where it did not show this pattern. Zn bioavailability showed positive linear regressions with Zn concentration in stems (spring) and leaves (summer) (Figure 11).

4. Discussion

4.1. Metal pollution in R. mangrove sediment of the Navachiste lagoon complex

Tissue Mn and Cu concentrations in R. mangle can be used as bioindicator data to monitor environmental exposure to some metals. Although the mobility/availability of metals within the soil-plant spectrum depends on OM, suspended O2, texture and pH, the chemical composition of the sediments and mangrove detritus [20,21], in this study, R. mangle demonstrated a significant correlation between the bioavailable contents of Mn and Cu in the sediment and their corresponding contents in its roots and leaves. Other species of this genus, such as R. mucronata, have already been classified as potential phytoremediators due to their ability to translocate trace metals to their tissues [22].
The capacity of mangrove species to translocate trace metals to their tissues is influenced by various parameters, including salinity, pH, Electrical conductivity (EC), Total Dissolved Solids (TDS), biochemical and chemical oxygen demand (BOD and COD), which affect the translocation of trace metals from the sediment to the tissues. Additionally, factors such as the type of sediments, life stage, age, morphology of the tree, and biomass also play a role in this process [5,22].
Physicochemical parameters, such as moderate salinity, stimulate the lignified exodermis, which delays the entry of metals, while a deficiency of N allows the adsorption of metals in the roots [23]. In this study, silt, clay, and OM showed correlations with the highest concentrations of metals, similar to those reported by [24]. The concentrations of trace metals varied between the collection sites of the NAV, but it is evident that the sample sites surrounding mangrove trees with these textural characteristics presented the highest concentrations of trace metals.
Another aspect that can influence the variation of the concentrations between the sites and the collection station are the speeds of the water circulation patterns that influence the rate of sediment deposit [25] and, therefore, the distribution of trace metals in the areas of the NAV lagoon complex. Within the NAV lagoon complex, it has been determined that the strongest currents are found at the entrances that are located among the sand islands [26]. The collection sites close to these areas had the lowest concentrations of metals (Figure 10).
The lack of correlation of the Cu, Zn, Mn, and Fe concentrations between the retention pattern by R. mangrove and collection sites in the NAV lagoon complex or among seasons of the year may be due to the adsorption pattern of metal(oids) that depends on the characteristics of the species’ roots, the amount and type of iron plaques, and the availability of metal ions in aquatic environments [27].
Despite the fact that in previous studies the root is reported as a sump for metals such as Co, Cr, Cu, Fe, Mn, Ni, Pb, Zn, and Hg [6], in this study, this accumulation strategy of metals was not observed in the root but rather in the leaf, which showed the highest correlations of Cu and Mn concentrations throughout most of the year and with the sediment. Unlike other neighboring species, such as L. racemosa, the bioaccumulation of other metals like Al, Pb, and Zn have been documented [8].
The difference in retention, both in the type and concentration of TM, can be attributed to two situations. The first is related to the location of both species on the coastline, with R. mangle situated in front of L. racemosa within the NAV [3]. In other words, possibly the sediments that are geographically more frontal to the coastline are richer in trace metals. This peculiar information makes it possible to expand future research areas perpendicular to the coast to determine this possible correlation. The second explanation could be given by the physiology of the leaves that depends on the species because concentrations of pentacyclic triterpenes and n-alkanes (such as hentriacontane) in the cuticular waxes influence the retention of trace metals [8].
Regarding the total fraction of Mn (563 µg g-1 y-1), it was found to be well above the average Mn content in the earth's crust (95 µg g-1) (Taylor, 1964), which added to its high correlation with Cu, Zn, Cr, and Ni, it could be related to the residues derived from the extensive use of agrochemicals, fertilizers, and pesticides used in agricultural processes (Daulta et al., 2023). For more than 20 years, the use of agrochemicals, such as Maneb® (SYNGENTA®), Zineb (VELSIMEX®), and Cupravit® (BAYER®), have been reported [24,28,29], and it is highly probable that they are still being used (or their derivatives) in the surrounding agricultural region of Guasave. In this sense, studies should be focused on determining the type of agrochemicals used, as well as the concentration of these residues in the sediments of the channels that flow into the NAV. It has been reported that high Mn levels are associated with the presence of Fe-Mn hydroxides due to the deposit of fine sediments in areas with depressions that favor the deposit of sedimentary material [30]. This situation is very present in the NAV, as erosion and deposition dominate the coasts and the islands that compose it, forming large extensions of dunes and gentle slopes with a predominance of sand [31].
The highest values of Zinc (112 µg g-1) were determined to be above the average value of the earth's crust of 70 µg g-1 [32], at various sites within the NAV (Figure 4). According to the EF, the Zn content in the MAB and NAB collection sites was classified as enriched throughout the four seasons of the year, agreeing with the crop cycles of the adjacent agricultural valley and the torrential rains that occur occasionally. This enrichment may be due to metallic residues from chemical fertilizers used in the Guasave valley, for the cultivation of vegetables and grains that increase the concentration of heavy metals in agricultural soil [33]. The increase in concentration adds to the suspended particulate matter, sediments, and water that end up in coastal areas [34]. This area includes the NAV impacted by the Guasave Valley [29], which is the most important agricultural area in Mexico, with more than 400 thousand hectares of intensive cultivation.
The Cr variation during autumn and winter in sediments was closely associated with the concentrations of Cu and Ni, and due to the same anthropogenic origin and the natural erosive contribution of the rocky material associated with the silt fraction of the sediment. Even though in the nearby coastal lagoons, such as Ohuira and Topolobampo, whose Cr concentration has been reported to be lower (29.9 ± 11.9 ppm) [35], it is clear that in the NAV lagoon complex, the contribution of erosive material is greater, managing to form larger areas of dunes and sand islands that make up this coastal lagoon [31]. Another potential source of Cr is through residues of the food used for shrimp in aquaculture, which provides 23 % of the supply accumulated by shrimp [36], and considering that there is a feed conversion rate of 1.79 regarding commercial product [37], it is likely that 6 % of the total 21 % of the uneaten product discharges through the drains towards the lagoon complex.
The annual average concentration of Ni (23 µg g -1), mainly associated with Zn, Cu, Cr, and the silt fraction of the sediment, presented the highest concentrations in spring. At the beginning of this season, intensive irrigation occurs in the agricultural valley of Guasave, slowing down with the beginning of the rains in the summer. This surplus of water carries agricultural residues, including traces of metals such as Ni. However, anthropogenic contamination induces a greater bioavailability of Ni in soils and even greater in soils with high geochemical contribution [38]. This is observed throughout the year, in which Ni values remain below 40 µg g-1, which is less than the concentration in the earth's crust (75 µg g-1) [32]. This can be attributed to the fact that in the areas surrounding the NAV, secondary activities do not present such an important development as is the case with primary activities like agriculture, livestock, and aquaculture.
The highest levels of Cu concentration were closely related to the discharge drains from agricultural areas, as previously described [39]. Cu concentrations were also closely related to discharges from shrimp aquaculture. Regarding shrimp farms, 67% of Cu accumulation by shrimp comes mainly from food ingestion [36]. That is, considering the feed conversion rate [37], it is probable that 17.8 % of Cu that was not consumed in the aquaculture feed of more than 290 thousand hectares of ponds, is discharged to the lagoon complex, increasing the concentrations of Cu. In the same way, the concentration of Cu in the areas receiving agricultural and aquaculture discharges was related to t he time of the year, silt and clay content found in the adjacent sediments of the mangrove trees. It has previously been determined how the concentration of Cu varies notably from the conditions of the pedosphere and in areas with greater impact from anthropogenic sources such as industrial plants, large urban areas, and high-seas ports, where the concentration values are higher [24].
The variation of Cd concentrations in the leaf, stem, and root of R. mangle, even with concentrations present in the sediments during the year, is associated with sediment components potentially reactive to diagenetic processes, such as OM, oxides, and carbonates near the surface [40]. Another source of Cd may come from the use of phosphate fertilizers based on phosphate rocks that are used in agriculture [41]. Another important factor is the 400,000 plus hectares of intensive cultivation in the Guasave Valley, which is likely to be the most important source of Cd. This can also be supported by the high correlation of Cd with those of Zn (r = 0.92) and Fe (r= 0.91) during summer through winter when one of the two irrigation stages occurs in the Guasave Valley and the contributions of waste to the NAV could increase.
The correlation of Fe concentration in sediment with OM content in sediments during the spring and in silt in autumn and winter occurs in alkaline systems where the presence of organic matter and other oxidizable compounds in the sediment prevent constant oxidation due to the interaction with nanoparticles that favor aggregation and sedimentation [42].
For this reason, when there is a greater sedimentation and interaction, the BioF of Fe was found to be higher in summer, specifically regarding concentrations equivalent to the total Fe content in the sediment. The Fe concentrations in the roots were also correlated with the Fe concentrations in the summer. That is, the bioavailability of Fe in the sediment was reduced due to the lower interaction and/or its accumulation through the exclusion/regulation mechanism called "iron plaques" present in the roots of R. mangrove [7]. Other aspects that influence the formation of Fe plaques are the remobilization and introduction of Fe available in Fe-rich sediments, different water conditions, and wetland types, and acidic pH [43,44], which are potentially correlated with the formation of Fe plaques [6].

4.2. Relationship between trace metals in sediments and tissues of R. mangle: bioindicator potential

Unlike previous reports [5], regarding the correlation of metals in leaves and sediments in Avicenia marina, the concentrations of Cu and Zn were 50 % lower in R. mangle leaves. Of particular interest, the regression model showed a positive relationship in the concentration of Cu and Zn in sediments and leaves (except for Zn in winter) (Figure 12A and 12B). Contrary to the Mn concentrations in R. mangle leaves during all four seasons, Mn concentrations were five-times higher than those reported in A. marina, at the same time showing a positive correlation and a similar explained variance (Figure 12C).
The BioF of Fe in sediments showed a high positive linear regression with the concentration of Fe in the roots (Figure 12D). Cd concentrations stand out due to their correlation with certain textures pertaining to the sediment and organic matter in summer and autumn, but not with temperature, salt percentage, and pH, which coincides with previous literature [45,46].
These low concentrations in the dry season could be due to the immobilization of some of its mobile portions as a result of diagenesis, secondary to physicochemical and biological processes [45].
Figure 12. Linear regression model (p < 0.05) between the bioavailable fraction of Cu (a), Zn (b), Mn (c), and Fe (d) in the sediment and leaves, stem, and root of R. mangrove.
Preprints 83535 g012

5. Conclusions

The concentrations of Mn and Cu in the R. mangle leaf could be a potential bioindicator of environmental exposure to anthropogenic sources of contamination due to the presence of these trace metals in sediment. Specifically, a positive linear regression was presented between the bioavailability of Mn in the sediment with the concentration of Mn in leaf tissue constantly throughout the year. Cu bioavailability in the sediment showed similar positive linear regressions except for winter when it did not have this pattern. The rest of the concentrations of TM in the sediments and the seasonal variations in sediments BioF of Fe, Zn, and Cr in the NAV were associated with the natural contributions of eroded rocky material and by terrigenous dragging from the surrounding agricultural and aquaculture area. In the case of Cd and Zn, which showed "enrichment" in the NAB and MAB bays throughout the year associated with the intensive use of agrochemicals from the adjacent agricultural area. Mn, Cr, Ni, and Cu were considered as “conservative” elements, in proportions similar to the average values reported for the earth's crust, that is explained by the seasonal linear regression models which described the relationship of the content of these metals in the BioF of the sediment and leaves of R. mangle.

Author Contributions

HAGO: Conceptualization, Resources, Supervision, Project administration, Funding acquisition, Writing – review & editing. CPO: MSc thesis investigation, Sampling collection and Sample laboratory análisis, Statistical analysis, Writing – original draft. EPG: Laboratory analysis and Field sampling coordination, Statistical analysis, Formal analysis, Writing – review & editing. GDRM: Conceptualization, Methodology, Investigation, Formal analysis, Writing – review & editing. HAGO and GDRM contributed equally to this work as MSc tesis advisors. Authors approved the submitted manuscript.

Funding

This research was funded by the Instituto Politecnico Nacional (Mexico) grants´ number: SIP20130398 and SIP-20130273.

Data Availability Statement

The database support of this article is available by the authors without undue reservation.

Acknowledgments

Thanks to the personnel of the Contamination laboratory of the CIIDIR-Sinaloa, IPN (Mexico) analysis assistance and the fisherman Gaspar Angulo for the valuable sampling collection sites coordination. The authors thanks Mrs. Ingrid Mascher for the English grammar review.

Conflicts of Interest

All authors declare no conflict of interest of any personal circumstances or interest that may be perceived as inappropriately influencing the representation or interpretation of reported research results, design of the study, in the collection, analyses or interpretation of data, or in the writing of the manuscript and decision to publish the results. The funders had no role in any phase of the design of the study and decision to publish the results.

References

  1. Hamilton, S. E.; Casey, D. , Creation of a high spatio-temporal resolution global database of continuous mangrove forest cover for the 21st century (CGMFC-21). Global Ecology and Biogeography 2016, (6), 729–738. [Google Scholar] [CrossRef]
  2. Valderrama-Landeros, L. H.; Rodríguez-Zúñiga, M. T.; Troche-Souza, C.; Velázquez-Salazar, S.; Villeda-Chávez, E.; Alcántara-Maya, J. A.; Vázquez-Balderas, B.; Cruz-López, M. I.; Ressl, R. , Manglares de México: actualización y exploración de los datos del sistema de monitoreo 1970/1980–2015. In Comisión Nacional para el Conocimiento y Uso de la Biodiversidad (CONABIO): Ciudad de México, 2017; p 128.
  3. Carrasquilla-Henao, M.; González Ocampo, H. A.; Luna González, A.; Rodríguez Quiroz, G. , Mangrove forest and artisanal fishery in the southern part of the Gulf of California, Mexico. Ocean Coast Manag 2013, 83, 75–80. [Google Scholar] [CrossRef]
  4. Costa, E. S.; Sá, F.; Gomes, L. E. O.; Silva, C. A.; Lima, A. T.; Lehrback, B. D.; Neto, R. R. , Can severe drought periods increase metal concentrations in mangrove sediments? A case study in eastern Brazil. Sci Total Environ 2020, 748, 142443. [Google Scholar] [CrossRef] [PubMed]
  5. Alam, M. R.; West, M.; Anh Tran, T. K.; Stein, T. J.; Gaston, T. F.; Schreider, M. J.; Reid, D. J.; MacFarlane, G. R. , Metal(loid) accumulation in the leaves of the grey mangrove (Avicennia marina): Assessment of robust sampling requirements and potential use as a bioindicator. Environ Res 2022, 211, 113065. [Google Scholar] [CrossRef] [PubMed]
  6. Robin, S. L.; Marchand, C.; Ham, B.; Pattier, F.; Laporte-Magoni, C.; Serres, A. , Influences of species and watersheds inputs on trace metal accumulation in mangrove roots. Sci Total Environ 2021, 787, 147438. [Google Scholar] [CrossRef]
  7. Machado, W.; Gueiros, B. B.; Lisboa-Filho, S. D.; Lacerda, L. D. , Trace metals in mangrove seedlings: role of iron plaque formation. Wetlands Ecology and Management 2005, (2), 199–206. [Google Scholar] [CrossRef]
  8. Pimentel Victório, C.; Silva dos Santos, M.; Cordeiro Dias, A.; Silvério Pena Bento, J. P.; dos Santos Ferreira, B. H.; da Costa Souza, M.; Kato Simas, N.; do Carmo de Oliveira Arruda, R. , Laguncularia racemosa leaves indicate the presence of potentially toxic elements in mangroves. Sci Rep 2023, (1), 4845. [Google Scholar] [CrossRef]
  9. Yap, C. K.; Al-Mutairi, K. A. , Potentially Toxic Metals in the Tropical Mangrove Non-Salt Secreting Rhizophora apiculata: A Field-Based Biomonitoring Study and Phytoremediation Potentials. Forests 2023, (2), 237. [Google Scholar] [CrossRef]
  10. RAMSAR, RAMSAR Sites Information Service. Ficha Informativa de los Humedales de Ramsar (FIR)- Sistema Lagunar San Ignacio - Navachiste - Macapule, 2006-2008 ed.; The Secretariat of the Convention on Wetlands: Gland, Switzerland, 2018. [Google Scholar]
  11. Folk, R. L. , Petrology of sedimentary rocks. Hemphill publishing company: 1980. https://repositories.lib.utexas.edu/bitstream/handle/2152/22930/folkpetrology.pdf?
  12. Bouyoucos, G. J. , Hydrometer method improved for making particle size analyses of soils. Agronomy Journal 1962, (5), 464–465. [Google Scholar] [CrossRef]
  13. Walkley, A.; Black, I. , An examination of Degtjareff method for determining soil organic matter and a proposed modification of the chromic acid Tritation method. Soil Science 1934, (1), 29–38. [Google Scholar] [CrossRef]
  14. Breder, R. , Optimization studies for reliable trace metal analysis in sediments by atomic absorption spectrometric methods. Z. Anal. Chem. 1982, (5), 395–402. [Google Scholar] [CrossRef]
  15. Luoma, S. N.; Bryan, G. , A statistical assessment of the form of trace metals in oxidized estuarine sediments employing chemical extractants. Sci Total Environ 1981, (2), 165–196. [Google Scholar] [CrossRef]
  16. Szefer, P.; Glasby, G.; Pempkowiak, J.; Kaliszan, R. , Extraction studies of heavy-metal pollutants in surficial sediments from the southern Baltic Sea off Poland. Chem Geol. [CrossRef]
  17. Windom, H. L.; Smith Jr, R. G.; Rawlinson, C. , Particulate trace metal composition and flux across the southeastern US continental shelf. Mar Chem. [CrossRef]
  18. Vasavada, N. One-way ANOVA (Analysis of variance) with post-hoc Tukey HSD (Honestly Significant Difference). Test Calculator for comparing multiple treatments. https://astatsa. 2023. [Google Scholar]
  19. Vasavada, N. Spearman, Pearson's rho, Kendall's tau correlations (for paired sample data). https://astatsa. 2016. [Google Scholar]
  20. Ondrasek, G.; Bakić Begić, H.; Zovko, M.; Filipović, L.; Meriño-Gergichevich, C.; Savić, R.; Rengel, Z. , Biogeochemistry of soil organic matter in agroecosystems & environmental implications. Sci Total Environ 2019, 658, 1559–1573. [Google Scholar] [CrossRef] [PubMed]
  21. Kristensen, E.; Bouillon, S.; Dittmar, T.; Marchand, C. , Organic carbon dynamics in mangrove ecosystems: A review. Aquat Bot 2008, (2), 201–219. [Google Scholar] [CrossRef]
  22. Aboulsoud, Y. I. E.; Elkhouly, A. A. , Evaluation potentiality of Rhizophora mucronata plantation for pollutants remediation on the Red Sea Coast, Egypt. SN Appl Sci 2023, (7), 179. [Google Scholar] [CrossRef]
  23. Cheng, H.; Wang, Y.-S.; Ye, Z.-H.; Chen, D.-T.; Wang, Y.-T.; Peng, Y.-L.; Wang, L.-Y. , Influence of N deficiency and salinity on metal (Pb, Zn and Cu) accumulation and tolerance by Rhizophora stylosa in relation to root anatomy and permeability. Environ Pollut 2012, 164, 110–117. [Google Scholar] [CrossRef] [PubMed]
  24. Soto-Jiménez, M.; Páez-Osuna, F.; Ruiz-Fernández, A. C. , Geochemical evidences of the anthropogenic alteration of trace metal composition of the sediments of Chiricahueto marsh (SE Gulf of California). Environ Pollut 2003, (3), 423–432. [Google Scholar] [CrossRef]
  25. Williams, D. K. , Use of acoustic techniques for the determination of net sediment transport and design of safe navigation channels, marine supply base, Darwin Harbour. In Australasian Coasts & Ports 2017: Working with Nature, Barton, ACT, 2017; pp 1172-1178.
  26. Sánchez-Lindoro, F. d. J.; Jiménez-Illescas, Á. R.; Espinosa-Carreón, T. L.; Obeso-Nieblas, M. , Modelo hidrodinámico en el Sistema Lagunar Navachiste, Guasave, Sinaloa, México. Rev Biol Mar Oceanogr 2017, 52, 219–231. [Google Scholar] [CrossRef]
  27. Zandi, P.; Yang, J.; Darma, A.; Bloem, E.; Xia, X.; Wang, Y.; Li, Q.; Schnug, E. , Iron plaque formation, characteristics, and its role as a barrier and/or facilitator to heavy metal uptake in hydrophyte rice (Oryza sativa L.). Mar Geochem Health. [CrossRef]
  28. Páez-Osuna, F.; Zazueta-Padilla, H. M.; Osuna-López, J. I. , Biochemical composition of the oysters Crassostrea iridescens Hanley and Crassostrea corteziensis Hertlein in the Northwest coast of Mexico: seasonal changes. Journal of Experimental Marine Biology and Ecology 1993, 170, 1–9. [Google Scholar] [CrossRef]
  29. Muñoz Sevilla, N. P.; Villanueva-Fonseca, B. P.; Góngora-Gómez, A. M.; García-Ulloa, M.; Domínguez-Orozco, A. L.; Ortega-Izaguirre, R.; Villegas, L. E. C. , Heavy metal concentrations in diploid and triploid oysters (Crassostrea gigas) from three farms on the north-central coast of Sinaloa, Mexico. Environ Monit Assess 2017, (11), 1–10. [Google Scholar] [CrossRef]
  30. Shumilin, E.; Páez-Osuna, F.; Green-Ruiz, C.; Sapozhnikov, D.; Rodrı́guez-meza, G. D.; Godı́nez-orta, L. , Arsenic, Antimony, Selenium and other Trace Elements in Sediments of the La Paz Lagoon, Peninsula of Baja California, Mexico. Marine Pollution Bulletin 2001, (3), 174–178. [Google Scholar] [CrossRef]
  31. Sánchez-Prieto, M. C.; Luna-González, A.; Espinoza-Tenorio, A.; González-Ocampo, H. A. , Planning ecotourism in coastal protected areas; projecting temporal management scenarios. Sustain. [CrossRef]
  32. Taylor, S. R. , Abundance of chemical elements in the continental crust: a new table. Geochim Cosmochim Acta 1964, (8), 1273–1285. [Google Scholar] [CrossRef]
  33. Soleimani, H.; Mansouri, B.; Kiani, A.; Omer, A. K.; Tazik, M.; Ebrahimzadeh, G.; Sharafi, K. , Ecological risk assessment and heavy metals accumulation in agriculture soils irrigated with treated wastewater effluent, river water, and well water combined with chemical fertilizers. Heliyon. [CrossRef]
  34. Li, D.; Yang, T.; Zhou, R.; Zhu, Z.; An, S. , Assessment and sources of heavy metals in the suspended particulate matter, sediments and water of a karst lake in Guizhou Province, China. Marine Pollution Bulletin 2023, 189, 114636. [Google Scholar] [CrossRef] [PubMed]
  35. Green-Ruiz, C.; Páez-Osuna, F. , Heavy Metal Distribution in Surface Sediments from a Subtropical Coastal Lagoon System Associated with an Agricultural Basin. Bull Environ Contam Toxicol 2003, (1), 0052–0059. [Google Scholar] [CrossRef]
  36. Wang, Q.; Tian, Y.; Wang, J.; Li, J.-y.; He, W.; Craig, N. J. , Assessing pathways of heavy metal accumulation in aquaculture shrimp and their introductions into the pond environment based on a dynamic model and mass balance principle. Sci Total Environ 2023, 881, 163164. [Google Scholar] [CrossRef]
  37. Nababan, Y. I.; Yuhana, M.; Penataseputro, T.; Nasrullah, H.; Alimuddin, A.; Widanarni, W. , Dietary supplementation of Pseudoalteromonas piscicida 1UB and fructooligosaccharide enhance growth performance and protect the whiteleg shrimp (Litopenaeus vannamei) against WSSV and Vibrio harveyi coinfection. Fish Shellfish Immunol 2022, 131, 746–756. [Google Scholar] [CrossRef]
  38. Ding, S.; Guan, D.-X.; Dai, Z.-H.; Su, J.; Teng, H. H.; Ji, J.; Liu, Y.; Yang, Z.; Ma, L. Q. , Nickel bioaccessibility in soils with high geochemical background and anthropogenic contamination. Environ Pollut 2022, 310, 119914. [Google Scholar] [CrossRef]
  39. El-Amier, Y. A.; Bonanomi, G.; Abd-ElGawad, A. M. , Assessment of heavy metals contamination and ecological risks in coastal sediments of the Mediterranean seashore. Reg Stud Mar Sci 2023, 63, 103017. [Google Scholar] [CrossRef]
  40. Soto-Jiménez, M. F.; Páez-Osuna, F. , Diagenetic processes on metals in hypersaline mudflat sediments from a subtropical saltmarsh (SE Gulf of California): Postdepositional mobility and geochemical fractions. Applied Geochemistry 2008, (5), 1202–1217. [Google Scholar] [CrossRef]
  41. de Meeûs, C.; Eduljee, G. H.; Hutton, M. , Assessment and management of risks arising from exposure to cadmium in fertilisers. I. Sci Total Environ 2002, (1), 167–187. [Google Scholar] [CrossRef]
  42. Silva, M. M. d.; Wasserman, M. A. V.; Wasserman, J. C. d. F. A.; Pérez, D. V.; Pereira, T. R.; Barreto, M. B.; Santos-Oliveira, R. , Effect of nanomaterials on the bioavailability of metals in sediments from a highly impacted tropical coastal environment. Environmental Nanotechnology, Monitoring & Management, 0079. [Google Scholar] [CrossRef]
  43. Fang, C. H.; Lee, H. J. , Food-related lifestyle segments in Taiwan: Application of the food-related lifestyle instrument. American Journal of Applied Sciences 2009, (12), 2036–2042. [Google Scholar] [CrossRef]
  44. Ferreira, A. D.; Queiroz, H. M.; Otero, X. L.; Barcellos, D.; Bernardino, Â. F.; Ferreira, T. O. , Iron hazard in an impacted estuary: Contrasting controls of plants and implications to phytoremediation. Journal of Hazardous Materials 2022, 428, 128216. [Google Scholar] [CrossRef] [PubMed]
  45. Nijeje, E.; Senyonjo, A.; Sahan, S. J.; Byamugisha, D.; Ntambi, E. , Speciation of Selected Heavy Metals in Bottom Sediments of River Rwizi, Mbarara City, Uganda. Water, Air, & Soil Pollution. [CrossRef]
  46. Sababa, E.; Ekoa Bessa, A. Z. , Heavy Metals Signature in Stream Sediments at Eséka Gold District, Central Africa: A Pre-mining Environmental Assessment. Chemistry Africa 2022, (2), 413–430. [Google Scholar] [CrossRef]
Figure 1. Study area and location of the collection points of sediment and leaf, stem, and root samples of R. mangle.
Preprints 83535 g001
Figure 2. Average metal concentration of trace metals in the leaf, root, and bark of R. mangle from the Navachiste Lagoon complex, Mexico.
Preprints 83535 g002
Figure 3. Cu concentration during the year in adjacent sediments to R. mangle trees in the Navachiste lagoon complex, Mexico.
Preprints 83535 g003
Figure 4. Zn concentrations during the year in adjacent sediments to R. mangle trees in the Navachiste lagoon complex, Mexico.
Preprints 83535 g004
Figure 5. Mn concentrations during the year in adjacent sediments to R. mangle trees in the Navachiste lagoon complex, Mexico.
Preprints 83535 g005
Figure 6. Fe concentrations during the year in adjacent sediments to R. mangle trees in the Navachiste lagoon complex, Mexico.
Preprints 83535 g006
Figure 7. Ni concentrations during the year in adjacent sediments to R. mangle trees in the Navachiste lagoon complex, Mexico.
Preprints 83535 g007
Figure 8. Cr concentration during the year in adjacent sediments to R. mangle trees in the Navachiste lagoon complex, Mexico.
Preprints 83535 g008
Figure 9. Cd concentration during the year in adjacent sediments to R. mangle trees in the Navachiste lagoon complex, Mexico.
Preprints 83535 g009
Figure 10. Sediment type distribution in adjacent sediments to R. mangle trees in the Navachiste lagoon complex, Mexico.
Preprints 83535 g010
Figure 11. Spearman regression coefficient of the Mn bioavailable fraction in the sediment and leaves from Rhizophora mangle during the different seasons of the year.
Preprints 83535 g011
Table 1. Concentration (µg g-1) of the total fraction of metals in leaf, stem, and root of Rhizophora mangle.
Season Tissue Zn Mn Fe Cd Cr Cu Ni
Spring L 4.60 ± 0.8 352.70 ± 73.27 23.07 ± 3.93 0.005 ± 0.01 2.04 ± 0.18 2.08 ± 0.55 1.03 ± 0.1
S 9.05 ± 5.95 48.27 ± 19.97 12.67 ± 4.77 0.023 ± 0.02 0.74 ± 0.36 0.70 ± 0.25 0.50 ± 0.17
R 2.02 ± 0.65 40.63 ± 9.33 81.00 ± 18.33 1.98 ± 0.11 2.84 ± 0.074 0.80 ± 0.1
Summer L 2.50 ± 0.56 381.07 ± 160.6 39.20 ± 4.9 0.12 ± 0.09 1.58 ± 0.28 0.17 ± 0.1
S 1.43 ± 0.53 215.50 ± 88.2 27.00 ± 12.63 0.56 ± 0.17 0.17 ± 0.07
R 1.43 ± 0.63 47.47 ± 26.57 371.73 ± 223.8 0.0365 ± 0.024 0.30 ± 0.21 2.62 ± 0.91 0.37 ± 0.2
Autumn L 0.96 ± 0.46 310.57 ± 108.8 27.07 ± 3.9 0.012 ± 0.009 0.42 ± 0.29 1.50 ± 0.42 0.06 ± 0.03
S 1.39 ± 0.75 112.20 ± 44.8 15.27 ± 7.87 0.24 ± 0.16 0.44 ± 0.14 0.20 ± 0.03
R 4.37 ± 2.89 67.20 ± 28.83 340.73 ± 212.23 0.31 ± 0.17 2.46 ± 0.89 0.30 ± 0.1
Winter L 0.33 ± 0.13 289.97 ± 78.87 32.23 ± 4.77 0.024 ± 0.015 0.80 ± 0.12 1.92 ± 0.64 0.40 ± 0.07
S 8.16 ± 5.66 82.27 ± 17.63 39.37 ± 16.13 0.76 ± 0.18 0.65 ± 0.19 0.60 ± 0.07
R 12.03 ± 8.14 32.63 ± 10.6 133.37 ± 69.83 0.96 ± 0.14 3.33 ± 1.07 0.43 ± 0.13
L = Leaf, S = Stem, R = Root. Numbers in bold indicate the highest value.
Table 2. Trace metal total fraction concentration (µg g-1) in adjacent sediments to Rhizophora mangle trees.
Season Fe* Cu Zn Mn Ni Cr Cd
Spring 2.3 ± 0.8 19.1 ± 6.83 66.33 ± 22.93 679.93 ± 370.83 28.83 ± 6.87 55.77 ± 41.2 0.3 ± 0.1
Summer 2.17 ± 0.6 16.23 ± 6.57 58.67 ± 20.17 321.4 ± 187.87 30.33 ± 14.2 48.67 ± 8.3 0.47 ± 0.17
Atumn 2.27 ± 0.83 14.27 ± 7.36 55.73 ± 24.1 781.33 ± 372.4 17.83 ± 7.13 40.9 ± 10.2 0.37 ± 0.1
Winter 2.57 ± 1.0 14.3 ± 8.10 59.1 ± 21.83 94.03 ± 52.57 15.77 ± 6.13 45.2 ± 10.83 0.5 ± 0.33
Media ± Standard deviation; n=4. *Concentration (%). Numbers in bold indicate the highest value.
Table 3. Physicochemical parameters of surface water recorded in the three bays of the lagoon complex.
Season T (°C) Salinidad(‰) pH
Spring 19.3 ± 1.03 35.7 ± 1.6 7.40 ± 0.4
Summer 28.47 ± 0.73 40 ± 2.37 7.60 ± 0.37
Autumn 31.1 ± 0.77 34.23 ± 1 7.67 ± 0.13
Winter 22.8 ± 0.15 34.37 ± 0.8 7.3 ± 0.02
Table 4. Enrichment factors (EF) of trace metals in adjacent sediments to Rhizophora mangle per season and annual average in the NAV, Mexico.
Spring Summer Autumm Winter Average
Cu 0.80 0.71 0.56 0.52 0.02
Zn 2.28 2.10 1.85 1.83 2.57
Mn 1.66 0.83 2.29 1.02 1.38
Ni 0.92 1.02 0.58 0.45 0.73
Cr 1.40 1.32 1.07 1.04 1.18
Conservative (2 < EF); Enriched (2 < EF ≤ 10); Highly enriched (EF > 10).
Table 5. Spearman correlation (p < 0.05) between the concentration of metals in the total fraction of the sediment (μg g-1), and the content of organic matter, sediment classes texture, and the physicochemical parameters of seawater.
Spring Summer
Zn Mn Fe Cd Cr Cu Ni Zn Mn Fe Cd Cr Cu Ni
Mn 0.9 0.8
Fe 0.6 0.8 0.9 0.9
Cd - - - - - -
Cr 0.9 0.8 0.7 - 0.7 0.6 0.7 -
Cu 0.7 0.9 0.7 - 0.8 1.0 0.8 1.0 - 0.7
Ni 0.8 0.9 0.7 - 0.8 0.9 0.6 - - - 0.8 -
MO 0.8 0.7 - - 0.6 0.6 0.7 0.7 0.6 0.7 0.7 - 0.7 -
Sand -0.8 -0.9 -0.6 - -0.7 -0.8 -0.9 -0.8 -0.8 -0.8 -0.7 - -0.9 -
Clay 0.8 0.9 - - 0.8 0.9 0.9 - - - - - - -
Lim 0.6 0.7 - - 0.6 0.7 0.8 0.8 0.9 0.8 0.7 - 0.8 -
T °C - - - - - - - - - - 0.7 - - -
Sal ‰ - -0.6 - - - -0.9 -0.8 0.7 0.6 - 0.7 - 0.7 -
pH - -0.6 - - - -0.9 -0.8 -0.7 -0.6 - -0.7 - -0.7 -
Autumm Winter
Zn Mn Fe Cd Cr Cu Ni Zn Mn Fe Cd Cr Cu Ni
Mn - 0.9
Fe 1.0 - 0.9 0.8
Cd - - - - - 0.2
Cr 0.9 - 0.9 - 1.0 0.9 0.8 -
Cu 0.9 - 0.8 0.6 0.9 0.9 0.8 0.6 - 0.9
Ni 1.0 - 0.9 - 0.9 1.0 0.9 0.8 0.7 - 1.0 1.0
MO 0.7 - 0.7 - 0.8 0.8 0.8 0.7 - 0.7 - 0.6 0.6 0.6
Sand -0.8 - -0.7 -0.6 -0.8 -0.9 -0.8 -0.8 -0.6 -0.6 - -0.7 -0.8 -0.8
Clay - - - - - - - - - - - - - -
Lim 0.8 - 0.7 0.6 0.8 0.9 0.8 0.7 - - - 0.7 0.7 0.7
T °C -0.6 - - - - - -0.6 - - - - - 0.7 0.7
Sal ‰ -0.7 - - -0.8 -0.6 -0.7 -0.7 - - - - - - -
pH - - - -0.8 - - - - - - - - - -
Table 6. Spearman's matrix of correlation coefficients (p <0.05) between the concentration of metals in the total fraction with the bioavailable fraction (μg g-1) of the sediment, organic matter, texture of the sediment, and physicochemical parameters of seawater.
Spring Summer
BioF
Zn Mn Fe Cd Cr Cu Ni Zn Mn Fe Cd Cr Cu Ni
Total Frcation Zn - - 0.7 -0.7 - 0.7 - 1.0 0.9 0.9 - - 0.9 0.9
Mn - 0.7 0.8 - - 0.9 - 0.9 0.9 0.7 - - 0.7 0.8
Fe - - 0.6 - - 0.6 - 0.9 0.8 0.9 - 0.6 0.8 0.8
Cd 0.6 - - - - - - - - - 0.7 - - -
Cr - - 0.7 -0.6 - 0.6 - 0.8 0.7 0.7 - 0.9 0.7 0.7
Cu 0.8 0.7 0.9 - - 1.0 - 1.0 0.8 0.9 - - 0.9 0.9
Ni 0.8 0.8 0.9 - - 0.9 0.6 0.6 - - - 0.6 0.6 0.6
BioF Mn 0.6 0.9
Fe 0.8 0.7 0.8 0.7
Cd - - - - - -
Cr - - - - 0.6 - - -
Cu 0.8 0.7 0.8 - - 0.9 0.9 0.8 - -
Ni 0.7 - - - - - 0.9 0.8 0.7 - - 0.9
Physicochemical parameters MO - - 0.7 - - 0.7 0.7 0.7 - - 0.6 - - 0.7
Aren -0.6 -0.7 -0.9 0.6 - -0.8 - -0.8 -0.8 -0.6 - - -0.7 -0.8
Arc 0.8 0.6 0.9 - - 0.9 - - 0.2 - - - - -
Lim 0.7 0.7 0.9 - - 0.7 0.6 0.7 0.8 0.6 - - 0.7 0.7
T °C - - - - - - - - - - - - - -
Sal ‰ -0.9 -0.7 -0.8 - - -0.8 -0.7 0.7 0.7 - 0.6 - 0.6 0.7
pH -0.9 -0.7 -0.8 - - -0.8 -0.7 -0.7 -0.7 - -0.6 - -0.6 -0.7
Autumn Winter
Zn Mn Fe Cd Cr Cu Ni Zn Mn Fe Cd Cr Cu Ni
Total Fraction Zn 0.9 0.7 0.7 - 0.9 0.8 1.0 1.0 0.8 0.6 - 0.9 0.9 0.9
Mn - - - - - - - 0.9 0.7 - - 0.9 0.7 0.9
Fe 0.8 0.8 0.6 - 0.9 0.8 0.9 0.7 - 0.6 - 0.7 - 0.7
Cd 0.6 - - 0.7 - 0.8 0.6 - - 0.6 0.9 - - -
Cr 0.8 0.7 0.7 - 1.0 0.9 0.9 0.9 0.6 - - 0.9 0.8 0.9
Cu 0.9 0.6 0.7 0.7 0.9 0.9 0.9 1.0 0.7 - - 0.8 0.9 0.9
Ni 0.9 0.7 0.7 0.7 0.9 0.9 1.0 1.0 0.7 - - 0.8 0.9 0.9
BioF Mn - 0.8
Fe 0.9 - 0.6 0.7
Cd 0.7 - 0.6 - - 0.7
Cr 0.9 0.7 0.7 0.5 0.8 0.6 - -
Cu 0.8 0.7 0.8 0.7 0.9 0.9 0.8 - - 0.8
Ni 0.9 0.7 0.7 0.7 0.9 0.9 0.9 0.7 - - 0.9 0.9
Physicochemical parameters MO 0.7 0.6 0.8 0.6 0.8 0.9 0.8 0.6 - 0.6 - - 0.6 -
Aren -0.8 - -0.8 -0.8 -0.8 -0.9 -0.8 -0.8 -0.8 -0.8 - -0.7 -0.9 -0.7
Arc - - 0.7 - - - - - -0.6 - - - - -
Lim 0.8 - 0.8 0.7 0.8 0.9 0.8 0.7 0.8 0.8 0.6 0.6 0.9 0.7
T -0.7 - -0.8 - - - - 0.7 - - - - 0.6 0.7
Sal -0.8 - -0.6 -0.8 - -0.7 -0.8 - - - - - - -
pH - - - -0.6 - - - - - - - - - -
Table 7. Spearman correlation coefficients (p<0.05) between the concentration of metals in the bioavailable fraction of the sediment and Rhizophora mangle tissues.
Spring Summer Autumn Winter
BF L S R L S R L S R L S R
Cu 0.78 0.67 0.9 0.75 - - 0.84 0.62 0.74 - - -
Zn - 0.58 - 0.61 - - - - - - - -
Fe - - - - - - - - - - - -
Mn 0.63 - 0.65 0.78 0.89 - 0.76 0.73 - 0.74 0.71 0.66
Cd - - - - - - - - - - - -
Cr - - - - - - - - - - - -
Ni - - - - - - - - - - - -
BioF = Bioccessibility fraction; L = Leaf; S = Stem; R = root.
Disclaimer/Publisher’s Note: The statements, opinions and data contained in all publications are solely those of the individual author(s) and contributor(s) and not of MDPI and/or the editor(s). MDPI and/or the editor(s) disclaim responsibility for any injury to people or property resulting from any ideas, methods, instructions or products referred to in the content.
Copyright: This open access article is published under a Creative Commons CC BY 4.0 license, which permit the free download, distribution, and reuse, provided that the author and preprint are cited in any reuse.
Alerts
Prerpints.org logo

Preprints.org is a free preprint server supported by MDPI in Basel, Switzerland.

Subscribe

© 2025 MDPI (Basel, Switzerland) unless otherwise stated