Submitted:
20 November 2023
Posted:
23 November 2023
You are already at the latest version
Abstract
Keywords:
1. Introduction
2. Literature Review
3. Study Area
4. Methods
5. Findings
5.1. Characteristics of Slum Residents Based on Family Income, Migration Status, and Skills
5.2. Interpolation of Slum Distribution in Palembang City
5.3. Distribution Pattern of Slum Areas through Kernel Density Analysis
5.4. Spatial Data Modeling Analysis on the Slum Areas Distribution in Palembang City
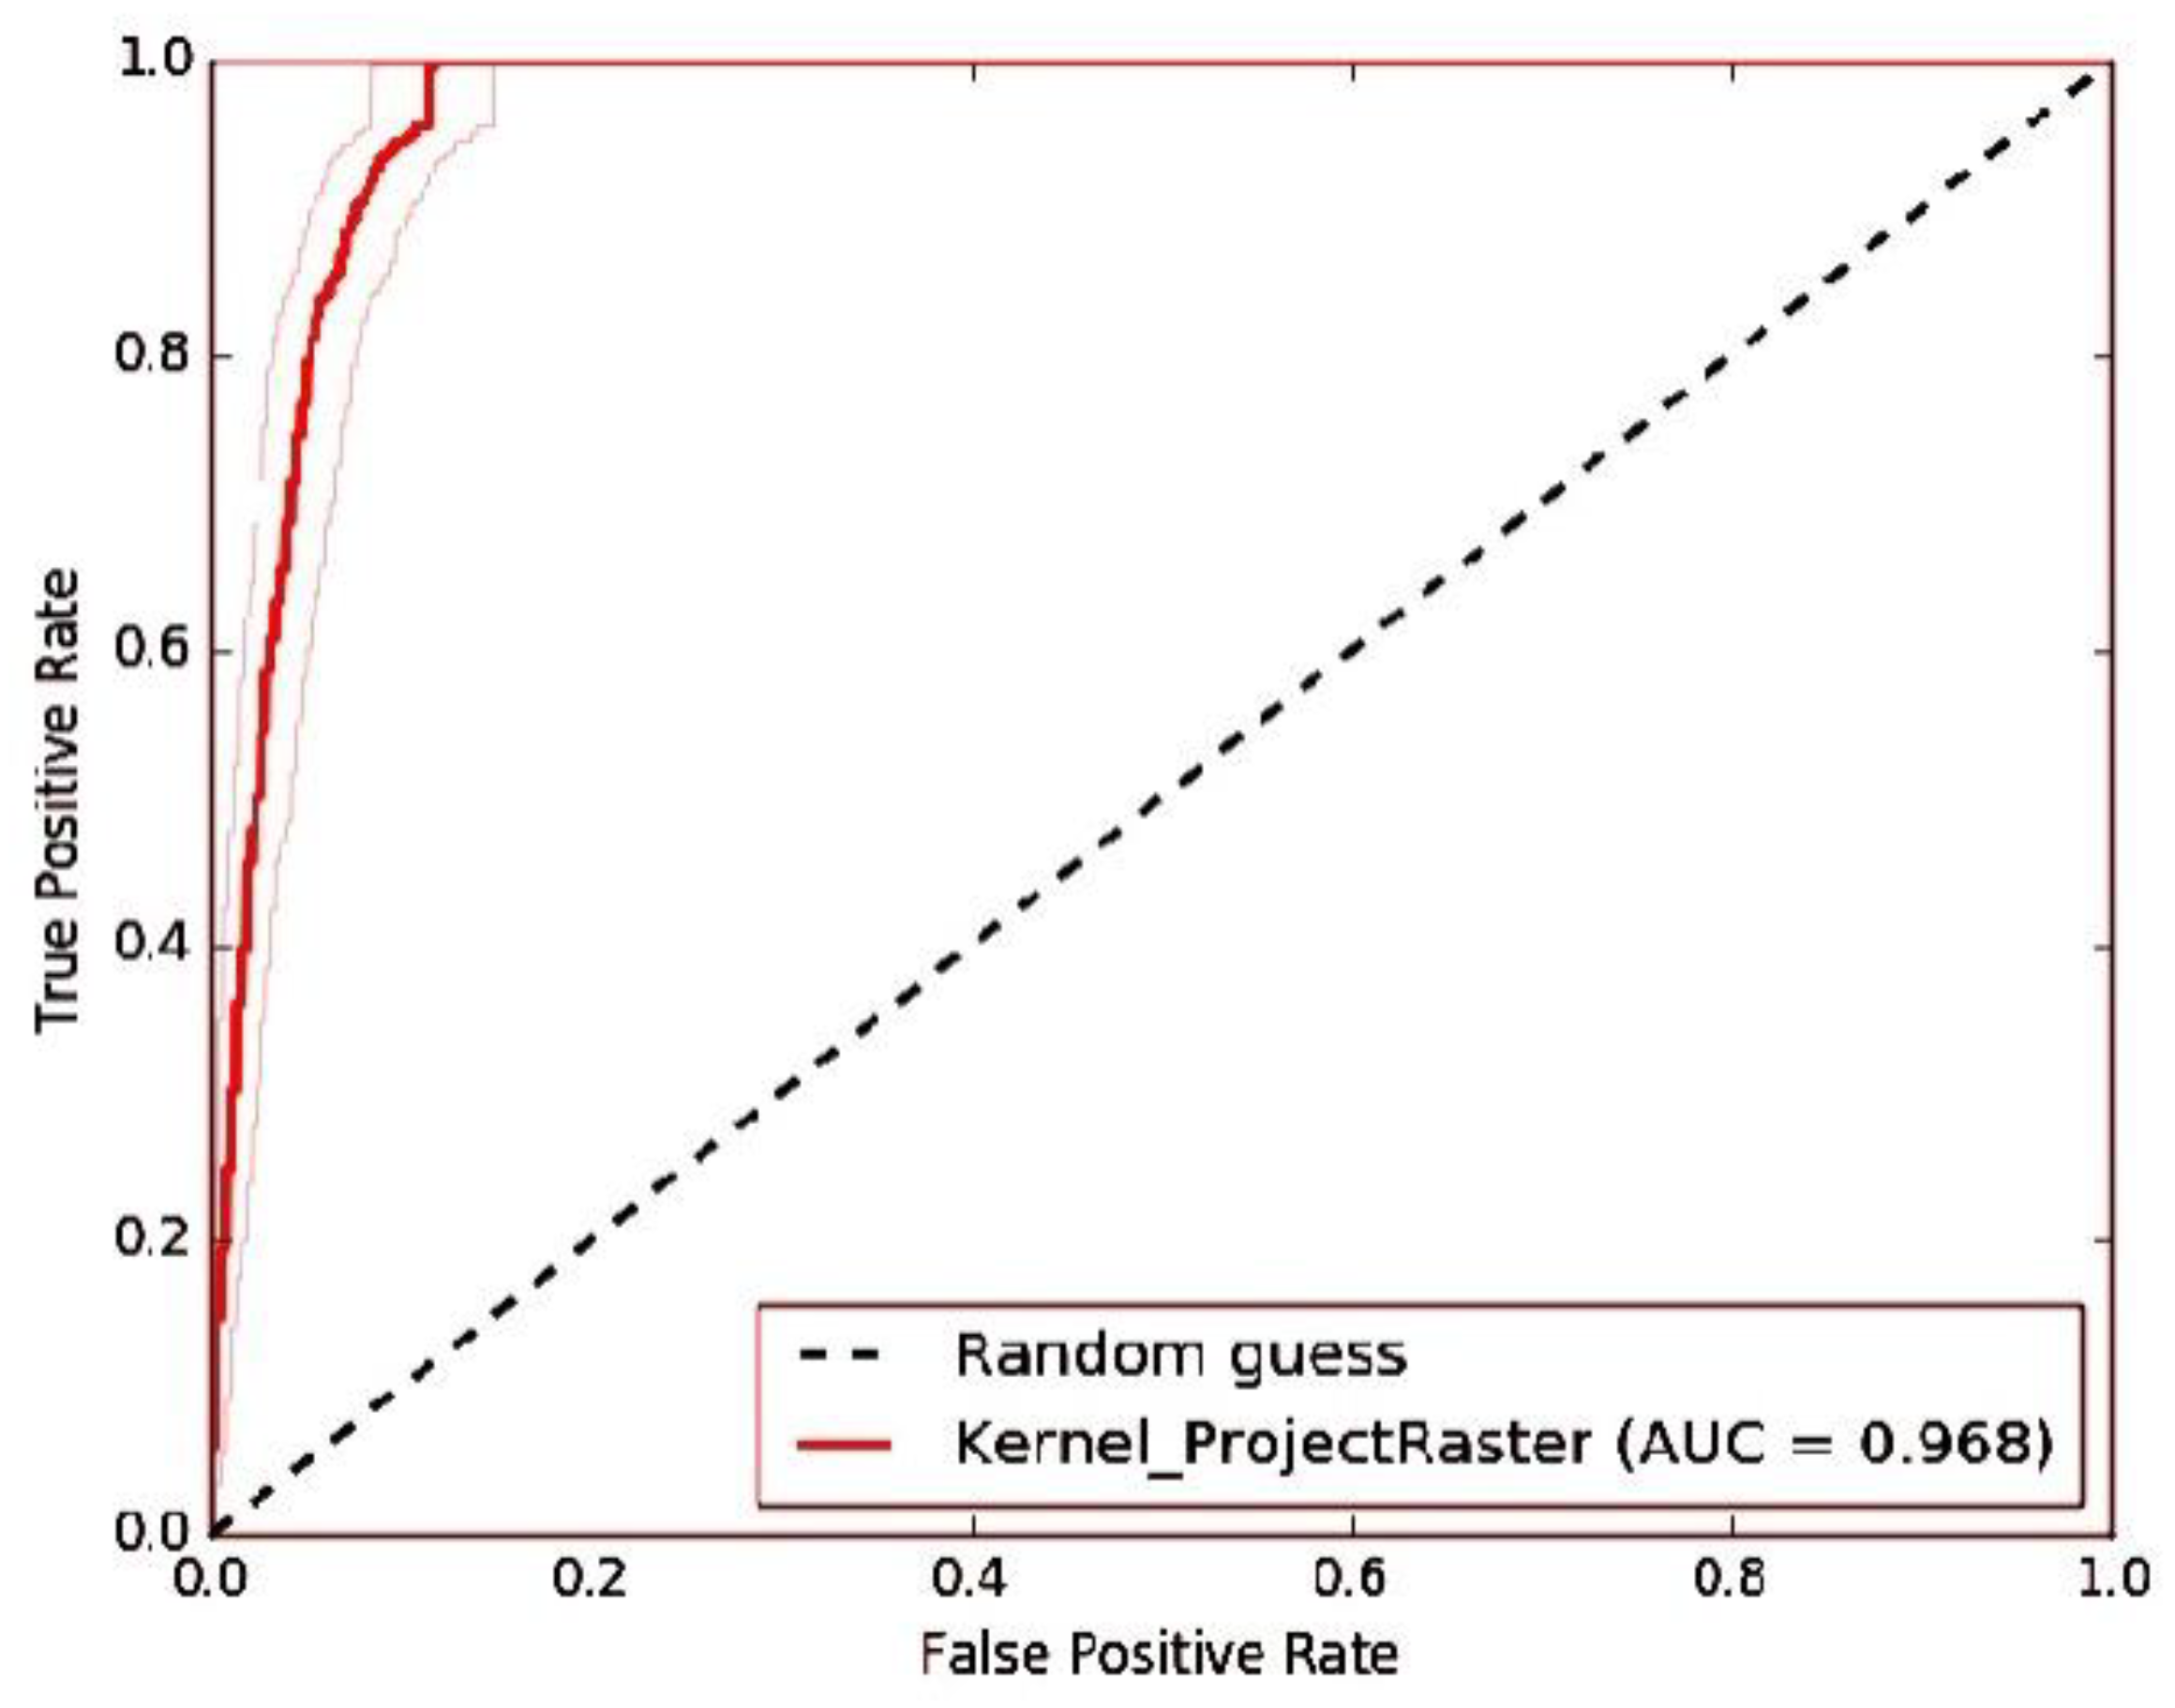
| AUC Value | Test Quality |
| >0.9 – 1 | Excellent |
| >0.8 – 0.9 | Very Good |
| >0.7 – 0.8 | Good |
| >0.6 – 0.7 | Satisfactory |
| 0.5 – 0.6 | Unsatisfactory |
6. Discussion
7. Conclusions
References
- Sukmaniar, A. J. Pitoyo, and A. Kurniawan, “Deviant behaviour in the slum community of Palembang city,” in IOP Conference Series: Earth and Environmental Science, 2021, vol. 683, no. 1, pp. 1–9. [CrossRef]
- K. Sik Lee and A. Anas, “Costs of Deficient Infrastructure: The Case of Nigerian Manufacturing,” Urban Stud., vol. 29, no. 7, pp. 1071–1092, 1992. [CrossRef]
- N. Joshi, A. K. Gerlak, C. Hannah, S. Lopus, N. Krell, and T. Evans, “Water insecurity, housing tenure, and the role of informal water services in Nairobi’s slum settlements,” World Dev., vol. 164, p. 106165, 2023. [CrossRef]
- L. W. Riley, A. I. Ko, A. Unger, and M. G. Reis, “Slum health: Diseases of neglected populations,” BMC Int. Health Hum. Rights, vol. 7, no. 2, pp. 1–6, 2007. [CrossRef]
- J. Bird, P. Montebruno, and T. Regan, “Life in a slum: Understanding living conditions in Nairobi’s slums across time and space,” Oxford Rev. Econ. Policy, vol. 33, no. 3, pp. 496–520, 2017. [CrossRef]
- S. Gulyani and D. Talukdar, “Slum Real Estate: The Low-Quality High-Price Puzzle in Nairobi’s Slum Rental Market and its Implications for Theory and Practice,” World Dev., vol. 36, no. 10, pp. 1916–1937, 2008. [CrossRef]
- W. Hogrewe, S. Joyce, and E. Perez, “The unique challenges of improving peri-urban sanitation,” 1993.
- J. Jalan and M. Ravallion, “Does piped water reduce diarrhea for children in rural India?,” Jan. 2001. [CrossRef]
- L. Haller, G. Hutton, and J. Bartram, “Estimating the costs and health benefits of water and sanitation improvements at global level,” J. Water Health, vol. 5, no. 4, pp. 467–480, Dec. 2007. [CrossRef]
- K. Kar and R. Chambers, Handbook on Community-Led Total Sanitation, vol. 44, no. 0. 2008.
- M. Piesse, “Water Security in Urban India: Water Supply and Human Health,” 2015. [Online]. Available: http://futuredirections.org.au/wp-content/uploads/2015/09/Water_Security_in_Urban_India_Water_Supply_and_Human_Health.pdf.
- R. P. Sindt, “Housing Economics: The Condominium Market in Transition,” Reg. Bus. Rev., vol. 26, pp. 59–71, 2007.
- N. Islam, “Urban Governance In Bangladesh: The Post Independence Scenario,” J. Asiat. Soc. Bangladesh, vol. 58, no. 2, pp. 289–301, 2013.
- Sukmaniar, A. Kurniawan, and A. J. Pitoyo, “Population characteristics and distribution patterns of slum areas in Palembang City: Getis ord gi∗ analysis,” in E3S Web of Conferences, 2020, vol. 200, pp. 1–6. [CrossRef]
- F. Kraas, “Megacities and Global Change in East , Southeast and South Asia,” ASIEN, vol. 103, no. April, pp. 9–22, 2007.
- R. M. Buckley and J. Kalarickal, “Housing policy in developing countries: Conjectures and refutations,” World Bank Res. Obs., vol. 20, no. 2, pp. 233–257, 2005. [CrossRef]
- O. Golubchikov and A. Badyina, Sustainable Housing for Sustainable Cities. 2012.
- H. S. Kim, Y. Yoon, and M. Mutinda, “Secure land tenure for urban slum-dwellers: A conjoint experiment in Kenya,” Habitat Int., vol. 93, no. November 2018, p. 102048, 2019. [CrossRef]
- S. Gulyani, D. Talukdar, and D. Jack, “Poverty, living conditions, and infrastructure access: a comparison of slums in Dakar, Johannesburg, and Nairobi,” World Bank Policy Res., no. July, p. 59, 2010, [Online]. Available: http://papers.ssrn.com/sol3/papers.cfm?abstract_id=1650479.
- S. Gulyani, D. Talukdar, and E. M. Bassett, “A sharing economy? Unpacking demand and living conditions in the urban housing market in Kenya,” World Dev., vol. 109, pp. 57–72, 2018. [CrossRef]
- J. Kangmennaang, E. Bisung, and S. J. Elliott, “‘We Are Drinking Diseases’: Perception of Water Insecurity and Emotional Distress in Urban Slums in Accra, Ghana,” Int. J. Environ. Res. Public Health, vol. 17, no. 3, pp. 1–17, 2020. [CrossRef]
- F. A. Shafie, D. Omar, and S. Karuppannan, “Environmental Health Impact Assessment and Urban Planning,” in Procedia - Social and Behavioral Sciences, 2013, vol. 85, pp. 82–91. [CrossRef]
- D. Bradley, C. Stephens, T. Harpham, and S. Cairncross, “A Review of Environmental Health Impacts in Developing Country Cities,” 1992.
- M. K. Putri, N. Nuranisa, E. T. W. Mei, S. R. Giyarsih, S. Sukmaniar, and W. Saputra, “The characteristics of ethnics people at the banks of musi river in palembang,” IOP Conf. Ser. Earth Environ. Sci., vol. 683, no. 1, 2021. [CrossRef]
- Sukmaniar, A. J. Pitoyo, and A. Kurniawan, “Vulnerability of economic resilience of slum settlements in the City of Palembang,” IOP Conf. Ser. Earth Environ. Sci., vol. 451, no. 1, 2020. [CrossRef]
- B. Marx, T. Stoker, and T. Suri, “The economics of slums in the developing world,” J. Econ. Perspect., vol. 27, no. 4, pp. 187–210, 2013. [CrossRef]
- L. C. Duncker, “Hygiene awareness for rural water supply and sanitation projects,” 2000. [Online]. Available: http://www.fwr.org/wrcsa/819100.htm.
- G. Payne, “Getting ahead of the game: A twin-track approach to improving existing slums and reducing the need for future slums,” Environ. Urban., vol. 17, no. 1, pp. 135–146, Apr. 2005. [CrossRef]
- S. Gulyani and E. M. Bassett, “Retrieving the baby from the bathwater: Slum upgrading in Sub-Saharan Africa,” Environ. Plan. C Gov. Policy, vol. 25, no. 4, pp. 486–515, 2007. [CrossRef]
- S. Hossain, “The production of space in the negotiation of water and electricity supply in a bosti of Dhaka,” Habitat Int., vol. 36, no. 1, pp. 68–77, Jan. 2012. [CrossRef]
- S. Gulyani, D. Talukdar, and R. M. Kariuki, “Universal (non)service? Water markets, household demand and the poor in urban Kenya,” Urban Stud., vol. 42, no. 8, pp. 1247–1274, 2005. [CrossRef]
- S. L. Murthy, “Land security and the challenges of realizing the human right to water and sanitation in the slums of Mumbai, India,” Health Hum. Rights, vol. 14, no. 2, pp. 61–73, 2012, [Online]. Available: https://www.jstor.org/stable/40277691.
- H. De Soto and H. P. Diaz, “The mystery of capital. Why capitalism triumphs in the West and fails everywhere else,” Canadian Journal of Latin American & Caribbean Studies, vol. 27, no. 53. 2002.
- E. Duflo, S. Galiani, and M. Mobarak, “Improving Access to Urban Services for the Poor,” Abdul Latif Jamelle Poverty Action Lab Rep., no. October, pp. 1–44, 2012, [Online]. Available: https://www.povertyactionlab.org/sites/default/files/publications/USI Review Paper.pdf.
- M. O. Asibey, M. Poku-Boansi, and I. O. Adutwum, “Residential segregation of ethnic minorities and sustainable city development. Case of Kumasi, Ghana,” Cities, vol. 116, no. May 2020, p. 103297, Sep. 2021. [CrossRef]
- Ezeh et al., “The history, geography, and sociology of slums and the health problems of people who live in slums,” Lancet, vol. 389, no. 10068, pp. 547–558, Feb. 2017. [CrossRef]
- Sukmaniar, A. Kurniawan, and A. J. Pitoyo, “Hazard Level of Slum Areas in Palembang City,” in IOP Conference Series: Earth and Environmental Science, 2021, vol. 884, no. 1, pp. 1–10. [CrossRef]
- S. Fox, “The Political Economy of Slums: Theory and Evidence from Sub-Saharan Africa,” World Dev., vol. 54, pp. 191–203, 2014. [CrossRef]
- R. J. Lilford, O. Oyebode, D. Satterthwaite, G. J. Melendez-Torres, Y. F. Chen, and B. Mberu, “Improving the Health and Welfare of People who Live in Slums,” Lancet, vol. 389, no. 10068, pp. 559–570, 2017. [CrossRef]
- S. Croese, L. R. Cirolia, and N. Graham, “Towards Habitat III: Confronting the disjuncture between global policy and local practice on Africa’s ‘challenge of slums,’” Habitat Int., vol. 53, pp. 237–242, 2016. [CrossRef]
- S. Nakamura, “Does slum formalisation without title provision stimulate housing improvement? A case of slum declaration in Pune, India,” Urban Stud., vol. 54, no. 7, pp. 1715–1735, 2017. [CrossRef]
- M. Huchzermeyer, “Slum upgrading in Nairobi within the housing and basic services market: A housing rights concern,” J. Asian Afr. Stud., vol. 43, no. 1, pp. 19–39, 2008. [CrossRef]
- E. M. Bah, I. Faye, and Z. F. Geh, Housing market dynamics in Africa. Springer Nature, 2018. [CrossRef]
- P. Garau and E. D. Sclar, “Interim Report of the Task Force 8 on Improving the Lives of Slum Dwellers,” 2004.
- J. Quan, “Reflections on the Development Policy Environment For Land and Property Rights, 1997–2003,” 2003.
- K. Deinlnger and H. Binswanger, “The Evolution of the World Bank’s Land Policy: Principles, Experience, and Future Challenges,” World Bank Res. Obs., vol. 14, no. 2, pp. 247–276, Aug. 1999. [CrossRef]
- A. Kagawa, “Policy Effects and Tenure Security Perceptions of Peruvian Urban Land Tenure Regularisation Policy in the 1990s,” ESF/N-AERUS Int. Work., vol. 23, pp. 1–12, 2001.
- K. Deininger, Land policies for growth and poverty reduction, vol. 41, no. 09. 2004.
- K. Haldrup, “From Elitist Standards to Basic Needs – Diversified Strategies to Land Registration Serving Poverty Alleviation Objectives,” 2nd FIG Reg. Conf., pp. 1–16, 2003.
- A. Durand-Lasserve, E. Fernandes, G. Payne, and C. Rakodi, “Social and economic impacts of land titling programs in urban and periurban areas: A short review of the literature,” Urban L. Mark. Improv. L. Manag. Success. Urban., no. March, pp. 133–161, 2009. [CrossRef]
- E. M. Bassett, “The Persistence of the Commons: Economic Theory and Community Decision-Making on Land Tenure in Voi, Kenya,” African Stud. Q., vol. 9, no. 3, pp. 1–29, 2007.
- J. Lobo, M. Alberti, and M. Allen-Dumas, “Urban Science: Integrated Theory from the First Cities to Sustainable Metropolises,” SSRN Electron. J., no. January, 2020. [CrossRef]
- A. Azhar, H. Buttrey, and P. M. Ward, “‘Slumification’ of Consolidated Informal Settlements: A Largely Unseen Challenge,” Curr. Urban Stud., vol. 09, pp. 315–342, 2021. [CrossRef]
- M. Azpurua and K. dos Ramos, “A comparison of spatial interpolation methods for estimation of average electromagnetic field magnitude,” Prog. Electromagn. Res. M, vol. 14, no. January, pp. 135–145, 2010. [CrossRef]
- C. A. Nanda, A. L. Nugraha, and H. S. Firdaus, “Analisis Tingkat Daerah Rawan Kriminalitas Menggunakan Metode Kernel Density Di Wilayah Hukum Polrestabes Kota Semarang,” J. Geod. Undip, vol. 8, no. 4, pp. 50–58, 2019, [Online]. Available: https://ejournal3.undip.ac.id/index.php/geodesi/article/viewFile/25144/22354.
- B. W. Silverman, “Density Estimation for Statistics and Data Analysis,” Technometrics, vol. 29, no. 4, pp. 1–13, 2018. [CrossRef]
- D. A. Ghertner, “Analysis of new legal discourse behind Delhi’s slum demolitions,” Econ. Polit. Wkly., vol. 43, no. 20, pp. 57–66, 2008, [Online]. Available: https://www.jstor.org/stable/40277691.
- L. Feler and J. V. Henderson, “Exclusionary policies in urban development: Under-servicing migrant households in Brazilian cities,” J. Urban Econ., vol. 69, no. 3, pp. 253–272, 2011. [CrossRef]
- O. Gruebner et al., “A spatial epidemiological analysis of self-rated mental health in the slums of Dhaka,” Int. J. Health Geogr., vol. 10, no. 36, pp. 1–15, 2011. [CrossRef]
| Family Income (IDR) |
Migra-tion Status | Number of respondents (head of families) based on skills (percentage) |
Total | ||||||||||||||||
| Construc-tion | Martial arts | Trade | Farming | Tailor | Contract worker | Iron welding | Car welding | Cooking | Fishing | Teaching | Quran teaching | Driving | Car repair | Care-taker | Hair-dresser | No | |||
| 1. 500,000–1,000,000 | Migrant | 1 (0.26%) |
- | - | - | 1 (0.26%) | - | - | - | 2 (0.52%) |
- | - | 1 (0.26%) |
- | - | - | - | 11 (2.88%) |
16 (4.18%) |
| Non-migrant | - | - | - | - | - | - | - | - | 3 (0.78%) |
- | - | - | - | - | - | - | 11 (2.88%) |
14 (3.66%) |
|
| >1,000,000–1,500,000 | Migrant | - | - | - | - | - | - | - | - | 2 (0.52%) |
- | - | - | 3 (0.78%) |
- | - | - | 6 (1.57%) |
11 (2.87%) |
| Non-migrant | - | - | 3 (0.78%) |
2 (0.52%) |
2 (0.52%) |
- | - | - | - | - | - | - | 4 (1.05%) |
- | - | - | 17 (4.55%) |
28 (7.42%) |
|
| >1,500,000–2,000,000 | Migrant | - | - | - | - | - | - | 1 (0.26%) |
- | 1 (0.26%) |
1 (0.26%) |
1 (0.26%) |
- | 3 (0.78%) |
- | - | - | 25 (6.54%) |
32 (8.36%) |
| Non-migrant | 2 (0.52%) |
- | 3 (0.78%) |
6 (1.57%) |
- | - | - | 1 (0.26%) |
3 (0.78%) |
1 (0.26%) |
- | - | 4 (1.05%) |
- | - | - | 47 (12.30%) |
67 (17.52%) |
|
| >2,000,000 | Migrant | - | 1 (0.26%) |
4 (1.05%) |
- | - | - | 1 (0.26%) |
- | 5 (1.31%) |
4 (1.05%) |
2 (0.52%) |
- | 7 (1.83%) |
1 (0.26%) |
1 (0.26%) |
- | 62 (16.23%) |
88 (23.03%) |
| Non-migrant | - | 3 (0.78%) |
5 (1.31%) |
3 (0.78%) |
- | 1 (0.26%) |
- | 3 (0.78%) |
3 (0.78%) |
2 (0.52%) |
1 (0.26%) |
- | 6 (1.57%) |
4 (1.05%) |
- | 1 (0.26%) |
94 (24.61%) |
126 (32.96%) |
|
| Total | 3 (0.78%) |
4 (1.04%) |
15 (3.92%) |
11 (2.87%) |
3 (0.78%) |
1 (0.26%) |
2 (0.52%) |
4 (1.04%) |
19 (4.95%) |
8 (2.09%) |
4 (1.04%) |
1 (0.26%) |
27 (7.06%) |
5 (1.31%) |
1 (0.26%) |
1 (0.26%) |
273 (71.56%) |
382 (100.00%) |
|
Disclaimer/Publisher’s Note: The statements, opinions and data contained in all publications are solely those of the individual author(s) and contributor(s) and not of MDPI and/or the editor(s). MDPI and/or the editor(s) disclaim responsibility for any injury to people or property resulting from any ideas, methods, instructions or products referred to in the content. |
© 2023 by the authors. Licensee MDPI, Basel, Switzerland. This article is an open access article distributed under the terms and conditions of the Creative Commons Attribution (CC BY) license (http://creativecommons.org/licenses/by/4.0/).


