
You are currently viewing a beta version of our website. If you spot anything unusual, kindly let us know.
Preprint
Article
The Impact of Avoidable Mortality Changes on Life Expectancy at Birth in Korea, 2000-2020
Altmetrics
Downloads
113
Views
48
Comments
0


This version is not peer-reviewed
Abstract
This study investigated mortality discrepancies in Korea, 2000-2020, with a focus on age, gender, and preventable causes of death, and their impact on life expectancy at birth. The study utilized data from Korean Standard Classification of Diseases and OECD/Eurostat lists of preventable and treatable causes of death and employed Arriaga's method. Noteworthy findings revealed gender disparities in life expectancy increases, with male gaining an advantage over females from 2000-2020 (8.142 years for males versus 6.806 years for females). The most significant increase in life expectancy was found to be in males aged 70-74 and females aged 75-79. The gender gap in LEB is narrowing and that the main age group contributing to the gender gap are getting older. Reduced gains in life expectancy at birth resulted from avoidable mortality, contributing 57.3% to the increase. Cerebrovascular disease and transport accidents were positive contributors, whereas suicide and certain cancers were negative contributors. The changes in mortality for individuals aged 65 and over had an impact of 45.44% (males) and 71.01% (females) on life expectancy gains. This study offers a novel approach in evaluating avoidable mortality and life expectancy, having the potential to improve international health indicators and inform health policies.
Keywords:
Subject: Public Health and Healthcare - Public Health and Health Services
1. Introduction
In health at a glance 2021, the Organization for Economic Cooperation and Development (OECD) lists life expectancy at birth(LEB) and avoidable mortality as part of the population health system performance indicators for health status [1].
LEB is a key measure of population health and is often used to evaluate health system performance [2]. Globally, LEB is continuously increasing, including in Korea. Although LEB indicates the average length of length, it fails to provide any insight into the range of life expectancies. In practice, it has the limitation of not reflecting the differences in LEB between subgroups of the population. Therefore, to fully understand the health of a population, it is important to understand the contribution of subgroups of the population to LEB [3].
The main goal of a healthcare system is to improve overall health and ensure an equitable distribution of health outcomes across different subgroups. In this regard, gender health inequalities are of considerable importance as they reflect distinctions in social framework, including political and economic establishments and health and social policies [4]. According to WHO statistics, the gap in LEB between males and females is significant, with females living an average of 5.1 years longer than males globally in 2019 [5]. The gender gap in LEB may be explainable by biological, behavioral, and social-economic factors [6,7]. Given that health systems can enhance the longevity and population health by ensuring timely access to affordable and high-quality healthcare [9] it is also possible that public health policies and access to quality health care have contributed to the gender gap in LEB because it has been differentially distributed to males and females [10]. It is therefore important to examine the extent to which health policies and quality of healthcare contribute to the distribution of health outcomes across sociodemographic groups, including males and females.
Avoidable mortality refers to an unnecessary premature death that could be preventable by timely and suitable interventions and effective healthcare policy. It has long been recognized as an indicator of healthcare system performance [11]. Avoidable mortality can be divided into two distinct categories: preventable and treatable. Preventable mortality is the deaths that can be preventable through appropriate primary healthcare interventions or public health programs. Treatable mortality is defined as deaths that can be avoided through timely and effective medical interventions at the secondary and tertiary healthcare levels [11]. In South Korea, avoidable mortality continues to decline due to efficient healthcare policies [12]. South Korea's avoidable mortality rate in 2018 was 144.0 deaths per 100,000 population, which is lower than the OECD average (199.7) and has decreased significantly over 18 years compared to 2000 (344) [12]. Currently, various health policies are being identified and tried to further reduce avoidable mortality. To do so, it is necessary to understand the impact of different potentially avoidable causes of death on LEB.
Several studies have examined the impact of avoidable mortality on LEB. Avoidable mortality was first applied to population-level studies by Charlton, J et al [13]. They selected 14 disease groups to identify regional variation in avoidable mortality in England and Wales and found that regional variation in avoidable mortality resulted in significant variation in the quality of healthcare [13]. The first study to examine trends in avoidable mortality in Korea found that avoidable mortality declined significantly between 1982-1991 (37.4% in 1982 and 24.9% in 1991), especially among males, and cited acute respiratory diseases, malnutrition, pneumonia, and influenza as the leading causes. A follow-up to that study suggested that the reduction in avoidable mortality resulted in improved LEB [14]. Bahk, J et al. used the UK Office for National Statistics' cause of death list to assess the impact of avoidable mortality on LEB growth from 1998-2017 [15]. They found that changes in avoidable causes of death contributed more than 50% to the increase in LEB, and that avoidable causes of death such as cerebrovascular disease and traffic accidents were the main causes of the increase in LEB [15].
This study aims to identify the contribution of age and gender to the change in LEB in Korea over the past two decades and to analyze the impact of avoidable mortality on LEB. The results would provide insights into the causes of the increase in LEB in Korea.
2. Materials and Methods
2.1. Data Source
The statistical data used in this study were life table (1970 to 2020) and annual mortality data (2000 to 2020) from the Korea National Statistical Office. Annual LEB for both gender was calculated with standard demographic techniques [16]. Mortality data contained the number of deaths by 5-year age group, gender and cause for every year from 2000 to 2020. Causes of death were classified by Korean Standard Classification of Diseases and OECD/Eurostat lists of preventable and treatable causes of death (Table S1) [17]. 11 disease category-specific causes of death and several significant single diseases within the disease groups.
2.2. Analytical Method
Arriaga's decomposition method was applied to discern the roles of age, gender disparities, and causes of death in the increase in LEB [18]. This method assesses the impact of mortality changes across age groups and causes of death on the overall LEB shift within a defined period. As LEB reflects age-specific mortality rates, alterations in mortality rates across various age brackets dictate the overall change in LEB over time [18]. Therefore, the total shift in LEB results from the accumulation of years either added (positive contribution) or subtracted (negative contribution) to the LEB due to changes in mortality rates across different age segments within the specified period.
Furthermore, the cumulative years contributed by specific age groups to changes in LEB can also be parsed by causes of death [18]. Analogous to the age-based decomposition, reductions in mortality associated with specific causes within particular age groups lead to positive contributions to the overall change in LEB, while causes with increased mortality have negative contributions. Hence, the sum of cause-specific contributions aligns with the comprehensive contribution for each age group, ultimately culminating in the combined influence of age- and cause-related factors on LEB.
To summarize the method for measuring the years of life attributed to the increase in LEB due to changes in the sinusoidal structure, the process is as follows: The change in LEB arises from changes in mortality at each specific age, reflecting an increase or decrease in years of life gained or lost due to changes in the central mortality rate.
The number of years contributed to the increase in LEB by the change in mortality within a specific age group from the baseline year (0 year) to the comparison year (1 year), denoted as the change in mortality in the specific age group (), can be expressed using equation (1).
If the change in total mortality in age group j is denoted as = the change in mortality for each cause of death (C) can be represented as = .
The change in mortality within a particular age group, represented as (where s is the group of causes of death), is the sum of changes in mortality from each cause within the same age group. The contribution of each cause's change in a particular age group to the increase in LEB (equation 2) can be expressed as a ratio of total life expectancy.
3. Results
3.1. Life Expectancy at Birth in Korea, 1970-2020
Figure 1 presents the trends of LEB by gender in Korea from 1970 to 2020. LEB had continued to increase for both males and females, although the rate of increase is gradually slowing down. From 1970 to 2020, The LEB increased at an average annual rate of 0.42 years (0.43 years for males and 0.41 years for females). The difference in LEB between males and females shows that female's LEB had always been higher than male's (Table S2).
3.2. Age-Specific Contribution to Life Expectancy at Birth
The age-specific contribution to the increase in LEB from 2000 to 2020 was examined separately for males and females. The period of the study was also divided into two sub-periods, 2000-2010 and 2010-2020.
From 2000 to 2020, LEB increased by 8.142years for males and 6.806 years for females. In both 2000-2010 and 2010-2020, LEB increased more for males than for females. In 2000-2010, the increase in LEB was 4.494 years for males and 3.967 years for females, and in 2010-2020, the increase in LEB was 3.648 years for males and 2.839 years for females. Comparing the gains in LEB between the two periods, both males and females experienced more gains in LEB in 2000-2010 than in 2010-2020 (Table S3 and Figure 2).
Looking at the age groups that contributed most to LEB gains for both genders, over the 20-year period LEB increased by more than 0.2 years for males after the age of 35 and for females after the age of 55. When broken down by decade, LEB gains of more than 0.1 years for males were observed in the 35-39 age group in the period 2000-2010 and in the 40-44 age group in the period 2010-2020 (Table S3 and Figure 2a), while LEB gains of more than 0.1 years for females were observed in the 50-54 age group in the period 2000-2010 and in the 60-64 age group in the period 2010-2020 (Table S3 and Figure 2b). Thus, the age-specific contributions to LEB gains were found to be made by females around 20 years older than males.
Over the 20-year period, the age groups with the largest increases in LEB were 70-74 years (1.105 years, 13.57%) and 65-69 years (0.996 years, 12.23%) for males, and 75-79 years (1.189 years, 17.47%) and 70-74 years (1.032 years, 15.16%) for females. At the decade level, it was 65-69 years (0.590 years, 13.13%) for males in 2000-2010 (Table S3 and Figure 2a) and 70-74 years (0.572 years, 15.68%) in 2010-2020, and 75-79 years (0.659 years, 16.61% and 0.530 years, 18.67%, respectively) for females in both periods (Table S3 and Figure 2b). Thus, the gains in LEB were largely driven by those aged 65 and over.
Taken together, these results suggest that the main contribution to the increase in LEB in Korea since 2000 has been made by those aged 65 and over, with relatively large contributions from those aged 70-74 for males and 75-79 for females.
3.3. Gender Gap in Life Expectancy at Birth
The difference in LEB between males and females was determined in three years: 2000, 2010 and 2020. In 2000, male LEB was 72.3 years and female LEB was 79.7 years, a difference of 7.4 years. In 2010, male LEB was 76.8 years and female LEB was 83.6 years, a difference of 6.8 years, and in 2020, male LEB was 80.5 years and female LEB was 86.5 years, a difference of 6.0 years. In all three years, female LEB was about six to seven years higher than male LEB.
When the difference in LEB between males and females is broken down by age, the age group 0-44 does not have a significant impact on the gender gap in LEB, as the difference between male and female LEB is less than 0.5 years in all three years and contributes less than 20% to the difference in LEB between males and females (Table S4 and Figure 3). In contrast, the gender gap in LEB was greater than 0.5 years in 2000 for those aged 45-79, in 2010 for those aged 50-84 and in 2020 for those aged 60-85 and over. The age groups with the highest gender gaps were 60-64 years (0.959 years, 13.10%) in 2000, 70-74 years (0.952 years, 14.01%) in 2010 and 75-79 years (0.862 years, 14.40%) in 2020.
It shows that the gender gap in LEB is narrowing and that the main age group contributing to the gender gap in LEB are getting older.
3.4. Contribution of Avoidable Mortalities to Life Expectancy at Birth
To determine the contribution of changes in causes of death due to avoidable mortality to LEB, cause of death data and life tables from Korea National Statistics Office as the main data.
Changes in mortality can be attributed to changes in the age-specific cause of death structure. The change in age-specific cause of death can be evaluated as a positive or negative contribution to the increase in LEB. A positive contribution is an increase in LEB due to a decrease in mortality, while a negative contribution is a decrease in LEB due to an increase in mortality. Some conditions that do not appear in the OECD/Eurostat list of avoidable causes of death (236 items) are included in the list of co-morbidities. Among the 13 major categories, Adverse effects of medical and surgical care were excluded as the category was not found in Korean mortality data. Hepatitis, cirrhosis, and fibrosis causes of death were classified as digestive system diseases according to Korean Standard Classification of Diseases.
3.4.1. Contribution of Avoidable Mortalities to Life Expectancy at Birth, 2000-2010
Using the Office for National Statistics data on causes of death from 2000 to 2010 and the life tables from 2000 and 2010, we calculated the contribution of avoidable mortalities to LEB in each age group over the 10-year period (Table S5).
For males, the increase in LEB due to avoidable mortalities was 3.118 years. Of these, 0.856 years (27.5%) were due to treatable mortality and 2.262 years (72.5%) to avoidable mortalities, with avoidable mortality being more than 2.5 times greater than treatable mortality. The highest contribution to LEB gains was in the 65-69 age group (0.509 years), and the lowest in the 10-14 age group (0.019 years). Cerebrovascular diseases (0.672 years), transport accidents (0.472 years) and fibrosis and cirrhosis of the liver (0.472 years) make positive contributions to LEB gains (Table S5). For cerebrovascular disease, the gain in LEB begins to increase by more than 0.1 year after the age of 60, while for transport accidents the effect is more widespread across all age groups than for specific age groups. For fibrosis and cirrhosis of liver, LEB increases by 0.05 to 0.08 years between the ages of 40 and 69, while liver disease seems to affect middle-aged people. Negative contributors to LEB were intentional self-harm (0.307 years), colorectal cancer (0.027 years) and viral hepatitis (0.021 years).
For females, the contribution of avoidable mortalities to LEB was lower than for males, at 1.702 years. Of these, 0.723 years (42.5%) were due to treatable mortality and 0.979 years (57.5%) to avoidable mortalities (Table S5). The highest contribution to LEB gains was in the 70-74 age group (0.458 years), and the lowest in the 25-29 age group (-0.009 years). Cerebrovascular disease (0.612 years), diabetes mellitus (0.194 years) and transport accidents (0.186 years) made a positive contribution to LEB. For cerebrovascular disease, the contribution to LEB starts to increase after the age of 60, with a gain of more than 0.1 years, and for transport accidents, the contribution to LEB is similar for all age groups (0.09 to 0.018 years) except for age 0. For diabetes mellitus, the contribution was higher in the 55+ age group at 0.176 years (89.3%). The negative contributors to LEB were intentional self-harm (0.189 years), breast cancer (0.022 years) and viral hepatitis (0.017 years), with intentional self-harm and viral hepatitis being the same for males.
When the avoidable mortalities of males and females were divided into treatable and preventable mortalities, preventable mortality contributed more than treatable mortality, except at age 0 (Table S6 and Figure 4). Only at age 0 is the treatable mortality rate high, suggesting that medical interventions are important in reducing infant mortality.
Comparing avoidable mortalities in 11 broad categories, the gains in LEB for males and females were higher for diseases of the circulatory system (0.863 years for males and 0.776 years for females), cancer (0.733 years for males and 0.292 years for females) and diseases of the digestive system (0.501 years for males and 0.108 years for females) (Table S7 and Figure 5).
In summary, the contribution of diseases of the circulatory system and cancer to the change in LEB between 2000 and 2010 was higher for males than for females, for diseases than for conditions, and for older age groups than for younger age groups for both genders.
3.4.2. Contribution of Avoidable Mortalities to Life Expectancy at Birth, 2010-2020
Using the Office for National Statistics data on causes of death from 2010 to 2020 and the life tables from 2010 and 2020, we calculated the contribution of avoidable mortalities to LEB in each age group over the 10-year period (Table S8).
For males, the gain in LEB due to avoidable mortalities was 2.220 years (0.425 years for treatable mortality and 1.796 years for preventable mortality), with the contribution of preventable mortality being about four times greater than that of treatable mortality (Table 10). The highest contribution to LEB gains was in the 70-74 age group (0.489 years) and the lowest in the 10-14 age group (0.008 years) (Table S8). Positive contributions to LEB gains were made by cerebrovascular diseases (0.270 years), transport accidents (0.257 years) and liver cancer (0.251 years). Compared with 2000-2010, viral hepatitis, which was a negative cause, may have become a positive cause in 2010-2020 due to advances in medical technology or improvements in services over time. The contribution to the increase in LEB was higher in the post-60 age group for cerebrovascular diseases and in the post-45 age group for liver cancer. Pneumonia (0.052 years) and sepsis (0.016 years) made a negative contribution to LEB.
For females, the contribution of avoidable mortalities to LEB was 1.131 years, of which 0.349 years (31%) were due to treatable mortality and 0.783 years (69%) to avoidable mortalities.
The highest contribution to LEB gains was in the 70-74 age group (0.345 years), and the lowest in the 15-19 age group (0.003 years) (Table S8). The positive contributors to LEB are cerebrovascular disease (0.211 years), diabetes mellitus (0.108 years) and transport accidents (0.104 years), with both cerebrovascular disease and diabetes mellitus contributing more to LEB in the post-60 age group than in other age groups. Breast cancer (0.016 years) and pneumonia (0.016 years) contribute negatively to the reduction in LEB.
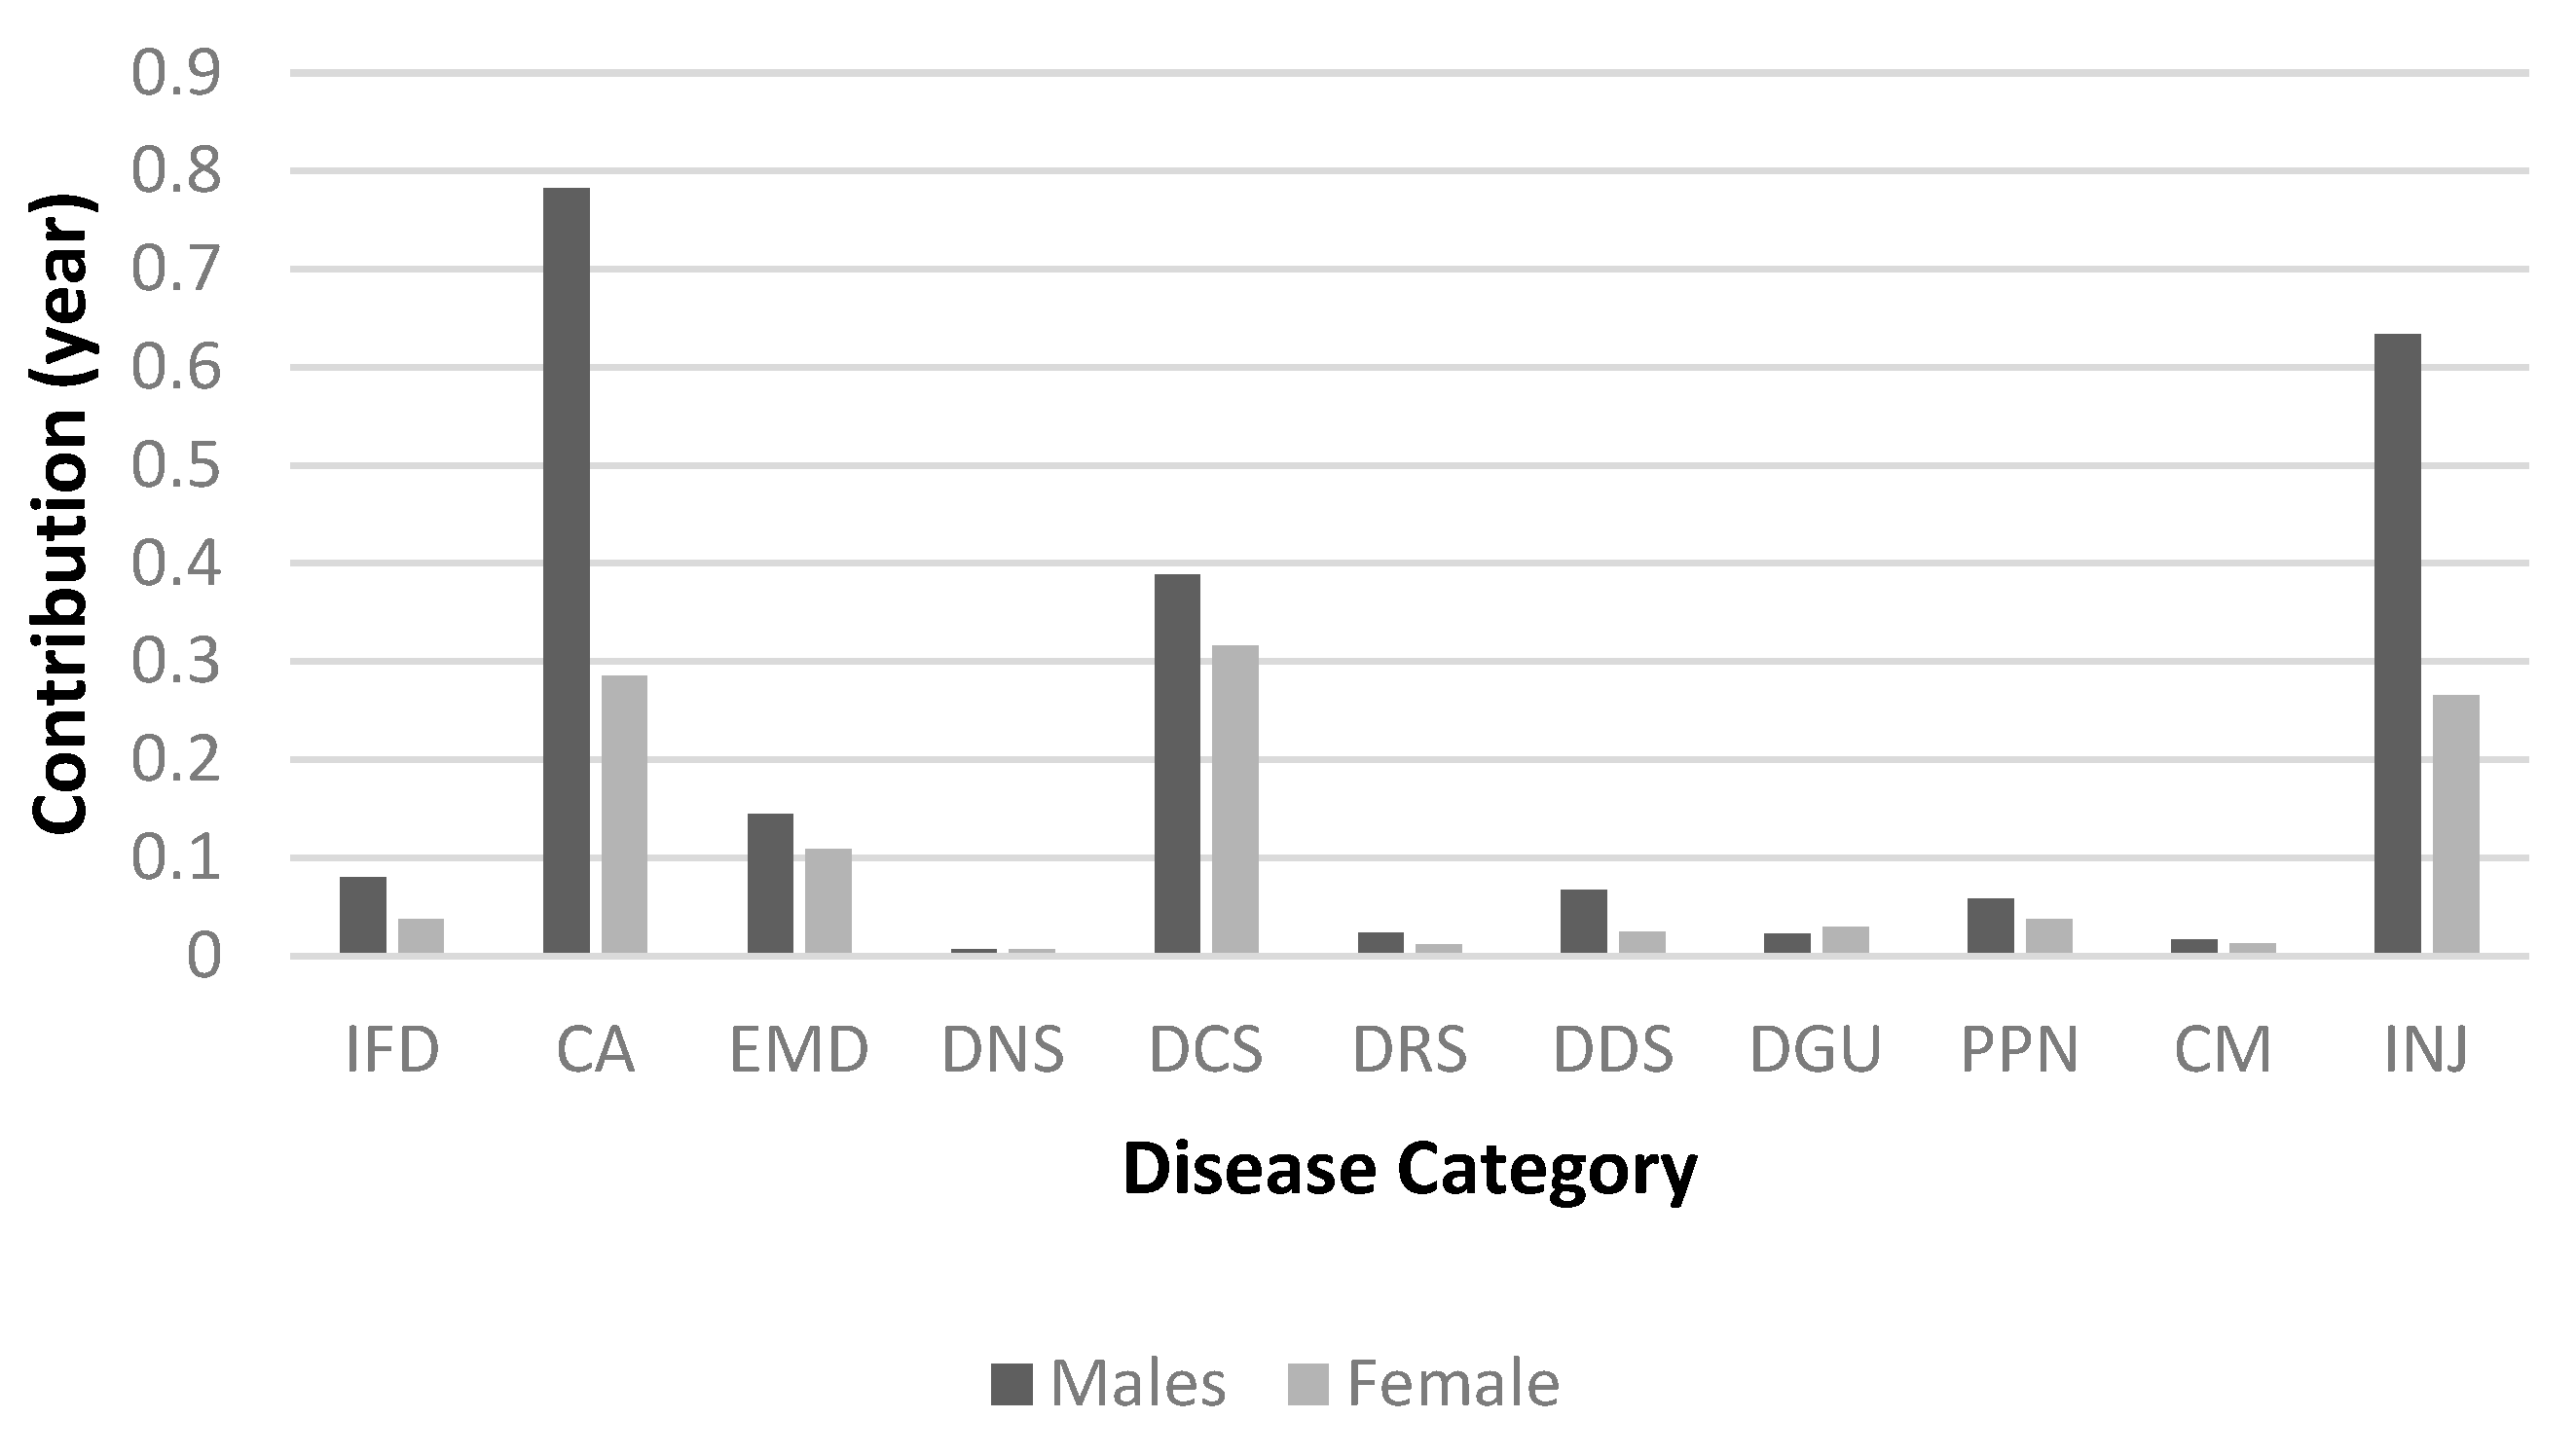
Avoidable mortalities for males and females were split into treatable and preventable mortalities to see the difference in their contributions, with preventable mortality contributing more than treatable mortality, except at age 0 (Table S9 and Figure 6). Comparing preventable mortality across the 11 broad categories, cancer (0.782 years), injuries (0.634 years) and disease of circulatory system (0.388 years) contributed most to LEB in males, followed by disease of circulatory system (0.316 years), cancer (0.285 years) and injuries (0.265 years) in females (Table S10 and Figure 7). In the period 2010-2020, the contribution of avoidable mortalities to LEB gains was lower for both males and females than in the period 2000-2010. In terms of gender, males were higher than females, in terms of age, males and females were higher in the 70-74 age group, and in terms of disease category, males were higher for cancer and females were higher for disease of circulatory system.
4. Discussion
This study analyzed the contribution of differences and changes in mortality by age, gender, and avoidable causes to LEB over the period 2000-2020.
From 2000 to 2020, LEB increased more for males (8.142 years) than for females (6.806 years). The contribution of those aged 65 and older was 45.44% (3.70 years) for males and 71.01% (4.83 years) for females, indicating that a large proportion of the increase in LEB was due to changes in mortality in the 65 and older age group. From this, it can be concluded that the 65+ age group contributed the most to the increase in LEB in Korea since 2000, especially in the 70-74 age group for males and 75-79 age group for females.
In recent years, the contribution of the younger age groups to the increase in LEB has been declining, while the contribution of the middle-aged and older age groups has been increasing. This is consistent with a study that found that changes in mortality at age 65 and older had the largest impact on LEB between 2000-2013 [19], and the previous study that found that the most significant contribution to LEB gains over the 30-year period from 1985-2015 was at ages 55-64 for males and 65-74 for females [19]. It is also consistent with findings in Germany that the largest contribution to LEB over 40 years was made by those aged 65 and older (2.9 years for males and 4.0 years for females) [20] and in Sweden that the largest contribution was made by those aged 65 and older (2.3 years for males and 1.37 years for females) between 1997-2014 [21].
The gender gap in LEB at each period was highest for those aged 60-64 in 2000 (0.959 years), 70-74 in 2010 (0.952 years), and 75-79 in 2020 (0.862 years). In 2000 and 2010, the gender gap in LEB was highest at ages 65-74 and decreased thereafter, while in 2020, the gender gap in LEB increased until ages 75-84. The gender gap in LEB shifts to older age group, which is consistent with previous studies [19].
The contribution of avoidable mortality to LEB from 2000 to 2020 is 57.3% (4.285 years), which is not directly comparable to other studies due to the different list of avoidable causes of death and study period. The increase in LEB due to avoidable mortality is higher for males (5.338 years) compared to females (2.833 years), which can be explained by the increase in LEB being higher for males (8.142 years) compared to females (6.806 years). The age-specific contribution of avoidable mortality is higher in the 65+ age group, which is likely due to the higher contribution of LEB gains in the 65+ age group.
In this study, the contribution to LEB gains was higher for avoidable mortality than for treatable mortality for both males and females, which is consistent with previous studies [14]. This suggests that preventable mortality needs to be further reduced. There was also a higher contribution from preventable mortality in males compared to females, which was likely due to liver disease (cirrhosis and fibrosis), stomach cancer and lung cancer. These causes of death are associated with higher mortality rates in males than in females and are thought to be caused by alcohol consumption and smoking habits, which contribute to liver disease (cirrhosis and fibrosis). It has also been argued that the lower rate of change in preventable mortality in females compared to males may be due to an increase in breast cancer mortality [14].
Alcohol consumption in Korea has not decreased over the past two decades and the downward trend in hepatitis B virus infection may have contributed to the decrease in mortality from alcohol-related diseases and malignant neoplasms of the liver [22]. Although the prevalence of smoking among men in Korea has decreased significantly from 60.9% in 2001 to 34% in 2020, the prevalence among women is very low (6.6% in 2020) and has increased slightly compared to 2001 (5.2%). Since the 2000s, the prevalence of smoking has decreased significantly due to the impact of government anti-smoking policies and changes in social awareness and is almost comparable to the average prevalence in OECD countries. Gender disparities in lifestyle behaviors, including smoking and alcohol consumption, are likely to be an important factor in the difference in LEB between males and females [23].
The present study could suggest the factors that influenced the decline in preventable mortality in two aspects.
First, a significant contributor to preventable mortality is vaccination. Vaccines are one of the greatest achievements of biomedical science and public health, contributing to the reduction of acute and chronic infectious diseases. Studies in the United States have shown that vaccination has reduced deaths by more than 99% for diphtheria, mumps, pertussis, and tetanus [24]. Polio, measles, and rubella viruses have been eliminated, and smallpox has been eradicated globally. Reductions in cases and deaths of most vaccine-preventable diseases, including hepatitis A, acute hepatitis B, Hib, and chickenpox, have been shown to be greater than 80%. In Korea, immunization rates are estimated to be high due to state support for essential immunizations for children. According to data from Statistics Korea in 2020 (National Childhood Immunization Rate Status), the immunization rate of nine vaccines surveyed was over 90%. The vaccination target is also gradually expanding, and in the case of HPV vaccination, state support is expanding from the current 12-year-olds to female adolescents aged 13-17 and low-income women aged 18-26. Immunization against human papillomavirus infection aims to prevent cervical, oropharyngeal, and anal and genital cancers. It can be said that infection prevention policies and immunizations have led to a decrease in infectious diseases and a decrease in avoidable mortality.
Second, Korea has implemented the National Health Promotion Act of 1995, which aims to improve the health of the people by creating conditions for practicing healthy living, and has implemented health promotion projects through health education, disease prevention, nutrition improvement, and healthy living practices. Changes in lifestyle appear to have contributed to the decline in preventable mortality. The development of non-communicable diseases, the world's leading cause of death, is influenced by lifestyle. Smoking, physical inactivity, unhealthy diet, obesity, and other lifestyle behaviors (such as alcohol consumption) are associated with the development of diseases such as cancer, heart disease, stroke, and diabetes [25], and are factors in reducing preventable mortality.
The higher the number of healthy lifestyle factors among the above five lifestyle factors, the lower the mortality rate, especially when four healthy lifestyle factors are practiced [25,26], and when at least three are practiced, it can be considered to have a healthy lifestyle [27]. Therefore, it is thought that time and motivation are needed to continuously promote health promotion projects for lifestyle improvement to the entire population so that it can become a habit.
In present study, cerebrovascular disease and transport accidents were the factors that influenced the increase in LEB from avoidable mortality in both males and females. Cerebrovascular disease contributed 0.942 years of LEB for males and 0.823 years of LEB for females. This is consistent with studies in Europe[28], Korea [15] and elsewhere that show that changes in the mortality of circulatory diseases are a major factor affecting LEB.
The age-standardized mortality rate for cerebrovascular disease in Korea decreased from 89.8 per 100,000 in 2000 to 20.1 in 2020, which is lower than the average for OECD countries (63.5 in 2018) [12]. The global rate of cerebrovascular disease deaths in Korea is also decreasing, which may have contributed to the decrease in avoidable mortality. The decline in stroke mortality, a type of cerebrovascular disease, can be attributed to quality improvement efforts. The Acute Stroke Adequacy Evaluation System was launched by the Korea Health Insurance Review and Assessment Service in 2006, and the Ministry of Health and Welfare has been operating regional cardiovascular disease centers since 2008. In addition, the Cardiovascular Disease Act was enacted in 2016, which comprehensively establishes and implements policies for the prevention, treatment, rehabilitation, and research of cardiovascular diseases. In addition, the decrease in the prevalence of hypertension, the increase in the treatment rate for hypertension, and the expansion of medical access through the National Health Insurance Program have contributed to the decrease in cerebrovascular disease mortality [22].
Among avoidable causes, the decrease in transportation accidents contributed to the improvement in LEB for both males and females. It increased LEB by 0.768 years for males and 0.324 years for females. Korea's transport accident rate decreased from 21.8 deaths per 100,000 people in 2000 to 5.9 deaths per 100,000 people in 2020, which is still the highest among major OECD countries. This decrease in traffic accident fatality rate can be attributed to seat belt use, walking environment improvement projects, expansion of traffic surveillance cameras, increased fines, stricter penalties for drunk driving, and road safety education programs.
In this study, suicide (intentional self-harm) was found to be the leading cause of decreased LEB in both men and women. Korea's suicide rate (per 100,000 population) was 23.0 ('17), the highest among OECD countries and 2.1 times higher than the OECD average (11.2). Over the 20-year period 2000-2020, the increase in mortality from suicide was the largest contributor to the decline in LEB. Suicide mortality has now surpassed deaths from diabetes, hypertensive disease, and liver disease, and the need to address rising suicide mortality cannot be overemphasized. Since 2000, suicide rates have continued to increase, reaching a peak in 2011, and have been declining since then. This can be explained by the fact that in this study, suicide was analyzed as a negative contributor to LEB in the period 2000-2010, whereas in the period 2010-2020 it was analyzed as a positive contributor.
In 2020, the suicide rate was three times higher for men than for women and increased with age, peaking in the 80+ age group. Suicide rates have been reported to increase during economic crises in different countries[29,30,31], and the impact of changes in the economy, employment, and other socioeconomic factors on suicide rates may have been greater in men in recent decades [32].
Pneumonia was the cause of death that contributed to the decrease in LEB among males. Infectious disease mortality rates for pneumonia and influenza are known to fluctuate from year to year, but in any given year, pneumonia mortality accounts for 30% of all respiratory causes of death in the OECD [33]. Pneumonia is a common cause of death in the elderly [34], and the resurgence of pneumonia is likely since Korea is the fastest aging country in the world [35]. In the future, pneumococcal and influenza immunization rates should be increased, and the prescription of antibiotics should be used more wisely [36]. Strategies to reduce the volume and pathogenicity of aspirated material are needed, especially in the elderly, because swallowing disorders and cough reflex disorders in the presence of cerebrovascular disease increase the risk of pneumonia [34].
Breast cancer was found to be the cause of decreased LEB among females. Breast cancer is the most common malignancy among Korean women and is a multifactorial complex disease in which many factors are involved in the development of the disease, including family history and genetic predisposition, internal environmental factors such as hormonal and reproductive factors, drugs, personal illness and lifestyle, and external environmental factors such as diet, occupational exposure, and environmental hormones. A woman's age can be seen as a major factor contributing to the increased risk of breast cancer because many risk factors for breast cancer can accumulate and increase with age, and exposure to female sex hormones also accumulates with age [37]. However, while the frequency of breast cancer increases with age in Western women, it increases until the early 50s in Korea and then gradually decreases after that. According to OECD statistics, the five-year survival rate for breast cancer in Korea from 2010-2014 was 86.6%, which is slightly higher than the OECD average of 84.5%. Primary prevention of breast cancer can be considered as reducing exposure to female hormones and improving lifestyle. Secondary prevention is early detection, and women aged 40 and older are encouraged to have a mammogram every two years. Early detection and treatment of breast cancer can reduce mortality, and higher national cancer screening rates have been shown to reduce curable mortality [38]. It has also been reported that breast cancers detected by screening often have a better prognosis and tend to have lower mortality rates than cancers diagnosed after symptoms have developed, emphasizing the effectiveness and importance of breast cancer screening.
The present study suggests that the causes of death that contributed to the decline in LEB during the period 2000-2020 were suicide (both genders), pneumonia (males), and breast cancer (females), and that improving avoidable causes of death, especially preventable causes, can contribute to increasing LEB.
Korea is one of the OECD countries with the highest projected LEB at age 65 [35], and reductions in avoidable mortality have contributed significantly to the increase in LEB among the elderly. There is still room for improvement in avoidable mortality, and health policies to reduce treatable and preventable mortality should continue.
5. Conclusions
Gender-based disparities in life expectancy increases, with male gaining an advantage over females from 2000-2020 (8.142 years for males versus 6.806 years for females). The most significant increase in life expectancy at birth was found to be in males aged 70-74 by 1.088 years and females aged 75-79 by 1.206 years. The gender gap in LEB is narrowing and that the main age group contributing to the gender gap are getting older. Avoidable causes of death have a significant impact on LEB, with cerebrovascular disease and transport accidents contributing to increases in LEB for both males and females, and suicide, pneumonia, and breast cancer contributing to decreases, particularly for males and those aged 65 and older. Preventable causes of death contribute more to LEB than treatable causes of death. Given that avoidable mortality can be reduced by immunization and lifestyle changes, aggressive improvement in avoidable mortality is important for improving LEB.
Supplementary Materials
The following supporting information can be downloaded at: Preprints.org, Table S1: Joint OECD/Eurostat lists of preventable and treatable causes of mortality; Table S2: Life expectancy at birth by gender in Korea, 1970-2020; Table S3: Age group-specific contribution to life expectancy at birth in Korea, 2000-2020; Table S4: Contribution of the mortality gender gap at each age group to the total gender gap in life expectancy at birth in Korea, 2000, 2010 and 2020; Table S5: Arriaga decomposition of changes in life expectancy at birth by avoidable cause of death, 2000-2010; Table S6: Contribution of preventable and treatable causes to life expectancy, 2000-2010; Table S7: Contribution life expectancy at birth by avoidable cause group, 2000-2010; Table S8: Arriaga decomposition of changes in life expectancy at birth by avoidable cause of death, 2000-2010; Table S9: Contribution of preventable and treatable causes to life expectancy, 2010-2020; Table S10. Contribution life expectancy at birth by avoidable cause group, 2010-2020.
Author Contributions
Conceptualization, D.O.L., S.N.L. and S.H.L.; methodology, D.O.L., and S.N.L.; software, S.N.L.; validation, D.O.L., S.N.L. and S.H.L.; formal analysis, S.N.L.; investigation, S.H.L. and D.O.L.; resources, D.O.L.; data curation, S.N.L.; writing—original draft preparation, S.H.L.; writing—review and editing, S.H.L. and D.O.L.; visualization, S.N.L. and S.H.L.; supervision, S.H.L. and D.O.L.; project administration, D.O.L.; funding acquisition, D.O.L.. All authors have read and agreed to the published version of the manuscript.
Funding
This research was funded by the research grant of Kongju National University in 2018.
Institutional Review Board Statement
Not applicable
Informed Consent Statement
Not applicable.
Conflicts of Interest
The authors declare no conflict of interest.
References
- OECD Health at a Glance 2021: Health at a Glance; OECD, 2021; p. 272;
- Laranjeira, E.; Szrek, H. Going beyond Life Expectancy in Assessments of Health Systems’ Performance: Life Expectancy Adjusted by Perceived Health Status. Int J Health Econ Manag. 2016, 16, 133–161. [Google Scholar] [CrossRef] [PubMed]
- van Raalte, A.A.; Sasson, I.; Martikainen, P. The Case for Monitoring Life-Span Inequality. Science 2018, 362, 1002–1004. [Google Scholar] [CrossRef] [PubMed]
- Mateos, J.T.; Fernández-Sáez, J.; Marcos-Marcos, J.; Álvarez-Dardet, C.; Bambra, C.; Popay, J.; Baral, K.; Musolino, C.; Baum, F. Gender Equality and the Global Gender Gap in Life Expectancy: An Exploratory Analysis of 152 Countries. Int J Health Policy Manag 2020, 11, 740–746. [Google Scholar] [CrossRef] [PubMed]
- 2020.
- Rochelle, T.L.; Yeung, D.K.Y.; Bond, M.H.; Li, L.M.W. Predictors of the Gender Gap in Life Expectancy across 54 Nations. Psychology, Health & Medicine 2015, 20, 129–138. [Google Scholar] [CrossRef]
- Sorenson, S.B. Gender Disparities in Injury Mortality: Consistent, Persistent, and Larger Than You’d Think. Am J Public Health 2011, 101, S353–S358. [Google Scholar] [CrossRef]
- Hao, L.; Xu, X.; Dupre, M.E.; Guo, A.; Zhang, X.; Qiu, L.; Zhao, Y.; Gu, D. Adequate Access to Healthcare and Added Life Expectancy among Older Adults in China. BMC Geriatr 2020, 20, 129. [Google Scholar] [CrossRef]
- Braveman, P.; Gottlieb, L. The Social Determinants of Health: It’s Time to Consider the Causes of the Causes. Public Health Rep 2014, 129, 19–31. [Google Scholar] [CrossRef]
- Glei, D.A.; Horiuchi, S. The Narrowing Sex Differential in Life Expectancy in High-Income Populations: Effects of Differences in the Age Pattern of Mortality. Population Studies 2007, 61, 141–159. [Google Scholar] [CrossRef]
- Measuring the Quality of Medical Care — A Clinical Method | NEJM Available online:. Available online: https://www.nejm.org/doi/full/10.1056/NEJM197603112941104 (accessed on 26 August 2023).
- 2021.
- Charlton, J.R.; Hartley, R.M.; Silver, R.; Holland, W.W. Geographical Variation in Mortality from Conditions Amenable to Medical Intervention in England and Wales. Lancet 1983, 1, 691–696. [Google Scholar] [CrossRef]
- Eun, S.J. Avoidable, Amenable, and Preventable Mortalities in South Korea, 2000–2017: Age-Period-Cohort Trends and Impact on Life Expectancy at Birth. Social Science & Medicine 2019, 237, 112482. [Google Scholar] [CrossRef]
- Bahk, J.; Jung-Choi, K. The Contribution of Avoidable Mortality to the Life Expectancy Gains in Korea between 1998 and 2017. Int J Environ Res Public Health 2020, 17, 6499. [Google Scholar] [CrossRef] [PubMed]
- Preston, S. Demography: Measuring and Modeling Population Processes. (No Title).
- Ilze (ESTAT), B. Avoidable Mortality: OECD/Eurostat Lists of Preventable and Treatable Causes of Death (22 Version). 2022. 20 January.
- Arriaga, E.E. Measuring and Explaining the Change in Life Expectancies. Demography 1984, 21, 83–96. [Google Scholar] [CrossRef] [PubMed]
- Yoo, Y.H.; Lee, J.H.; Park, S.-H.; Lim, D.O. The Structural Analysis of Influences of Mortality Change on the Life Expectancy at Birth in Korea: 1985~2015. Korean Public Health Research 2019, 45, 71–81. [Google Scholar]
- Klenk, J.; Rapp, K.; Büchele, G.; Keil, U.; Weiland, S.K. Increasing Life Expectancy in Germany: Quantitative Contributions from Changes in Age- and Disease-Specific Mortality. Eur J Public Health 2007, 17, 587–592. [Google Scholar] [CrossRef]
- Sundberg, L.; Agahi, N.; Fritzell, J.; Fors, S. Why Is the Gender Gap in Life Expectancy Decreasing? The Impact of Age- and Cause-Specific Mortality in Sweden 1997–2014. Int J Public Health 2018, 63, 673–681. [Google Scholar] [CrossRef]
- Yang, S.; Khang, Y.-H.; Harper, S.; Davey Smith, G.; Leon, D.A.; Lynch, J. Understanding the Rapid Increase in Life Expectancy in South Korea. Am J Public Health 2010, 100, 896–903. [Google Scholar] [CrossRef] [PubMed]
- Kiadaliri, A. Avoidable Deaths in Sweden, 1997-2018: Temporal Trend and the Contribution to the Gender Gap in Life Expectancy. BMC Public Health 2021, 21, 519. [Google Scholar] [CrossRef]
- Roush, S.W.; Murphy, T.V. ; Vaccine-Preventable Disease Table Working Group Historical Comparisons of Morbidity and Mortality for Vaccine-Preventable Diseases in the United States. JAMA 2007, 298, 2155–2163. [Google Scholar] [CrossRef]
- Loef, M.; Walach, H. The Combined Effects of Healthy Lifestyle Behaviors on All Cause Mortality: A Systematic Review and Meta-Analysis. Prev Med 2012, 55, 163–170. [Google Scholar] [CrossRef]
- van den Brandt, P.A. The Impact of a Mediterranean Diet and Healthy Lifestyle on Premature Mortality in Men and Women. Am J Clin Nutr 2011, 94, 913–920. [Google Scholar] [CrossRef]
- King, D.E.; Mainous, A.G.; Carnemolla, M.; Everett, C.J. Adherence to Healthy Lifestyle Habits in US Adults, 1988-2006. Am J Med 2009, 122, 528–534. [Google Scholar] [CrossRef] [PubMed]
- Bíró, A.; Hajdu, T.; Kertesi, G.; Prinz, D. Life Expectancy Inequalities in Hungary over 25 Years: The Role of Avoidable Deaths. Population Studies 2021, 75, 443–455. [Google Scholar] [CrossRef] [PubMed]
- Mokdad, A.H.; Marks, J.S.; Stroup, D.F.; Gerberding, J.L. Actual Causes of Death in the United States, 2000. JAMA 2004, 291, 1238–1245. [Google Scholar] [CrossRef] [PubMed]
- Gunnell, D. Time Trends and Geographic Differences in Suicide: Implications for Prevention. In Prevention and Treatment of Suicidal Behaviour:From science to practice; Hawton, K., Ed.; Oxford University Press, 2005; p. 0 ISBN 978-0-19-852976-7.
- Chang, S.-S.; Stuckler, D.; Yip, P.; Gunnell, D. Impact of 2008 Global Economic Crisis on Suicide: Time Trend Study in 54 Countries. BMJ 2013, 347, f5239. [Google Scholar] [CrossRef]
- Chang, S.-S.; Gunnell, D.; Sterne, J.A.C.; Lu, T.-H.; Cheng, A.T.A. Was the Economic Crisis 1997-1998 Responsible for Rising Suicide Rates in East/Southeast Asia? A Time-Trend Analysis for Japan, Hong Kong, South Korea, Taiwan, Singapore and Thailand. Soc Sci Med 2009, 68, 1322–1331. [Google Scholar] [CrossRef]
- Hespanhol, V.; Bárbara, C. Pneumonia Mortality, Comorbidities Matter? Pulmonology 2020, 26, 123–129. [Google Scholar] [CrossRef]
- Yamaya, M.; Yanai, M.; Ohrui, T.; Arai, H.; Sasaki, H. Interventions to Prevent Pneumonia among Older Adults. J Am Geriatr Soc 2001, 49, 85–90. [Google Scholar] [CrossRef]
- Kontis, V.; Bennett, J.E.; Mathers, C.D.; Li, G.; Foreman, K.; Ezzati, M. Future Life Expectancy in 35 Industrialised Countries: Projections with a Bayesian Model Ensemble. The Lancet 2017, 389, 1323–1335. [Google Scholar] [CrossRef]
- Ruhnke, G.W.; Coca-Perraillon, M.; Kitch, B.T.; Cutler, D.M. Marked Reduction in 30-Day Mortality among Elderly Patients with Community-Acquired Pneumonia. Am J Med 2011, 124, 171–178. [Google Scholar] [CrossRef]
- Park, S.K. Epidemiological characteristics of breast cancer in Koreans. J Korean Med Assoc 2019, 62, 424. [Google Scholar] [CrossRef]
- Baek, S.J.; Kim, H.; Lee, D.H.; Jeong, H. Regional Gaps in Health Status Estimated by Amenable Mortality Rate in Korea. Health Policy and Mangemnet 2021, 31, 100–113. [Google Scholar]
Figure 1.
Trends of life expectancy at birth by gender in Korea, 1970-2020.
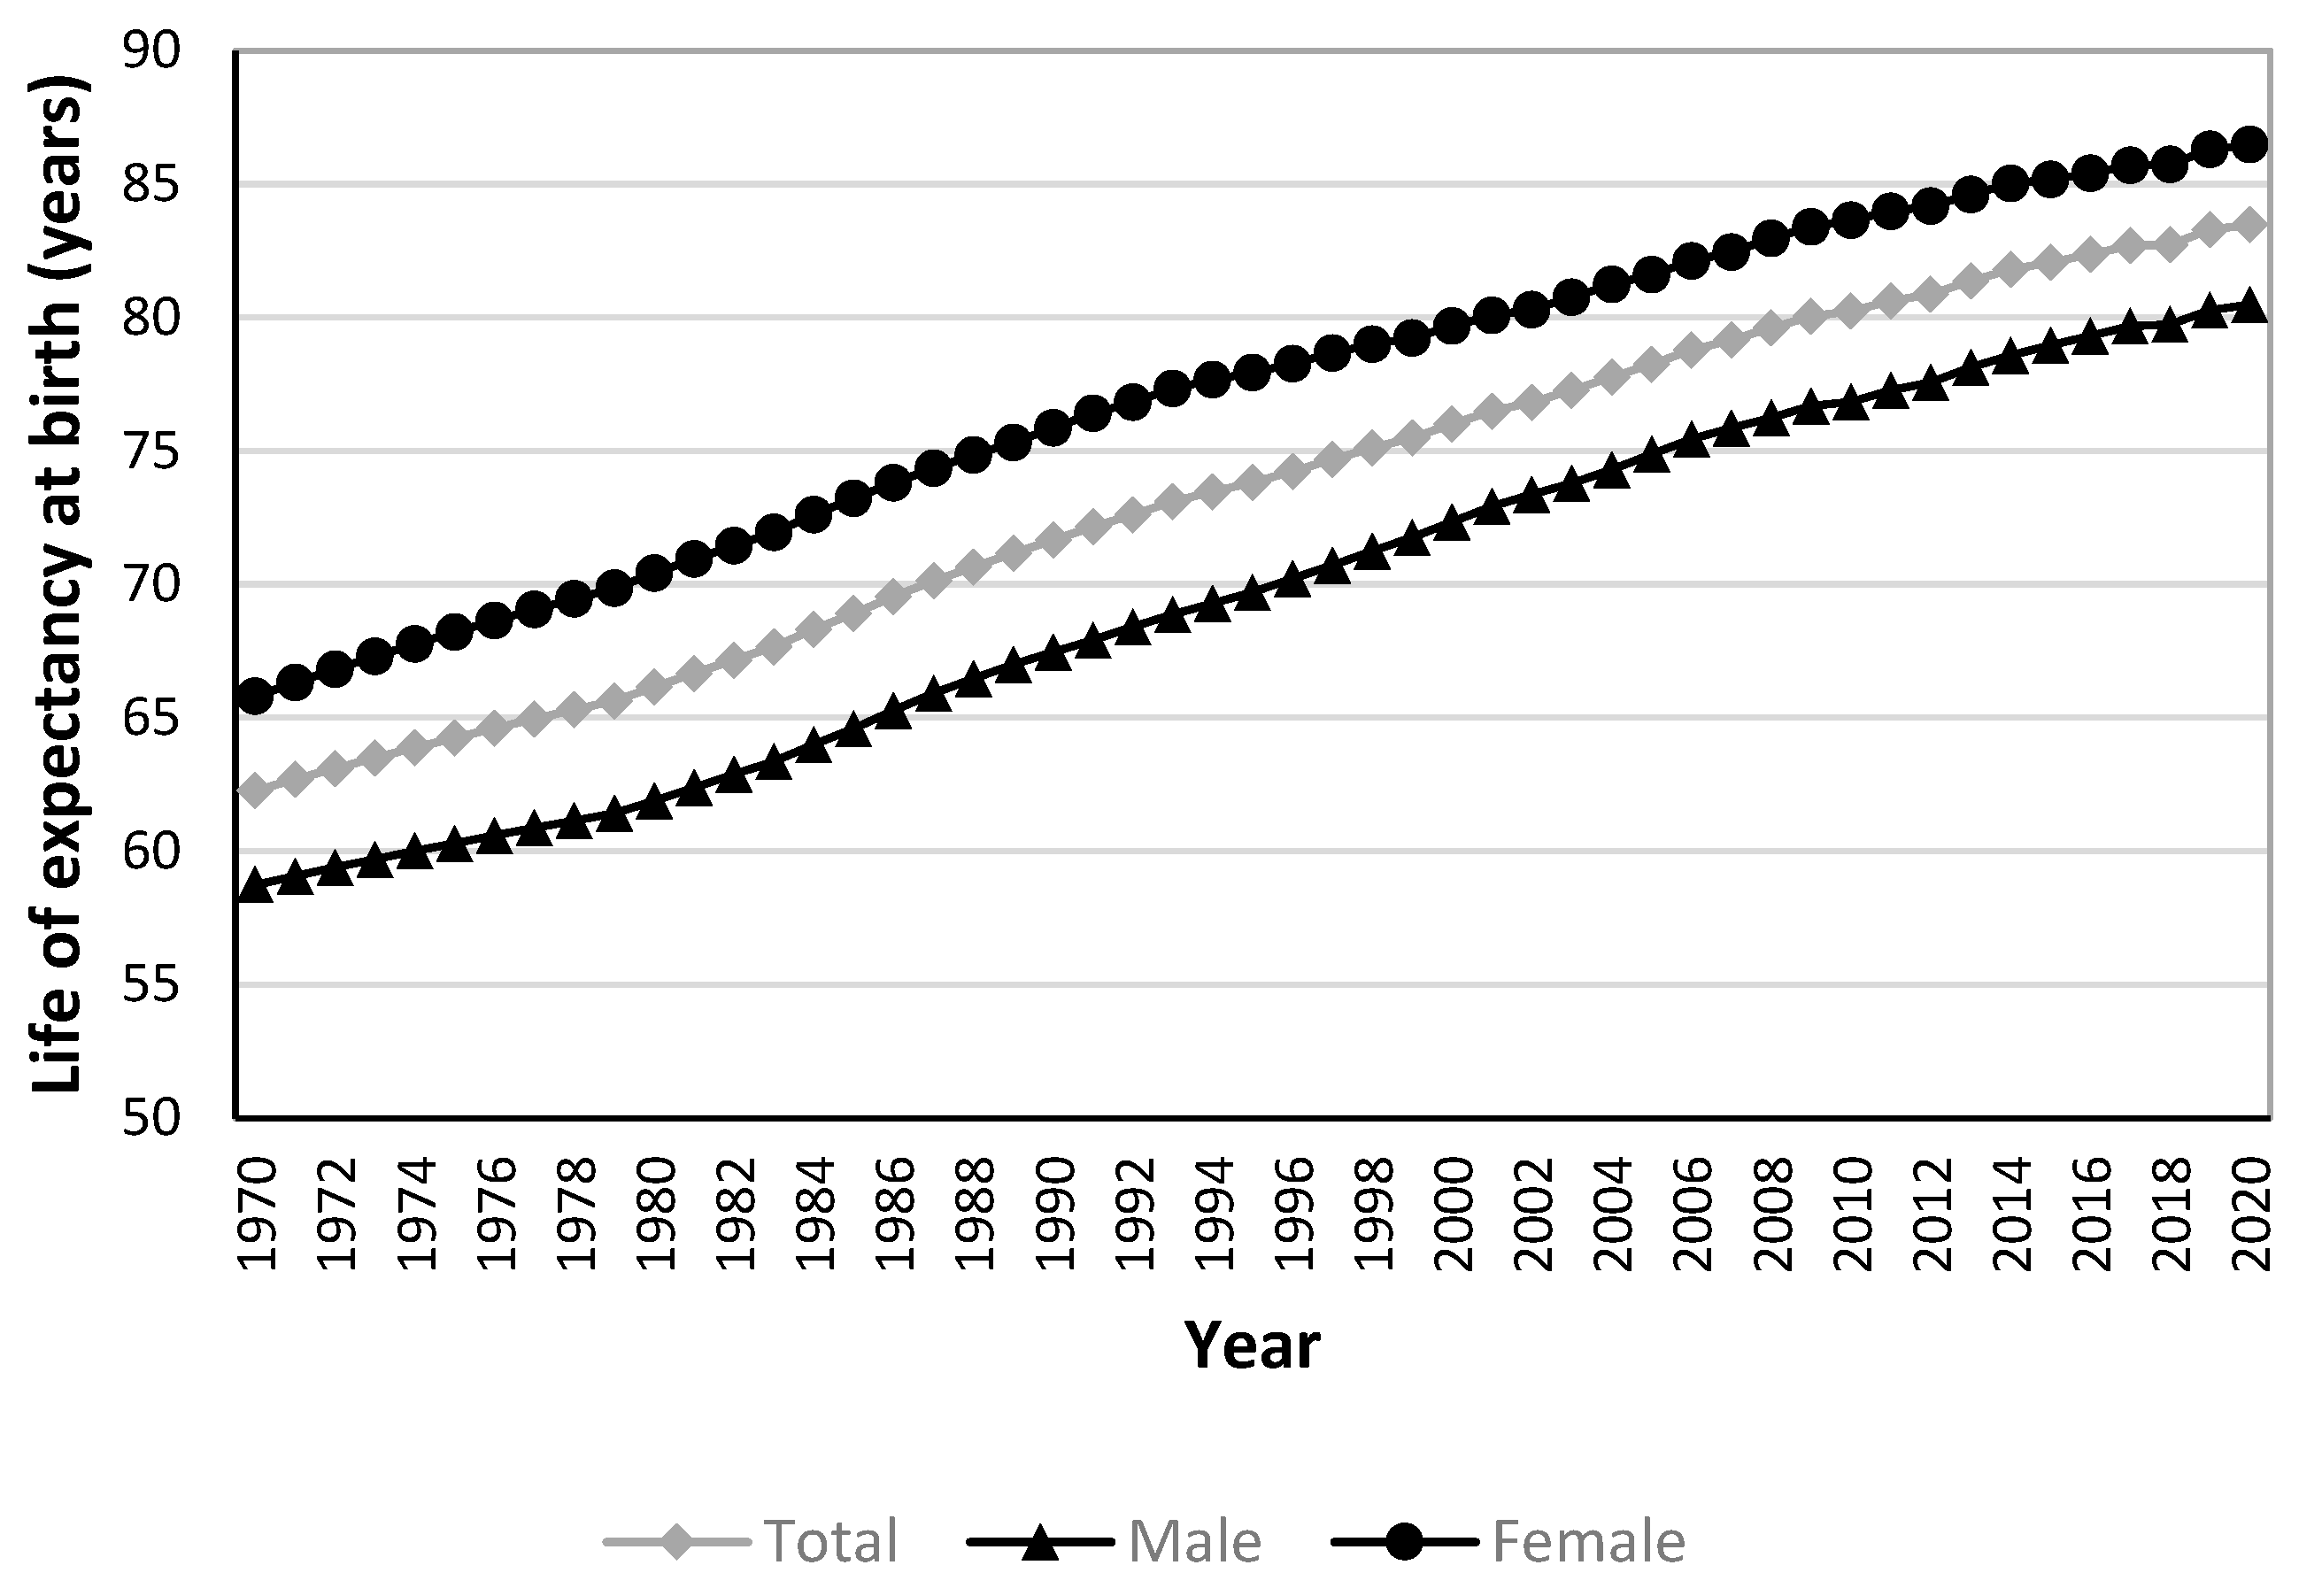
Figure 2.
Age-specific contributions to life expectancy at birth in Korea, 2000-2020. (a) Males; (b) Females.
Figure 2.
Age-specific contributions to life expectancy at birth in Korea, 2000-2020. (a) Males; (b) Females.
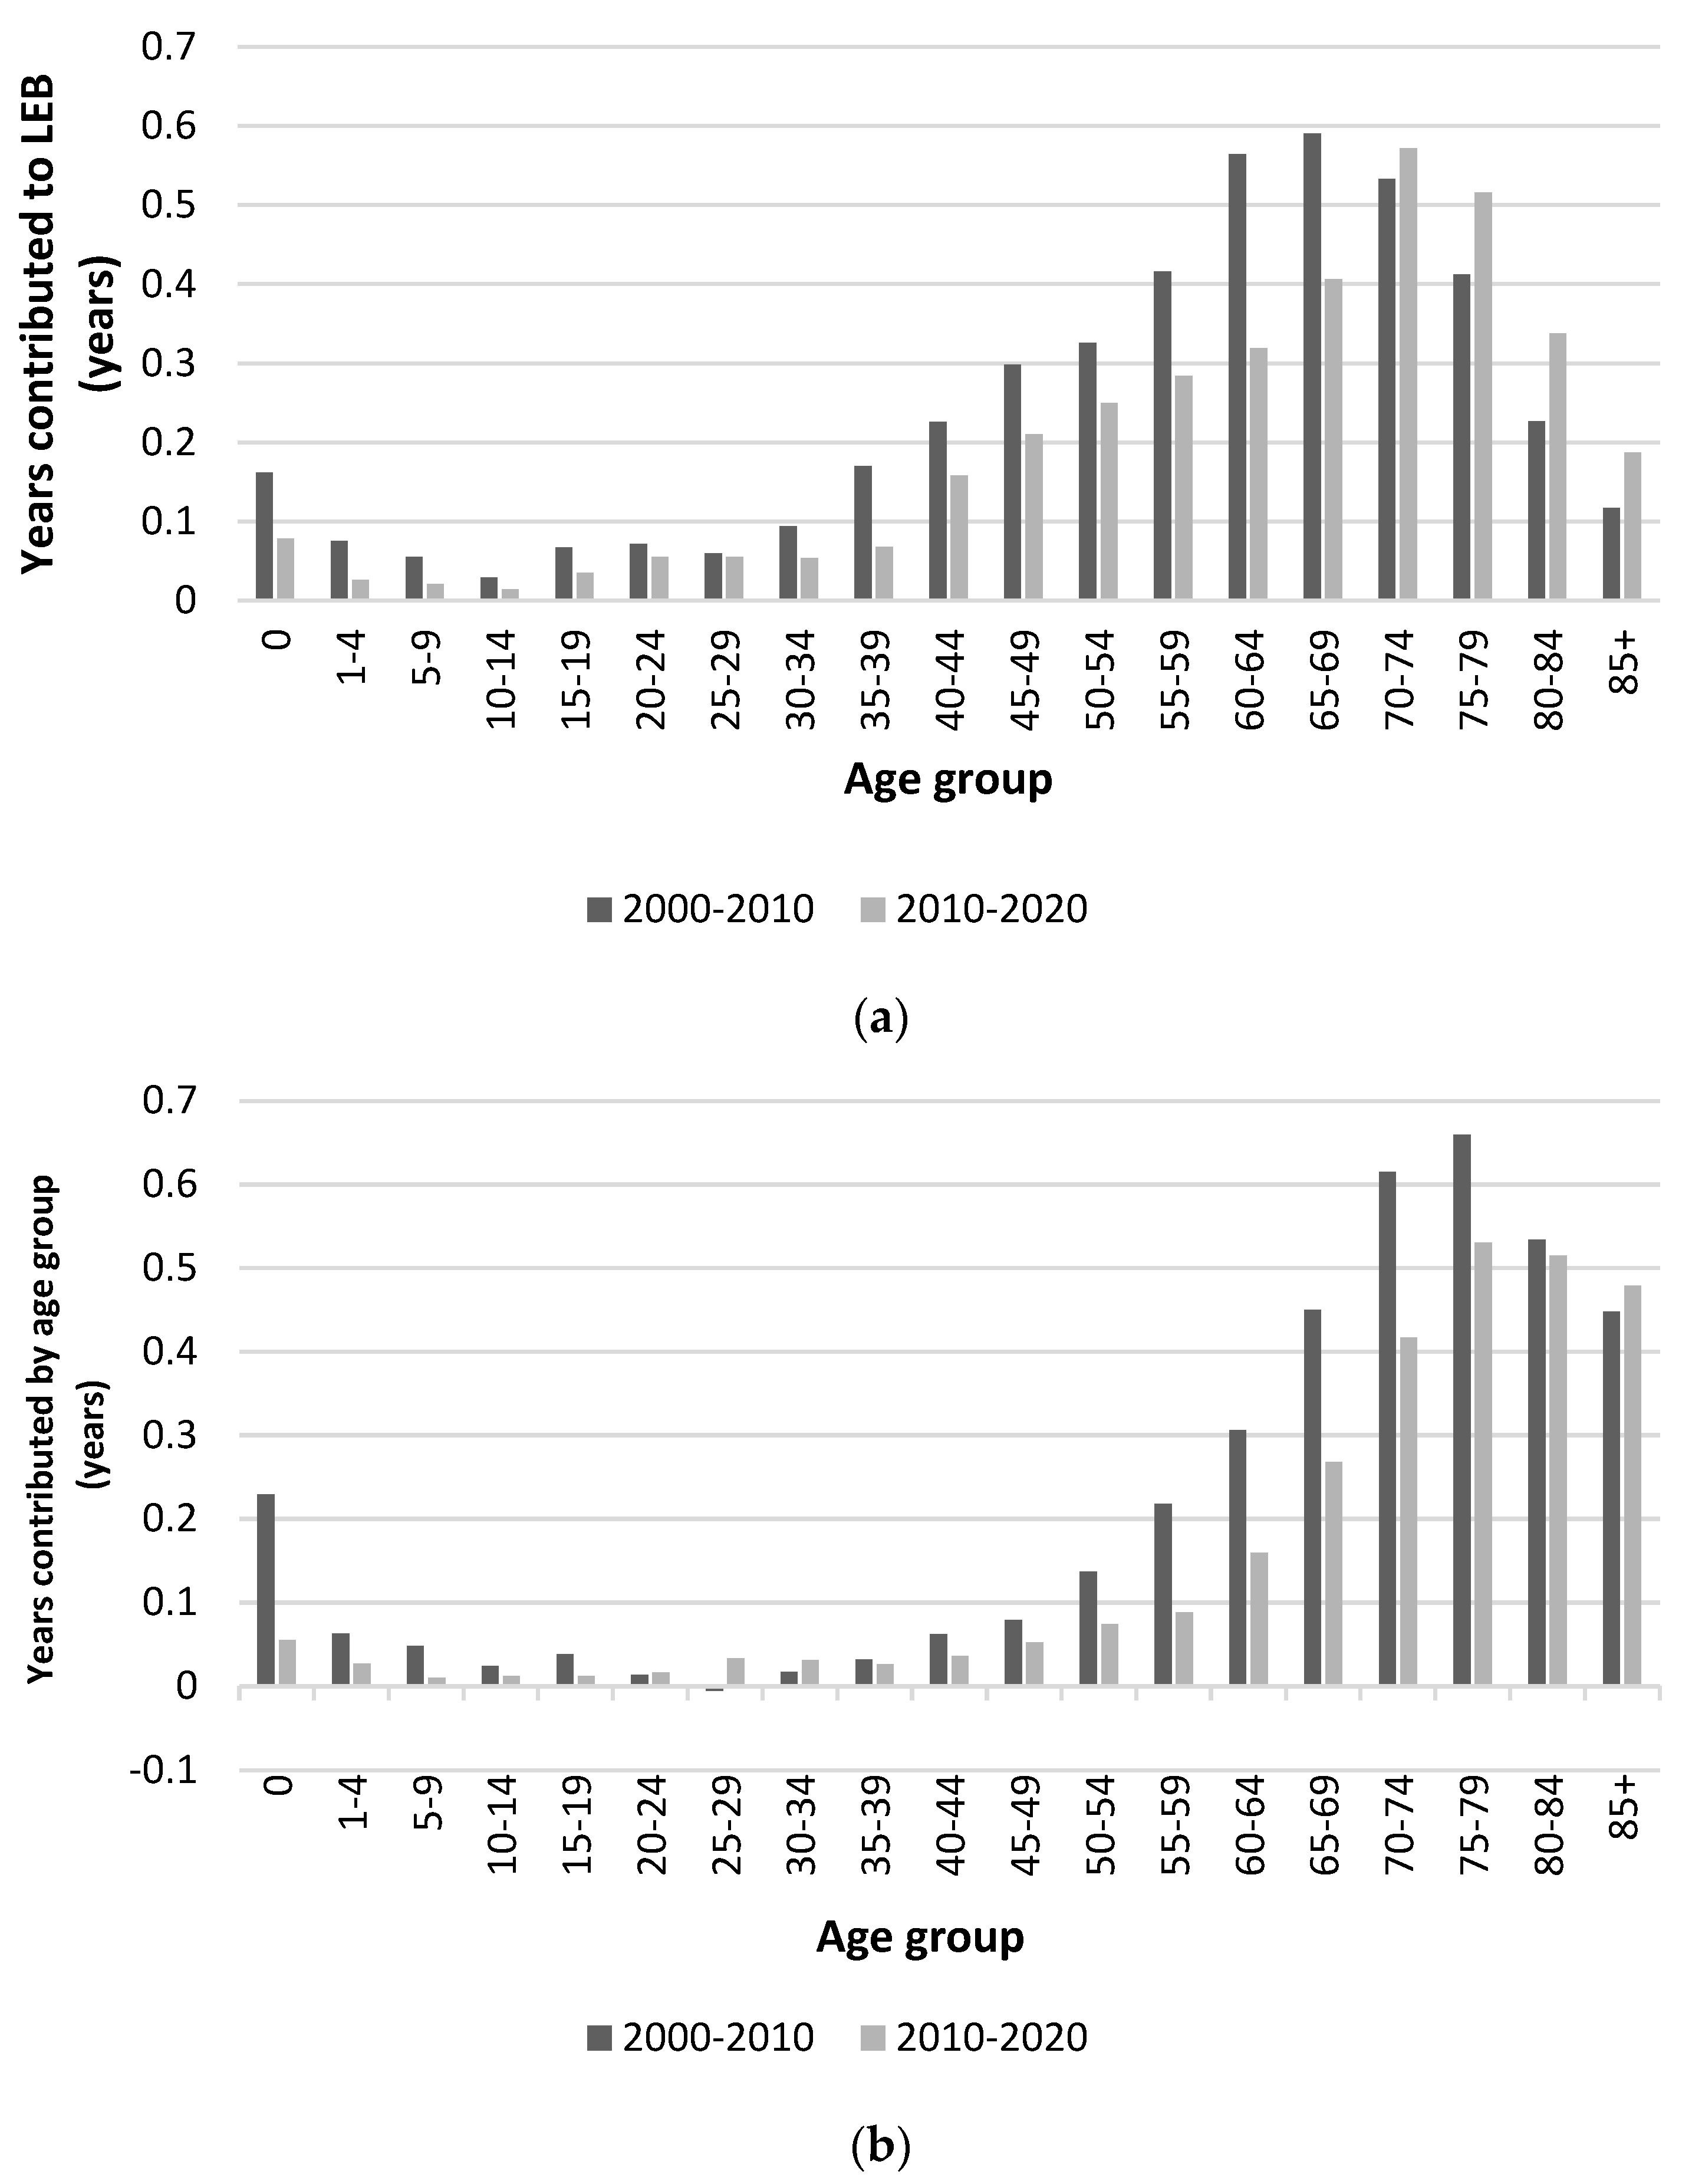
Figure 3.
Gender gap in life expectancy at birth in Korea.
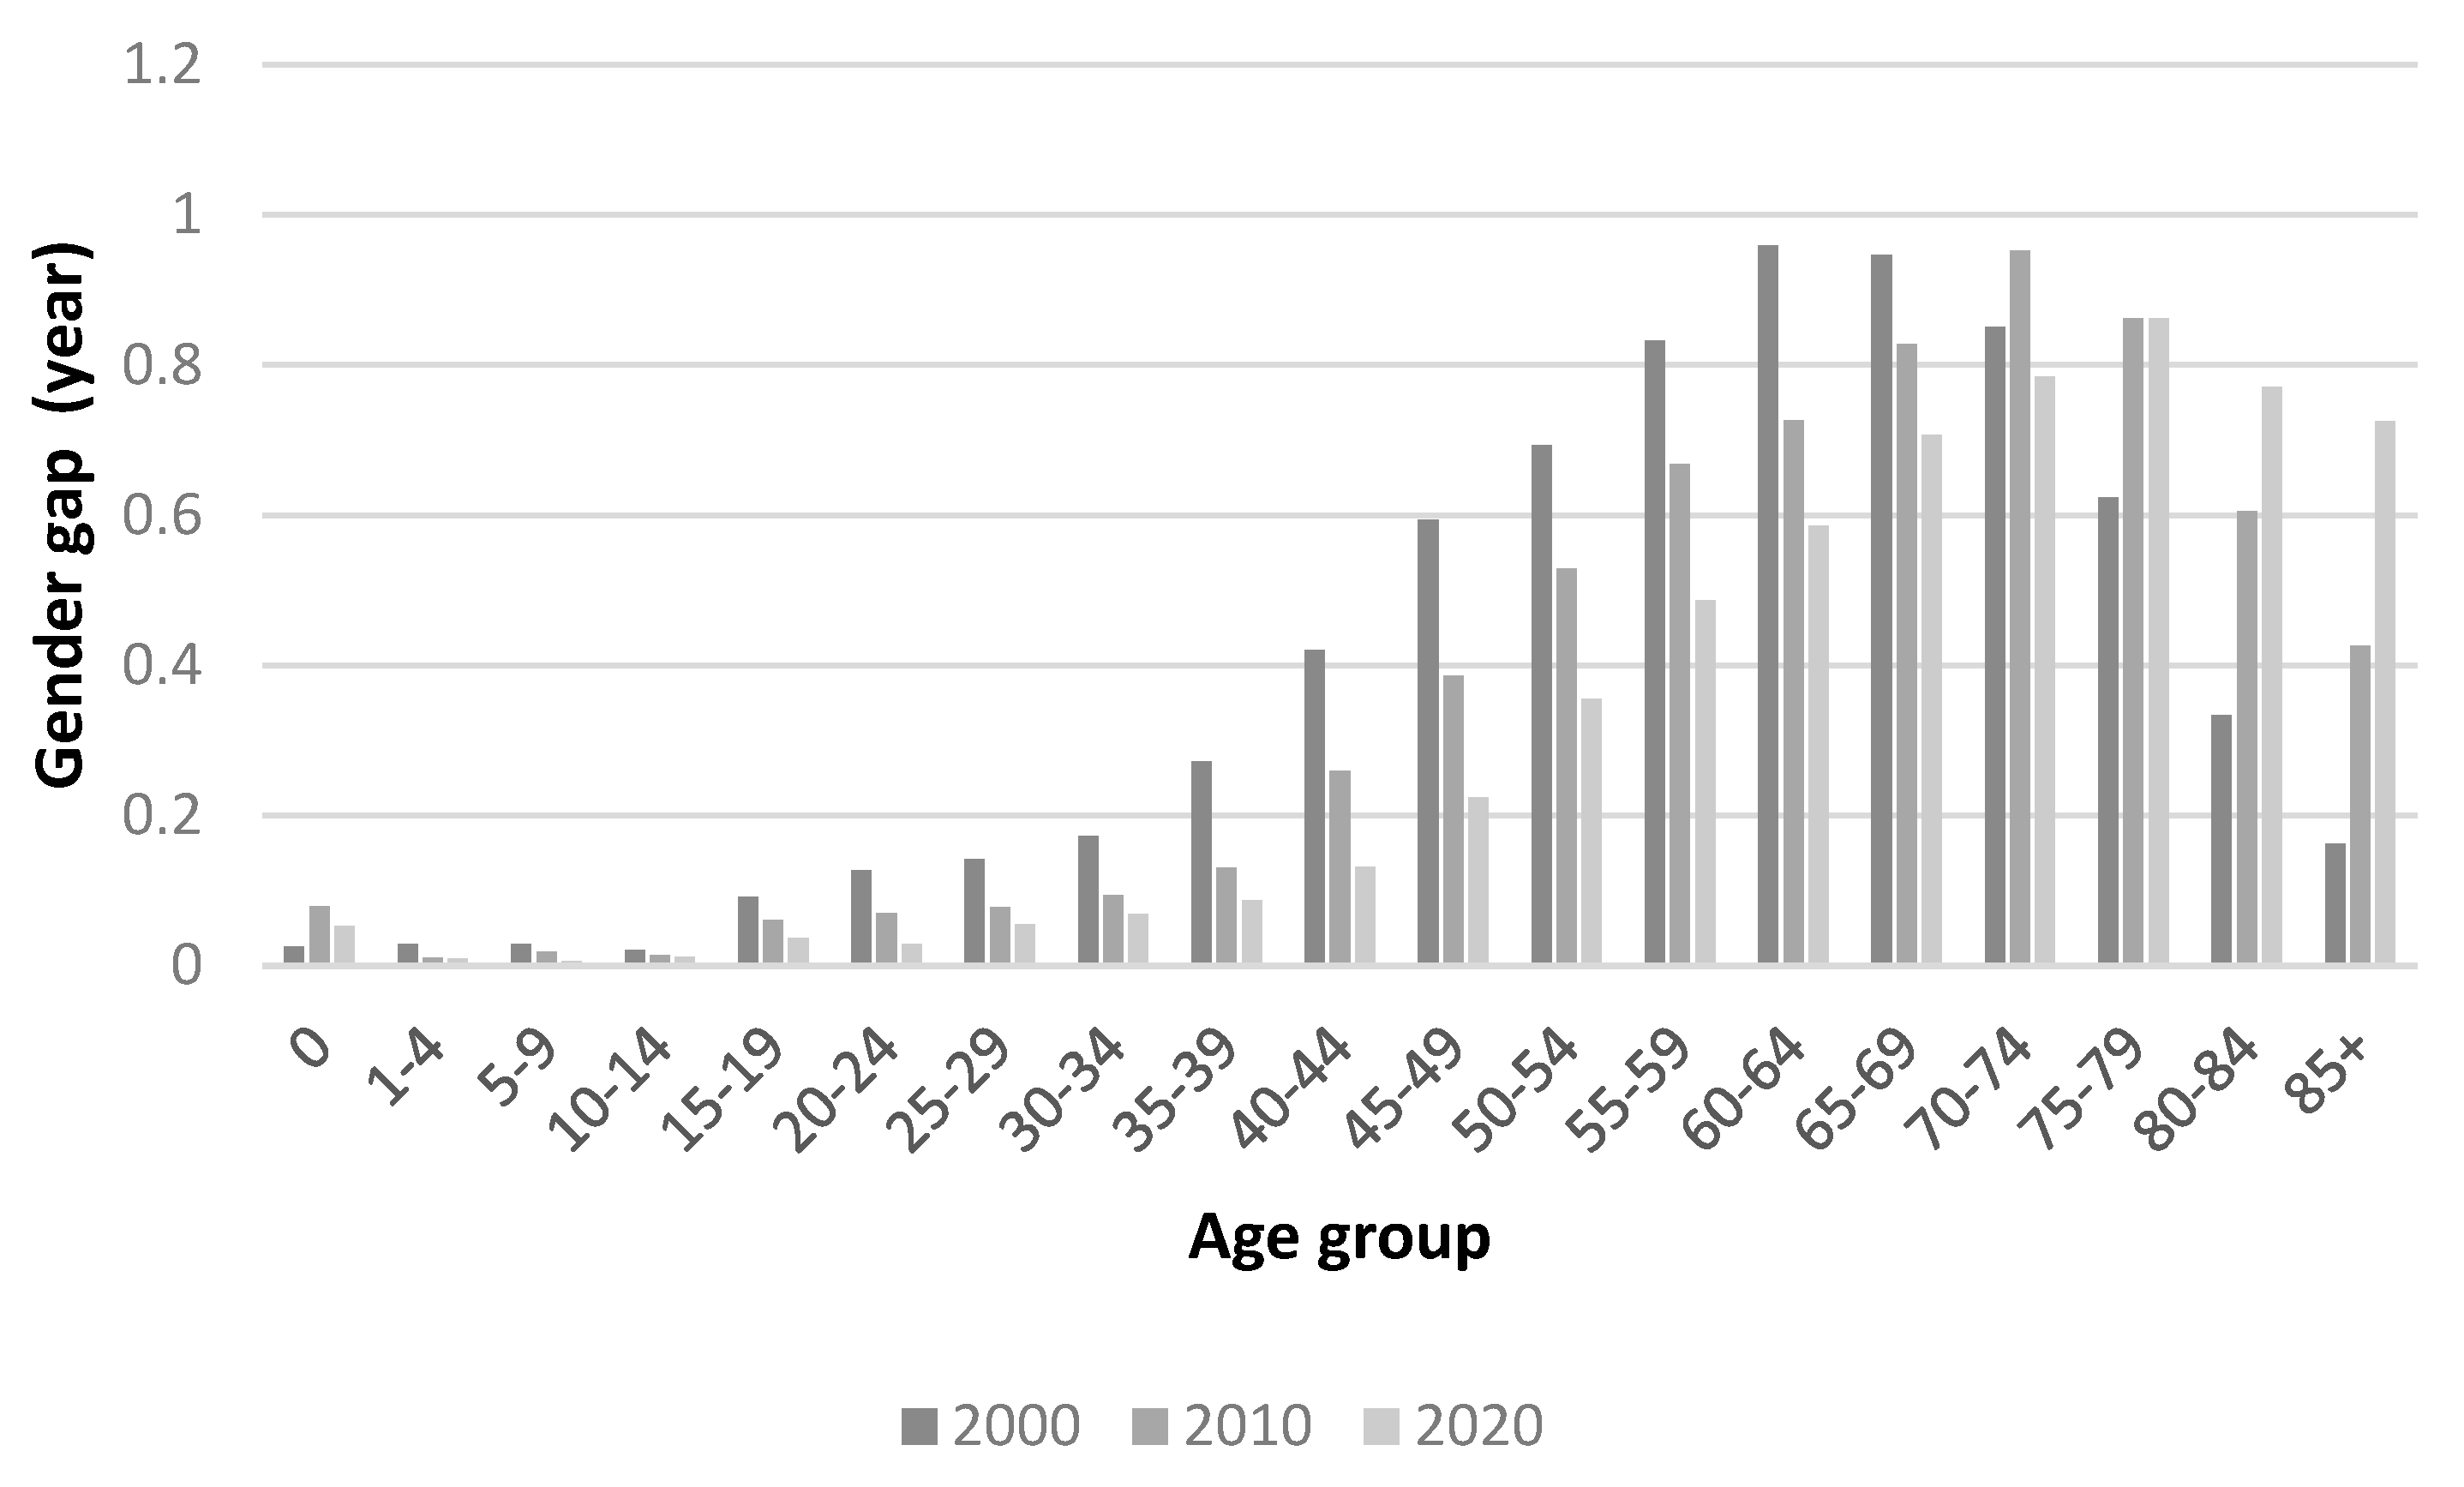
Figure 4.
Contribution of preventable and treatable causes to life expectancy, 2000-2010. (a) Males; (b) Females.
Figure 4.
Contribution of preventable and treatable causes to life expectancy, 2000-2010. (a) Males; (b) Females.
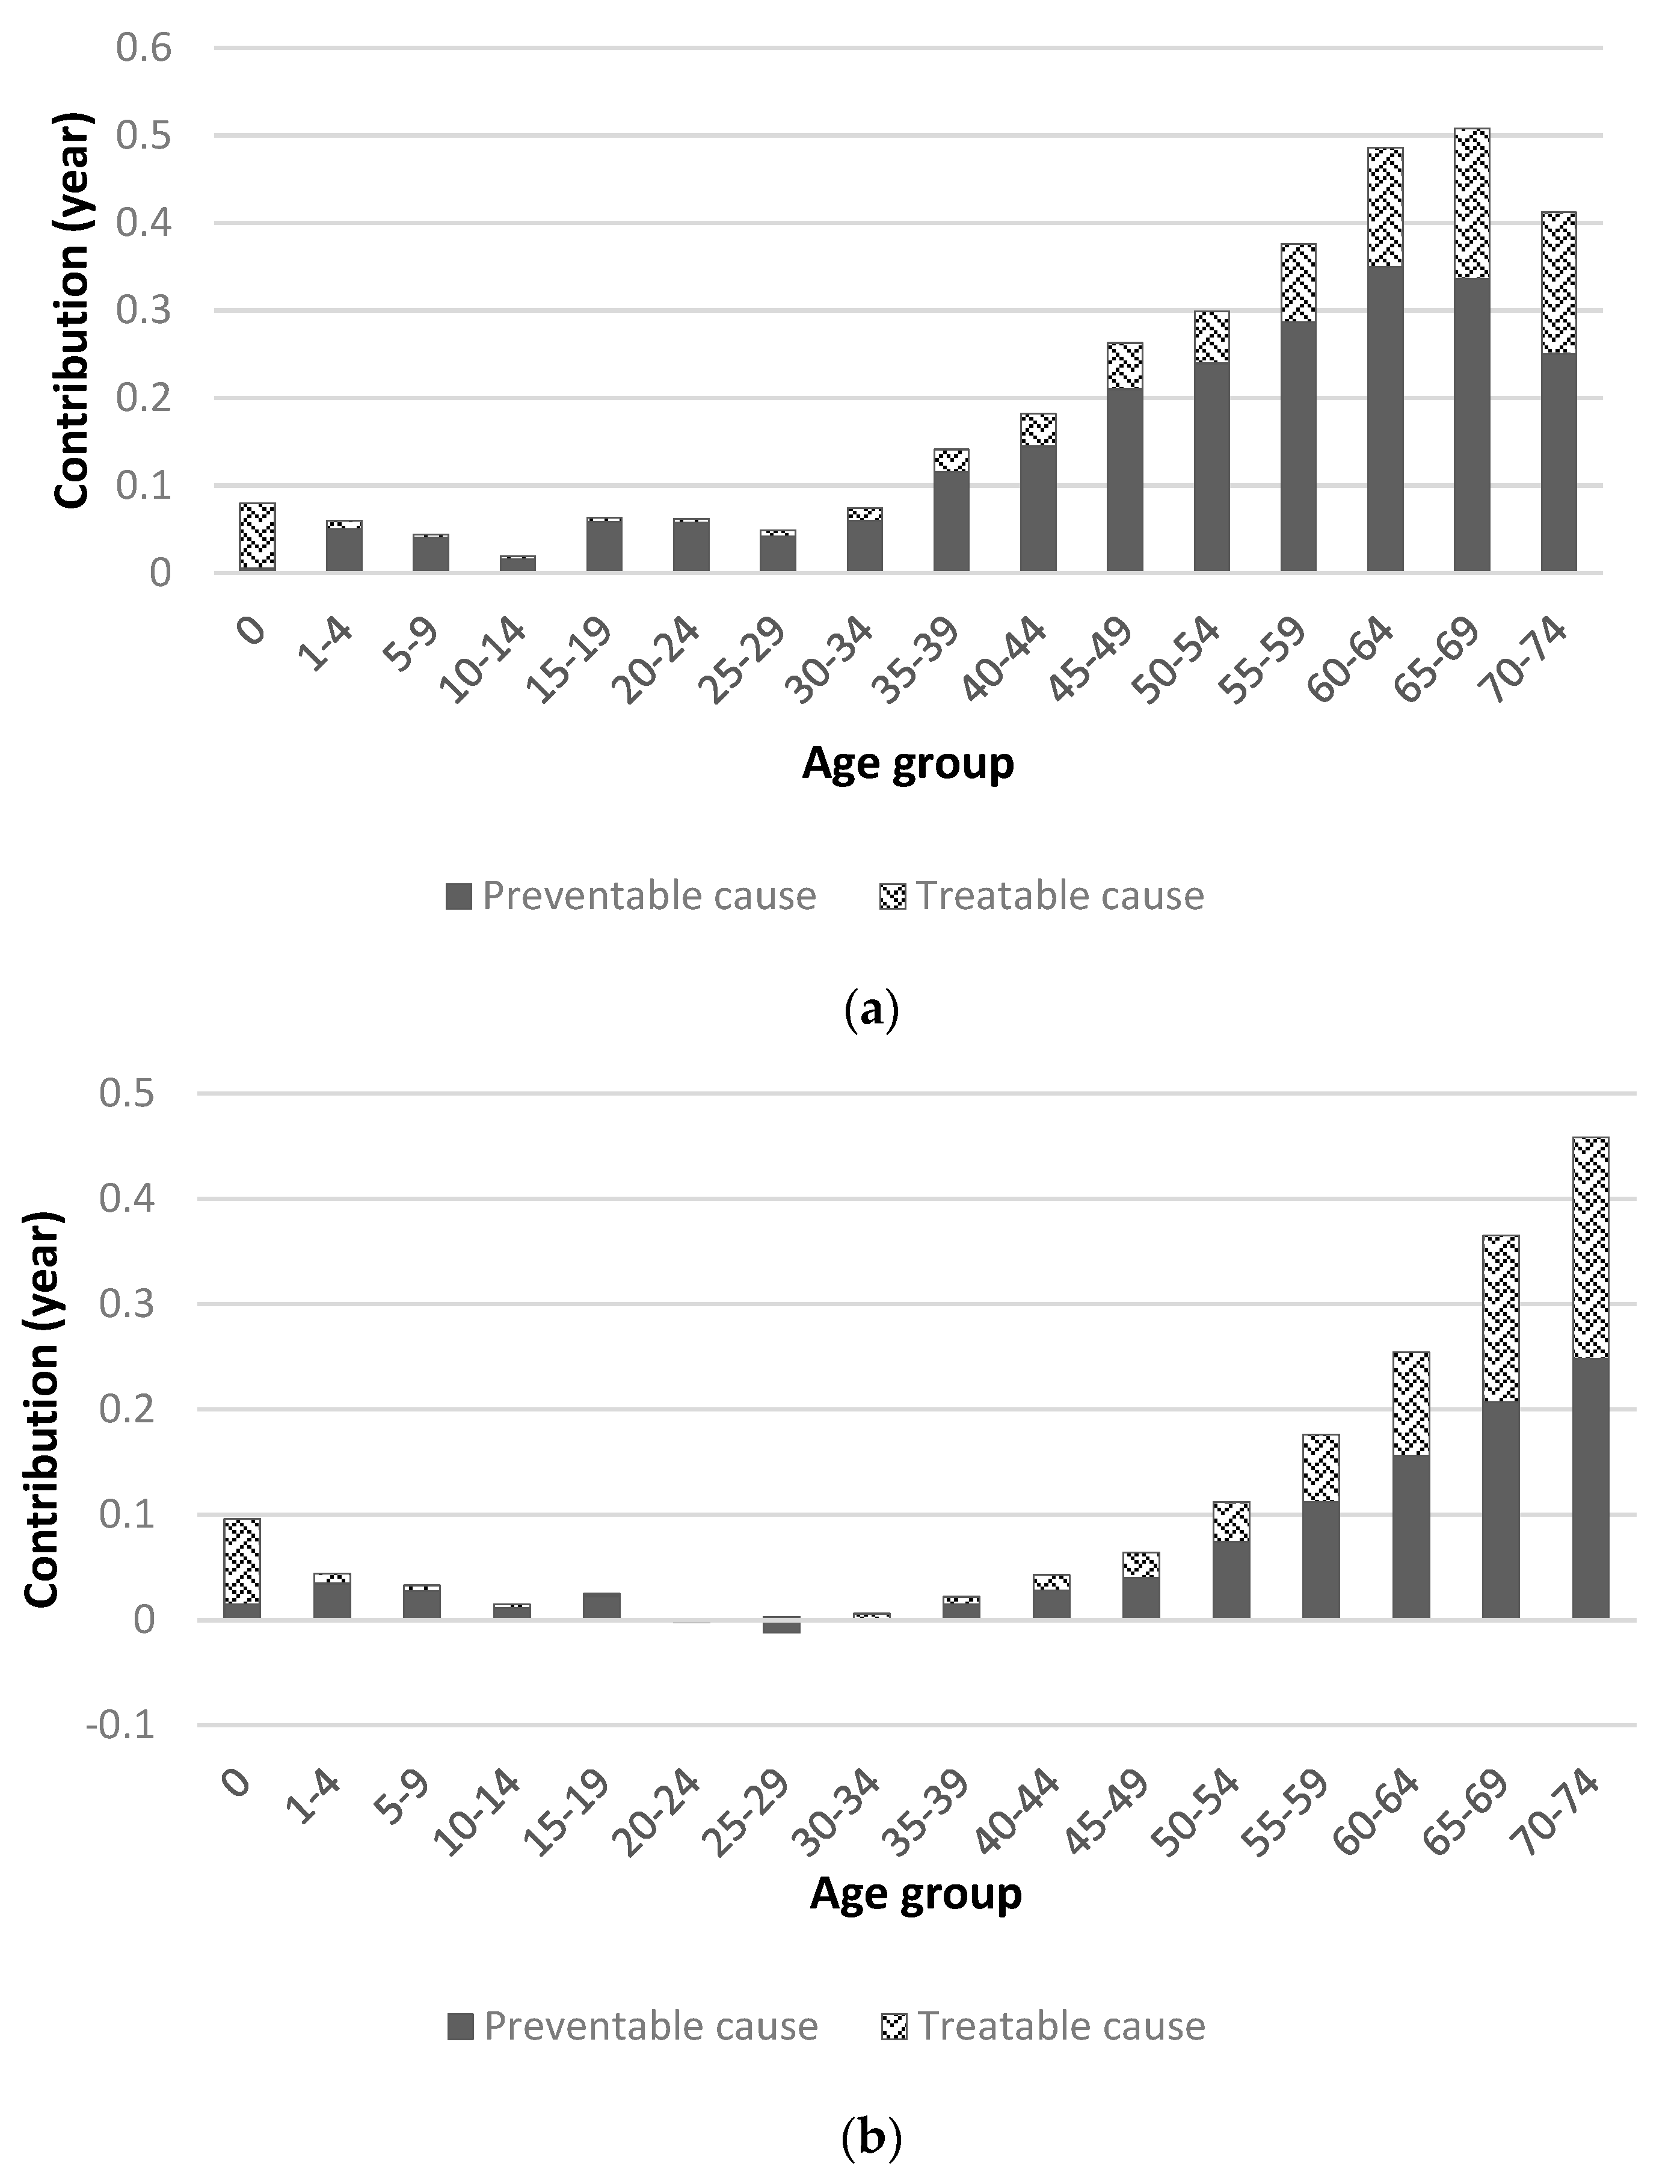
Figure 5.
Contribution of life expectancy by avoidable cause group, 2000-2010. IFD : Infectious disease, CA : Cancer, EMD : Endocrine and metabolic disease. DNS : Disease of nervous system, DCS : Disease of circulatory system. DRS : Disease of respiratory system, DDS : Disease of digestive system. DGU : Disease of genitourinary system,. PPN : Pregnancy, childbirth and perinatal period. CM : Congenital malformation, INJ : Injuries.
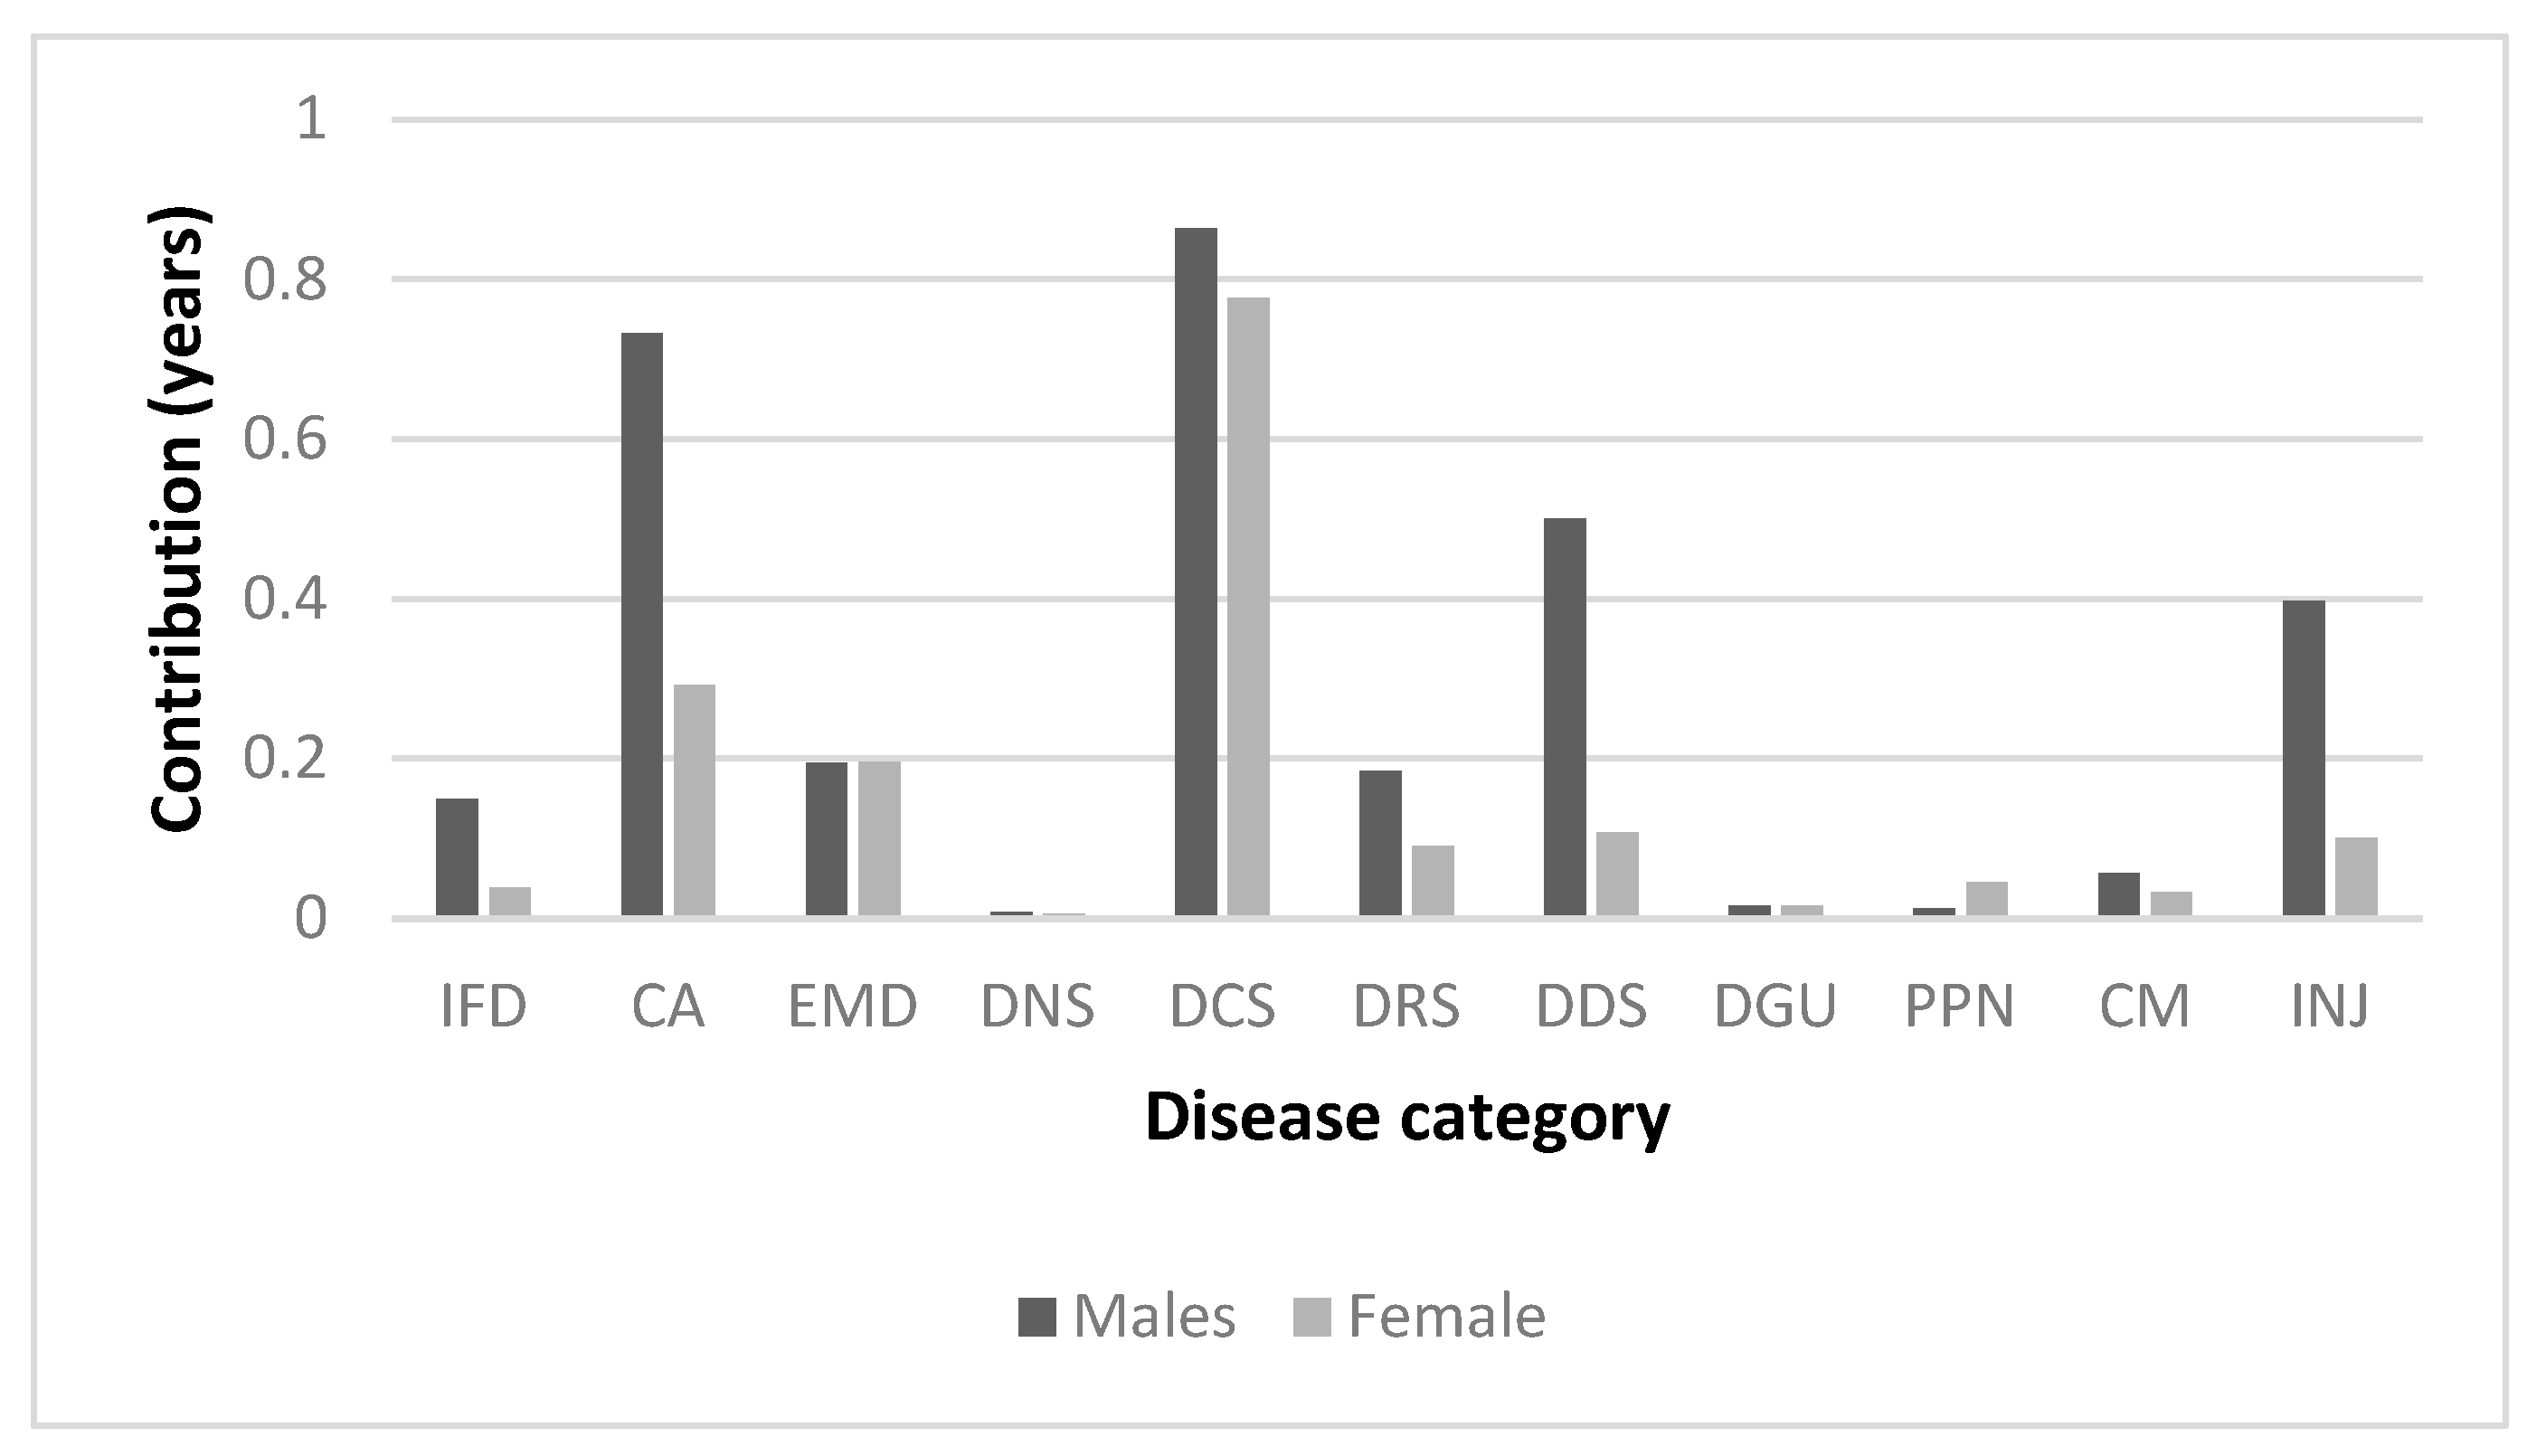
Figure 6.
Contribution of preventable and treatable causes to life expectancy, 2010-2020. (a) Males; (b) Females.
Figure 6.
Contribution of preventable and treatable causes to life expectancy, 2010-2020. (a) Males; (b) Females.
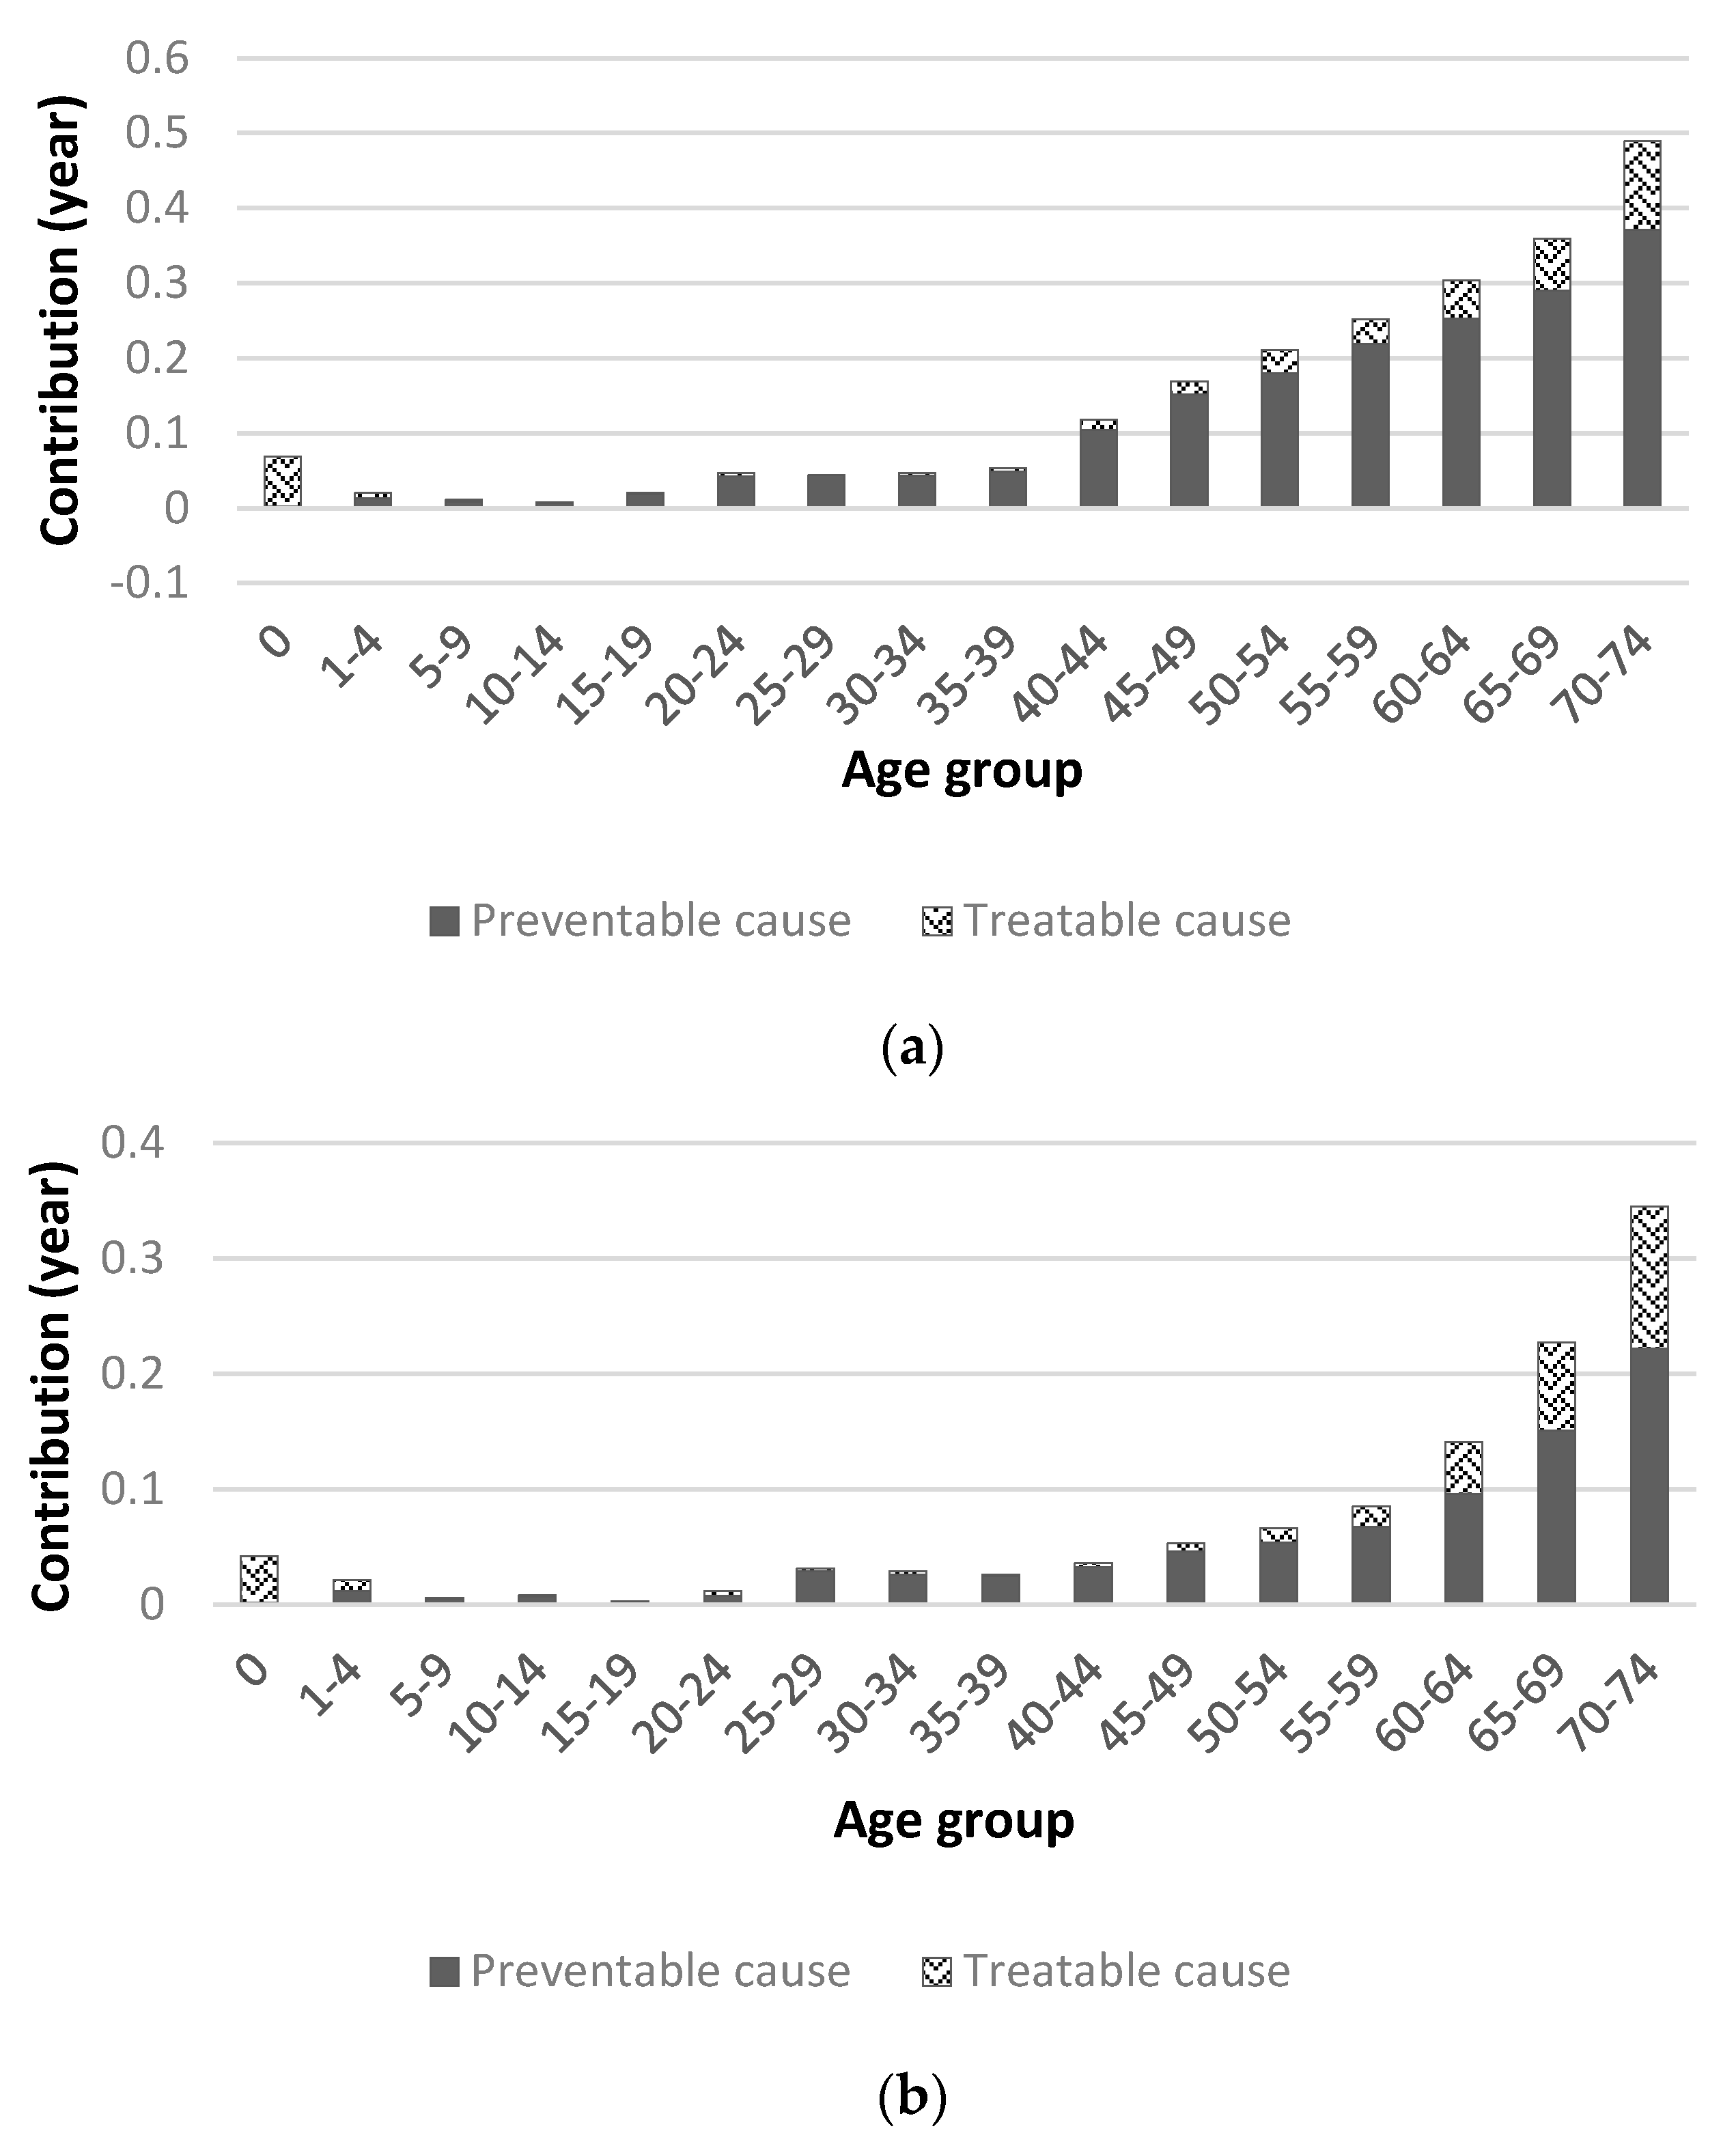
Figure 7.
Contribution of life expectancy by avoidable cause group, 2010-2020. IFD : Infectious disease, CA : Cancer, EMD : Endocrine and metabolic disease. DNS : Disease of nervous system, DCS : Disease of circulatory system. DRS : Disease of respiratory system, DDS : Disease of digestive system. DGU : Disease of genitourinary system, PPN : Pregnancy, childbirth and perinatal period. CM : Congenital malformation, INJ : Injuries.
Disclaimer/Publisher’s Note: The statements, opinions and data contained in all publications are solely those of the individual author(s) and contributor(s) and not of MDPI and/or the editor(s). MDPI and/or the editor(s) disclaim responsibility for any injury to people or property resulting from any ideas, methods, instructions or products referred to in the content. |
© 2023 by the authors. Licensee MDPI, Basel, Switzerland. This article is an open access article distributed under the terms and conditions of the Creative Commons Attribution (CC BY) license (http://creativecommons.org/licenses/by/4.0/).
Copyright: This open access article is published under a Creative Commons CC BY 4.0 license, which permit the free download, distribution, and reuse, provided that the author and preprint are cited in any reuse.
supplementary.zip (94.17KB )
Submitted:
28 August 2023
Posted:
30 August 2023
You are already at the latest version
Alerts
supplementary.zip (94.17KB )
This version is not peer-reviewed
Submitted:
28 August 2023
Posted:
30 August 2023
You are already at the latest version
Alerts
Abstract
This study investigated mortality discrepancies in Korea, 2000-2020, with a focus on age, gender, and preventable causes of death, and their impact on life expectancy at birth. The study utilized data from Korean Standard Classification of Diseases and OECD/Eurostat lists of preventable and treatable causes of death and employed Arriaga's method. Noteworthy findings revealed gender disparities in life expectancy increases, with male gaining an advantage over females from 2000-2020 (8.142 years for males versus 6.806 years for females). The most significant increase in life expectancy was found to be in males aged 70-74 and females aged 75-79. The gender gap in LEB is narrowing and that the main age group contributing to the gender gap are getting older. Reduced gains in life expectancy at birth resulted from avoidable mortality, contributing 57.3% to the increase. Cerebrovascular disease and transport accidents were positive contributors, whereas suicide and certain cancers were negative contributors. The changes in mortality for individuals aged 65 and over had an impact of 45.44% (males) and 71.01% (females) on life expectancy gains. This study offers a novel approach in evaluating avoidable mortality and life expectancy, having the potential to improve international health indicators and inform health policies.
Keywords:
Subject: Public Health and Healthcare - Public Health and Health Services
1. Introduction
In health at a glance 2021, the Organization for Economic Cooperation and Development (OECD) lists life expectancy at birth(LEB) and avoidable mortality as part of the population health system performance indicators for health status [1].
LEB is a key measure of population health and is often used to evaluate health system performance [2]. Globally, LEB is continuously increasing, including in Korea. Although LEB indicates the average length of length, it fails to provide any insight into the range of life expectancies. In practice, it has the limitation of not reflecting the differences in LEB between subgroups of the population. Therefore, to fully understand the health of a population, it is important to understand the contribution of subgroups of the population to LEB [3].
The main goal of a healthcare system is to improve overall health and ensure an equitable distribution of health outcomes across different subgroups. In this regard, gender health inequalities are of considerable importance as they reflect distinctions in social framework, including political and economic establishments and health and social policies [4]. According to WHO statistics, the gap in LEB between males and females is significant, with females living an average of 5.1 years longer than males globally in 2019 [5]. The gender gap in LEB may be explainable by biological, behavioral, and social-economic factors [6,7]. Given that health systems can enhance the longevity and population health by ensuring timely access to affordable and high-quality healthcare [9] it is also possible that public health policies and access to quality health care have contributed to the gender gap in LEB because it has been differentially distributed to males and females [10]. It is therefore important to examine the extent to which health policies and quality of healthcare contribute to the distribution of health outcomes across sociodemographic groups, including males and females.
Avoidable mortality refers to an unnecessary premature death that could be preventable by timely and suitable interventions and effective healthcare policy. It has long been recognized as an indicator of healthcare system performance [11]. Avoidable mortality can be divided into two distinct categories: preventable and treatable. Preventable mortality is the deaths that can be preventable through appropriate primary healthcare interventions or public health programs. Treatable mortality is defined as deaths that can be avoided through timely and effective medical interventions at the secondary and tertiary healthcare levels [11]. In South Korea, avoidable mortality continues to decline due to efficient healthcare policies [12]. South Korea's avoidable mortality rate in 2018 was 144.0 deaths per 100,000 population, which is lower than the OECD average (199.7) and has decreased significantly over 18 years compared to 2000 (344) [12]. Currently, various health policies are being identified and tried to further reduce avoidable mortality. To do so, it is necessary to understand the impact of different potentially avoidable causes of death on LEB.
Several studies have examined the impact of avoidable mortality on LEB. Avoidable mortality was first applied to population-level studies by Charlton, J et al [13]. They selected 14 disease groups to identify regional variation in avoidable mortality in England and Wales and found that regional variation in avoidable mortality resulted in significant variation in the quality of healthcare [13]. The first study to examine trends in avoidable mortality in Korea found that avoidable mortality declined significantly between 1982-1991 (37.4% in 1982 and 24.9% in 1991), especially among males, and cited acute respiratory diseases, malnutrition, pneumonia, and influenza as the leading causes. A follow-up to that study suggested that the reduction in avoidable mortality resulted in improved LEB [14]. Bahk, J et al. used the UK Office for National Statistics' cause of death list to assess the impact of avoidable mortality on LEB growth from 1998-2017 [15]. They found that changes in avoidable causes of death contributed more than 50% to the increase in LEB, and that avoidable causes of death such as cerebrovascular disease and traffic accidents were the main causes of the increase in LEB [15].
This study aims to identify the contribution of age and gender to the change in LEB in Korea over the past two decades and to analyze the impact of avoidable mortality on LEB. The results would provide insights into the causes of the increase in LEB in Korea.
2. Materials and Methods
2.1. Data Source
The statistical data used in this study were life table (1970 to 2020) and annual mortality data (2000 to 2020) from the Korea National Statistical Office. Annual LEB for both gender was calculated with standard demographic techniques [16]. Mortality data contained the number of deaths by 5-year age group, gender and cause for every year from 2000 to 2020. Causes of death were classified by Korean Standard Classification of Diseases and OECD/Eurostat lists of preventable and treatable causes of death (Table S1) [17]. 11 disease category-specific causes of death and several significant single diseases within the disease groups.
2.2. Analytical Method
Arriaga's decomposition method was applied to discern the roles of age, gender disparities, and causes of death in the increase in LEB [18]. This method assesses the impact of mortality changes across age groups and causes of death on the overall LEB shift within a defined period. As LEB reflects age-specific mortality rates, alterations in mortality rates across various age brackets dictate the overall change in LEB over time [18]. Therefore, the total shift in LEB results from the accumulation of years either added (positive contribution) or subtracted (negative contribution) to the LEB due to changes in mortality rates across different age segments within the specified period.
Furthermore, the cumulative years contributed by specific age groups to changes in LEB can also be parsed by causes of death [18]. Analogous to the age-based decomposition, reductions in mortality associated with specific causes within particular age groups lead to positive contributions to the overall change in LEB, while causes with increased mortality have negative contributions. Hence, the sum of cause-specific contributions aligns with the comprehensive contribution for each age group, ultimately culminating in the combined influence of age- and cause-related factors on LEB.
To summarize the method for measuring the years of life attributed to the increase in LEB due to changes in the sinusoidal structure, the process is as follows: The change in LEB arises from changes in mortality at each specific age, reflecting an increase or decrease in years of life gained or lost due to changes in the central mortality rate.
The number of years contributed to the increase in LEB by the change in mortality within a specific age group from the baseline year (0 year) to the comparison year (1 year), denoted as the change in mortality in the specific age group (), can be expressed using equation (1).
If the change in total mortality in age group j is denoted as = the change in mortality for each cause of death (C) can be represented as = .
The change in mortality within a particular age group, represented as (where s is the group of causes of death), is the sum of changes in mortality from each cause within the same age group. The contribution of each cause's change in a particular age group to the increase in LEB (equation 2) can be expressed as a ratio of total life expectancy.
3. Results
3.1. Life Expectancy at Birth in Korea, 1970-2020
Figure 1 presents the trends of LEB by gender in Korea from 1970 to 2020. LEB had continued to increase for both males and females, although the rate of increase is gradually slowing down. From 1970 to 2020, The LEB increased at an average annual rate of 0.42 years (0.43 years for males and 0.41 years for females). The difference in LEB between males and females shows that female's LEB had always been higher than male's (Table S2).
3.2. Age-Specific Contribution to Life Expectancy at Birth
The age-specific contribution to the increase in LEB from 2000 to 2020 was examined separately for males and females. The period of the study was also divided into two sub-periods, 2000-2010 and 2010-2020.
From 2000 to 2020, LEB increased by 8.142years for males and 6.806 years for females. In both 2000-2010 and 2010-2020, LEB increased more for males than for females. In 2000-2010, the increase in LEB was 4.494 years for males and 3.967 years for females, and in 2010-2020, the increase in LEB was 3.648 years for males and 2.839 years for females. Comparing the gains in LEB between the two periods, both males and females experienced more gains in LEB in 2000-2010 than in 2010-2020 (Table S3 and Figure 2).
Looking at the age groups that contributed most to LEB gains for both genders, over the 20-year period LEB increased by more than 0.2 years for males after the age of 35 and for females after the age of 55. When broken down by decade, LEB gains of more than 0.1 years for males were observed in the 35-39 age group in the period 2000-2010 and in the 40-44 age group in the period 2010-2020 (Table S3 and Figure 2a), while LEB gains of more than 0.1 years for females were observed in the 50-54 age group in the period 2000-2010 and in the 60-64 age group in the period 2010-2020 (Table S3 and Figure 2b). Thus, the age-specific contributions to LEB gains were found to be made by females around 20 years older than males.
Over the 20-year period, the age groups with the largest increases in LEB were 70-74 years (1.105 years, 13.57%) and 65-69 years (0.996 years, 12.23%) for males, and 75-79 years (1.189 years, 17.47%) and 70-74 years (1.032 years, 15.16%) for females. At the decade level, it was 65-69 years (0.590 years, 13.13%) for males in 2000-2010 (Table S3 and Figure 2a) and 70-74 years (0.572 years, 15.68%) in 2010-2020, and 75-79 years (0.659 years, 16.61% and 0.530 years, 18.67%, respectively) for females in both periods (Table S3 and Figure 2b). Thus, the gains in LEB were largely driven by those aged 65 and over.
Taken together, these results suggest that the main contribution to the increase in LEB in Korea since 2000 has been made by those aged 65 and over, with relatively large contributions from those aged 70-74 for males and 75-79 for females.
3.3. Gender Gap in Life Expectancy at Birth
The difference in LEB between males and females was determined in three years: 2000, 2010 and 2020. In 2000, male LEB was 72.3 years and female LEB was 79.7 years, a difference of 7.4 years. In 2010, male LEB was 76.8 years and female LEB was 83.6 years, a difference of 6.8 years, and in 2020, male LEB was 80.5 years and female LEB was 86.5 years, a difference of 6.0 years. In all three years, female LEB was about six to seven years higher than male LEB.
When the difference in LEB between males and females is broken down by age, the age group 0-44 does not have a significant impact on the gender gap in LEB, as the difference between male and female LEB is less than 0.5 years in all three years and contributes less than 20% to the difference in LEB between males and females (Table S4 and Figure 3). In contrast, the gender gap in LEB was greater than 0.5 years in 2000 for those aged 45-79, in 2010 for those aged 50-84 and in 2020 for those aged 60-85 and over. The age groups with the highest gender gaps were 60-64 years (0.959 years, 13.10%) in 2000, 70-74 years (0.952 years, 14.01%) in 2010 and 75-79 years (0.862 years, 14.40%) in 2020.
It shows that the gender gap in LEB is narrowing and that the main age group contributing to the gender gap in LEB are getting older.
3.4. Contribution of Avoidable Mortalities to Life Expectancy at Birth
To determine the contribution of changes in causes of death due to avoidable mortality to LEB, cause of death data and life tables from Korea National Statistics Office as the main data.
Changes in mortality can be attributed to changes in the age-specific cause of death structure. The change in age-specific cause of death can be evaluated as a positive or negative contribution to the increase in LEB. A positive contribution is an increase in LEB due to a decrease in mortality, while a negative contribution is a decrease in LEB due to an increase in mortality. Some conditions that do not appear in the OECD/Eurostat list of avoidable causes of death (236 items) are included in the list of co-morbidities. Among the 13 major categories, Adverse effects of medical and surgical care were excluded as the category was not found in Korean mortality data. Hepatitis, cirrhosis, and fibrosis causes of death were classified as digestive system diseases according to Korean Standard Classification of Diseases.
3.4.1. Contribution of Avoidable Mortalities to Life Expectancy at Birth, 2000-2010
Using the Office for National Statistics data on causes of death from 2000 to 2010 and the life tables from 2000 and 2010, we calculated the contribution of avoidable mortalities to LEB in each age group over the 10-year period (Table S5).
For males, the increase in LEB due to avoidable mortalities was 3.118 years. Of these, 0.856 years (27.5%) were due to treatable mortality and 2.262 years (72.5%) to avoidable mortalities, with avoidable mortality being more than 2.5 times greater than treatable mortality. The highest contribution to LEB gains was in the 65-69 age group (0.509 years), and the lowest in the 10-14 age group (0.019 years). Cerebrovascular diseases (0.672 years), transport accidents (0.472 years) and fibrosis and cirrhosis of the liver (0.472 years) make positive contributions to LEB gains (Table S5). For cerebrovascular disease, the gain in LEB begins to increase by more than 0.1 year after the age of 60, while for transport accidents the effect is more widespread across all age groups than for specific age groups. For fibrosis and cirrhosis of liver, LEB increases by 0.05 to 0.08 years between the ages of 40 and 69, while liver disease seems to affect middle-aged people. Negative contributors to LEB were intentional self-harm (0.307 years), colorectal cancer (0.027 years) and viral hepatitis (0.021 years).
For females, the contribution of avoidable mortalities to LEB was lower than for males, at 1.702 years. Of these, 0.723 years (42.5%) were due to treatable mortality and 0.979 years (57.5%) to avoidable mortalities (Table S5). The highest contribution to LEB gains was in the 70-74 age group (0.458 years), and the lowest in the 25-29 age group (-0.009 years). Cerebrovascular disease (0.612 years), diabetes mellitus (0.194 years) and transport accidents (0.186 years) made a positive contribution to LEB. For cerebrovascular disease, the contribution to LEB starts to increase after the age of 60, with a gain of more than 0.1 years, and for transport accidents, the contribution to LEB is similar for all age groups (0.09 to 0.018 years) except for age 0. For diabetes mellitus, the contribution was higher in the 55+ age group at 0.176 years (89.3%). The negative contributors to LEB were intentional self-harm (0.189 years), breast cancer (0.022 years) and viral hepatitis (0.017 years), with intentional self-harm and viral hepatitis being the same for males.
When the avoidable mortalities of males and females were divided into treatable and preventable mortalities, preventable mortality contributed more than treatable mortality, except at age 0 (Table S6 and Figure 4). Only at age 0 is the treatable mortality rate high, suggesting that medical interventions are important in reducing infant mortality.
Comparing avoidable mortalities in 11 broad categories, the gains in LEB for males and females were higher for diseases of the circulatory system (0.863 years for males and 0.776 years for females), cancer (0.733 years for males and 0.292 years for females) and diseases of the digestive system (0.501 years for males and 0.108 years for females) (Table S7 and Figure 5).
In summary, the contribution of diseases of the circulatory system and cancer to the change in LEB between 2000 and 2010 was higher for males than for females, for diseases than for conditions, and for older age groups than for younger age groups for both genders.
3.4.2. Contribution of Avoidable Mortalities to Life Expectancy at Birth, 2010-2020
Using the Office for National Statistics data on causes of death from 2010 to 2020 and the life tables from 2010 and 2020, we calculated the contribution of avoidable mortalities to LEB in each age group over the 10-year period (Table S8).
For males, the gain in LEB due to avoidable mortalities was 2.220 years (0.425 years for treatable mortality and 1.796 years for preventable mortality), with the contribution of preventable mortality being about four times greater than that of treatable mortality (Table 10). The highest contribution to LEB gains was in the 70-74 age group (0.489 years) and the lowest in the 10-14 age group (0.008 years) (Table S8). Positive contributions to LEB gains were made by cerebrovascular diseases (0.270 years), transport accidents (0.257 years) and liver cancer (0.251 years). Compared with 2000-2010, viral hepatitis, which was a negative cause, may have become a positive cause in 2010-2020 due to advances in medical technology or improvements in services over time. The contribution to the increase in LEB was higher in the post-60 age group for cerebrovascular diseases and in the post-45 age group for liver cancer. Pneumonia (0.052 years) and sepsis (0.016 years) made a negative contribution to LEB.
For females, the contribution of avoidable mortalities to LEB was 1.131 years, of which 0.349 years (31%) were due to treatable mortality and 0.783 years (69%) to avoidable mortalities.
The highest contribution to LEB gains was in the 70-74 age group (0.345 years), and the lowest in the 15-19 age group (0.003 years) (Table S8). The positive contributors to LEB are cerebrovascular disease (0.211 years), diabetes mellitus (0.108 years) and transport accidents (0.104 years), with both cerebrovascular disease and diabetes mellitus contributing more to LEB in the post-60 age group than in other age groups. Breast cancer (0.016 years) and pneumonia (0.016 years) contribute negatively to the reduction in LEB.
Avoidable mortalities for males and females were split into treatable and preventable mortalities to see the difference in their contributions, with preventable mortality contributing more than treatable mortality, except at age 0 (Table S9 and Figure 6). Comparing preventable mortality across the 11 broad categories, cancer (0.782 years), injuries (0.634 years) and disease of circulatory system (0.388 years) contributed most to LEB in males, followed by disease of circulatory system (0.316 years), cancer (0.285 years) and injuries (0.265 years) in females (Table S10 and Figure 7). In the period 2010-2020, the contribution of avoidable mortalities to LEB gains was lower for both males and females than in the period 2000-2010. In terms of gender, males were higher than females, in terms of age, males and females were higher in the 70-74 age group, and in terms of disease category, males were higher for cancer and females were higher for disease of circulatory system.
4. Discussion
This study analyzed the contribution of differences and changes in mortality by age, gender, and avoidable causes to LEB over the period 2000-2020.
From 2000 to 2020, LEB increased more for males (8.142 years) than for females (6.806 years). The contribution of those aged 65 and older was 45.44% (3.70 years) for males and 71.01% (4.83 years) for females, indicating that a large proportion of the increase in LEB was due to changes in mortality in the 65 and older age group. From this, it can be concluded that the 65+ age group contributed the most to the increase in LEB in Korea since 2000, especially in the 70-74 age group for males and 75-79 age group for females.
In recent years, the contribution of the younger age groups to the increase in LEB has been declining, while the contribution of the middle-aged and older age groups has been increasing. This is consistent with a study that found that changes in mortality at age 65 and older had the largest impact on LEB between 2000-2013 [19], and the previous study that found that the most significant contribution to LEB gains over the 30-year period from 1985-2015 was at ages 55-64 for males and 65-74 for females [19]. It is also consistent with findings in Germany that the largest contribution to LEB over 40 years was made by those aged 65 and older (2.9 years for males and 4.0 years for females) [20] and in Sweden that the largest contribution was made by those aged 65 and older (2.3 years for males and 1.37 years for females) between 1997-2014 [21].
The gender gap in LEB at each period was highest for those aged 60-64 in 2000 (0.959 years), 70-74 in 2010 (0.952 years), and 75-79 in 2020 (0.862 years). In 2000 and 2010, the gender gap in LEB was highest at ages 65-74 and decreased thereafter, while in 2020, the gender gap in LEB increased until ages 75-84. The gender gap in LEB shifts to older age group, which is consistent with previous studies [19].
The contribution of avoidable mortality to LEB from 2000 to 2020 is 57.3% (4.285 years), which is not directly comparable to other studies due to the different list of avoidable causes of death and study period. The increase in LEB due to avoidable mortality is higher for males (5.338 years) compared to females (2.833 years), which can be explained by the increase in LEB being higher for males (8.142 years) compared to females (6.806 years). The age-specific contribution of avoidable mortality is higher in the 65+ age group, which is likely due to the higher contribution of LEB gains in the 65+ age group.
In this study, the contribution to LEB gains was higher for avoidable mortality than for treatable mortality for both males and females, which is consistent with previous studies [14]. This suggests that preventable mortality needs to be further reduced. There was also a higher contribution from preventable mortality in males compared to females, which was likely due to liver disease (cirrhosis and fibrosis), stomach cancer and lung cancer. These causes of death are associated with higher mortality rates in males than in females and are thought to be caused by alcohol consumption and smoking habits, which contribute to liver disease (cirrhosis and fibrosis). It has also been argued that the lower rate of change in preventable mortality in females compared to males may be due to an increase in breast cancer mortality [14].
Alcohol consumption in Korea has not decreased over the past two decades and the downward trend in hepatitis B virus infection may have contributed to the decrease in mortality from alcohol-related diseases and malignant neoplasms of the liver [22]. Although the prevalence of smoking among men in Korea has decreased significantly from 60.9% in 2001 to 34% in 2020, the prevalence among women is very low (6.6% in 2020) and has increased slightly compared to 2001 (5.2%). Since the 2000s, the prevalence of smoking has decreased significantly due to the impact of government anti-smoking policies and changes in social awareness and is almost comparable to the average prevalence in OECD countries. Gender disparities in lifestyle behaviors, including smoking and alcohol consumption, are likely to be an important factor in the difference in LEB between males and females [23].
The present study could suggest the factors that influenced the decline in preventable mortality in two aspects.
First, a significant contributor to preventable mortality is vaccination. Vaccines are one of the greatest achievements of biomedical science and public health, contributing to the reduction of acute and chronic infectious diseases. Studies in the United States have shown that vaccination has reduced deaths by more than 99% for diphtheria, mumps, pertussis, and tetanus [24]. Polio, measles, and rubella viruses have been eliminated, and smallpox has been eradicated globally. Reductions in cases and deaths of most vaccine-preventable diseases, including hepatitis A, acute hepatitis B, Hib, and chickenpox, have been shown to be greater than 80%. In Korea, immunization rates are estimated to be high due to state support for essential immunizations for children. According to data from Statistics Korea in 2020 (National Childhood Immunization Rate Status), the immunization rate of nine vaccines surveyed was over 90%. The vaccination target is also gradually expanding, and in the case of HPV vaccination, state support is expanding from the current 12-year-olds to female adolescents aged 13-17 and low-income women aged 18-26. Immunization against human papillomavirus infection aims to prevent cervical, oropharyngeal, and anal and genital cancers. It can be said that infection prevention policies and immunizations have led to a decrease in infectious diseases and a decrease in avoidable mortality.
Second, Korea has implemented the National Health Promotion Act of 1995, which aims to improve the health of the people by creating conditions for practicing healthy living, and has implemented health promotion projects through health education, disease prevention, nutrition improvement, and healthy living practices. Changes in lifestyle appear to have contributed to the decline in preventable mortality. The development of non-communicable diseases, the world's leading cause of death, is influenced by lifestyle. Smoking, physical inactivity, unhealthy diet, obesity, and other lifestyle behaviors (such as alcohol consumption) are associated with the development of diseases such as cancer, heart disease, stroke, and diabetes [25], and are factors in reducing preventable mortality.
The higher the number of healthy lifestyle factors among the above five lifestyle factors, the lower the mortality rate, especially when four healthy lifestyle factors are practiced [25,26], and when at least three are practiced, it can be considered to have a healthy lifestyle [27]. Therefore, it is thought that time and motivation are needed to continuously promote health promotion projects for lifestyle improvement to the entire population so that it can become a habit.
In present study, cerebrovascular disease and transport accidents were the factors that influenced the increase in LEB from avoidable mortality in both males and females. Cerebrovascular disease contributed 0.942 years of LEB for males and 0.823 years of LEB for females. This is consistent with studies in Europe[28], Korea [15] and elsewhere that show that changes in the mortality of circulatory diseases are a major factor affecting LEB.
The age-standardized mortality rate for cerebrovascular disease in Korea decreased from 89.8 per 100,000 in 2000 to 20.1 in 2020, which is lower than the average for OECD countries (63.5 in 2018) [12]. The global rate of cerebrovascular disease deaths in Korea is also decreasing, which may have contributed to the decrease in avoidable mortality. The decline in stroke mortality, a type of cerebrovascular disease, can be attributed to quality improvement efforts. The Acute Stroke Adequacy Evaluation System was launched by the Korea Health Insurance Review and Assessment Service in 2006, and the Ministry of Health and Welfare has been operating regional cardiovascular disease centers since 2008. In addition, the Cardiovascular Disease Act was enacted in 2016, which comprehensively establishes and implements policies for the prevention, treatment, rehabilitation, and research of cardiovascular diseases. In addition, the decrease in the prevalence of hypertension, the increase in the treatment rate for hypertension, and the expansion of medical access through the National Health Insurance Program have contributed to the decrease in cerebrovascular disease mortality [22].
Among avoidable causes, the decrease in transportation accidents contributed to the improvement in LEB for both males and females. It increased LEB by 0.768 years for males and 0.324 years for females. Korea's transport accident rate decreased from 21.8 deaths per 100,000 people in 2000 to 5.9 deaths per 100,000 people in 2020, which is still the highest among major OECD countries. This decrease in traffic accident fatality rate can be attributed to seat belt use, walking environment improvement projects, expansion of traffic surveillance cameras, increased fines, stricter penalties for drunk driving, and road safety education programs.
In this study, suicide (intentional self-harm) was found to be the leading cause of decreased LEB in both men and women. Korea's suicide rate (per 100,000 population) was 23.0 ('17), the highest among OECD countries and 2.1 times higher than the OECD average (11.2). Over the 20-year period 2000-2020, the increase in mortality from suicide was the largest contributor to the decline in LEB. Suicide mortality has now surpassed deaths from diabetes, hypertensive disease, and liver disease, and the need to address rising suicide mortality cannot be overemphasized. Since 2000, suicide rates have continued to increase, reaching a peak in 2011, and have been declining since then. This can be explained by the fact that in this study, suicide was analyzed as a negative contributor to LEB in the period 2000-2010, whereas in the period 2010-2020 it was analyzed as a positive contributor.
In 2020, the suicide rate was three times higher for men than for women and increased with age, peaking in the 80+ age group. Suicide rates have been reported to increase during economic crises in different countries[29,30,31], and the impact of changes in the economy, employment, and other socioeconomic factors on suicide rates may have been greater in men in recent decades [32].
Pneumonia was the cause of death that contributed to the decrease in LEB among males. Infectious disease mortality rates for pneumonia and influenza are known to fluctuate from year to year, but in any given year, pneumonia mortality accounts for 30% of all respiratory causes of death in the OECD [33]. Pneumonia is a common cause of death in the elderly [34], and the resurgence of pneumonia is likely since Korea is the fastest aging country in the world [35]. In the future, pneumococcal and influenza immunization rates should be increased, and the prescription of antibiotics should be used more wisely [36]. Strategies to reduce the volume and pathogenicity of aspirated material are needed, especially in the elderly, because swallowing disorders and cough reflex disorders in the presence of cerebrovascular disease increase the risk of pneumonia [34].
Breast cancer was found to be the cause of decreased LEB among females. Breast cancer is the most common malignancy among Korean women and is a multifactorial complex disease in which many factors are involved in the development of the disease, including family history and genetic predisposition, internal environmental factors such as hormonal and reproductive factors, drugs, personal illness and lifestyle, and external environmental factors such as diet, occupational exposure, and environmental hormones. A woman's age can be seen as a major factor contributing to the increased risk of breast cancer because many risk factors for breast cancer can accumulate and increase with age, and exposure to female sex hormones also accumulates with age [37]. However, while the frequency of breast cancer increases with age in Western women, it increases until the early 50s in Korea and then gradually decreases after that. According to OECD statistics, the five-year survival rate for breast cancer in Korea from 2010-2014 was 86.6%, which is slightly higher than the OECD average of 84.5%. Primary prevention of breast cancer can be considered as reducing exposure to female hormones and improving lifestyle. Secondary prevention is early detection, and women aged 40 and older are encouraged to have a mammogram every two years. Early detection and treatment of breast cancer can reduce mortality, and higher national cancer screening rates have been shown to reduce curable mortality [38]. It has also been reported that breast cancers detected by screening often have a better prognosis and tend to have lower mortality rates than cancers diagnosed after symptoms have developed, emphasizing the effectiveness and importance of breast cancer screening.
The present study suggests that the causes of death that contributed to the decline in LEB during the period 2000-2020 were suicide (both genders), pneumonia (males), and breast cancer (females), and that improving avoidable causes of death, especially preventable causes, can contribute to increasing LEB.
Korea is one of the OECD countries with the highest projected LEB at age 65 [35], and reductions in avoidable mortality have contributed significantly to the increase in LEB among the elderly. There is still room for improvement in avoidable mortality, and health policies to reduce treatable and preventable mortality should continue.
5. Conclusions
Gender-based disparities in life expectancy increases, with male gaining an advantage over females from 2000-2020 (8.142 years for males versus 6.806 years for females). The most significant increase in life expectancy at birth was found to be in males aged 70-74 by 1.088 years and females aged 75-79 by 1.206 years. The gender gap in LEB is narrowing and that the main age group contributing to the gender gap are getting older. Avoidable causes of death have a significant impact on LEB, with cerebrovascular disease and transport accidents contributing to increases in LEB for both males and females, and suicide, pneumonia, and breast cancer contributing to decreases, particularly for males and those aged 65 and older. Preventable causes of death contribute more to LEB than treatable causes of death. Given that avoidable mortality can be reduced by immunization and lifestyle changes, aggressive improvement in avoidable mortality is important for improving LEB.
Supplementary Materials
The following supporting information can be downloaded at: Preprints.org, Table S1: Joint OECD/Eurostat lists of preventable and treatable causes of mortality; Table S2: Life expectancy at birth by gender in Korea, 1970-2020; Table S3: Age group-specific contribution to life expectancy at birth in Korea, 2000-2020; Table S4: Contribution of the mortality gender gap at each age group to the total gender gap in life expectancy at birth in Korea, 2000, 2010 and 2020; Table S5: Arriaga decomposition of changes in life expectancy at birth by avoidable cause of death, 2000-2010; Table S6: Contribution of preventable and treatable causes to life expectancy, 2000-2010; Table S7: Contribution life expectancy at birth by avoidable cause group, 2000-2010; Table S8: Arriaga decomposition of changes in life expectancy at birth by avoidable cause of death, 2000-2010; Table S9: Contribution of preventable and treatable causes to life expectancy, 2010-2020; Table S10. Contribution life expectancy at birth by avoidable cause group, 2010-2020.
Author Contributions
Conceptualization, D.O.L., S.N.L. and S.H.L.; methodology, D.O.L., and S.N.L.; software, S.N.L.; validation, D.O.L., S.N.L. and S.H.L.; formal analysis, S.N.L.; investigation, S.H.L. and D.O.L.; resources, D.O.L.; data curation, S.N.L.; writing—original draft preparation, S.H.L.; writing—review and editing, S.H.L. and D.O.L.; visualization, S.N.L. and S.H.L.; supervision, S.H.L. and D.O.L.; project administration, D.O.L.; funding acquisition, D.O.L.. All authors have read and agreed to the published version of the manuscript.
Funding
This research was funded by the research grant of Kongju National University in 2018.
Institutional Review Board Statement
Not applicable
Informed Consent Statement
Not applicable.
Conflicts of Interest
The authors declare no conflict of interest.
References
- OECD Health at a Glance 2021: Health at a Glance; OECD, 2021; p. 272;
- Laranjeira, E.; Szrek, H. Going beyond Life Expectancy in Assessments of Health Systems’ Performance: Life Expectancy Adjusted by Perceived Health Status. Int J Health Econ Manag. 2016, 16, 133–161. [Google Scholar] [CrossRef] [PubMed]
- van Raalte, A.A.; Sasson, I.; Martikainen, P. The Case for Monitoring Life-Span Inequality. Science 2018, 362, 1002–1004. [Google Scholar] [CrossRef] [PubMed]
- Mateos, J.T.; Fernández-Sáez, J.; Marcos-Marcos, J.; Álvarez-Dardet, C.; Bambra, C.; Popay, J.; Baral, K.; Musolino, C.; Baum, F. Gender Equality and the Global Gender Gap in Life Expectancy: An Exploratory Analysis of 152 Countries. Int J Health Policy Manag 2020, 11, 740–746. [Google Scholar] [CrossRef] [PubMed]
- 2020.
- Rochelle, T.L.; Yeung, D.K.Y.; Bond, M.H.; Li, L.M.W. Predictors of the Gender Gap in Life Expectancy across 54 Nations. Psychology, Health & Medicine 2015, 20, 129–138. [Google Scholar] [CrossRef]
- Sorenson, S.B. Gender Disparities in Injury Mortality: Consistent, Persistent, and Larger Than You’d Think. Am J Public Health 2011, 101, S353–S358. [Google Scholar] [CrossRef]
- Hao, L.; Xu, X.; Dupre, M.E.; Guo, A.; Zhang, X.; Qiu, L.; Zhao, Y.; Gu, D. Adequate Access to Healthcare and Added Life Expectancy among Older Adults in China. BMC Geriatr 2020, 20, 129. [Google Scholar] [CrossRef]
- Braveman, P.; Gottlieb, L. The Social Determinants of Health: It’s Time to Consider the Causes of the Causes. Public Health Rep 2014, 129, 19–31. [Google Scholar] [CrossRef]
- Glei, D.A.; Horiuchi, S. The Narrowing Sex Differential in Life Expectancy in High-Income Populations: Effects of Differences in the Age Pattern of Mortality. Population Studies 2007, 61, 141–159. [Google Scholar] [CrossRef]
- Measuring the Quality of Medical Care — A Clinical Method | NEJM Available online:. Available online: https://www.nejm.org/doi/full/10.1056/NEJM197603112941104 (accessed on 26 August 2023).
- 2021.
- Charlton, J.R.; Hartley, R.M.; Silver, R.; Holland, W.W. Geographical Variation in Mortality from Conditions Amenable to Medical Intervention in England and Wales. Lancet 1983, 1, 691–696. [Google Scholar] [CrossRef]
- Eun, S.J. Avoidable, Amenable, and Preventable Mortalities in South Korea, 2000–2017: Age-Period-Cohort Trends and Impact on Life Expectancy at Birth. Social Science & Medicine 2019, 237, 112482. [Google Scholar] [CrossRef]
- Bahk, J.; Jung-Choi, K. The Contribution of Avoidable Mortality to the Life Expectancy Gains in Korea between 1998 and 2017. Int J Environ Res Public Health 2020, 17, 6499. [Google Scholar] [CrossRef] [PubMed]
- Preston, S. Demography: Measuring and Modeling Population Processes. (No Title).
- Ilze (ESTAT), B. Avoidable Mortality: OECD/Eurostat Lists of Preventable and Treatable Causes of Death (22 Version). 2022. 20 January.
- Arriaga, E.E. Measuring and Explaining the Change in Life Expectancies. Demography 1984, 21, 83–96. [Google Scholar] [CrossRef] [PubMed]
- Yoo, Y.H.; Lee, J.H.; Park, S.-H.; Lim, D.O. The Structural Analysis of Influences of Mortality Change on the Life Expectancy at Birth in Korea: 1985~2015. Korean Public Health Research 2019, 45, 71–81. [Google Scholar]
- Klenk, J.; Rapp, K.; Büchele, G.; Keil, U.; Weiland, S.K. Increasing Life Expectancy in Germany: Quantitative Contributions from Changes in Age- and Disease-Specific Mortality. Eur J Public Health 2007, 17, 587–592. [Google Scholar] [CrossRef]
- Sundberg, L.; Agahi, N.; Fritzell, J.; Fors, S. Why Is the Gender Gap in Life Expectancy Decreasing? The Impact of Age- and Cause-Specific Mortality in Sweden 1997–2014. Int J Public Health 2018, 63, 673–681. [Google Scholar] [CrossRef]
- Yang, S.; Khang, Y.-H.; Harper, S.; Davey Smith, G.; Leon, D.A.; Lynch, J. Understanding the Rapid Increase in Life Expectancy in South Korea. Am J Public Health 2010, 100, 896–903. [Google Scholar] [CrossRef] [PubMed]
- Kiadaliri, A. Avoidable Deaths in Sweden, 1997-2018: Temporal Trend and the Contribution to the Gender Gap in Life Expectancy. BMC Public Health 2021, 21, 519. [Google Scholar] [CrossRef]
- Roush, S.W.; Murphy, T.V. ; Vaccine-Preventable Disease Table Working Group Historical Comparisons of Morbidity and Mortality for Vaccine-Preventable Diseases in the United States. JAMA 2007, 298, 2155–2163. [Google Scholar] [CrossRef]
- Loef, M.; Walach, H. The Combined Effects of Healthy Lifestyle Behaviors on All Cause Mortality: A Systematic Review and Meta-Analysis. Prev Med 2012, 55, 163–170. [Google Scholar] [CrossRef]
- van den Brandt, P.A. The Impact of a Mediterranean Diet and Healthy Lifestyle on Premature Mortality in Men and Women. Am J Clin Nutr 2011, 94, 913–920. [Google Scholar] [CrossRef]
- King, D.E.; Mainous, A.G.; Carnemolla, M.; Everett, C.J. Adherence to Healthy Lifestyle Habits in US Adults, 1988-2006. Am J Med 2009, 122, 528–534. [Google Scholar] [CrossRef] [PubMed]
- Bíró, A.; Hajdu, T.; Kertesi, G.; Prinz, D. Life Expectancy Inequalities in Hungary over 25 Years: The Role of Avoidable Deaths. Population Studies 2021, 75, 443–455. [Google Scholar] [CrossRef] [PubMed]
- Mokdad, A.H.; Marks, J.S.; Stroup, D.F.; Gerberding, J.L. Actual Causes of Death in the United States, 2000. JAMA 2004, 291, 1238–1245. [Google Scholar] [CrossRef] [PubMed]
- Gunnell, D. Time Trends and Geographic Differences in Suicide: Implications for Prevention. In Prevention and Treatment of Suicidal Behaviour:From science to practice; Hawton, K., Ed.; Oxford University Press, 2005; p. 0 ISBN 978-0-19-852976-7.
- Chang, S.-S.; Stuckler, D.; Yip, P.; Gunnell, D. Impact of 2008 Global Economic Crisis on Suicide: Time Trend Study in 54 Countries. BMJ 2013, 347, f5239. [Google Scholar] [CrossRef]
- Chang, S.-S.; Gunnell, D.; Sterne, J.A.C.; Lu, T.-H.; Cheng, A.T.A. Was the Economic Crisis 1997-1998 Responsible for Rising Suicide Rates in East/Southeast Asia? A Time-Trend Analysis for Japan, Hong Kong, South Korea, Taiwan, Singapore and Thailand. Soc Sci Med 2009, 68, 1322–1331. [Google Scholar] [CrossRef]
- Hespanhol, V.; Bárbara, C. Pneumonia Mortality, Comorbidities Matter? Pulmonology 2020, 26, 123–129. [Google Scholar] [CrossRef]
- Yamaya, M.; Yanai, M.; Ohrui, T.; Arai, H.; Sasaki, H. Interventions to Prevent Pneumonia among Older Adults. J Am Geriatr Soc 2001, 49, 85–90. [Google Scholar] [CrossRef]
- Kontis, V.; Bennett, J.E.; Mathers, C.D.; Li, G.; Foreman, K.; Ezzati, M. Future Life Expectancy in 35 Industrialised Countries: Projections with a Bayesian Model Ensemble. The Lancet 2017, 389, 1323–1335. [Google Scholar] [CrossRef]
- Ruhnke, G.W.; Coca-Perraillon, M.; Kitch, B.T.; Cutler, D.M. Marked Reduction in 30-Day Mortality among Elderly Patients with Community-Acquired Pneumonia. Am J Med 2011, 124, 171–178. [Google Scholar] [CrossRef]
- Park, S.K. Epidemiological characteristics of breast cancer in Koreans. J Korean Med Assoc 2019, 62, 424. [Google Scholar] [CrossRef]
- Baek, S.J.; Kim, H.; Lee, D.H.; Jeong, H. Regional Gaps in Health Status Estimated by Amenable Mortality Rate in Korea. Health Policy and Mangemnet 2021, 31, 100–113. [Google Scholar]
Figure 1.
Trends of life expectancy at birth by gender in Korea, 1970-2020.
Figure 2.
Age-specific contributions to life expectancy at birth in Korea, 2000-2020. (a) Males; (b) Females.
Figure 2.
Age-specific contributions to life expectancy at birth in Korea, 2000-2020. (a) Males; (b) Females.
Figure 3.
Gender gap in life expectancy at birth in Korea.
Figure 4.
Contribution of preventable and treatable causes to life expectancy, 2000-2010. (a) Males; (b) Females.
Figure 4.
Contribution of preventable and treatable causes to life expectancy, 2000-2010. (a) Males; (b) Females.
Figure 5.
Contribution of life expectancy by avoidable cause group, 2000-2010. IFD : Infectious disease, CA : Cancer, EMD : Endocrine and metabolic disease. DNS : Disease of nervous system, DCS : Disease of circulatory system. DRS : Disease of respiratory system, DDS : Disease of digestive system. DGU : Disease of genitourinary system,. PPN : Pregnancy, childbirth and perinatal period. CM : Congenital malformation, INJ : Injuries.
Figure 6.
Contribution of preventable and treatable causes to life expectancy, 2010-2020. (a) Males; (b) Females.
Figure 6.
Contribution of preventable and treatable causes to life expectancy, 2010-2020. (a) Males; (b) Females.
Figure 7.
Contribution of life expectancy by avoidable cause group, 2010-2020. IFD : Infectious disease, CA : Cancer, EMD : Endocrine and metabolic disease. DNS : Disease of nervous system, DCS : Disease of circulatory system. DRS : Disease of respiratory system, DDS : Disease of digestive system. DGU : Disease of genitourinary system, PPN : Pregnancy, childbirth and perinatal period. CM : Congenital malformation, INJ : Injuries.
Disclaimer/Publisher’s Note: The statements, opinions and data contained in all publications are solely those of the individual author(s) and contributor(s) and not of MDPI and/or the editor(s). MDPI and/or the editor(s) disclaim responsibility for any injury to people or property resulting from any ideas, methods, instructions or products referred to in the content. |
© 2023 by the authors. Licensee MDPI, Basel, Switzerland. This article is an open access article distributed under the terms and conditions of the Creative Commons Attribution (CC BY) license (http://creativecommons.org/licenses/by/4.0/).
Copyright: This open access article is published under a Creative Commons CC BY 4.0 license, which permit the free download, distribution, and reuse, provided that the author and preprint are cited in any reuse.
The Contribution of Avoidable Mortality to the Life Expectancy Gains in Korea between 1998 and 2017
Jinwook Bahk
et al.
IJERPH,
2020
Avoidable Mortality between Metropolitan and Non-Metropolitan Areas in Korea from 1995 to 2019: A Descriptive Study of Implications for the National Healthcare Policy
Min-Hyeok Choi
et al.
IJERPH,
2022
Trends of HIV Mortality between 2001 and 2018: An Observational Analysis
Chinmay Jani
et al.
TropicalMed,
2021


MDPI Initiatives
Important Links
© 2024 MDPI (Basel, Switzerland) unless otherwise stated