1. Introduction
Alternative splicing (AS) is a way for eukaryotes to produce multiple transcripts from a single gene by changing the composition of exons during RNA processing[
1]. Intron retention (IR) is a type of AS and affects about 80% of human genes[
2]. IR transcripts tend to be degraded by nonsense-mediated decay (NMD) or exosome pathway. Therefore, IR coupled with RNA surveillance can regulate gene expression and affect various biological processes [
3,
4]. IR transcripts can be detained in the nucleus and wait for splicing signals, such as in the T cell activation process responding to external stimulus[
5]. IR can also produce novel proteins with different functions[
6,
7,
8] or subcellular locations[
9], and play essential roles in many key biological conditions[
3,
10,
11]. IR is under sophisticated regulation that can be affected by sequence variations, splicing factors, epigenetic and transcriptional regulatory mechanisms,
etc[
12].
Tumors generally have 30% more aberrant alternative splicing events than normal tissues [
13] and can give rise to many tumor-specific transcripts associated with oncogenic functions and drug resistance[
14,
15,
16,
17]. There are numerous relevant studies on exon skipping in cancer, while only a handful of them have identified features and functions of IR. Dvinge and Bradley reported that compared to adjacent normal tissues, more introns were retained in tumor tissues for 15 cancer types, and many of them could be detected in the cytoplasm [
18]. Evidence showed that IR can promote cancer development. Somatic mutations in tumors can trigger IR and these mutations are enriched in tumor suppressor genes (TSGs)[
19]. Inactivation of histone H3K36 methyltransferase
SETD2 reduced
DVL2 IR, and as a result activated Wnt signaling to promote colon cancer predisposition[
20]. Similarly,
ZRSR2 loss increased retention of a minor intron of
LZTR1 and resulted in enhanced RAS signaling, potentially driving leukemia[
21]. IR produces epitopes presented on MHC I, making it a potential source of tumor-specific antigens (neoantigens)[
22]. However, these researches have mainly focused on individual or patient-specific IR events, a systematic survey of recurrent IR alterations at a pan-cancer level, especially from the prognostic perspective, is still lacking.
In the present study, we profiled the IR landscape of 33 cancer types in the Cancer Genome Atlas (TCGA), identified IR events that were differentially regulated between normal and tumor samples, and discovered IR events associated with survival. Some informative introns not only show potential in accurate diagnosis and prognosis with machine learning methods but also are involved in cancer pathology validated in our experiments (
Figure 1). Many of these introns were recurrently retained in multiple patients across cancers, serving as a resource of potential diagnostic and prognostic biomarkers, even as promising targets for new therapy.
2. Materials and methods
2.1. RNA-seq bam download and IR quantification
We downloaded RNA-seq bam files using the GDC data transfer tool, including 33 cancer types and over 10,000 tumor and adjacent normal samples in the TCGA project.
Stringtie (version 2.1.3)[
23] was used to quantify gene expression. IRFinder (version 1.3.1)[
2] was used to identify and quantify IR. And before applying IRFinder, samtools (version 1.9) was used to sort bam files by read pairs. The genome version was hg38 and the gene annotation version was gencode v35.
We performed quality control on both intron and sample levels. Filtering out introns that overlap with known exons (flagged by IRFinder as “known-exon”) resulted in 243,151 introns covering 21,520 genes genome-wide. Before quantifying IR, at least 4 junction reads (split reads) spanning flanking exons were required to make sure that the isoform was expressed. IRratio was used to measure the IR level, and it was calculated by dividing the median read depth of an intron by itself plus the number of reads spanning flanking exons. If the coverage of an intron was less than 20%, it was likely to be completely spliced and its IRratio was assigned to 0. If the coverage of an intron was above 70% and the median read depth was above 3, the intron was likely to be retained and its IRratio was kept, which must exceed 0. Otherwise, the retention state could not be accurately decided for an intron and its IRratio was set as missing. IRFinder automatically decided if an RNA-seq sample was suitable for IR detection based on the ratio of the number of reads that map to intergenic regions to the number of reads that map to coding regions. When the ratio exceeded 10%, it gave a warning message, and such samples were not used for further analysis. Over 90% of TCGA RNA-seq samples passed this QC.
The majority of TCGA RNA-seq was unstranded, so the read orientation could not be determined, which may lead to false positive IR detection[
2,
24]. Nevertheless, we made use of a small number of strand-specific RNA-seq samples in TCGA which passed sample quality control (n = 34) to generate a “whitelist” of retained introns, meaning they were more likely to be genuine and reliable. Specifically, we obtained a maximum IRratio of each intron in these samples, and introns with a maximum IRratio above 0.08 comprised the “whitelist” (n = 47,026). That is, these introns were retained in at least one stranded RNA-seq sample, which made them more reliable. Thus, differentially retained introns and survival-associated introns were restricted to only “whitelist” introns for higher confidence.
2.2. Differential IR and differential gene expression
Because IR levels did not follow a normal distribution across individuals, we used paired Wilcoxon rank-sum test to detect differential IR events (DIRs) in paired tumor and normal samples (n > 15) for 14 cancer types. A differentially retained intron should have a P value less than 0.05 and the difference of median IRratios between tumor and normal samples should be larger than 0.1.
In terms of differentially expressed genes (DEG) detection, DESeq2[
25] was used, and we selected DEGs with Padjusted < 0.05 and |log2FC| > 1.
2.3. Dimensionality reduction and visualization
If the quality control mentioned above was not passed, the IRratio was set to a missing value. We generated IRratio matrices, kept IR events with missing rates less than 30%, and imputed missing values with a mean value from the remaining samples. Principle component analysis was then performed. We extracted the first 100 principal components and further analyzed them with package
Rtsne[
26] to draw tSNE plots, with perplexity set to 30.
2.4. Functional enrichment
We used the package clusterprofiler[
27] to enrich gene ontology (GO) biological process terms and KEGG pathways for target gene sets. GO terms related to cancer hallmarks were retrieved from two previous studies[
28,
29].
2.5. Sequence features analysis
We classified introns into four types to compare their sequence features. Constitutive introns (n = 48,344) were introns with median IRratio of 0 in tumor and normal samples across all cancers; not regulated IR were introns retained in tumor or normal samples in any cancer but showed no significant difference between tumor and normal samples (n = 10,887); down DIRs were introns with reduced retention level in tumor samples in any cancer (n = 401); up DIRs were introns with increased retention level in tumor samples in any cancer (n = 669).
Conservation analysis: hg38 version of phastCons30way.bw was downloaded from UCSC, and
bwtool[
30] was used to calculate a mean phastCons[
31] score around boundaries of the above 4 types of introns separately.
Splice score of 5′ and 3′ sites were calculated using the maximum entropy modeling method[
32].
Intron GC content, length and relative gene position were all analyzed based on hg38 and gencode v35. To analyze the distribution of introns in genes, the relative gene position of an intron was calculated by dividing the rank of the intron (5′ to 3′ orientation) by the total intron count of this transcript.
We adjusted a nonsense-mediated decay (NMD) prediction rule from a previous study[
33]. Specifically, when an intron was retained in a protein coding gene, it was very possible to introduce a premature stop codon (PTC) and elicits NMD unless under following conditions. If the intron resides in a 5′ or 3′ untranslated region (UTR), or the intron was close to start codon (< 200 nt), or it was the last intron, NMD would not be elicited. If no PTC was produced, or the PTC was located within 55 nt upstream of the last exon-exon junction, NMD would not be elicited either. Otherwise, the IR transcript was prone to be targeted by NMD.
2.6. Random Forests model
We merged DIRs from different cancer types, and filtered out the ones with pan-cancer missing rates over 30% and the ones that were inconsistently up or down-regulated in different cancers. This resulted in 273 DIRs to be used in Random Forests models for pan-cancer modeling. R package
randomForest[
34] was applied to the train model, with mtree = 500, mtry = 3 and proximity = TRUE. A hundred times four-fold cross validation was used to calculate a pooled area under the curve (AUC) for the training set (paired tumor and normal samples from 14 cancers), and the receiver operating curve (ROC) in randomly selected one run was drawn using a R package
pROC[
35]. We used the Rfcv function to predict model performances with a sequentially reduced number of DIRs (ranked by importance), with cv.fold = 5 and step = 0.9.
2.7. Survival analysis
For introns that had valid IRratios in at least 50% of patients and at least 5% of valid IRratios were above 0.1, we restricted our analysis to patients with IRratios over 0 and classified them into IR-high or low groups based on median IRratio. Then we performed Univariate Cox regression and selected intron related to overall survival (OS) or disease-free survival (DFS), and an unadjusted p value less than 0.05 was considered significant. Similarly, gene expression associated with survival was identified by selecting genes with a median expression level over 1 TPM, dividing patients into high and low expression groups based on the median cutoff, and performing univariate Cox regression.
2.8. LASSO regression to build a prognostic model
To build an IR-based prognostic model for each cancer type, we selected introns with missing rates less than 20% (missing values were later filled with mean) and perform LASSO regression with R package
glmnet[
36,
37]. Candidate introns and corresponding coefficients were derived with the λ parameter associated with the minimum mean error or with one standard error. Intron retention risk (IRR) score was calculated as the sum of IRratios multiplied by corresponding coefficients of candidate introns. And then patients were divided into IRR-low and high groups based on median value.
2.9. Cell culture and lentiviral transfection
HEK293 (human embryonic kidney 293 cells), H1299 cells, A549 cells were purchased from National Collection of Authenticated Cell Cultures and cultured in Dulbecco’s Modified Eagle’s Medium (DMEM) (Invitrogen, 11960044) supplemented with 10% FBS (Gibco), streptomycin (100 μg/ml), and penicillin (100 U/ml) at 37℃/5% CO2.
We applied lentivirus transfection-mediated gene-silencing strategy to stably knockdown target gene STN1. HEK293T cells were transfected as described[
38]. Specifically, shRNAs (shRNA sequences were listed in
Supplementary Table S7) were obtained from Sigma-Aldrich, then annealed and cloned into pLKO.1 vector. HEK293 cells grown in 6-well plates were transfected with 1 μg constructed vectors or empty control vectors pLKO.1 with VSVG and gag/pol encoding plasmids by using Lipofectamine 2000 (Invitrogen). Then, the virus supernatant was harvested in 24 hours to infect A549 cells in six-well plates seeded one day ahead. After incubation for one more day, A549 cells were screened by 2.5 μg/ml puromycin for 24 hours. The surviving cells were cultured for two more days and then harvested for following RNA extraction and cell proliferation assays.
2.10. RNA preparation, RT-PCR and qRT-PCR
Total RNA was extracted from cells with TRIzol (Invitrogen) according to the manufacturer’s instructions (Invitrogen) and reversely transcribed into cDNA with oligo-(dT) primer (
Supplementary Table S7) using FastQuant RT Kit (Tiangen).
For RT-PCR, 100 ng cDNA was used for each PCR reaction, and PCR products were detected by agarose gel electrophoresis. Gene expression at the RNA level was quantified by qRT-PCR using a 2× SYBR mix (Vazyme). GAPDH served as an internal control. Then, the reaction was run on the Bio-Rad CFX manager machine. The IR and spliced transcripts of STN1 were quantified by qRT-PCR using primers specifically targeting the retained intron and exon junction, respectively. All primer sequences were listed in
Supplementary Table S7.
2.11. RNA stability assay, and isolation of nuclear and cytoplasmic fractions
A549s cells were treated with 10µg/ml actinomycin-D (Act D; Sigma-Aldrich, Inc., St. Louis, MO, USA, A4262) for 0, 2, 4, and 6 hours, respectively. The total RNAs were extracted, and RNA levels were quantified by qRT-PCR as described above.
For nuclear and cytoplasmic fractionation, A549 cells were cultured in a T25 flask until 90% confluence. Then, cells were trypsinized, washed twice with cold PBS, and then cells were fractioned by Nuclear/Cytosol Fractionation Kit (Phygene, PH1466). Following RNA extraction and qRT-PCR were carried out as described above.
2.12. Psi-CHECK2 constructs and dual luciferase assay
Luciferase reporter gene expression vectors were bought from Promega and were prepared according to the manufacturer’s protocol. Briefly, the 590bp intron retained 5′ UTR and 146 spliced 5′ UTR was PCR amplified using STN1_5′ UTR_Forward (Nhe I) 5’-TACGACTCACTATAGgctagcggggtcgtcgccgccag -3’ and STN1_5′ UTR_Reverse (Nhe I) 5’-TTGGAAGCCATGGTGgctagccaggctgcatcaagaggca-3’. PCR fragments were cloned into the NheI-restricted site of the psi-CHECK2 vector. The STN1 5′ UTR was inserted directly upstream of the Renilla gene. The psi-CHECK2 construct containing the mutated 5′ UTR IR fragment was synthesized by Tsingke company, where the three start codons within the intron (181ATG, 283ATG, and 392ATG) were all mutated to AGC. DH5α cells were transformed with the three distinct constructs and cultured on ampicillin-containing media.
One day before transfection, 1 × 10⁵ HEK293T cells were seeded into each well of a 24-well culture plate in 500μl DMEM supplemented with 10% FBS. Cells at 70% confluency were transfected with three psi-CHECK2 constructs with Lipofectamine 2000 reagent. 24 hours after transfection, growth media were removed and cells were washed gently with PBS. Passive lysis buffer (Promega) (100ul/well) was added and gently shaken for 15 min at room temperature, then cell lysates were harvested for dual luciferase assay. The activities of firefly and Renilla luciferase were measured using the Dual-Luciferase® Reporter 1000 Assay System (Promega) according to the manufacturer’s instructions. A total of 25μl cell lysate was transferred into a white opaque 96-well plate. The luminescence obtained for the mutated and wild-type constructs was normalized with the internal control firefly luciferase signal. Each experiment was performed in triplicate, and three independent experiments were performed. Quantitation of the reporter gene assay was calculated as mean ± SEM. Student’s t test was used to determine significant differences between each mutated construct compared with the wild-type construct.
2.13. Colony formation assay, transwell migration assay and cell proliferation assay
For the colony formation assay, cells were cultured in the six-well plate at a density of 800 cells per well. Cells were cultured under normal culture conditions for 15 days. For fixation of the cell, after the medium supernatant was removed, the cells were treated with 4% paraformaldehyde and were stained with 1% crystal violet (SigmaAldrich) for 15 min. Then, the plates were washed with phosphate-buffered saline (PBS) and photographed.
For the transwell migration assay, we used a 24-well transwell chamber (Corning). Cells were suspended in non-serum DMEM and then seeded in the top chamber of the transwell with a density of 1 × 10⁴ per chamber, and 300 μl fresh complete DMEM (10% FBS) was added to the bottom chamber. After incubating for 48 hours, use PBS to wash the cells in the top chamber twice, and then fix the cells with 4% paraformaldehyde for 15 min, followed by staining with 1% crystal violet (Sigma-Aldrich) for 30 min. After washing and wiping off the cells in the inner side of the top chamber, the migratory cells adhering to the bottom surface of the membrane were observed, photographed and then counted by ImageJ software.
Cell proliferation assay was performed on cultured cells at four time points (24, 48, 72, and 96 h, respectively). A total of 100 μL cells were seeded in a 96-well plate with at least 1000 cells per well and four replicates for each time point. Cell Counting Kit-8 (CCK-8) reagent (Dojindo) was added according to the manufacturer’s protocol. Then, cells were incubated at 37°C for 2 hours and the absorbance at 450 nm was measured with a microplate reader (TECAN).
4. Discussion
Aberrant AS is one of the hallmarks of cancer, and tumor tissues commonly have about 30% more AS events than normal tissues[
13]. By producing tumor-specific proteins or by altering the production of normal proteins, aberrant AS can lead to the activation of proto-oncogenes or inactivation of TSGs, ultimately affecting cell growth and differentiation, angiogenesis, tissue invasion, and metastasis[
56]. Therefore, the study of aberrant splicing not only helps to understand the mechanisms of cancer initiation and development but also has potential clinical implications[
57]. There is an intriguing imbalanced IR pattern in multiple cancers where tumors exhibit a significant increase in IR compared to normal samples, which is not observed in other AS types[
18]. IR may contribute to cancer development by inactivating TSGs in cancer patients[
19]. Moreover, IR can encode novel proteins and may be an important source of tumor-specific antigens[
22]. In this study, w
e systematically quantified and profiled IRs in 33 cancers from TCGA and tentatively explored their clinical relevance. So far as we know, this is a comprehensive analysis of IR regarding the largest number of cancer types.
We identified differential intron retention events (DIRs) by comparing paired tumor and normal tissues in multiple cancer types. We found that the splicing signals of differentially retained introns were almost as strong as constitutive introns, which was consistent with Zhang
et al.’s finding[
51]. One possible explanation is that DIRs were recurrent in tumor and/or normal samples, and they may have similar biological importance as constitutive introns. Interestingly, DIRs were shorter than both constitutive introns and unregulated retained introns. Zhang
et al. have reported that shorter exons are more likely to be excluded in cancers, and are possibly regulated by elevated transcription and dysregulation of some RBPs in cancer cells[
58]. In addition, most genes are spliced co-transcriptionally[
59], and increased RNA Pol II accumulation in retained introns has also been reported[
3,
60]. Whether shorter introns are more sensitive to transcription and other splicing alterations in cancer deserves further study.
Compared with adjacent normal tissues, dozens to hundreds of introns per cancer showed up or down-regulation in tumor tissues, resulting in a total of 988 DIRs across 14 cancer types. Some of them were cancer-type specific (such as
CSF3R), while some others (such as
LZTR1 and
ERCC4) showed consistent alterations across multiple cancers. We further identified 30 DIRs that stratified tumor samples and normal samples, demonstrating their diagnostic potential. A recent study exerted intron splicing events generated by
SF3B1 mutations that are specific to tumor patients, to design synthetic introns and achieve targeted clearance of tumor cells [
61]. Similarly, DIRs in our study may also serve as promising candidates for therapeutic synthetic introns, since they were widespread in multiple patients and even in multiple cancers (e.g., IR of
ZDHHC8 in
Figure 4G). On the other hand, because retained introns can also encode peptides located on cancer cell surfaces[
22], commonly retained introns may be potential targets for “off-the-shelf” immunotherapy.
We discovered several introns with the potential to be survival indicators. For example, we experimentally validated a functional prognostic intron in LUAD. Specifically, the 5′ UTR intron regulates the translation efficiency of
STN1, which is essential for cancer cell proliferation through maintaining telomere replication and genome stability (
Supplementary Figure S17). These insightful results also indicate potential novel therapeutic strategies to combat LUAD.
There have been ongoing efforts in exploring new biomarkers for risk stratification in cancers, such as gene expression[
55,
62,
63,
64,
65]. However, splicing has been reported to outperform gene expression analysis in predicting survival in multiple tumor types[
66,
67]. The potential of alternative splicing (AS) in prognosis has also been demonstrated in various cancers, including ovarian cancer[
68], colorectal cancer[
69], lung cancer[
70], esophageal cancer[
71], liver cancer[
72] and adrenocortical carcinoma[
73]. We explored the prognostic power of IR in 33 cancer types, and most of the cancers (n=32) can be stratified with less than 30 introns. The performance of the IR-based prognostic model in TCGA LAML cohorts outperformed clinical and other molecular predictors. IR has been reported to indicate prostate cancer aggressiveness[
51] and pancreatic cancer clinical outcomes[
66,
74]. Our results further suggest that IR can serve as an accurate and powerful biomarker in multiple cancers. Moreover, IR (including other AS types) is usually quantified in a relative rather than an absolute method, which may be less influenced by different processing procedures.
DIRs and prognostic IR events were two types of informative IR characterized in this study. Differentially retained introns across many cancer types were heterogenous and influenced genes of various functional categories. Prognostic introns affected genes involved in cancer-related pathways, including DNA damage and cell cycle regulation, angiogenesis, cancer cell invasion and metastasis. In DLBC, KIRP and LAML, prognostic IR genes were significantly enriched for COSMIC cancer genes. IR has been recognized as a widespread mechanism of TSG inactivation[
19], and we found that IR may also regulate the activity of oncogenes, such as
MYC (
Supplementary Figure S13). Of note, one of the limitations of our study is that we still lack experimental assessments of the IR functions, since IR transcripts have diverse fates[
12]. The second limitation is that only a few patients in TCGA dataset have matched normal tissues. More normal samples as background or negative controls will add to finding more informative IR events in future analysis.
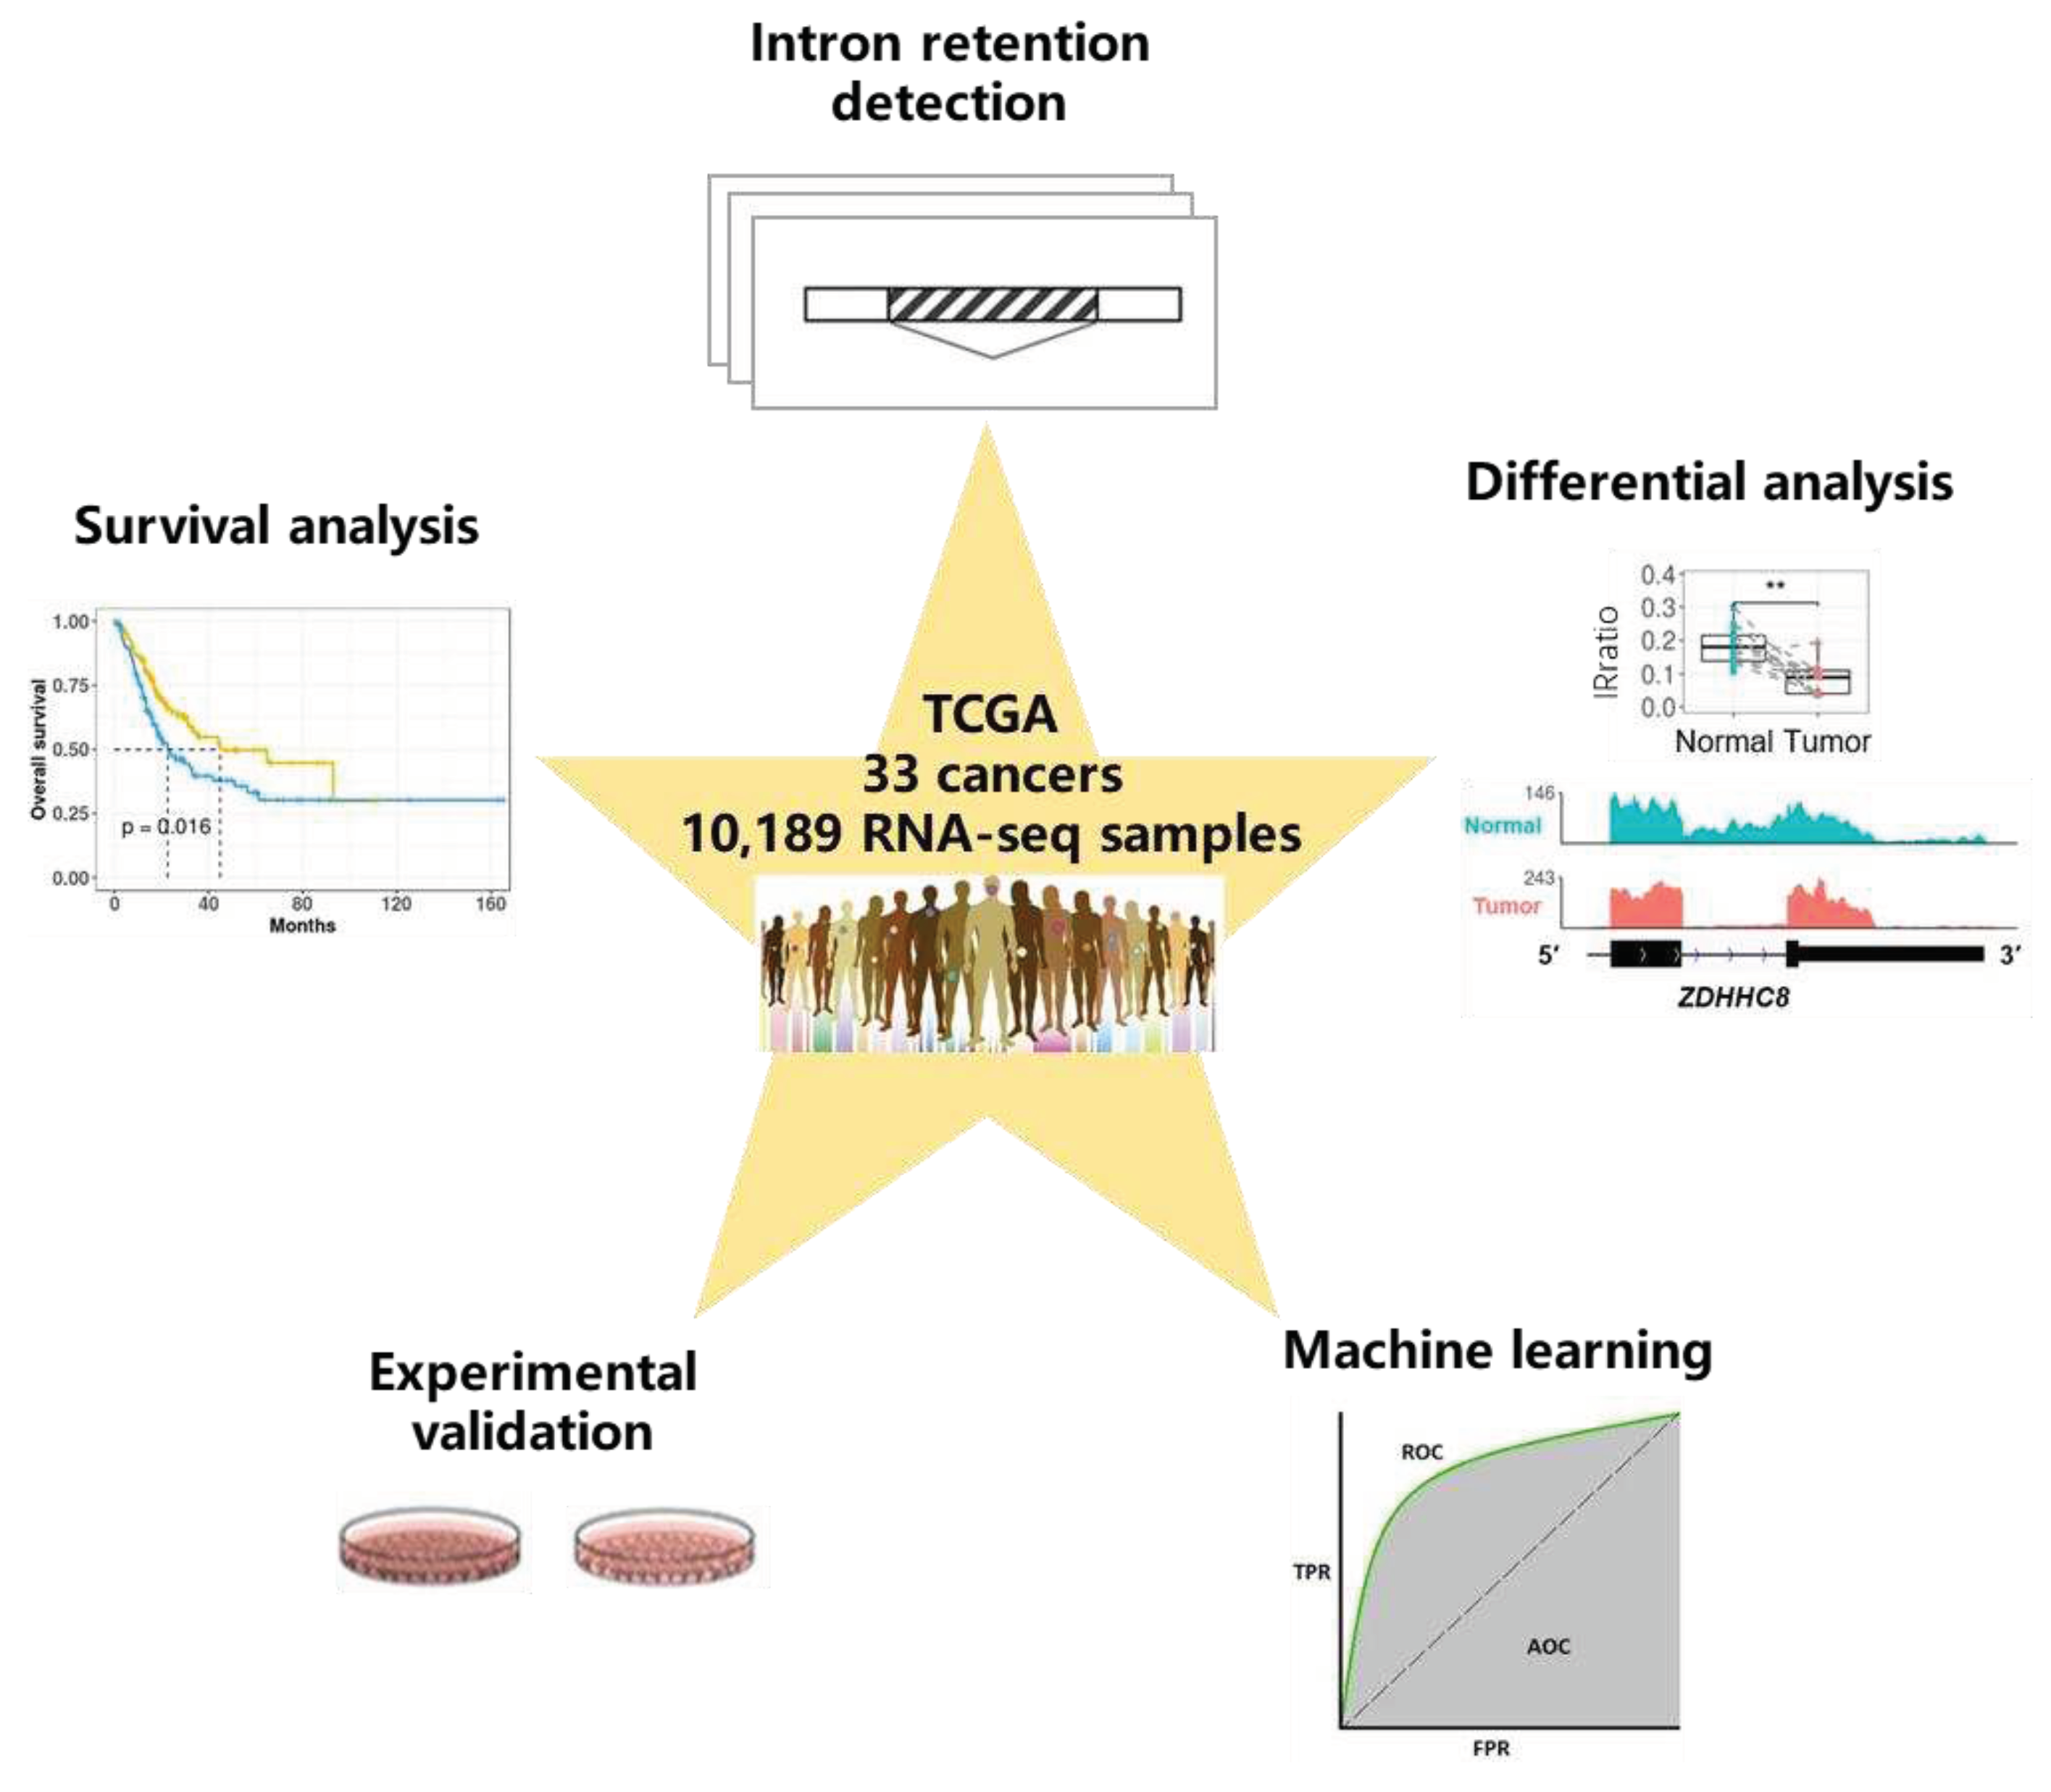
Figure 1.
Schematic overview of data set and analysis. We downloaded over 10,000 RNA-seq samples originating from 33 cancer types from the TCGA data portal and detected genome-wide intron retention events for each sample. Differential analysis between adjacent normal tissues and cancerous tissues was conducted to find differential IR events, and survival analysis was conducted to find prognostic IR events. We demonstrated that some informative introns were potential diagnostic or prognostic biomarkers with machine learning methods. Importantly, our molecular and functional experiments validated that IR plays a role in cancer pathology.
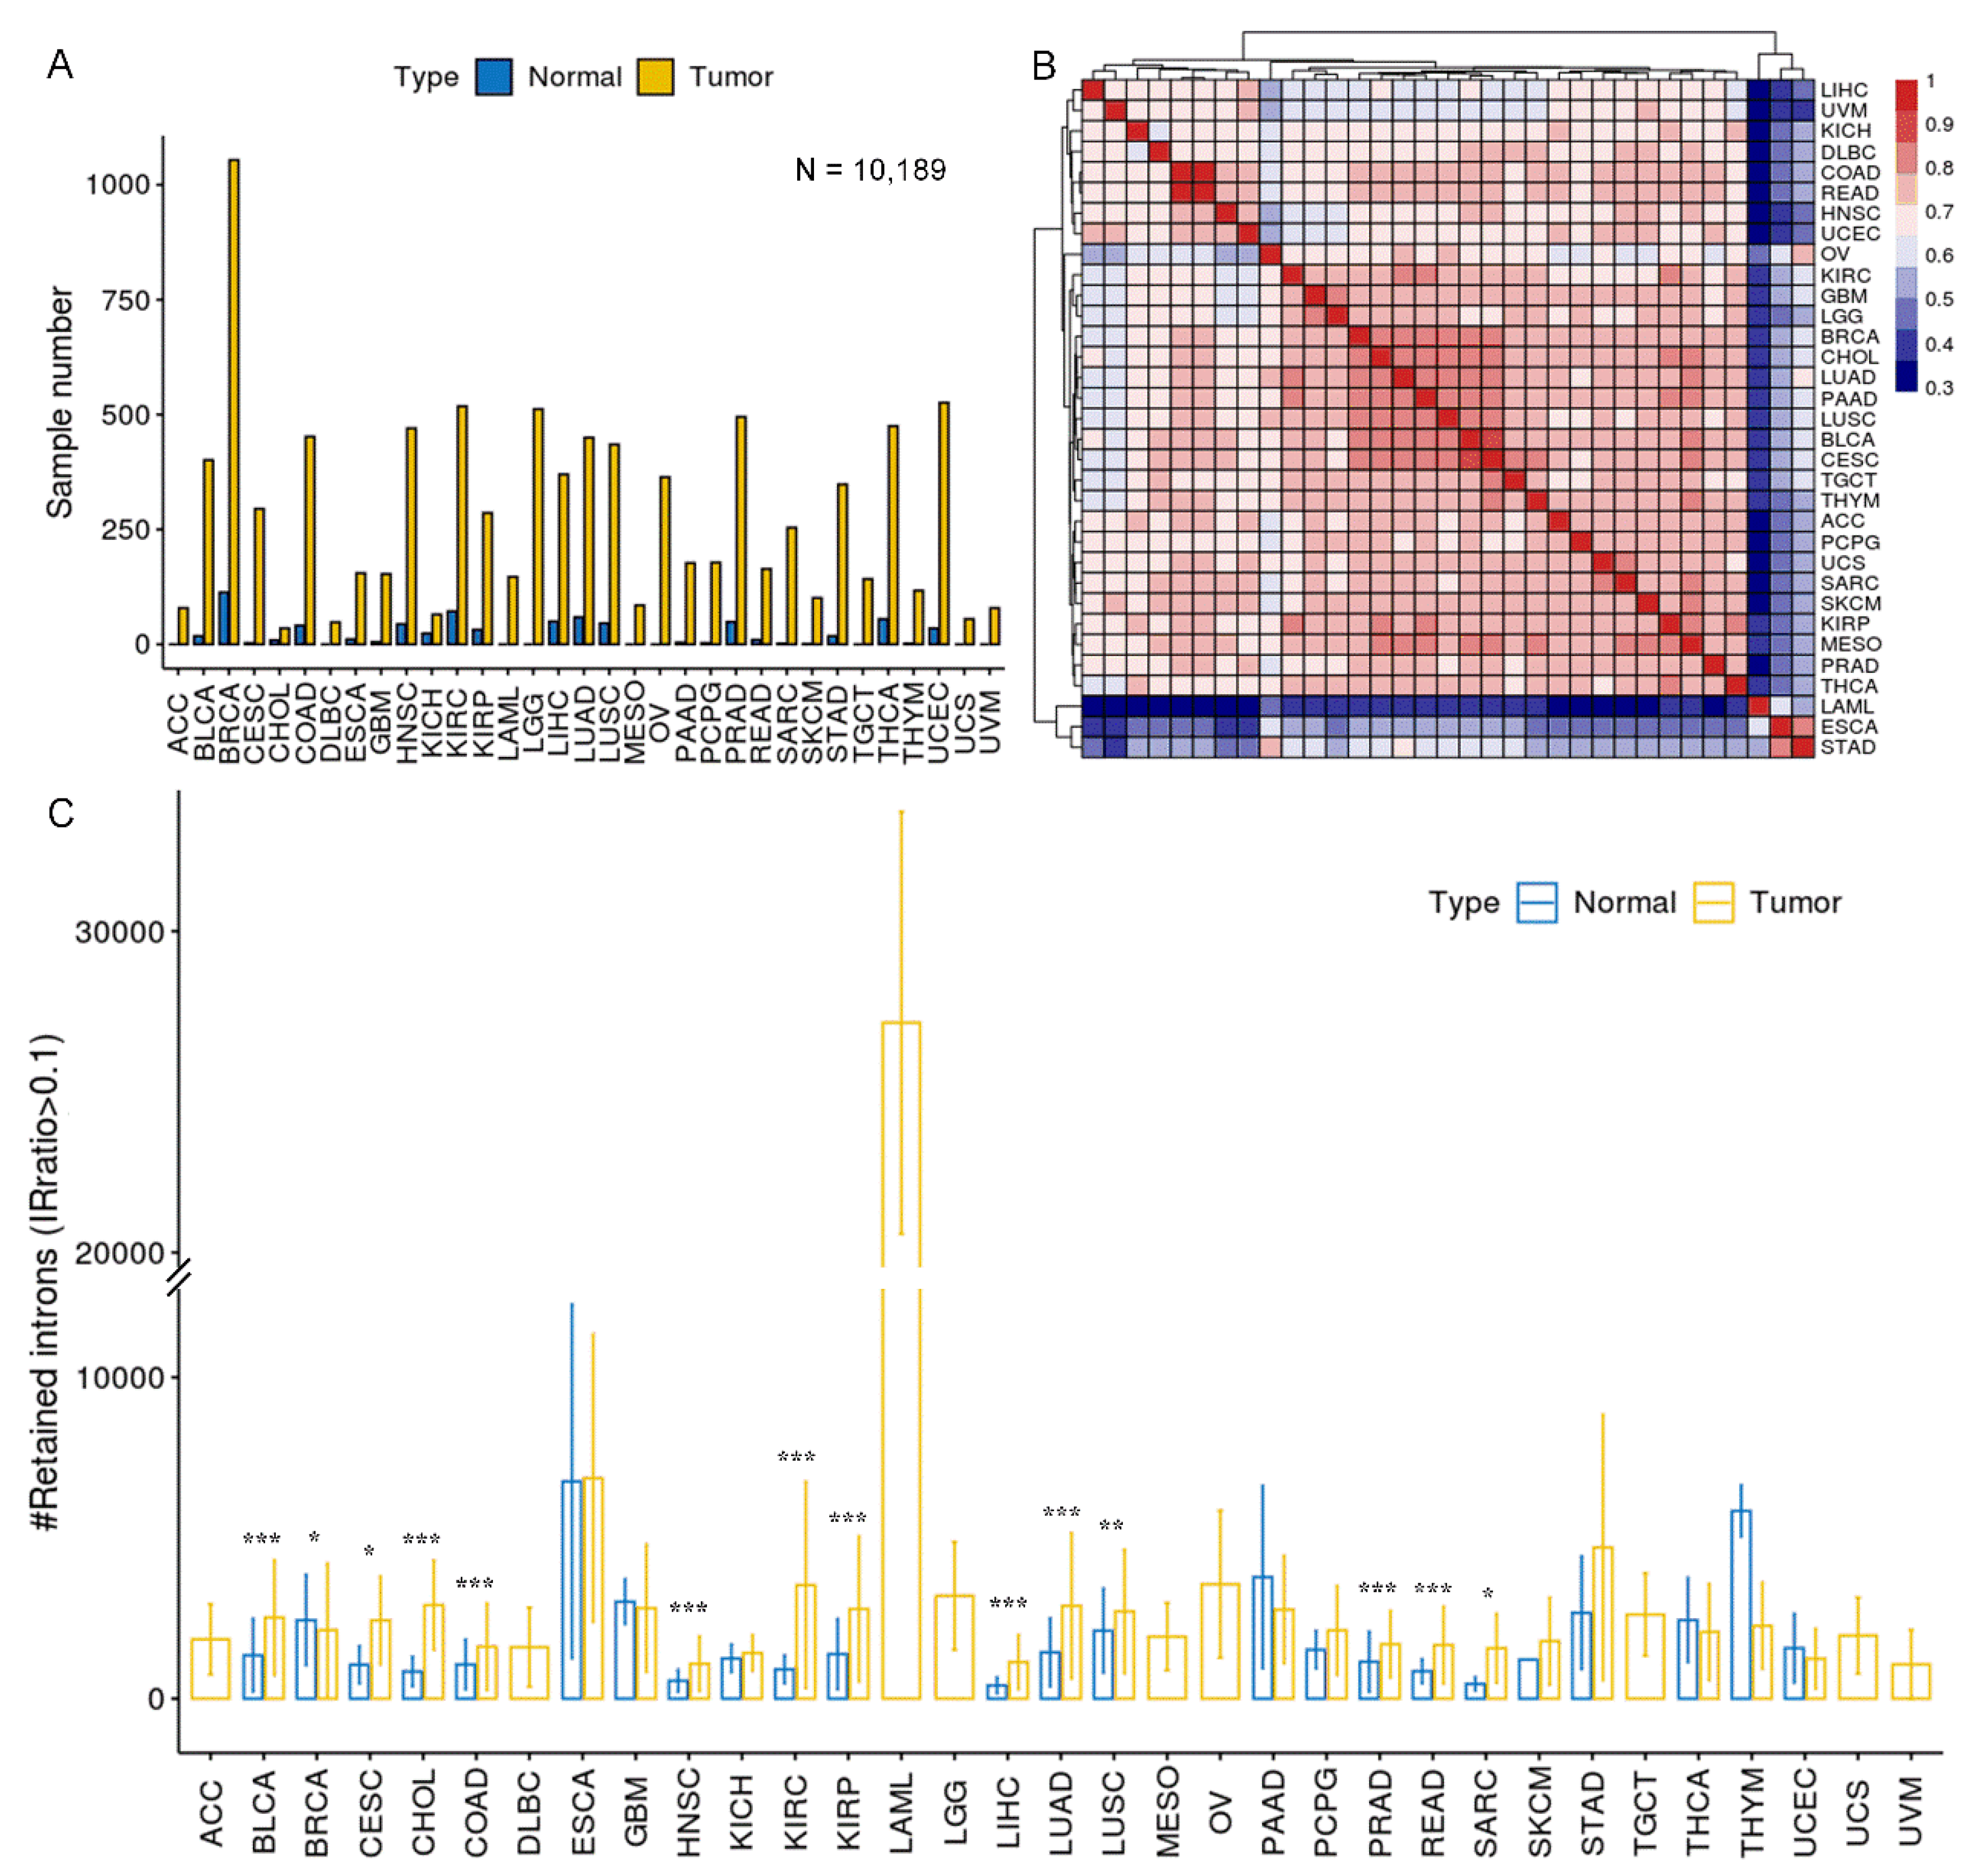
Figure 2.
Overview of intron retention across 33 cancer types. (A) Sample statistics for a total of 10,189 samples from 33 cancer types. Only samples that passed IRFinder QC were analyzed. (B) Hierarchical clustering of median IRratio across cancer types based on pair-wise Spearman correlation. (C) The average number of retained introns (IRratio > 0.1) in tumor and normal samples for each cancer type. Some cancers lack normal samples, and as a result, only tumor samples were shown. Error bars indicate standard deviation. *, P < 0.05; **, P < 0.01; ***, P < 0.001; two-tailed student’s t test.
Figure 3.
Differential IR events between tumor and adjacent normal samples.(A) Statistics of up and down-regulated differential IR events (DIRs) in 14 cancer types. Cancer associated IR referred to introns that tend to be spliced in normal samples (median IRratio = 0) and retained in tumor samples (median IRratio > 0.1). The opposite standed for normal associated IR. (B) The relationship between DIRs and gene expression changes. The left panel showed a comparison of median IRratio change and corresponding mRNA fold change between tumor and normal samples. Grey area masked genes whose expression fold change were between 1/2 and 2. The right panel shows the proportion of differentially expressed genes that were anti-concordant with IR change (i.e. expression increases and IR decreases, and vice versa). (C) Length distribution of four types of introns. ***, P < 0.001, two-tailed Mann–Whitney U test. (D) Comparison of GC content, relative position in genes (intron number divided by the total number of introns) and splice signals across four types of introns. (E, F) tSNE plot of genome-wide introns (n = 37,845 after missing rate filter) colored by cancer types (E) or by tumor or normal sample (F). (G, H) tSNE plot of DIRs (n = 375 after missing rate filter) colored by cancer types (G) or by tumor or normal sample (H).
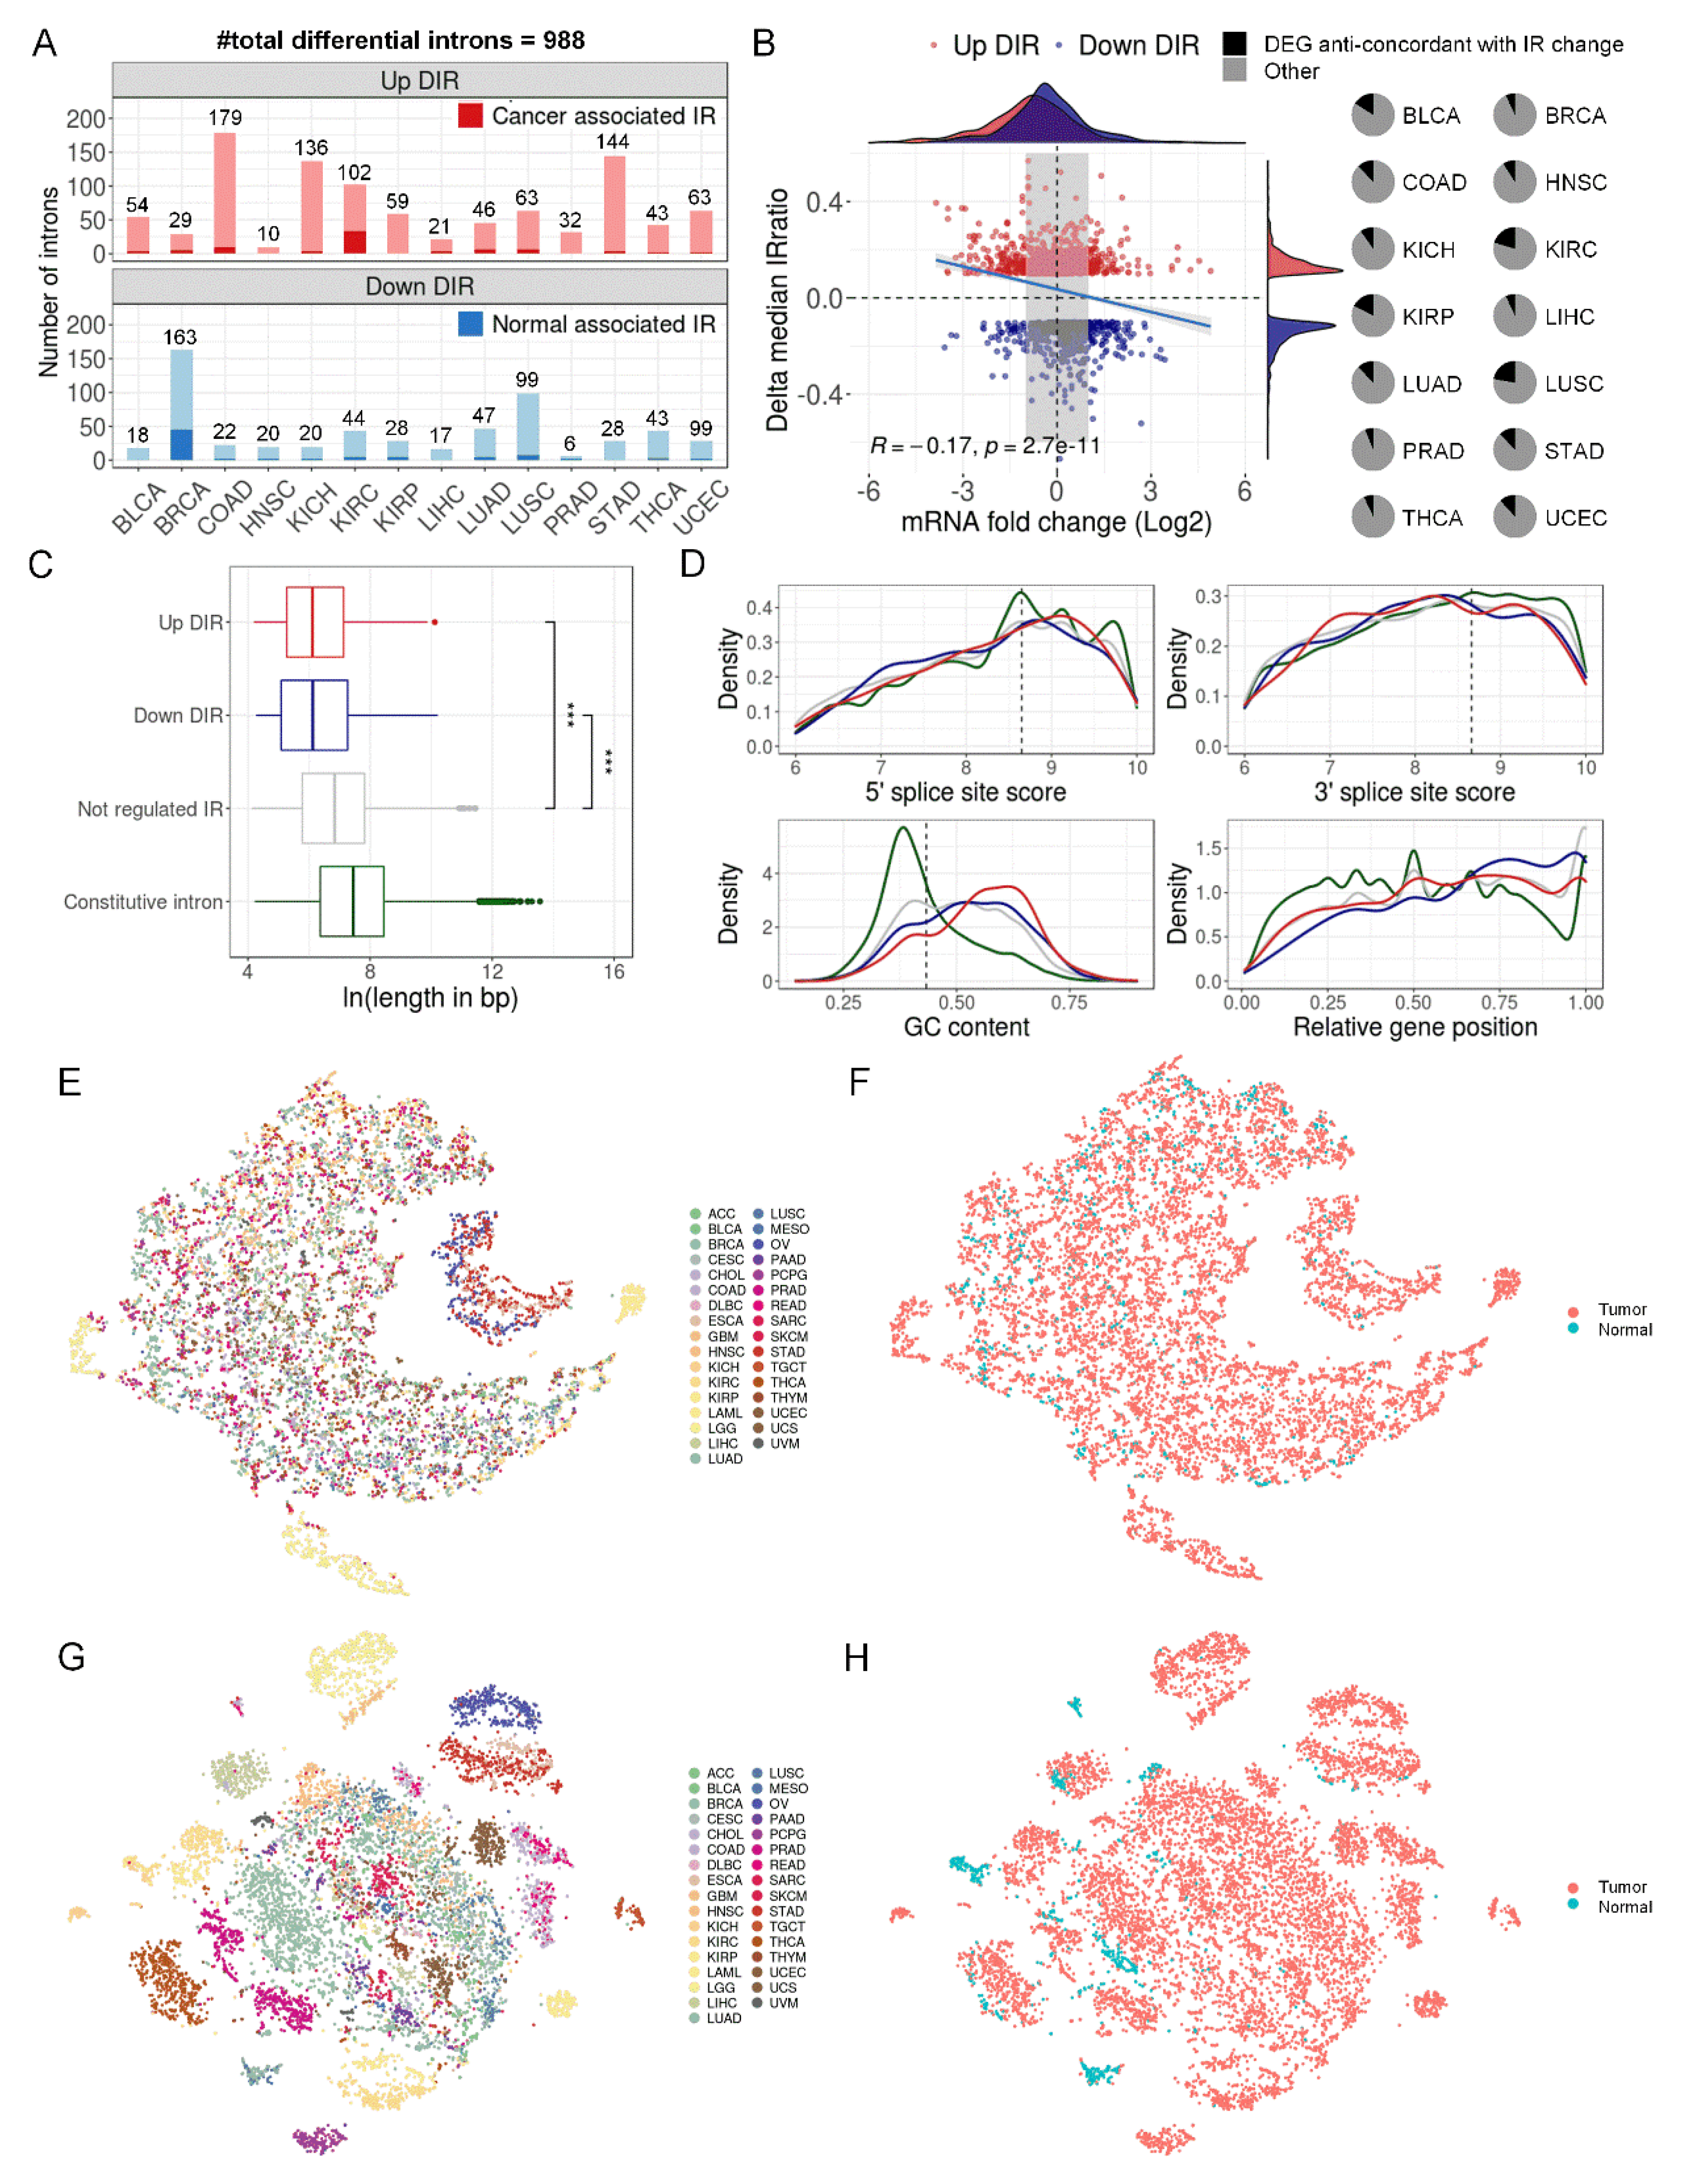
Figure 4.
Differential introns can distinguish tumors from normal samples. (A) TCGA samples were divided into three groups: paired tumor and normal samples in 14 cancer types that were previously used to detect DIRs (training set for Random Forests model, n = 1,210), unpaired samples in the same 14 cancer types (validation set 1, n = 5,789), and all samples from 19 other cancer types (validation set 2, n = 3,190). (B) Random Forests model performance in training set in a 4-fold cross validation run. The upper right panel showed the sample distribution. The left panel showed the ROC of the model and the bottom right panel shows the confusion matrix. (C, D) Random Forests model performance in validation set 1 (C) and set 2 (D) when 1,210 paired samples in 14 cancers were all used to train the model. (E) Five-fold cross-validated prediction performance of models in training set with a sequentially reduced number of DIR (ranked by importance). (F) Top 30 DIRs that contributed most to model accuracy and their alteration in 14 cancer types. Blue and red standed for down and up-regulated introns, respectively. (G, H) ZDHHC8 (G) and ZNF800 (H) last introns were differentially retained in paired tumor (red) and normal (blue) samples in 5 cancer types. The left panels were IRratio boxplots and the right panels were RNA-seq read coverage from example patients. *, P < 0.05; ***, P < 0.001; paired Wilcoxon rank-sum test.
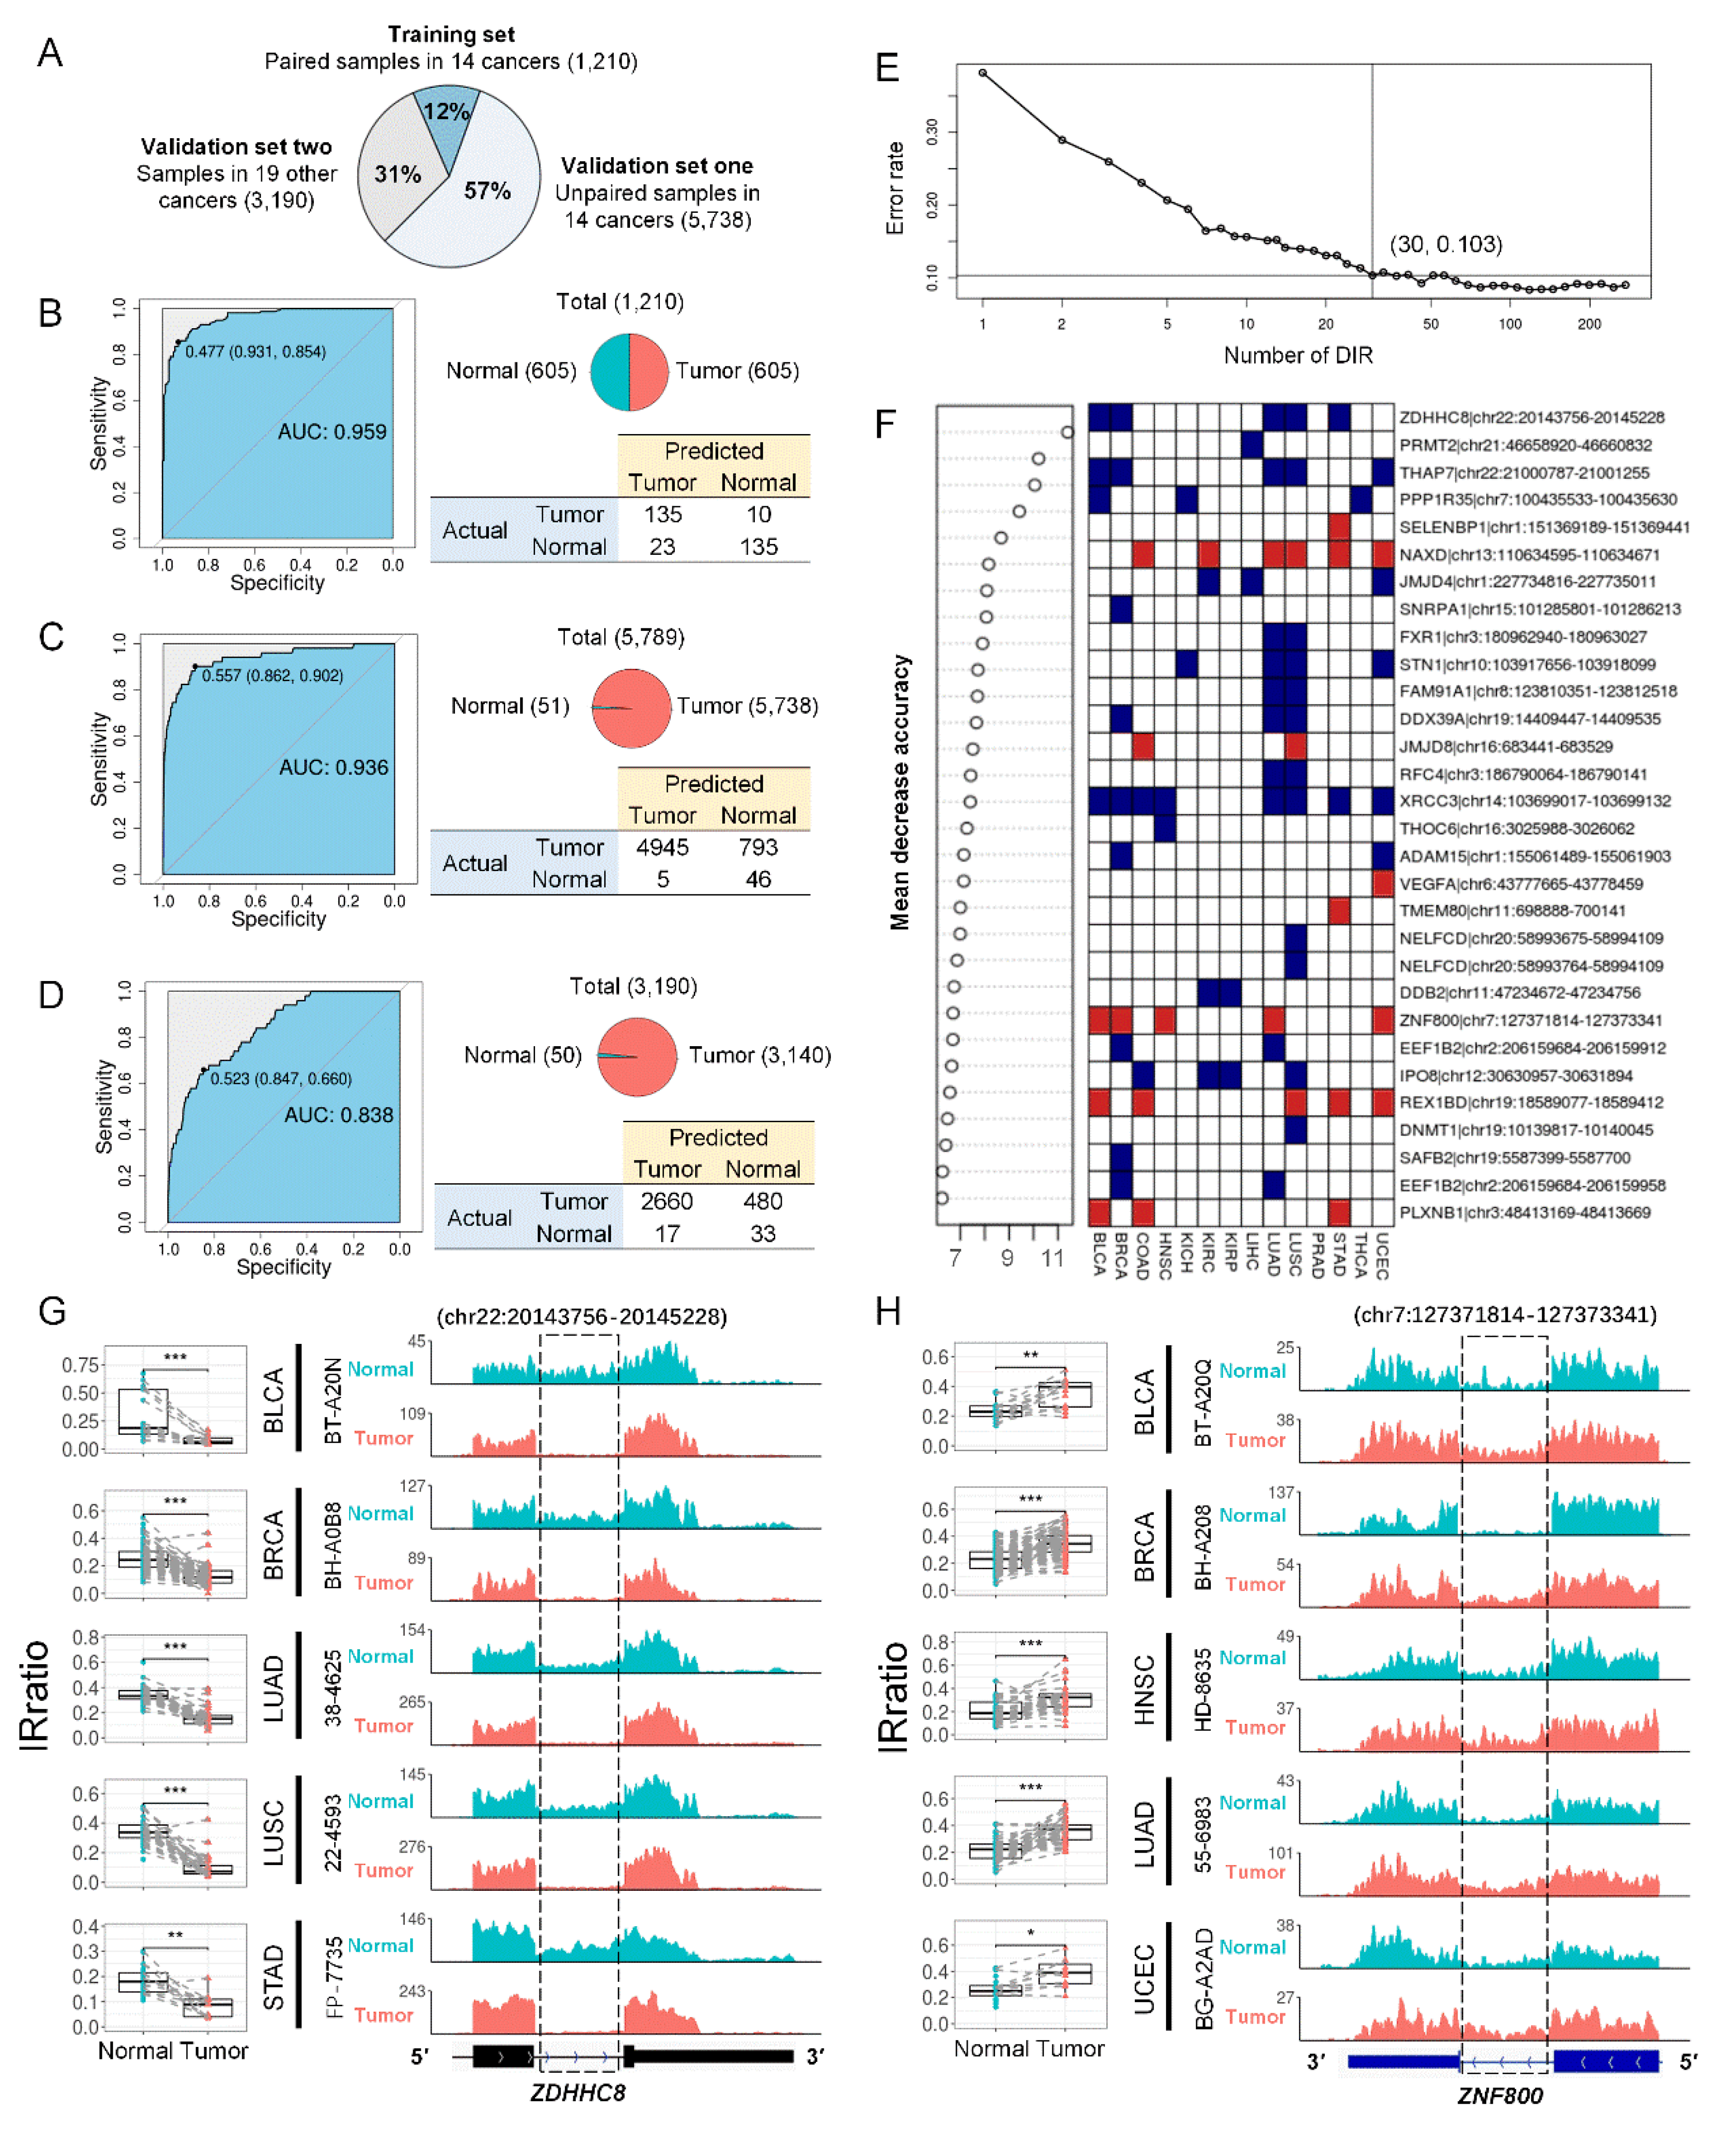
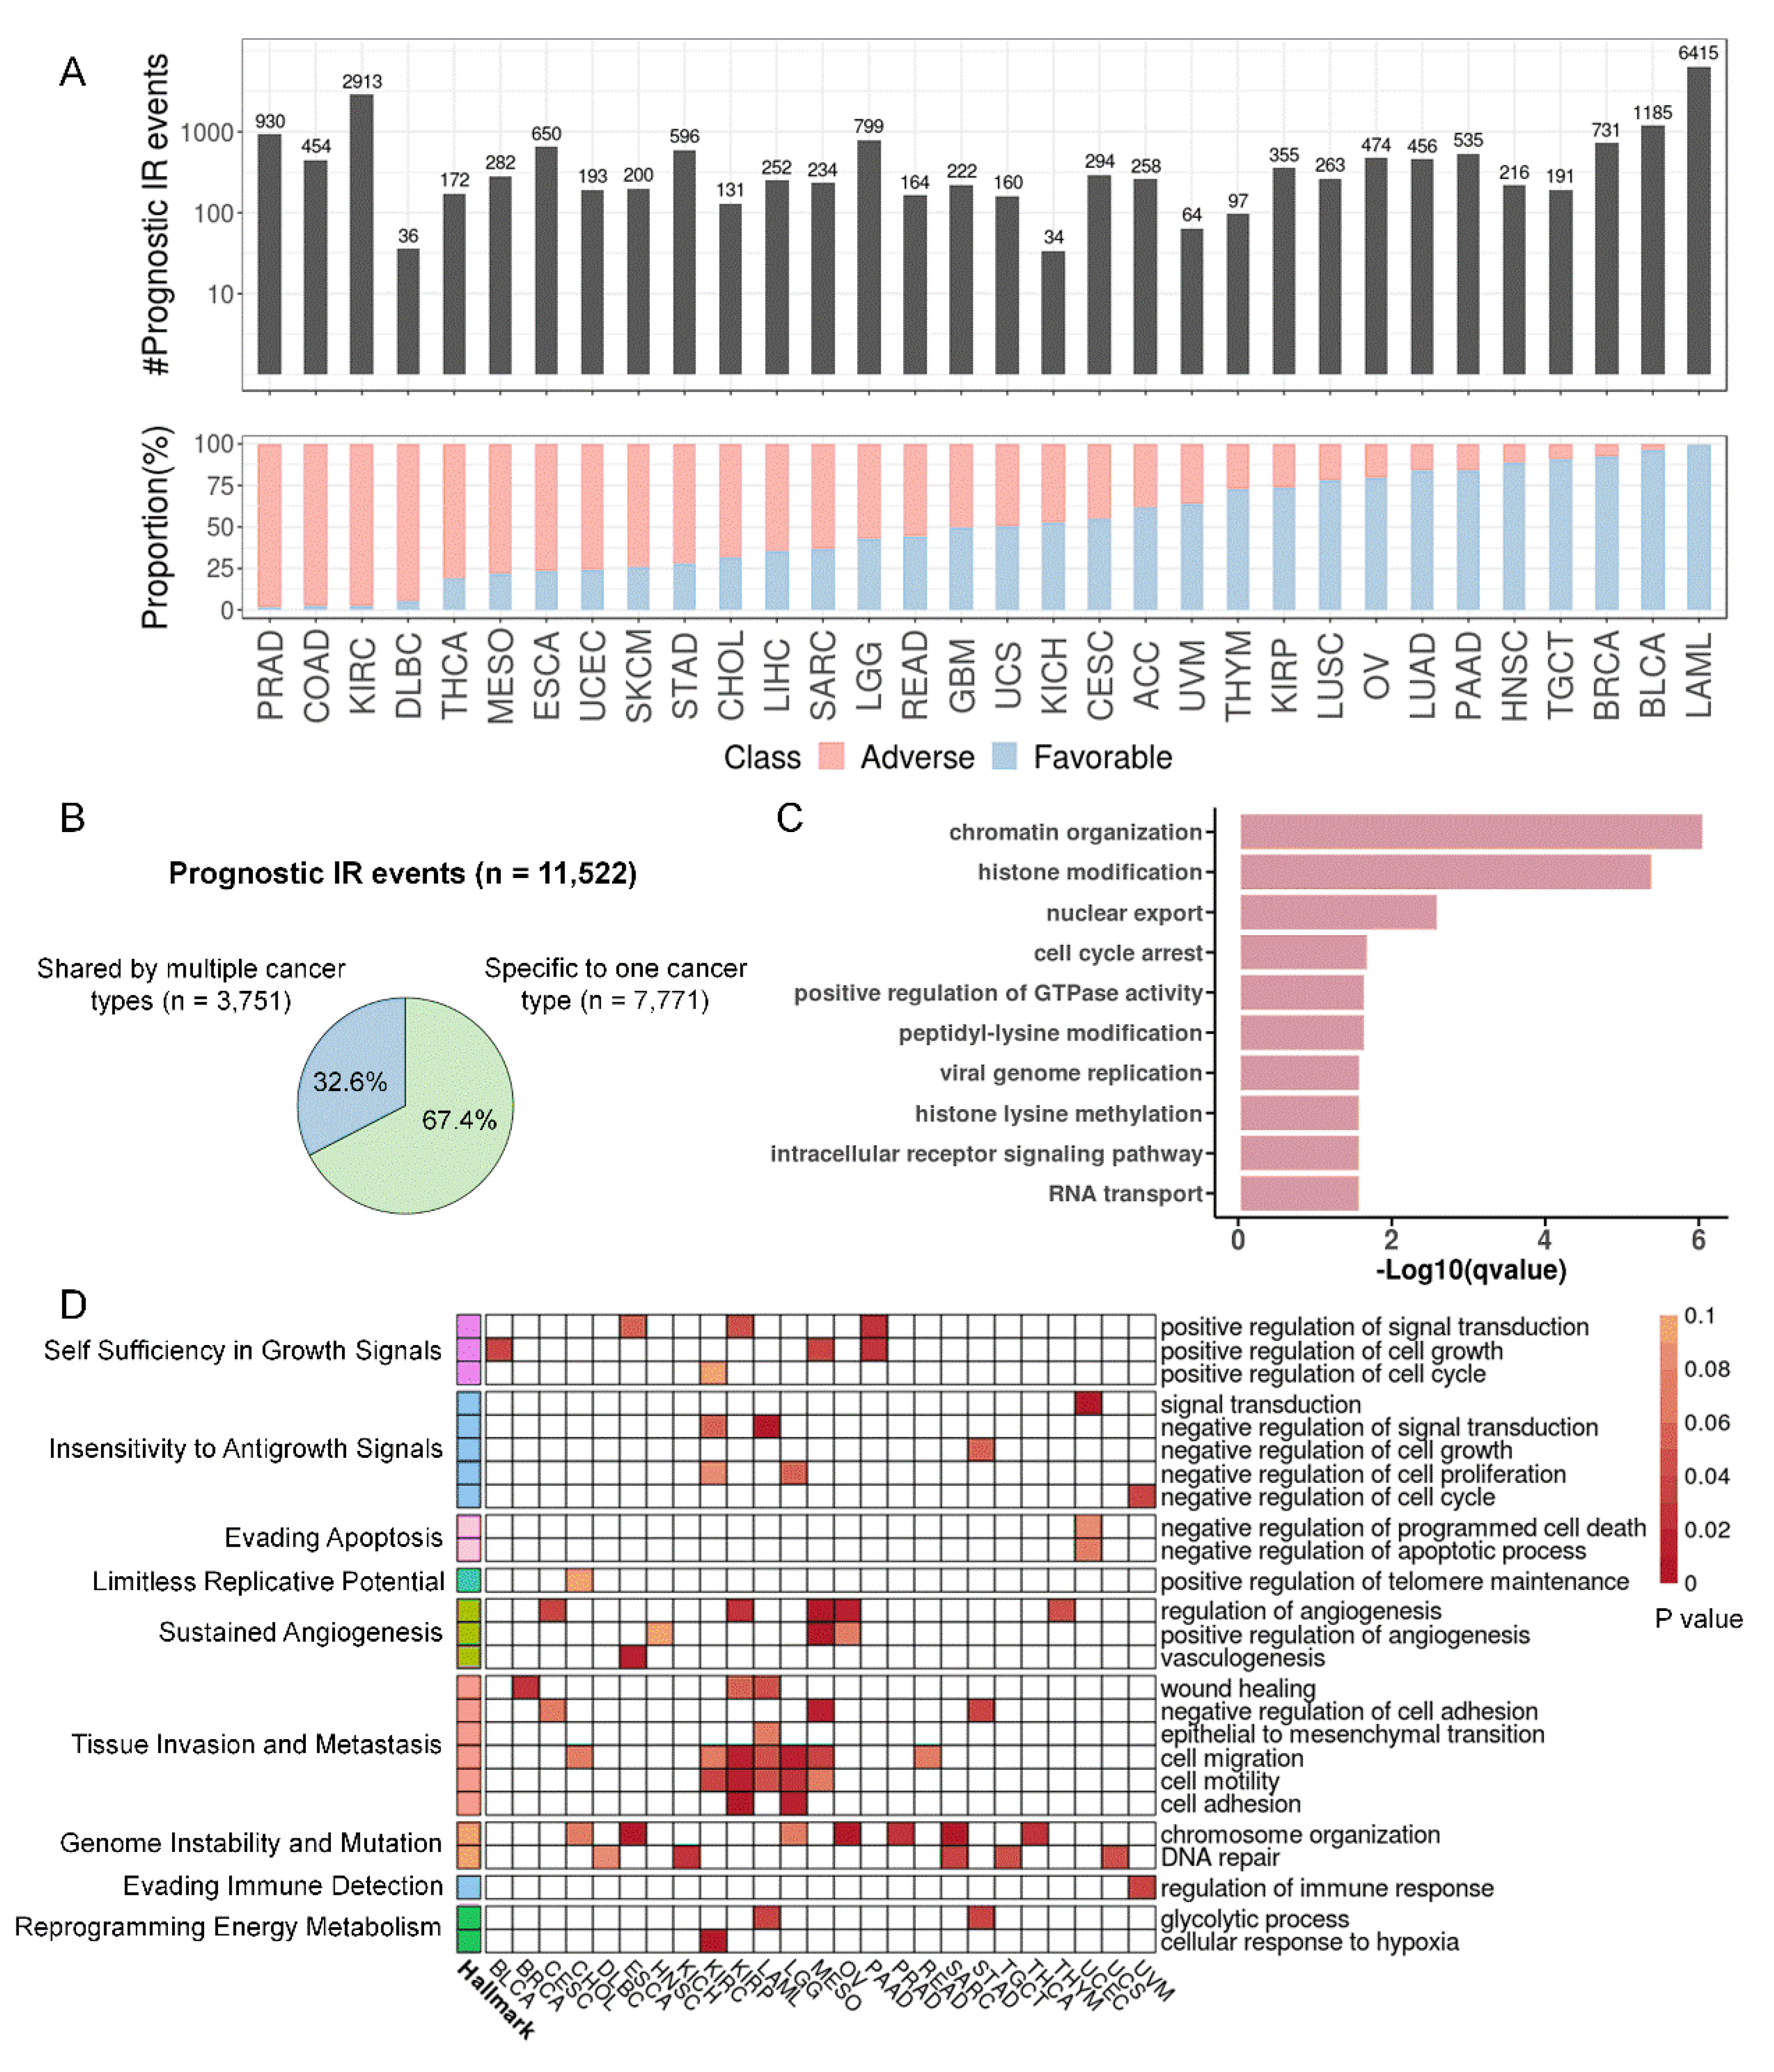
Figure 5.
Statistics and functional enrichment of prognostic introns. (A) Statistics of prognostic introns. The upper panel showed the number of prognostic introns for each cancer type. The bottom panel showed the percentage of prognostic introns associated with longer (favorable prognosis, blue) or shorter (adverse prognosis, red) survival for each cancer type. (B) Proportion of two types of prognostic introns. (C) GO term enrichment of total prognostic IR genes. (D) Enrichment of prognostic IR genes in each cancer for GO terms associated with cancer hallmarks. GO terms (rows) were sorted according to cancer hallmarks on the left. Cell color indicated P values (hypergeometric test; white cells indicate P values larger than 0.1).
Figure 6.
A 5′UTR IR reduces the translation efficiency of STN1 and may suppress tumor growth. (A) Increased IR in 5′ UTR of STN1 was associated with longer survival in lung adenocarcinoma patients. (B) RT-PCR using primers amplifying exons 1-2 (‘e1-e2′) as well as specific to IR isoform in H1299 and A549 cells. (C) Relative intron retention ratio of STN1 in A549 cells detected by qRT-PCR. (D) Relative expression of IR and spliced transcripts of STN1 detected by qRT-PCR after inhibition of transcription in actinomycin D (10 µg/ ml)-treated A549 cells. (E) qRT-PCR for STN1 spliced and IR transcripts, following nuclear and cytoplasmic fractionation of A549 cell lysates. NEAT1 and ACTB serve as markers (or the internal controls) for the nucleus and cytoplasm, respectively. (F) Schematic diagram illustrating the design of the dual-luciferase reporter vector, where 3 different 5′ UTRs of STN1 (spliced 5′ UTR, IR 5′ UTR, and mutated IR 5′ UTR (ATG to AGC)) were attached to the psi-CHECK2 vector, located in front of Renilla. (G) The translation efficiency of three 5′ UTRs was detected by the relative fluorescence intensity of Renilla to Firefly. (H) Expression levels of STN1, CDK1, MKI67, were detected by qPT-PCR upon STN1 knockdown. (I) Effect of STN1 knockdown on cell viability in the clonogenic assay (upper panel) and cell migration assay (lower panel). (J) The cell proliferation rate of A549 cells evaluated by CCK-8 assay upon STN1 knockdown. *, P < 0.05; **, P < 0.01; ***, P < 0.001; two-tailed student’s t test.
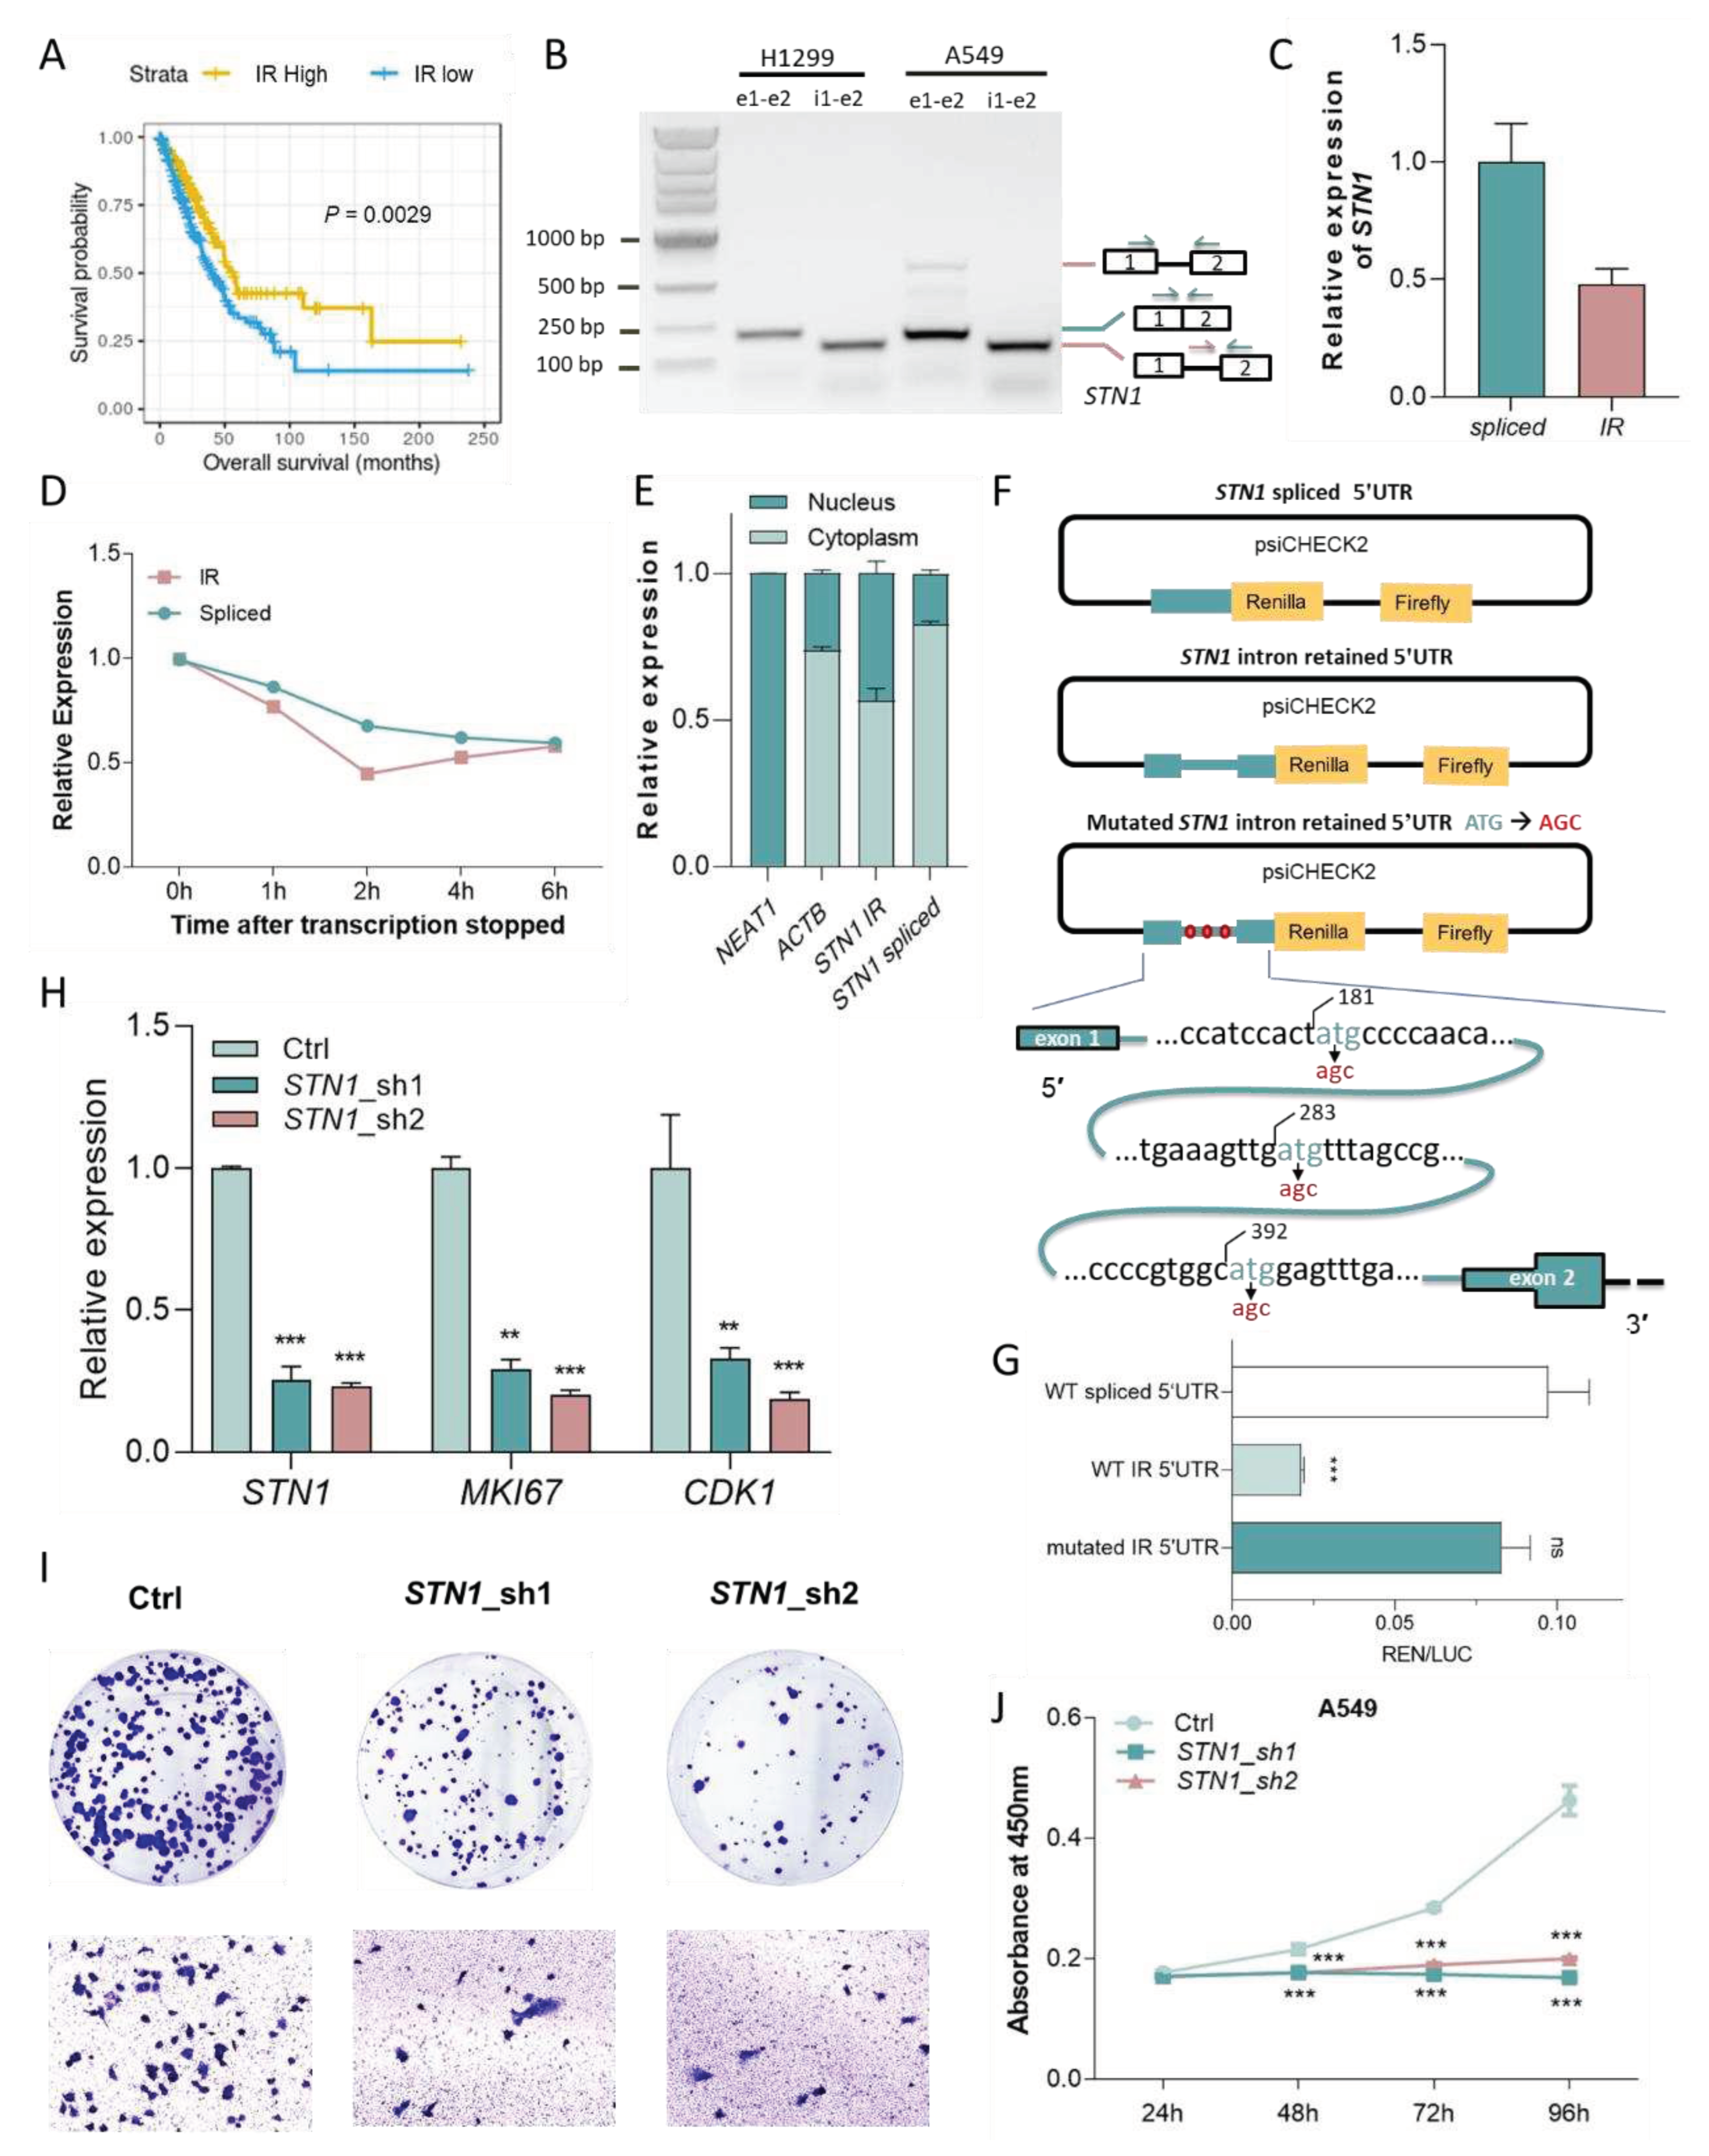
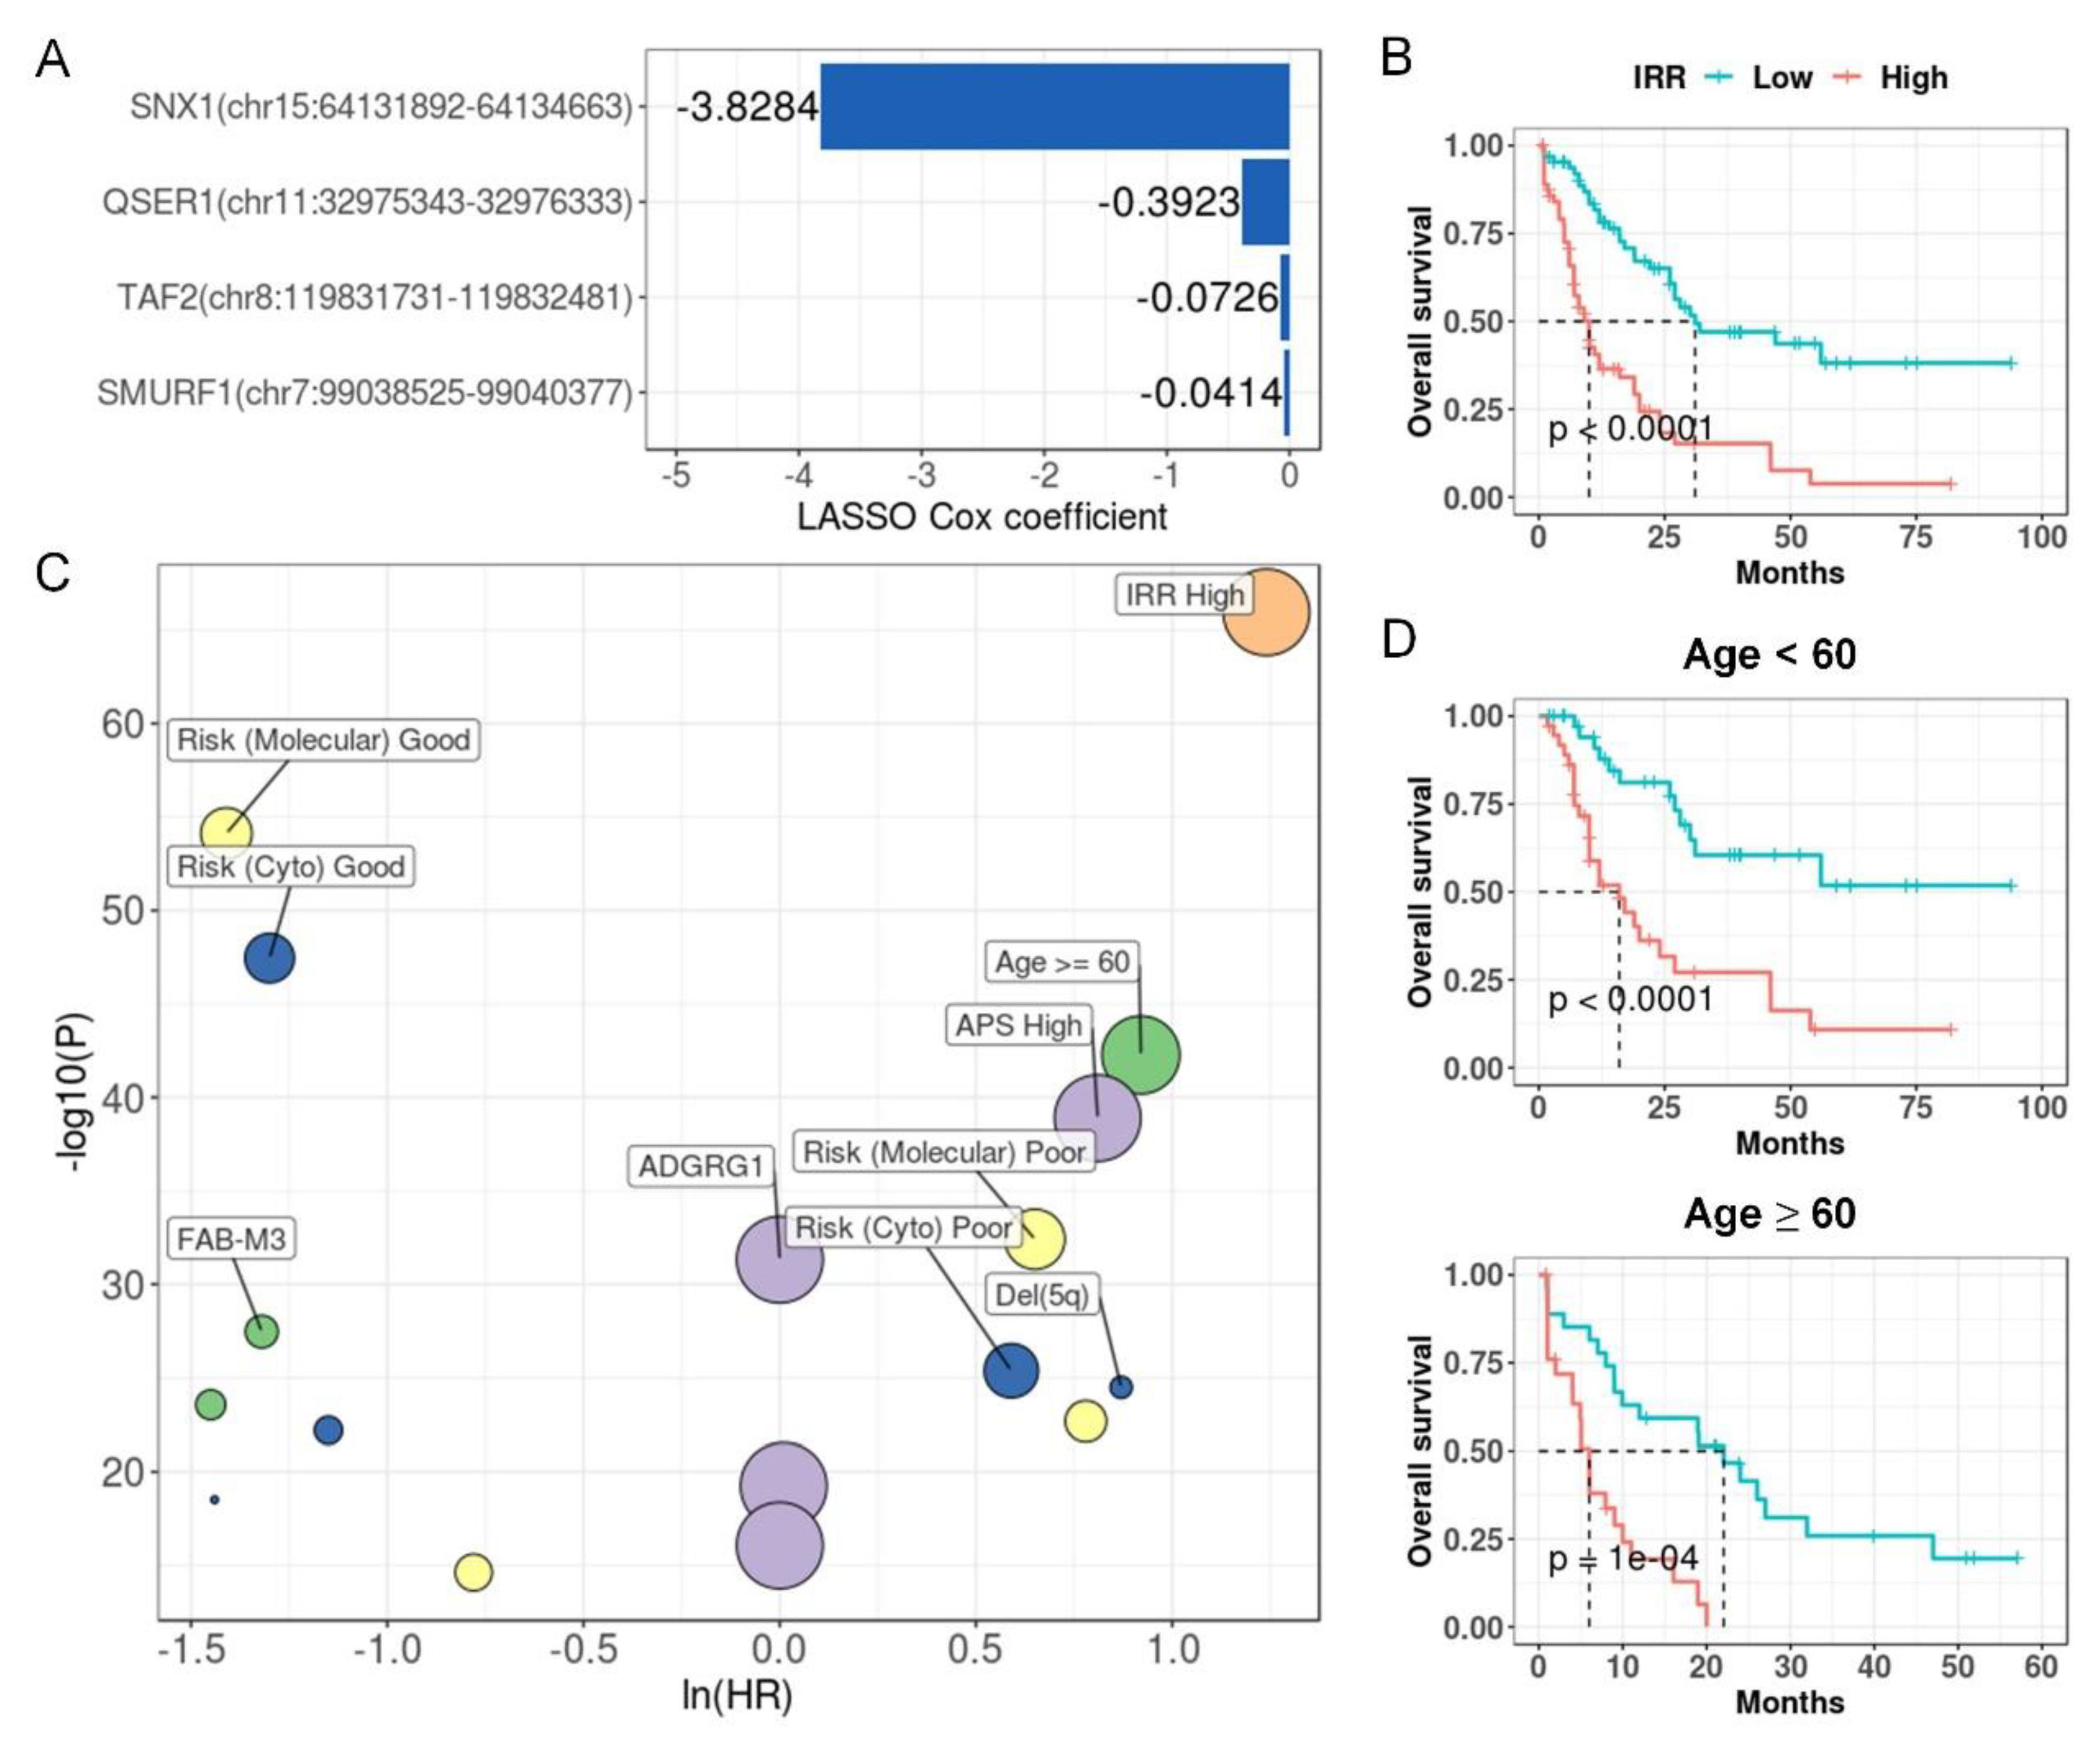
Figure 7.
IR prognostic model stratifies patients in LAML. (A) IRR model coefficients. Y-axis indicates introns and corresponding genes that were used to build this model, and the x-axis indicates their LASSO Cox coefficients. (B) Kaplan-Meier curves of high and low risk groups divided based on median IRR. P value was calculated with a log rank test. (C) IR (orange), clinical (green), mutational (yellow), cytogenetic (blue), and expression (purple) features that were significantly associated with prognosis in univariate COX regression. X-axis and y-axis indicate hazard ratios and the corresponding P values, respectively (both were log-transformed). Point size reflected the percentage of patients affected by the investigated feature.
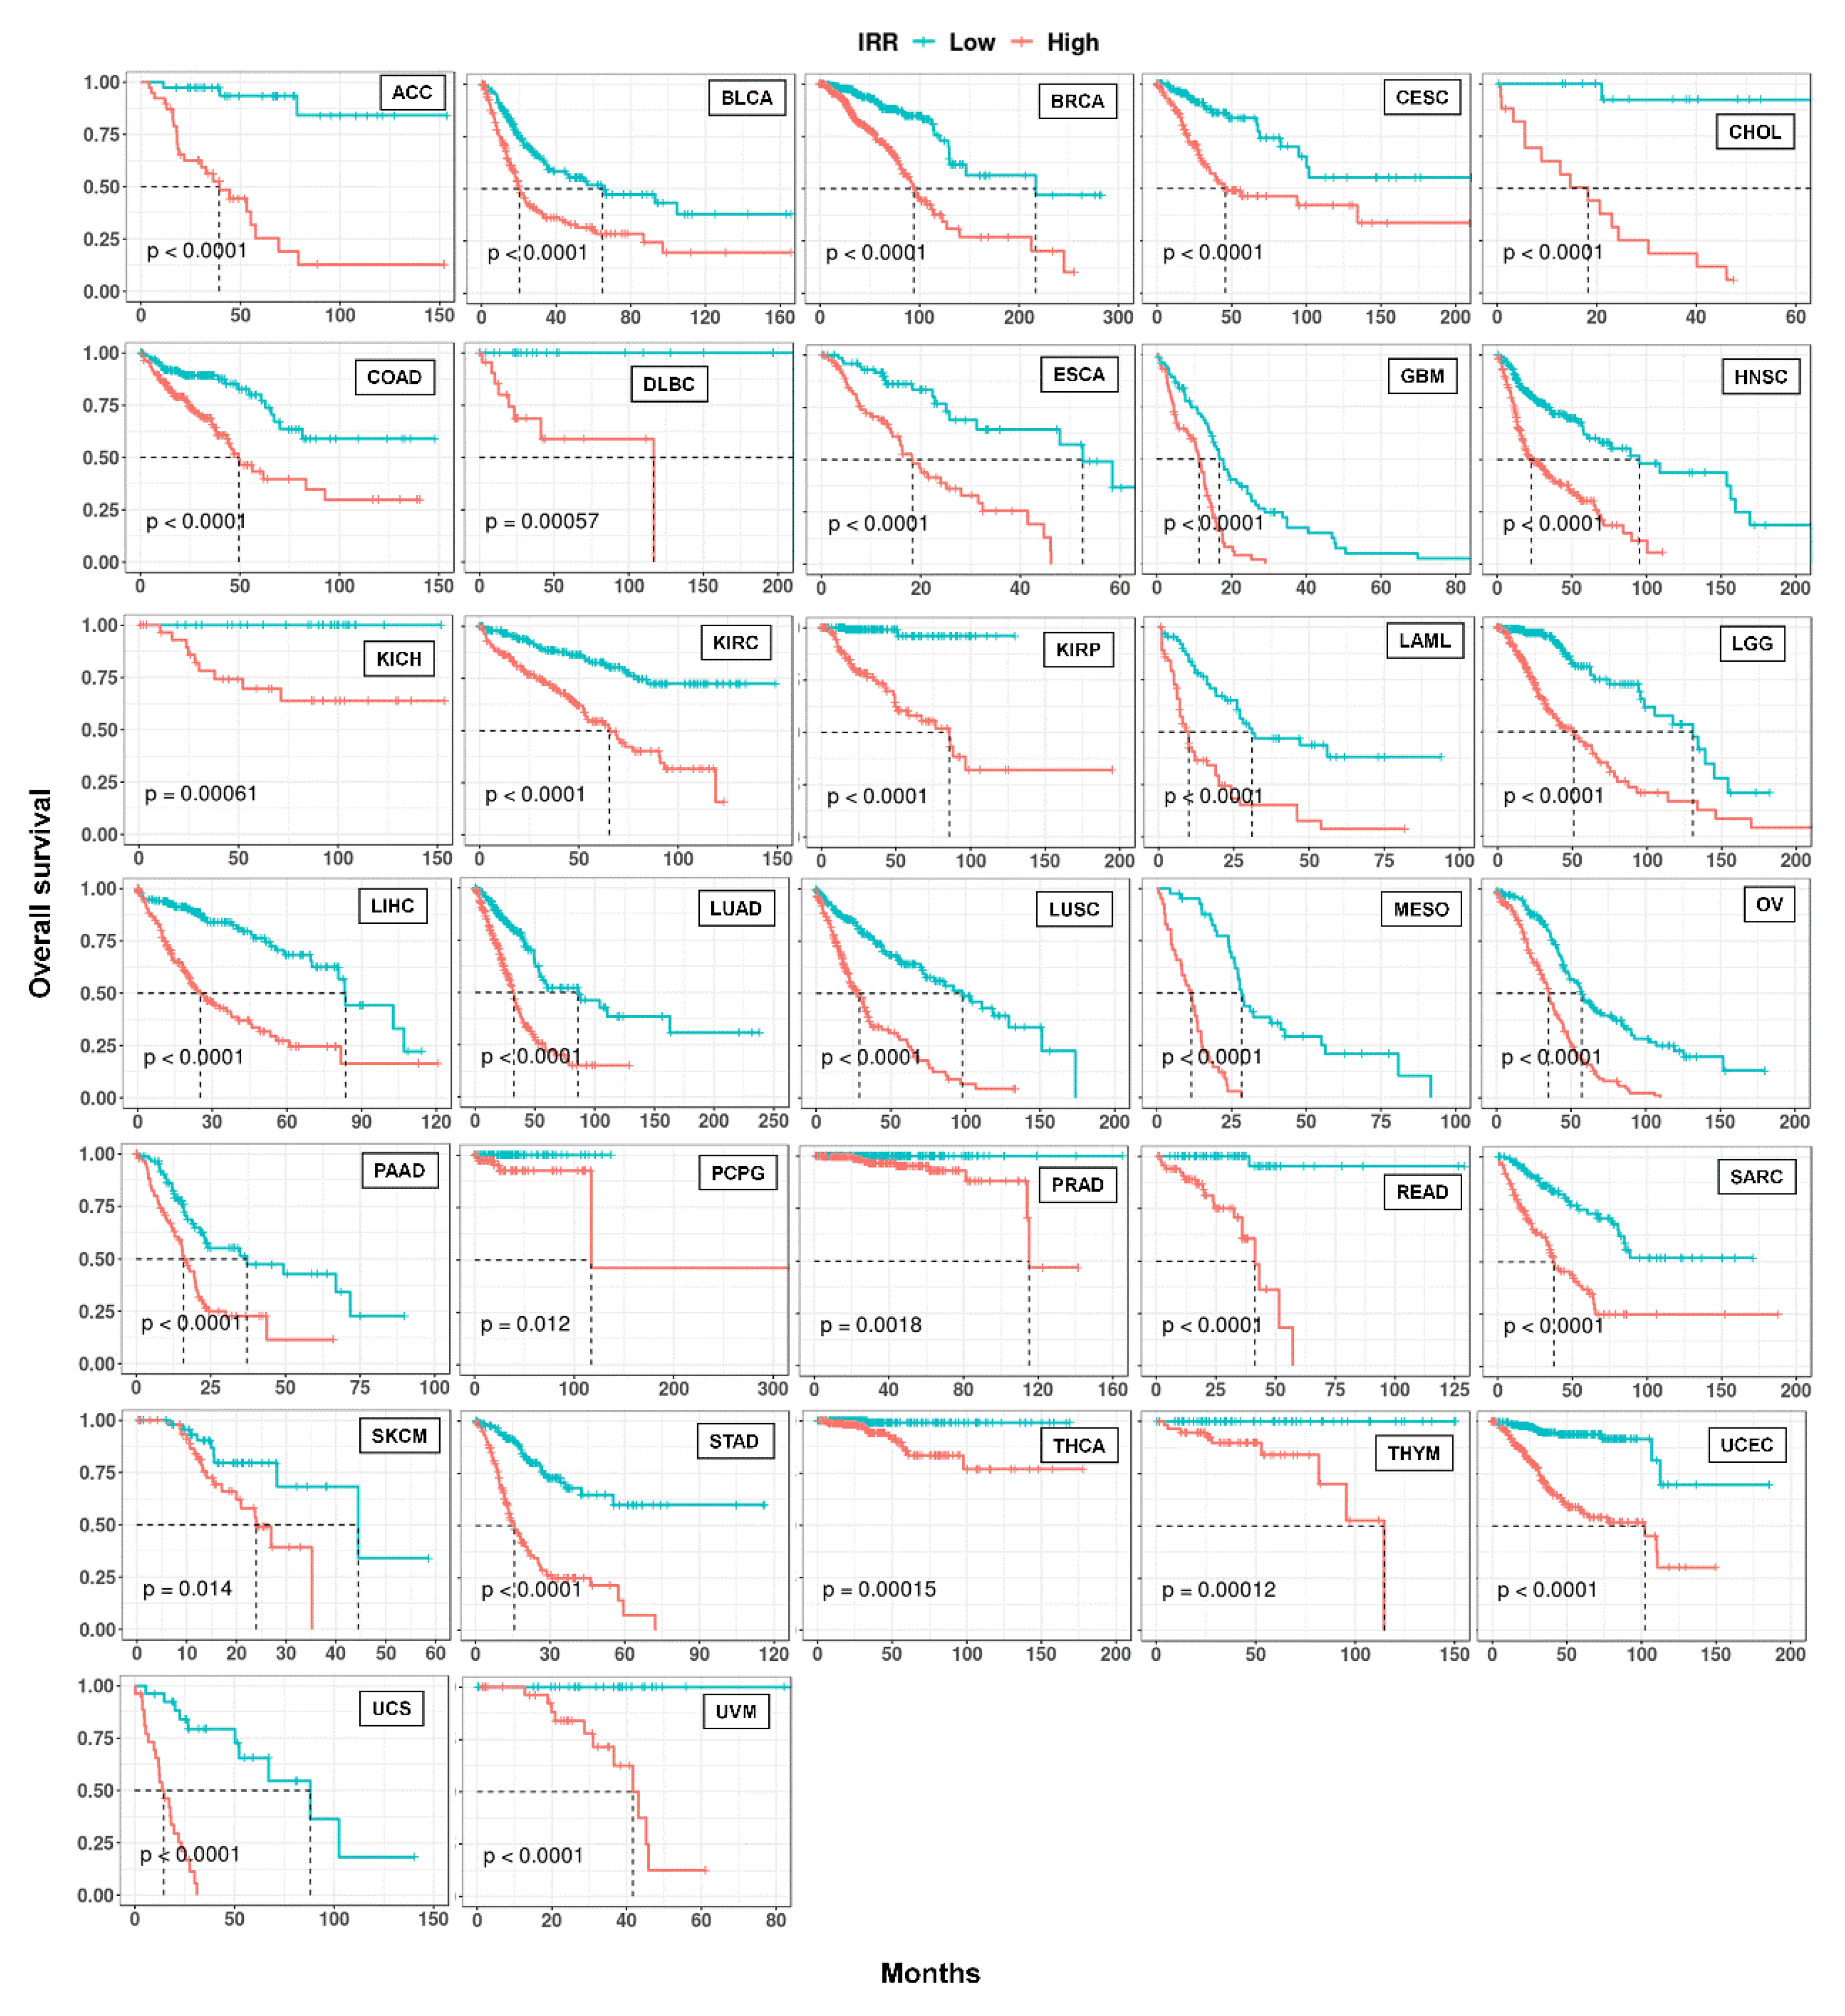
Figure 8.
Kaplan-Meier curves of IR-based prognostic models in 32 cancer types. For each cancer, LASSO regression was performed to build an IR-based prognostic model which we called IRR. Patients in each cancer type were classified into high and low risk groups based on median IRR, and Kaplan-Meier curves were drawn. P values were calculated with a log rank test.
