1. Introduction
The primary motivation for any energy management system is the economic gain. Pricing systems define the appropriate characteristics of smart household management systems (BMSs), which have a substantial impact on the complexity and dependability of BMSs [
1]. Power-grid authorities recently changed the household electrical pricing to encourage proper demand-side control by homeowners. Furthermore, many countries support small-scale PV integration on residential or commercial rooftops and net metering [
2,
3].
On the other hand, RES-based electricity generation is unaffected by other conventional sustainable resources or variations in energy use. Sustainable generating is planned in accordance with expected load levels as well as some technological and environmental constraints. However, weather-dependent RES, such as PV facilities and wind farms, must run at maximum output whenever technically practicable in order to show a high proportion of RES in the electric energy production mixture. When considering limited or isolated energy networks (e.g., islands), these operating criteria cannot be met and may result in insufficient energy supply. Furthermore, as the proportion of renewable energy sources (RESs) in electricity generation grows, this problem becomes increasingly pressing.
All of the concerns listed above can be solved by integrating energy storage systems and controlled loads into the grid, as well as integrating enhancements to the control infrastructure and algorithms in a non-invasive manner for the distribution network. The microgrid, which is commonly characterized as a distribution grid incorporating distributed generators (DGs), energy storage units, and regulated loads [
1], appears to be one of the most significant aspects of future power grid topologies. The auxiliary services that a microgrid's supply and demand sides could provide are predicted to improve the value of the future smart grid [
2,
3,
4,
5,
6,
7]. In general, load levelization and demand-side management are widely employed to provide services such as voltage regulation and energy management for isolated microgrids [
3,
7,
8].
Because they are programmable, these authorized automation devices are typically put at the low-voltage sector of the grid and have numerous capabilities for controlling electric energy use. Their operation is based on a shared data bus, which allows simple binary signals to be transmitted to activate their varied capabilities. Accurate assessment and proper control of the State of Charge (SoC) of energy storage devices are critical during islanded operation of microgrids [
12,
13]. According to [
14], faulty control architecture and algorithms can have a severe impact on grid operation, resulting in inaccurate SoC estimate as well as a decrease in customer power supply reliability. As a result, it is obvious that the control architecture of a smart distribution grid must be compatible with and adequately interactive with energy storage devices and existing bus communication technologies.
The developers of [
10] use the OPC server solution to address the compatibility issue between the microgrid's control system and bus communication technologies. This technique has significant drawbacks, including a relatively expensive cost, the requirement of permanent additional hardware installation, and software version compatibility concerns. Furthermore, in this scenario, the control algorithm of an experimental microgrid without bus technology, as described in [
15], should be exposed to numerous changes. Because most DGs' principal energy sources (PV and wind) are stochastic in nature, incorporating weather prediction into microgrid control algorithms will be critical [
6,
7], however this is not a component of this paper.
In order to achieve optimal demand-side management, this paper describes the control infrastructure and algorithm of an experimental smart microgrid that is compatible with KNX bus systems [
9,
16,
17] in a very simple and cost-effective manner. The first section describes the smart microgrid topology by emphasizing the unique control infrastructure components that transform the distribution network into a "smart grid.", the details of the suggested technique for integrating KNX bus devices into the microgrid and then, a brief overview of the microgrid's control method is offered, including interoperability with KNX bus systems. Finally, the experimental results of the microgrid's operation are shown. According to the findings, incorporating smart cities (bus) systems might greatly improve consumer reliability performance and the supply/demand balance of microgrid-based smart grid topologies.
2. Materials and Methods
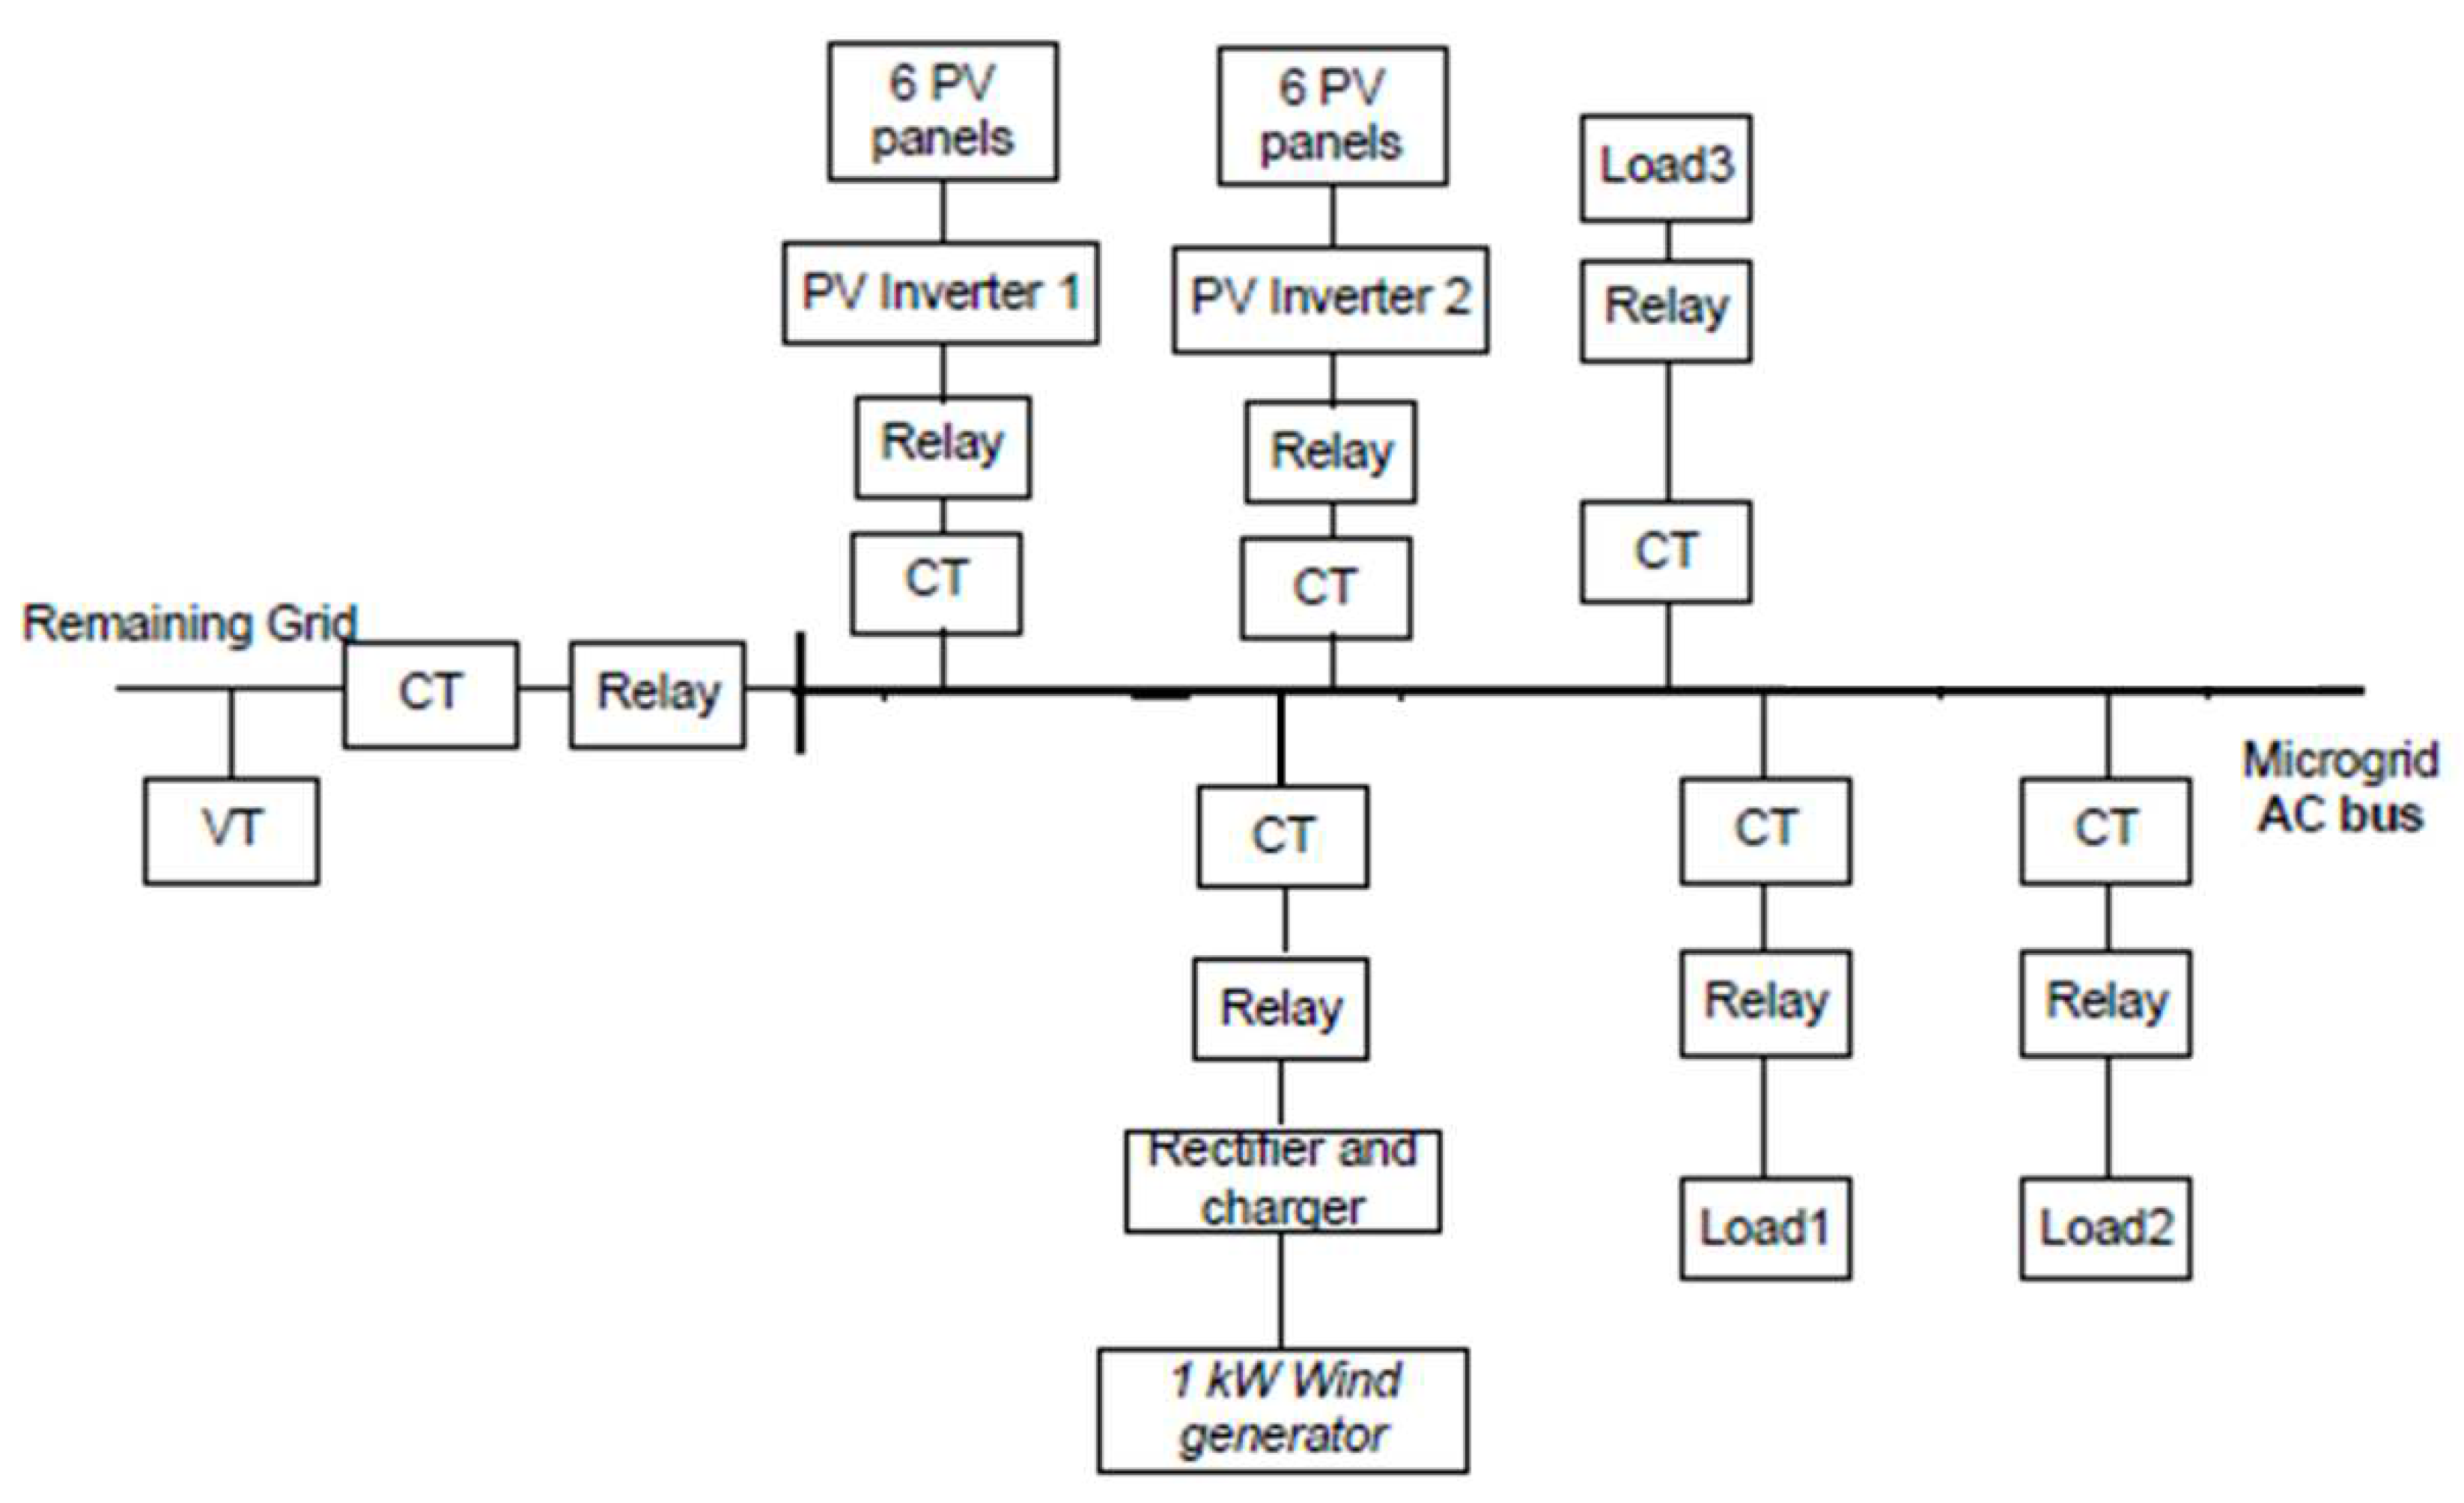
In the experimental microgrid of UoWM, every DC load, generator, or energy storage device in a microgrid-based smart distribution grid architecture is equipped with individual DC-AC inverters and is connected to the AC microgrid via KNX actuator and multi tariff energy meter.
The microgrid is made up of two 1.1 kW PV-inverter with six connected PV panels each, three loads with a maximum consumption of approximately 1500 W (1 AC-motor, incandescent lamps).
Figure 1.
Implementation of a smart distribution grid topology.
Figure 1.
Implementation of a smart distribution grid topology.
Interoperability with KNX system
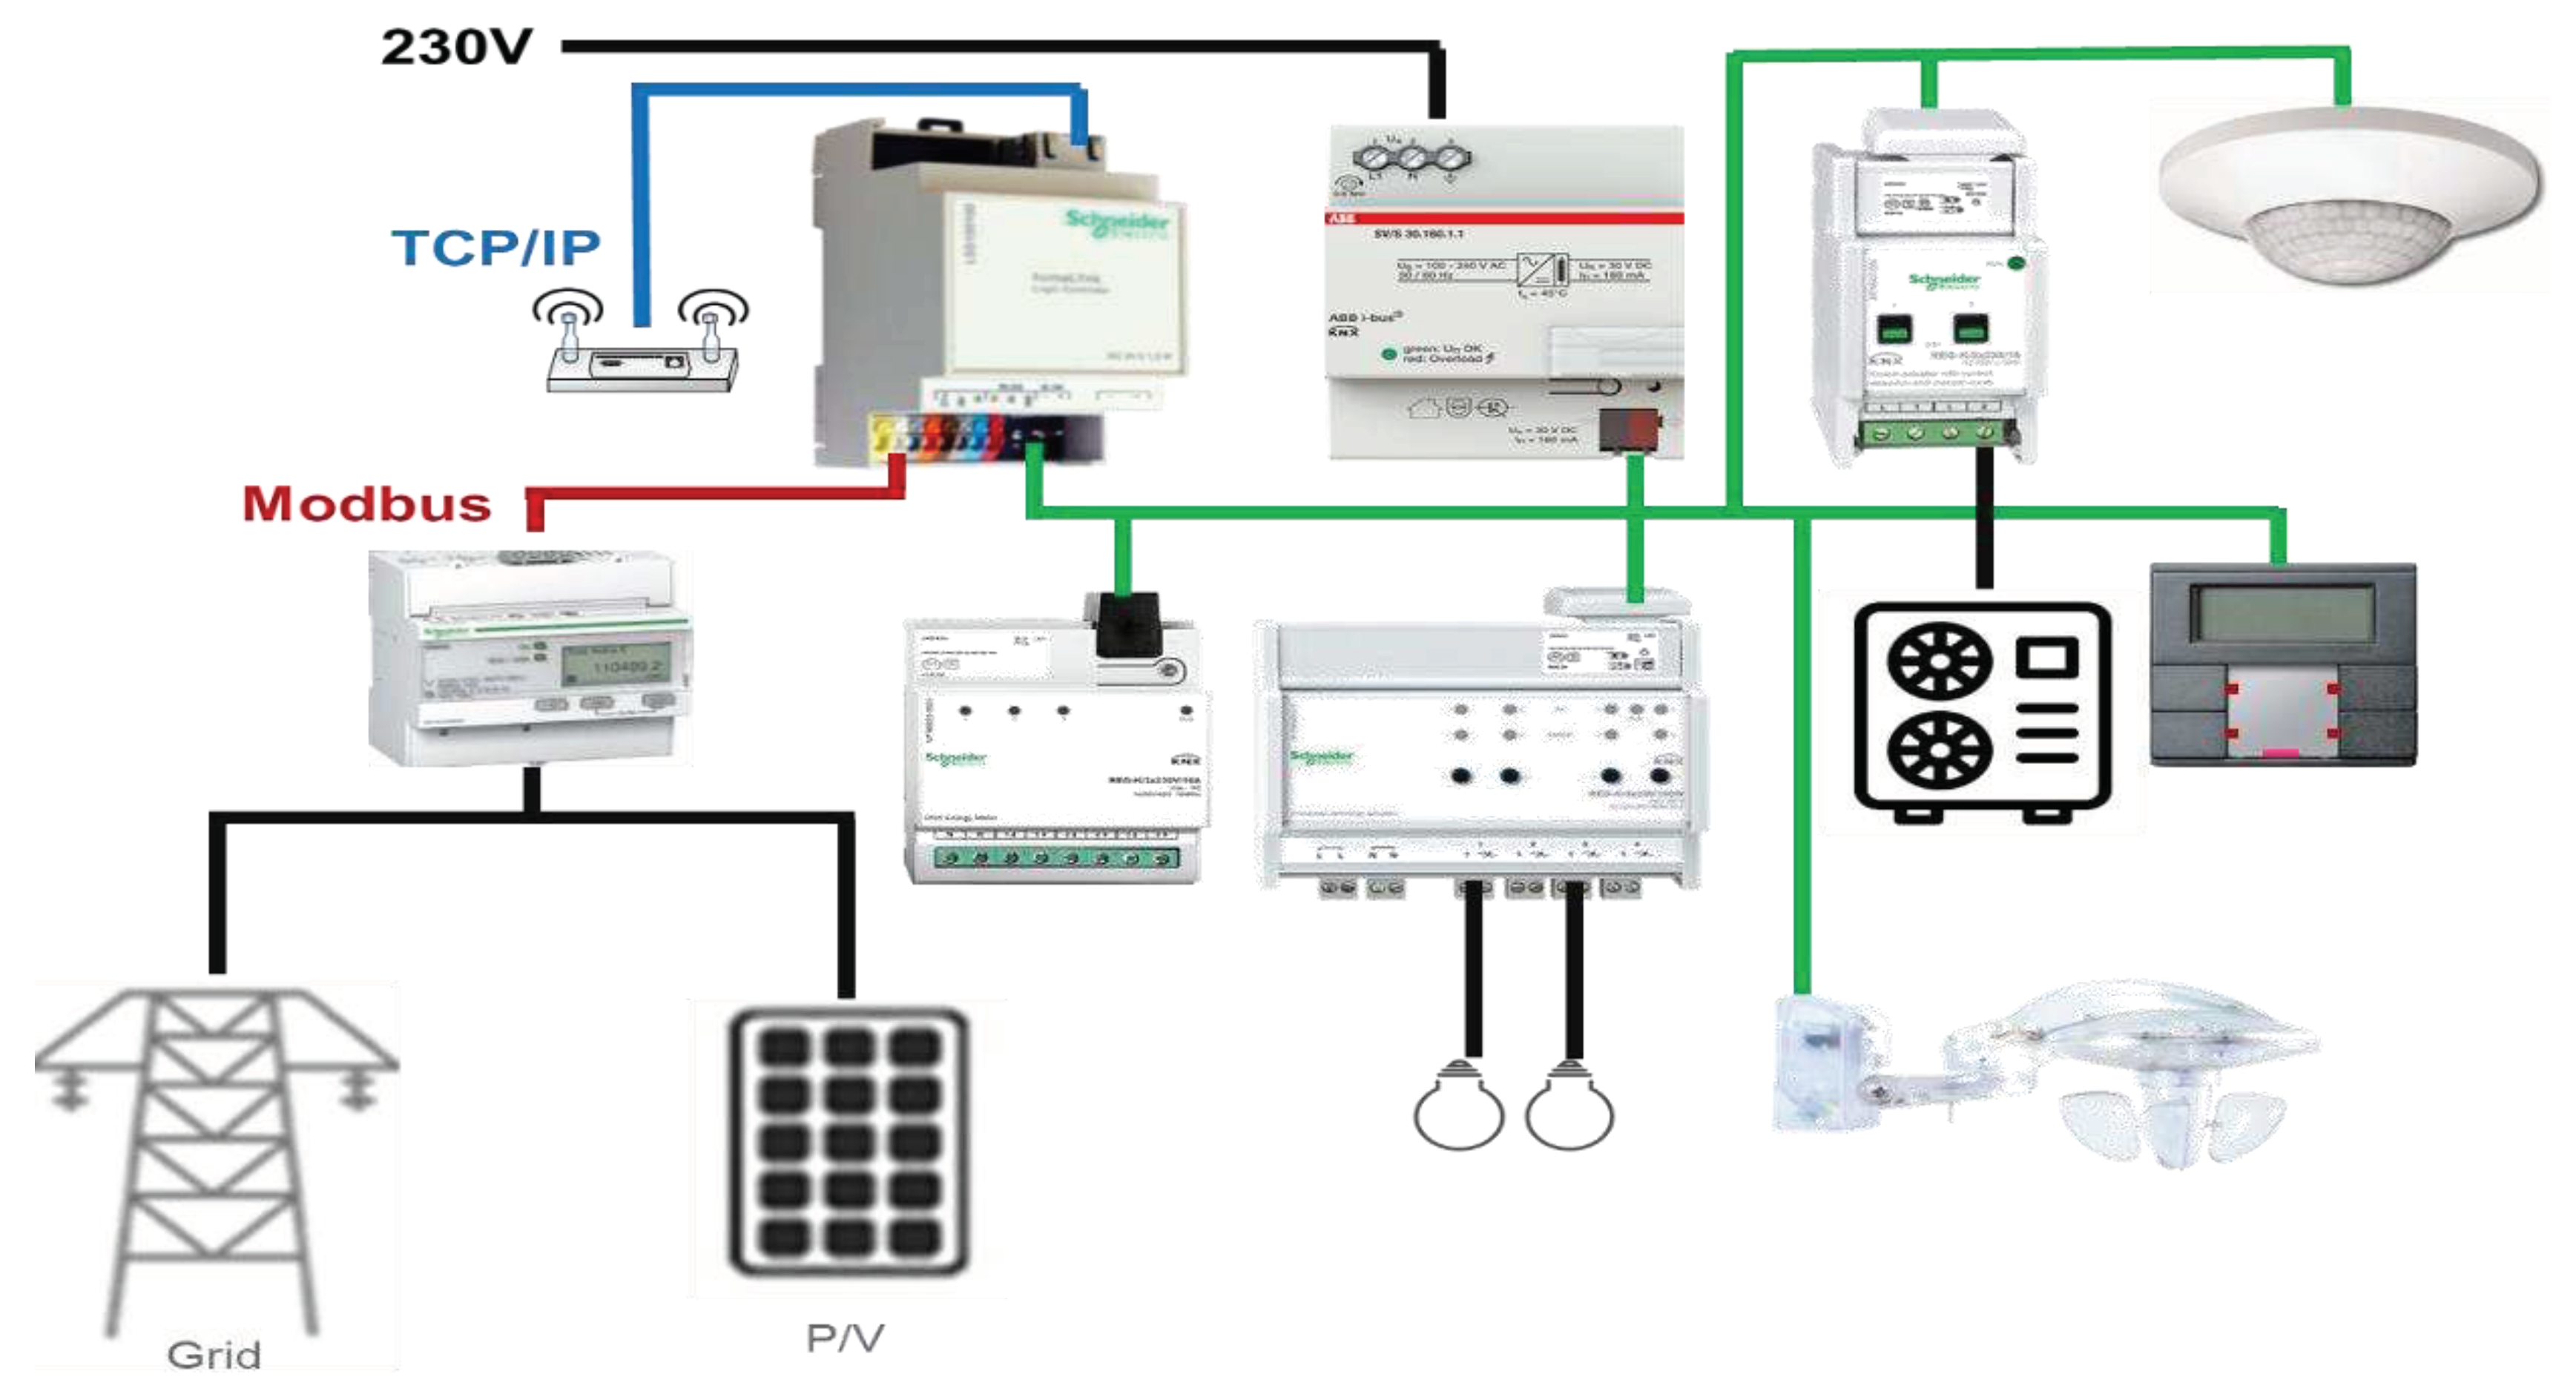
In this paper we have installed some KNX devices: a KNX power supply 160mA, a switch on/off actuator of 2 channels, a dimmer actuator of 4 channels, an energy 3 channels multi-tariff meter, a basic weather station, a push button with room temperature control, a presence detector with light control and a KNX server for the visualization.
The KNX server (HomeLynk from Schneider Electric) is required to incorporate KNX bus technologies into real-time measurements and decision systems in general. In the case of the experimental microgrid, in addition to the KNX devices the KNX HomeLynk sever, as illustrated in
Figure 2, should be installed on the microgrid. Load 1 in
Figure 2 represents the motor (heating/cooling pump), while Load 2 and Load 3 represent a 500W incandescent light group.
Table 1.
Lab appliance types.
Table 1.
Lab appliance types.
| Component |
Load/source type |
Rating |
| PV modules |
Source |
2 kW |
| Light 1 |
Managed load |
250W |
| Light 2 |
Managed load |
250W |
| Heating/cooling pump |
Managed load |
1 kW |
The BMS, checks the PV energy, the real time energy price and the average energy price through the multi tariff energy meter continuously every 15 minutes. Recent smart homes have several possibilities of room occupants. According to this study, the optimal schedule of occupant rooms, i.e., the comfort zone, is defined and suggested to home owners. The system checks the internal and external brightness of the room, the room temperature, the photovoltaic energy flow according to the weather prediction the electricity real time price and the average electricity price According to all these parameters the system dims up or down the light in the room, changes the temperature setpoint and activates the heating or cooling and activates the electric vehicle (EV) charge station.
Cost effective demand side-management
As previously stated, a simple and low-cost alternative option for integrating KNX-controlled loads into the microgrid control strategy is devised. KNX is the global standard for all building and smart city applications control.
The majority of KNX-compatible load control devices are activated by KNX switches as well as traditional push buttons, the manipulations of which can be converted into binary signals. When the push button on a KNX dimmer is pressed briefly, the signal is translated into a pulse in the dimming mechanism. The inbuilt KNX program in the gadget transforms this pulse to full power for the lamps, and the lamps consume full power. On the other hand, sustained switch pressure indicates that the KNX device gets 1 bit signals sequentially. In this situation, the device begins lowering the voltage of the lamps until the pressing stops or the voltage is reduced to the final value set by the dimmer's original program. The lights and electricity usage are both lowered. If the button is held down for an extended period of time, the brightness is increased, and so on.
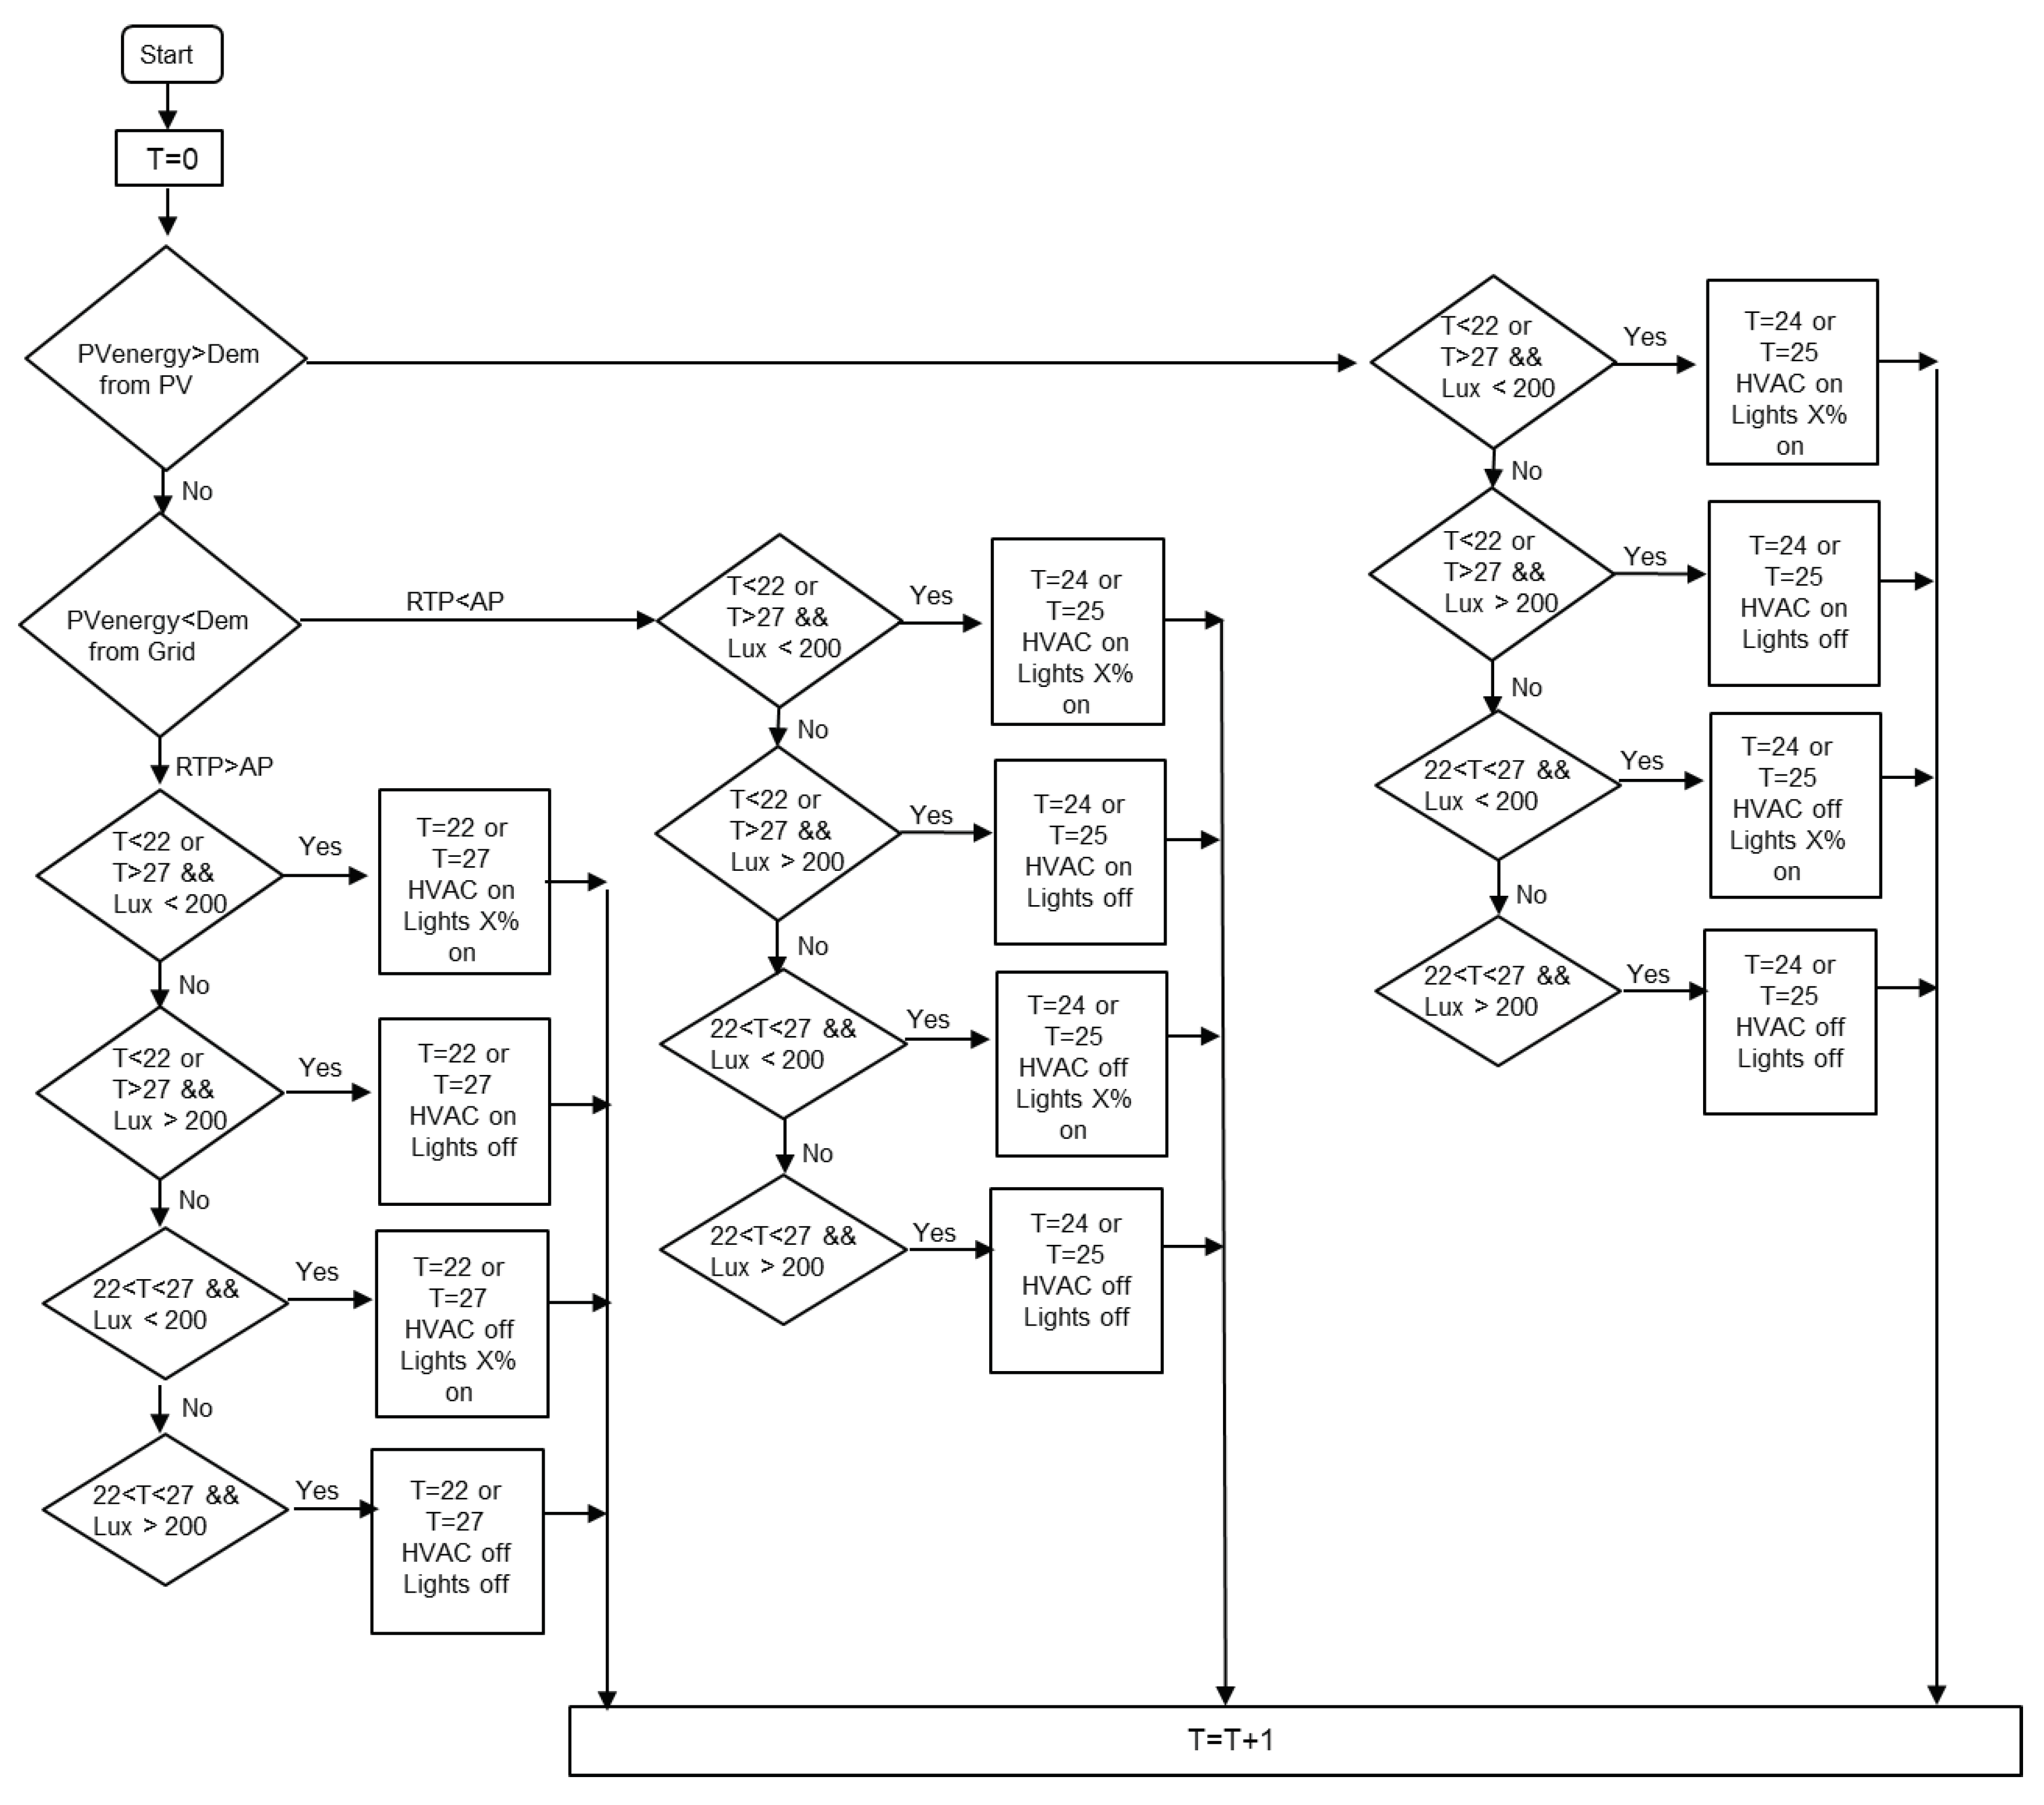
There are two main scenarios according to the flow chart in
Figure 3. In scenario 1 the photovoltaic energy is greater than the demand energy, while in scenario 2 the photovoltaic energy is less than the demand power and the real time electricity price is greater than the average electricity price. In scenario 3 the photovoltaic energy is less than the demand energy and the real time electricity price is less than the average electricity price.
When the photovoltaic power is greater than the demand power, then the power source is the photovoltaic, otherwise the power source is the grid.
The technical features of the multi-tariff energy meter are presented below:
Table 2.
Multi-tariff energy meter characteristics.
Table 2.
Multi-tariff energy meter characteristics.
| Direct measurement (up to 63 A) |
√ |
| Active Energy measurements |
√ |
| Four Quadrant Energy measurements |
√ |
| Electrical measurements (I, V, P, ...) |
√ |
| Multi-tariff (internal clock) |
4 |
| Multi-tariff (controlled by digital inputs) |
2 |
| Measurement display |
√ |
| Digital inputs |
1 |
| Programmable digital outputs |
1 |
| Overload alarm |
√ |
| Modbus communication |
√ |
| MID (legal metrology certification) |
√ |
The control algorithm's inputs are real-time measurements that are updated by the HomeLynk at each duty cycle and output variables that are supplied back into the iterative control method at the end of its execution period.
The algorithm's real-time measurement inputs are:
the PV energy
the signal for multi-tariffs
the L1 energy in channel 1 of the dimmer
the L2 energy in channel 1 of the dimmer
the motor (heating/cooling) energy
the internal lux in the lab
the external lux
the room temperature
the room temperature setpoint
The HomeLynk algorithm
The HomeLynk algorithm is presented in
Figure 3. PV energy is the energy from photovoltaic panels, Dem is the demand energy, T is the room temperature, L is the internal brightness, REP is the real time energy price, and AP is the average energy price. According to the algorithm in the
Figure 3 there are the cases below:
The photovoltaic energy is greater than the demand energy, the room temperature is less than 22 oC (winter) or greater than 27 oC, and the internal brightness is less than 200 lux, then energy source is the PV, the temperature setpoint is 24 oC (winter) or 25 oC (summer) and the heating/cooling pump is on and the lamps L1 and L2 are dimmed up at X % brightness as follows: internal brightness + X% brightness = 200 lux.
The photovoltaic energy is greater than the demand energy, the room temperature is less than 22 oC (winter) or greater than 27 oC, and the internal brightness is greater than 200 lux, then energy source is the PV, the temperature setpoint is 24 oC (winter) or 25 oC (summer) and the heating/cooling pump is on and the lamps L1 and L2 are switched off.
The photovoltaic energy is greater than the demand energy, the room temperature is greater than 22 oC (winter) or less than 27 oC, and the internal brightness is less than 200 lux, then energy source is the PV, the temperature setpoint is 24 oC (winter) or 25 oC (summer) and the heating/cooling pump is on and the lamps L1 and L2 are dimmed up at X % brightness as follows: internal brightness + X% brightness = 200 lux.
The photovoltaic energy is greater than the demand energy, the room temperature is greater than 22 oC (winter) or less than 27 oC, and the internal brightness is greater than 200 lux, then energy source is the PV, the temperature setpoint is 24 oC (winter) or 25 oC (summer) and the heating/cooling pump is on and the lamps L1 and L2 are switched off.
The photovoltaic energy is less than the demand energy, the real time energy price is greater than the average price, the room temperature is less than 22 oC (winter) or greater than 27 oC, and the internal brightness is less than 200 lux, then energy source is the grid, the temperature setpoint is 22 oC (winter) or 27 oC (summer) and the heating/cooling pump is on and the lamps L1 and L2 are dimmed up at X % brightness as follows: internal brightness + X% brightness = 200 lux.
The photovoltaic energy is less than the demand energy, the real time energy price is greater than the average price, the room temperature is less than 22 oC (winter) or greater than 27 oC, and the internal brightness is greater than 200 lux, then energy source is the grid, the temperature setpoint is 22 oC (winter) or 27 oC (summer) and the heating/cooling pump is on and the lamps L1 and L2 are switched off.
The photovoltaic energy is less than the demand energy, the real time energy price is greater than the average price, the room temperature is greater than 22 oC (winter) or less than 27 oC, and the internal brightness is less than 200 lux, then energy source is the grid, the temperature setpoint is 22 oC (winter) or 27 oC (summer) and the heating/cooling pump is on and the lamps L1 and L2 are dimmed up at X % brightness as follows: internal brightness + X% brightness = 200 lux.
The photovoltaic energy is less than the demand energy, the real time energy price is greater than the average price, the room temperature is greater than 22 oC (winter) or less than 27 oC (summer), and the internal brightness is greater than 200 lux, then energy source is the grid, the temperature setpoint is 22 oC (winter) or 27 oC (summer) and the heating/cooling pump is on and the lamps L1 and L2 are switched off.
The photovoltaic energy is less than the demand energy, the real time energy price is less than the average price, the room temperature is less than 22 oC (winter) or greater than 27 oC (summer), and the internal brightness is less than 200 lux, then energy source is the grid, the temperature setpoint is 24 oC (winter) or 25 oC (summer) and the heating/cooling pump is on and the lamps L1 and L2 are dimmed up at X % brightness as follows: internal brightness + X% brightness = 200 lux.
The photovoltaic energy is less than the demand energy, the real time energy price is less than the average price, the room temperature is less than 22 oC (winter) or greater than 27 oC (summer), and the internal brightness is greater than 200 lux, then energy source is the grid, the temperature setpoint is 24 oC (winter) or 25 oC (summer) and the heating/cooling pump is on and the lamps L1 and L2 are switched off.
The photovoltaic energy is less than the demand energy, the real time energy price is less than the average price, the room temperature is greater than 22 oC (winter) or less than 27 oC (summer), and the internal brightness is less than 200 lux, then energy source is the grid, the temperature setpoint is 24 oC (winter) or 25 oC (summer) and the heating/cooling pump is on and the lamps L1 and L2 are dimmed up at X % brightness as follows: internal brightness + X% brightness = 200 lux.
The photovoltaic energy is less than the demand energy, the real time energy price is less than the average price, the room temperature is greater than 22 oC (winter) or less than 27 oC (summer), and the internal brightness is greater than 200 lux, then energy source is the grid, the temperature setpoint is 24 oC (winter) or 25 oC (summer) and the heating/cooling pump is on and the lamps L1 and L2 are switched off.
Figure 3.
HomeLynk flow chart algorithm.
Figure 3.
HomeLynk flow chart algorithm.
The change of the temperature setpoint from 22 oC to 24 oC (winter) or from 27 oC to 25 oC, when the real time energy price is less than the average energy price, leads to energy efficiency and to reduction of the energy cost. In Greece the average energy price for the homes is 0,18 €/Kwh, while the real time energy price is between 0,06 €/Kwh and 0,12 €/Kwh.
3. Results
The results show that none of the loads are totally rejected when KNX automation system is used for load control actions instead of traditional on-off control [
18]. In this paper we present the results of the HomeLynk server trends application in a single day of summer when the environmental temperature is 35
oC. In the
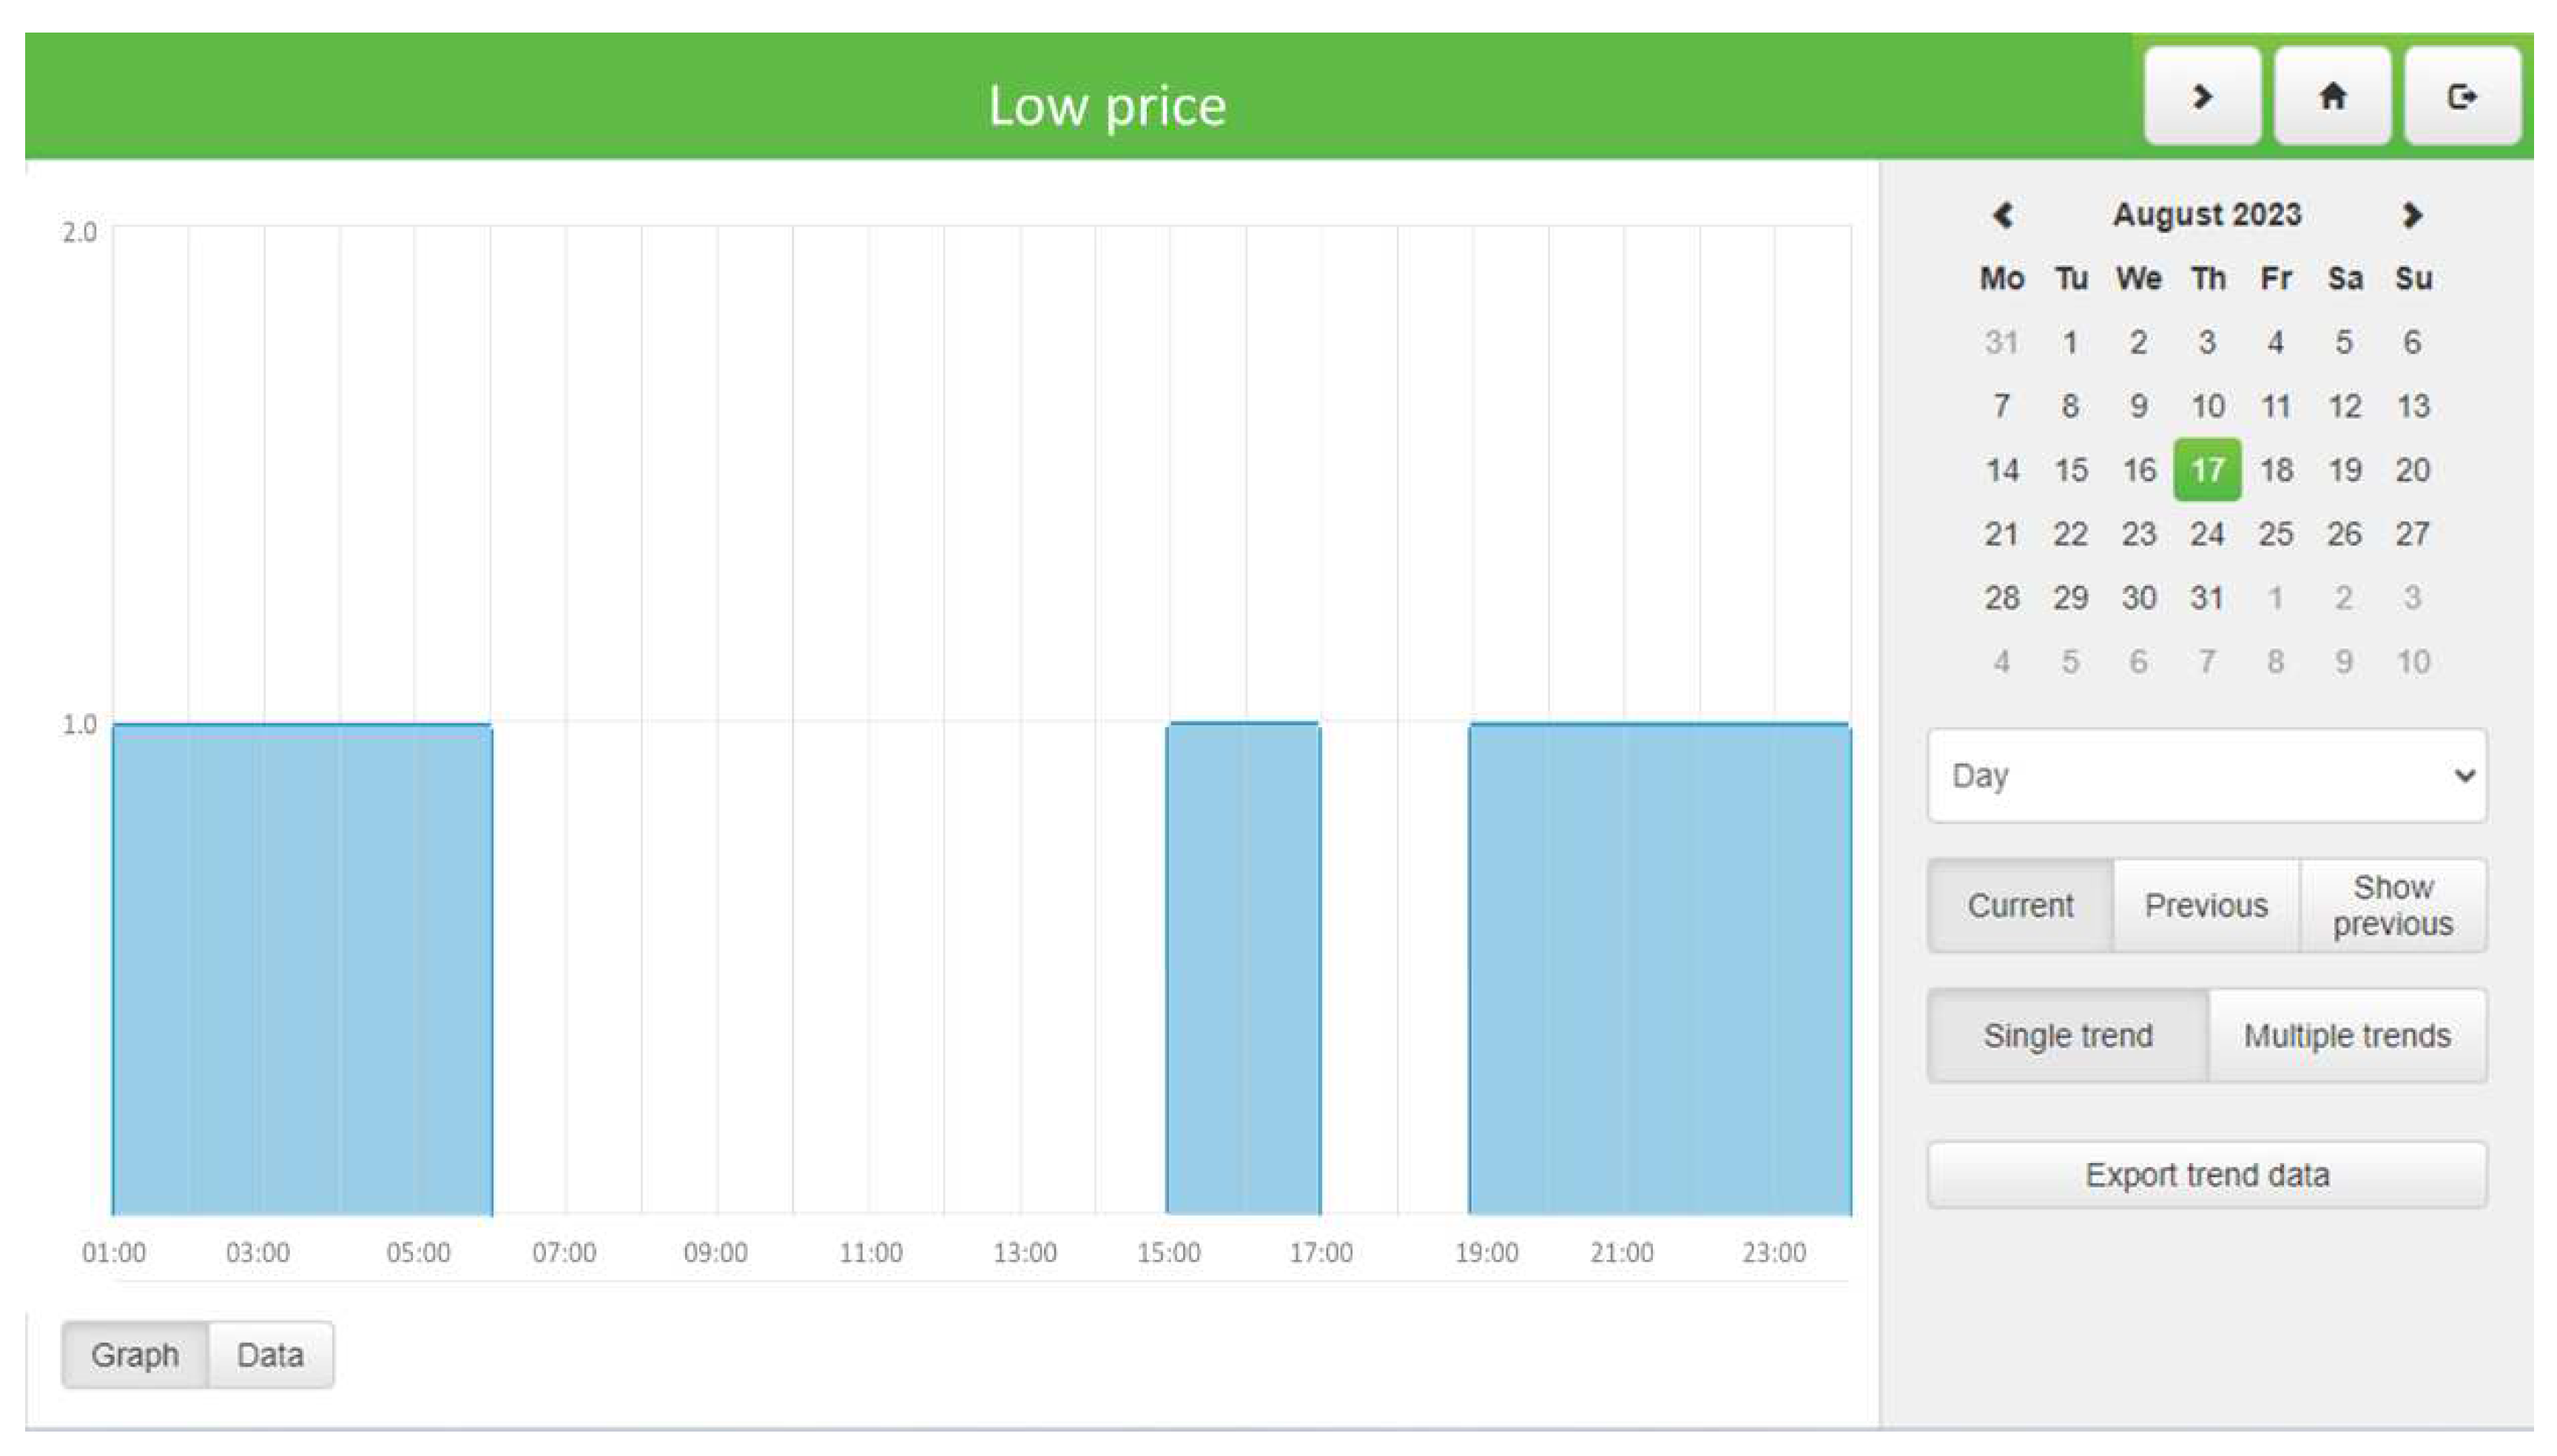
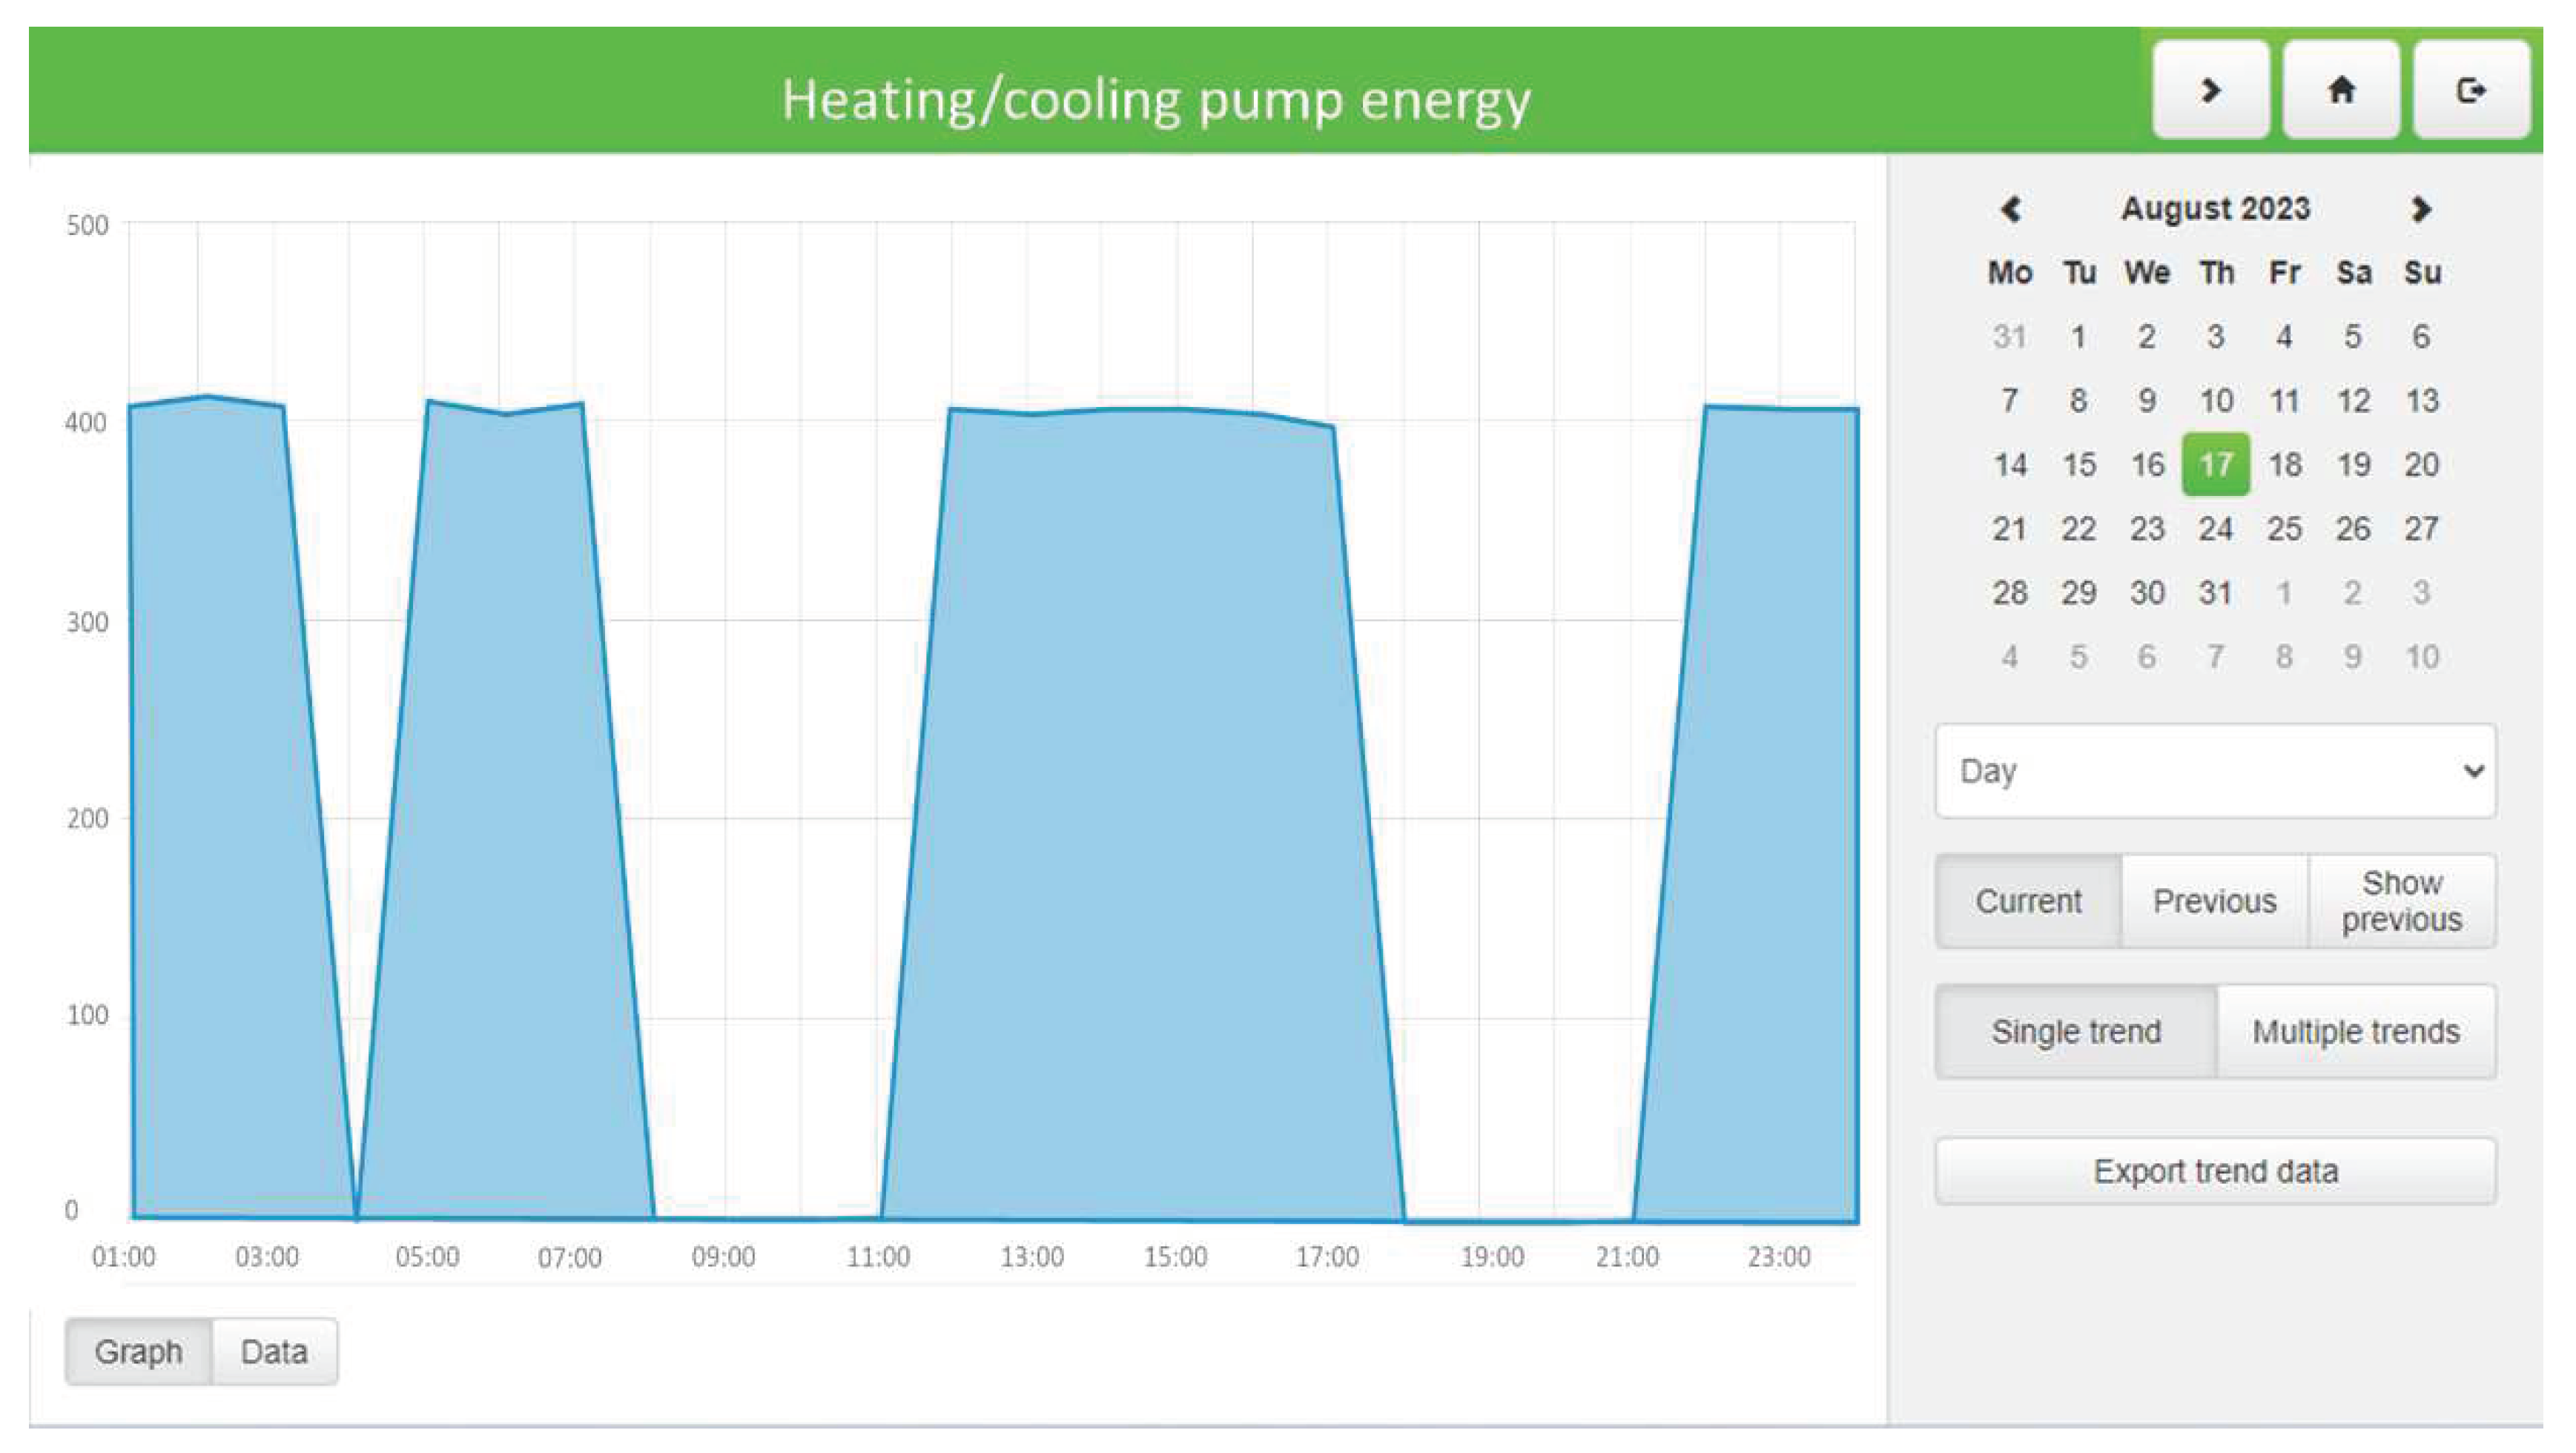
Figure 4 is presented the low and the high electricity price during the day. As one can see the low-price periods are 24:00 – 06:00, 15:00 – 17:00 and 19:00 – 24:00. In the remaining time during the day there is the high electricity price. In the next two figures (
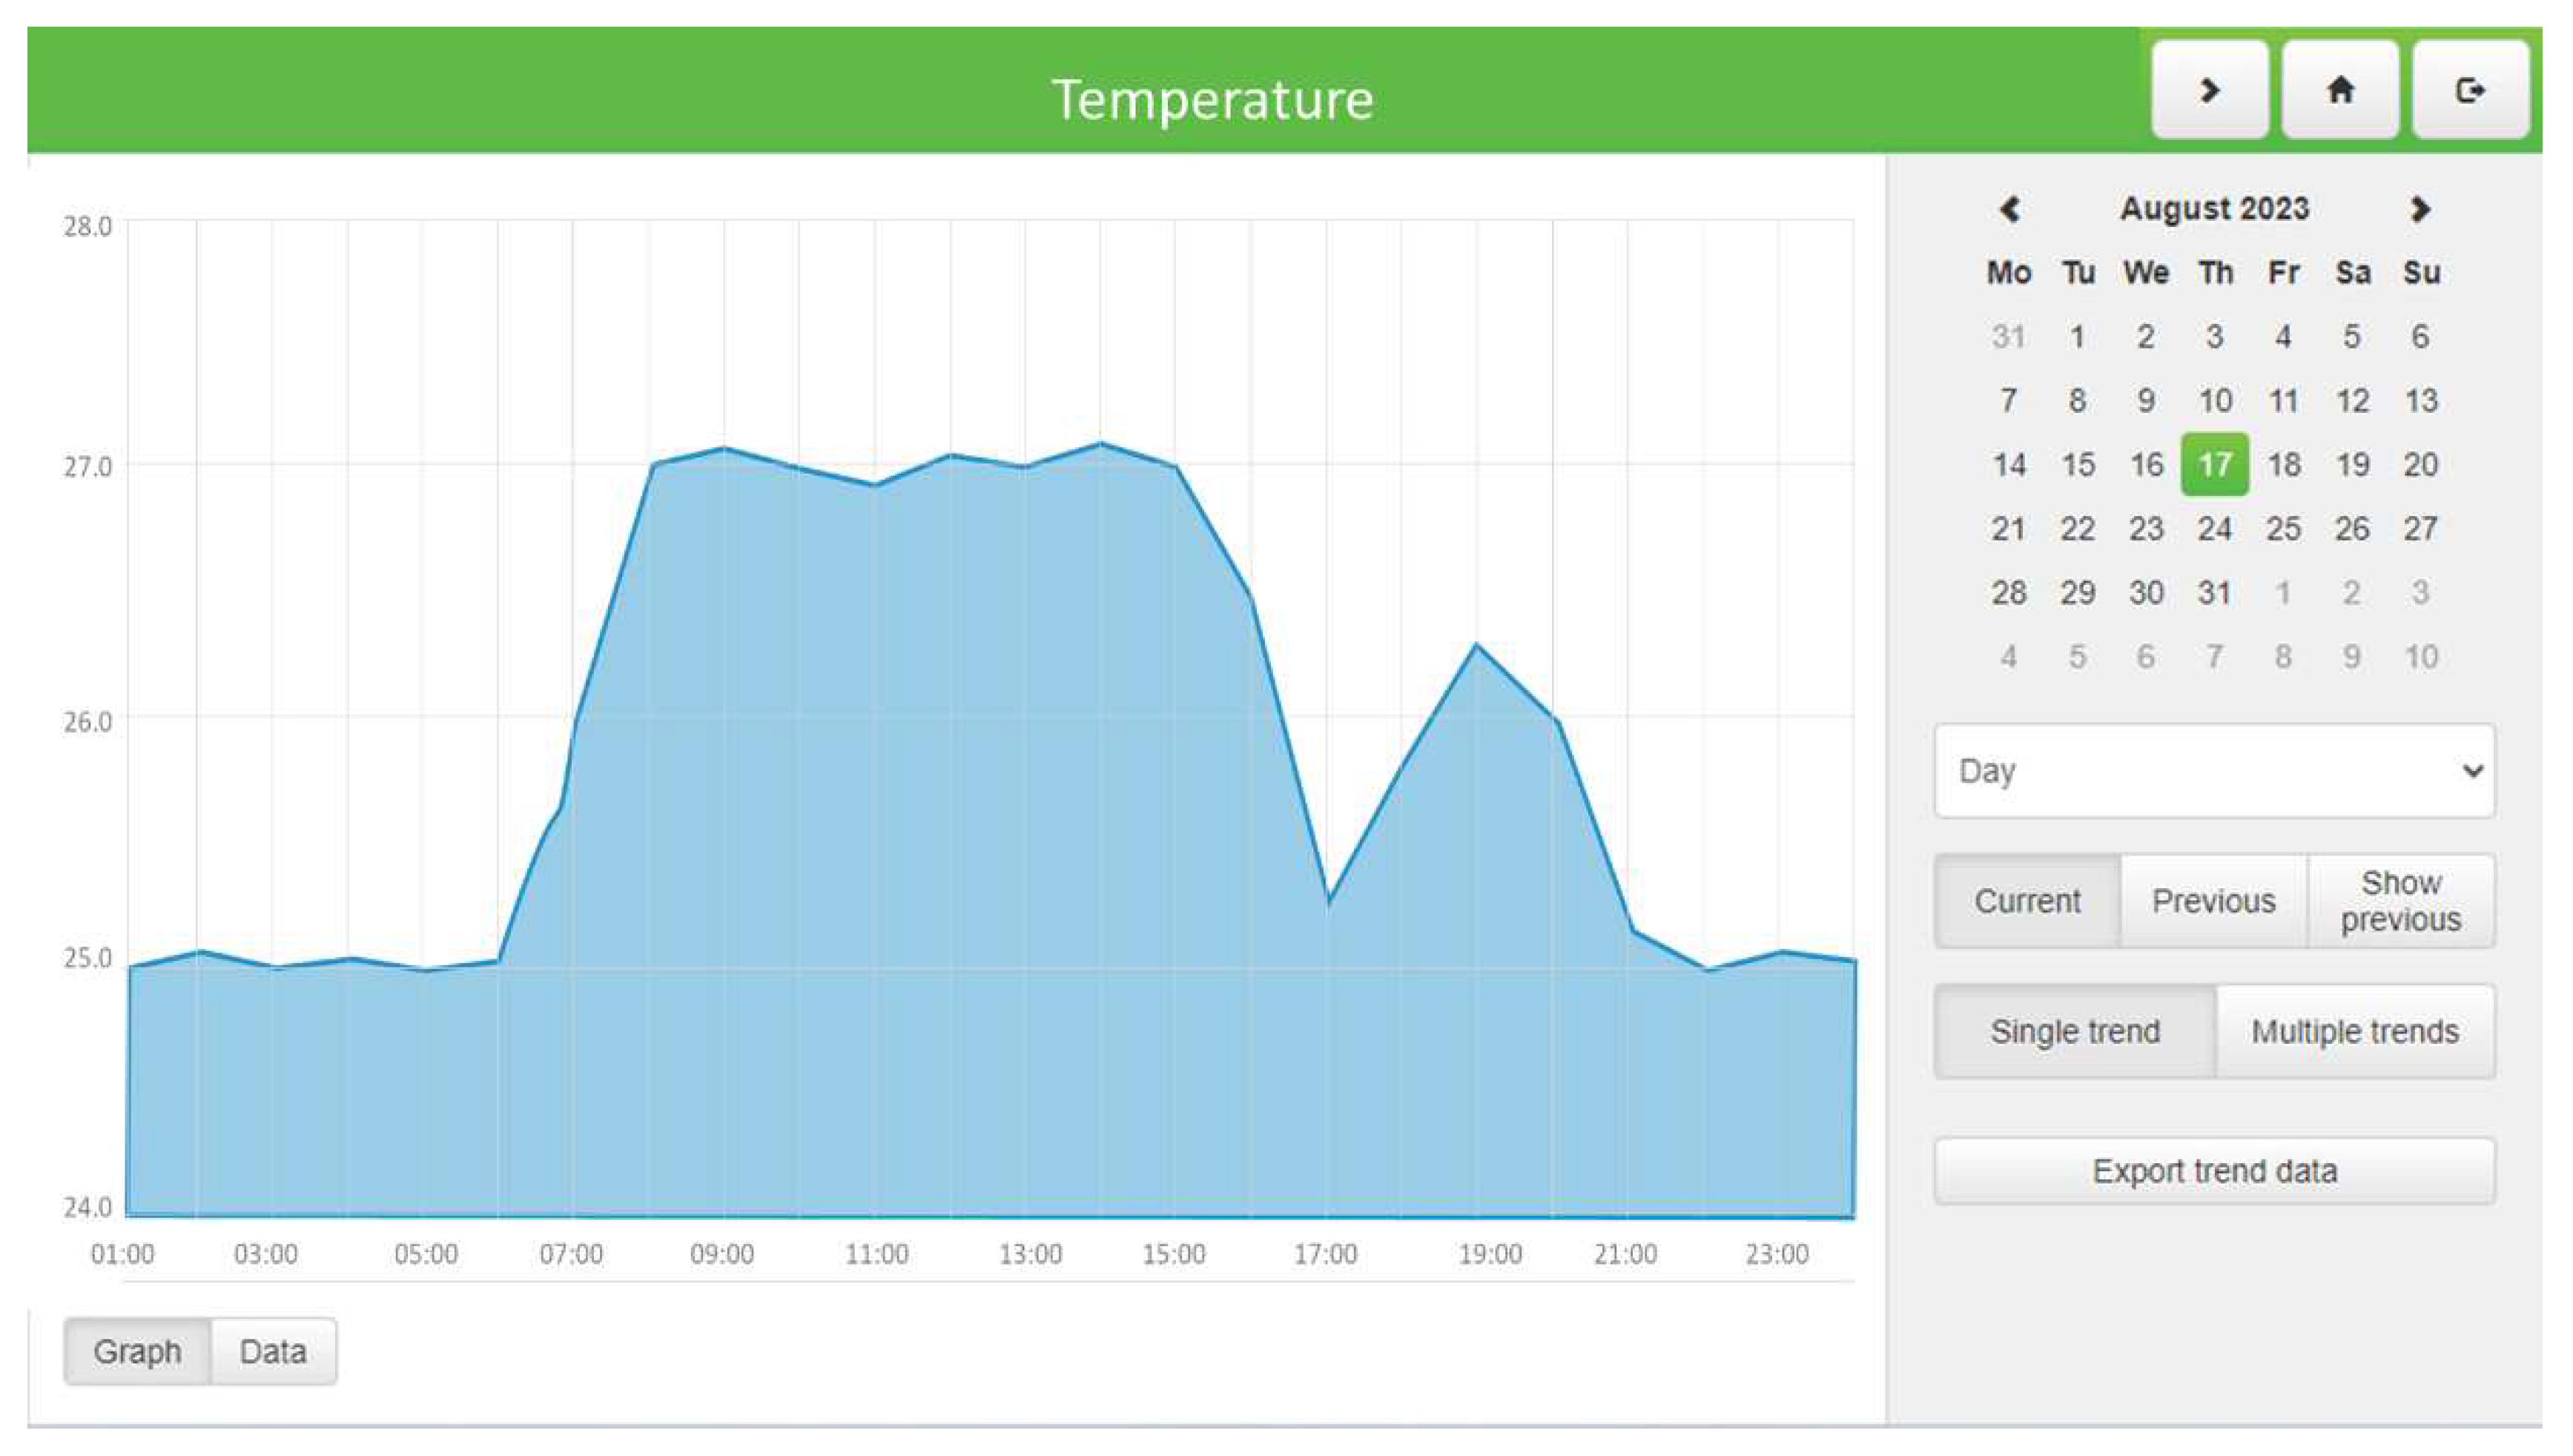
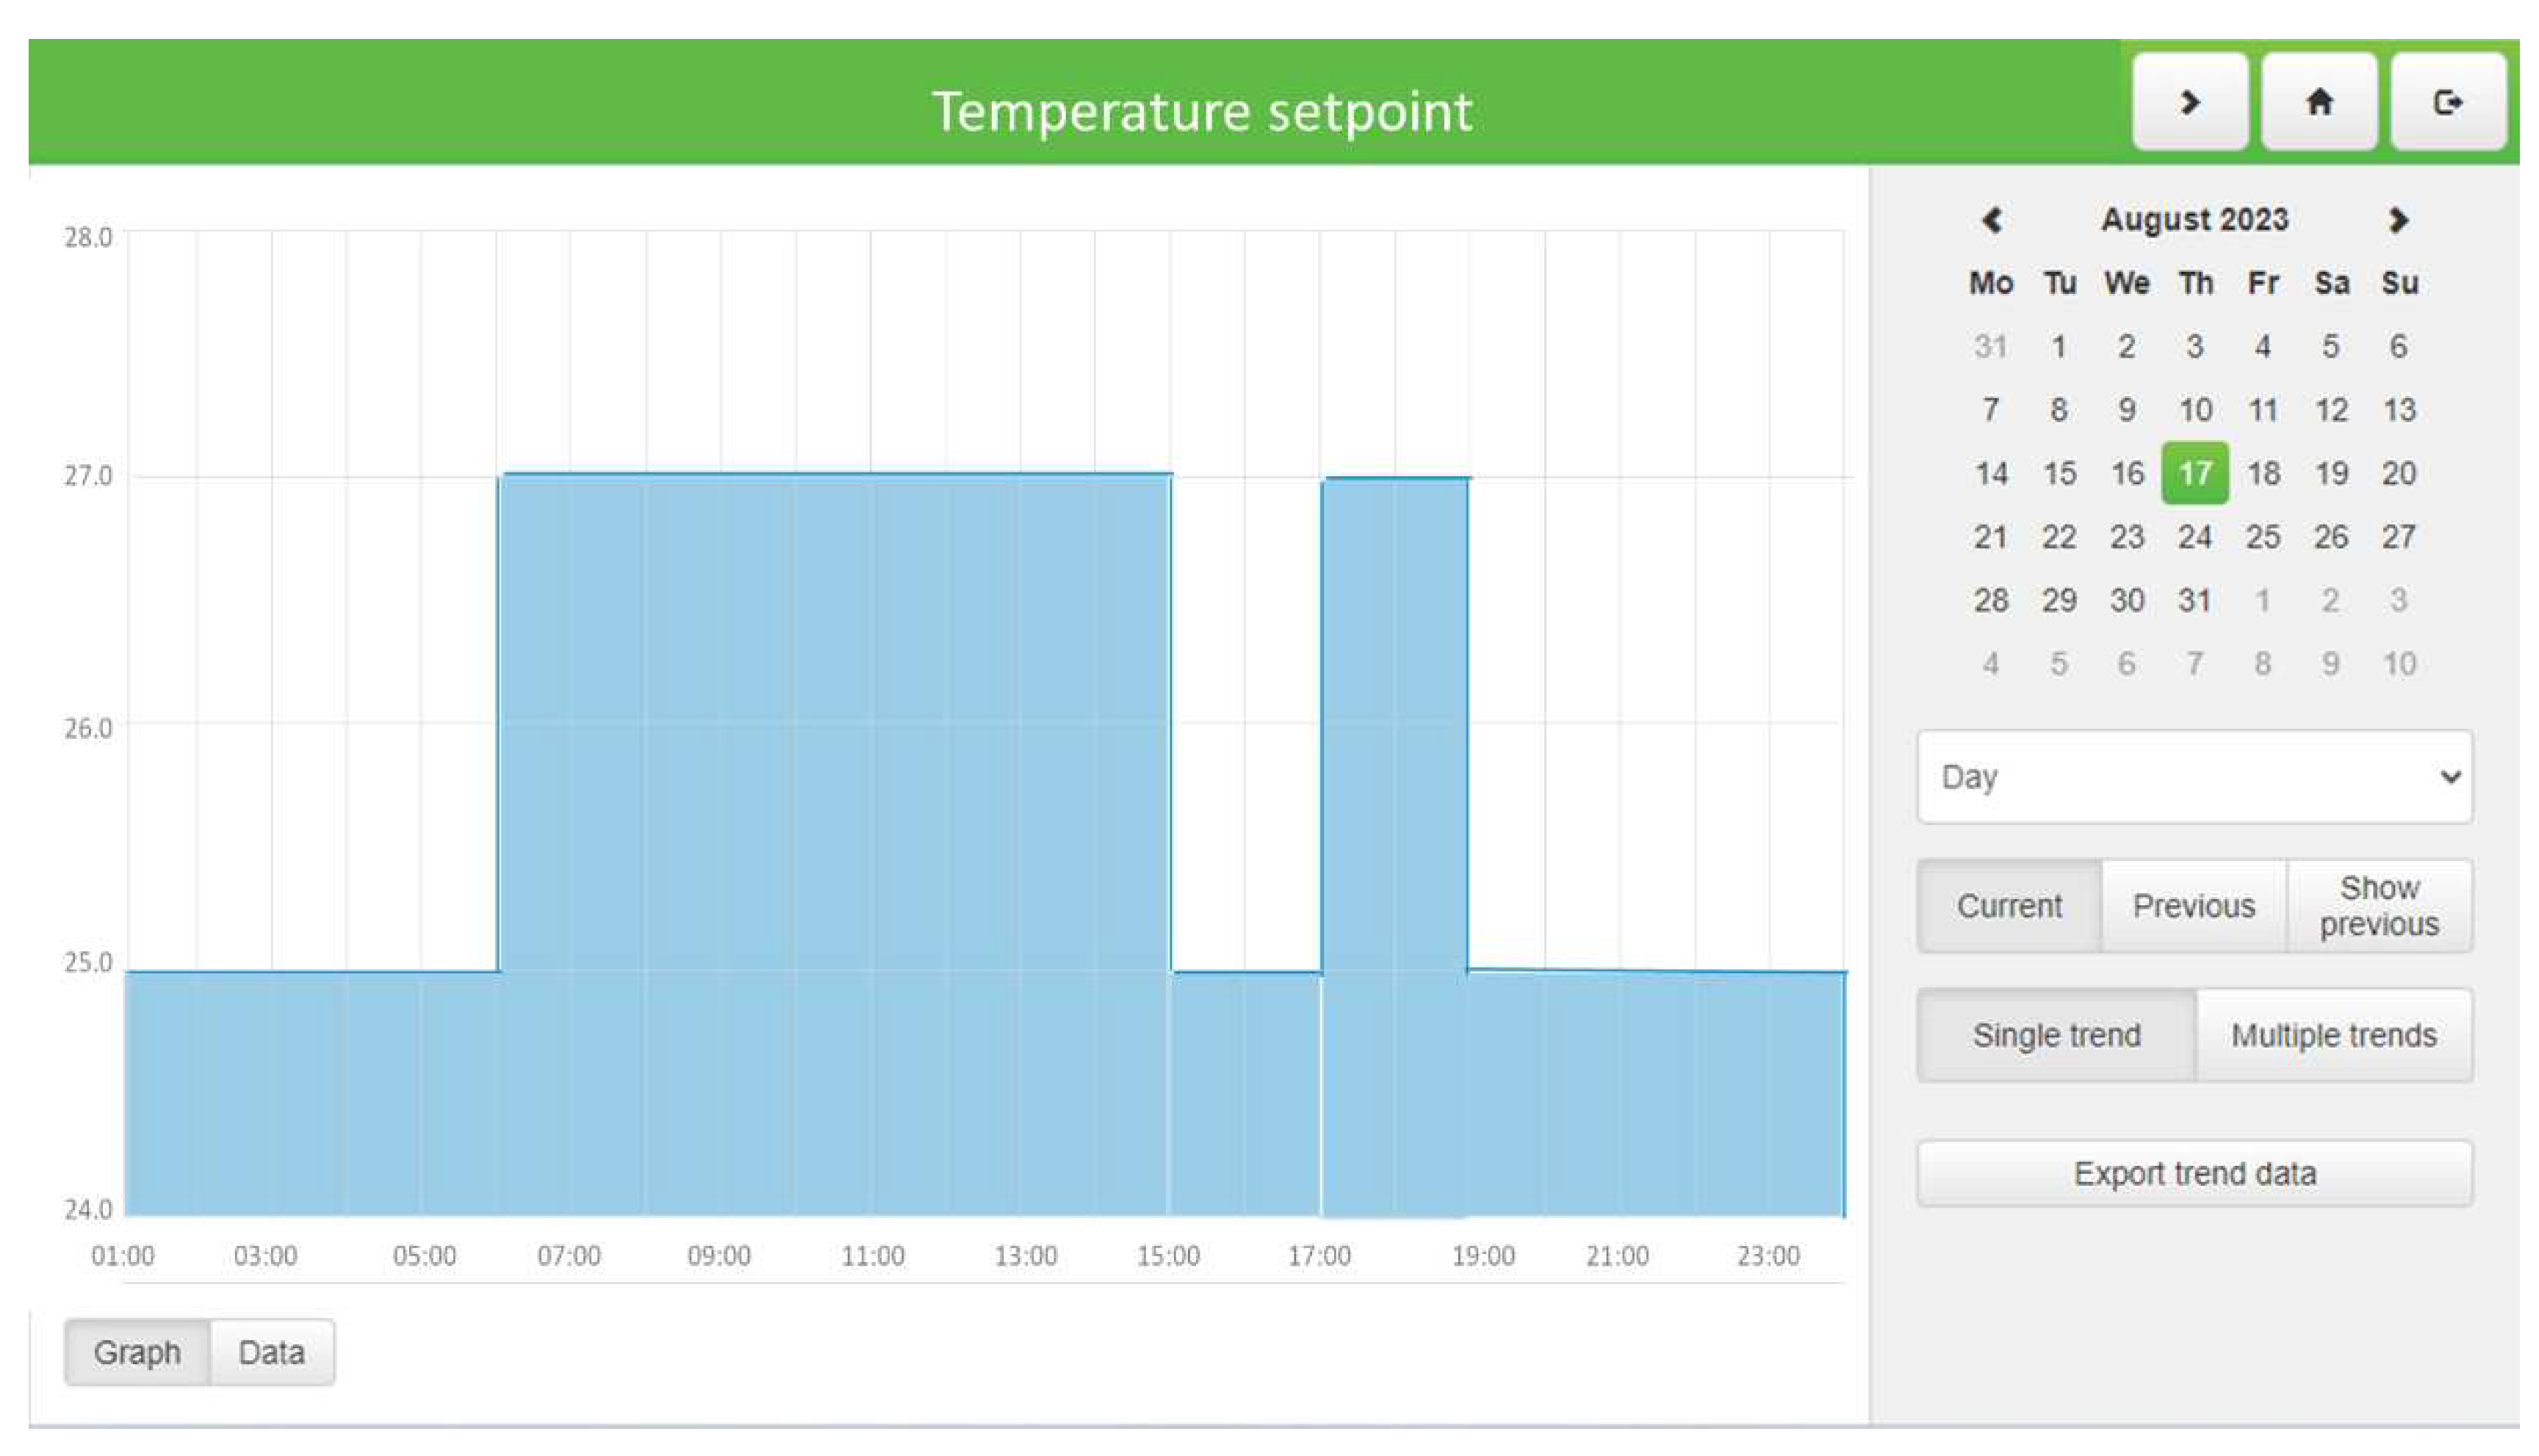
Figure 5 and
Figure 6) we present the temperature setpoint and the room temperature. As one can see, in the low-price periods the temperature setpoint is 25
oC and in the high-price periods the temperature setpoint increases automatically to 27
oC.
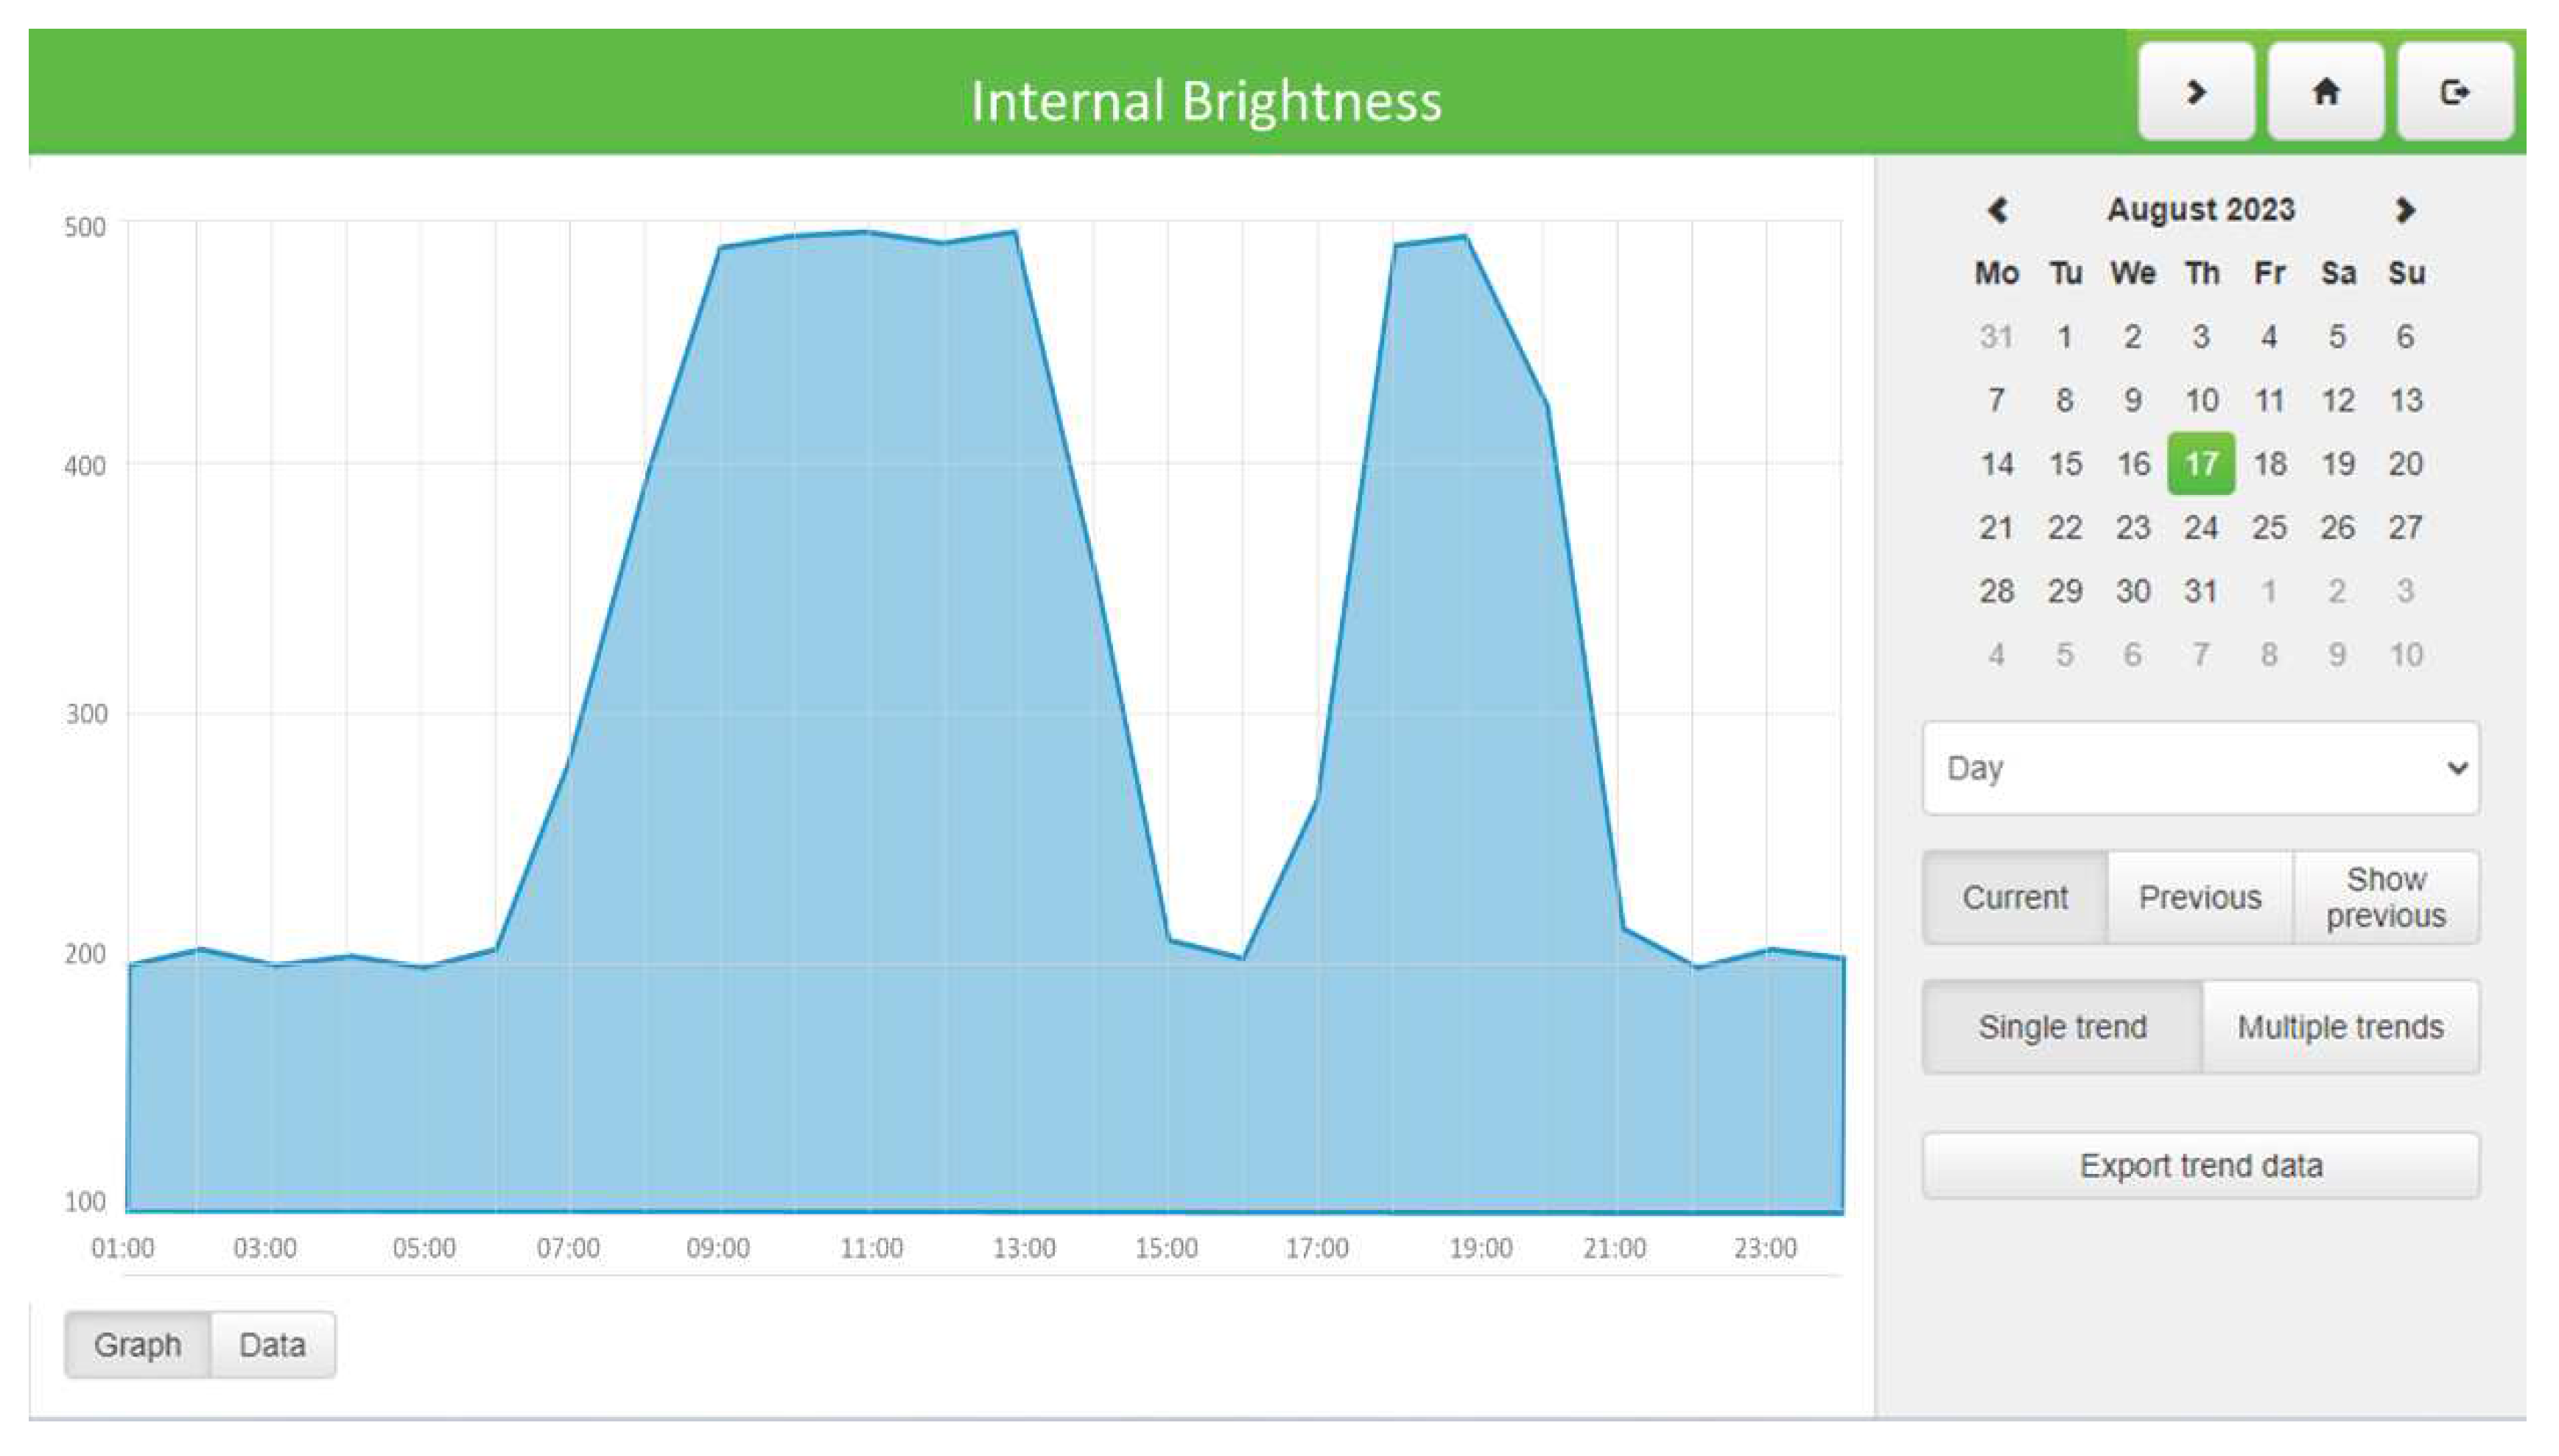
In the next five figures (
Figure 7,
Figure 8,
Figure 9,
Figure 10 and
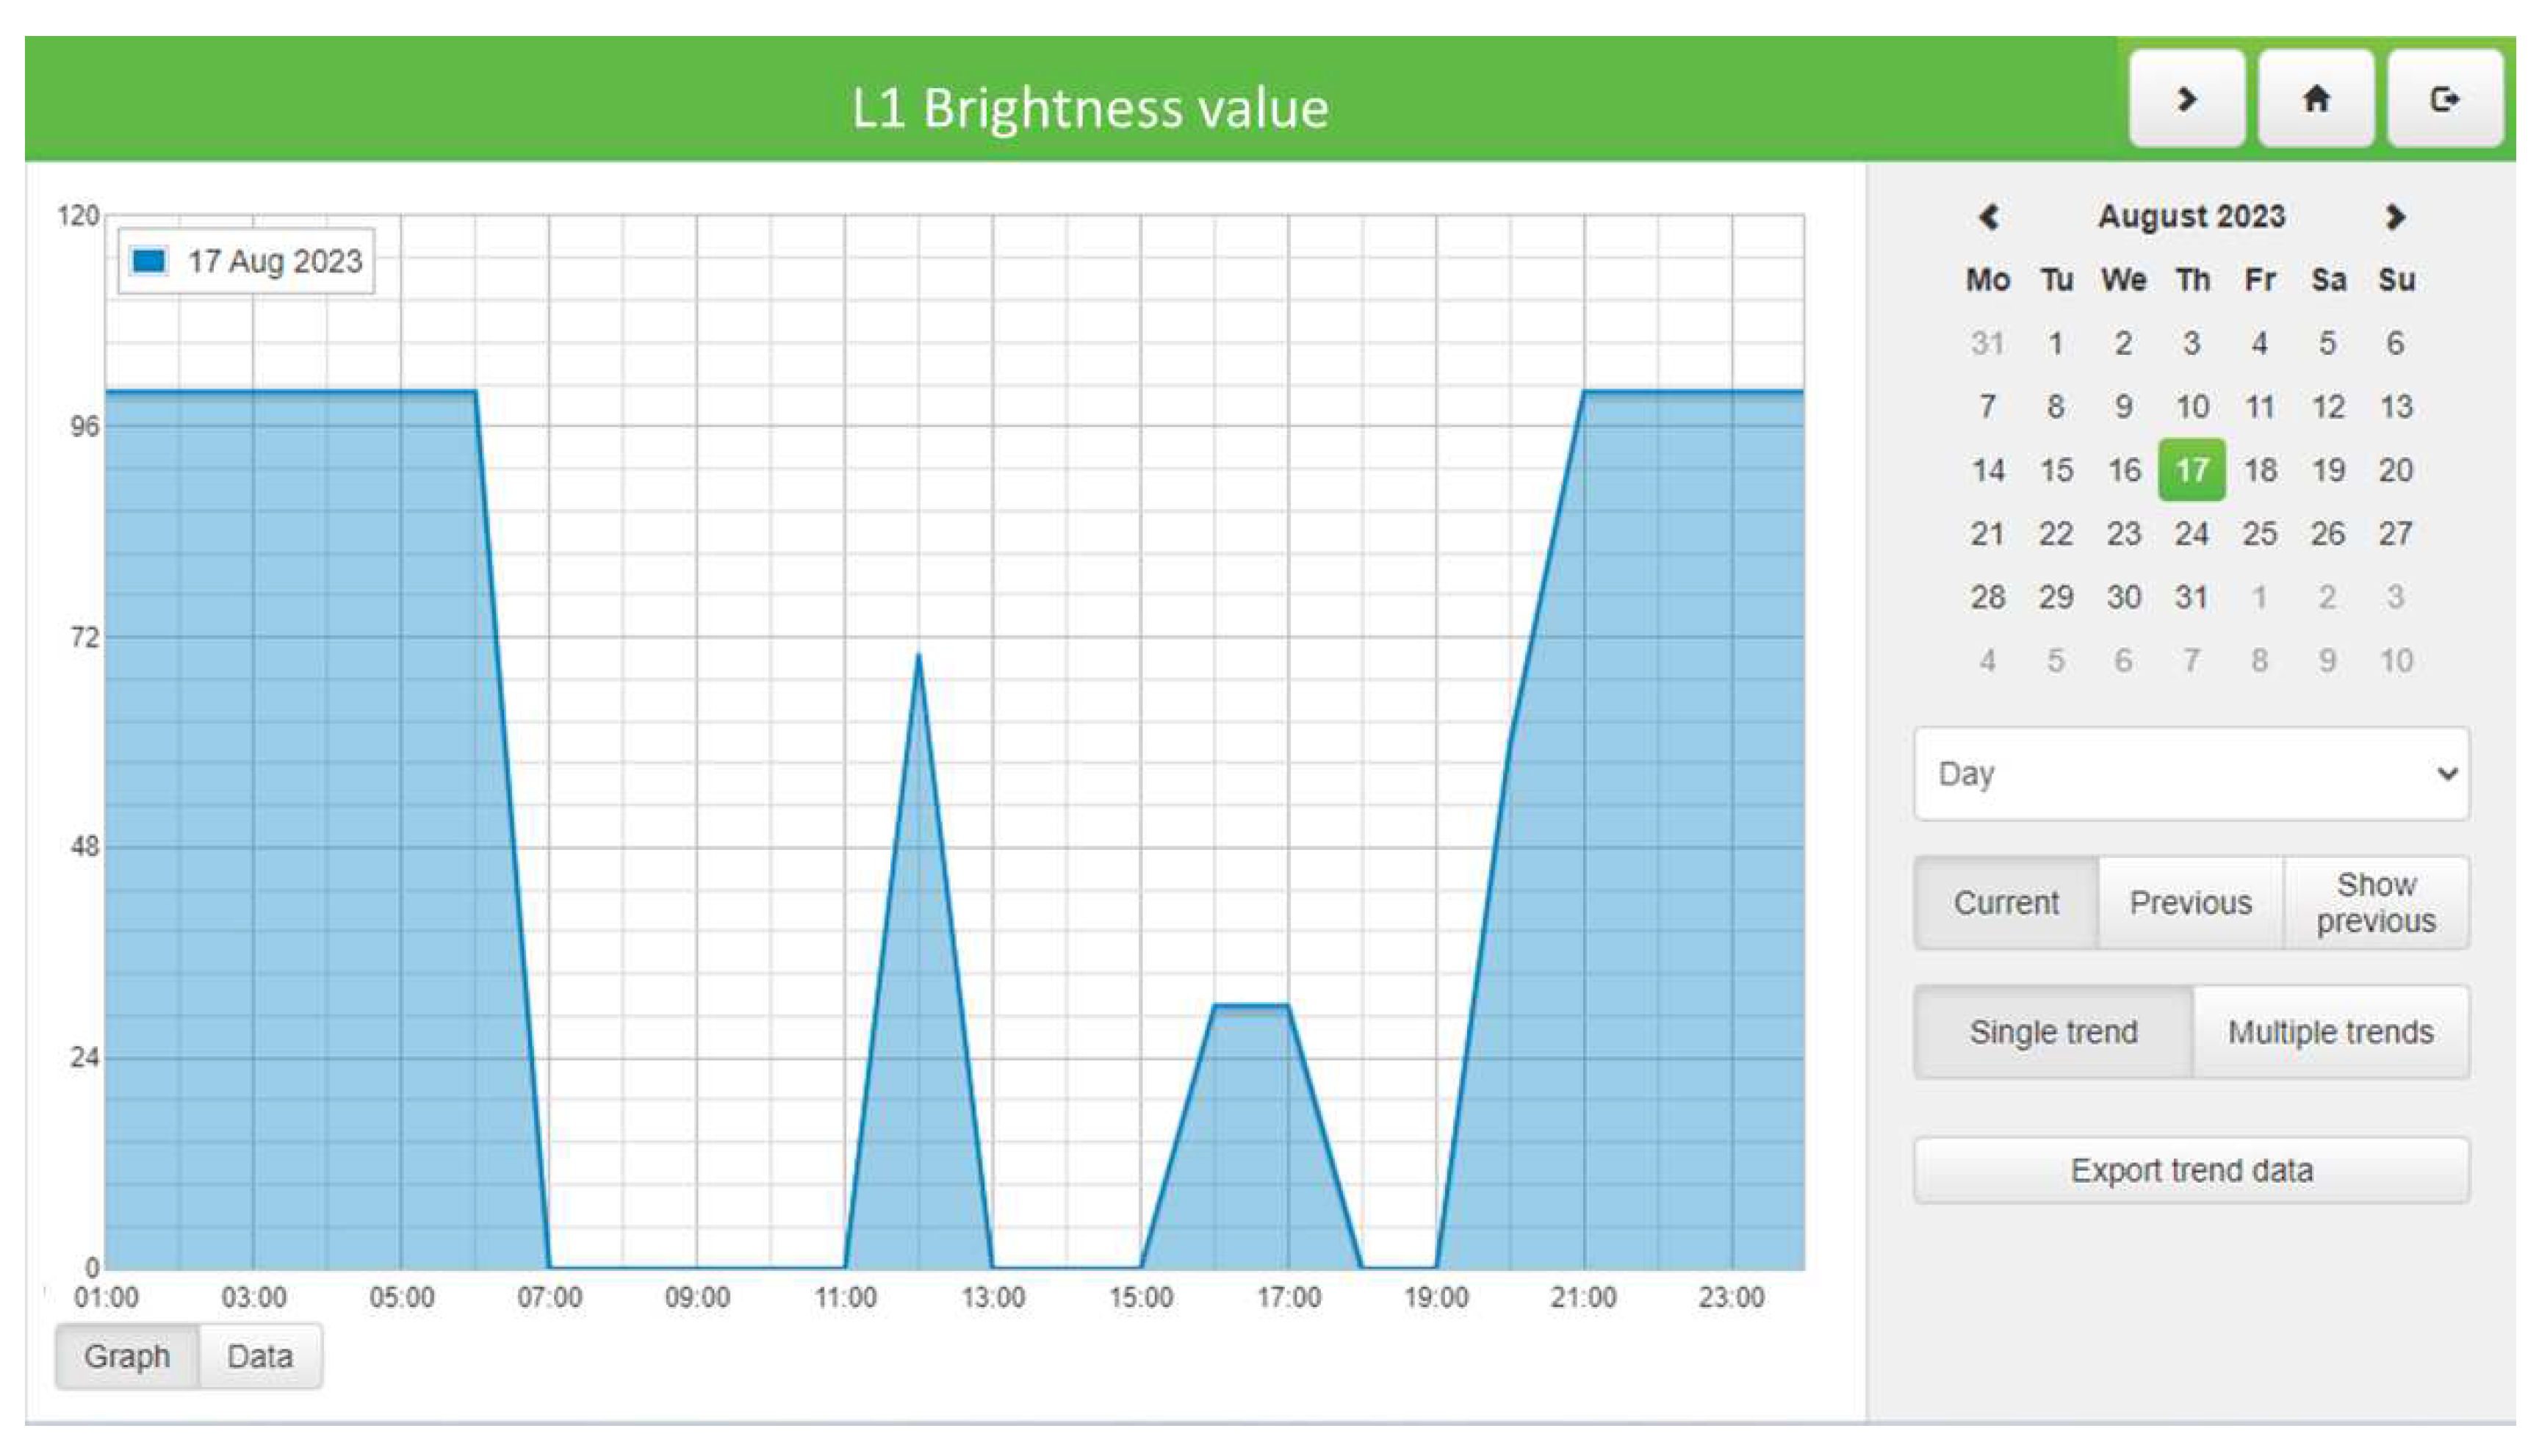
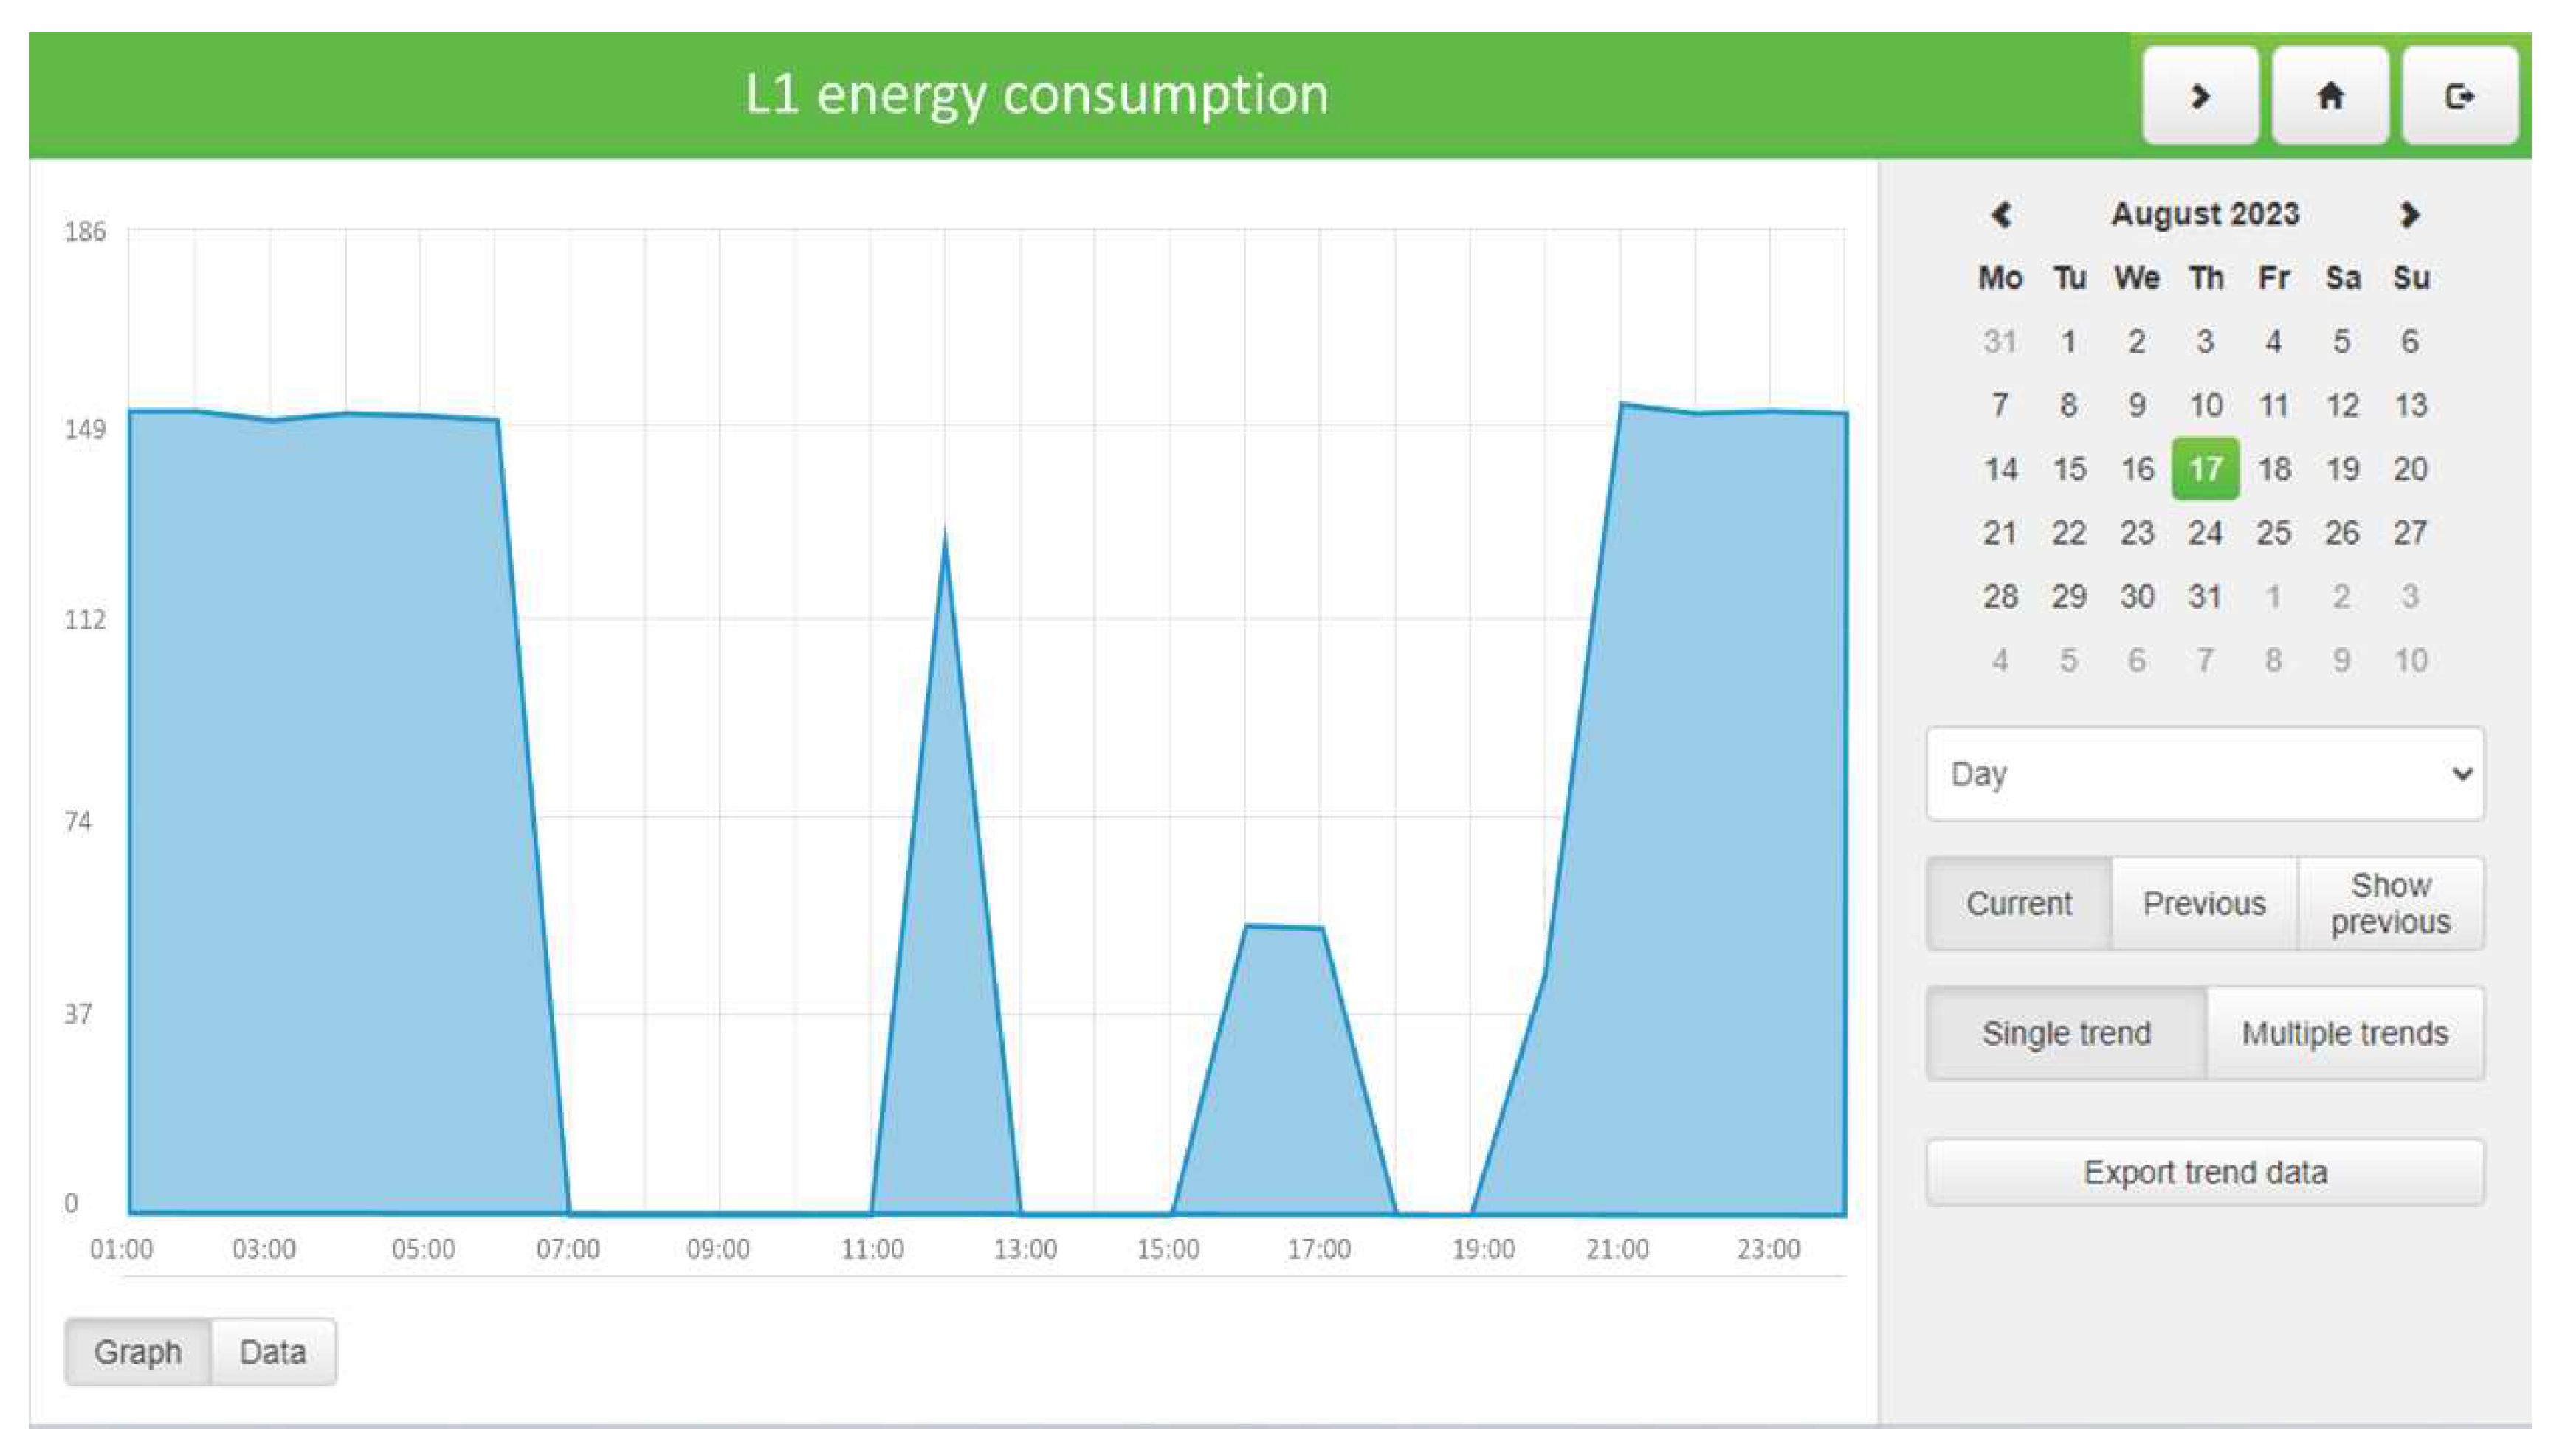
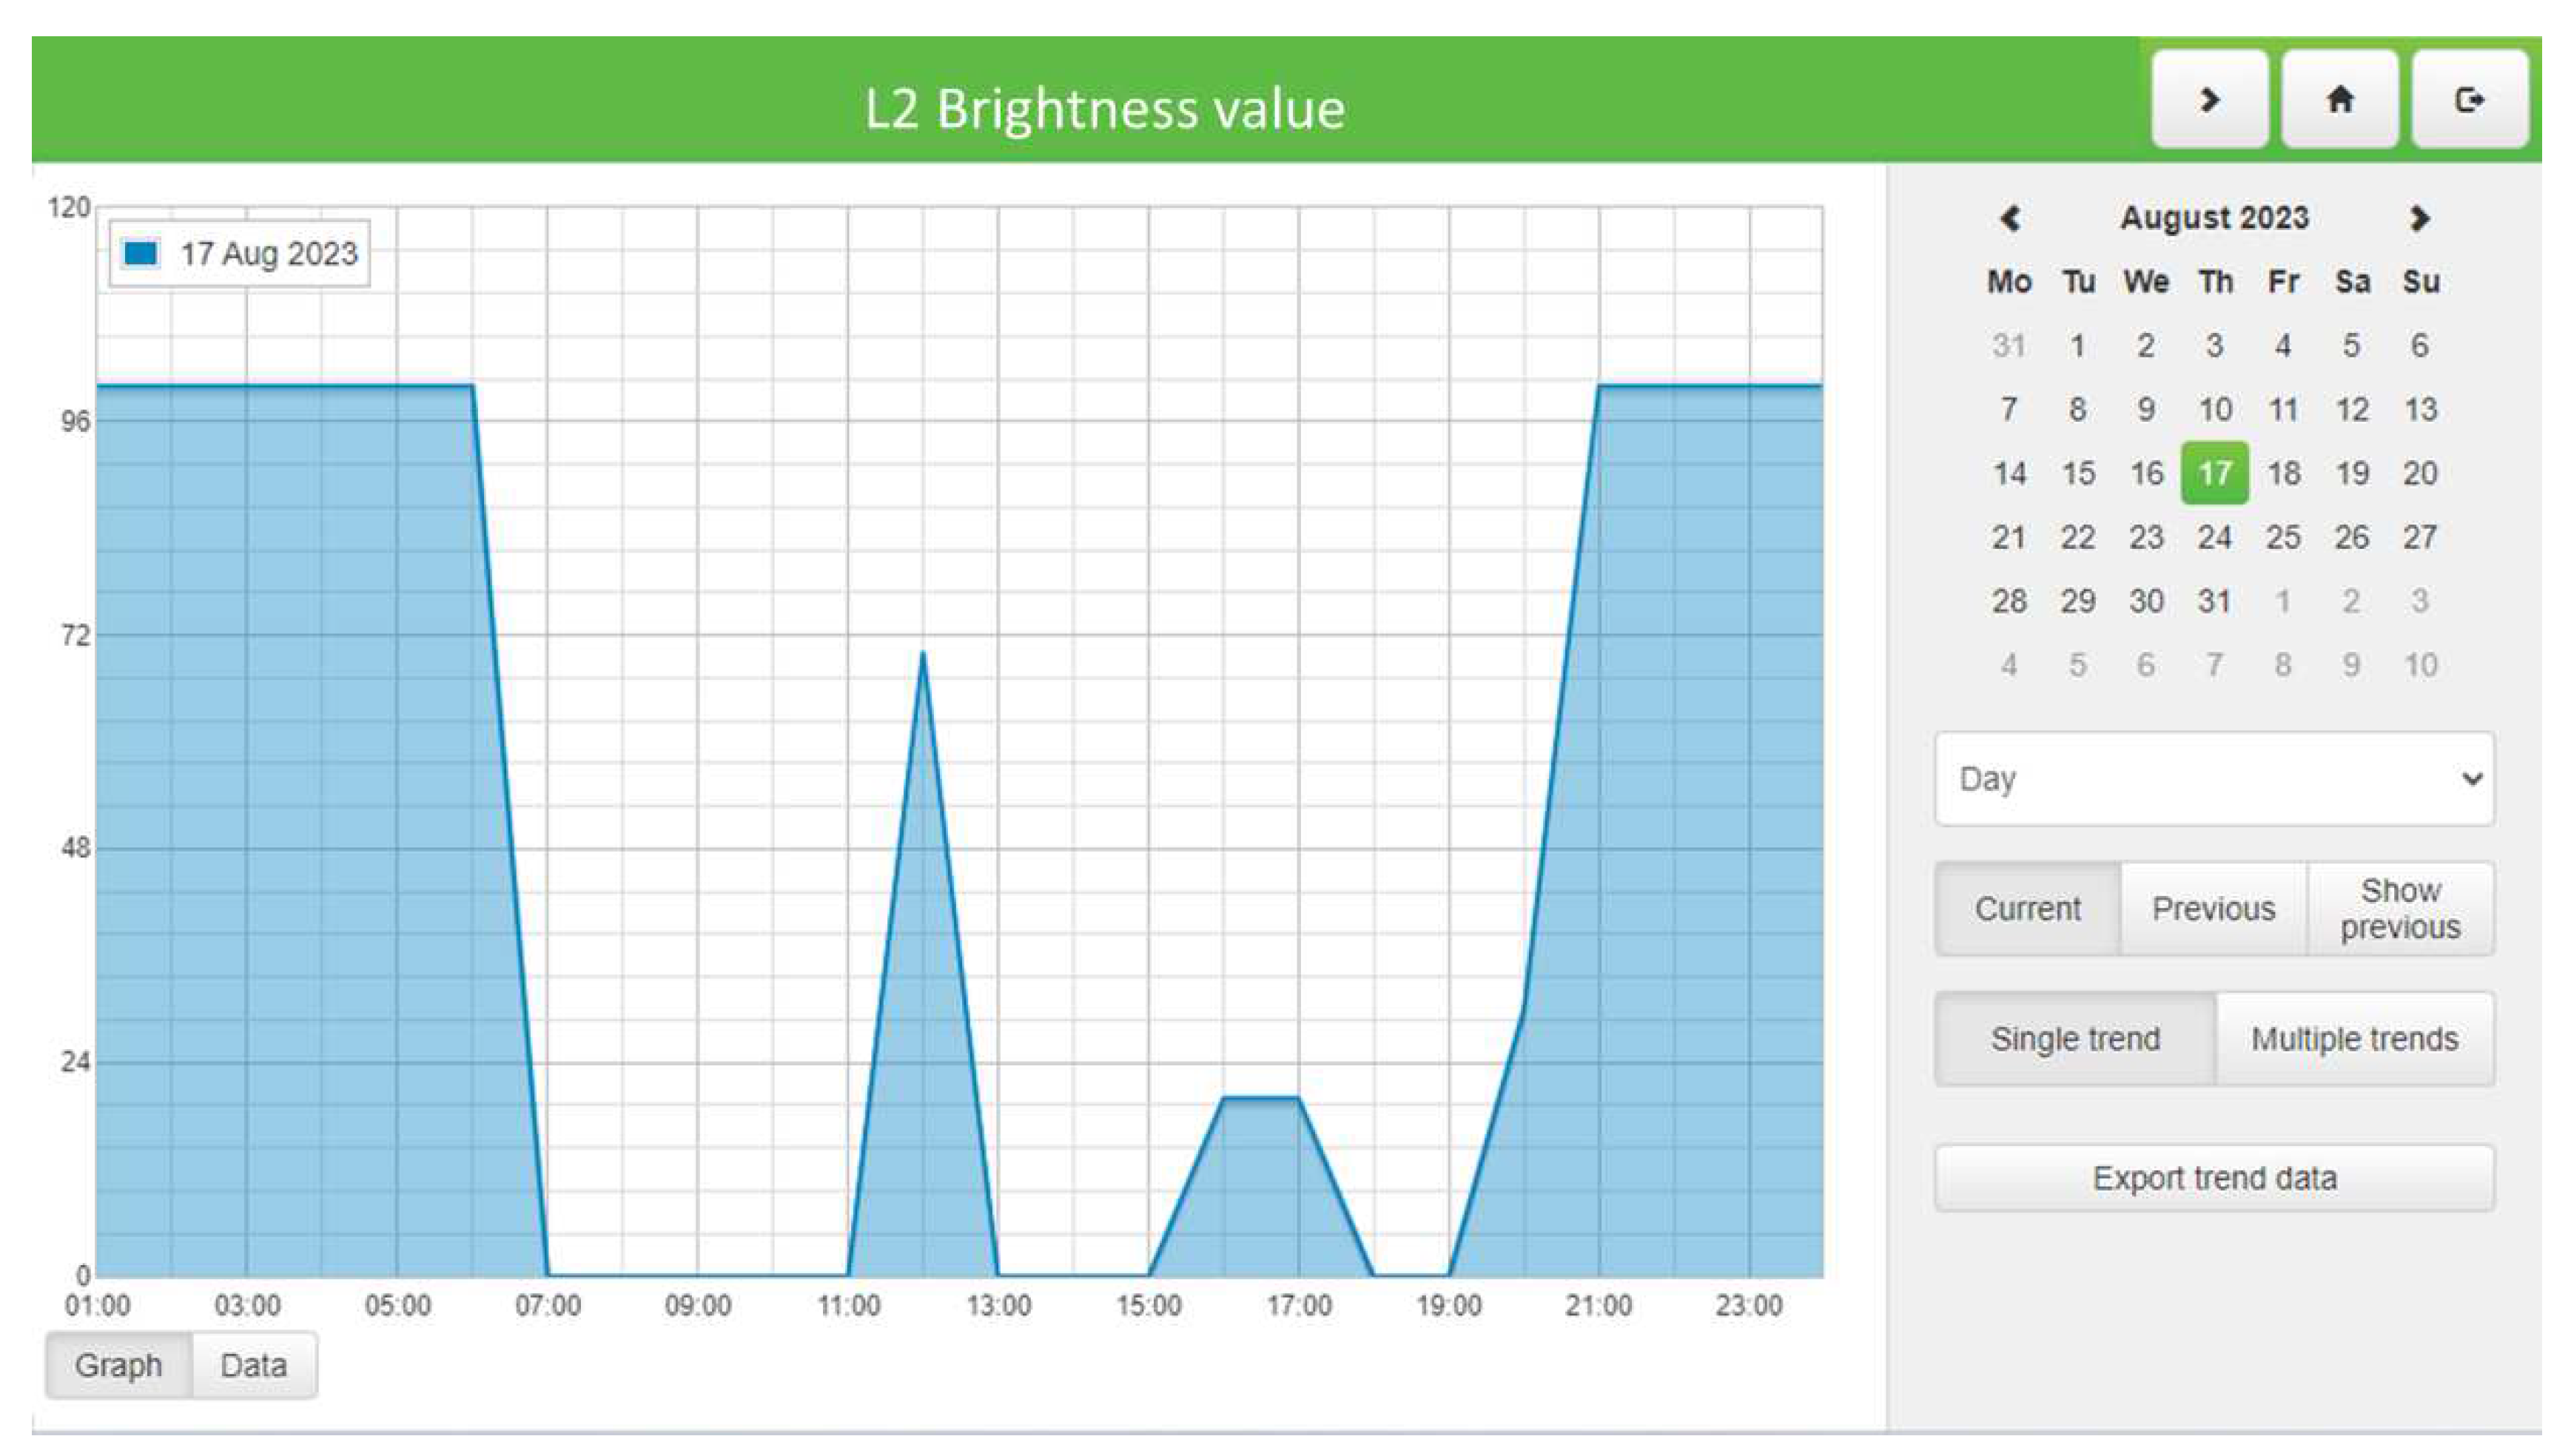
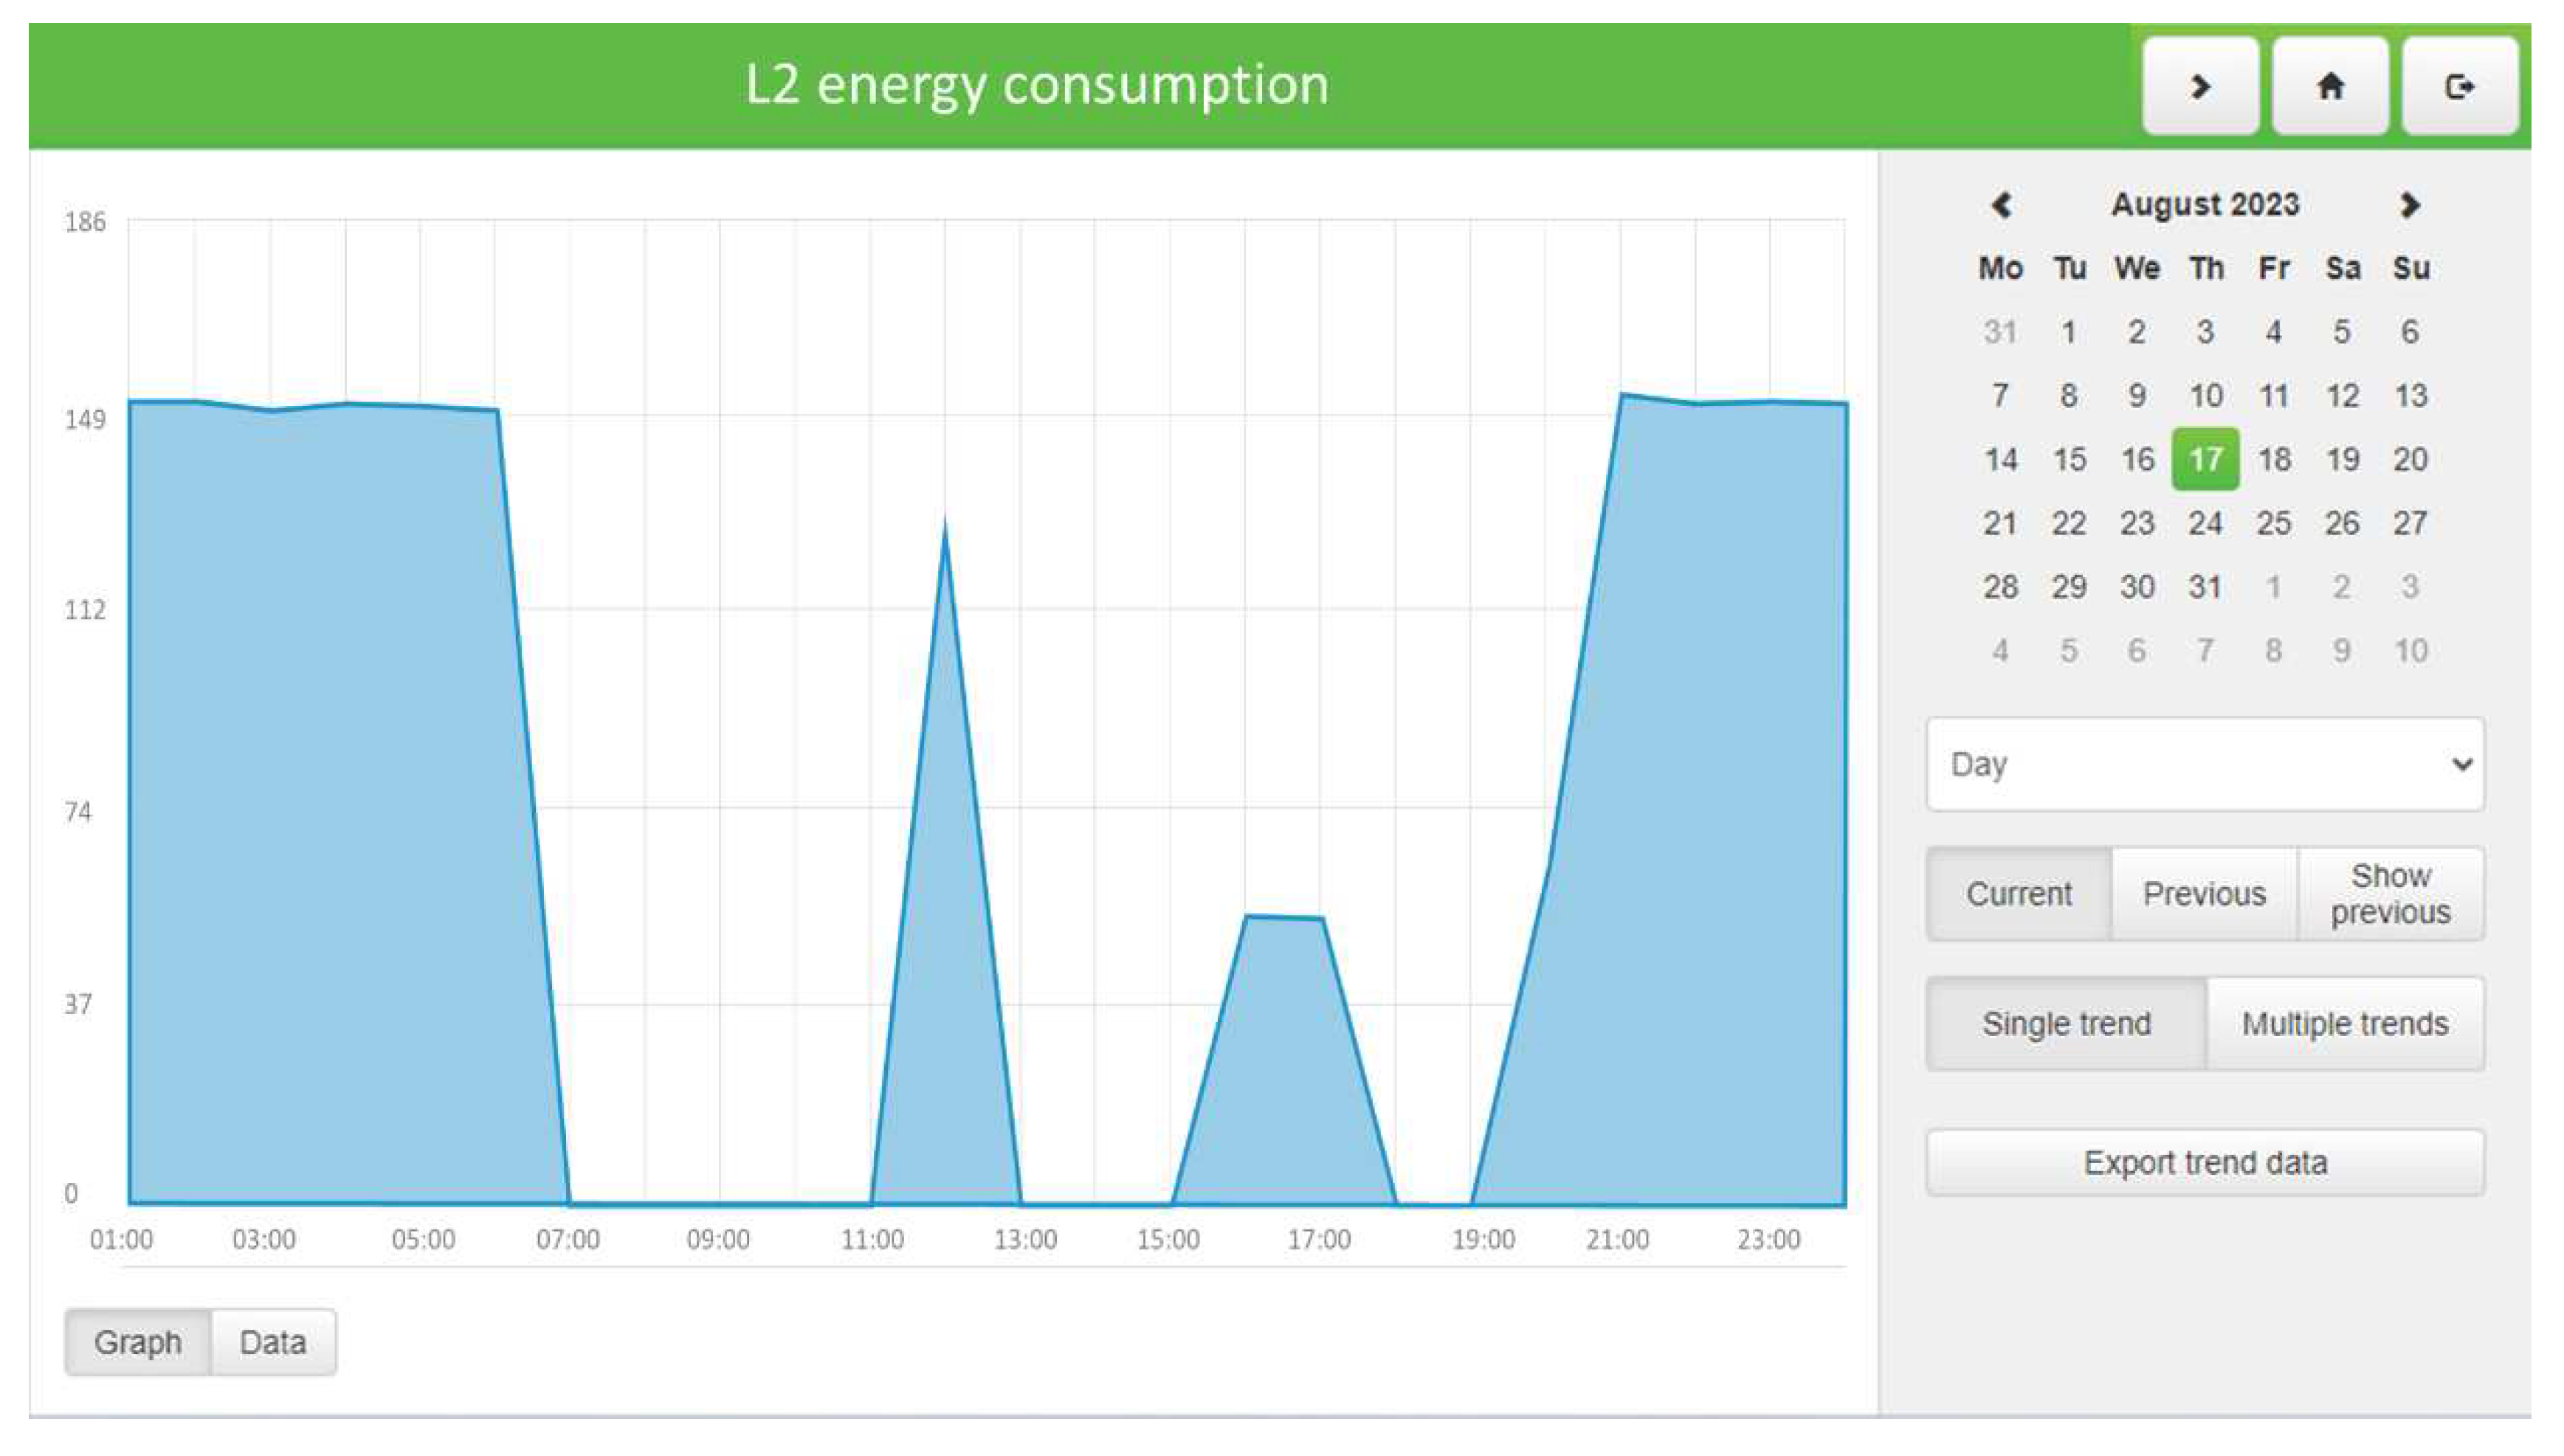
Figure 11) we present the room internal brightness according to the external brightness, the brightness of the lamps L1 and L2 and the energy consumption of the lamps L1 and L2. The lamps L1 and L2 are dimmed up. During the low price and the if the total room brightness is less than 200 lux the lamps are dimmed up at X % brightness as follows: internal brightness + X% brightness = 200 lux.
The
Figure 12 below shows the motor energy consumption individually and the figure presents the motor energy consumption, the room setpoint temperature, the room temperature according to the low price.
In the
Table 3 the results of the first experiment are presented
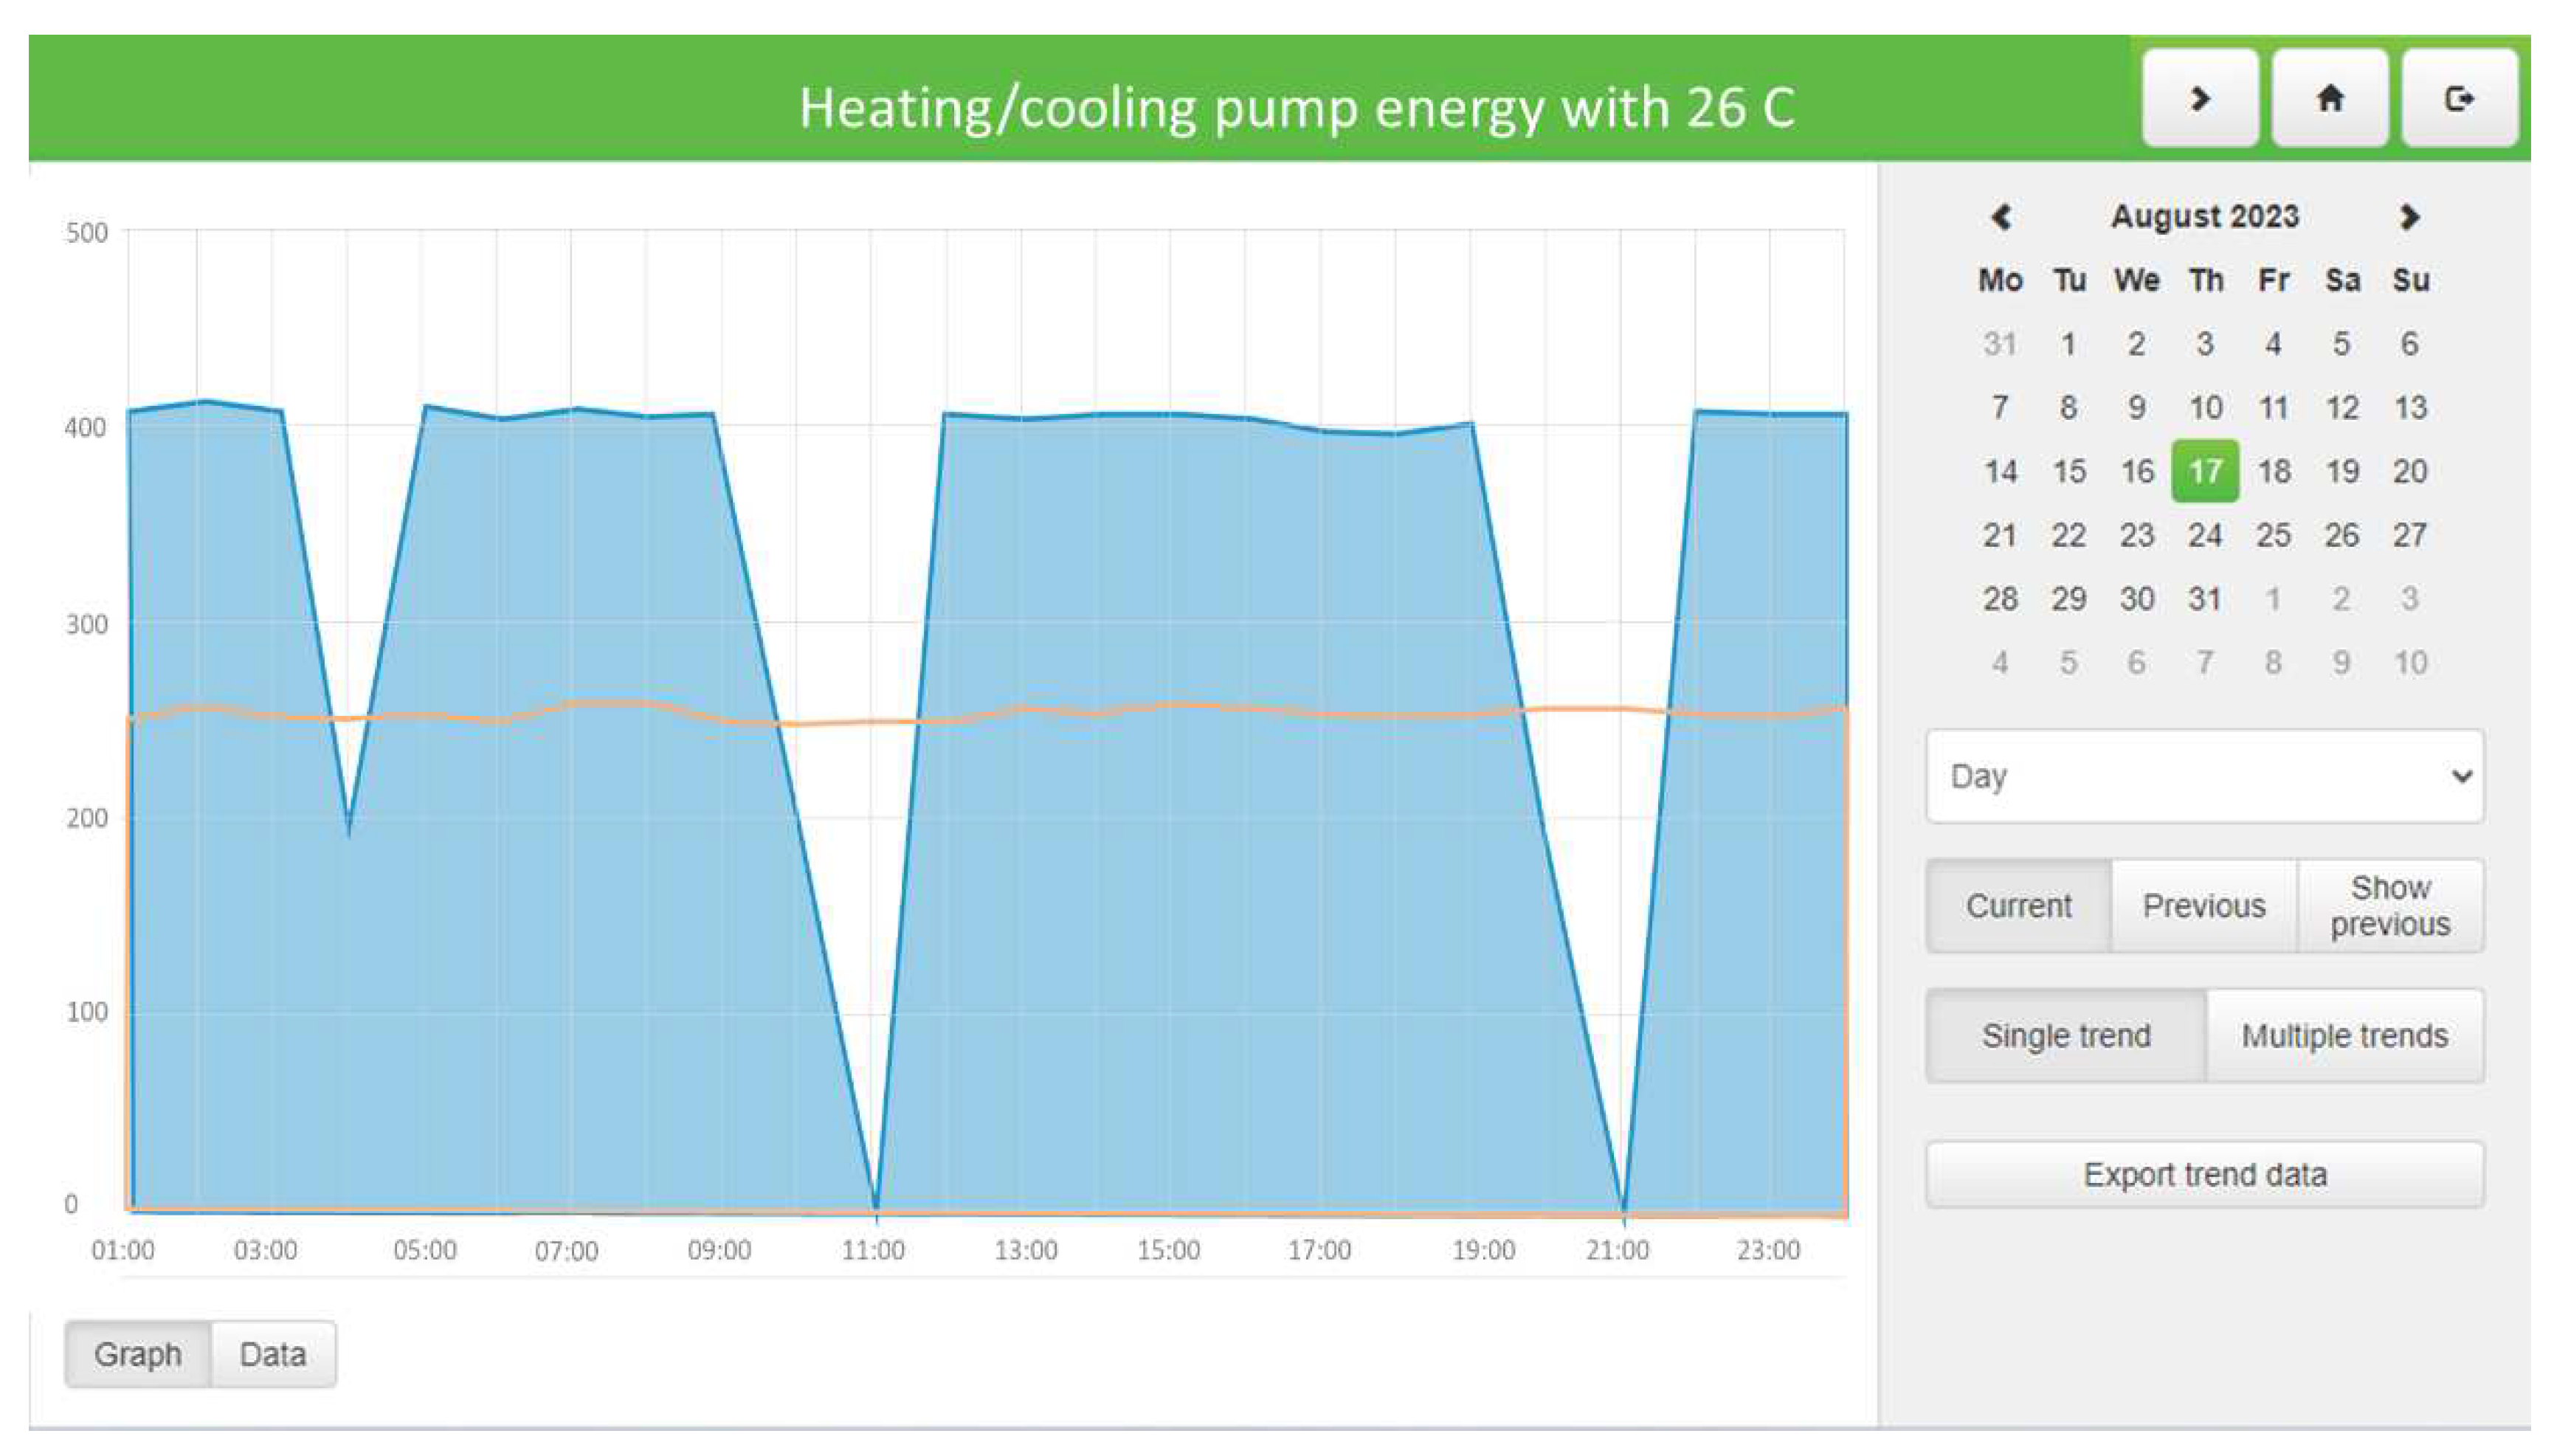
After these results a second experiment is following without the low-price signal and the HomeLynk algorithm. According to this, the energy consumption is presented when the setpoint temperature is always to 26
oC during the day. In the
Table 4 the results of the second experiment are presented.
Figure 14.
Heating/cooling pump energy consumption with temperature setpoint at 26 oC.
Figure 14.
Heating/cooling pump energy consumption with temperature setpoint at 26 oC.
By comparing
Table 3 and
Table 4, the suggested system transfers the selected load (heating/cooling pump) to a time with low electricity prices and the total energy consumption is 217.88Wh with an average room temperature 25.89
oC, instead of 361.91Wh with an average temperature 26
oC.
Taking account only the energy consumption of the heating/cooling pump and an average environmental temperature in the summer of 35 oC, the monthly energy cost savings are too high. The total monthly energy is consumption is lowered to 6,536.4 Wh instead of 10,857 Wh, reducing by 40%.
The suggested BMS schedules the lab appliances based on the tariff category, which changes based on the total accumulated usage during the day. The proposed BMS take two major factors into account in order to provide a comfortable lifestyle for the users. Users can change the ambient temperature to their favorite region. Recent smart homes allow for a variety of room inhabitants. The best schedule of inhabitant rooms, i.e., the comfort zone, is determined and advised to home owners. The area covered by a heating/cooling pump (chiller) is simply adjusted to minimize energy consumption by designating comfort zones, i.e., room/rooms that vary depending on the available tariff category. Second, all appliances can be switched manually to satisfy the sudden wants of home residents.
4. Discussion
The next steps of the research of the authors include the integration of energy storage (14,4 kWh batteries and 2 hydrogen fuel cells of 1,1 kWs each) into the microgrid, which will also be controlled by KNX decentralized algorithms, highlighting also the impact of energy storage in grid stability and grid ancillary services indices, as well as comfort indices. Installing a battery will increase probably the economic benefits of the home PV system. Vehicle-to-home will be studied also as an alternative source for smart homes. Therefore, there will be economic benefit of using electric vehicle batteries as a home source with the studied slab tariff.
5. Conclusions
Many developing countries, including Greece, use IBR tariffs for residential structures or "homes." There have been no significant studies on this popular tariff in relation to smart homes.
The suggested BMSs rely primarily on a load-shifting technique, which moves controllable loads to low-cost periods to avoid high loading during peak hours. Many BMSs minimize some loads, such as heating/cooling pumps and lighting, to reduce total spent energy. All of these options were investigated for the IBR pricing structure.
This research looks at a developing country's household energy system that uses the Greek block-rate tariff.
Because of the block-rate tariff structure, shifting loads such as heating/cooling pumps and lighting has a small influence on total electrical cost. The total monthly cost could be reduced to 40% of the default value..
References
- H. Laaksonen, K. Kauhaniemi, S. Voima, Microgrid voltage level managementand role as part of smart grid voltage control, in: IEEE PowerTech 2011, Trond-heim, Norway, 2011.
- K. De Brabandere, K. Vanthournout, J. Driesen, G. Deconinck, R. Belmans, Controlof microgrids, in: IEEE Power Engineering Society General Meeting, 2007.
- A.P. Meliopoulos, G. Cokkinides, R. Huang, E. Farantatos, S. Choi, Y. Lee, X. Yu,Smart grid technologies for autonomous operation and control, IEEE Trans.Smart Grids 2 (1) (2011) 1–10. [CrossRef]
- H. Laaksonen, P. Saari, R. Komulainen, Voltage and frequency control of inverterbased weak LV network microgrid, in: International Conference of FuturePower Systems, 18 November, 2005, Amsterdam, The Netherlands, 2005, pp.1–6.
- K.D. Brabandere, A. Woyte, R. Belmans, J. Nijs, Prevention of inverter volt-age tripping in high density PV grids, in: Proc. 19th Photovoltaic Solar EnergyConference, 7–11 June, 2004, Paris, France, 2004.
- T. Kottas, D. Stimoniaris, D. Tsiamitros, V. Kikis, Y. Boutalis, E. Dialynas, Newoperation scheme and control of smart grids using fuzzy cognitive networks,in: IEEE PowerTech 2015 Conference, 29 June–2 July, 2015, Eindhoven, TheNetherlands, 2015, pp. 1–5.
- M.A. Zehir, A. Batman, M. Bagriyanik, An event-driven energy managementsystem for planned control of thermostatic loads, in: IEEE PowerTech 2013Conference, 16–20 June, 2013, Grenoble, France, 2013.
- T.L. Vandoorn, B. Renders, L. Degroote, B. Meersman, L. Vandevelde, Active loadcontrol in islanded microgrids based on the grid voltage, IEEE Trans. SmartGrids 2 (1) (2011) 139–151. [CrossRef]
- KNX—The International buildings control and automation standard._www.knx.org_.
- D. Tsiamitros, D. Stimoniaris, N. Poulakis, M.A. Zehir, A. Batman, M. Bagriyanik,A. Ozdemir, E. Dialynas, Advanced energy storage and demand-side manage-ment in smart grids using buildings energy efficiency technologies, in: IEEEInnovative Smart Grid Technologies 2014 Conference (IEEE-ISGT2014), 12–15October, 2014, Istanbul, Turkey, 2014.
- T. Kollatou, D. Tsiamitros, D. Stimoniaris, V. Kikis, M.A. Zehir, A. Batman, M.Bagriyanik, A. Ozdemir, E. Dialynas, Advanced demand-side management inmicrogrids using KNX technologies, in: 2014 KNX Scientific Conference, 30–31October, 2014, Wiesbaden, Germany, 2014.
- S. Piller, M. Perrin, A. Jossen, Methods for state-of-charge determination andtheir applications, J. Power Sources 96 (2001) 113–120. [CrossRef]
- Sunny Island Installation Guide, Version 4.0, [Online]. Available:_http://www.sma.de_.
- D. Stimoniaris, D. Tsiamitros, N. Poulakis, T. Kottas, V. Kikis, E. Dialynas, Inves-tigation of smart grid topologies using pilot installations-experimental results,in: IEEE -ISGT-2011, Manchester, UK, 2011.
- D. Stimoniaris, D. Tsiamitros, E. Dialynas, Improved Energy Storage Manage-ment and PV-Active Power Control Infrastructure and Strategies for Microgrids,IEEE Trans on Power Systems 31 (1) (2016) 813–820. [CrossRef]
- N. Langhammer, R. Kays, Performance evaluation of wireless home automa-tion networks in indoor scenarios, IEEE Trans. Smart Grids 3 (4) (2012)2252–2261. [CrossRef]
- M. Aliberti, Green networking in home and building automation systemsthrough power state switching, IEEE Trans. Consum. Electron. 57 (2) (2011)445–452. [CrossRef]
- M.A. Zehir, A. Batman, M.A. Sonmez, A. Font, D. Tsiamitros, D. Stimoniaris, T. Kol-latou, M. Bagriyanik, A. Ozdemir, E. Dialynas, Development of a field data-basedvirtual test bed for microgrid integration of building automation technologies,in: ELECO 2015 Conference, Bursa, Turkey, 2015.
Christodoulos Spagkakas is an Automation Engineer and he had received the diploma in Automation
Engineering from the department of the International Hellenic University and his MSc degree in Energy
Management and Energy Efficiency in Buildings. He was employee of Schneider Electric for 16 years as
responsible for Building Automation sector. During this period, he established a new training center for South
East Europe for building automation. Now, he is Founder of Building Automation startup. He is also a PhD
candidate at the University of Western Macedonia on the subject “Design of new interfaces for energy
management and energy efficiency in buildings”.
Dimitrios Stimoniaris (UOWM, Assistant Professor, Electrical and Computer Engineer PhD) has received his
PhD degree from the school of Electrical and Computer Engineering of the National Technical University of
Athens (NTUA), Greece, his MSc degree in Electrical and Computer Engineering from the department of
Electrical and Computer Engineering, Democritus University of Thrace, Greece and the respective diploma from
the department of Electrical and Computer Engineering, Aristotle University of Thessaloniki, Greece. He is now
an Assistant Professor at the department of Electrical and Computer Engineering, University of Western
Macedonia, Kozani, Greece. He is also scientific responsible of two Interreg Europe projects FINERPOL: and
SUPER and was scientific responsible of the IPA cross-border “Greece-Fyrom 2007-2013 project with acronym
PEEBPE, of the bilateral research & technology cooperation Greece-Turkey 2013-2014 – “smart electrical
energy management and buildings energy efficiency technologies project-SEEMBEET” and 5 more technical and
research regional projects. He has twenty years of experience as Electrical Engineer and technical advisor to
industrial and residential customers and administrative experience as: (a) vice-president of the Thessaloniki
integrated transport authority (http://www.thita.gov.gr/en), (b) member of the board of technical studies and
constructions of the municipality of Kozani, (c) member of the board of the technical chamber of Greece – West
Macedonia department. He is co-author of over 30 40 publications in international journals and conference
proceedings with reviewers.
Dimitrios Tsiamitros (UOWM, Associate Professor, Electrical & Computer Engineer PhD) has received the Ph.D. degree in Electrical and Computer Engineering from the department of Electrical and Computer Engineering, Aristotle University of Thessaloniki, Greece and the respective diploma from the same university. He is now an Associate Professor at the department of Electrical and Computer Engineering, University of Western Macedonia, Kozani, Greece. He is also scientific responsible of UoWM at the CEF project Crocodile 2, the Interreg Europe project E-MOB, project manager of the regional project: “Biomass-based chp district heating system of Deskati” and technical manager at the Interreg Europe projects Finerpol and Super. He was technical manager at the IPA cross-border “Greece-Fyrom 2007-2013 projects with acronyms PEEBPE and BIOFOSS and other IPA cross-border and regional technical projects. He was principal investigator at the bilateral research & technology cooperation Greece-Turkey 2013-2014 – “smart electric energy management and buildings energy efficiency technologies project-SEEMBEET”. He received a basic research scholarship during his PhD studies. He is/was reviewer at electric power systems research (EPSR) journal, the IET proceedings on generation, transmission and distribution (iet-gtd), the IEEE transactions on electromagnetic compatibility (ieee-emc), the IEEE transactions on power systems journals and he served as scientific evaluator of the Hellenic electricity distribution network operator (HEDNO). He was the ASHRAE student branch advisor of the first ASHRAE student branch in Greece and vice-president of the national mechanical & electrical engineers association / West Macedonia branch. He is co-author of 16 (sixteen) publications at international journals with reviewers and of over 60 publications at international conferences with reviewers on power systems.
|
Disclaimer/Publisher’s Note: The statements, opinions and data contained in all publications are solely those of the individual author(s) and contributor(s) and not of MDPI and/or the editor(s). MDPI and/or the editor(s) disclaim responsibility for any injury to people or property resulting from any ideas, methods, instructions or products referred to in the content. |
© 2023 by the authors. Licensee MDPI, Basel, Switzerland. This article is an open access article distributed under the terms and conditions of the Creative Commons Attribution (CC BY) license (http://creativecommons.org/licenses/by/4.0/).
