1. Introduction
Interfacial adhesion refers to the ability of soil particles to adhere to the interface of other materials in the presence of water [
1]. The system of soil adhesion comprises three elements: soil, solid surfaces, and their interface [
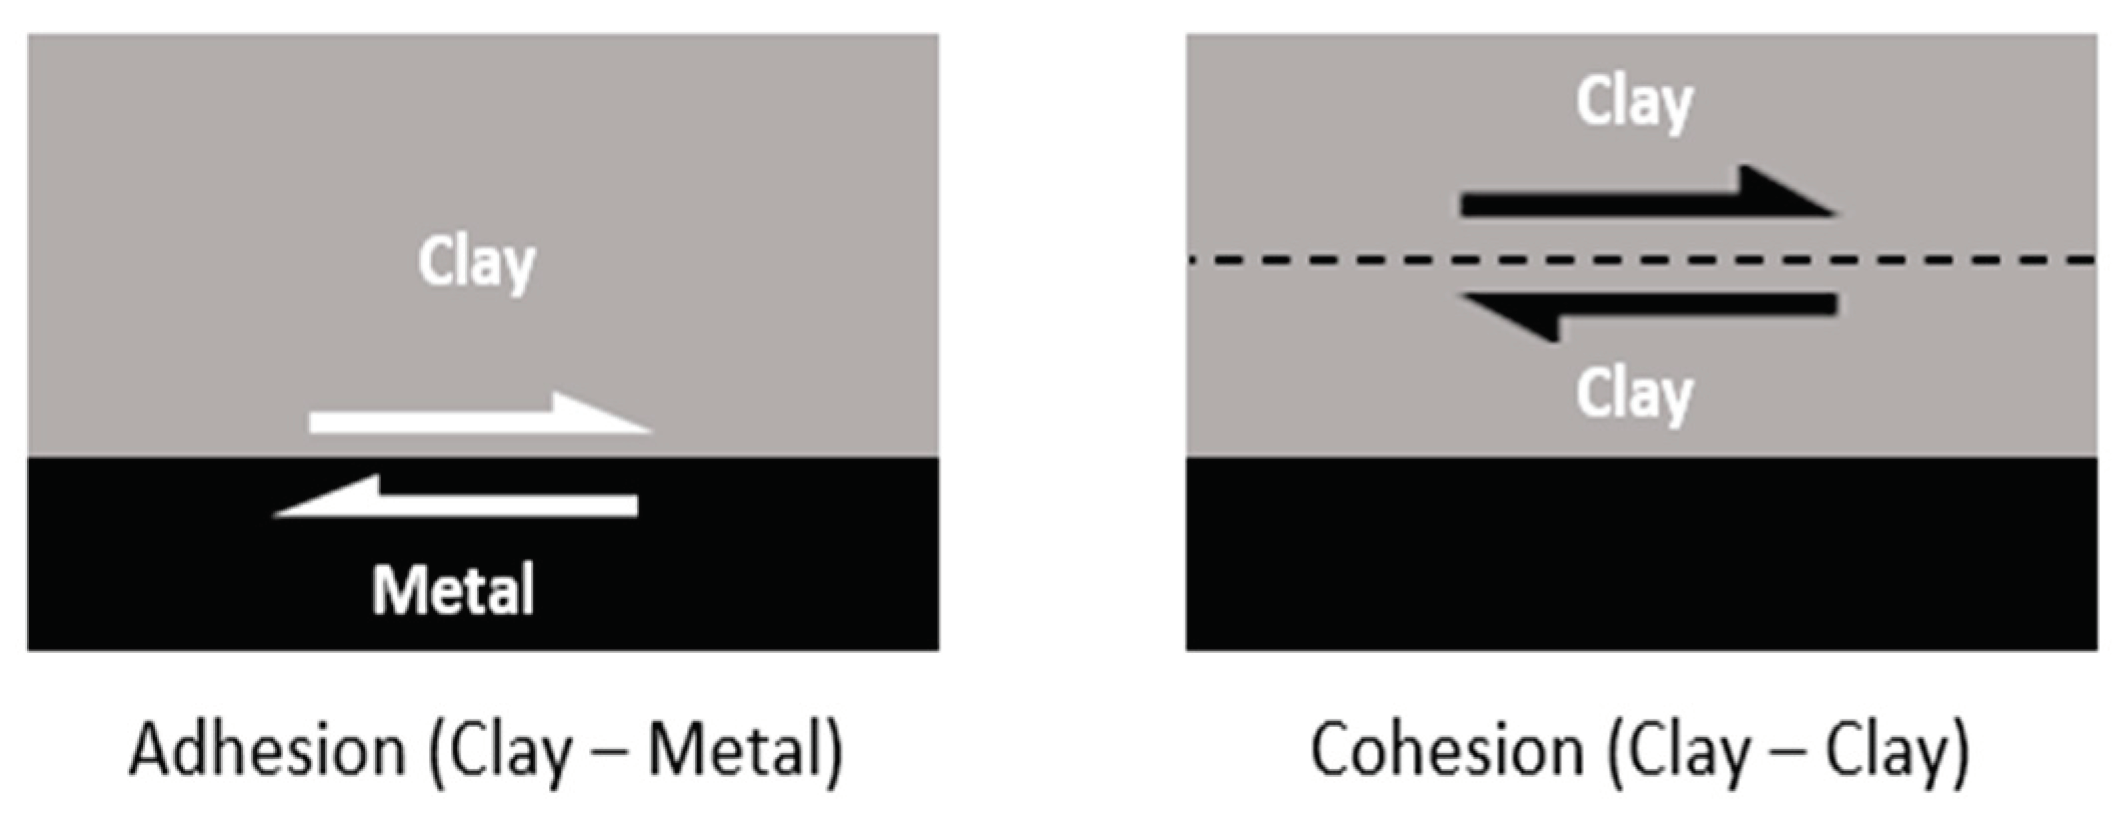
2]. An example of interfacial adhesion commonly encountered is between clay and metal. It is important to differentiate between soil adhesion and soil cohesion as shown in
Figure 1, where the former involves soil particles adhering to other materials and the latter refers to soil particles sticking to each other [
3].
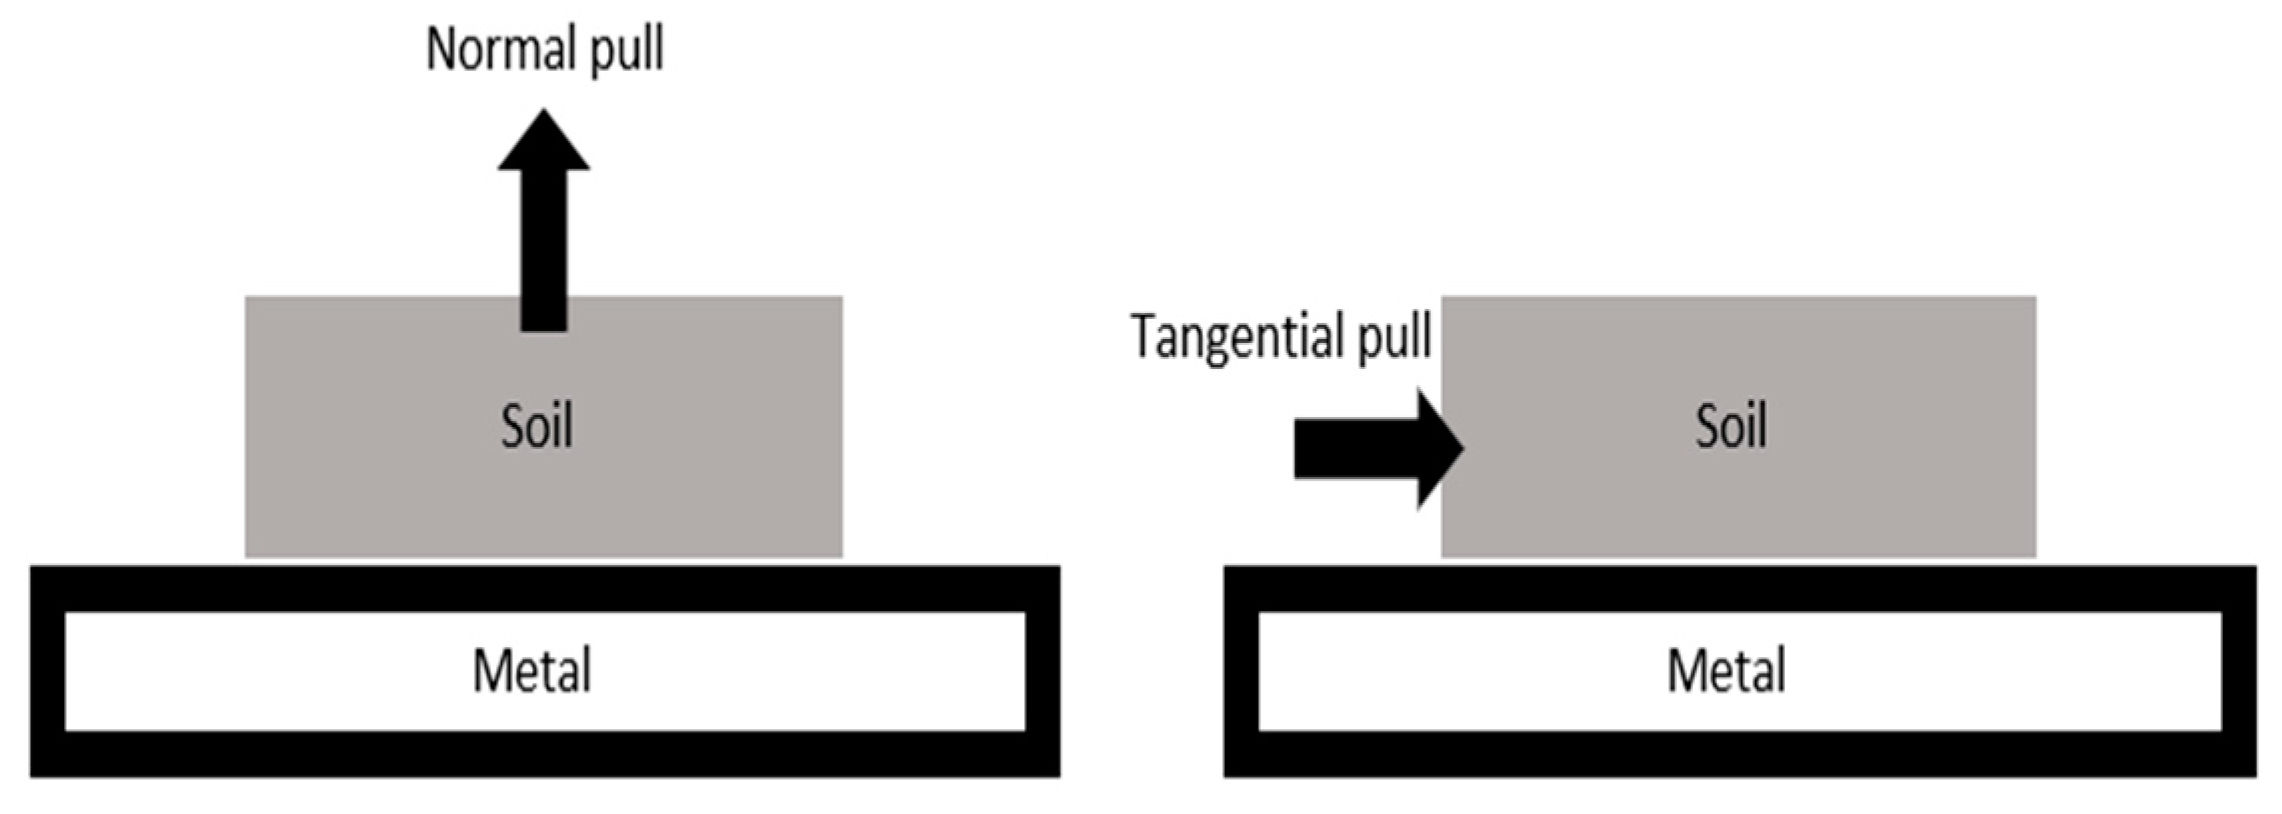
There are two types of soil adhesion: normal adhesion and shear (tangential) adhesion [
2]. The applied load is the factor that determines the adhesion type. The normal adhesion is accommodated with normal tensile load and the shear adhesion is accommodated with shear load, as shown in
Figure 2.
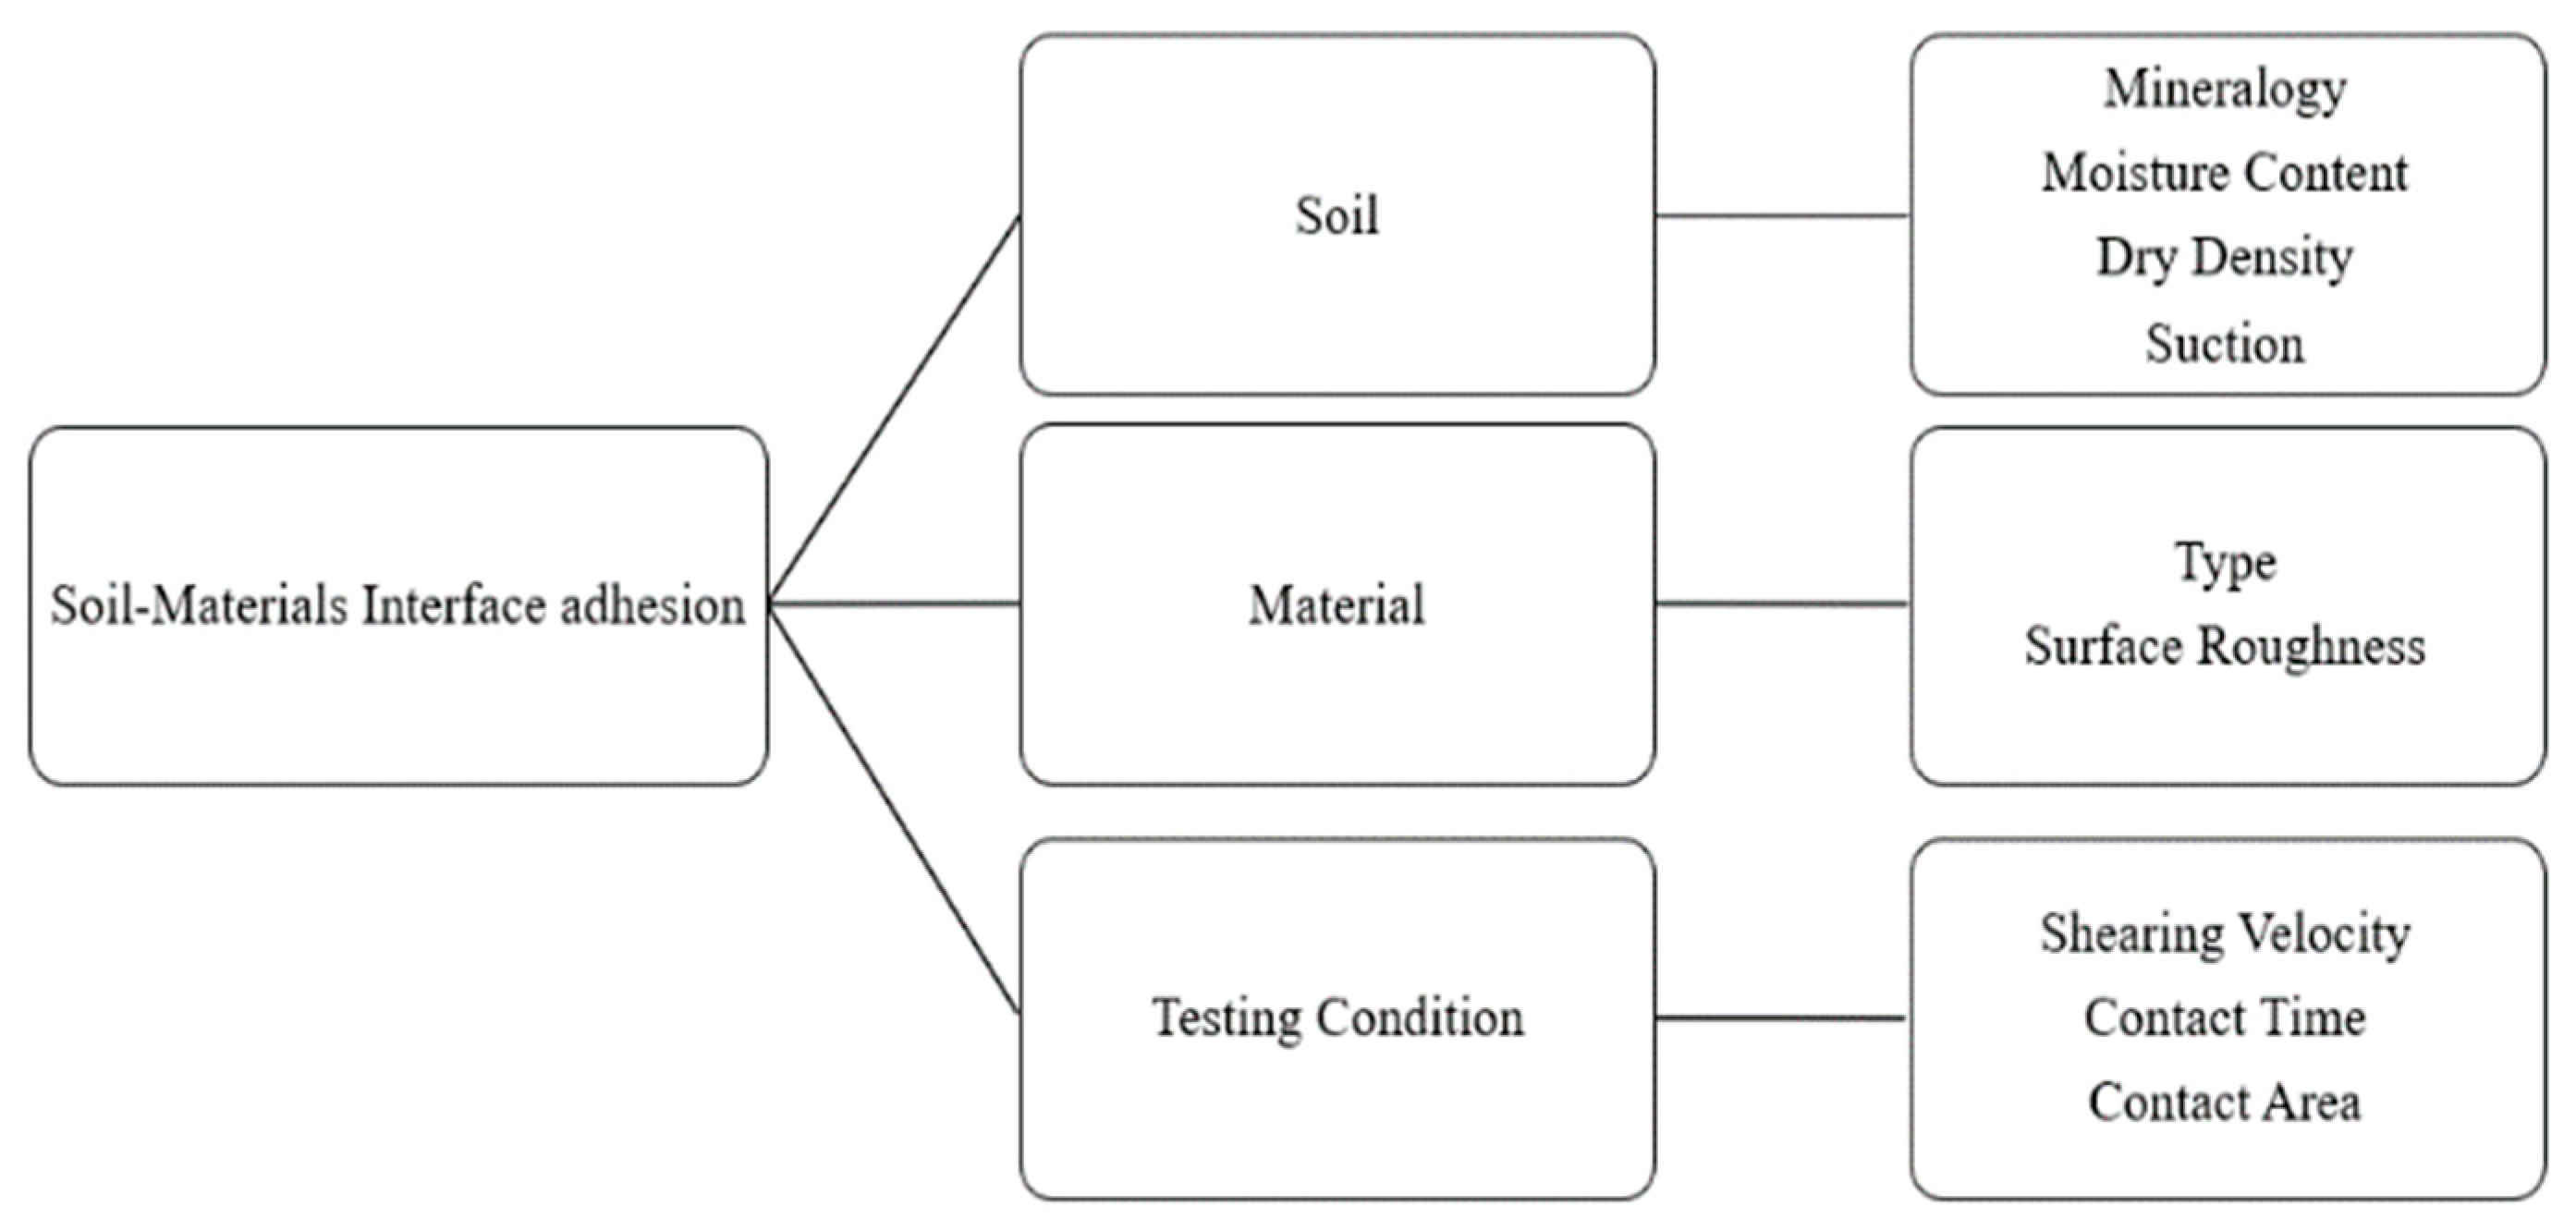
Adhesion behaviour at interfaces is influenced by various factors including soil properties, material properties, interface properties and test conditions as shown in
Figure 3 [
4,
5]. Soil properties affecting interfacial adhesion include soil composition, grain size distribution, porosity, specific surface area (SSA), moisture content, water salinity, matric suction, plasticity, consistency and cohesion [
4,
5,
6]. According to [
7], shear adhesion and moisture content exhibit a parabolic relationship. Moisture content (w
c) is a parameter in the consistency index (
Ic) of the soil, which incorporates liquid limits (
LL) and plasticity index (
PI) as defined by Equation (1).
Thus, there is a relationship between the consistency index and shear adhesion which assists in understanding the behaviour of clay adhesion [
8]. Material properties that influence interfacial adhesion include the contact area, applied normal load, and roughness of the surface area [
9]. Testing conditions such as contact time at the soil-material interface, rate of loading, humidity, and temperature of the interface surface also play a significant role in affecting the behaviour and value of interfacial soil adhesion [
6,
10].
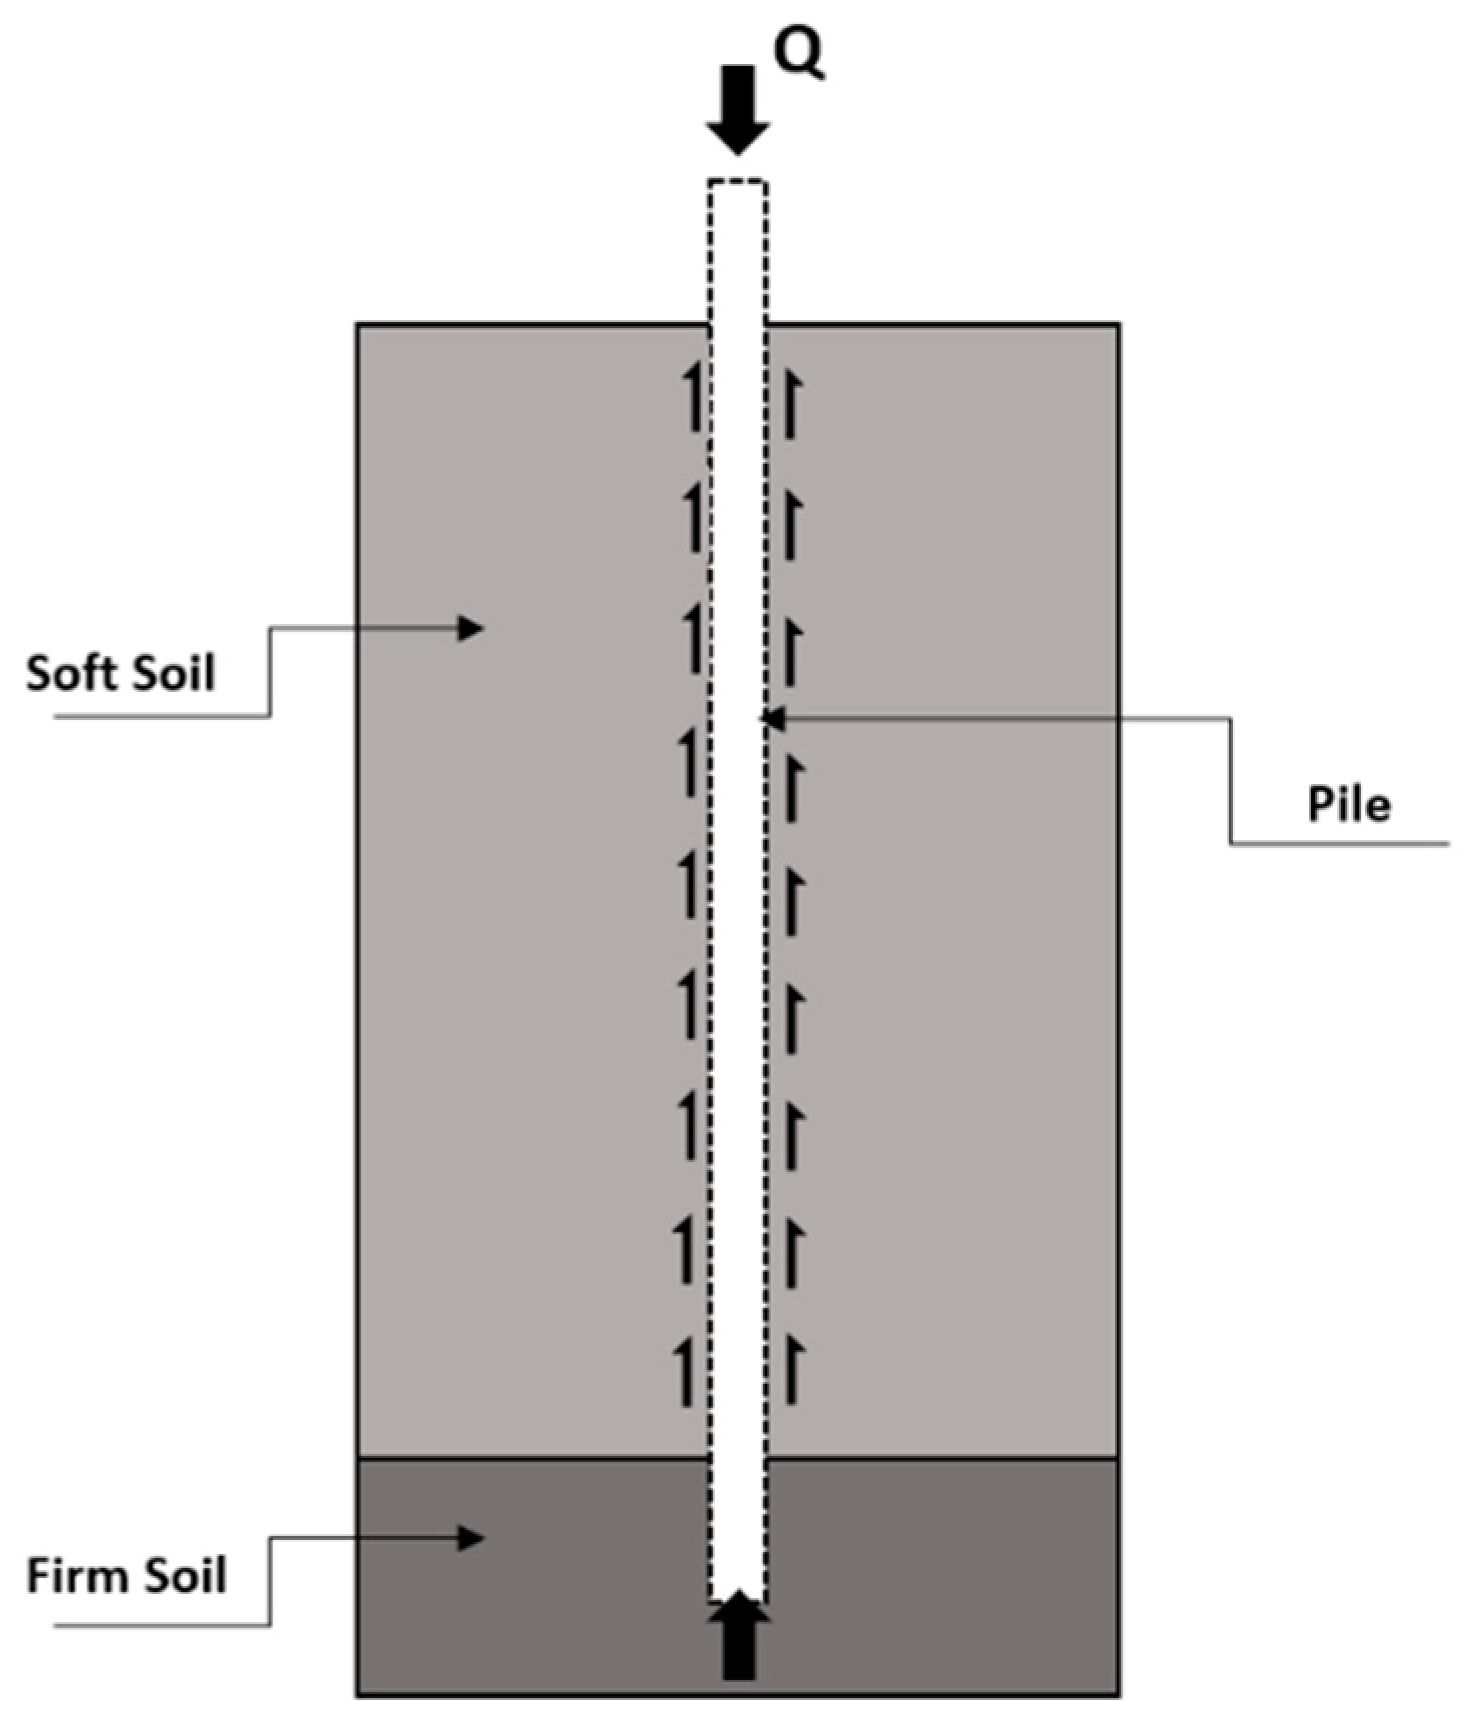
The interfacial soil adhesion derives importance from its applications in geotechnical engineering and agriculture, where it can pose potential challenges. For example, pile foundations,
Figure 4, may encounter stickiness issues during the digging process [
11], and the cutter head of a tunnel boring machine (TBM) can experience clogging problems at the interface due to interfacial soil adhesion [
12,
13,
14].
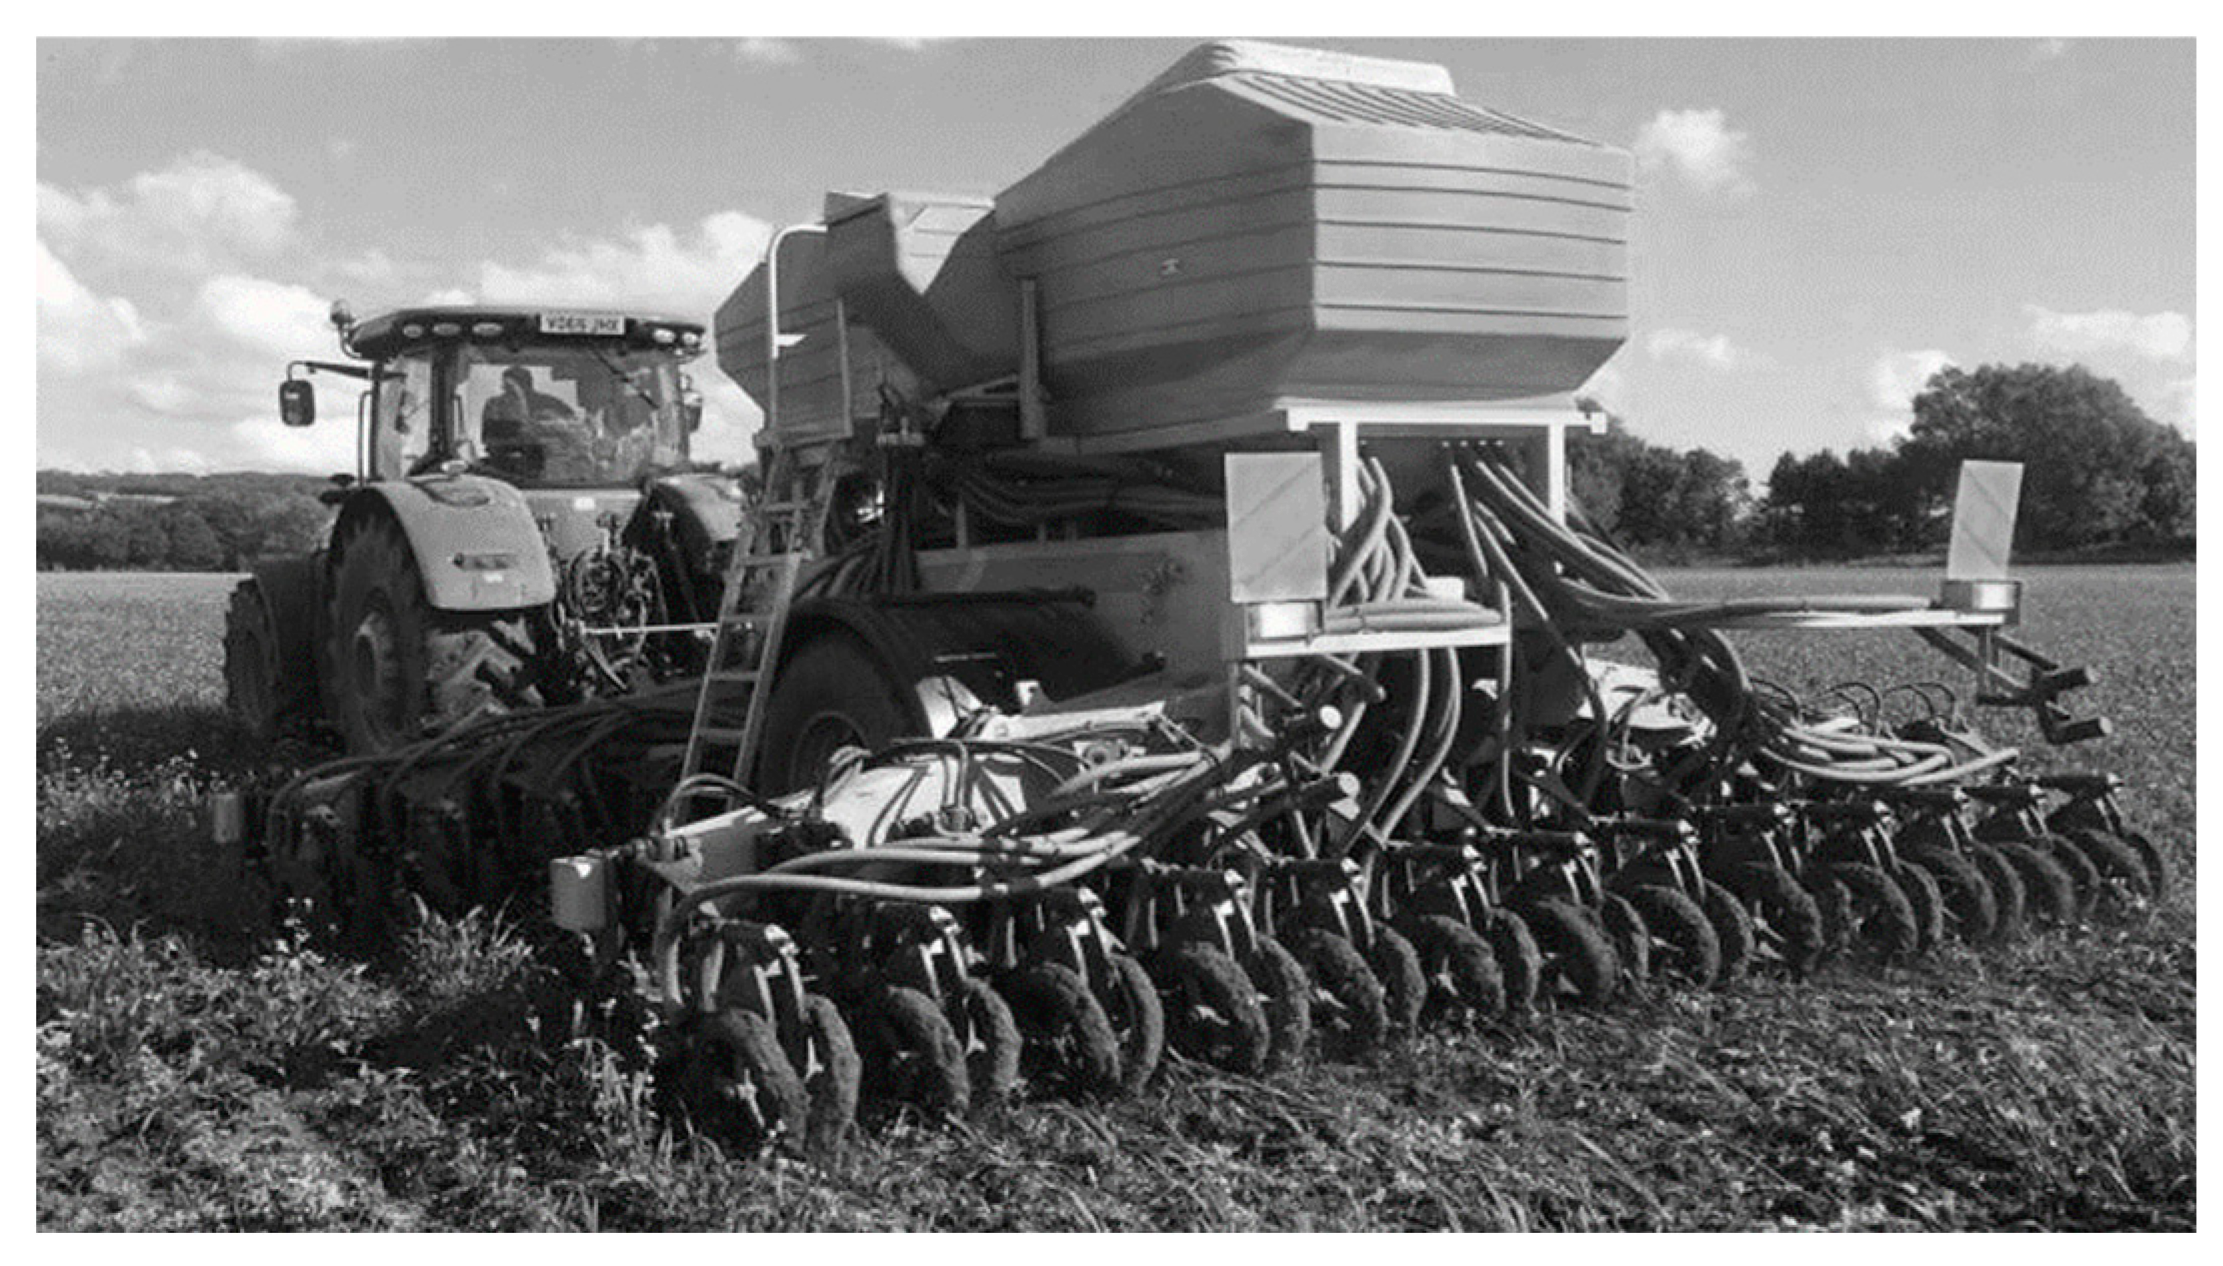
These practical applications of interfacial soil adhesion can lead to unexpected cost implications. Additionally, soil sticking to agricultural machines during harvesting, as shown in
Figure 5, can result in high energy consumption and reduced work efficiency [
6,
8]. Therefore, it is crucial to investigate the behaviour of soil adhesion with other materials.
Several studies have employed different methods to measure soil adhesion; however, there is no specific method or device exclusively designed for soil adhesion measurement [
3]. Soil adhesion can be measured in the laboratory using pull-out tests [
12], piston separation tests [
15] and shear plate tests [
16]. Fountaine [
1] used a specialized apparatus to measure normal adhesion for loam clay and sandy clay under the influence of water surface tension. Their study revealed that moisture content and material type have an impact on soil adhesion. Thewes and Burger [
12] utilized pull-out tests to investigate clogging issues in TBMs, where normal soil adhesion occurs. It was found that clay minerals and soil consistency index (I
c) affect normal adhesion. Azadegan and Massah [
17], designed a dedicated instrument to measure normal adhesion between clay and steel. Their study focused on the effect of temperature on adhesion and demonstrated that temperature influences soil adhesion. Basmenj, Mirjavan [
15] employed a piston separation device to measure the normal adhesion of soil to metal. The study investigated wetness levels of montmorillonite clay and revealed that wetness is a significant influencing factor. Burbaum and Sass [
18] used pull-out load or separation tests to investigate normal adhesion between clay and steel surfaces, finding that adhesion is influenced by the soil consistency index. Zumsteg and Puzrin [
16] employed a plate apparatus to examine the clogging issue occurring at the interface of clay and TBM machines during tunnelling. They identified tangential adhesion as the main factor contributing to soil stickiness and clogging issues. This paper aims to investigate the behaviour of shear adhesion at the interface between kaolin clay and the internal surface of a brass mould. The study involves testing thirty compacted kaolin samples with different moisture contents and compaction energy levels (dry density). To conduct the experiment, a new simple test method was developed to measure interfacial shear adhesion between kaolin and brass.
2. Materials and Methods
2.1. Materials
The interface adhesion test conducted in this study involved the use of kaolin clay as the testing material. Kaolin clay is a commonly utilized soil material in geotechnical engineering studies due to its availability and representative properties.
Table 1 provides an overview of the mineral composition of the kaolin clay used in this research.
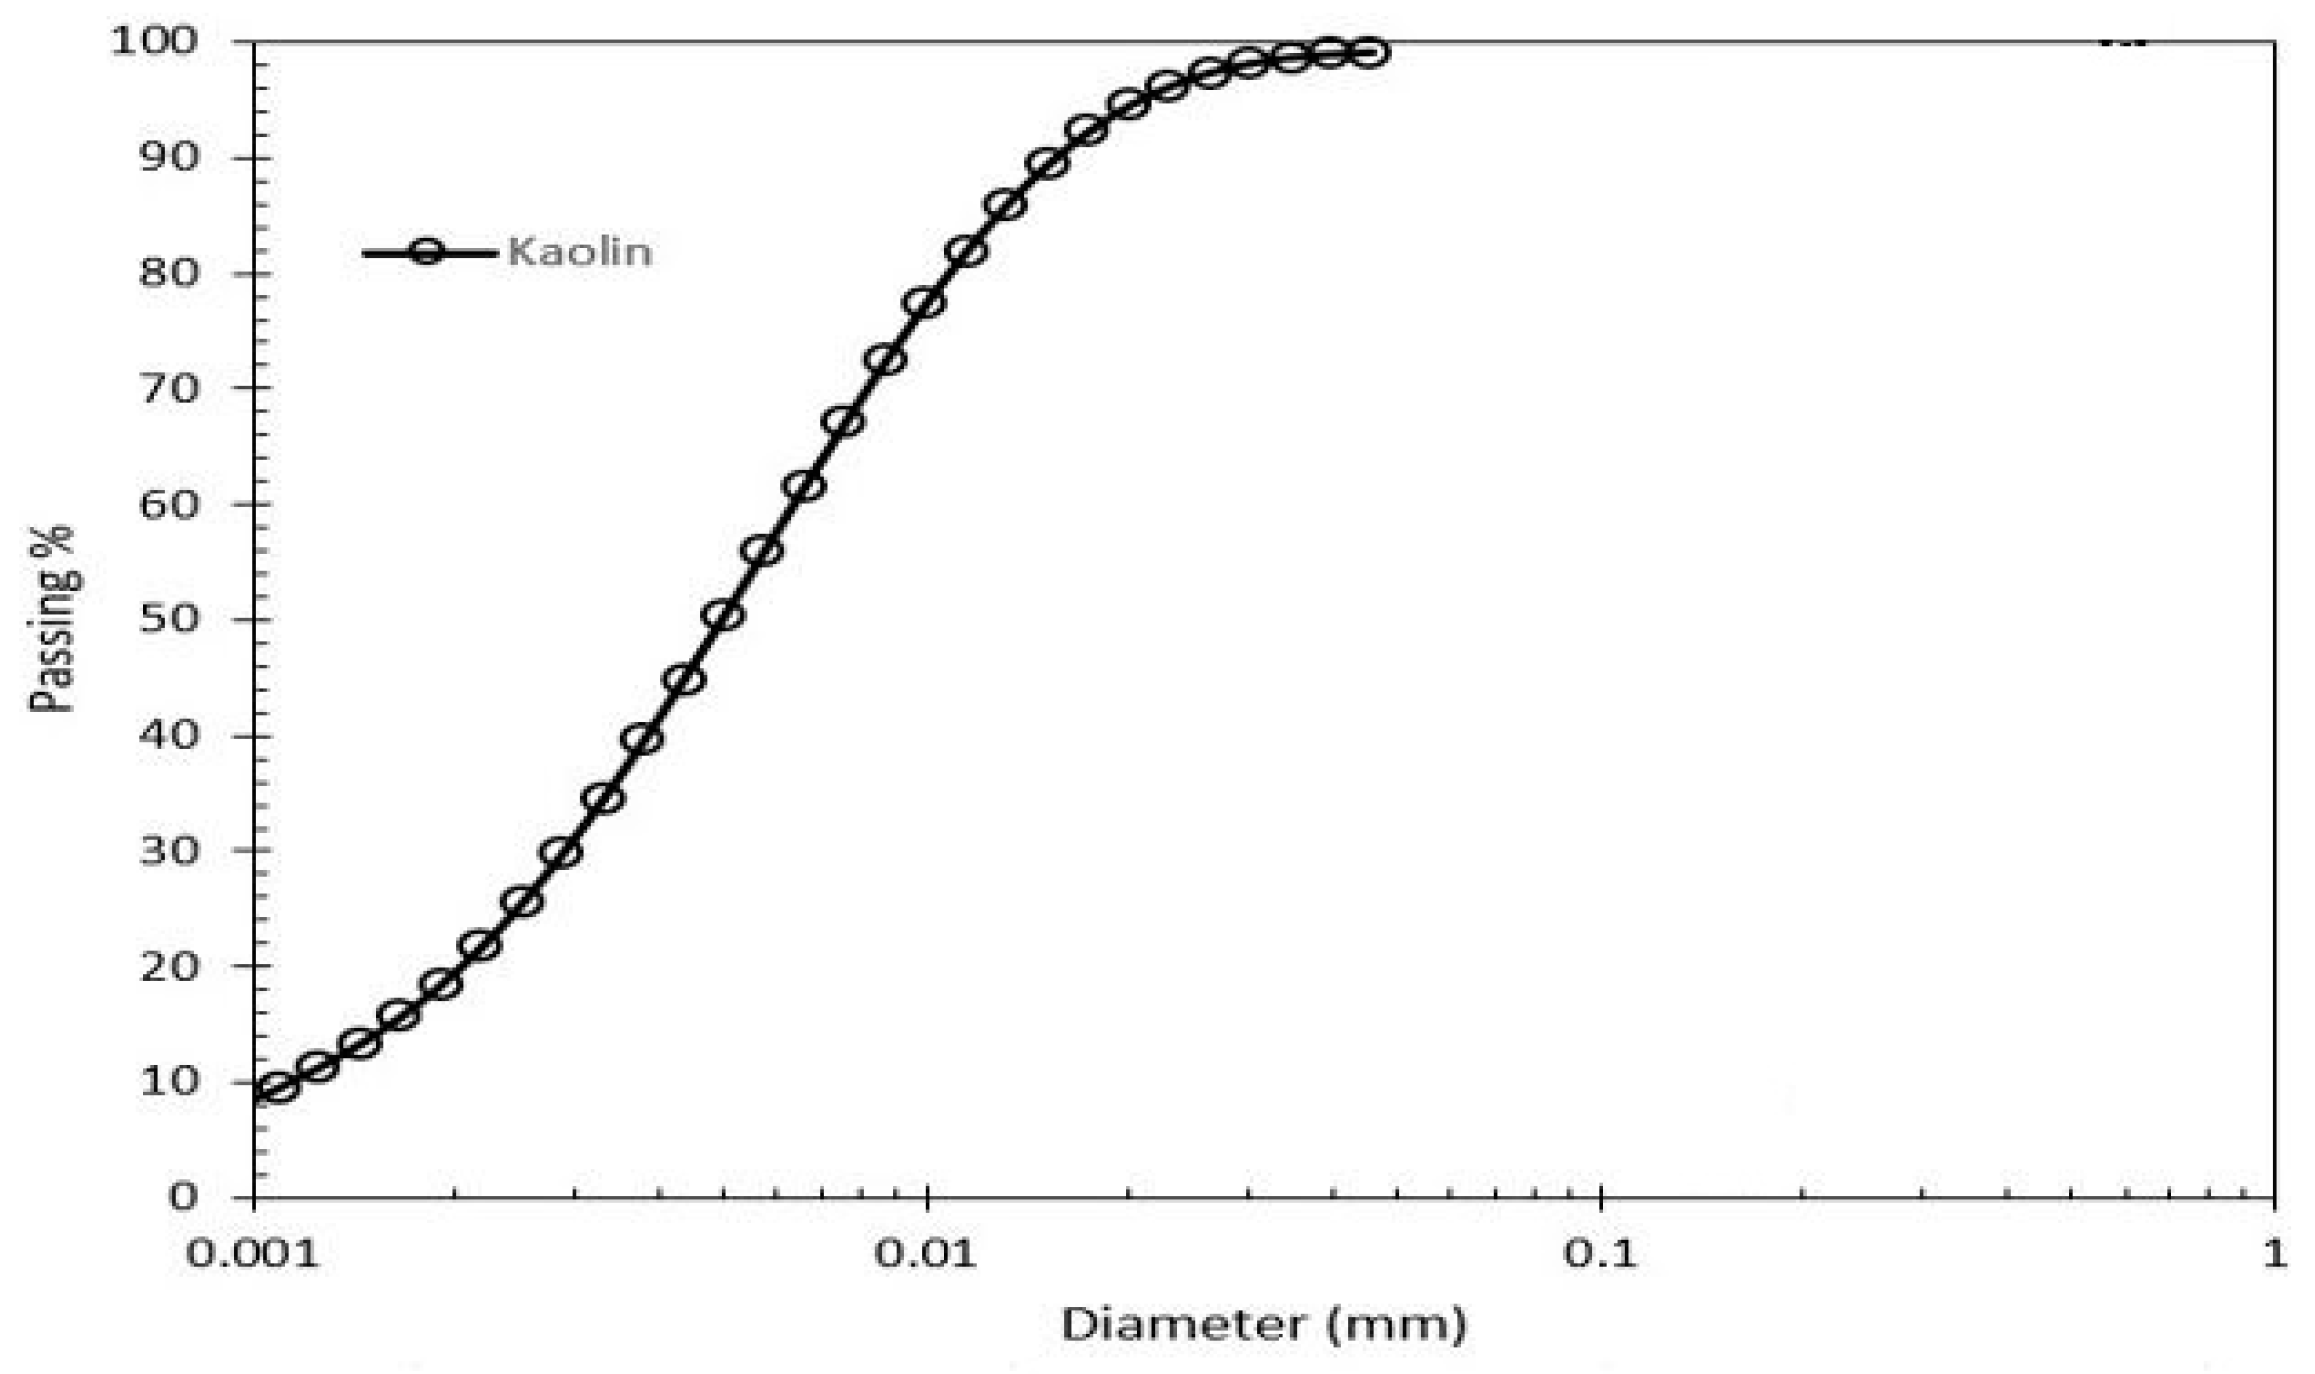
To further characterize the kaolin clay,
Table 2 presents the geotechnical properties that were examined during the study. These properties include parameters such as moisture content, dry density, shear strength, and compaction energy. Understanding the geotechnical properties of the soil is crucial for assessing its behaviour under different loading and moisture conditions.
Additionally,
Figure 6 shows the particle size distribution of the kaolin clay. This distribution illustrates the relative proportions of different particle sizes present within the soil sample. The particle size distribution plays a significant role in determining the mechanical and hydraulic properties of the soil, affecting factors such as compaction behaviour, permeability, and shear strength.
2.2. Preparation
To carry out the interfacial adhesion test, 30 different samples were prepared. The prepared samples produced different moisture content and dry density conditions. The percentage of moisture was between 10% and 50%. The kaolin samples were compacted at different compaction energy levels using a series of blows ranging from 15 to 55 blows to achieve the minimum and maximum dry density at different moisture levels as listed in
Table 3. The soil was compacted in the mould in three equal layers of almost 43 mm. The same amount of energy was applied to each layer. The moisture content used was regular tap water. After adding varying amounts of moisture to the soil samples, each sample was placed in a sealed plastic bag and kept overnight for moisture equalization.
2.3. Approach
After the soil has been compacted in the compaction mould, the next step is to test the interfacial shear adhesion with a loading machine. This approach enables the interfacial shear strength between the compacted soil and the brass mould to be evaluated.
To prepare the compaction mould for testing, it is inverted, and the mould base is removed. This allows the compacted soil to be extruded from the mould, exposing the surface that will be in contact with the brass mould during the shear adhesion test. This setup ensures a consistent interface between the soil sample and the mould and allows for accurate measurements of shear adhesion.
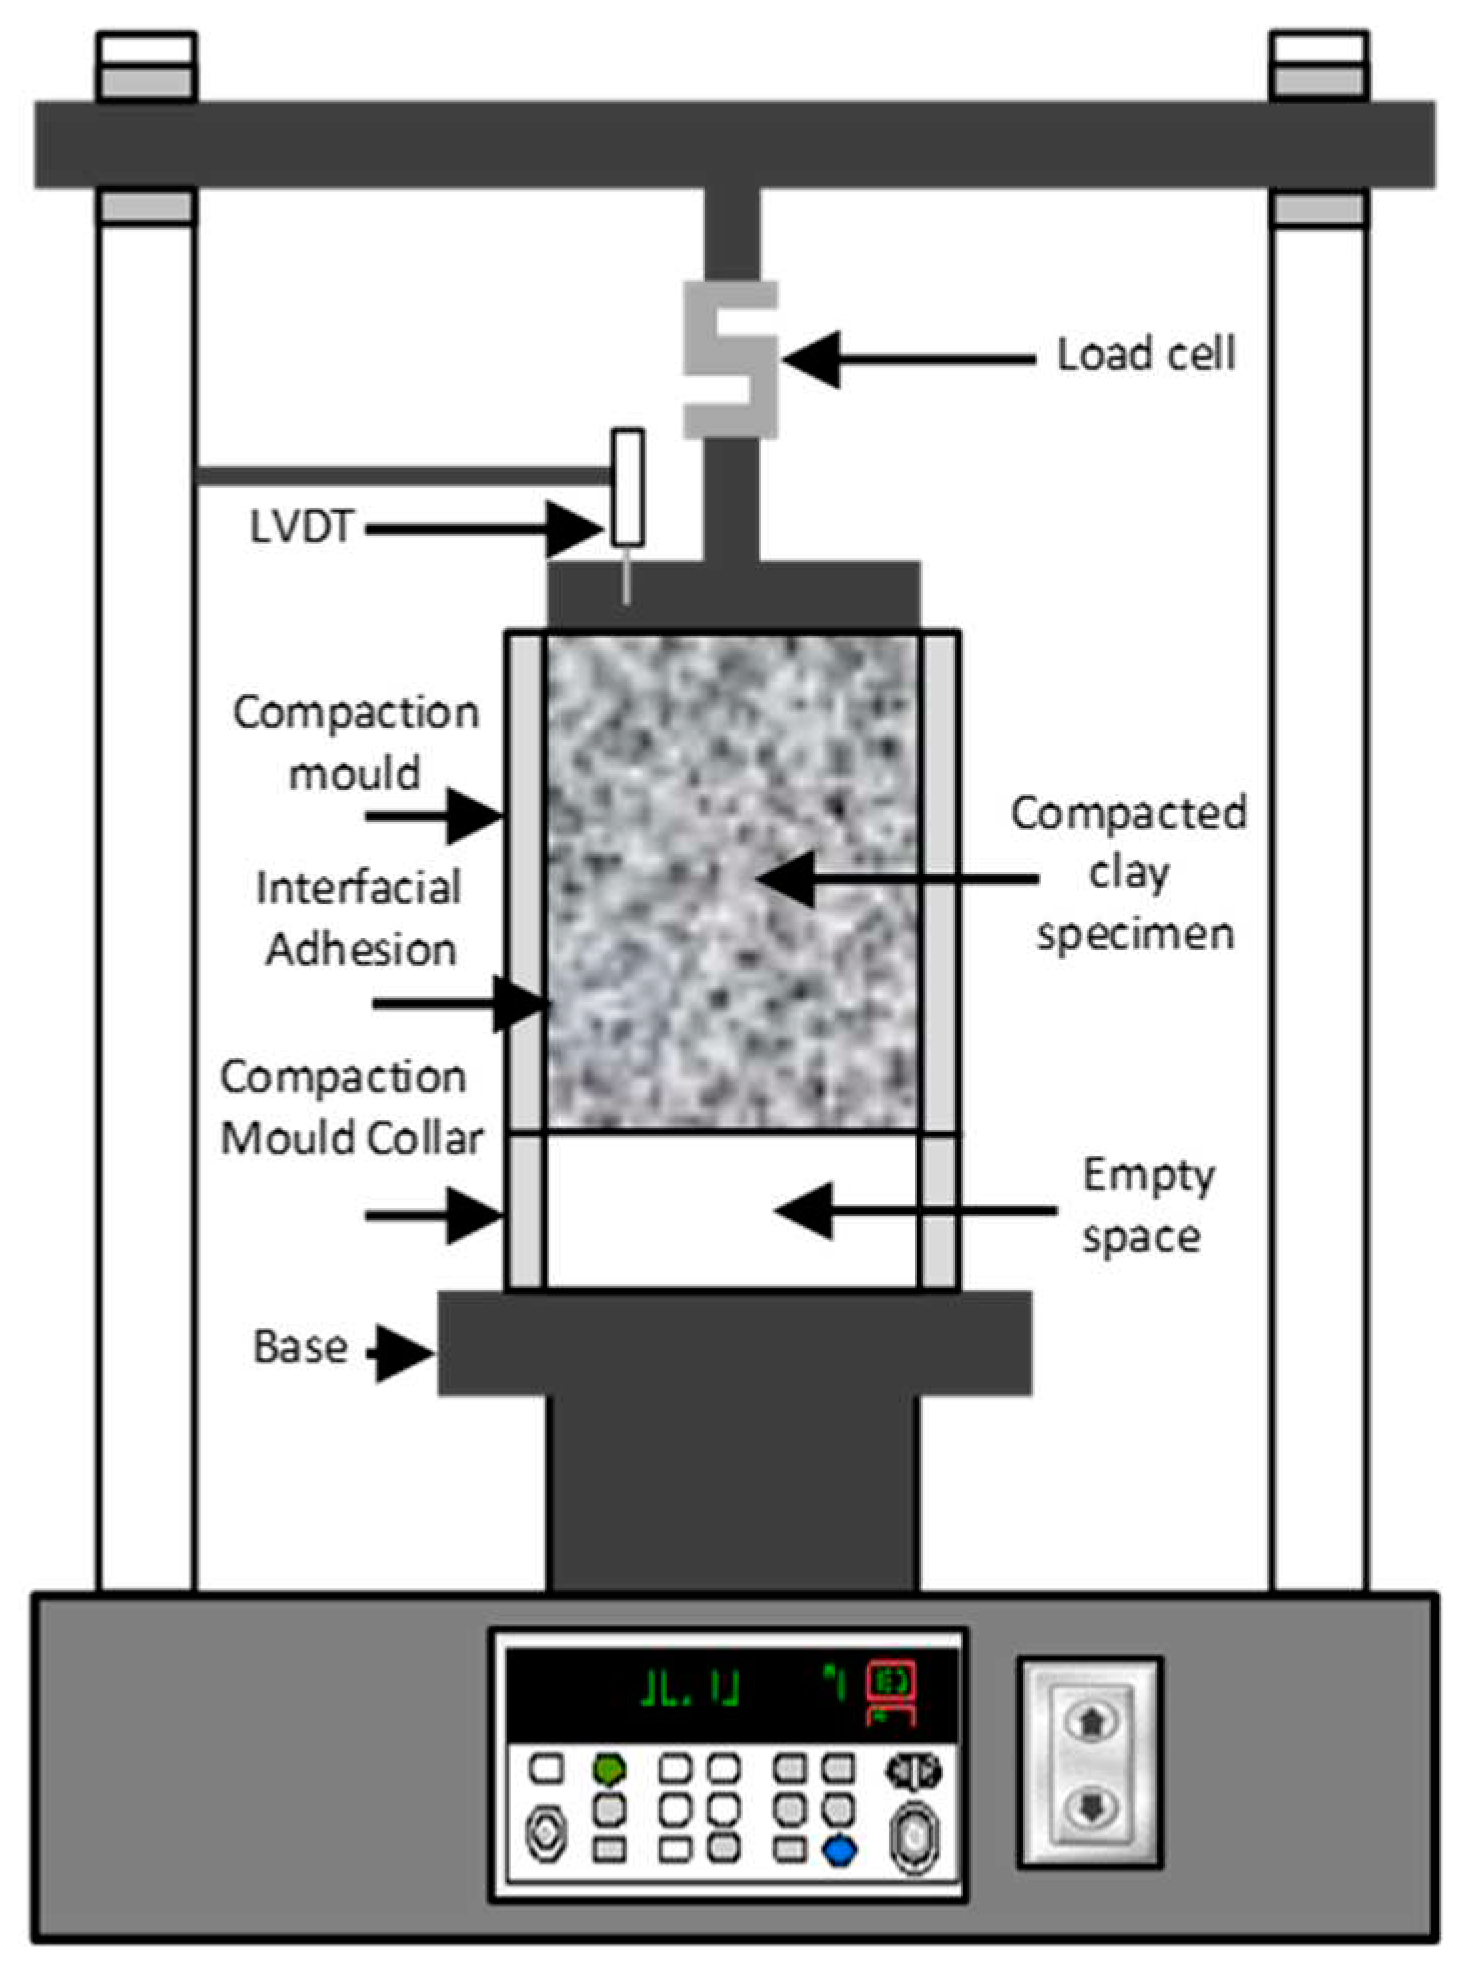
The loading machine is then utilized to apply a displacement-controlled load to the compacted soil, compressing it out of the mould. The loading machine's mechanism and setup are illustrated in
Figure 7, providing a visual representation of the process. The displacement rate employed in this study is 5.0 mm/min. This rate ensures a controlled and uniform compression of the compacted soil, allowing for precise measurements and reliable data acquisition.
By subjecting the compacted soil to a displacement-controlled load, the loading machine simulates the conditions under which the soil is subjected to external forces or loading in real-world applications. This enables the shear adhesion strength between the soil and the mould to be evaluated, providing valuable insights into the stability of the soil and its interaction with surrounding materials.
The utilization of a displacement-controlled load and a consistent loading rate ensures standardized testing conditions, enabling accurate comparisons between different soil samples and variations in compaction parameters. The data obtained from these tests contributes to a better understanding of soil behaviour and its response to external loads and helps in the planning and implementation of various engineering projects.
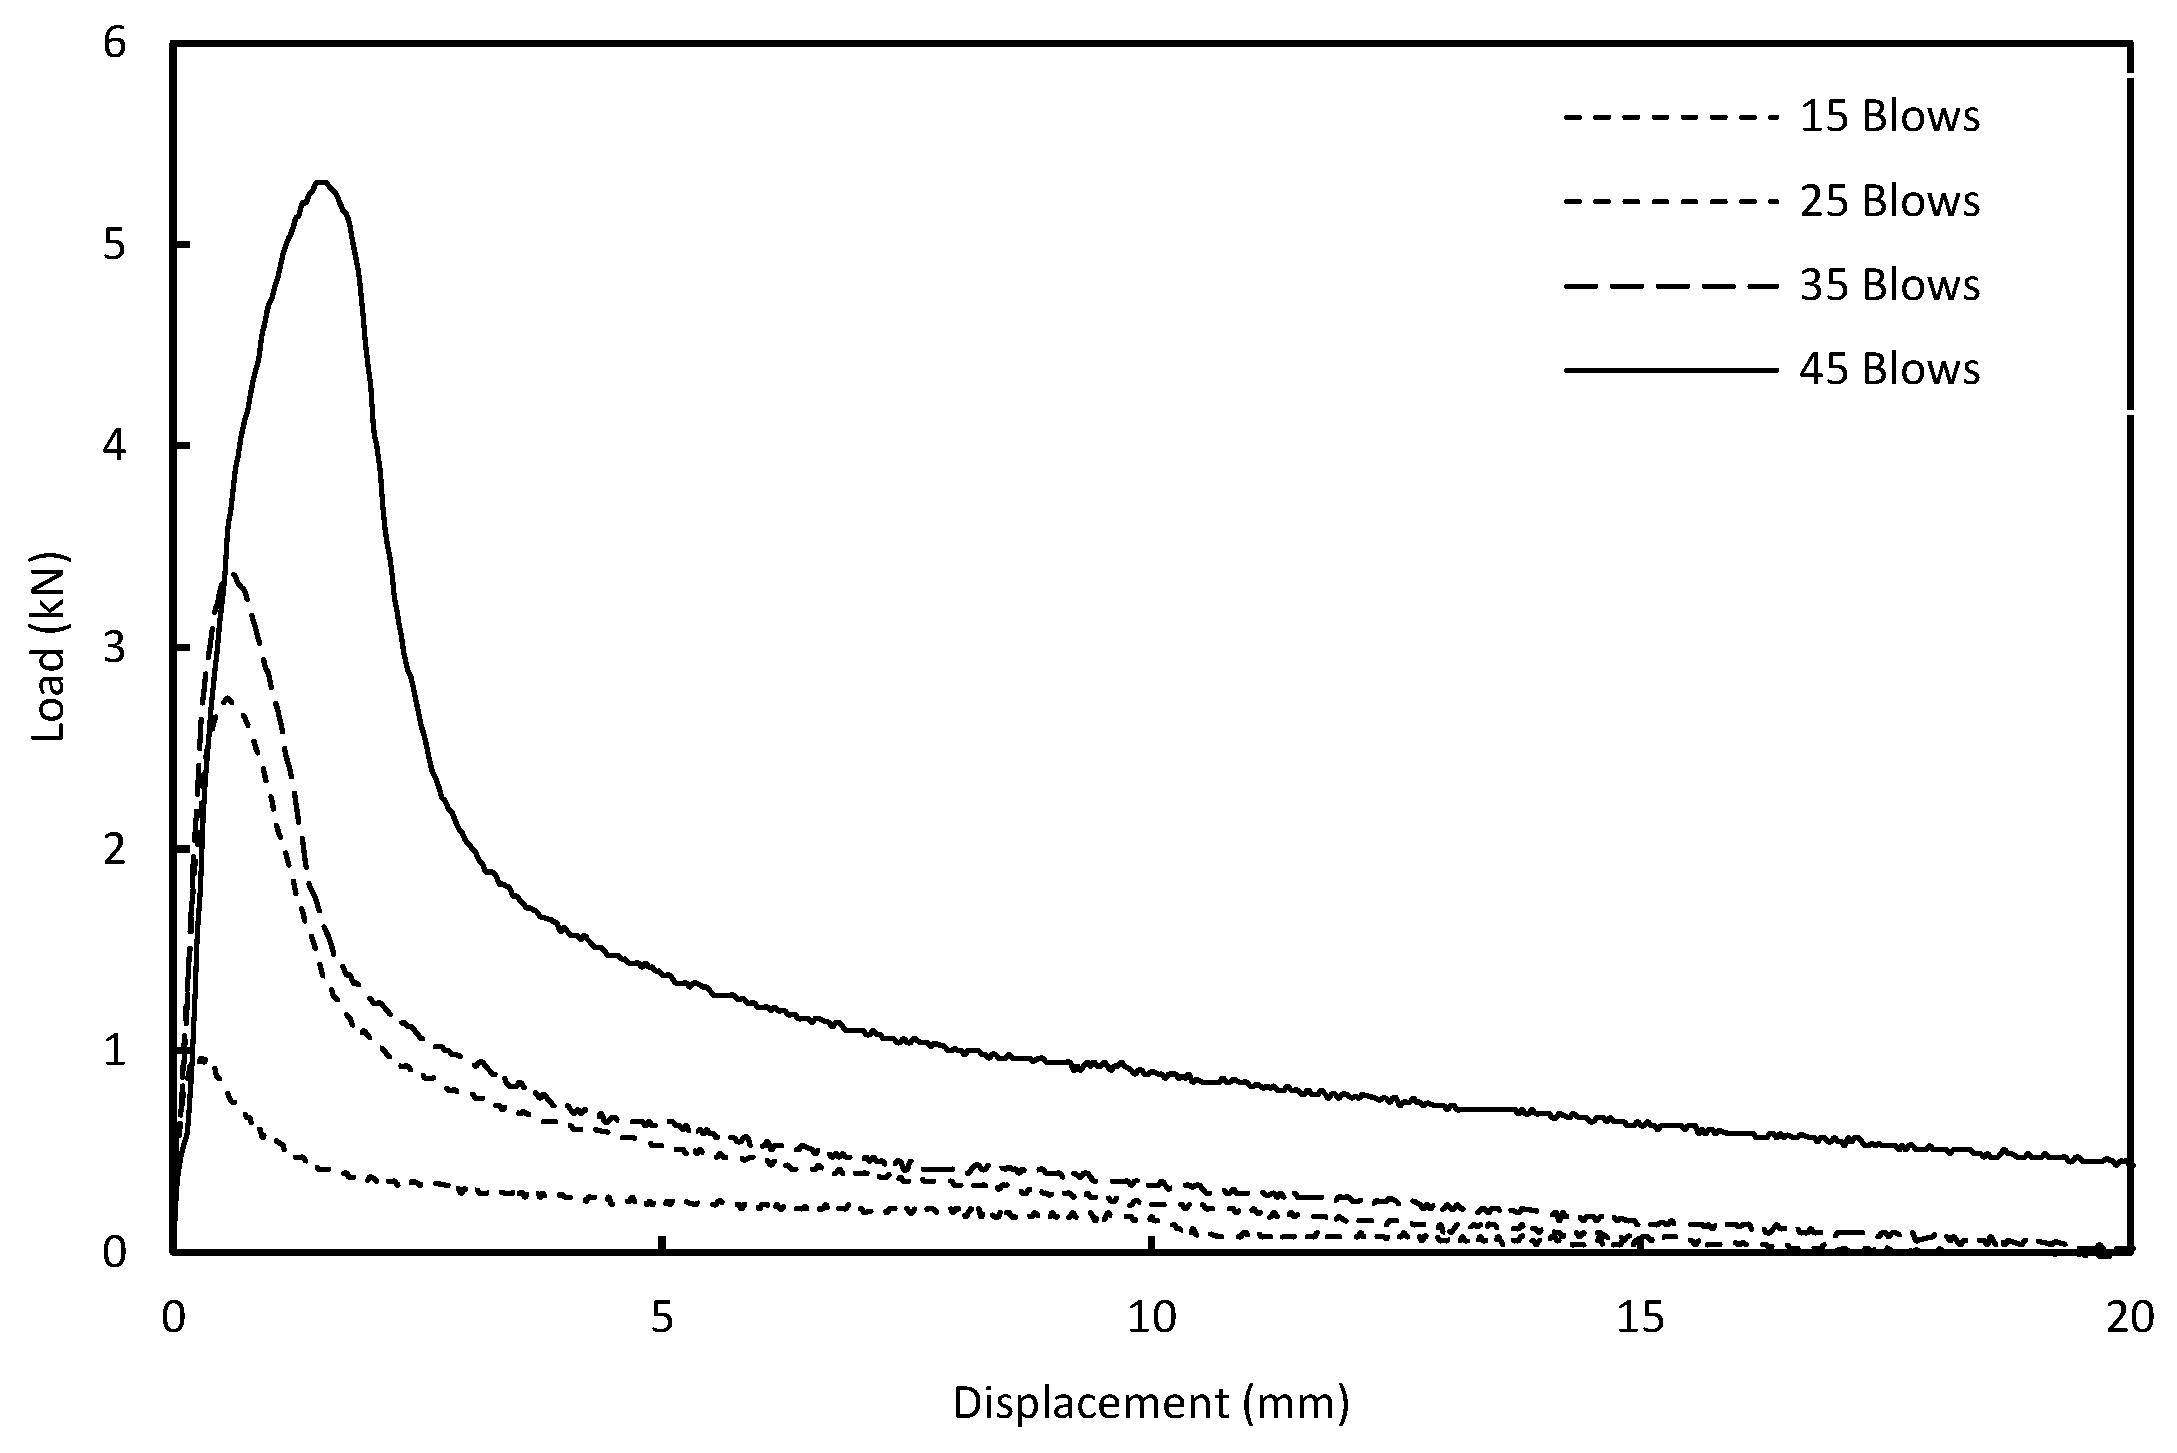
The testing process involves shearing the soil against the internal surface of the mould by applying a vertical load. To ensure that the machine load does not cause additional compression on the compacted specimen, which could potentially damage it by excessive squeezing, it is crucial for the movement of the compacted specimen to precisely match the loading displacement. Throughout the loading process, both the displacement and the load are accurately recorded and plotted. The peak of the load-displacement curve shows the maximum adhesion capacity of the interface between the compacted kaolin and the inner wall of the brass mould as shown in
Figure 8. The soil-mould interface adhesion can be determined using Equation (2):
Where α is interfacial adhesion (kPa), P is peak load (kN), and A is internal surface of the mould (m
2).
3. Results
3.1. Compaction Curve
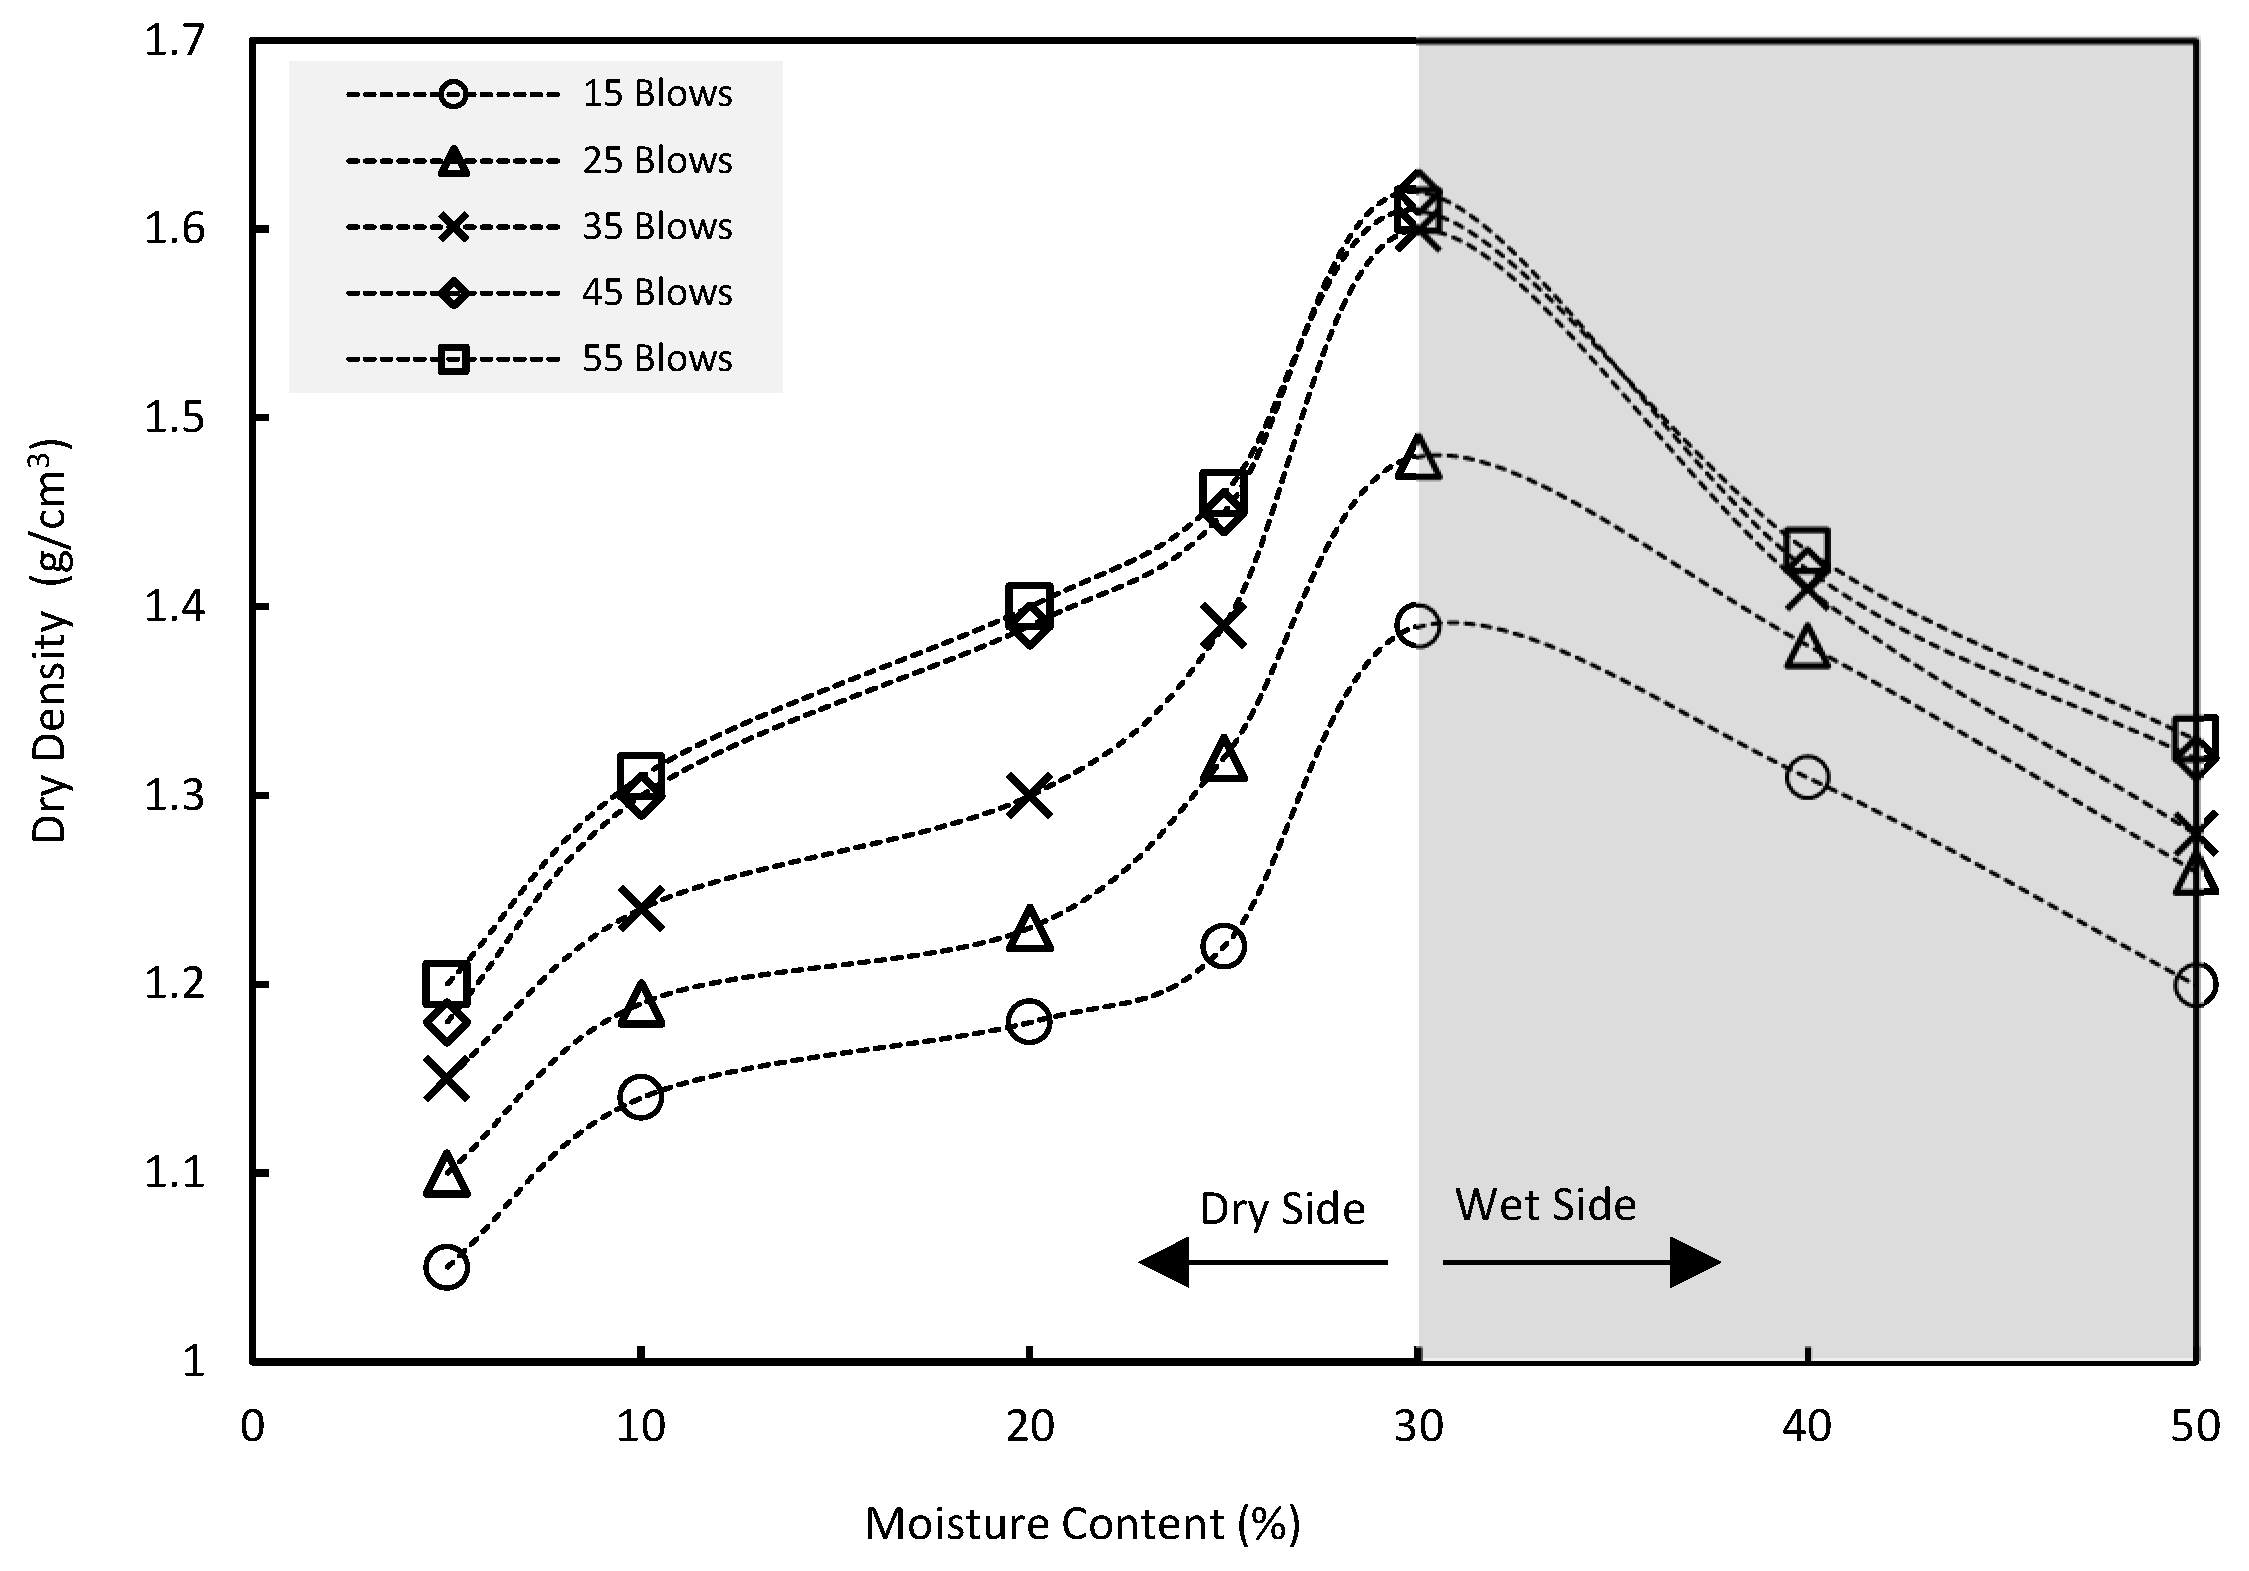
The compaction curve displayed in
Figure 9 provides valuable insights into the behaviour of kaolin under different compaction energies and moisture contents. By examining the curve, the relationship between dry density, compaction energy, and moisture content can be observed.
The compaction curve shows the variations in dry density as a function of compaction energy, represented by the number of blows (15, 25, 35, 45 and 55 blows) and the moisture content in the range from 10% to 50%. Each combination of compaction energy and moisture content corresponds to a specific point on the compaction curve. The peaks observed on the compaction curve indicate the optimum moisture content (OMC) for the kaolin, which is approximately 30% in all cases studied. The OMC represents the moisture content at which the kaolin reaches its maximum dry density during the compaction process. This optimum moisture content is critical to achieving the desired compaction properties and overall soil performance. The OMC effectively divides the compaction curve into two distinct sides: the dry-side and the wet-side. The moisture content range of 10% to 30% represents the dry-side, while the range of 30% to 50% represents the wet-side. These divisions reflect the different behaviour of the kaolin under different moisture conditions.
3.2. Dry Density
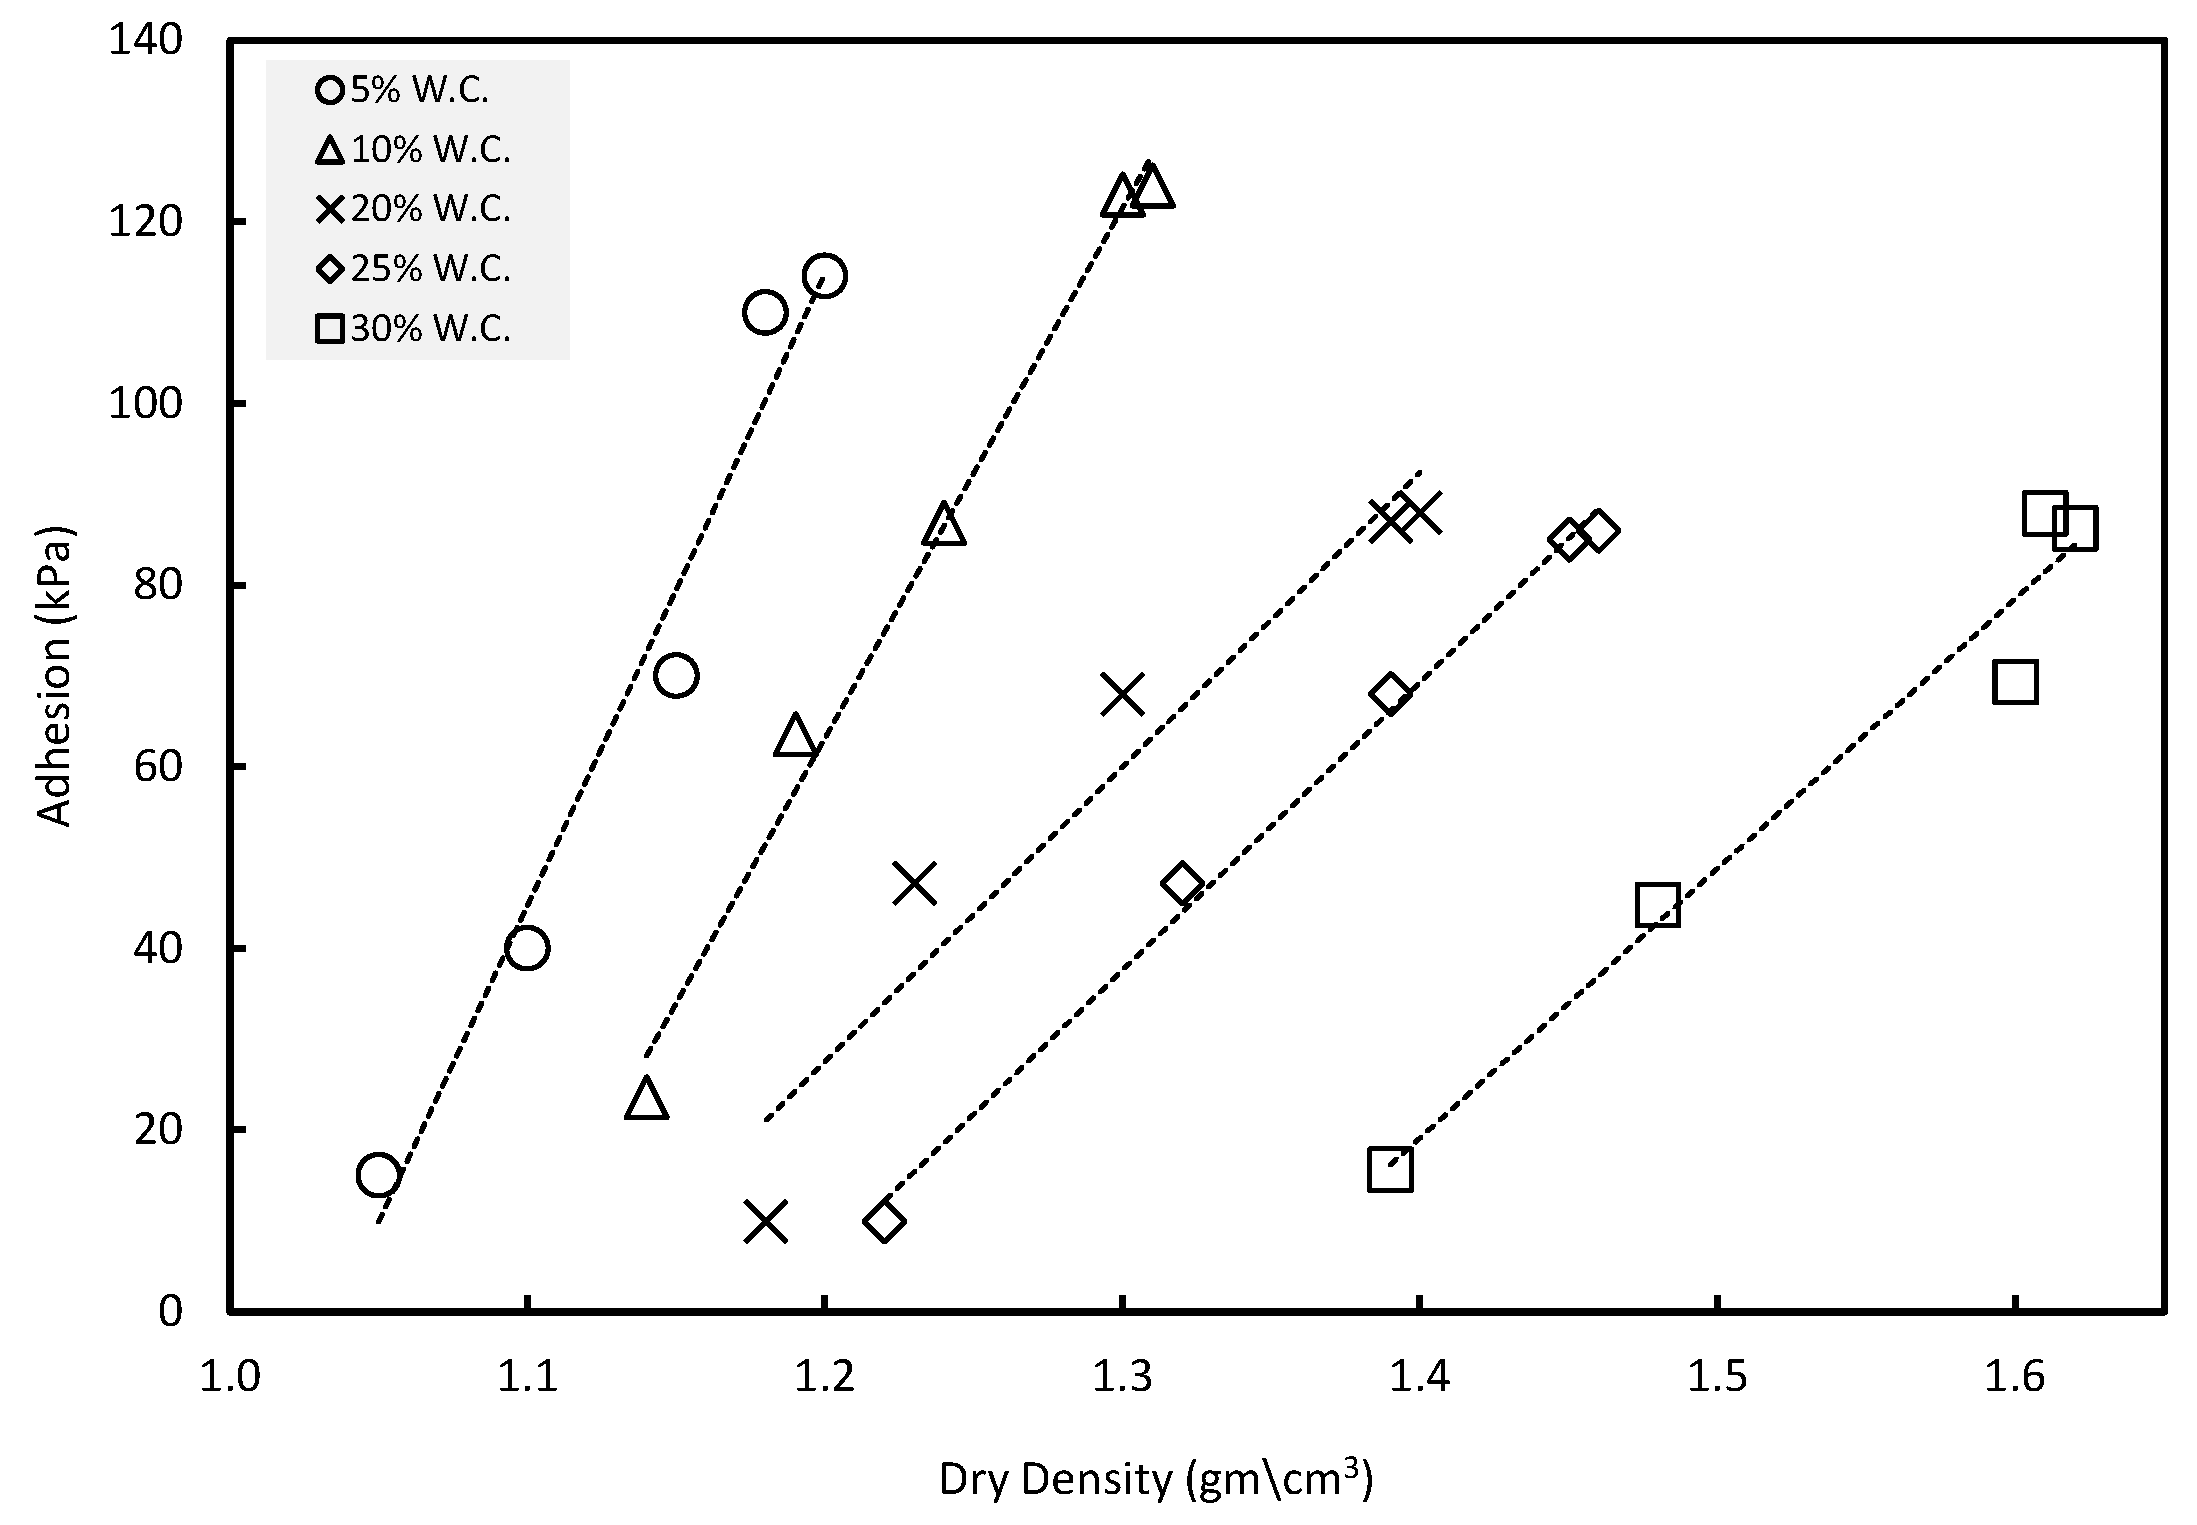
The relationship between dry density and interfacial shear adhesion at the dry-side is presented in
Figure 10. It is observed that there is a linear relationship between dry density and shear adhesion, wherein an increase in dry density leads to an increase in shear adhesion at each moisture content. This finding highlights the importance of compaction in influencing interfacial adhesion behaviour.
When kaolin clay is compacted to a greater extent within the dry-side, the soil particles come closer to each other, resulting in creating a denser surface area. This densification of the soil enhances the contact area between kaolin and the brass mould. Consequently, the interfacial shear adhesion is strengthened due to the increased contact between the soil particles and the mould surface. It should be noted that the extent of the increase in dry density is dependent on the moisture content. In other words, the effect of dry density on interfacial shear adhesion varies with the moisture content. Furthermore, detailed analysis revealed that the impact of dry density on shear adhesion is more pronounced at the dry-side of the compaction curve compared to the wet-side.
3.3. Moisture Content
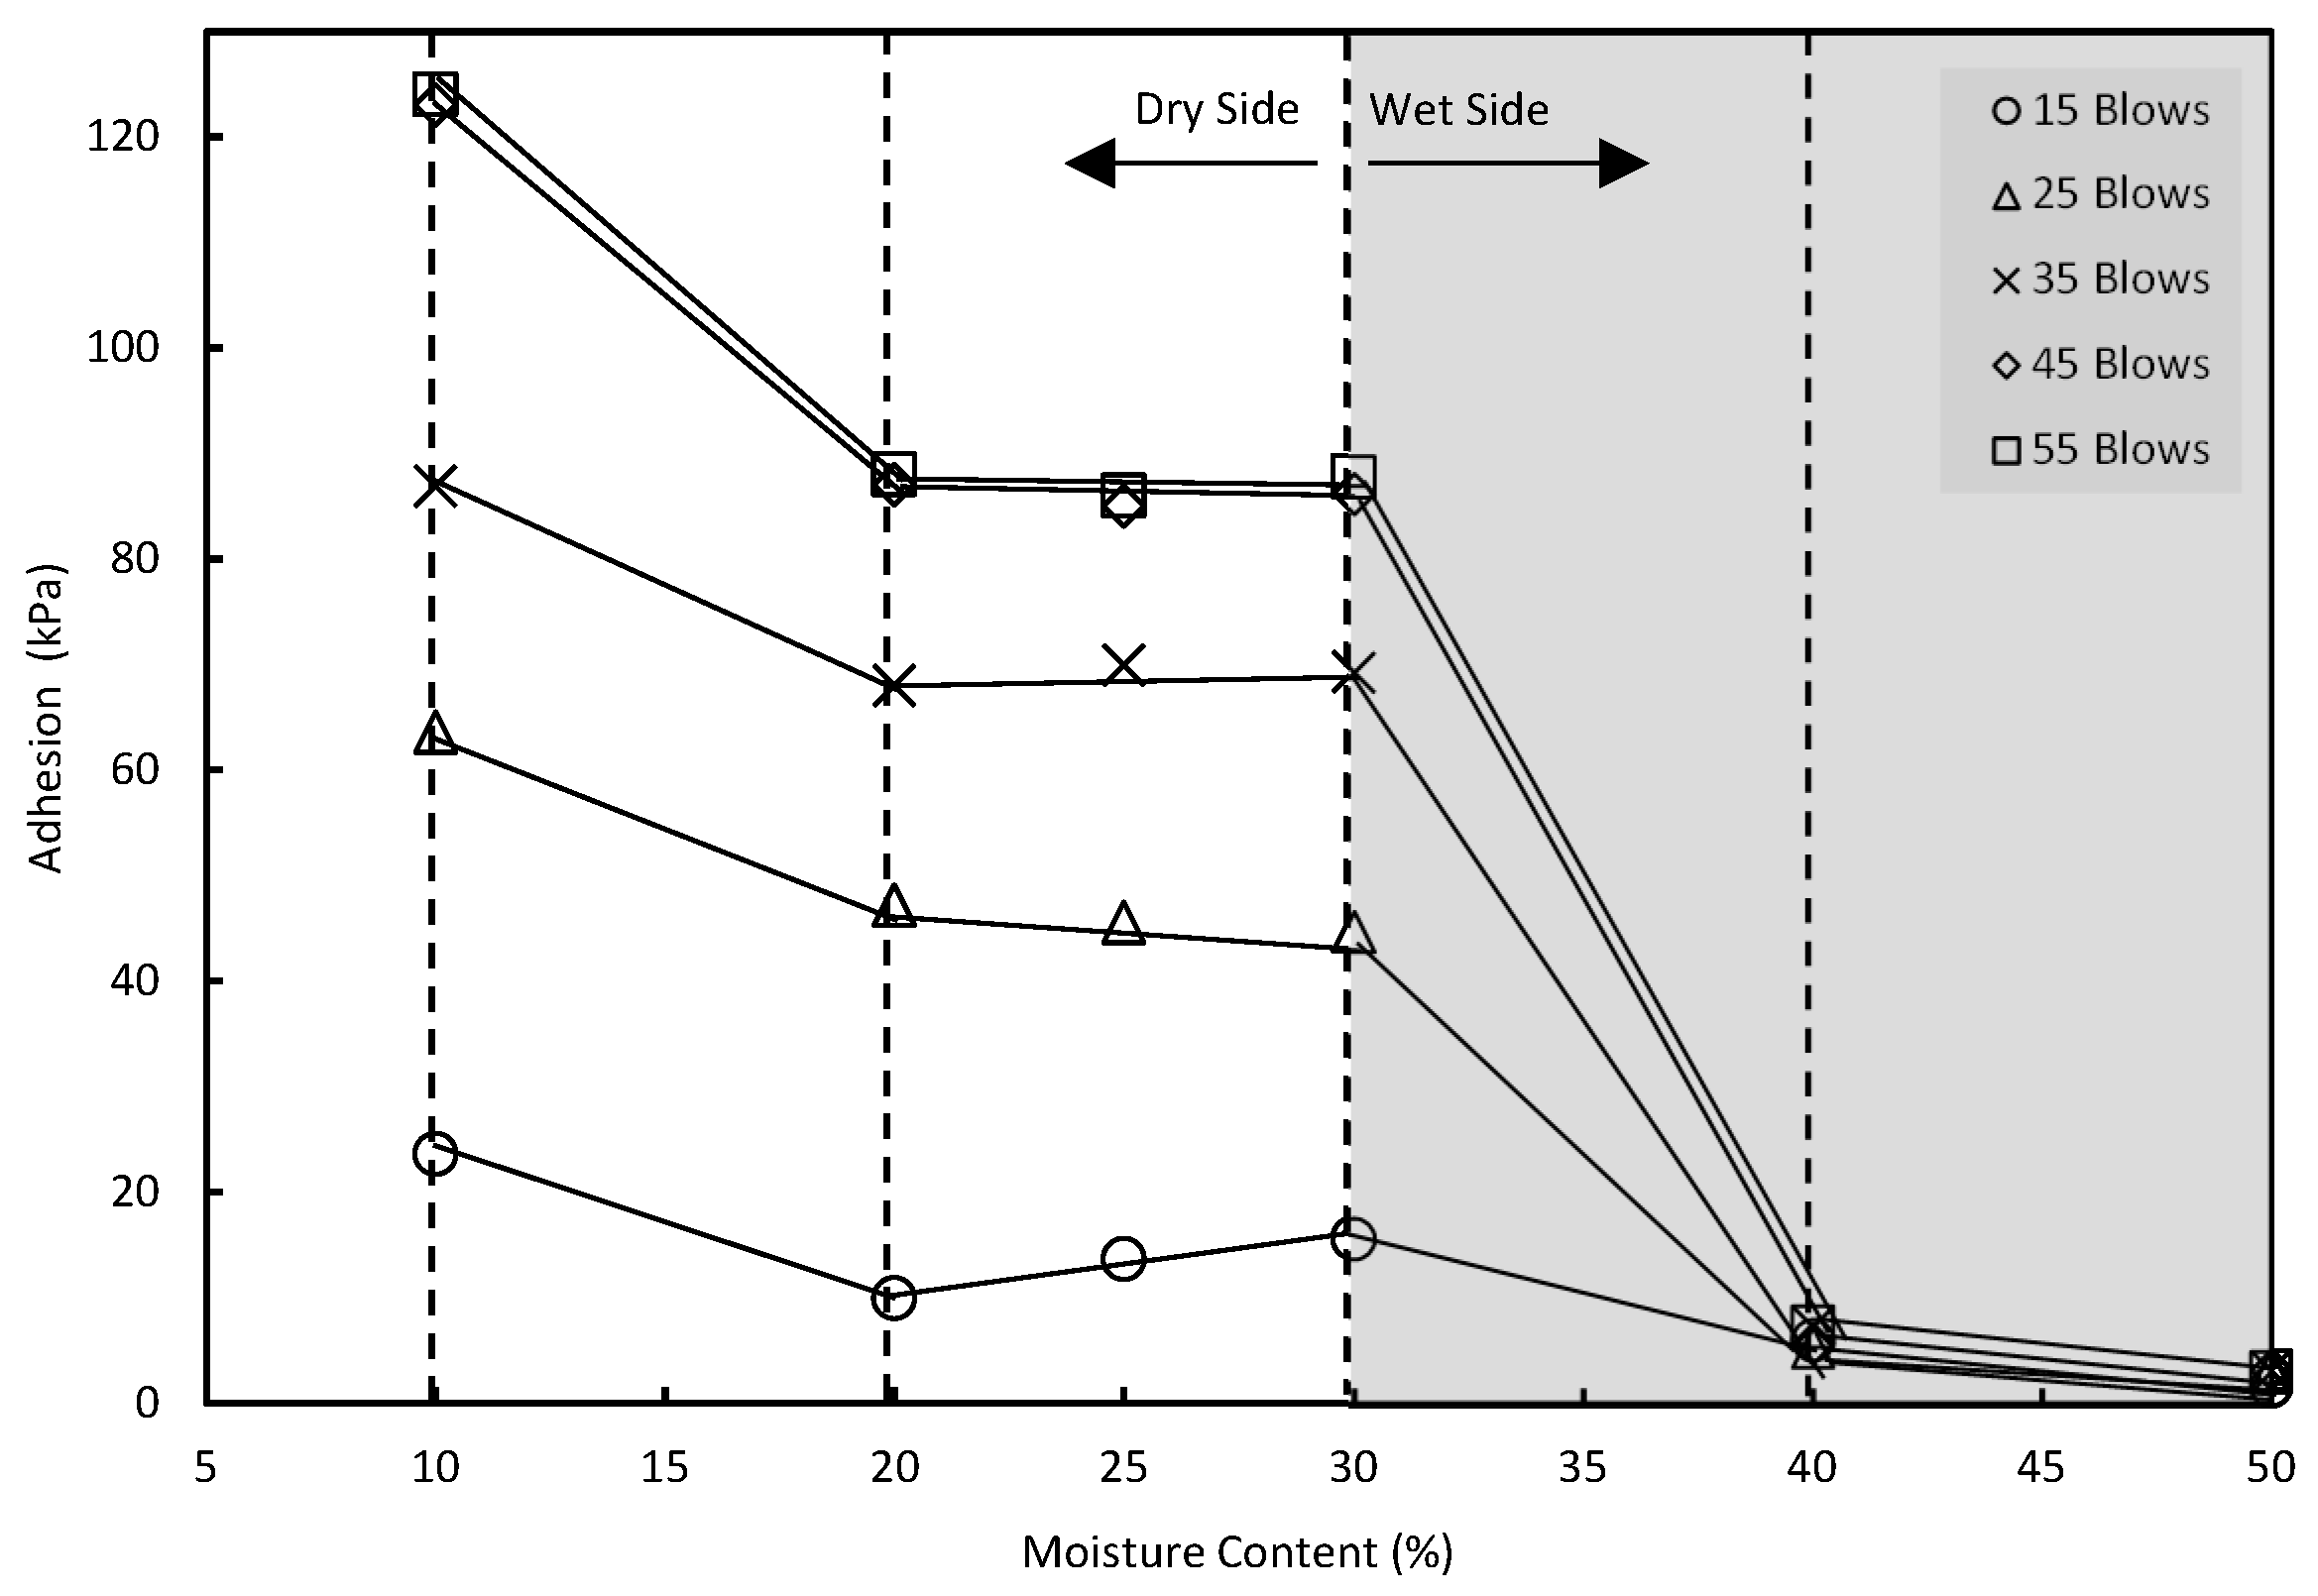
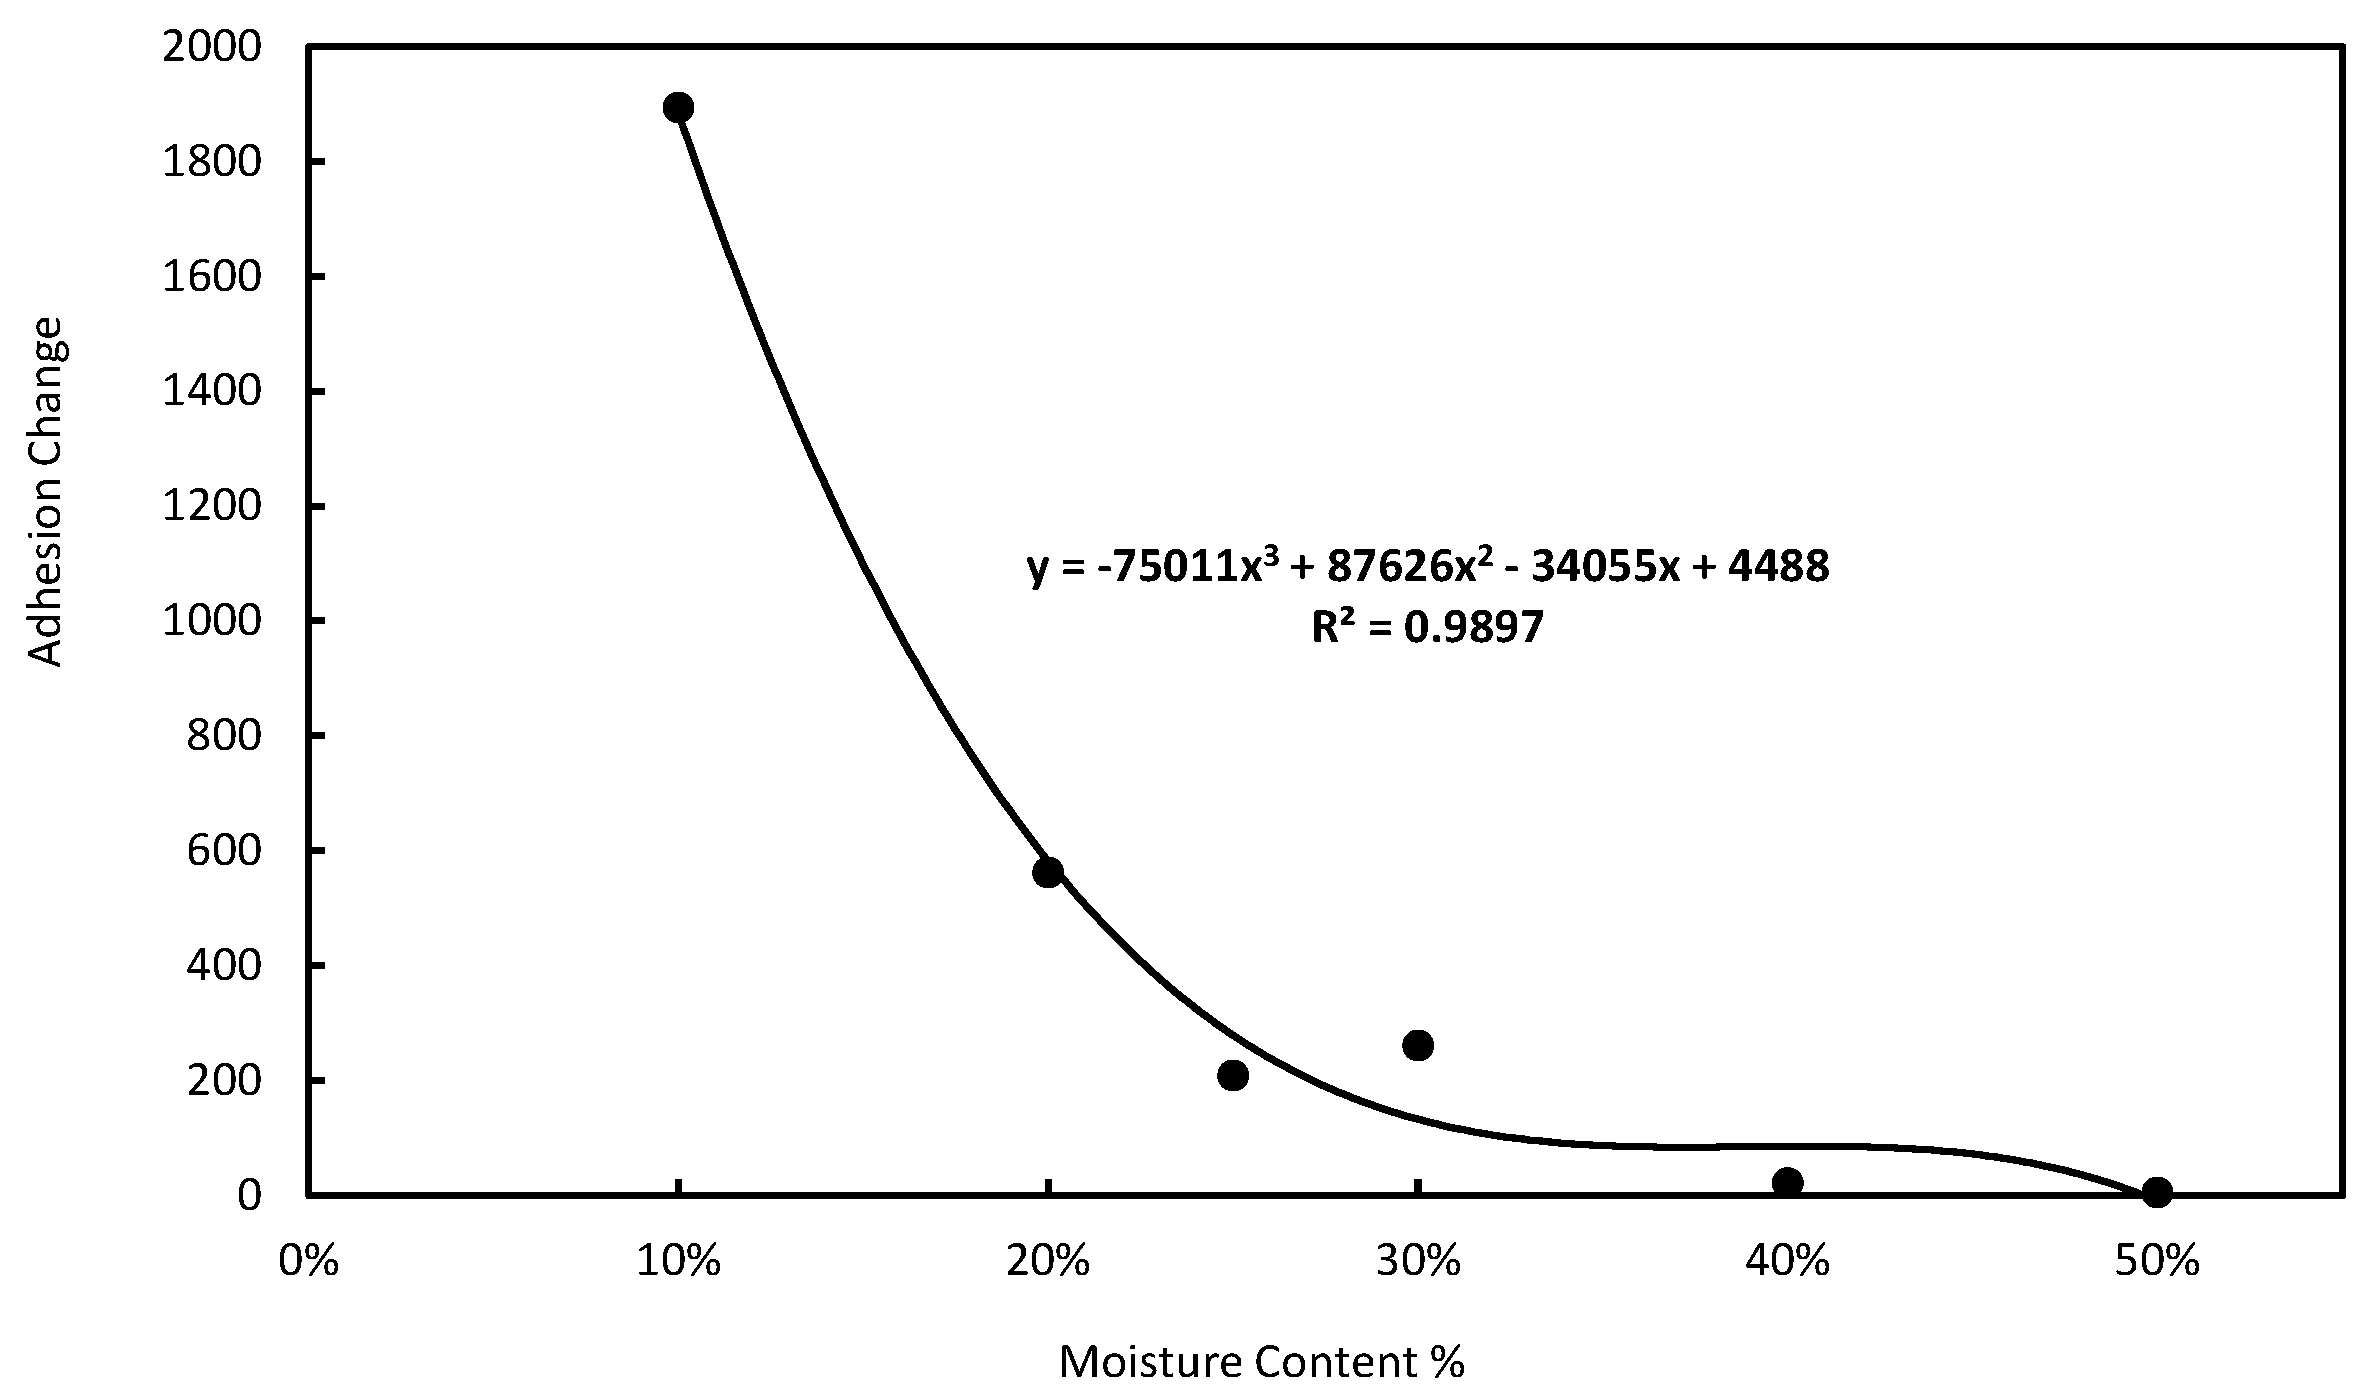
Figure 11 provides insight into the behaviour of interfacial shear adhesion in compacted kaolin under the influence of moisture content. It has been observed that the lowest moisture content and degree of saturation results in the highest adhesion amongst the different levels of compacted kaolin on the dry-side. However, when the moisture content approaches the OMC, especially between 20% and 30%, increasing the moisture content no longer affects adhesion.
The behaviour of the unaffected area on the dry-side can be explained by considering the maximum dry density of the soil at that point. At the OMC, the soil reaches its maximum dry density, resulting in a dense contact area between the kaolin and the mould surface. This dense interface contributes to the formation of the strongest interfacial adhesion. Consequently, there is a balanced effect between dry density, which typically improves adhesion, and moisture content, which often decreases adhesion. On the other hand, on the wet-side, which is characterized by extreme moisture content and a high degree of saturation, a significant decrease in interfacial shear adhesion is observed. At the highest moisture content of 50%, the interface adhesion becomes null. This behaviour can be attributed to the detrimental effects of excessive moisture content and saturation on the interfacial adhesion properties of the kaolin.
3.4. Coupling effect of dry density and moisture content
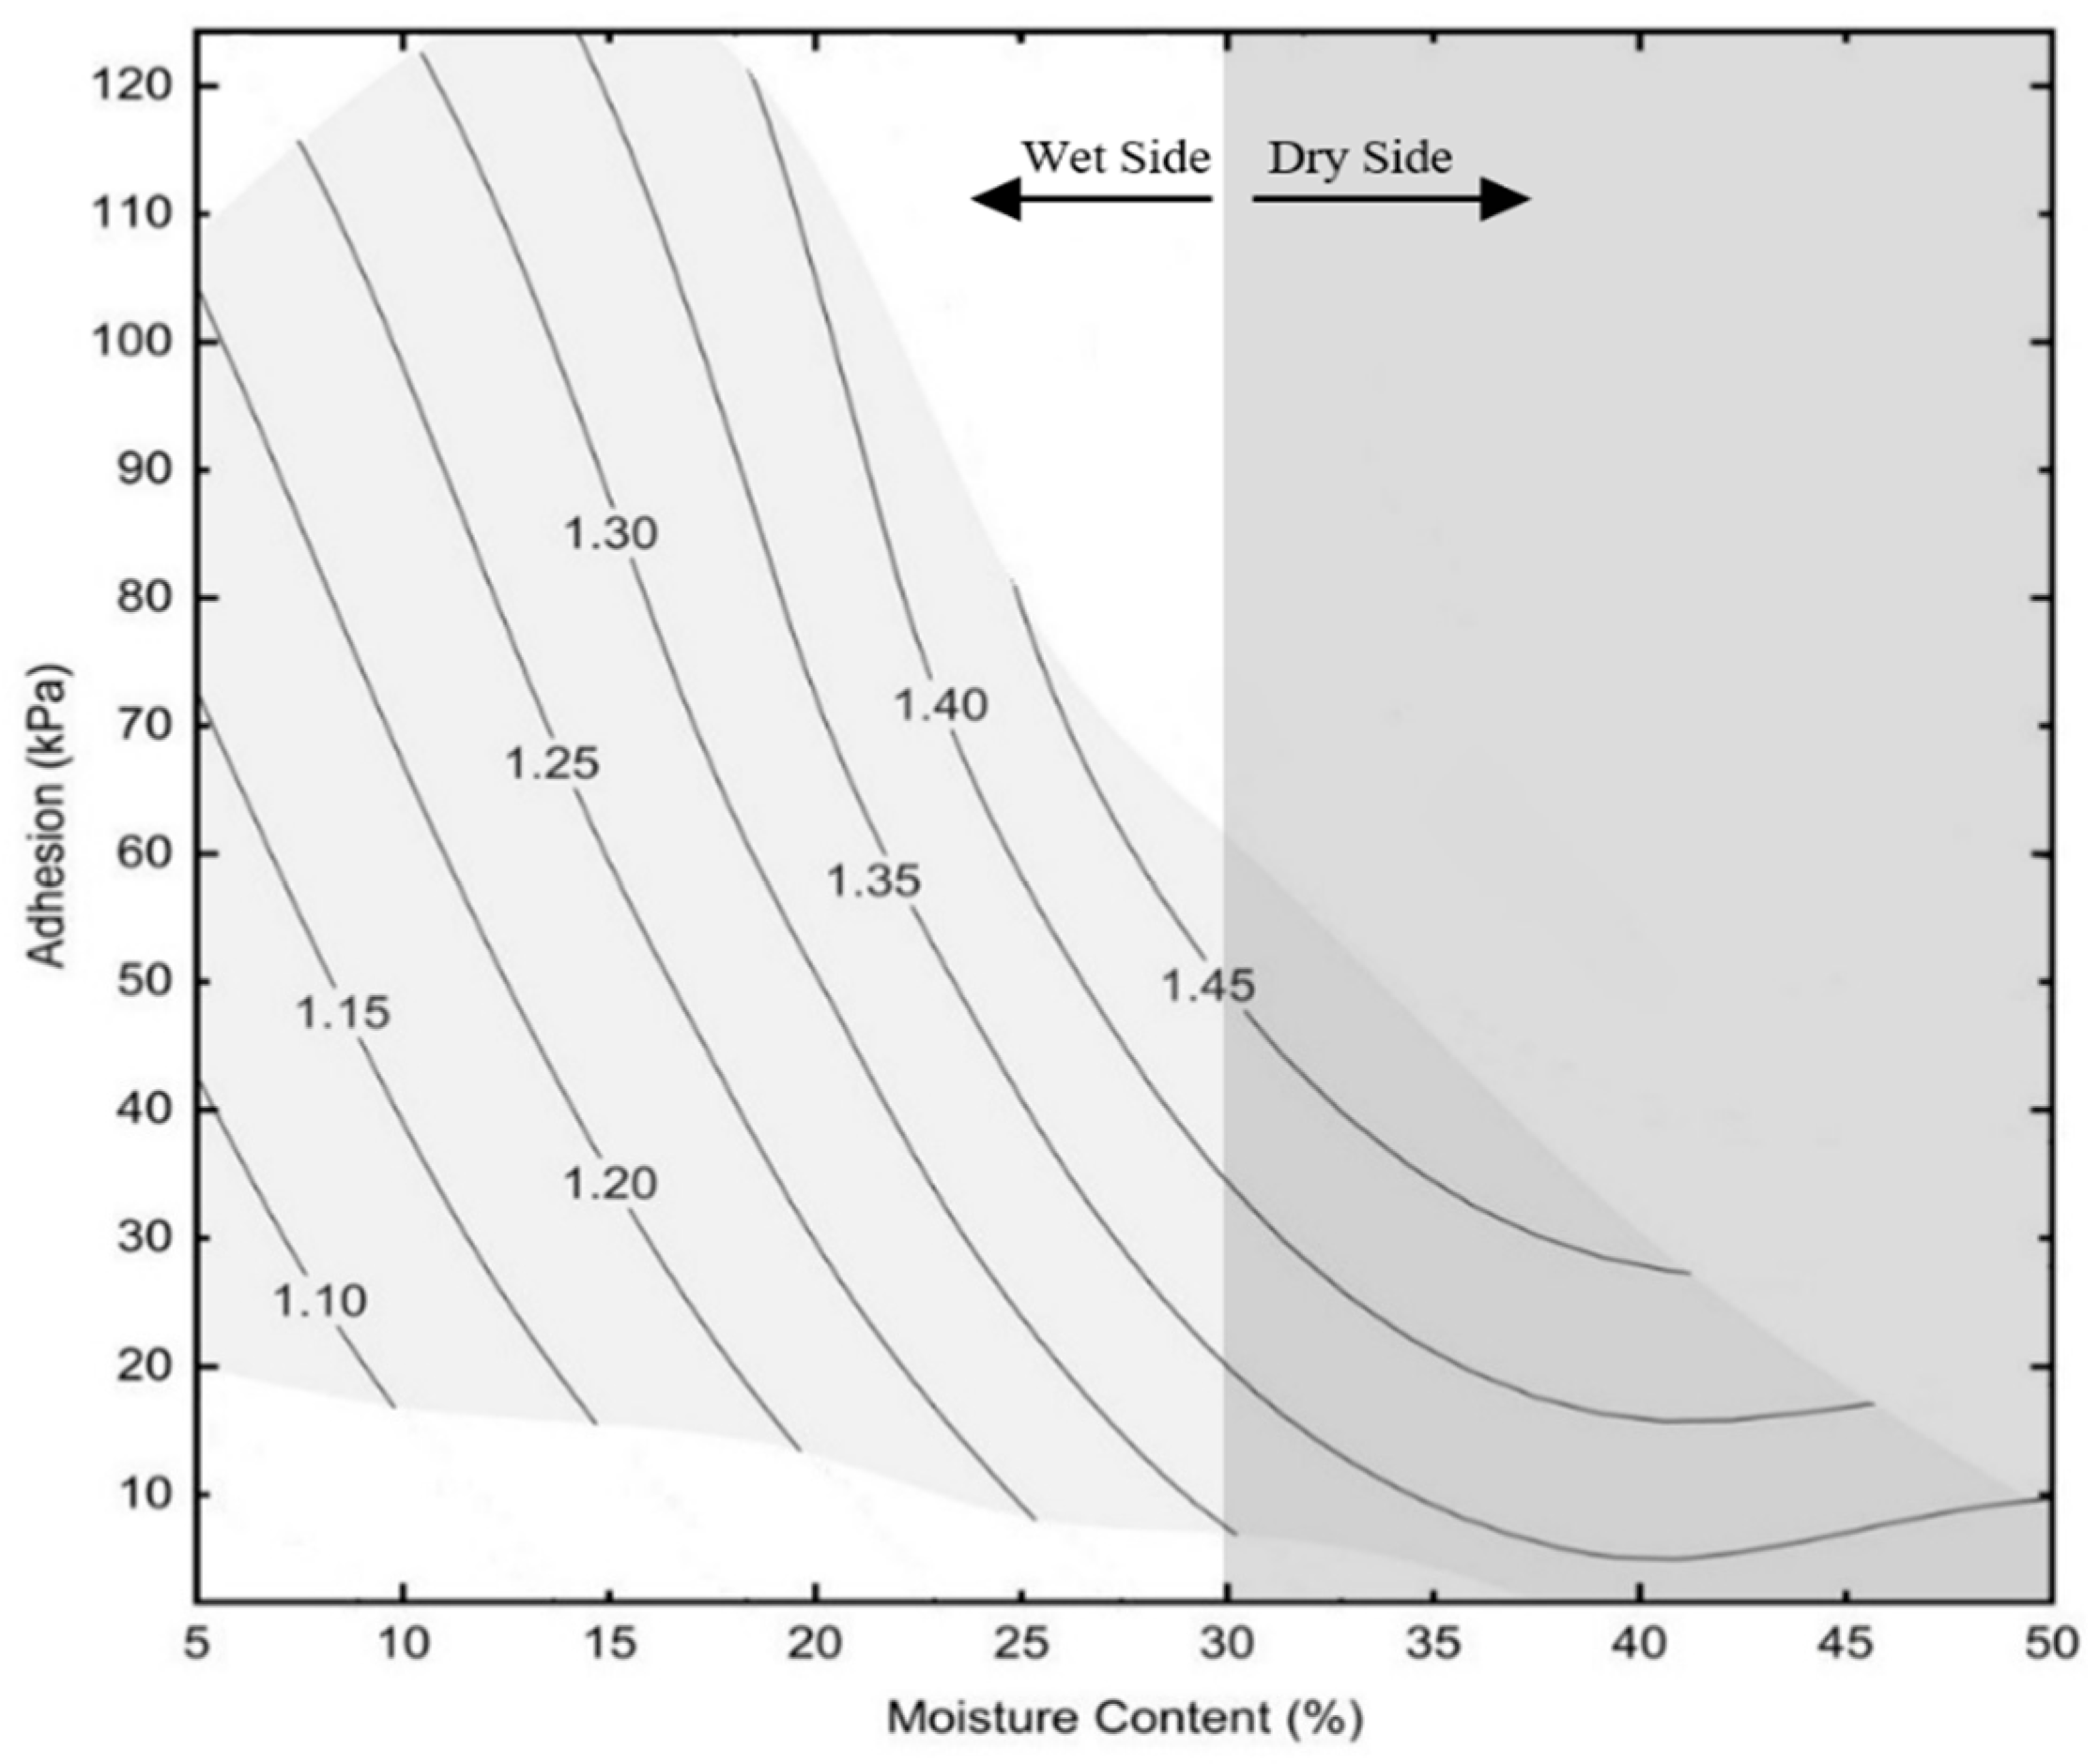
Figure 12 presents a novel three-dimensional graph showing the coupling effect of dry density and moisture content on the interfacial shear adhesion between kaolin and a brass mould. This graph provides a comprehensive visualization of the relationship between these two parameters and their influence on shear adhesion. For the studied case, the light grey shaded area represents the possible shear adhesion values in relation to moisture content (w
c) and dry density (ꝩ
dry). The diagram of the contour lines provides valuable insights. It shows that at constant dry density, shear adhesion tends to decrease as moisture content increases. This relationship suggests that higher moisture content generally leads to a reduction in interfacial adhesion between kaolin and brass mould.
However, it is important to note that the rate of shear adhesion reduction varies with dry density, as shown in
Figure 13. The information provided by these contour lines allows for a more detailed understanding of the interaction between dry density, moisture content, and interfacial shear adhesion. The graph shows that changes in these parameters affect the adhesion behaviour of the kaolin. This understanding can help optimize compaction processes and control moisture content to achieve desired shear adhesion properties.
4. Discussion
The interfacial adhesion behaviour between kaolin and brass can vary depending on whether it is observed on the dry or wet-side of the compaction curve. The compaction curve is a graph showing the relationship between compaction pressure and the resulting density or porosity of a material. Analysis of the interfacial adhesion behaviour on either side of the compaction curve can provide insight into the mechanisms that control the interaction between kaolin and brass. The experimental results show that the interfacial adhesion of kaolin to brass is affected by both dry density and moisture content.
4.1. Mechanism of adhesion on the dry-side
It has been observed that on the dry-side of the compaction curve, interfacial adhesion increases with higher dry density values at any moisture content. Conversely, adhesion decreases with increasing moisture content, as summarized in
Table 4. On the dry-side of the compaction curve, where the pressure is relatively low, the interfacial adhesion behaviour between kaolin and brass is mainly influenced by physical interlocking and mechanical friction. When pressure is applied, the kaolin particles tend to encounter the brass surface, creating points of contact and interlocking. This physical interlocking creates a certain level of adhesion between the two materials. In addition, the roughness and surface irregularities of the brass surface can contribute to adhesion. The kaolin particles can fill in the gaps and irregularities on the brass surface, resulting in a larger contact area and stronger adhesion.
4.2. Mechanism of adhesion on the OMC
At the OMC point on the compaction curve, where pressure is at its peak, the adhesion behaviour between kaolin and brass undergoes marked changes. Moisture content plays a crucial role in influencing the underlying adhesion mechanisms in that specific region. However, despite the observed changes, it should be noted that the interfacial adhesion at the OMC is not the highest. The adhesion between kaolin and brass weakens with increasing moisture content, demonstrating the negative influence of increased moisture levels on the strength of interfacial adhesion.
4.3. Mechanism of adhesion on the wet-side
In contrast, on the dry-side of the compaction curve, the presence of excessive moisture content can adversely affect the bonds between individual kaolin particles. The water essentially acts as a lubricant, reducing friction and interlocking between the particles. This weakens the bond between the particles, resulting in a significant decrease in the overall adhesion strength at the interface.
4.4. Matric Suction Role
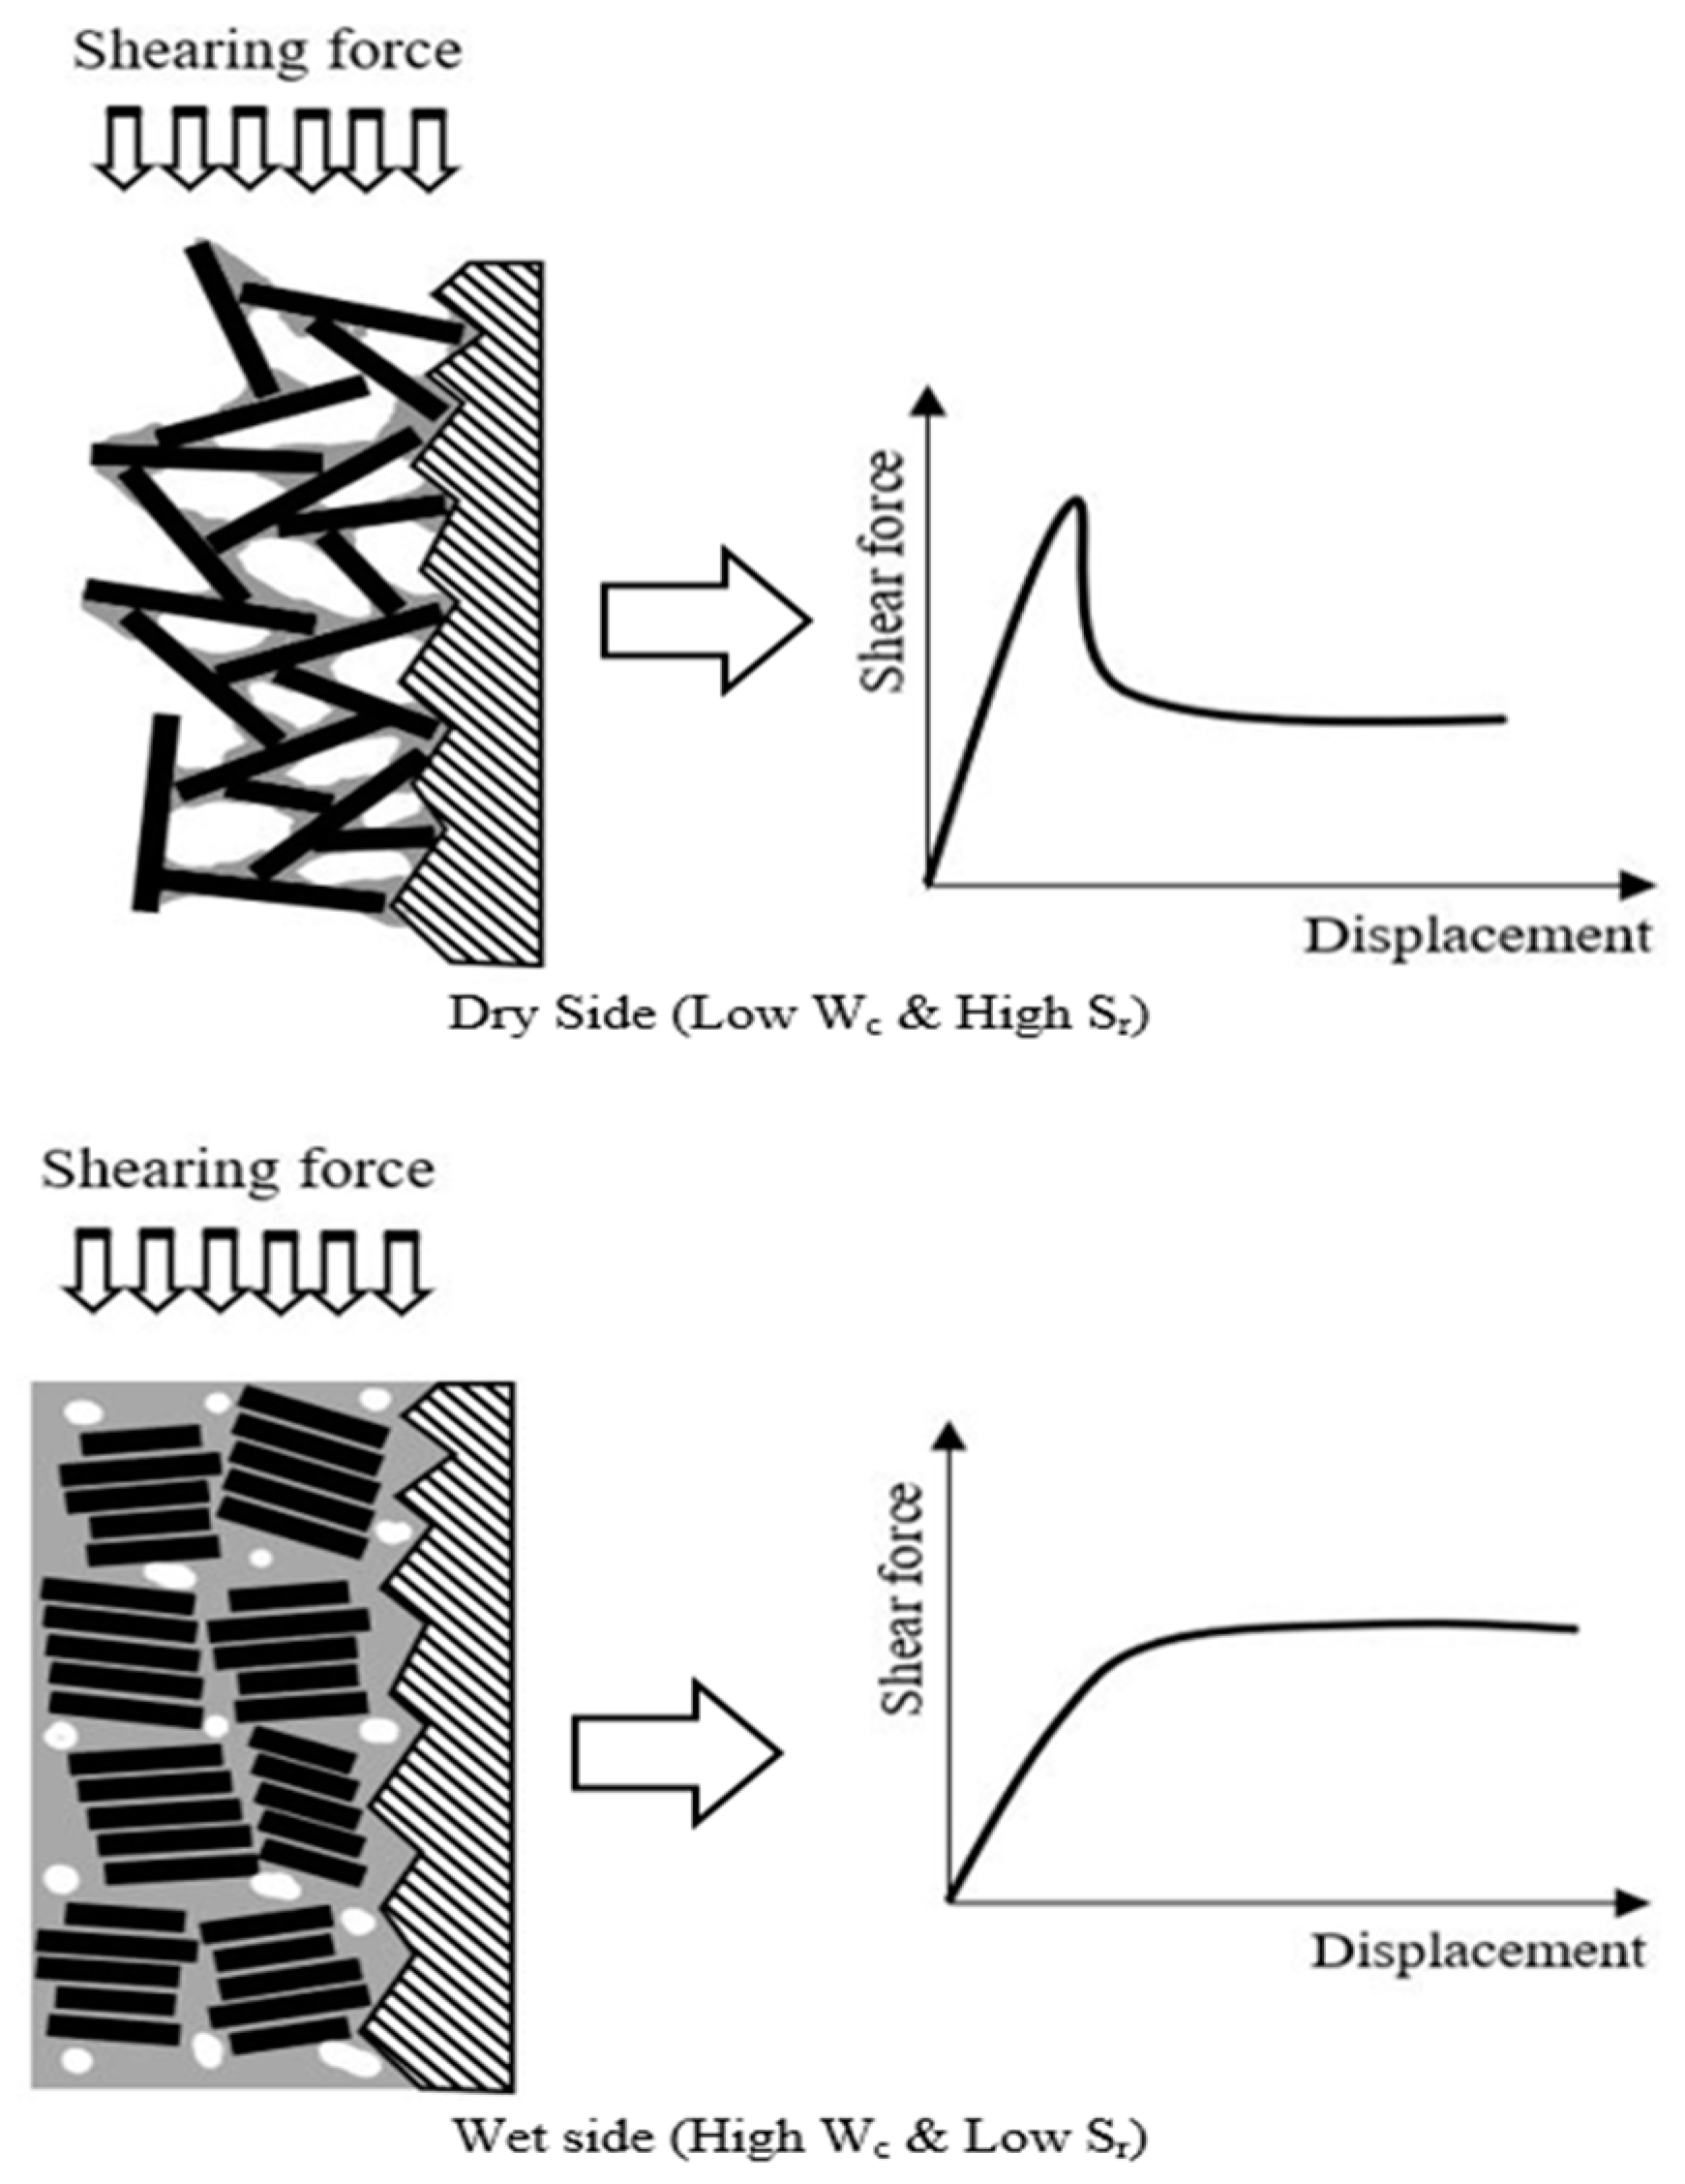
This complex behaviour is further explained by the matric suction effect.
Figure 14 illustrates the role of matric suction in binding the kaolin particles to the inner surface of the compaction mould. On the dry-side, which is characterized by low moisture content and high soil suction, interfacial bonding is strong, resulting in increased interfacial adhesion. On the other hand, on the wet-side, which is characterized by high moisture content and low soil suction, interfacial bonding becomes weak and has a negligible impact on interfacial adhesion.
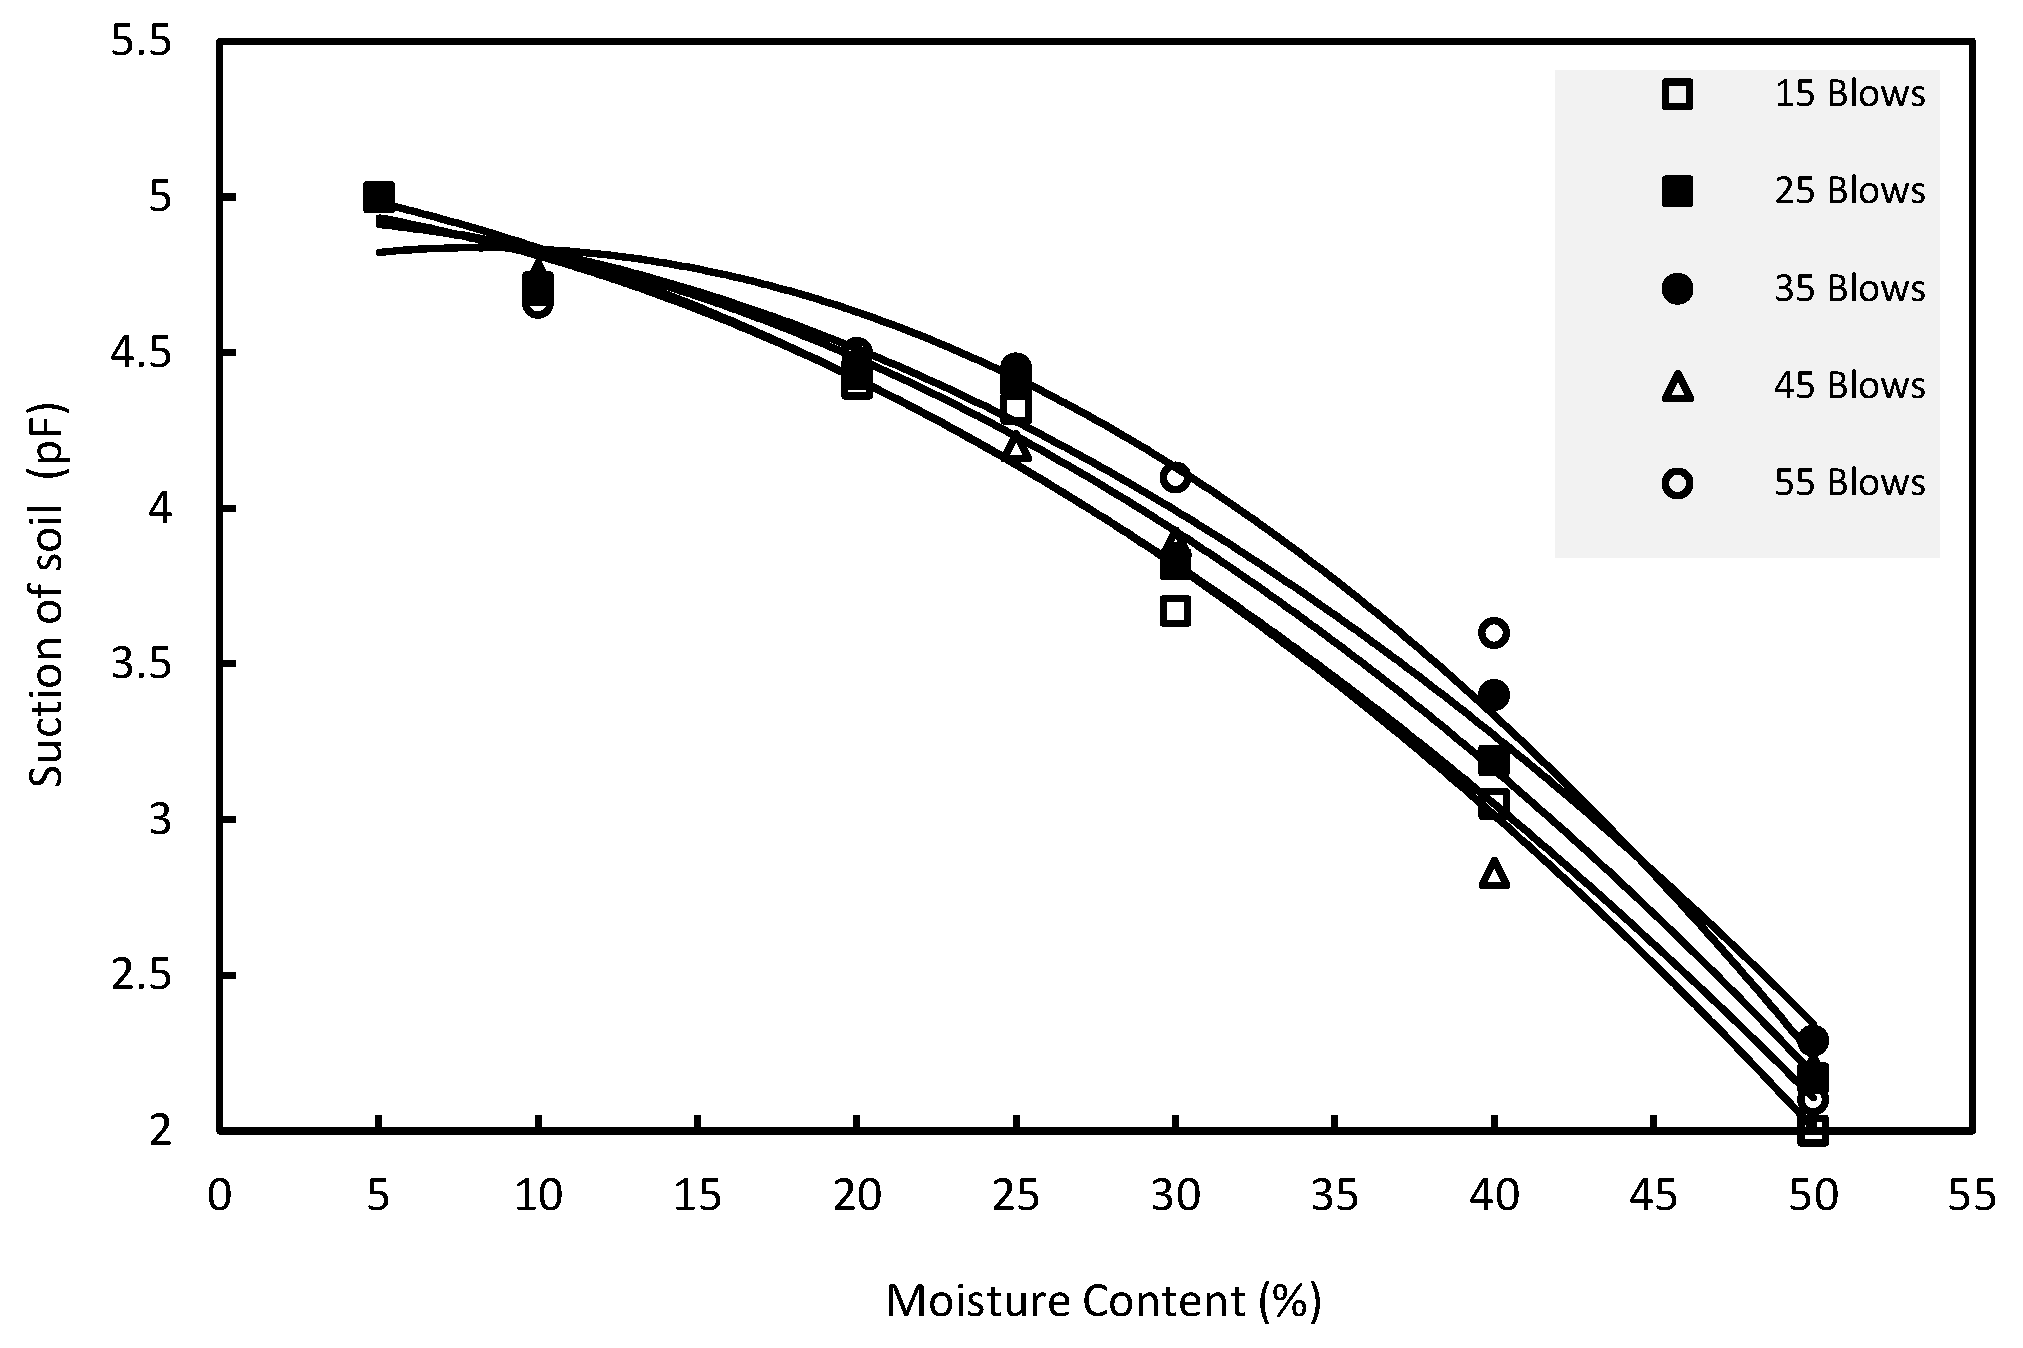
Kaolin exhibits high suction power on the dry-side when moisture content is low, and low suction power on the wet-side when moisture content is high, as shown in
Figure 15.
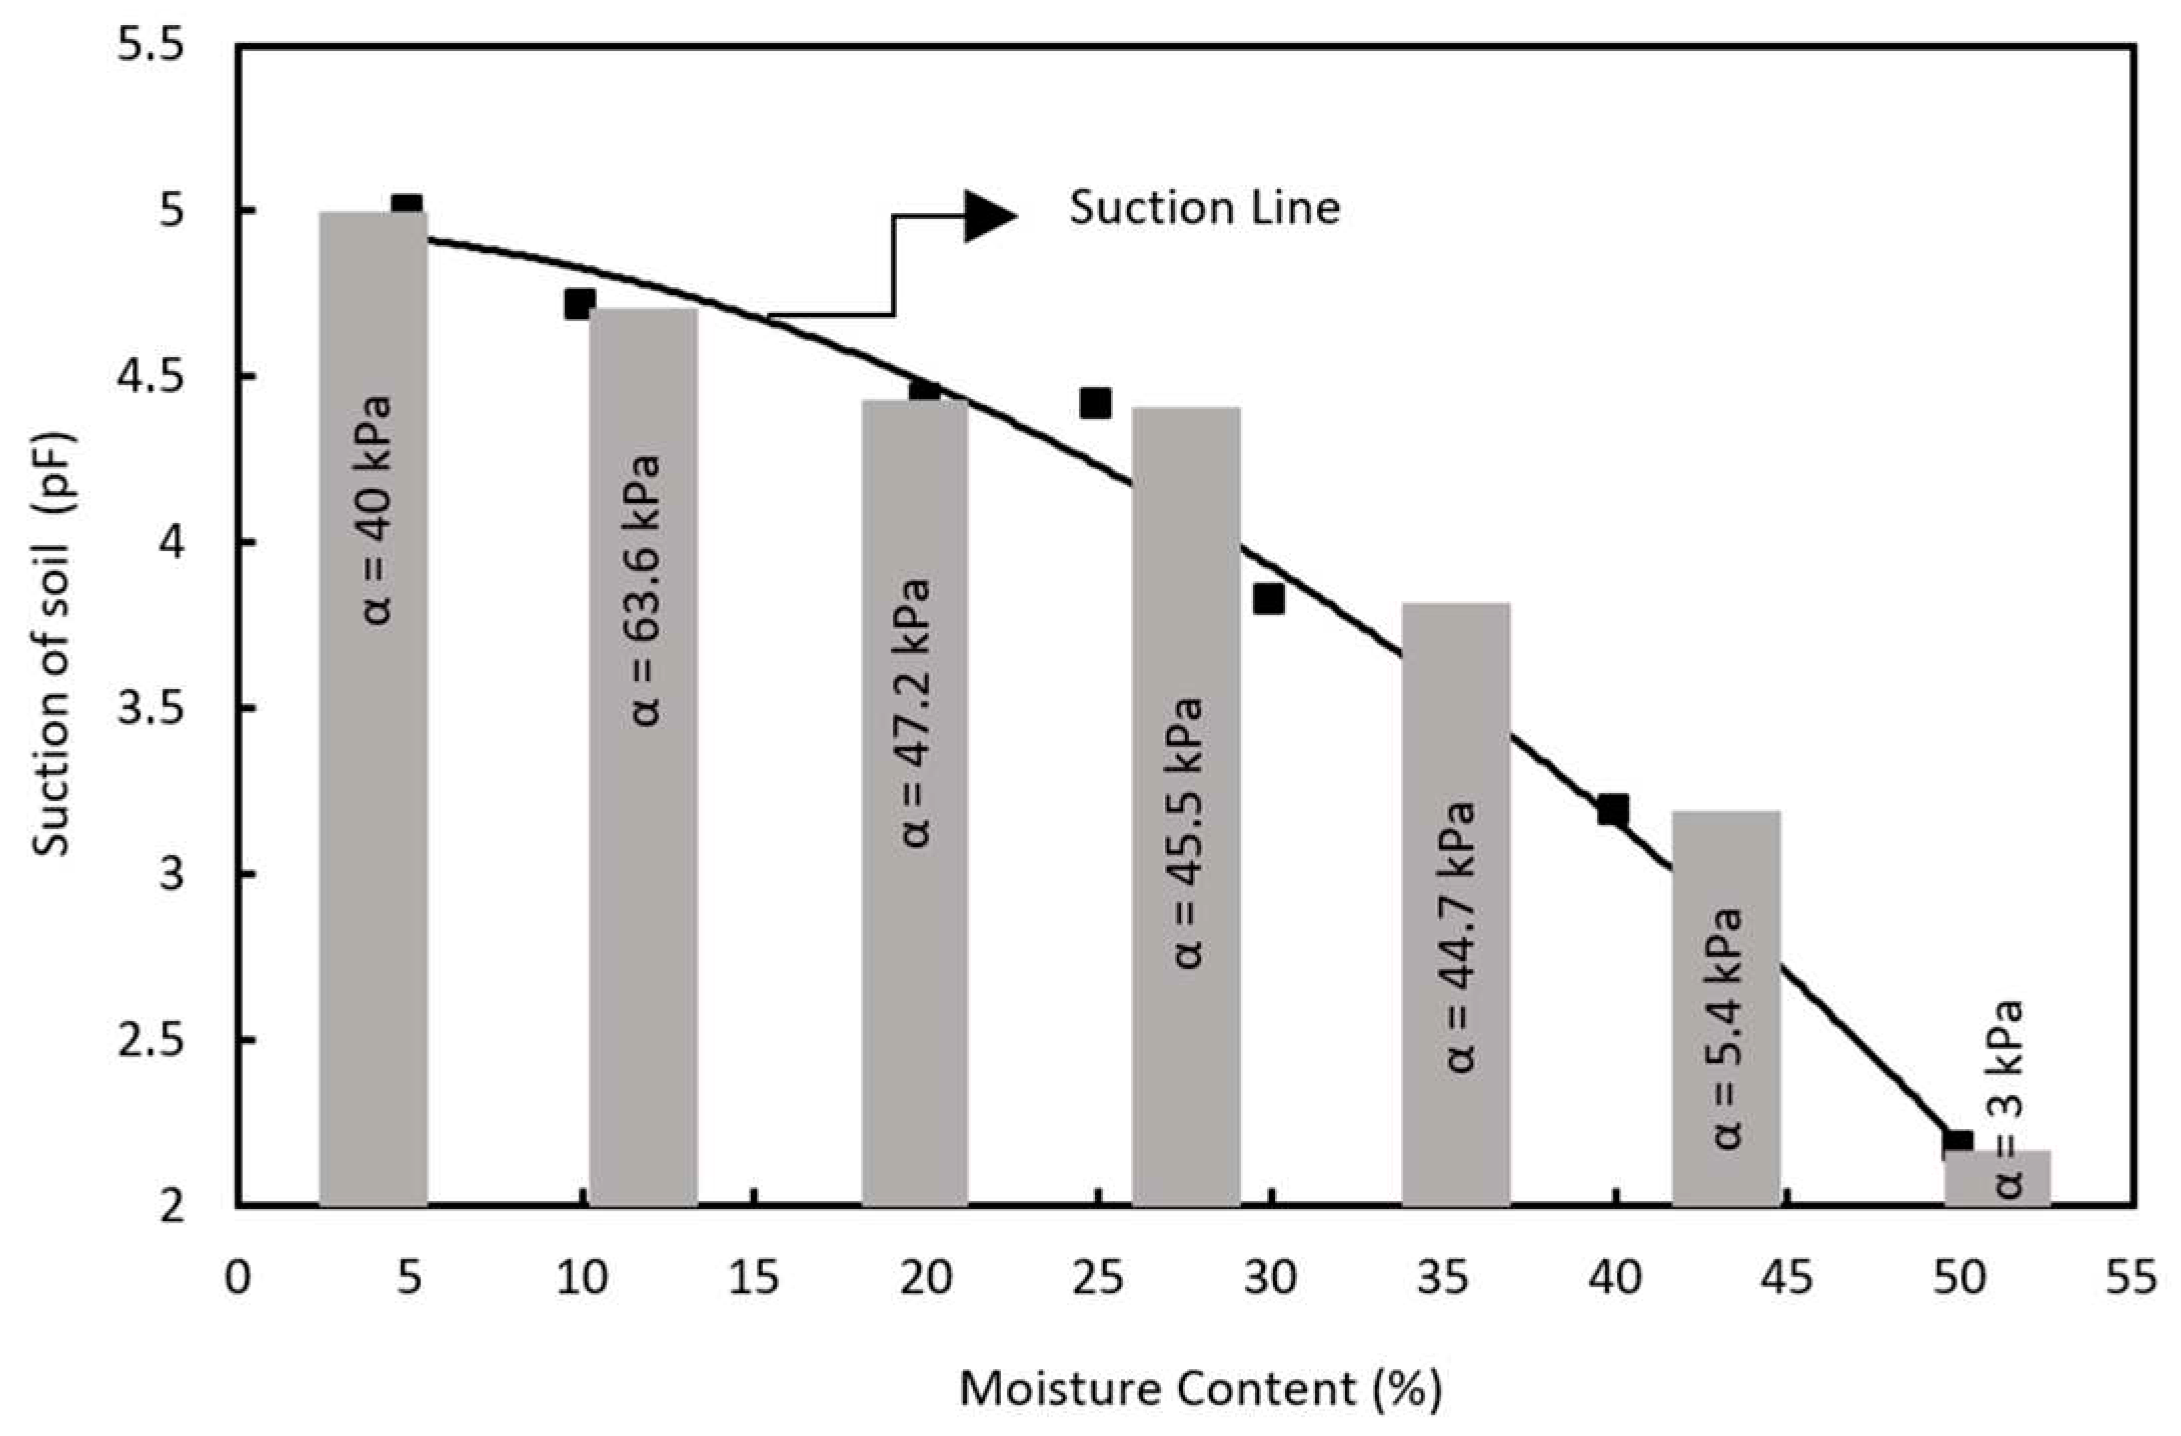
The influence of suction on the shear adhesion on both sides, as shown in
Figure 16, concluded that the suction has no significant influence on the adhesion on the wet side due to its relatively small value. Consequently, the significant reduction in soil suction as moisture content increases from 10% to 30% on the dry-side accelerates the loss of adhesion. In contrast, on the wet-side, beyond the OMC of 30%, the effect of soil suction decreases due to the high degree of saturation, leading to a sudden failure of the interfacial adhesion. This adhesion failure is due to the combined effect of high moisture content, where the soil is fully saturated, and low suction.
5. Conclusions
This study investigated the behaviour of interfacial shear adhesion between kaolin clay and the inner surface of a brass mould. Moisture content and compaction energy were studied as factors influencing shear adhesion at the interface. The results shed light on the relationship between these factors and shear adhesion, providing valuable insights for geotechnical applications.
The study used a novel and simple method to measure shear adhesion at the interface. In this method, a loading machine was used to apply a displacement-controlled load to the pre-compacted soil. The results showed that on the dry-side of the compaction curve, there is a direct relationship between dry density and shear adhesion. Increasing dry density results in improved shear adhesion due to soil densification and a larger contact area with the mould surface.
In addition, the research showed that moisture content plays a critical role in interfacial shear adhesion. The lowest moisture content and saturation level within the dry-side of the compaction curve resulted in the highest adhesion. However, as the moisture content approached the OMC, the increase in moisture content no longer affected adhesion. Excessive moisture content and high saturation on the wet-side resulted in a significant decrease in shear adhesion at the interface, with adhesion becoming zero at the highest moisture content.
The behaviour can be further explained by considering the role of matrix suction, in which the strength of interfacial bonding is influenced by suction. On the dry-side, high suction improves interfacial adhesion, while on the wet-side, low suction results in weaker bonding and reduced adhesion.
These insights are practical and applicable to geotechnical engineering. Optimizing compaction processes and being able to make informed decisions about geotechnical structure design and performance is facilitated by understanding the relationship between moisture content, dry density, and shear adhesion. The results help improve the stability and interaction of soils with surrounding materials and address potential issues such as stickiness during excavation or clogging problems in tunnel boring machines.
This study provides valuable insights into the behaviour of interfacial shear adhesion in kaolin clay. The results improve the understanding of the factors affecting shear adhesion, provide guidance for geotechnical engineering applications, and ultimately contribute to the development of more efficient and reliable construction practices. Further research in this area could investigate other soil types and increase the understanding of interfacial adhesion in different geotechnical contexts.
References
- Fountaine, E. , Investigations into the mechanism of soil adhesion. Journal of soil science, 1954, 5, 251–263. [Google Scholar] [CrossRef]
- Tong, J. , et al, Characteristics of adhesion between soil and solid surfaces. Journal of Terramechanics, 1994, 31, 93–105. [Google Scholar] [CrossRef]
- Alberto-Hernandez, Y. , et al, Clogging potential of tunnel boring machine (TBM): a review. International Journal of Geotechnical Engineering, 2018, 12, 316–323. [Google Scholar] [CrossRef]
- Jia, X. , Theoretical analysis of the adhesion force of soil to solid materials. Biosystems engineering, 2004, 87, 489–493. [Google Scholar] [CrossRef]
- Soni, P. and V.M. Salokhe, Theoretical analysis of microscopic forces at soil-tool interfaces: a review. Agricultural Engineering International: CIGR Journal 2006. [Google Scholar]
- Sass, I. and U. Burbaum, A method for assessing adhesion of clays to tunneling machines. Bulletin of engineering geology and the environment 2009, 68, 27–34. [CrossRef]
- Zhang, J., Z. Sang, and L. Gao, Adhesion and friction between soils and solids. Nung yeh chi hsieh hsueh pao= Transactions of the Chinese society of agricultural machinery 1986.
- Liu, P. , et al, Tangential adhesion strength between clay and steel for various soil softnesses. Journal of Materials in Civil Engineering 2019, 31, 04019048. [Google Scholar] [CrossRef]
- Bhushan, B. , Adhesion and stiction: mechanisms, measurement techniques, and methods for reduction. Journal of Vacuum Science & Technology B: Microelectronics and Nanometer Structures Processing, Measurement, and Phenomena, 2003, 21, 2262–2296. [Google Scholar]
- Satomi, T., H. Nihei, and H. Takahashi. Investigation on characteristics of soil adhesion to metallic material surface and soil animal’s cuticle. in Proceedings of the 15th International Conference on Experimental Mechanics. 2012.
- Sladen, J. , The adhesion factor: applications and limitations. Canadian Geotechnical Journal, 1992, 29, 322–326. [Google Scholar] [CrossRef]
- Thewes, M. and W. Burger, Clogging of TBM drives in clay–identification and mitigation of risks. Underground space 2005. [Google Scholar]
- Atkinson, J. , et al, Destructuring and disaggregation of Mercia Mudstone during full-face tunnelling. Quarterly Journal of Engineering Geology and Hydrogeology, 2003, 36, 293–303. [Google Scholar] [CrossRef]
- Jancsecz, S., R. Krause, and L. Langmaack, Advantages of soil conditioning in shield tunnelling: experiences of LRTS Izmir. Challenges for the 21st Century, Alten et al (eds), 1999: p. 865-875.
- Basmenj, A.K. , et al, Assessment of the adhesion potential of kaolinite and montmorillonite using a pull-out test device. Bulletin of Engineering Geology and the Environment, 2016, 76, 1507–1519. [Google Scholar] [CrossRef]
- Zumsteg, R. and A.M. Puzrin, Stickiness and adhesion of conditioned clay pastes. Tunnelling and Underground Space Technology, 2012, 31, 86–96. [CrossRef]
- Azadegan, B. and J. Massah, Effect of temperature on adhesion of clay soil to steel. Cercetari Agronomice in Moldova, 2012, 45, 21–27. [CrossRef]
- Burbaum, U. and I. Sass, Physics of adhesion of soils to solid surfaces. Bulletin of Engineering Geology and the Environment, 2017, 76, 1097–1105. [CrossRef]
Figure 1.
Illustration of adhesion and cohesion of soil.
Figure 1.
Illustration of adhesion and cohesion of soil.
Figure 2.
The adhesive tensile strength (normal pull) and the adhesive shear strength (tangential pull).
Figure 2.
The adhesive tensile strength (normal pull) and the adhesive shear strength (tangential pull).
Figure 3.
Factors affecting interfacial soil adhesion.
Figure 3.
Factors affecting interfacial soil adhesion.
Figure 4.
Pile Foundation and stickiness during digging.
Figure 4.
Pile Foundation and stickiness during digging.
Figure 5.
Soil sticking to agricultural equipment.
Figure 5.
Soil sticking to agricultural equipment.
Figure 6.
Particle size distribution of Kaolin.
Figure 6.
Particle size distribution of Kaolin.
Figure 7.
Schematic diagram of the apparatus and the test setup.
Figure 7.
Schematic diagram of the apparatus and the test setup.
Figure 8.
Kaolin adhesion at 30% optimum moisture, varying compaction levels.
Figure 8.
Kaolin adhesion at 30% optimum moisture, varying compaction levels.
Figure 9.
Compaction curve of kaolin at different compaction levels.
Figure 9.
Compaction curve of kaolin at different compaction levels.
Figure 10.
Dry density versus interfacial adhesion on kaolin at different moisture content levels.
Figure 10.
Dry density versus interfacial adhesion on kaolin at different moisture content levels.
Figure 11.
Interface adhesion of Kaolin at different moisture content and densities.
Figure 11.
Interface adhesion of Kaolin at different moisture content and densities.
Figure 12.
Three-Dimensional contour graph of the effect of dry density and moisture content on shear adhesion of kaolin.
Figure 12.
Three-Dimensional contour graph of the effect of dry density and moisture content on shear adhesion of kaolin.
Figure 13.
The rate of adhesion-change as a function of dry density along with the increase of moisture content.
Figure 13.
The rate of adhesion-change as a function of dry density along with the increase of moisture content.
Figure 14.
Interface adhesion behaviour for dry-side versus wet-side.
Figure 14.
Interface adhesion behaviour for dry-side versus wet-side.
Figure 15.
Behaviour of suction against the moisture content for varied compacted kaolin.
Figure 15.
Behaviour of suction against the moisture content for varied compacted kaolin.
Figure 16.
Influence of suction on interface adhesion of Kaolin at a standard compaction at 25 blows.
Figure 16.
Influence of suction on interface adhesion of Kaolin at a standard compaction at 25 blows.
Table 1.
Mineral composition of the kaolin.
Table 1.
Mineral composition of the kaolin.
| Mineral |
Mass Percentage |
| Kaolinite |
83.7 |
| Muscovite |
14.0 |
| Quartz |
2.3 |
Table 2.
Engineering Properties of the used soil (Kaolin).
Table 2.
Engineering Properties of the used soil (Kaolin).
| Properties |
Value |
| Specific gravity (Gs) |
2.58 |
| LL (%) |
74 |
| PL (%) |
32 |
| PI (%) |
42 |
| Cation exchange capacity (CEC) (meq/100g) |
0.075 |
| Total surface area (m2/g) |
20 |
| Surface charge density (µC/m2) |
0.36 |
| Silicate SiO2
|
45.2 |
| Aluminium Al2O3
|
38.8 |
Table 3.
The amount of water content and number of blows used in the experiment.
Table 3.
The amount of water content and number of blows used in the experiment.
| Wc (%) |
10 |
20 |
25 |
30 |
40 |
50 |
| Number of blows |
15 |
15 |
15 |
15 |
15 |
15 |
| 25 |
25 |
25 |
25 |
25 |
25 |
| 35 |
35 |
35 |
35 |
35 |
35 |
| 45 |
45 |
45 |
45 |
45 |
45 |
| 55 |
55 |
55 |
55 |
55 |
55 |
Table 4.
Summary of interfacial adhesion behaviour for dry and wet-side.
Table 4.
Summary of interfacial adhesion behaviour for dry and wet-side.
| |
Dry-side |
Wet-side |
| Wc (%) |
10 ~ 30 |
30 ~ 50 |
| Ꝩd (g/cm3) |
1.19 Increase to 1.48 |
1.48 Decrease to 1.26 |
| Sr (%) |
22 Increase to 95 |
95 Increase to 100 |
| Su (pF) |
4.71 Decrease to 3.72 |
3.72 Decrease to 2.17 |
| α (kPa) |
64 Decrease to 45 |
45 Decrease to 3 |
|
Disclaimer/Publisher’s Note: The statements, opinions and data contained in all publications are solely those of the individual author(s) and contributor(s) and not of MDPI and/or the editor(s). MDPI and/or the editor(s) disclaim responsibility for any injury to people or property resulting from any ideas, methods, instructions or products referred to in the content. |
© 2023 by the authors. Licensee MDPI, Basel, Switzerland. This article is an open access article distributed under the terms and conditions of the Creative Commons Attribution (CC BY) license (http://creativecommons.org/licenses/by/4.0/).
