1. Introduction
Intussusceptive angiogenesis (IA), known also as blood vessel splitting, is a complementary mechanism to sprouting angiogenesis (SA) that was proposed for the expansion and remodelling of vascular networks. The hallmarks of IA are thin transluminal pillars with a typical diameter of 1-2.5 µm. They are hypothesized to form by simultaneous invagination of opposing vessel sides, perforation of the contact zone, and finally invasion of perivascular cells and connective tissue fibres (reviewed in [
1]). There is abundant evidence for the presence of these thin transluminal structures in developing embryonic vasculature of different species, such as in chicken chorioallantoic membrane (CAM) [
2,
3,
4], mice embryos [
5], human embryos [
6], developing frog [
7] and most recently in zebrafish embryos [
8].
IA may have the following morphological and functional outcomes: (I) Intussusceptive microvascular growth (IMG): insertion of pillars may serve to expand the vascular bed within itself and increase its complexity. Since it requires only a little proliferation rate, this mechanism enables the growth of a plexus with low costs of energy. IMG has been documented in numerous tissues and animal models and is therefore thought to be universal. (II) Intussusceptive arborisation (IAR): pillar arrays may merge and split small arteries and veins to establish hierarchy in the vascular network. (III) Intussusceptive branching remodelling (IBR): pillars may also enable optimisation of the branching geometry by changing the branching angle towards the ideal of a constant level of shear stress with minimal power usage (“Murray’s Law”). Hereby, unlike in IMG and IAR, the number of vessels remains the same or can be reduced by pruning (reviewed in [
9]). In line with the findings of IBR, the insertion of transluminal pillars was shown to be flow-dependent and triggered by a local drop in shear stress. This has been demonstrated in vivo [
4], in vitro [
10] and in computational models [
11,
12] (reviewed in [
13]). IA does not require a remodelling of the surrounding matrix or endothelial cell (EC) proliferation and migration, but the ECs rather increase their size and flatten [
14]: it is thus considered to be a more energy efficient process [
15]. Therefore, it is not surprising that the intussusceptive pillars have been frequently observed in various types of tumours (reviewed in [
16]).
Different mechanisms of pillar formation have been proposed: intraluminal capillary wall fusion [
17], capillary wall folding [
18] and inverse sprouting [
19]. The description of these mechanisms is based on different developmental stages that have been captured on serial semithin or transmission electron microscopy (TEM) images, vascular casts, and with light microscopy images. The currently preferred “intraluminal capillary wall fusion” model proposes four stages of pillar formation: (I) opposite sides of the endothelium make intraluminal processes that contact each other, (II) the endothelial intercellular junctions reorganize and the contact zone is perforated, (III) cytoplasmic extensions of myofibroblasts, pericytes and interstitial fibres infiltrate the pillar, form its core and (IV) merge to create a thin cylindrical pillar, which eventually grows in diameter as it gets penetrated by perivascular cells and extracellular matrix [
20]. The alternative “capillary wall folding” mechanism proposes pillar formation by a perforation of a one-sided intraluminal fold [
18]. In more detail: first, an intraluminal fold consisting of collagen fibrils and perivascular cell extensions is formed. Next, this fold gets thinner and thinner, until it contains only a bundle of collagen fibrils coated by a single endothelial cell layer (pre-pillar). Finally, the fold is perforated, causing the separation of the pillar. Yet another mechanism termed “inverse sprouting” was proposed much later [
19]. According to it, first, a thin transluminal endothelial bridge is formed (how exactly remains open). The endothelial cell then pulls collagen bundles inside this bridge to stabilise it until it stretches throughout the pillar.
Although there are over 200 publications documenting the presence of transluminal pillars in different vessel beds, their development and subsequent growth has, to our knowledge, never been documented in vivo in 3D. Recently, transluminal pillars have also been observed in the caudal vein plexus (CVP) of zebrafish embryos [
8]. The transparency of the zebrafish embryonic tissue, the flat morphology, small dimensions of the CVP (ca. 700 x 200 x 50 µm) and the feasibility of in vivo imaging [
21] make the CVP an ideal model to address those questions.
The CVP is a transient venous network in the tail of zebrafish, located caudally of the yolk sack extension. It starts forming at 24 hours post fertilisation (hpf) when the heart starts beating and blood creates a simple loop between the dorsal aorta and a caudal vein. The development of the plexus has been described as follows: the starting point is marked by sprouting from the posterior cardinal vein and fusion of neighbouring tip cells. Sprouting from the venous segments in caudal-ventral direction and rapid anastomosis leads to a formation of a primitive plexus by 32-36 hpf ([
8,
22]). Then, the plexus continues to expand, and hierarchy begins to be established. By 48 hpf the majority of the circulating blood cells is restricted to a vascular loop formed by the dorsal aorta and the most ventral branch of the venous plexus (the caudal vein). The process of gradual elimination of the redundant loops and parallel branches of the plexus further continues until 3 days post fertilisation (dpf) and it retracts in dorso-ventral direction, also due to the tail growing in length. The redundant branches from the central part of the plexus do not fully retract, as observed in pruning, since they serve as a haematopoietic niche [
23]. Between 3-5 dpf, some of these connections are observed to drain the blood from the intersegmental vessels to the caudal vein. At 5-7 dpf, the plexus has been simplified to one major loop between the dorsal aorta and the caudal vein [
24].
Another question that has not been answered so far concerns the transition from sprouting to intussusception. As documented by various methods in different developing vascular beds, the high number of sprouts during early plexus formation indicates that this phase is dominated by SA (reviewed in [
25]). In later stages of the development, the sprout density decreases, and the number and diameter of thin intraluminal pillars gradually increases, which points to the participation of IA in subsequent plexus remodelling. There is, however, no gold standard for the quantification of the involvement of SA versus IA. The semi-quantitative approaches include pillar count versus sprout count [
8,
26], pillar count versus hollow (big meshes) count [
27], or the use of endothelial cell proliferation as an indicator of SA and presence of pillars as a marker of IA [
28]. Other studies quantify IA based on the pillar count, however, “pillars” may be “small holes” on corrosion casts without specification of the diameter [
29], structures of several µm in diameter seen on wild field acquisitions [
30,
31], or a circular intraluminal structure [
32], a fold [
33], an intraluminal contact intermediate of a “pillar” on a histology section [
34], or a cross-section acquired by TEM [
35]. Many studies use a combination of several methods to describe the wave of IA ([
36,
37,
38,
39]) but the classification criteria for intussusceptive pillars, when specified at all, are difficult to compare.
To summarise, there is broad evidence for the presence of intraluminal pillars in the developing vascular beds of different species during vessel reorganisation. Nonetheless, little is known about the mechanisms of the formation and subsequent growth of pillars and intercapillary meshes. Zebrafish embryos present a valuable and well-documented model for angiogenesis research with the possibility of in vivo imaging (reviewed in [
40]), we have chosen the zebrafish CVP to document the mechanisms of pillar formation. Our aim was to gain insight into the role of pillars in plexus expansion and remodelling in high spatio-temporal resolution.
3. Discussion
The concept of intussusceptive angiogenesis was first presented in 1986. It describes the formation of pillars within the vessel lumen and their fusion, leading to vessel splitting and remodelling [
42]. Since then, a big body of evidence has been collected on this phenomenon [
43]. The morphology of intraluminal pillars and their existence in different vessel beds has been well documented, but the dynamic aspects of this process, namely how the pillars form in vivo and how they facilitate vessel splitting, remained largely unexplained. The availability of suitable transgenic models and the improvements of confocal microscopy in the recent years made such studies possible. We have used the zebrafish caudal vein plexus model that was established in our laboratory by Karthik et al. [
8] and documented the formation of the transluminal pillars and their contribution to the plexus development in high spatio-temporal resolution.
Most pillars were present in the venous part of the CVP, and they were orientated perpendicular to the symmetry plane of the embryo, but one or a few pillars were usually present in the distal part of the dorsal aorta (oriented rather diagonally). Pillars were most numerous between 32-48 dpf, with a very high interindividual heterogeneity. There was a significant reduction in the pillar number from 3 dpf onwards, although some of the pillars persisted until at least 4 dpf. These data correlate with previous findings in our group [
8]. We measured an average pillar diameter of 1.7±0.7 µm and an average length of 11±4.5 µm, and their ultrastructure corresponded to the intussusceptive pillars documented before [data not shown].
A problem in comparing our results with other studies is the paucity of quantitative data on pillar dimensions and the inconsistency of literature regarding the definition of a pillar. Most studies defined a pillar as a cylindrical structure with a diameter of 1-2.5 µm seen on SEM or on serial TEM sections, some extended the cut-off to up to 4 µm [
44] or did not specify a cut-off at all. Foehst et al. developed an automated algorithm that classified all transluminal columns of a given diameter (they decided on 1 - 5 µm) [
45], and they reported a highly asymmetric distribution of pillar diameter and volumes, with most pillars being between 1-3 µm in diameter and having a volume of less than 40 µm
3 (our average measurements of diameter and length would correspond to a volume of 25 µm
3). In order to see if the (most cited) cut-off at 2.5 µm was appropriate, we included in our quantifications (diameter and height,
Figure 2, and area change,
Figure 7) structures up to 4 µm (or up to 12 µm
2 in cross-section). The majority of pillars were indeed in the range of 1-2.5 µm and had the typical cylindrical shape.
Among the 74 pillars that were tracked back to their formation, we observed three processes involved in pillar formation: sprouting (formation of filopodia that “embrace” the future pillar core), lumen formation/expansion, and formation of a fold in an already lumenised vessel (capillary wall folding). This does not mean that there were three distinct mechanisms, it was rather a highly heterogeneous process where these three events participated to a certain degree, possibly depending on how mature the vasculature was at the time of pillar formation. Pillar formation by capillary wall folding has already been proposed before by Patan et al. [
18] based on TEM data. We could identify vertical tissue folds and intermediates that they termed “pre-pillars” as immediate predecessors of the pillars that we observed by confocal microscopy. According to Patan et al., the pre-pillars formed in already lumenised vessels after the sprouting had ceased. Our data indicated that they may also appear earlier, during lumen formation, and have their origin in sprouting angiogenesis. We also observed thin intraluminal connections reminiscent of endothelial bridges described by Paku et al. [
19], but their nature was more transient, and they seemed to have no particular function. Contrary to our expectations, none of the observed thin transluminal pillars did form by the intraluminal invagination and perfusion of the contact zone.
Pillar formation is thought to occur preferably at branching points of vessels, triggered by a local drop of shear stress [
12]. We used
sih embryos (bearing a mutation in cardiac troponin and thus totally lacking blood flow) to test whether the pillar formation was flow dependent. Our results showed an impairment of mesh formation as reported previously by Xie et al. [
41], but pillars were present nonetheless and their formation resembled the mechanisms described in the wt embryos. The insertion of pillars in the CVP of
sih-embryos was therefore, contrary to previous findings [4, 8], not driven by local differences in blood flow or shear stress. An important remark here is that the computer models of flow-dependent pillar insertion were built on the intraluminal capillary wall fusion mechanism, which we did not confirm in the developing CVP. Yet another point might be that the in silico calculations [
12] and in vivo data showing dependence of pillar formation on the blood flow referred to structures of 5-10 µm as “pillars” [
8]. The formation of structures of this diameter (termed “meshes” in our work) was according to our data indeed impaired under no flow conditions.
The concept of intussusception postulates that intercapillary meshes evolve from transluminal pillars that increase their diameter as they get penetrated by perivascular cells (e.g. myofibroblasts or pericytes [
1,
20,
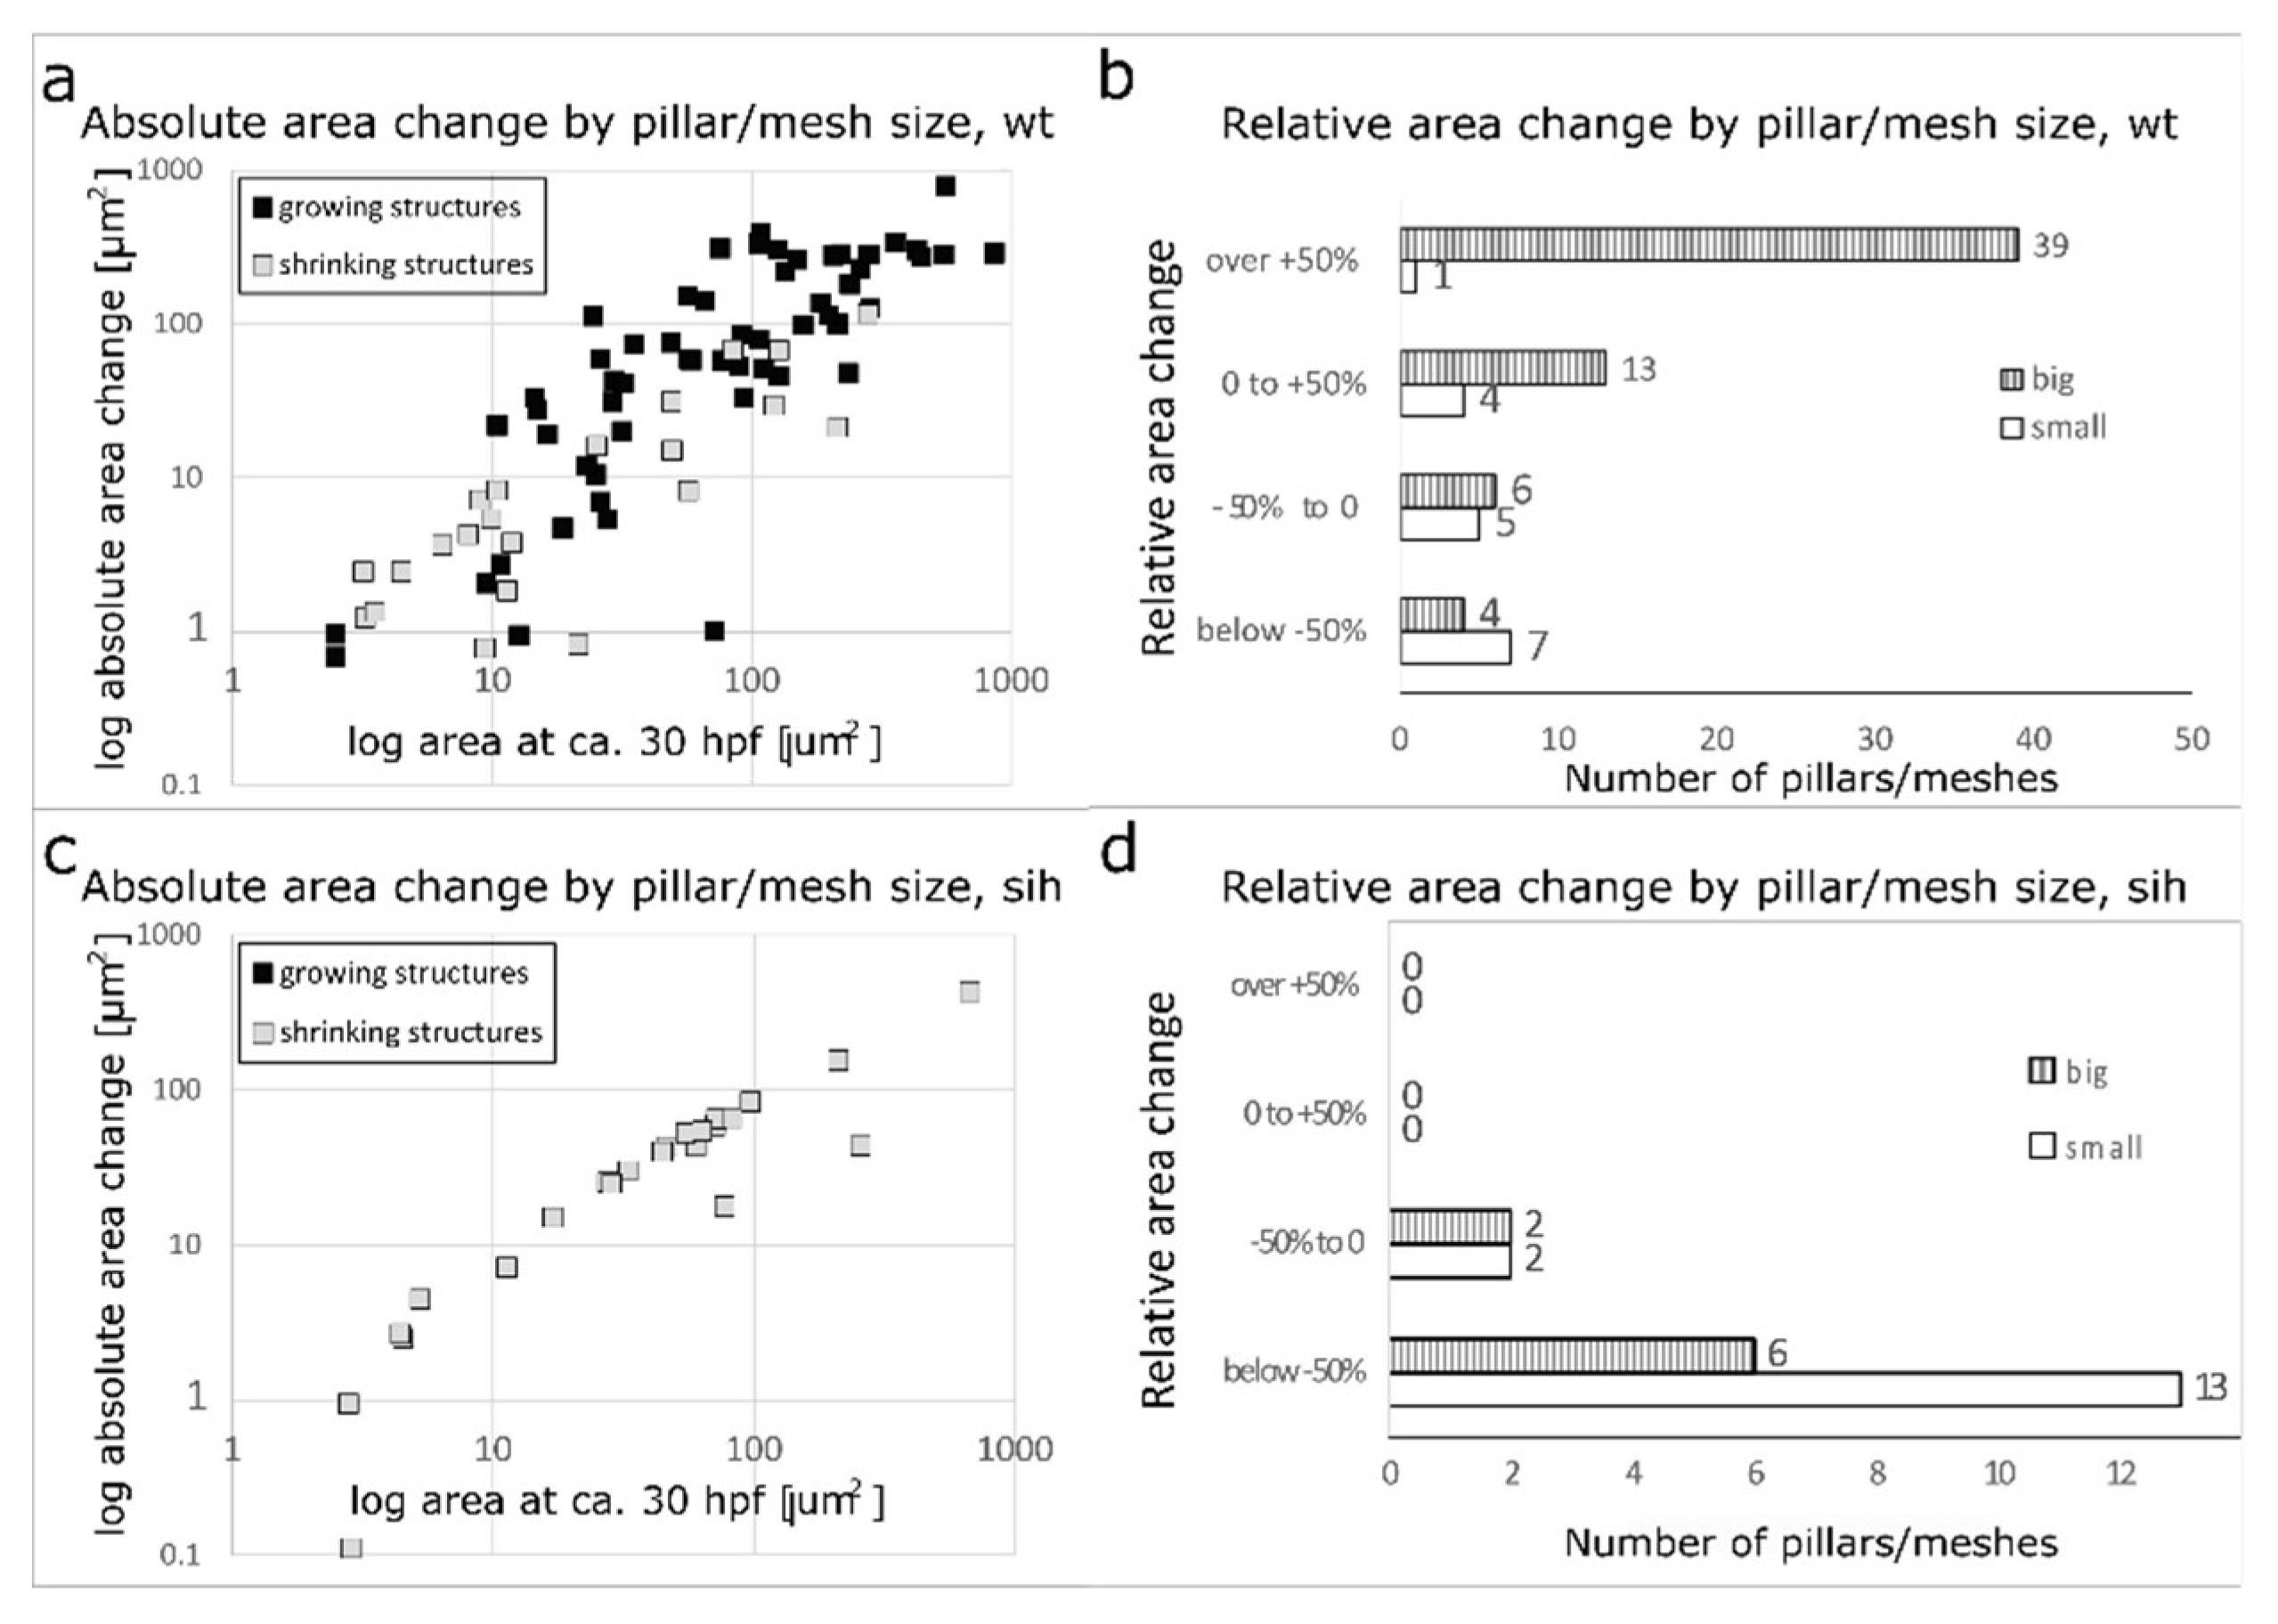
46]). To examine this hypothesis, we tracked back meshes in time. Between 28-48 hpf, there were some newly formed meshes (by SA) or pillars, and there were some cases of mesh merging or splitting, but the majority of structures only changed their size. While the majority of meshes grew (39/62 grew by more than +50%), the majority of pillars (or very small meshes: cross-sectional area below 12 µm2 or below 4 µm in diameter) did not change much or shrank (only 1/17 changed their area by more than +50%, namely by +209%). This growing structure originally had a diameter of 3.5 µm: without information about the ultrastructure, we cannot tell with certainty whether this was a true case of pillar growth or whether, which we tend to believe, this was a tiny mesh already from the beginning.
The intercapillary meshes were thus, contrary to our expectations, not a later stage of intussusceptive pillars, but formed by SA ([
22,
47]). These meshes were highly dynamic and effectively shaped the vascular bed in the later stages of plexus remodelling and simplification. Pillars usually persisted in the lumen for several hours without any change in diameter or shape, and many eventually disappeared by rupture or fused back with the vessel wall (”capillary wall folding” reversed). The average lifetime of the observed pillars cannot be calculated since our 14 - 16-hour long scans contained only a few cases of the complete life of a pillar. A possible reason for the observed lack of growth of slender pillars might be a strong interaction between endothelial cell receptors and ECM constituents of the pillar core [
48], that simply do not allow infiltration of pillars by perivascular cells. In contrast, small meshes might have a core consisting of diverse ECM components and cell extensions that is less dense and thus more plastic.
The question, how the interplay between SA and IA might be, is difficult to answer since it depends on (1) how we define intussusception or a pillar as the hallmark of IA, (2) how we define a mesh or what is our hallmark of SA, (3) the methodology used and its limitations, and finally, (4) differences in physiology of the different models used.
The involvement of SA during the early development of the CVP, followed by the appearance of pillars at 36-48 dpf in our study correlates with previous findings ([
8,
22]). Our data also remind of the recently proposed piecemeal mechanism that integrates IA and SA [
49]. They described it as a combination of sprouting and intussusception angiogenesis, where sprouting stands at the beginning of the process and the appearance of pillars/papillae shows intussusception to be part of the following process.
So, how can we integrate the findings of our study into the broader picture of earlier research in this field? If intussusception is defined as the in-itself folding of a vessel leading to an insertion of intraluminal pillars, then we found no support of this mechanism. If we leave the mechanism aside and focus on insertion of pillars and their expansion into bigger intercapillary meshes, then we also found little evidence supporting this concept. The dynamics of pillar count per CVP we observed recapitulated the data of Karthik et al. [
8], but the slender pillars did not grow and the development of the CVP was dominated by the behaviour of meshes that arose by SA.
On the other hand, if intussusception is defined according to the outcomes, then the initial increase of plexus complexity resembled the IMG described in earlier studies about IA [
21]. In line with the concept of IMG, the increase of vessel surface area did not appear to be attributable to endothelial cell proliferation, but rather by migration and flattening of endothelial cells (qualitative observations, data not shown). However, unlike in IMG, we did not observe growth of pillars (<2.5 µm in diameter). Furthermore, the later CVP development followed the pattern described as IAR. The growth and merging of intercapillary spaces served to split vessels, and changes in lumen diameter further established the hierarchy. The third possible outcome of intussusception, namely pillar formation being involved in branching point remodelling as proposed in IBR, has not been observed in CVP. We rather observed pillar disappearance (by rupture or by fusion with the vessel wall), not their formation, in response to changed flow condition.
The pillar formation and its further fate might depend on the chosen model. Chicken chorioallantoic membrane, mouse retina, capillary networks in the developing lung or kidney or in solid tumours might rather expand “within themselves”, whereas the CVP of zebrafish rather expands its borders. Alternatively, the behaviour of pillars in the CVP might be specific for lower vertebrates - which is in our opinion rather unlikely, since the homology between fish and mammalian genes is generally high. All this would require further investigation.
To summarize, our data demonstrated that, when discriminating IA from SA, it is important to distinguish between the thin intussusceptive pillars and the bigger intercapillary meshes. Firstly, pillars and small meshes differ in their shape and their content. Secondly, according to our findings, pillars and small meshes have different mechanisms of formation, the latter originating by sprouting angiogenesis and not by the growth of small pillars. In contrast, the formation of pillars seemed to be driven by three major processes, which we described earlier. Thirdly, they behave differently – possibly since they have a different content. This also means that they have different roles or a different fate in the developing plexus.
Figure 1.
Morphology of pillars and meshes and pillar count per plexus. (a) Confocal images of Fli1a:eGFP//Gata1:dsRed embryos, endothelium in green (eGFP), erythrocytes in red (dsRed), the wide field channel is in greytones. I, II: Overview of the CVP at 48 hpf shows the blood flow in the dorsal aorta and the caudal vein (DA, CV), the tail of the fish is pointing to the right of the image. I is a maximum intensity projection of Z-stacks, II a single slice image. Cyan rectangles show meshes, magenta circles pillars within the plexus, the region indicated by a white rectangle is shown in detail in III (single slice) and IV (3D reconstruction of the endothelium based on the confocal data). The orientation of the pillar is perpendicular to the blood flow (moving erythrocytes seen as red streaks). V, VI, VII and VIII show further details of the small mesh from image III, in V a cross section (xy), in VI and VII a longitudinal section (yz and xz, perivascular cells infiltrating the mesh are apparent) and in VIII the 3D reconstruction in grey. In IX, X, XI and XII details of the pillar from image III are seen, in IX a cross section (xy), X and XI a longitudinal section (yz and xz) and in XII the 3D reconstruction in grey. Note the different shape and diameter of the mesh in comparison to the pillar. Scale bar I and II: 50 µm, other images: 10 µm; (b) Distribution of pillar height (length in z-axis) and diameter (in xy plane) at 48 hpf. The thick line represents the average height, dashed lines the correspondent standard deviation; (c) Number of pillars per plexus measured in in vivo confocal images between 28 and 96 hpf (1 and 4 dpf). Thick lines represent the average pillar number for each time point, thin dashed lines the correspondent standard deviation.
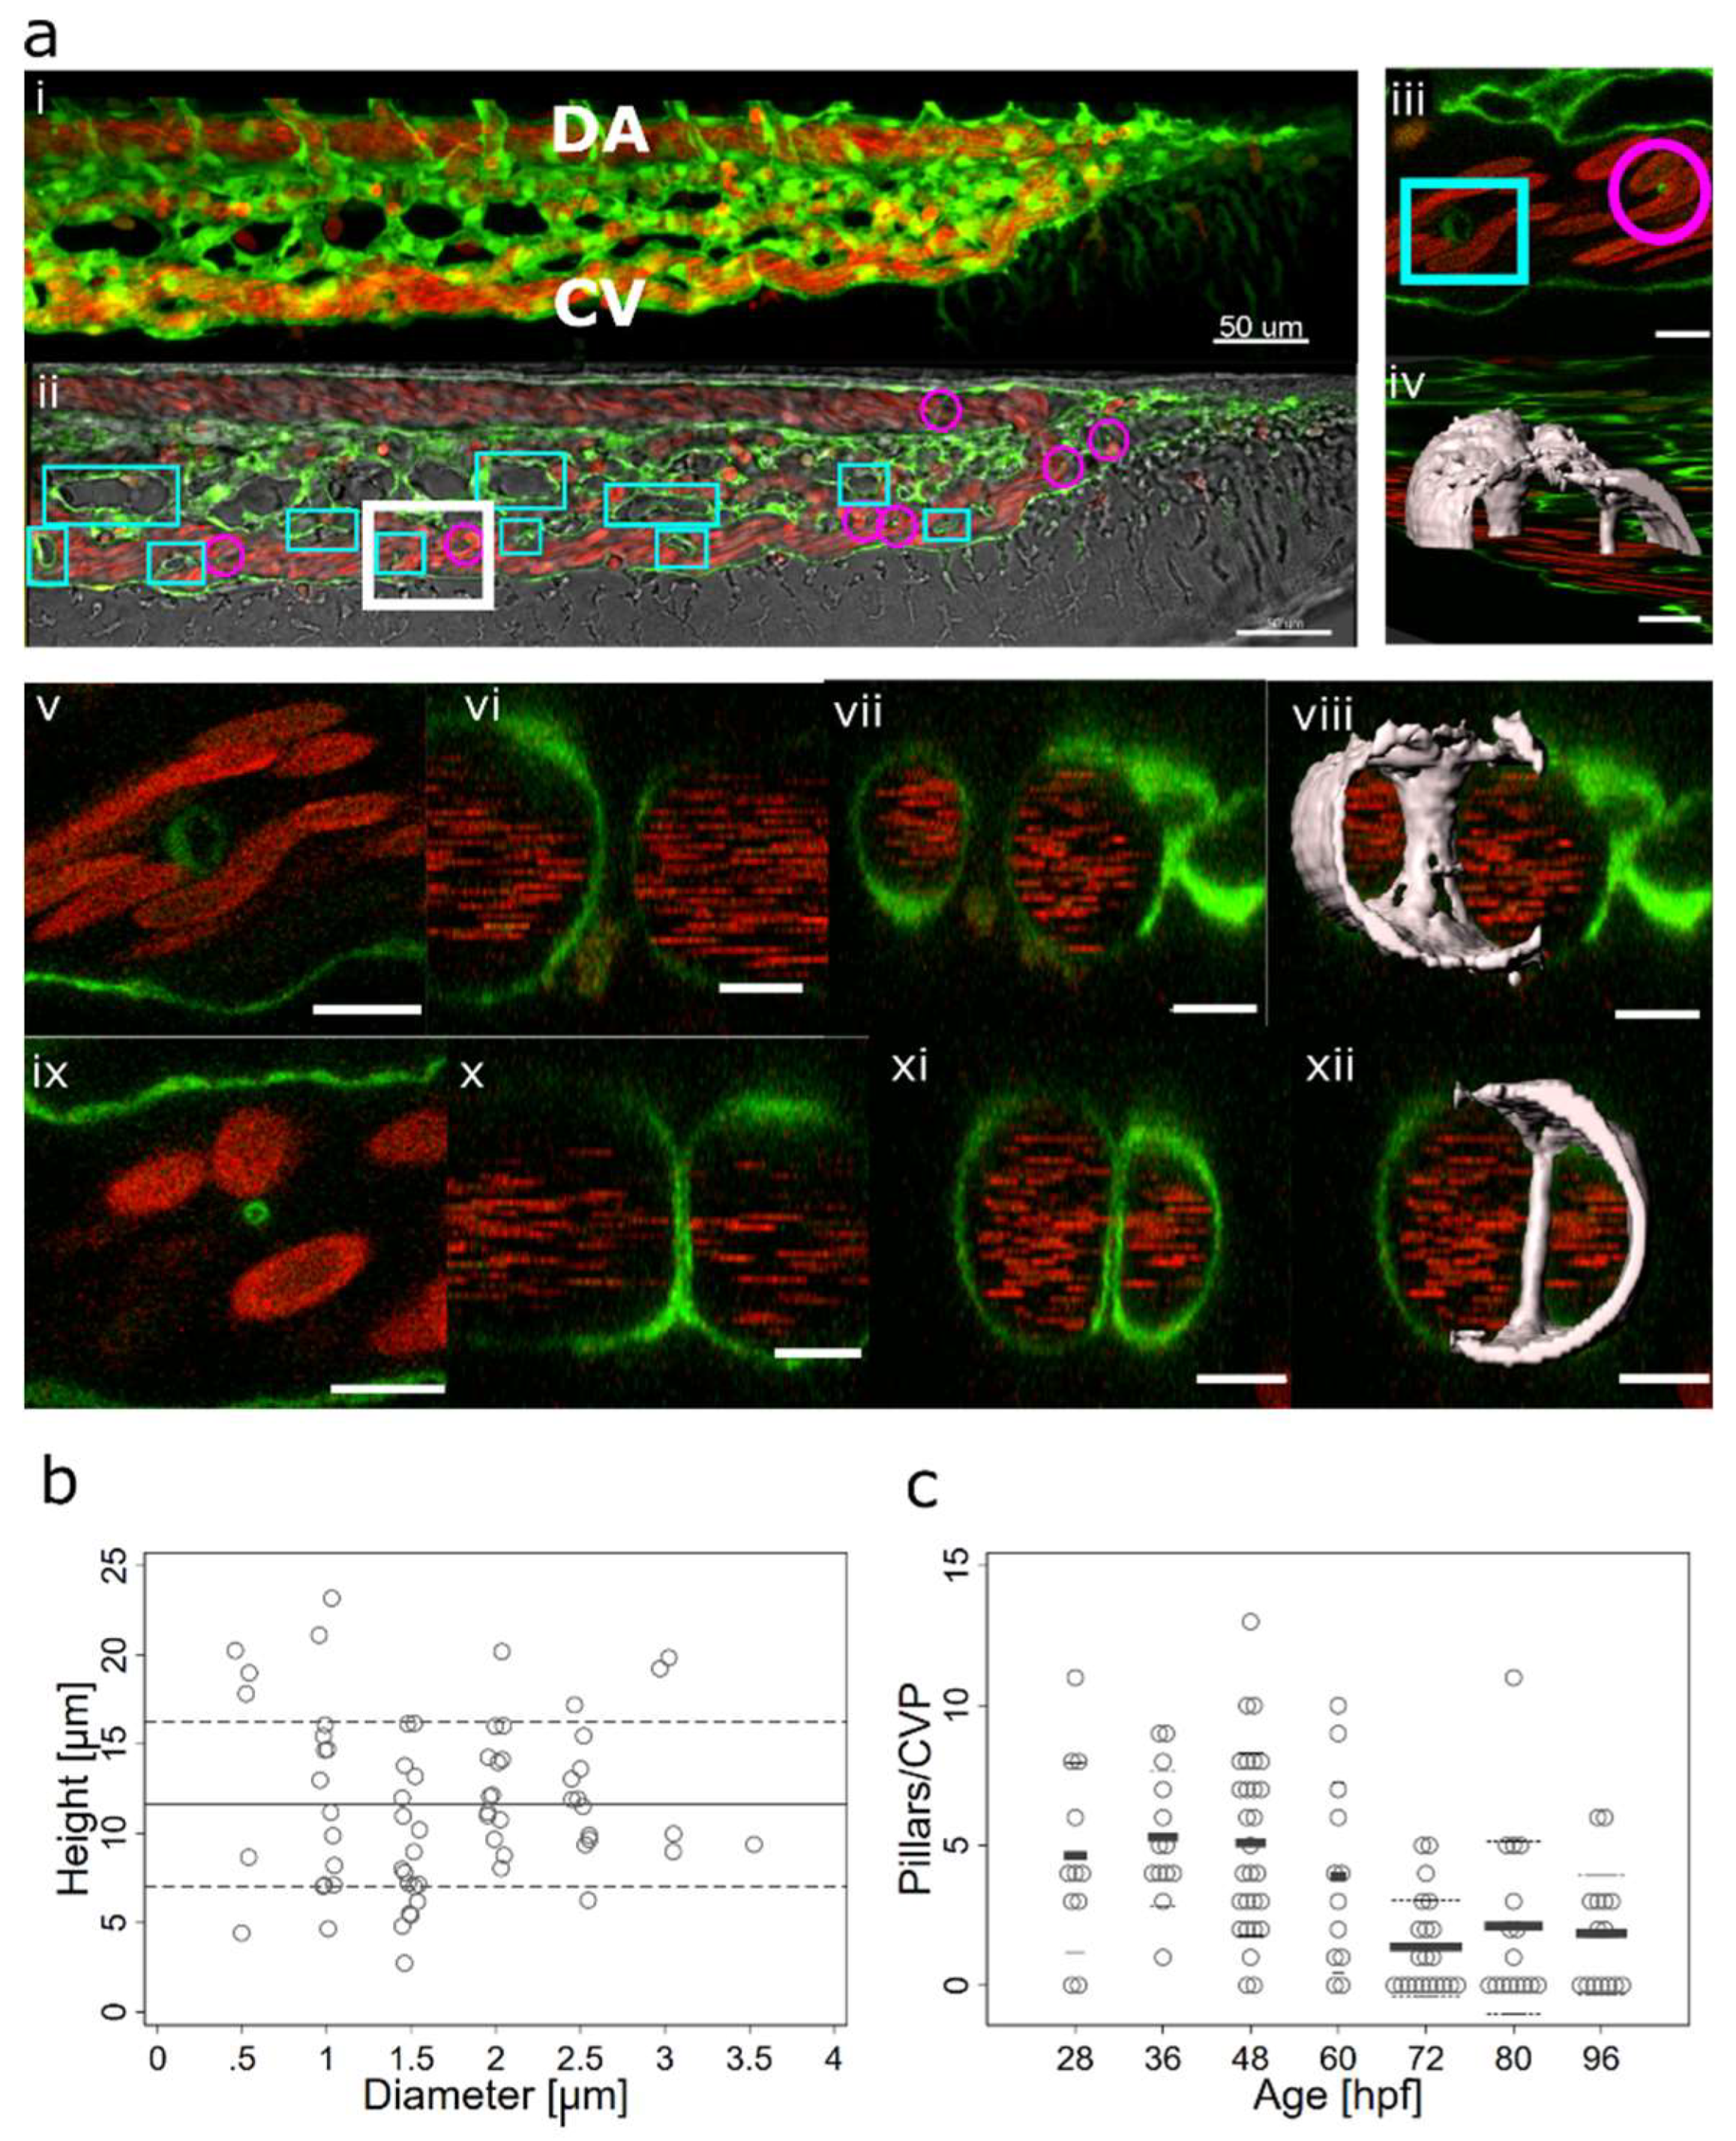
Figure 2.
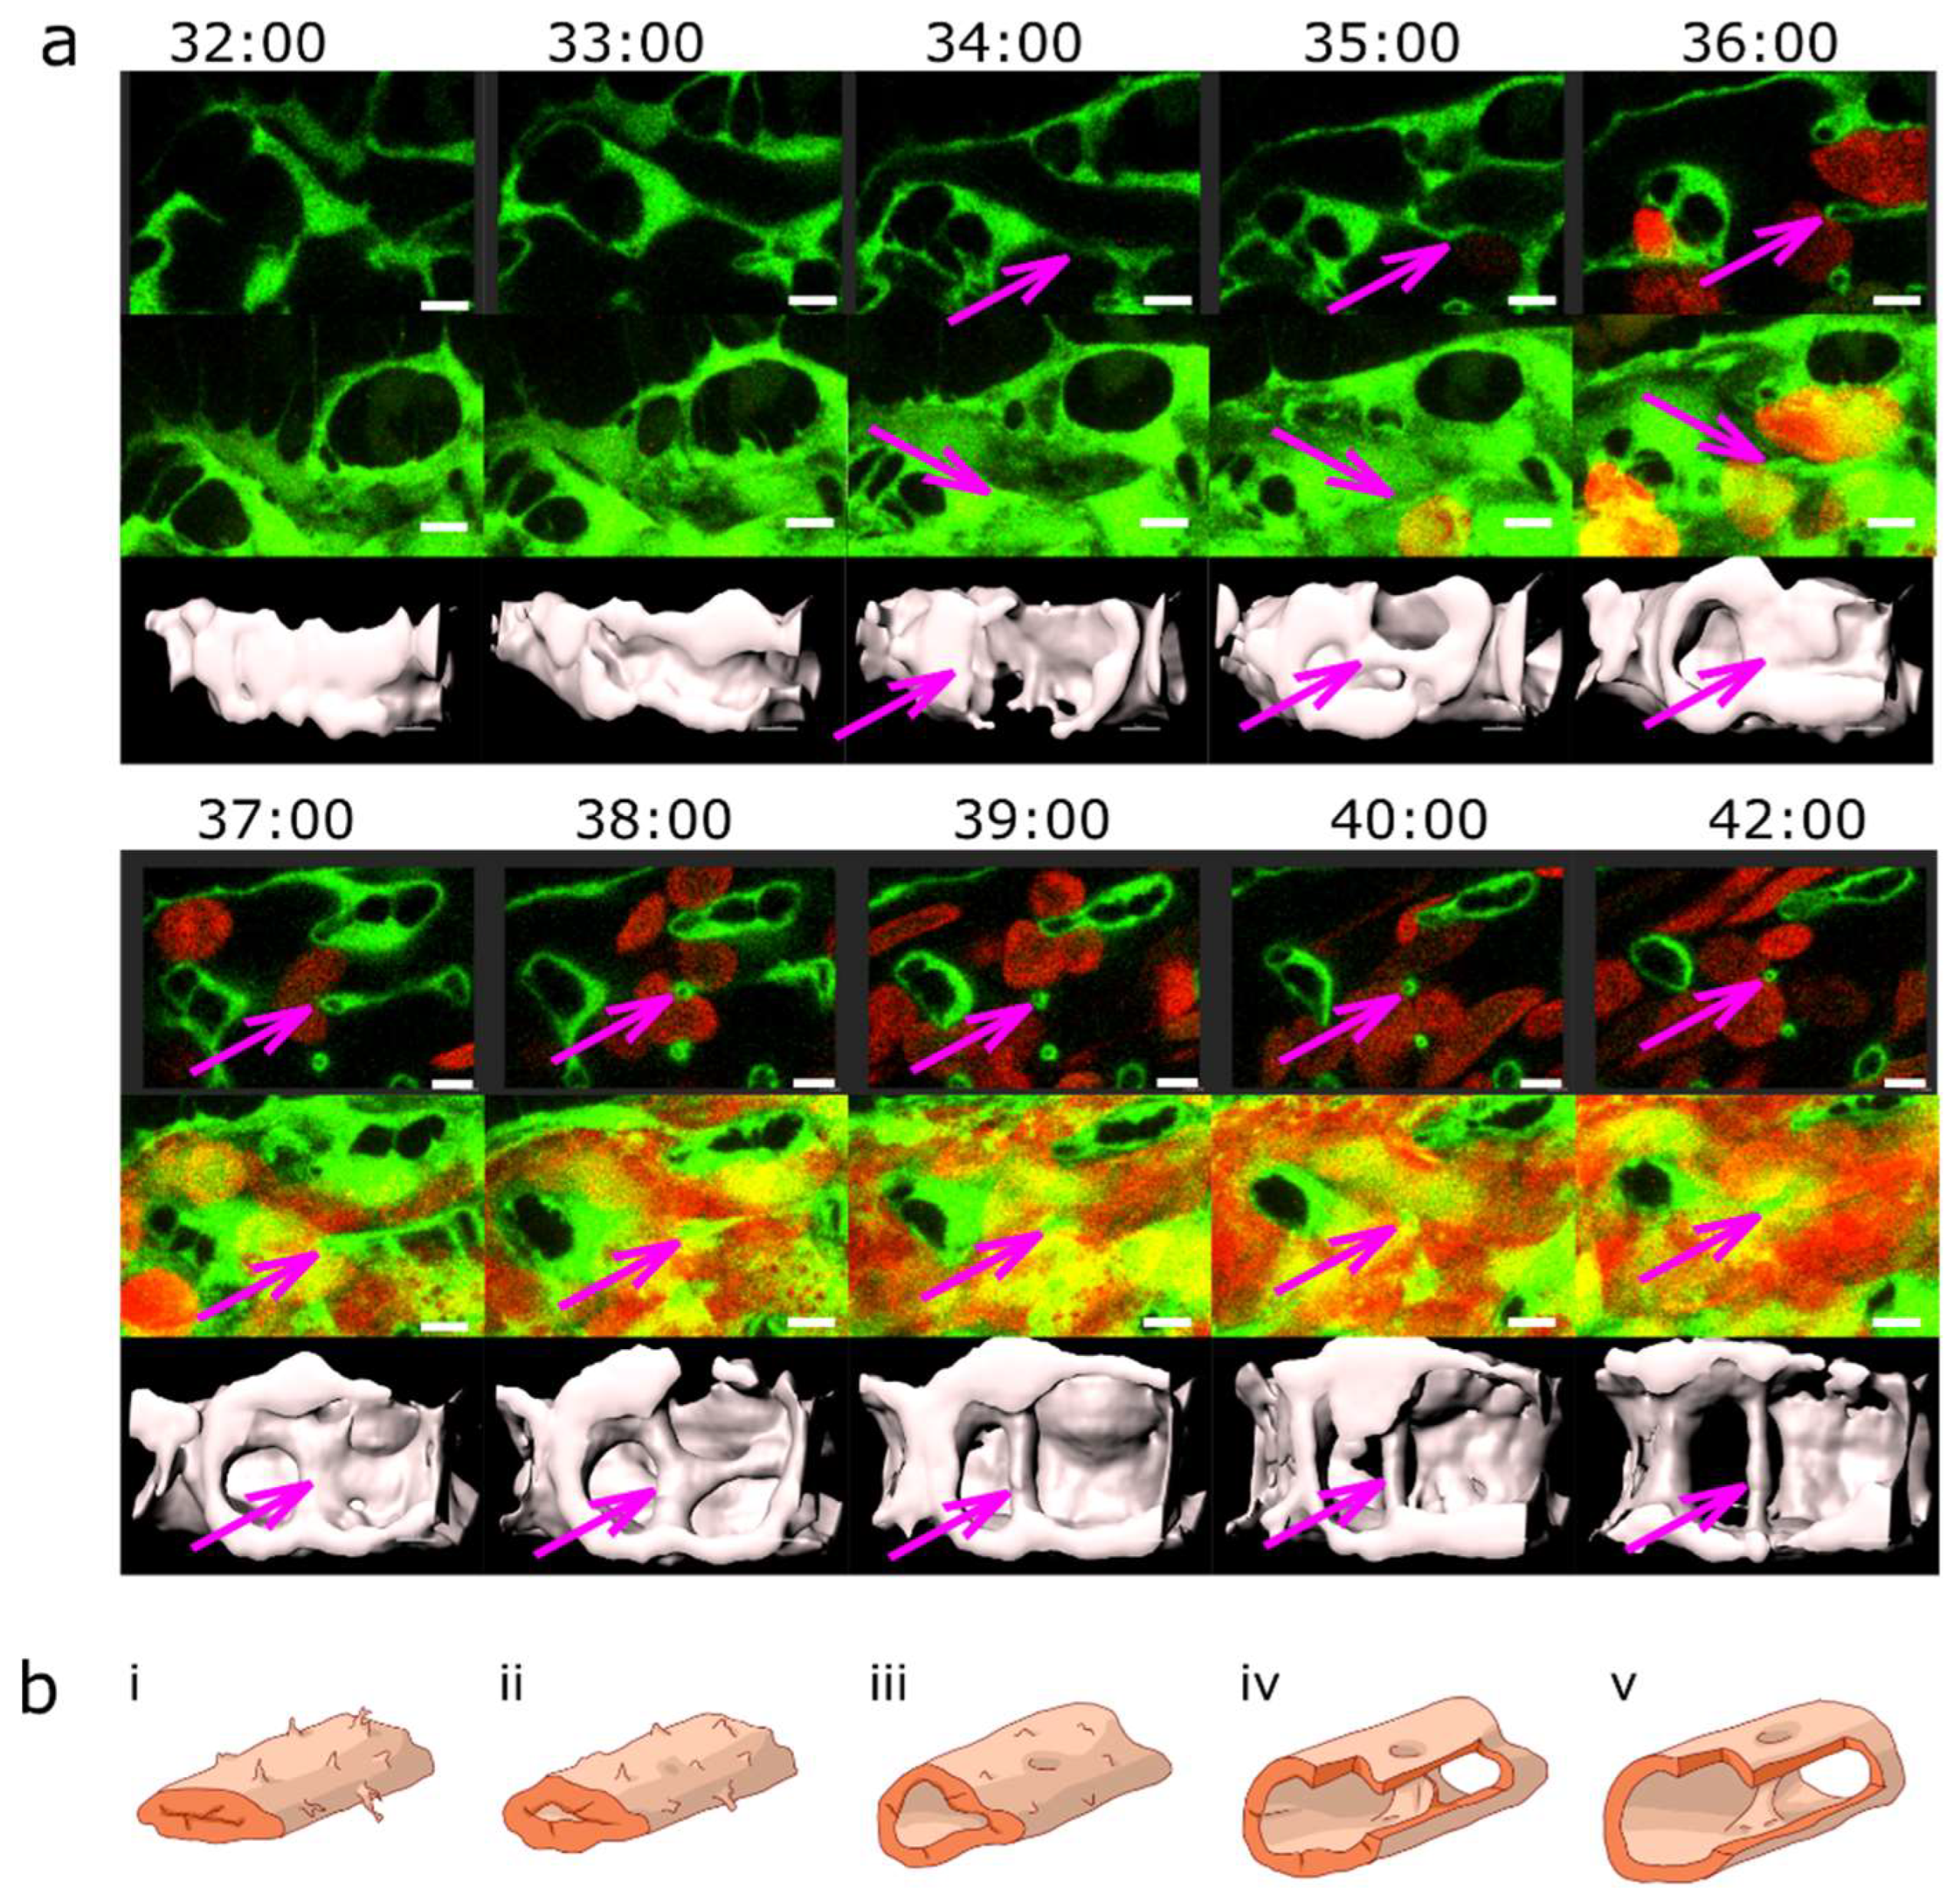
Lumen expansion and pillar formation.(a) Confocal images showing the formation of a pillar by lumen expansion. The pillar is marked with a magenta arrow. The example shows the high plasticity of the developing endothelial network. The pillar starts being visible in the 3D reconstruction at time point 35:00 and in the single slice at time point 36:00. As the pillar forms, weak connections to the endothelial walls (endothelial bridges) may be apparent, as seen in the 3D reconstruction at time point 38:00 but they get thinner and break soon (time point 39:00). First row: one confocal section of 1µm, endothelium in green (eGFP), erythrocytes in red (dsRed). Second row: maximum intensity projection. Third row: 3D reconstruction showing surface models of the endothelium in grey (based on the GFP channel). Time points (hh:mm post fertilisation) are valid for each column. Scale bars: 5 µm. (b) Illustration of the proposed mechanism.
Figure 3.
Pillar formation by fusion of sprouts.(a) Confocal images showing the formation of two pillars (indicated by coloured arrows) that could be tracked back to sprouting angiogenesis. First, endothelial cells form highly dynamic filopodia that make transient contacts (time point 30:50 and 31:00). Second, they form small loops that are not perfused first, visible at time point 32:40 (yellow arrow) and 33:20 (magenta arrow). This stage corresponds to the “intraluminal fold”, except that the lumen is very narrow and not well defined yet. Third, vessel perfusion starts: the lumen expands and the pillar detaches from the vessel wall. This can be seen at the time points 37:30 – 38:40 (magenta arrow). The pillars grow in z-axis (usually perpendicular to the plane of the CVP) and the pillar diameter often shrinks. The structure is morphologically visible as a pillar only now. Endothelium in green (eGFP), erythrocytes in red (dsRed). First row: single slice of 1 µm with bright field channel added. Second row: maximum intensity projection. Third row: 3D reconstruction in grey. All confocal images are in the same magnification. Time points (hh:mm post fertilisation) are valid for every three (two) representations below. Scale bar: 5 µm. (b) illustration of the proposed mechanisms, i-v: sprouting (corresponding to the pillar marked by the magenta arrow), i’-v’: combination of SA and LE (corresponding to the pillar marked by the yellow arrow).
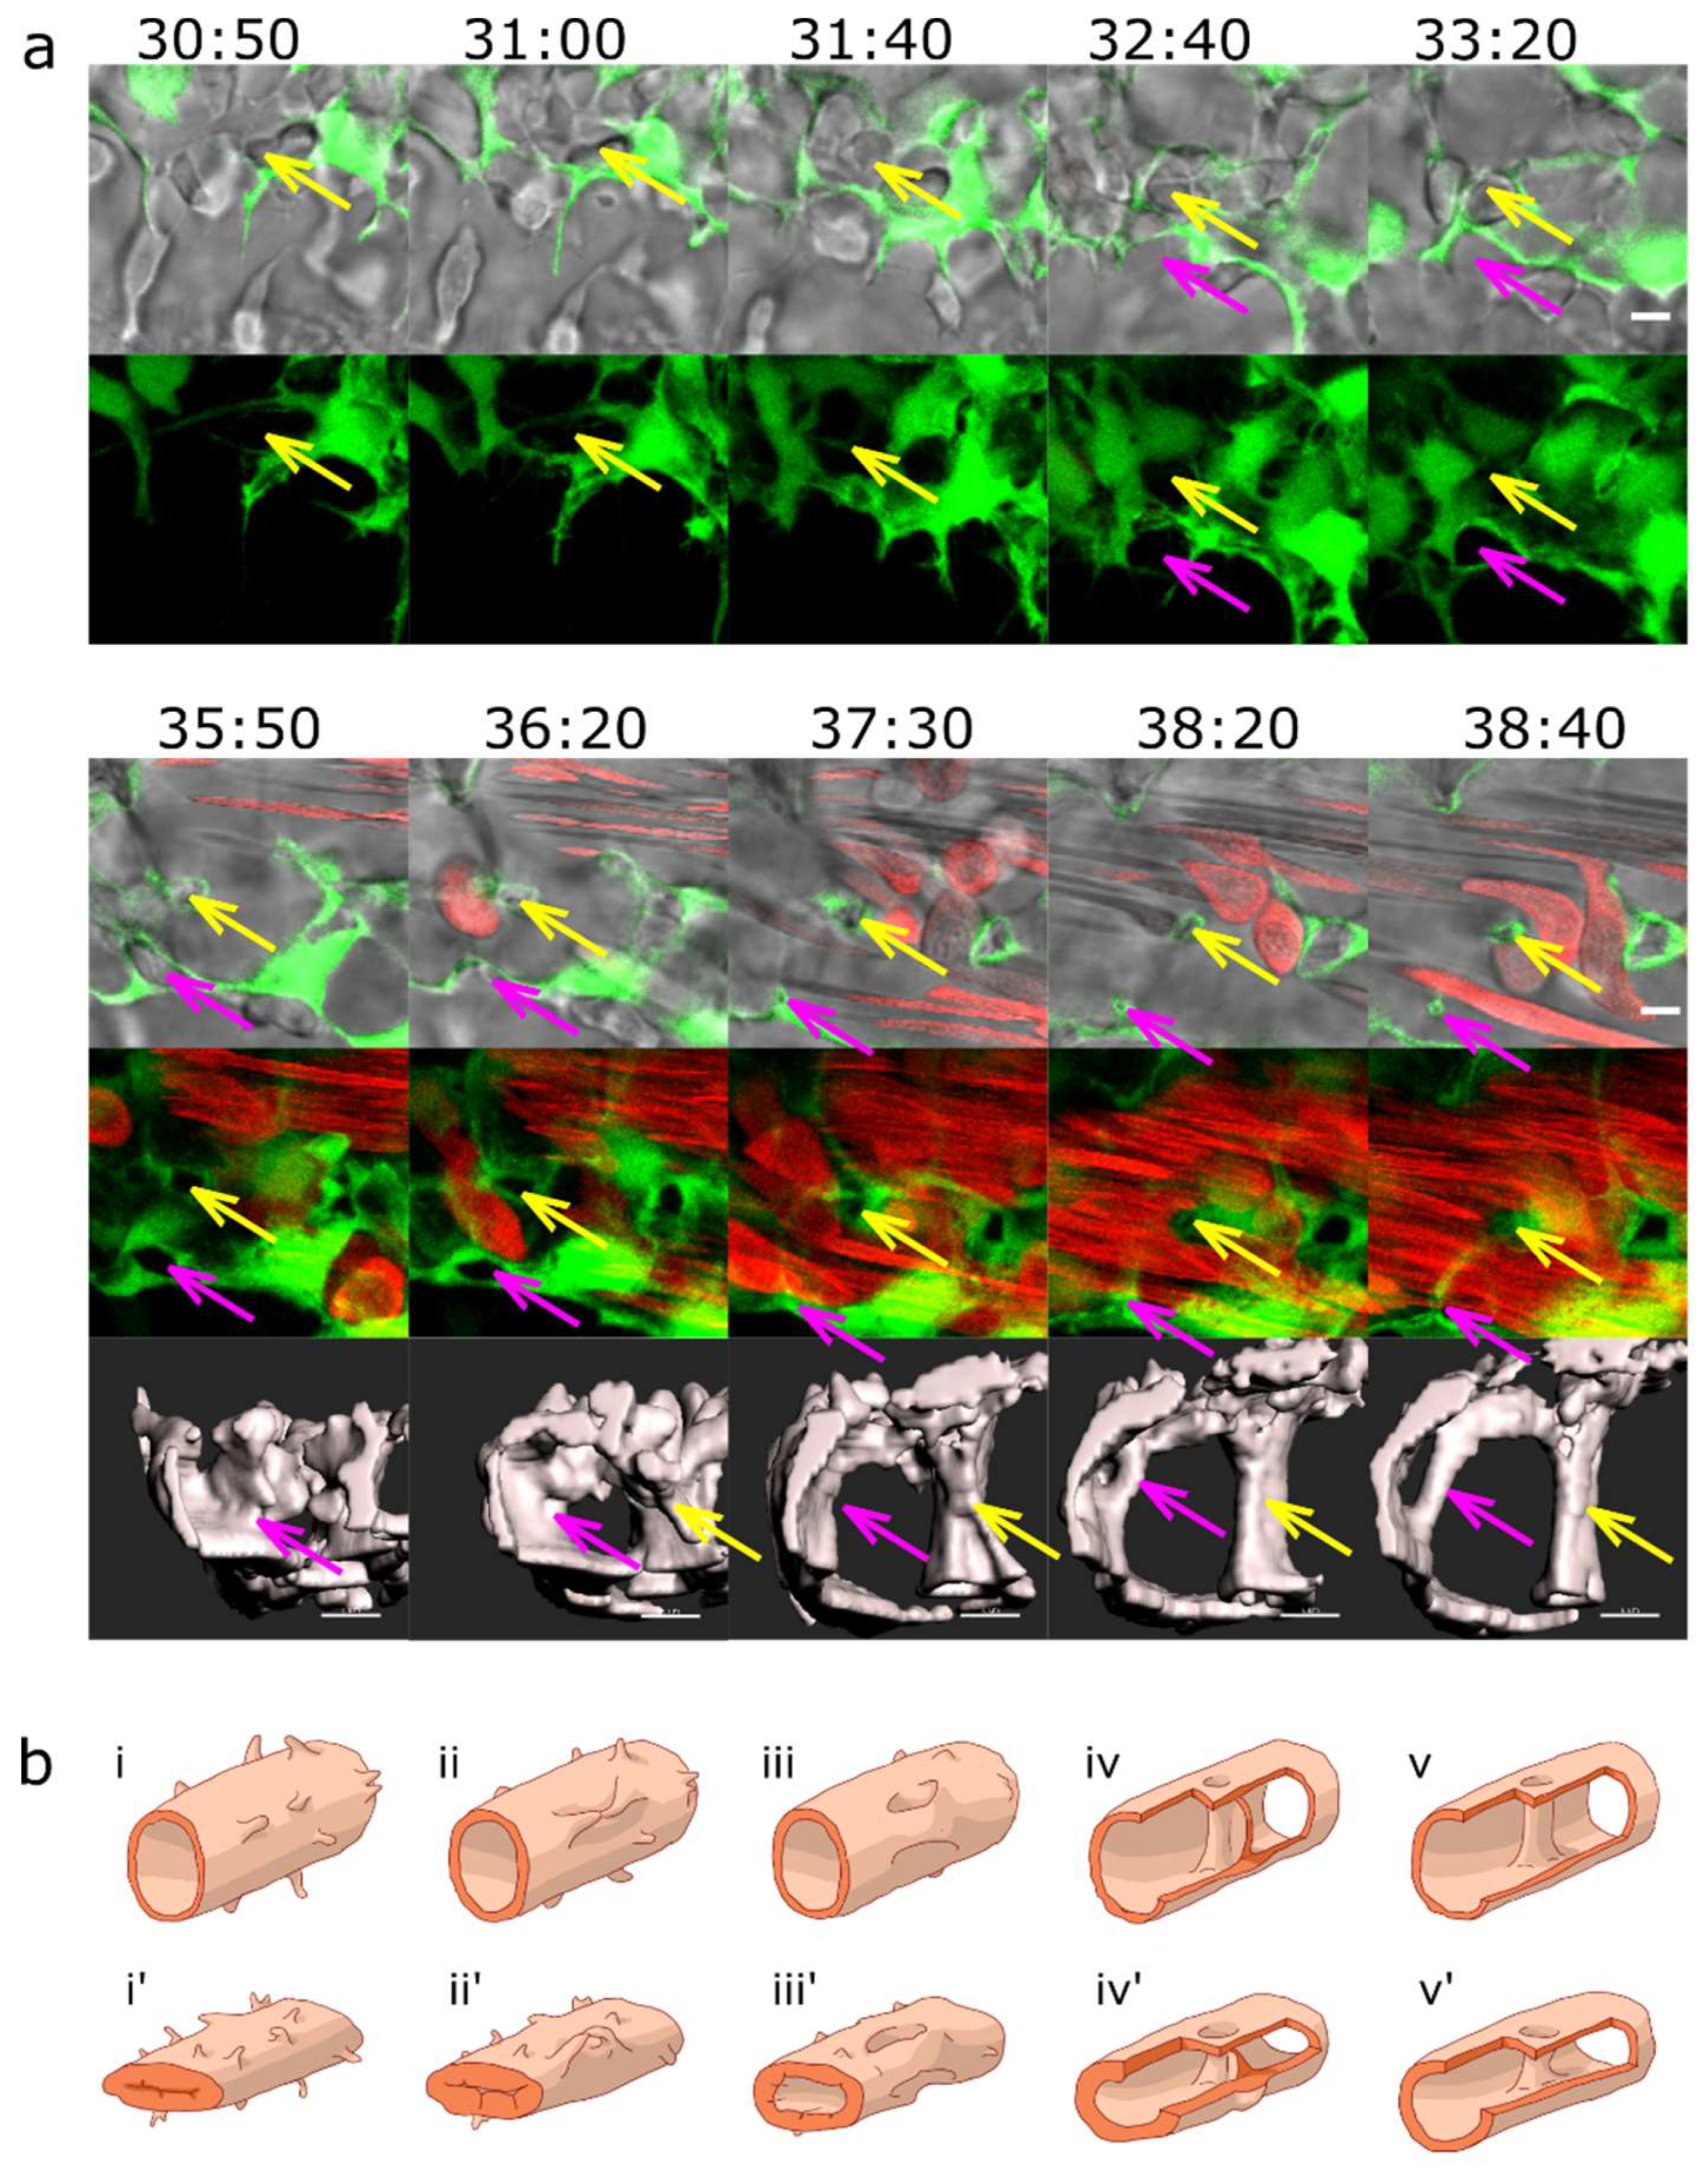
Figure 4.
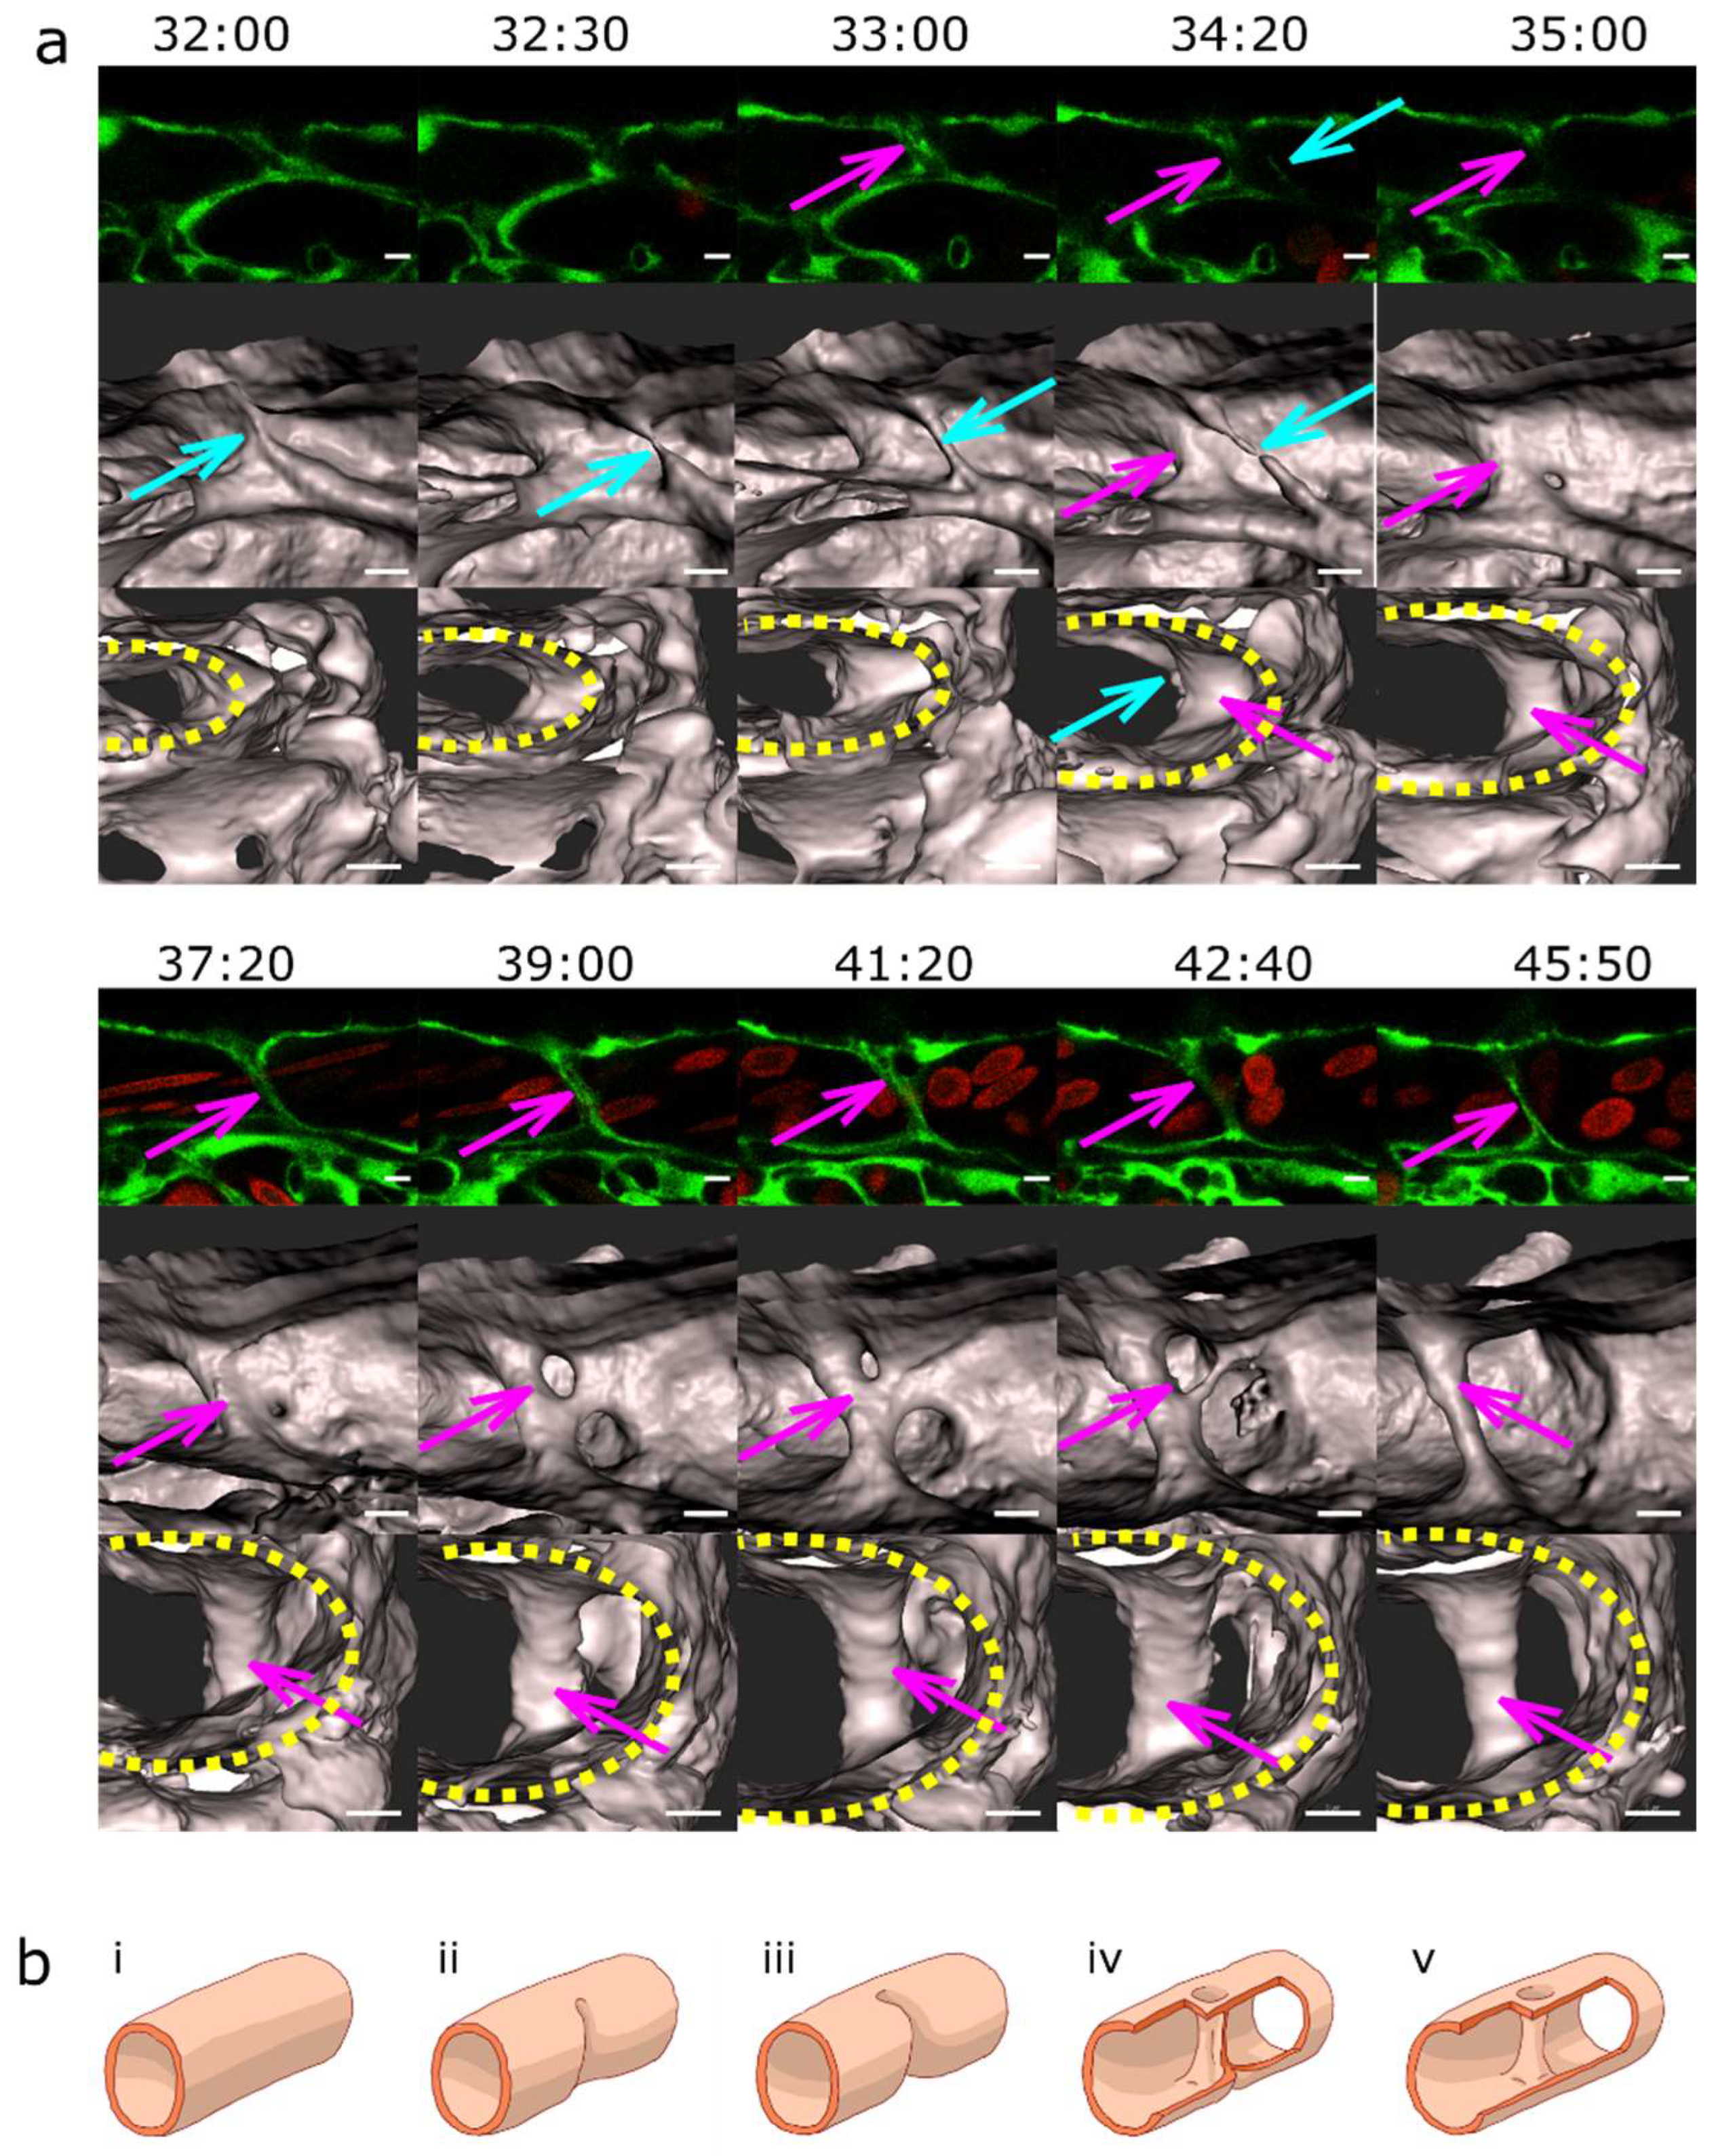
Pillar formation by capillary wall folding.(a) Development of one of the strong transversal pillars that are frequently observed in the caudal part of the dorsal aorta (DA). The pillar starts to form as an intraluminal fold (time point 34:20, magenta arrow) and grows as the lumen of the DA expands. Briefly, another thin pillar (cyan arrows) or endothelial bridge forms by the same mechanism (time points 32:00-33:00) but gets thinner and ruptures soon afterwards (34:20). First row: one confocal section of 1µm, endothelium in green (eGFP), erythrocytes in red (dsRed). Second row: maximum intensity projection of the same region. Third and fourth row: surface models of the endothelium in 3D (based on the GFP channel) in two different perspectives, the yellow dotted line shows the lumen of the dorsal aorta. Time points (hh:mm post fertilisation) are valid for each column. Scale bars: 5 µm. (b) Illustration of the proposed mechanism based on the 3D reconstructions above.
Figure 5.
Pillar and mesh formation in the absence of blood flow. a: CVP of a Fli:eGFP//sih embryo (I and II) compared to the CVP of a wt embryo (III and IV) at 48hpf. The sih embryo does not have any blood flow and thus no local shear stress differences. I and III: single confocal section, II and IV: maximum intensity projection. Endothelium in green (eGFP), erythrocytes in red (dsRed), and bright field in grey (I and III). Note that there are frequent pillars (visible as tiny circles in single confocal sections) but very few meshes (oval-like shapes, corresponding to dark spots in II). This stands in contrast to the wt CVP seen in III and IV, where there are only a few pillars visible. Scale bars: 50 µm. b: Mechanism of pillar formation in the absence of blood flow. The driving forces of pillar formation in Fli:eGFP//sih embryos are sprouting and lumen expansion, i.e. the same phenomena as in wt embryos. The development of two pillars is marked by coloured arrows, one of them disappears at the end of the image sequence (time point 45:00-46:00, yellow arrow). First row: one confocal section. Second row: maximum intensity projection of the same region. Third row: surface models of the endothelium in grey (based on the GFP channel). Time points (hh:mm post fertilisation) are valid for each column. Scale bars: 5 µm.
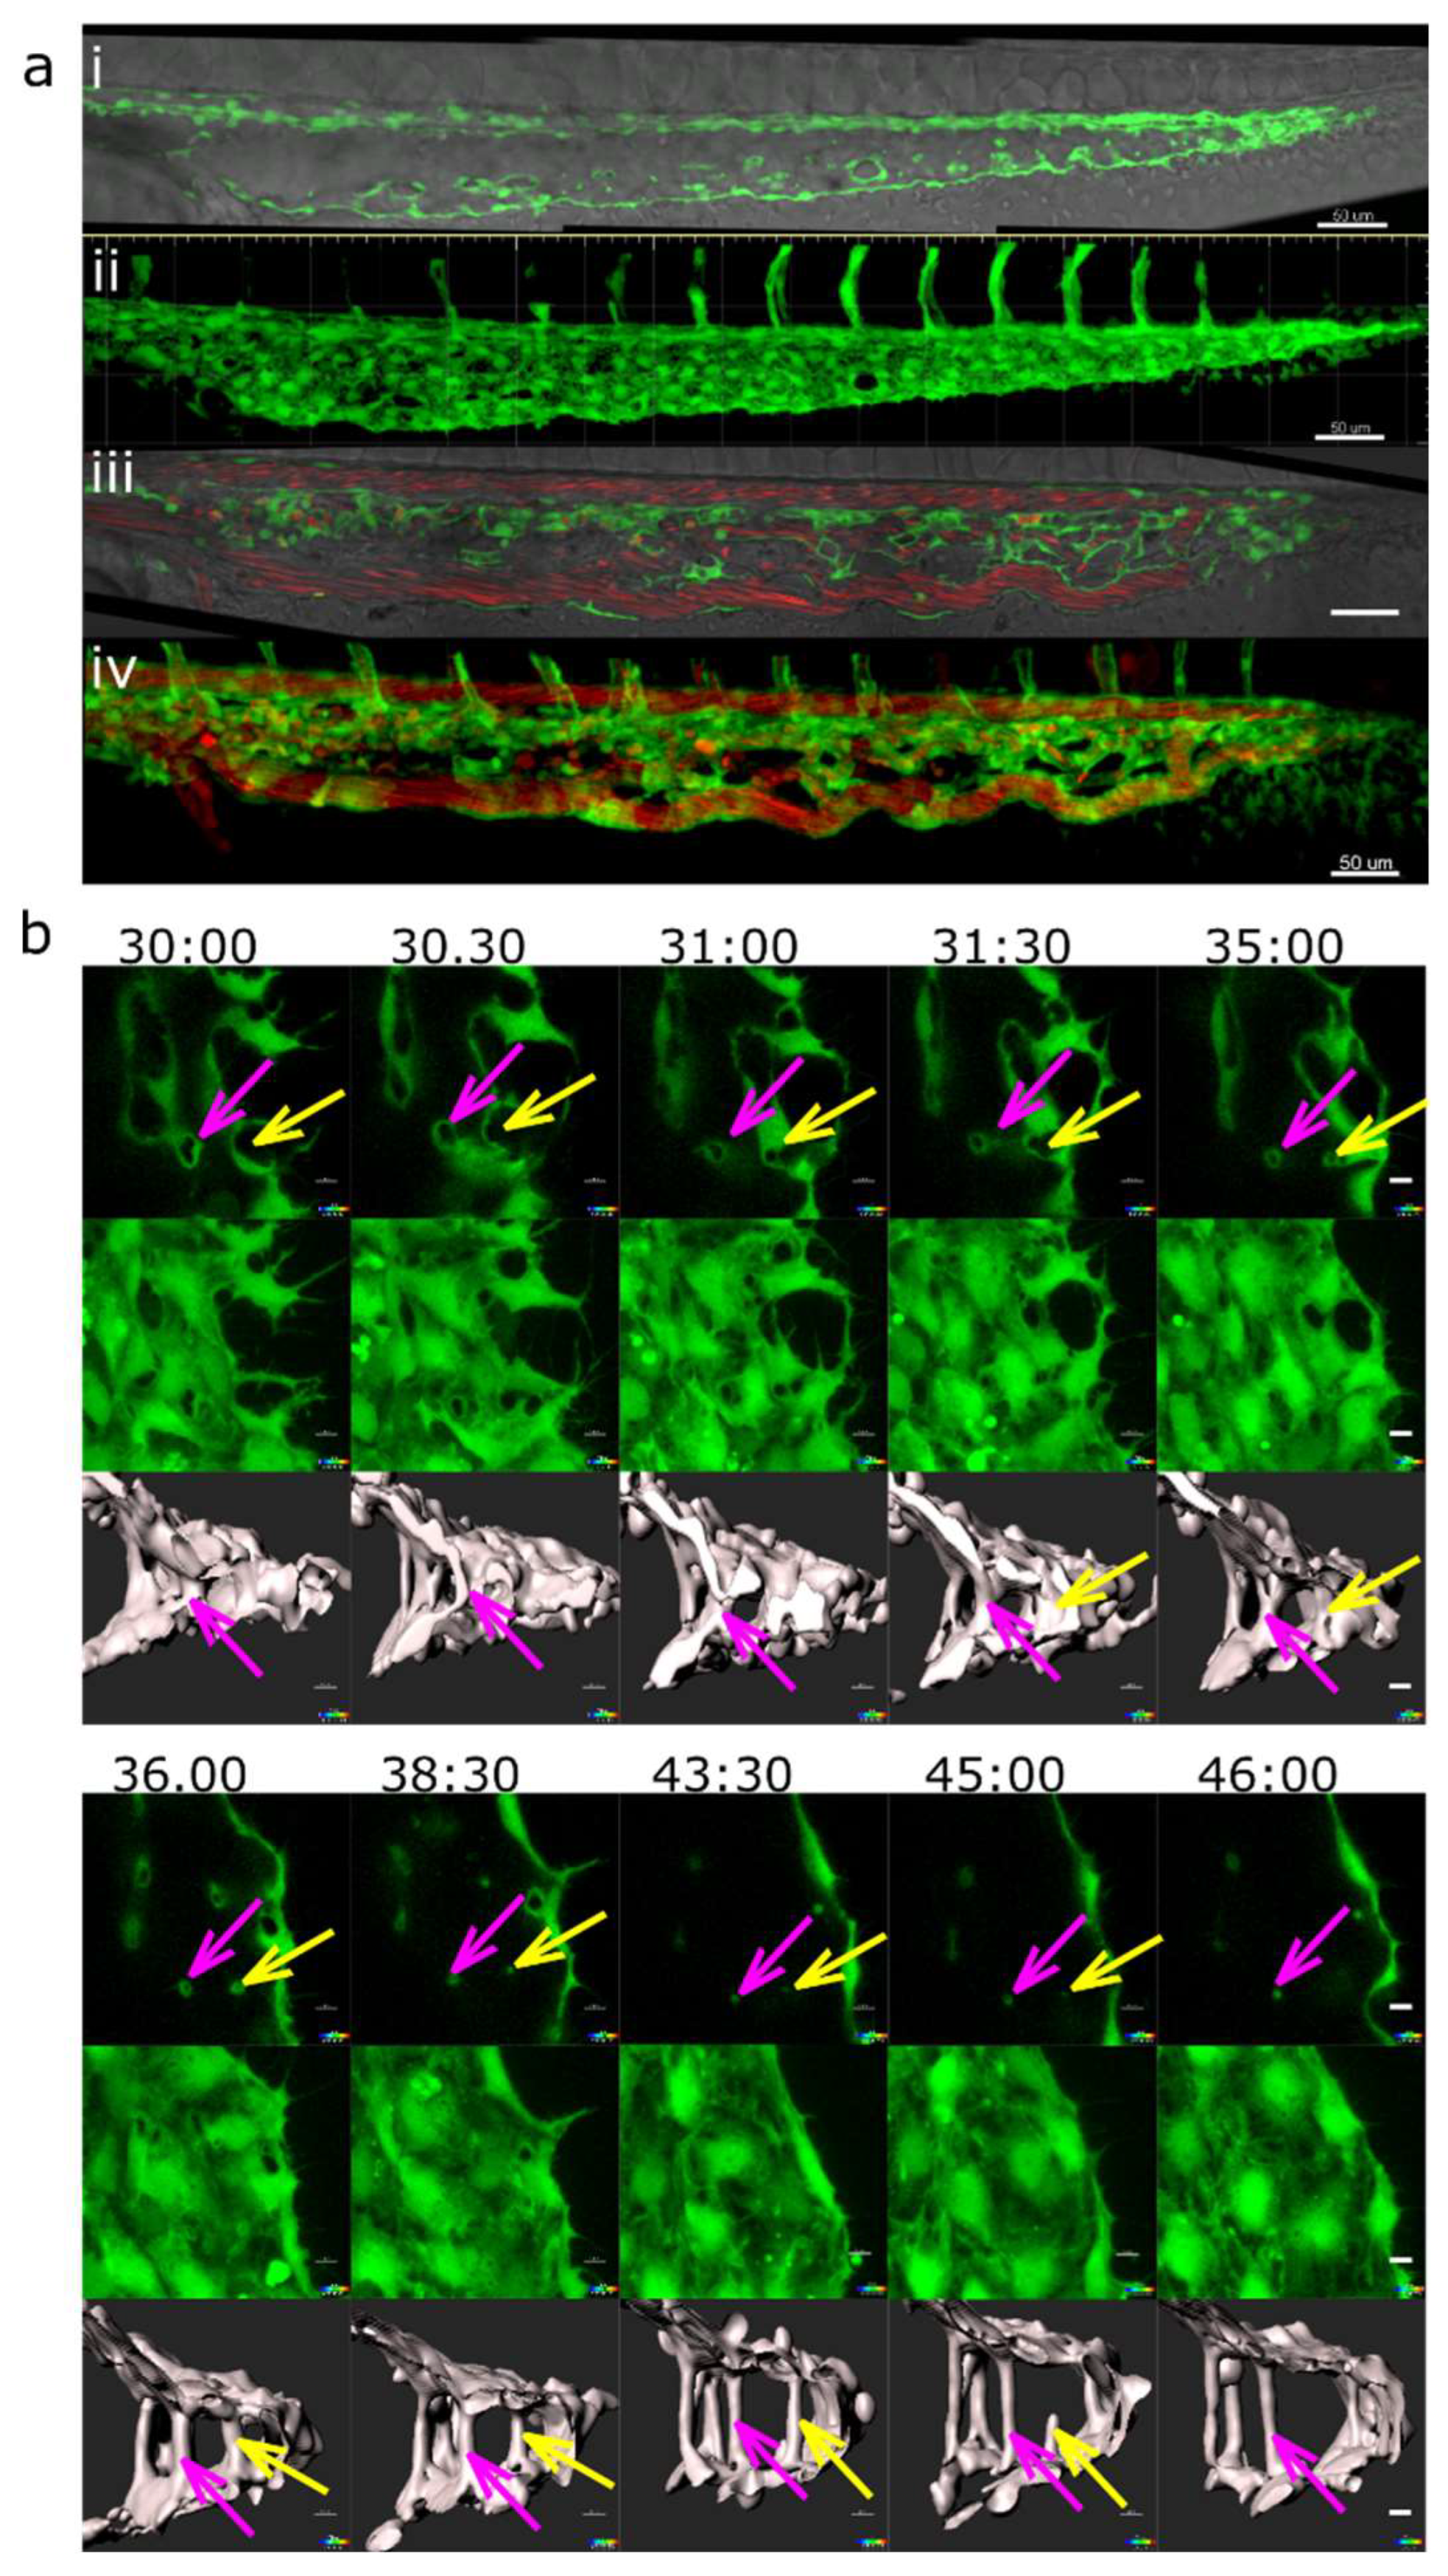
Figure 6.
Absolute and relative change in mesh/pillar area depending on their initial size and the presence or absence of blood flow. (a, b) : wt embryos. (c,d): sih embryos (no blood circulation). Changes in pillar/mesh size at 44-48 hpf are plotted against their initial area at 28-32hpf. In wt (a), the bigger the mesh, the more it usually grew or shrank, while in sih (c), all measured meshes shrank independently from their initial size. Relative changes in pillar/mesh area are seen in (b, d): In wt, very small meshes and pillars with an area <12 µm2 at 28-32 hpf (corresponding to a diameter below 4 µm, white bars in the tables) did not grow or shrink much, while the majority of bigger meshes (>12 µm2, striped bars) changed their size (b). In sih, all the structures shrank, independently from their initial size (d).
Figure 7.
Vascular splitting by merging of meshes; pillar disappearance by merging with a mesh (capillary wall folding reversed). Different examples of pillar and mesh behaviour seen in confocal images. Endothelium in green (eGFP), erythrocytes in red (dsRed). First row: single slice. Second row: 3D reconstruction of the endothelium in grey (based on the GFP channel). (a) Example of merging of two small meshes, marked by arrows (yellow and light blue). Scale bar: 5 µm. i to v: illustration of the proposed mechanism based on the 3D reconstructions above (b) Example of a growing mesh (blue arrow) and a reversible mesh merging (yellow and magenta arrows). Note the increasing diameter of the mesh marked with the blue arrow between time point 37:50 and 40:10 and again at 46:20. The two meshes marked with a yellow and a magenta arrow fuse at time point 37:50 and separate again at 40:10. Scale bars: 20 µm. (c, d) Disappearance of several pillars in one region by merging with meshes. The pillar marked with a yellow arrow fuses with the mesh on the bottom left of the image (blue arrow) between time point 44:10 and 46:20. The other pillar, marked with a light blue arrow, fuses with another mesh between time point 43:40 and 44:10. Unlike merging of meshes, the fusion of a pillar with a nearby structure is not accompanied by a visible increase in its size. The 3D reconstruction was done only from the area within the white rectangle. Time points (hh:mm post fertilisation) are valid for each column. Scale bar: 5 µm. i to v: illustration of the proposed mechanism of the 3D reconstructions above.
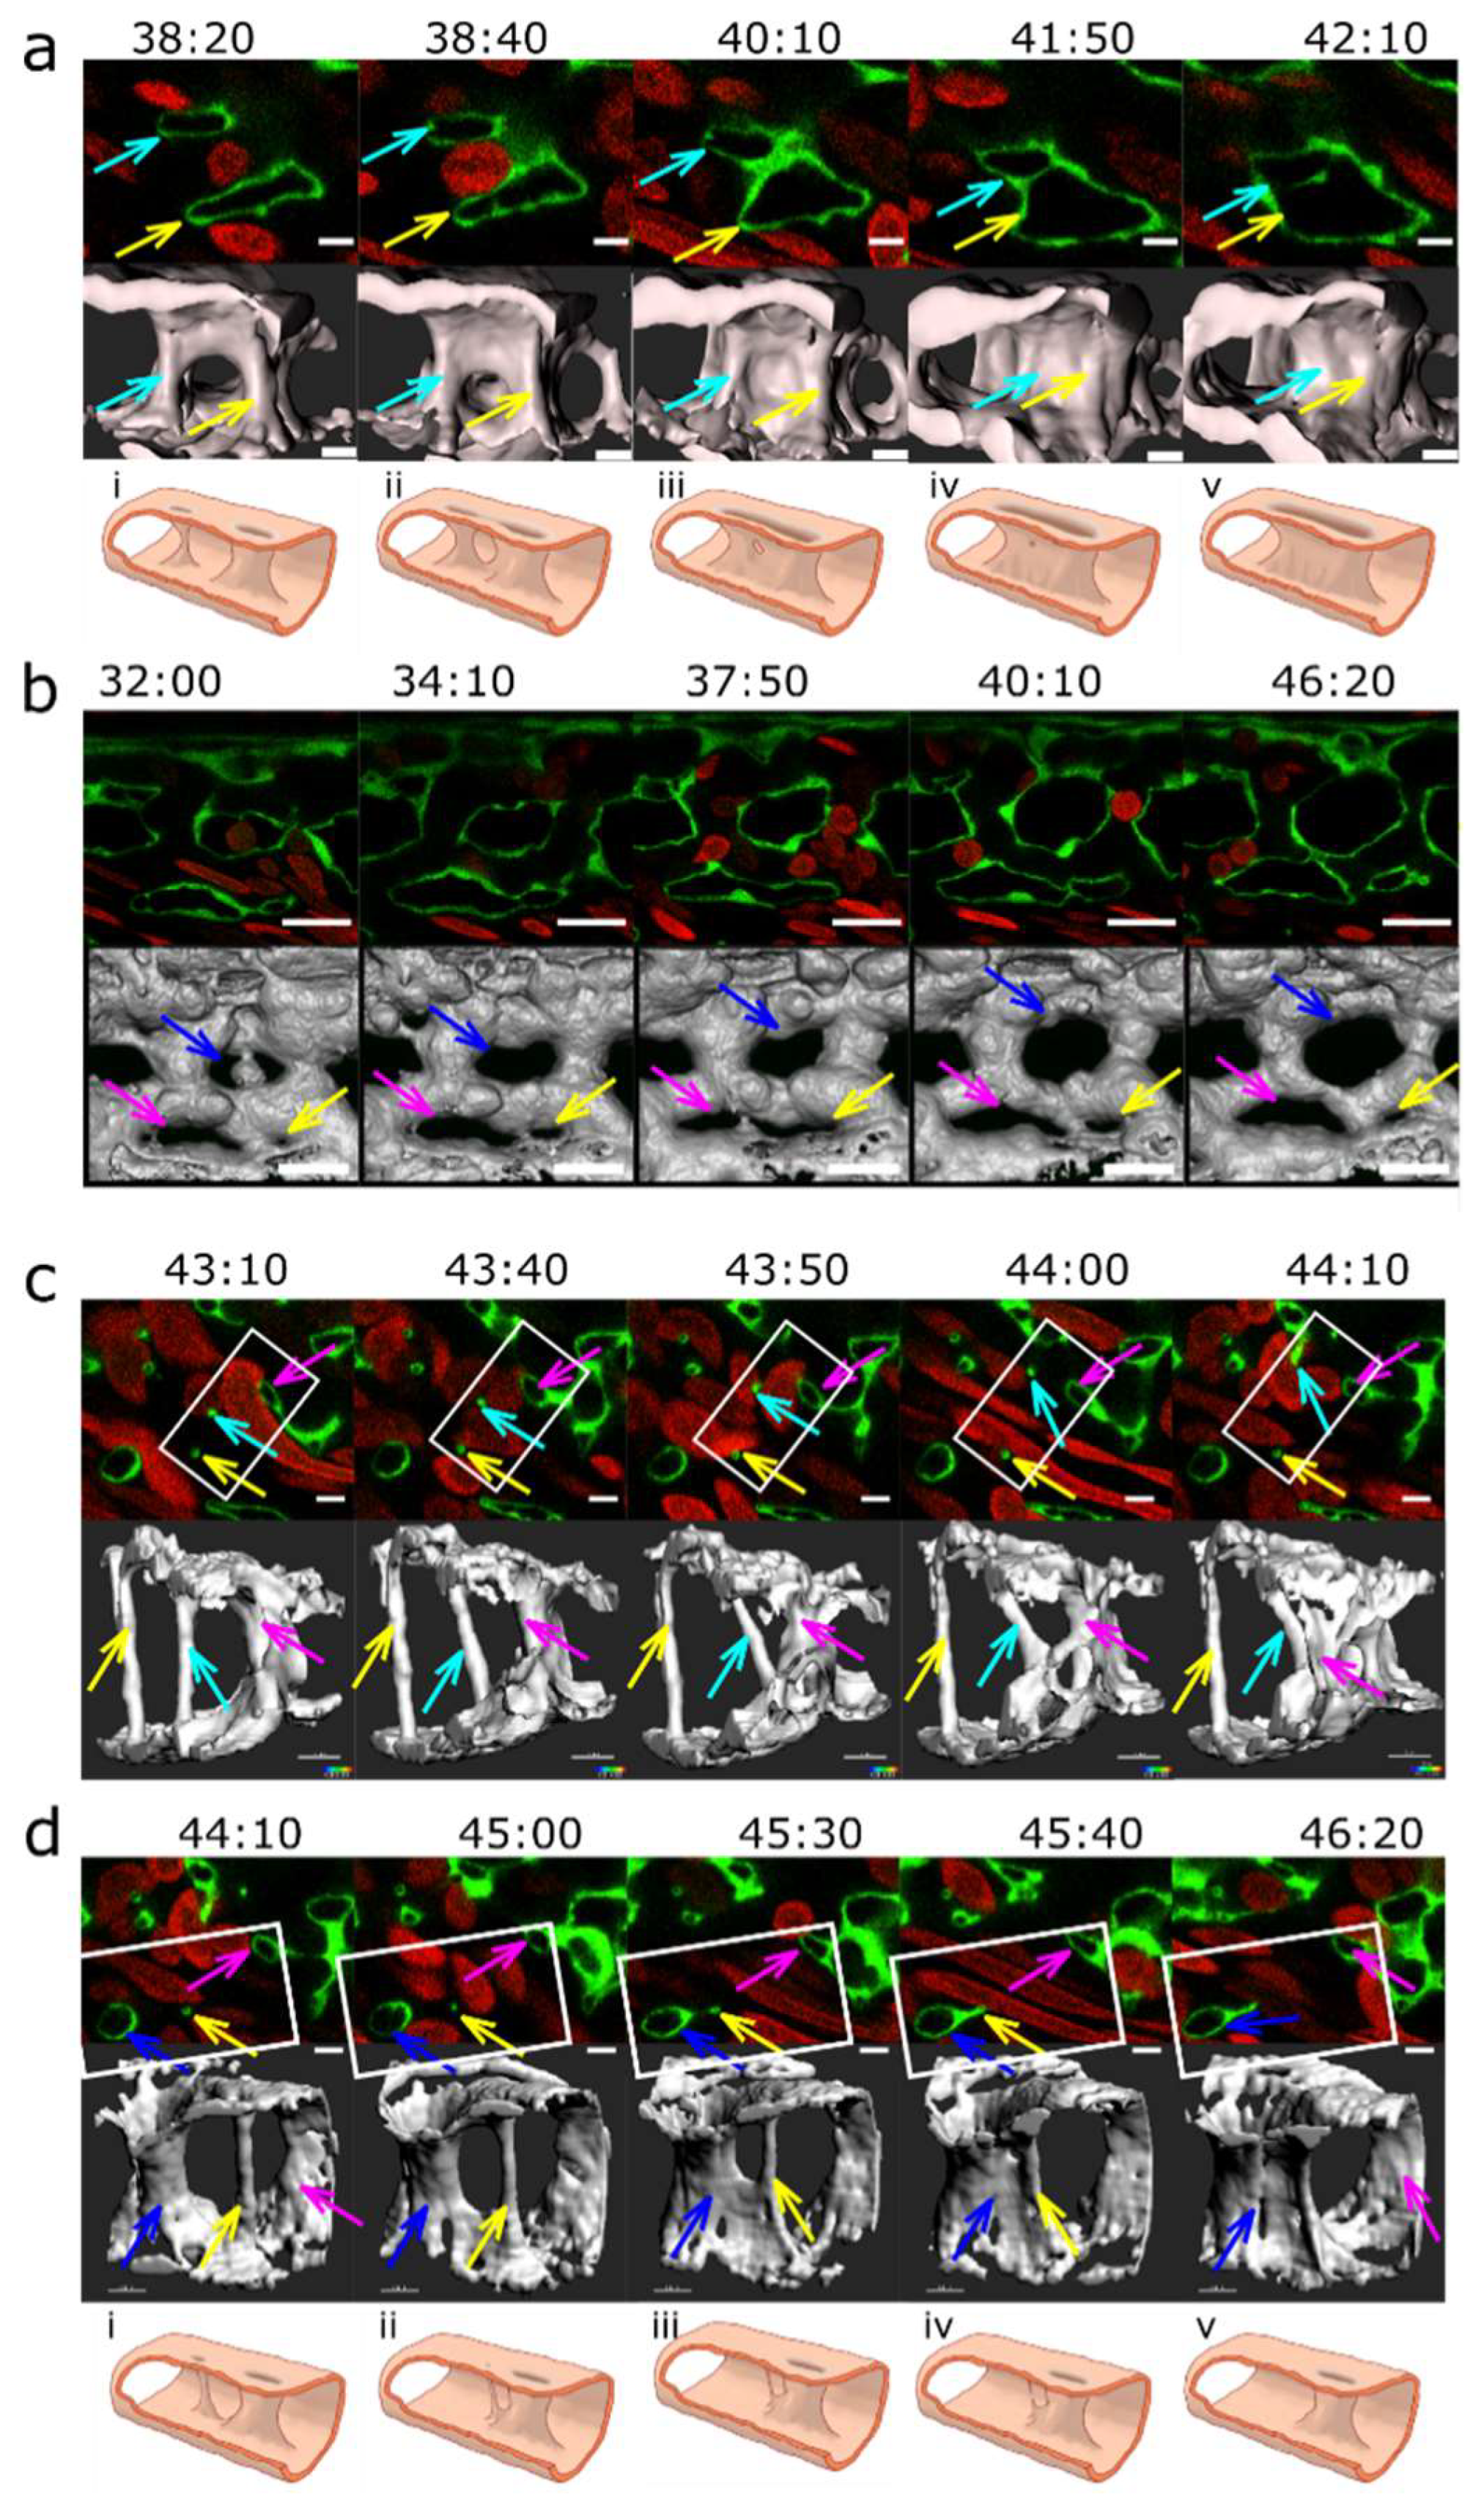
Figure 8.
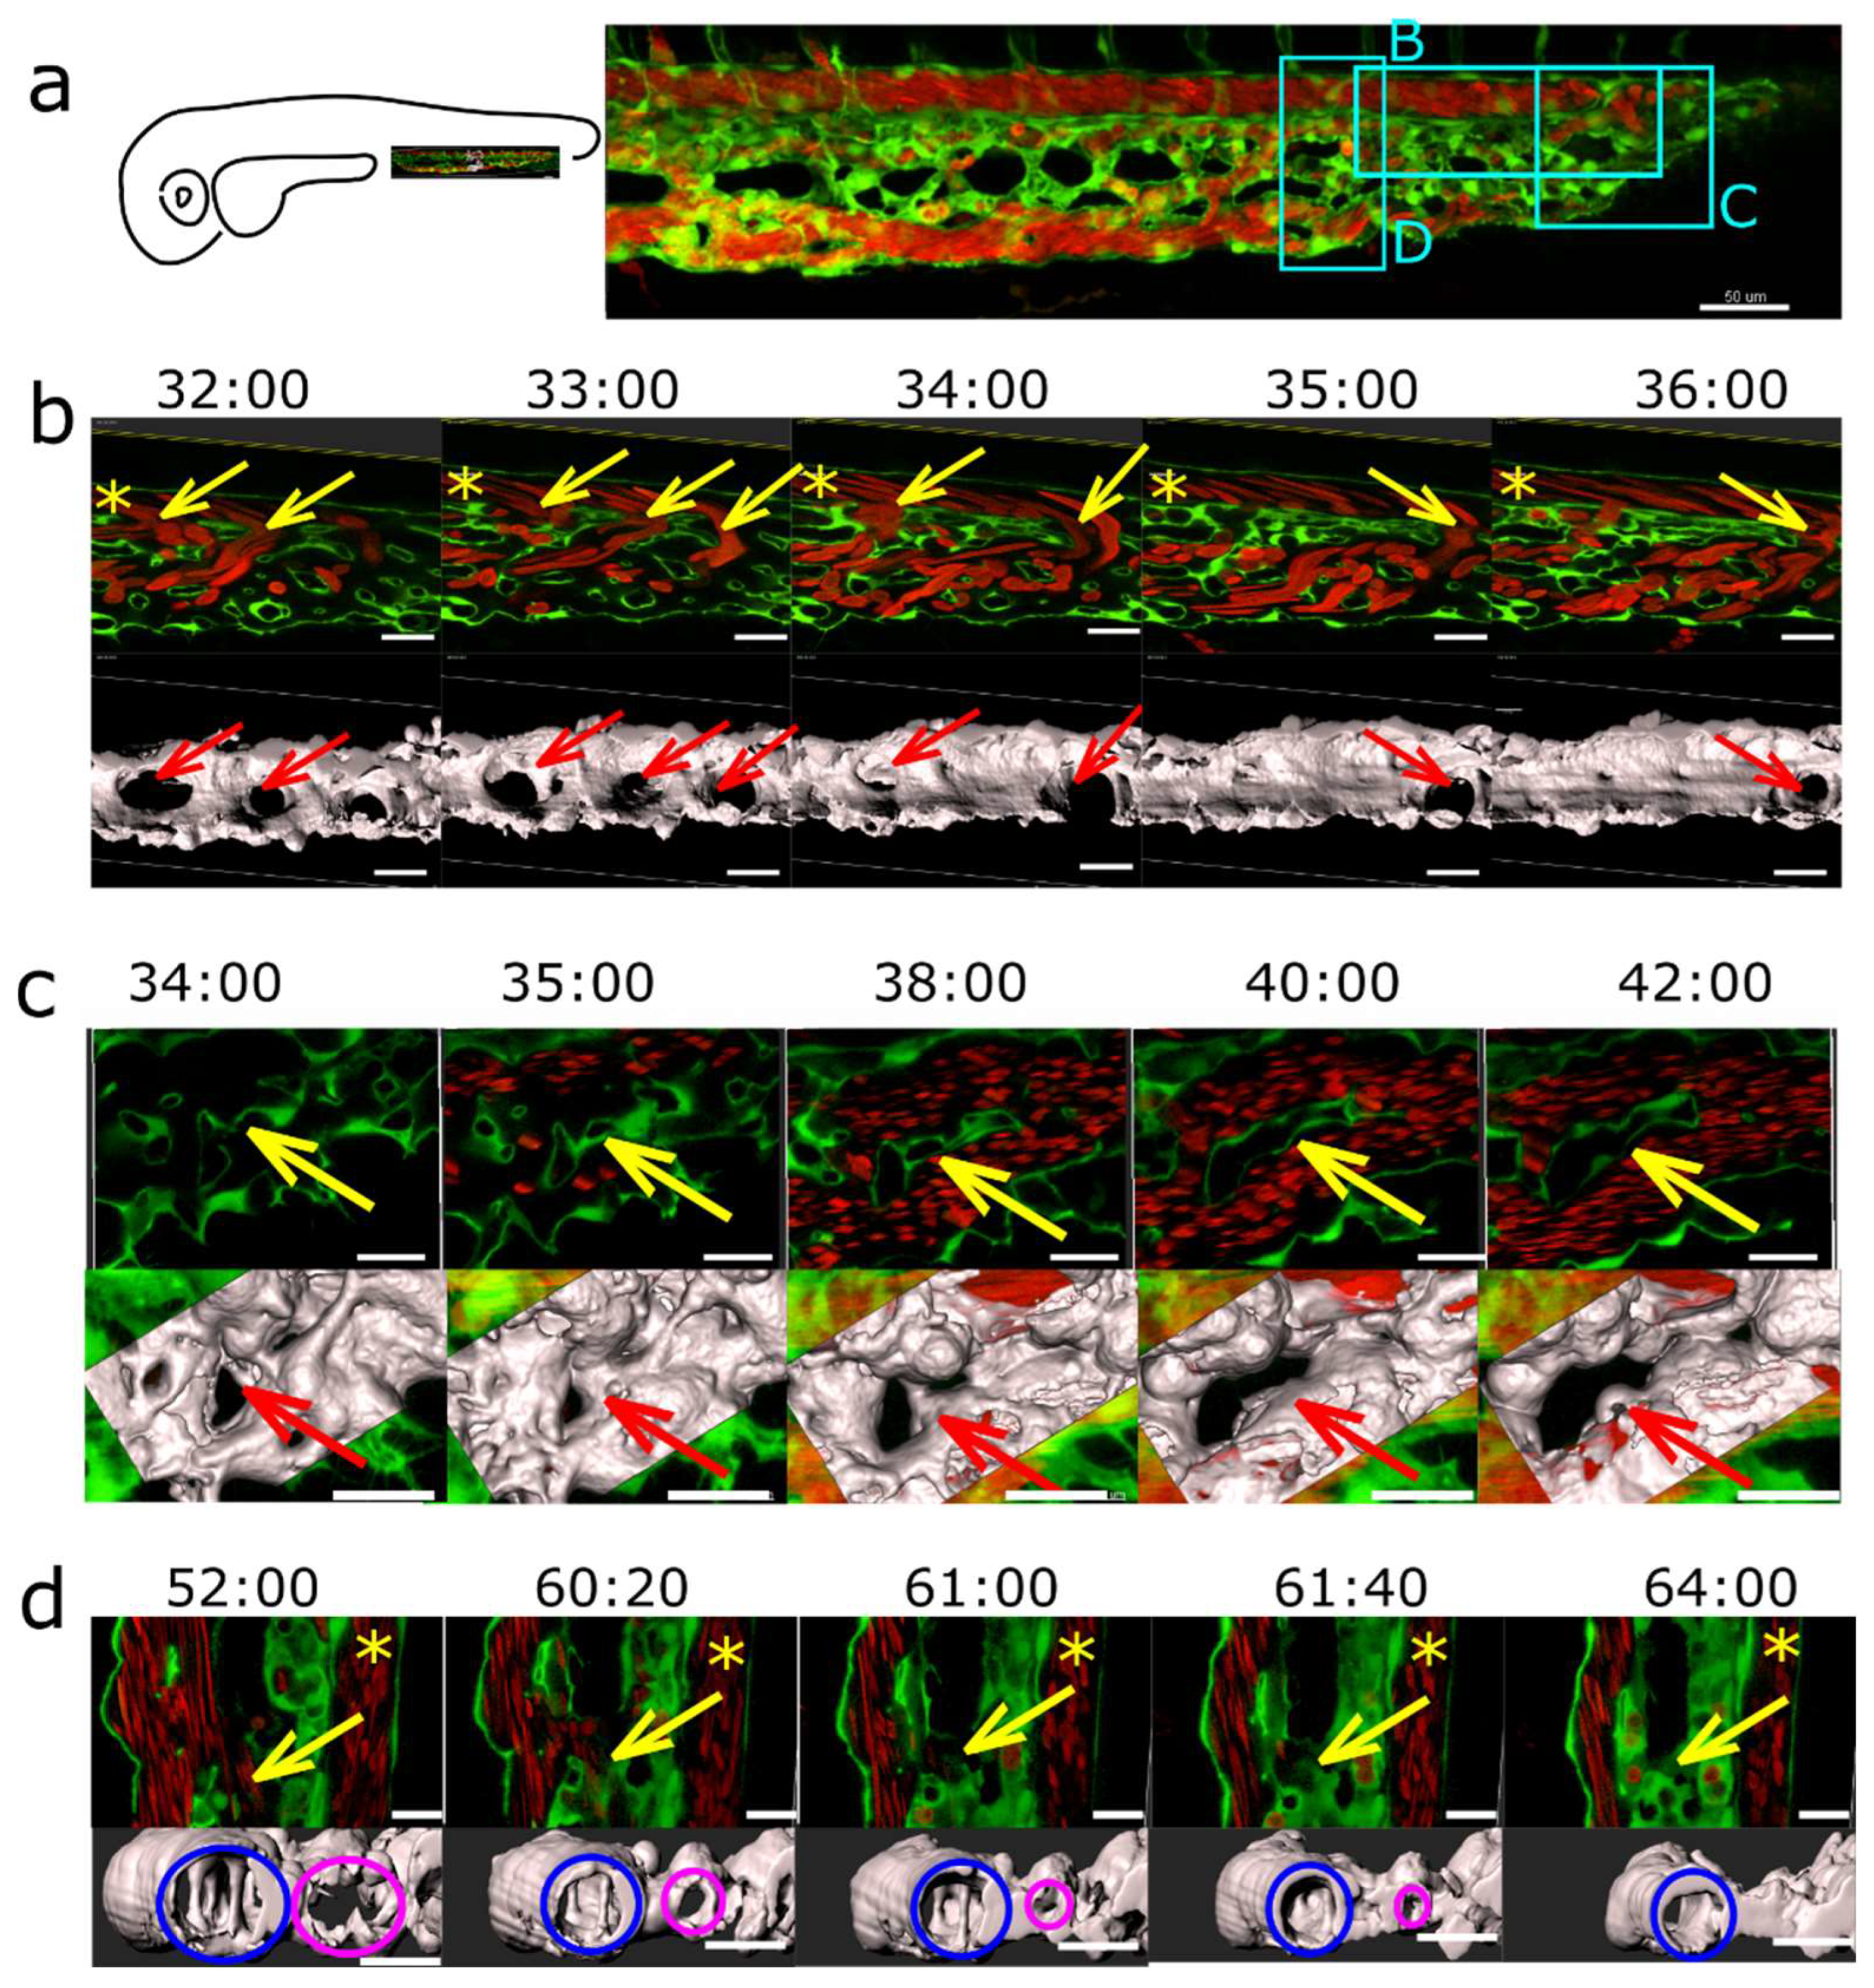
Arteriovenous and venous splitting. (a): Overview of the CVP of Fli1a:eGFP//Gata1:dsRed embryos showing the region where image sequences b-d were taken (since these were from different embryos, this is just a typical example CVP). DA marked with an asterisk. Endothelium in green, erythrocytes in red, 3D reconstruction in grey (based on the eGFP channel). (b): Arteriovenous splitting. The image sequence shows connections between the DA and the CV marked with yellow arrows that gradually close except for the most caudal one: thus, the blood flow shifts towards the caudal end of the plexus. First row: single slice. Second row: 3D reconstruction, showing the arteriovenous connections (red arrows). (c): Venous splitting at the growing front of the plexus occurs by merging of meshes. First row: single slice. Second row: 3D reconstruction within the rectangle in grey. (d): (Intussusceptive) Arborisation: The lumen of a redundant venous segment (magenta circle) in the central part of the CVP gradually shrinks and eventually fully collapses, leaving only the lumen of the caudal vein (blue circle) patent. First row: single slice. Second row: 3D reconstruction in grey. Time points (hh:mm post fertilisation) are valid for both columns, respectively. Scale bars: in a: 50 µm, b-d: 20 µm.
