1. Introduction
The modern world is intrinsically reliant on electricity, making the resilience and reliability of electrical grids paramount to the functioning of societies, industries, and critical infrastructure [
1,
2,
3,
4]. The uninterrupted supply of power is essential for the operation of hospitals, communication networks, transportation systems, and a host of other sectors that underpin our daily lives [
1,
2,
5]. However, the vulnerability of electrical grids to various disruptions, such as extreme weather events, cyberattacks, and equipment failures, has highlighted the pressing need to develop strategies that bolster grid resilience and mitigate the impacts of power outages [
6].
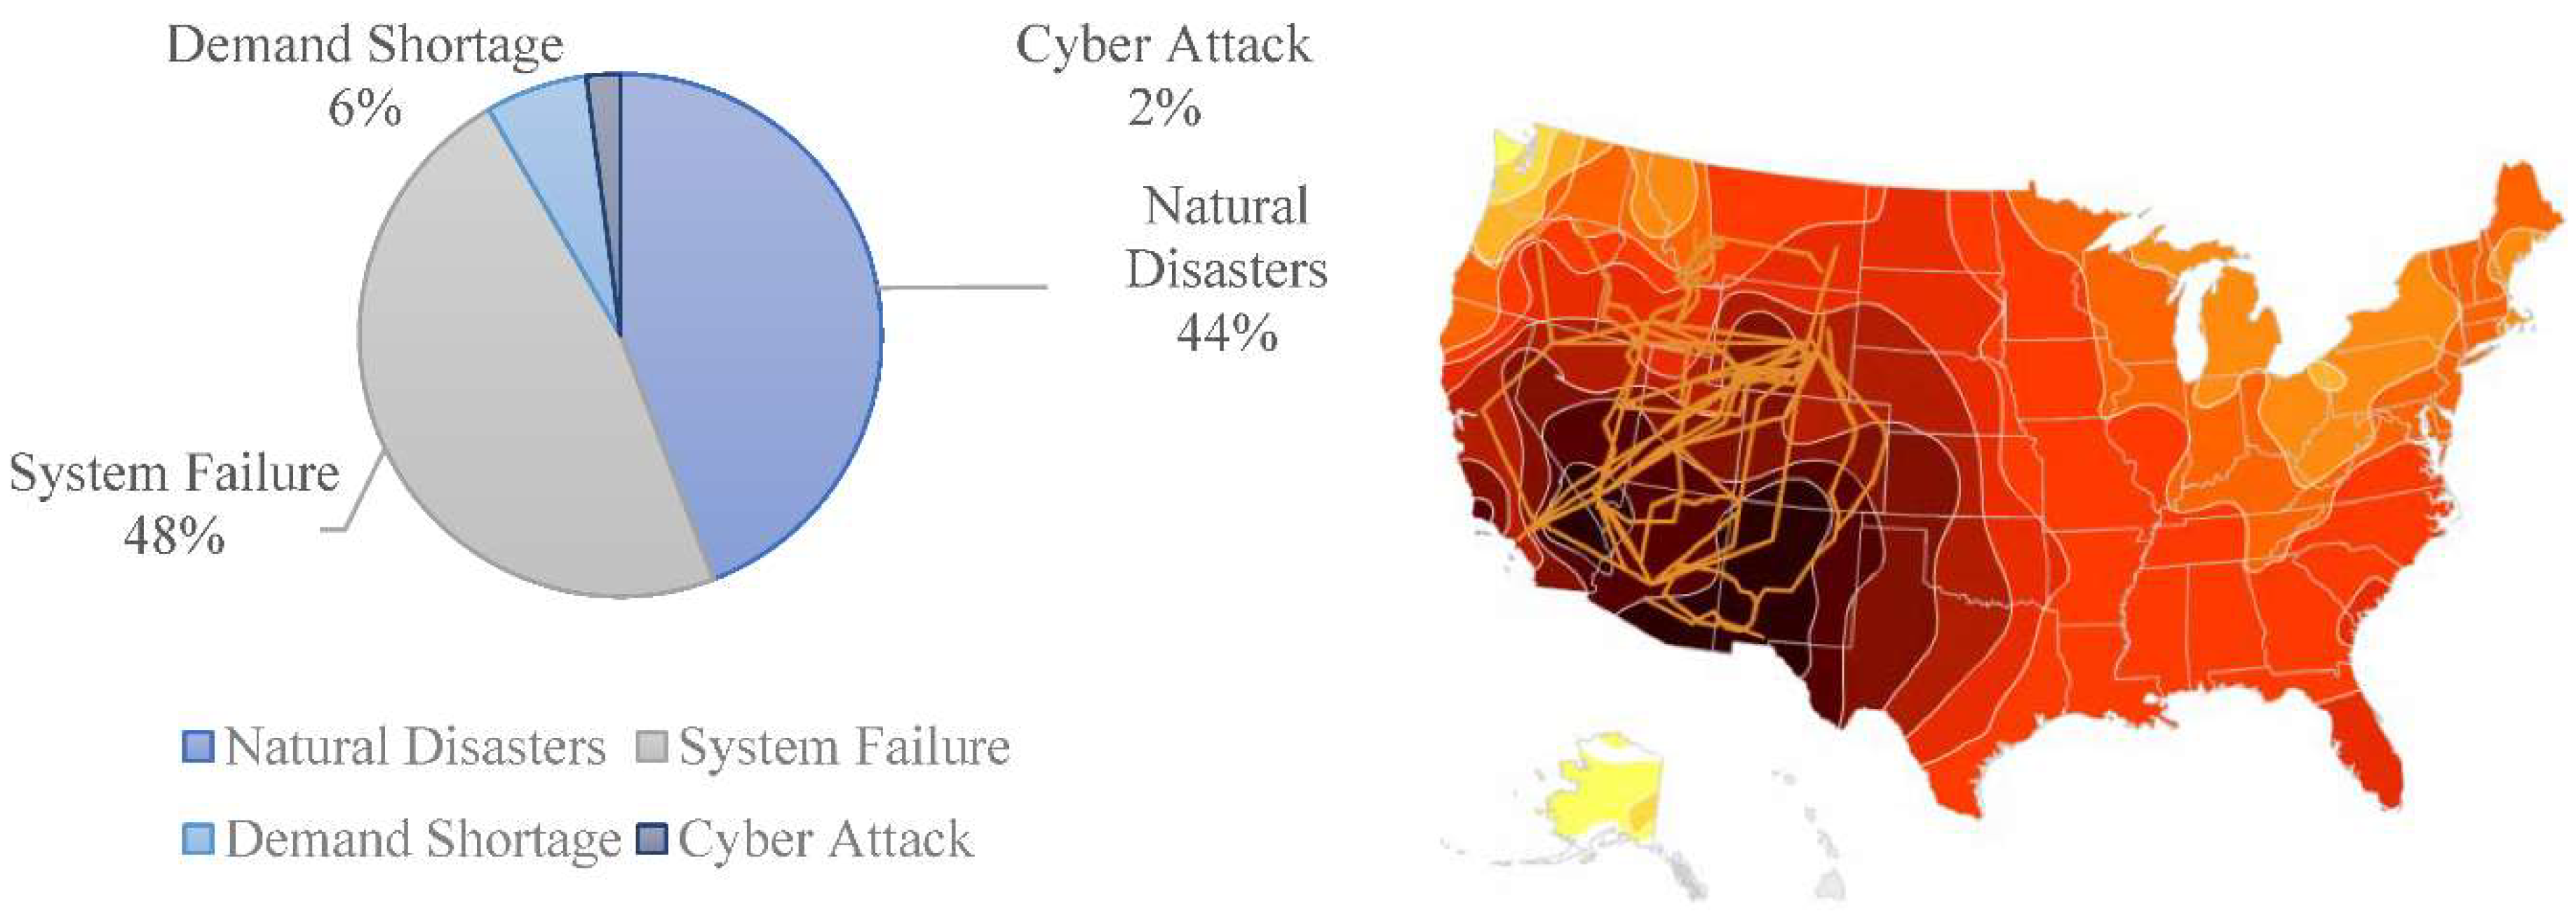
Figure 1.
Typical causes for grid outages in the United States with map [
3].
Figure 1.
Typical causes for grid outages in the United States with map [
3].
Grid resilience, a vital aspect of modern power systems, refers to the ability of an electrical grid to withstand and recover from disturbances, ensuring the consistent delivery of electricity to consumers [
7,
8,
9]. A primary impediment to grid resilience is the occurrence of power outages, characterized by the abrupt cessation of electricity supply to specific areas [
10]. These outages vary in duration and severity, ranging from momentary flickers to extended blackouts that disrupt entire regions [
11]. The causes of power outages are diverse, encompassing natural disasters, equipment malfunctions, overloads, and deliberate attacks on infrastructure [
12]. Therefore, understanding the underlying patterns and attributes of power outages is pivotal for devising effective strategies to augment grid resilience [
13,
14,
15].
A thorough review of existing literature underscores the multifaceted nature of the challenges associated with grid resilience and power outage prediction [
16,
17,
18,
19,
20,
21,
22,
23,
24,
25,
26,
27,
28,
29,
30,
31,
32,
33]. Studies indicate that accurate outage prediction models are essential tools for proactive grid management [
1,
3,
8,
17,
18]. The integration of advanced machine learning techniques, including Long Short-Term Memory (LSTM) networks, has emerged as a promising avenue for capturing temporal dependencies and enhancing the accuracy of forecasting models [
34,
35,
36,
37,
38]. Furthermore, utilizing optimization methodologies such as Particle Swarm Optimization (PSO) has demonstrated notable potential in refining predictive models [
2,
3,
4,
5,
6,
7,
8,
9].
A rigorous statistical analysis was conducted to comprehensively understand power outage occurrences and characteristics in the United States. Examining historical outage data facilitated the identification of trends, frequency distributions, and correlations between outage events and influential factors. These insights furnish valuable information for designing predictive models that anticipate and prepare for impending outage events [
39]. Monte Carlo simulations were employed within the MATLAB environment to envisage future power outage events based on historical data and trends. This probabilistic approach considers the inherent uncertainties of outage occurrences and generates a spectrum of potential scenarios. By contemplating diverse parameters and scenarios, the Monte Carlo method augments the precision of outage predictions and contributes to the formulation of robust mitigation strategies [
10]. The potential of Long Short-Term Memory (LSTM) networks, a subset of recurrent neural networks, was harnessed for the prediction of solar irradiance and load profiles within microgrids. The accurate prediction of solar irradiance is pivotal for optimizing the utilization of renewable energy sources, while load forecasting facilitates the efficient distribution of energy resources [
2,
3,
4,
6,
8,
40,
41]. The LSTM model's innate ability to capture temporal dependencies within data significantly advances over traditional methods, leading to heightened forecasting accuracy [
4,
6,
41,
42,
43].
Recognizing the need to further enhance prediction accuracy, the hybrid LSTM-PSO model emerged as an innovative solution [
3]. This hybridization capitalizes on the strengths of both LSTM and Particle Swarm Optimization (PSO) [
2,
3,
44,
45,
46,
47]. The PSO algorithm, traditionally used for optimization tasks, is adapted to fine-tune the parameters of the LSTM network, thereby enhancing the model's performance [
3,
6,
48]. The synergistic interaction between LSTM and PSO results in forecasts that are more precise, reliable, and adaptable [
2,
3]. On the other hand, the State of Charge (SoC) of batteries constitutes a pivotal factor in augmenting the resilience of microgrids during power outages [
12,
15,
49,
50,
51,
52,
53]. Batteries, capable of storing surplus energy generated by solar panels and discharging it when needed, act as a dependable source of backup power during disruptions [
52]. Effective management of battery SoC ensures an uninterrupted power supply and minimizes downtime during outages [
37,
38,
52]. A comparative evaluation between grid-tied microgrids featuring solar panels and battery storage and traditional grid systems unveils the techno-economic advantages of the former [
17,
19,
26,
31]. This assessment considers many factors, including reduced energy costs, diminished emissions, and augmented energy self-sufficiency [
11,
21,
33,
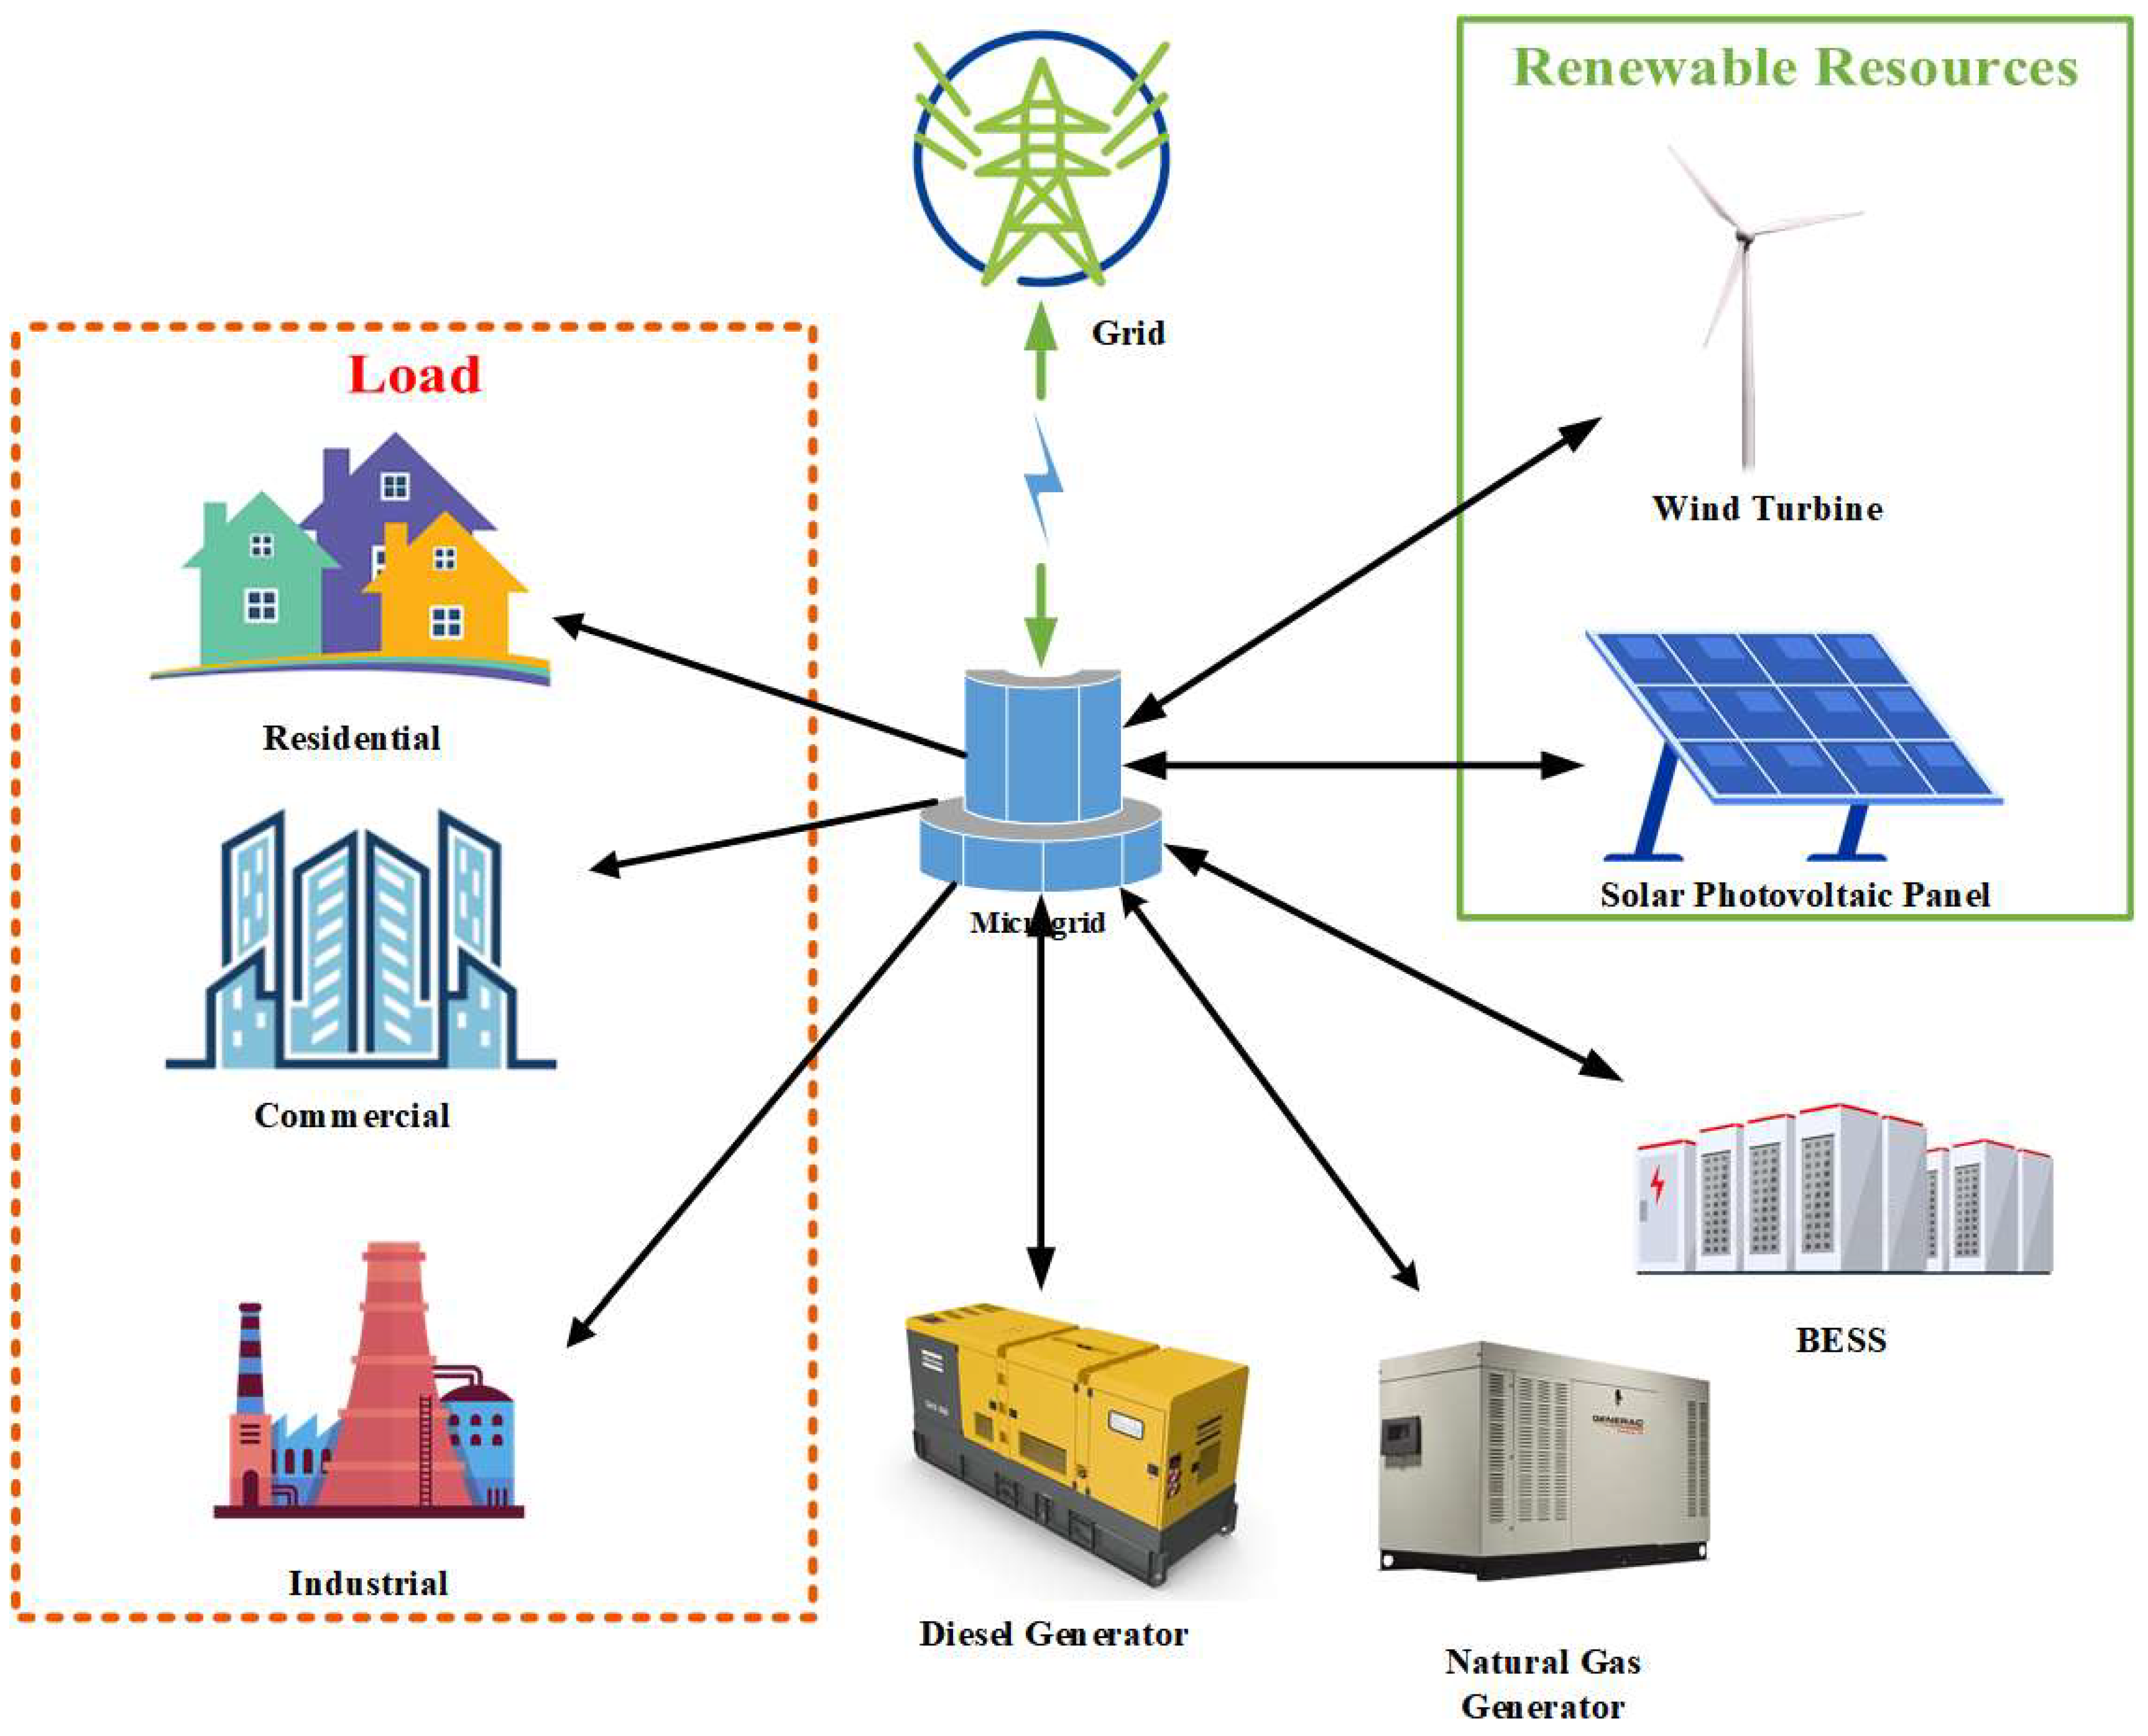
50]. The results underscore the potential of microgrids as sustainable, cost-effective alternatives that bolster grid resilience and foster energy efficiency. The schematic of a grid-connected microgrid is shown in
Figure 2.
This article presents a comprehensive approach to fortifying grid resilience through the integration of advanced prediction and optimization techniques. By amalgamating statistical analysis, machine learning methodologies, and hybrid models, the proposed framework offers a holistic strategy for alleviating the impact of power outages. Incorporating renewable energy sources and battery storage within microgrids enhances energy utilization sustainability and economic advantages [
2,
3,
12,
19]. The study contributes to the ongoing endeavors to bolster grid resilience in the face of evolving challenges, thereby advancing the sustainability and reliability of modern power systems [
16,
35].
2. Methodology
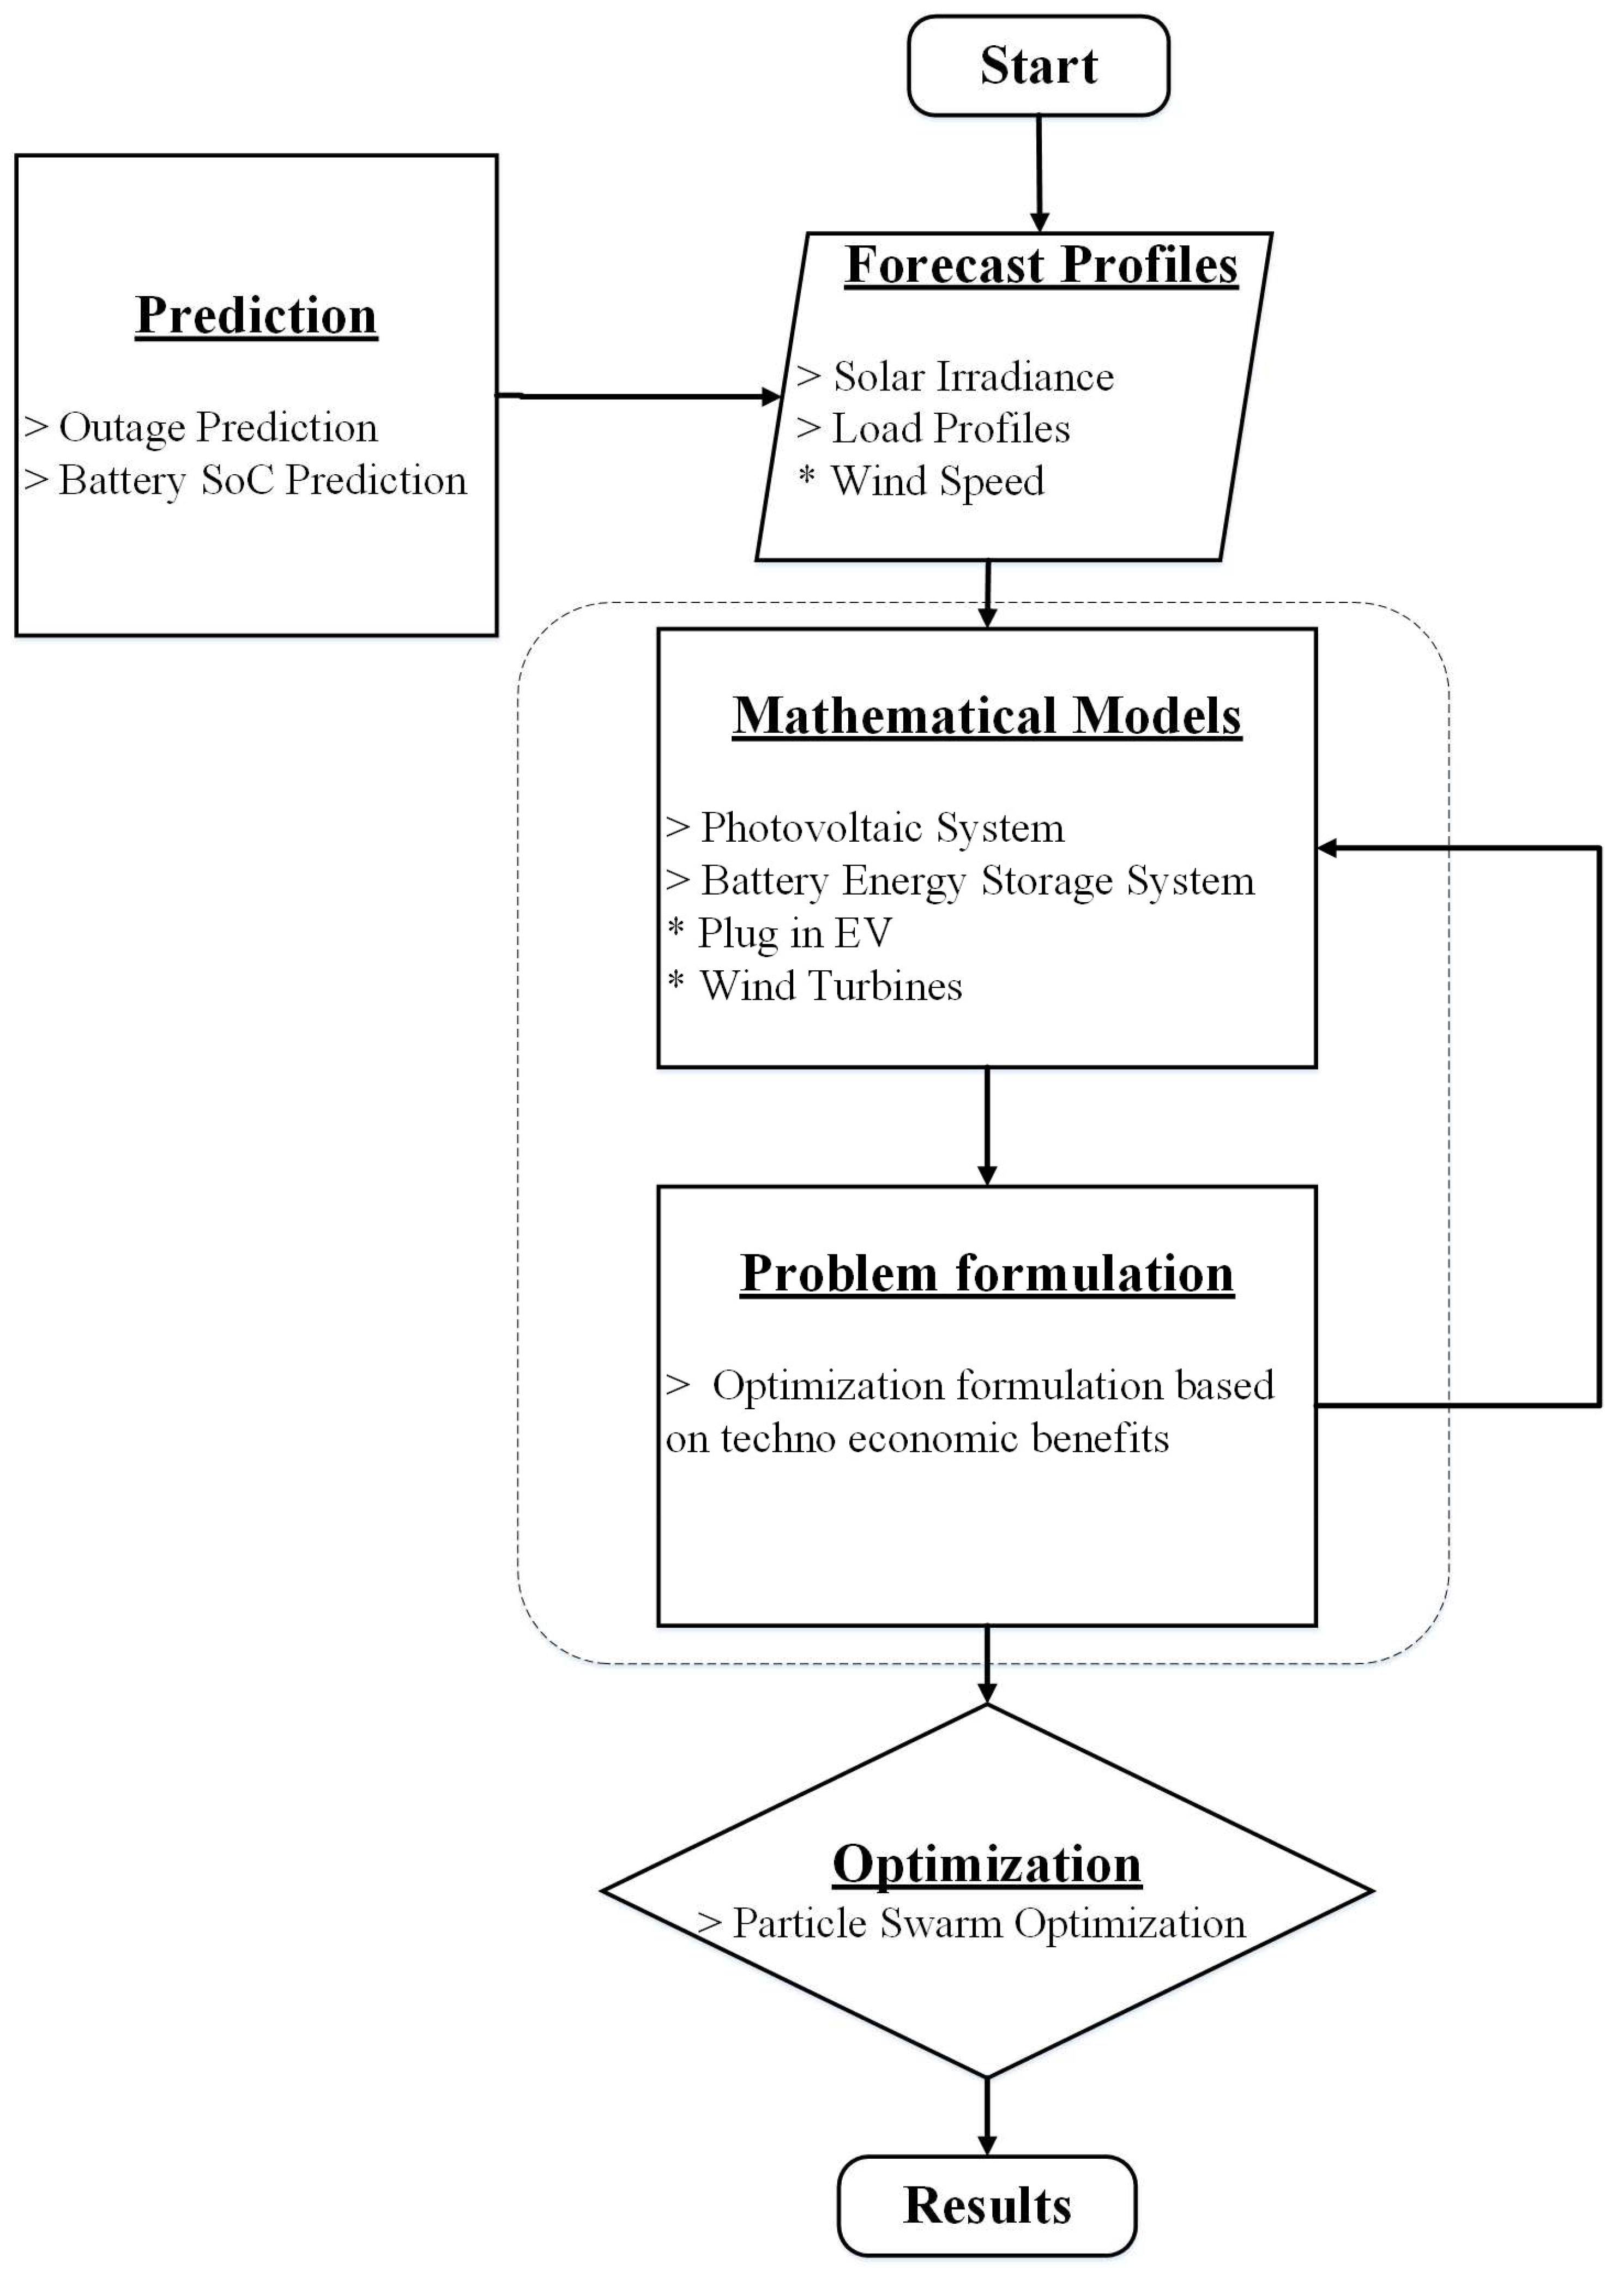
The research methodology employs a systematic approach to enhance grid resilience and optimize microgrid operations. The methodology encompasses several interconnected steps, leveraging predictive techniques, mathematical models, optimization algorithms, and results analysis. The proposed hybrid algorithm is shown in
Figure 3.
The flowchart shows a six-step process for optimizing the resilience and economics of a microgrid. The first step is to predict outage events and battery state of charge using Monte Carlo simulation. The second step is to forecast energy profiles using hybrid-modified PSO-LSTM models. The third step is to formulate mathematical models for the various components of the microgrid. The fourth step is to formulate an optimization problem that maximizes grid resilience and economic benefits, subject to constraints such as energy generation, storage capacity, and load demand. The fifth step is to solve the optimization problem using particle swarm optimization. The sixth step is to analyze and interpret the results to identify the most resilient and economic microgrid configuration.
The flowchart is a comprehensive and systematic approach to optimizing the resilience and economics of a microgrid. It takes into account the uncertainty of future outage events and battery state of charge, and it uses state-of-the-art forecasting techniques to predict energy profiles. The optimization problem is formulated to maximize grid resilience and economic benefits, and it is solved using a powerful optimization algorithm. The flowchart is a valuable tool for microgrid operators looking to improve their systems' resilience and economics.
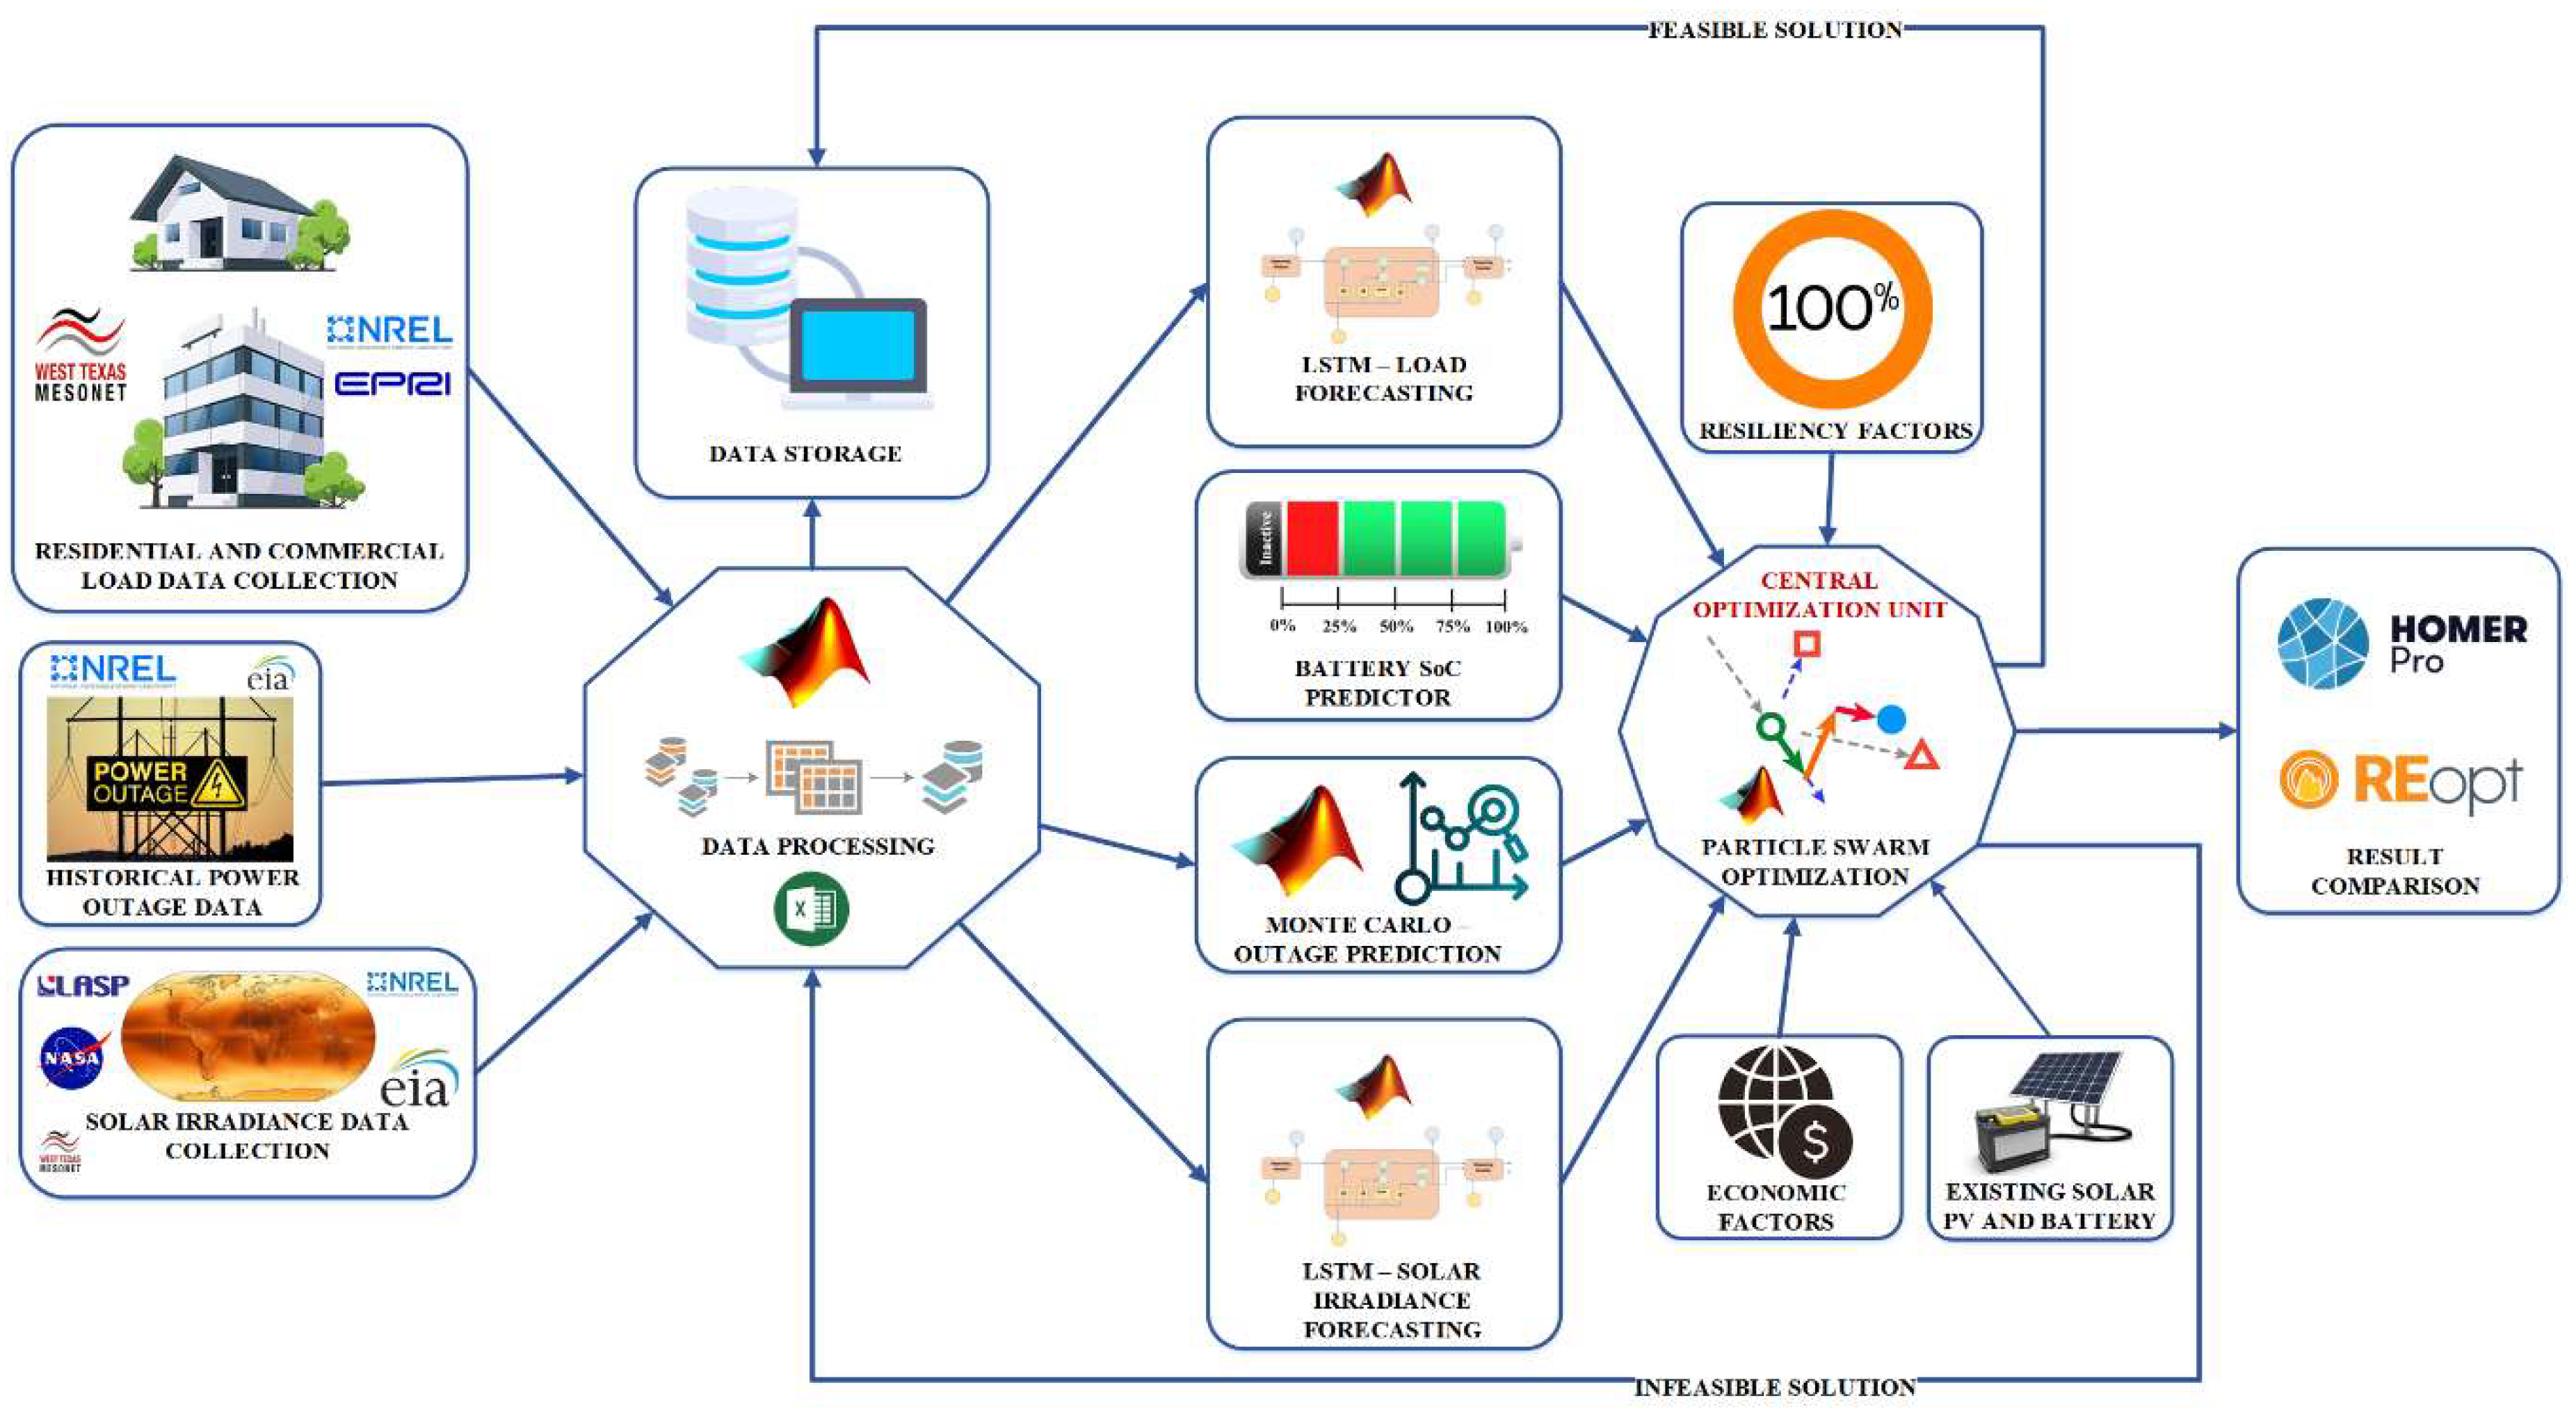
By following this comprehensive methodology, the article's approach ensures an integrated and optimized microgrid operation, considering both resilience and economic viability. The system overview is shown in
Figure 4.
The combination of predictive techniques, mathematical models, optimization algorithms, and results analysis enables the microgrid to navigate uncertainties and challenges effectively while ensuring reliable energy supply and efficient resource utilization.
3. Constraining Function For Optimization
The constraining functions used in the optimization problem play a vital role in ensuring that the solutions obtained are feasible and aligned with the objectives of the microgrid. These functions impose restrictions on various parameters and variables to ensure that the resulting configuration is practical and meets specific criteria. In the context of the article's methodology, the constraining functions can be described as follows:
3.1. Energy Balance Constraint
This constraint ensures that the energy supplied by various sources within the microgrid matches the energy demand. It ensures that the energy generation (solar, wind, etc.), energy storage, and energy consumption (load demand) are balanced at all times:
3.2. Battery State of Charge (SoC) Constraint
To maintain the reliability of the microgrid during outages, the battery SoC needs to be within a specific range. This constraint prevents overcharging or over-discharging of the battery, which can impact its efficiency and lifespan:
3.3. Energy Storage Capacity Constraint
The energy stored in the battery should not exceed its storage capacity:
3.4. Generation and Load Limits
Constraints are set on the maximum energy generation from different sources (solar panels, wind turbines) and the maximum allowable load demand to prevent exceeding the capacity of the microgrid components:
3.5. Economic Constraints
If the article's analysis includes economic considerations, there may be budget limitations or cost-effectiveness constraints. These constraints ensure that the solution aligns with the available resources and budget:
3.6 Environmental Constraints
In the case of a grid-connected microgrid with renewable sources, there might be constraints on minimizing carbon emissions or maximizing the utilization of renewable energy:
These constraining functions guide the optimization algorithm to search for solutions that satisfy both technical and economic requirements. The optimization aims to find a configuration that maximizes the microgrid's resilience against outages while ensuring its efficient and cost-effective operation. The specific form and parameters of these constraints would depend on the microgrid's characteristics, the objectives of the optimization, and the constraints imposed by the physical components and operational conditions.
4. Outage and Battery SoC prediction
Monte Carlo simulation is a powerful technique used to model and analyze the behavior of complex systems through random sampling [
10]. In the context of the article's methodology, Monte Carlo simulation is applied to predict outage events and battery state of charge (SoC).
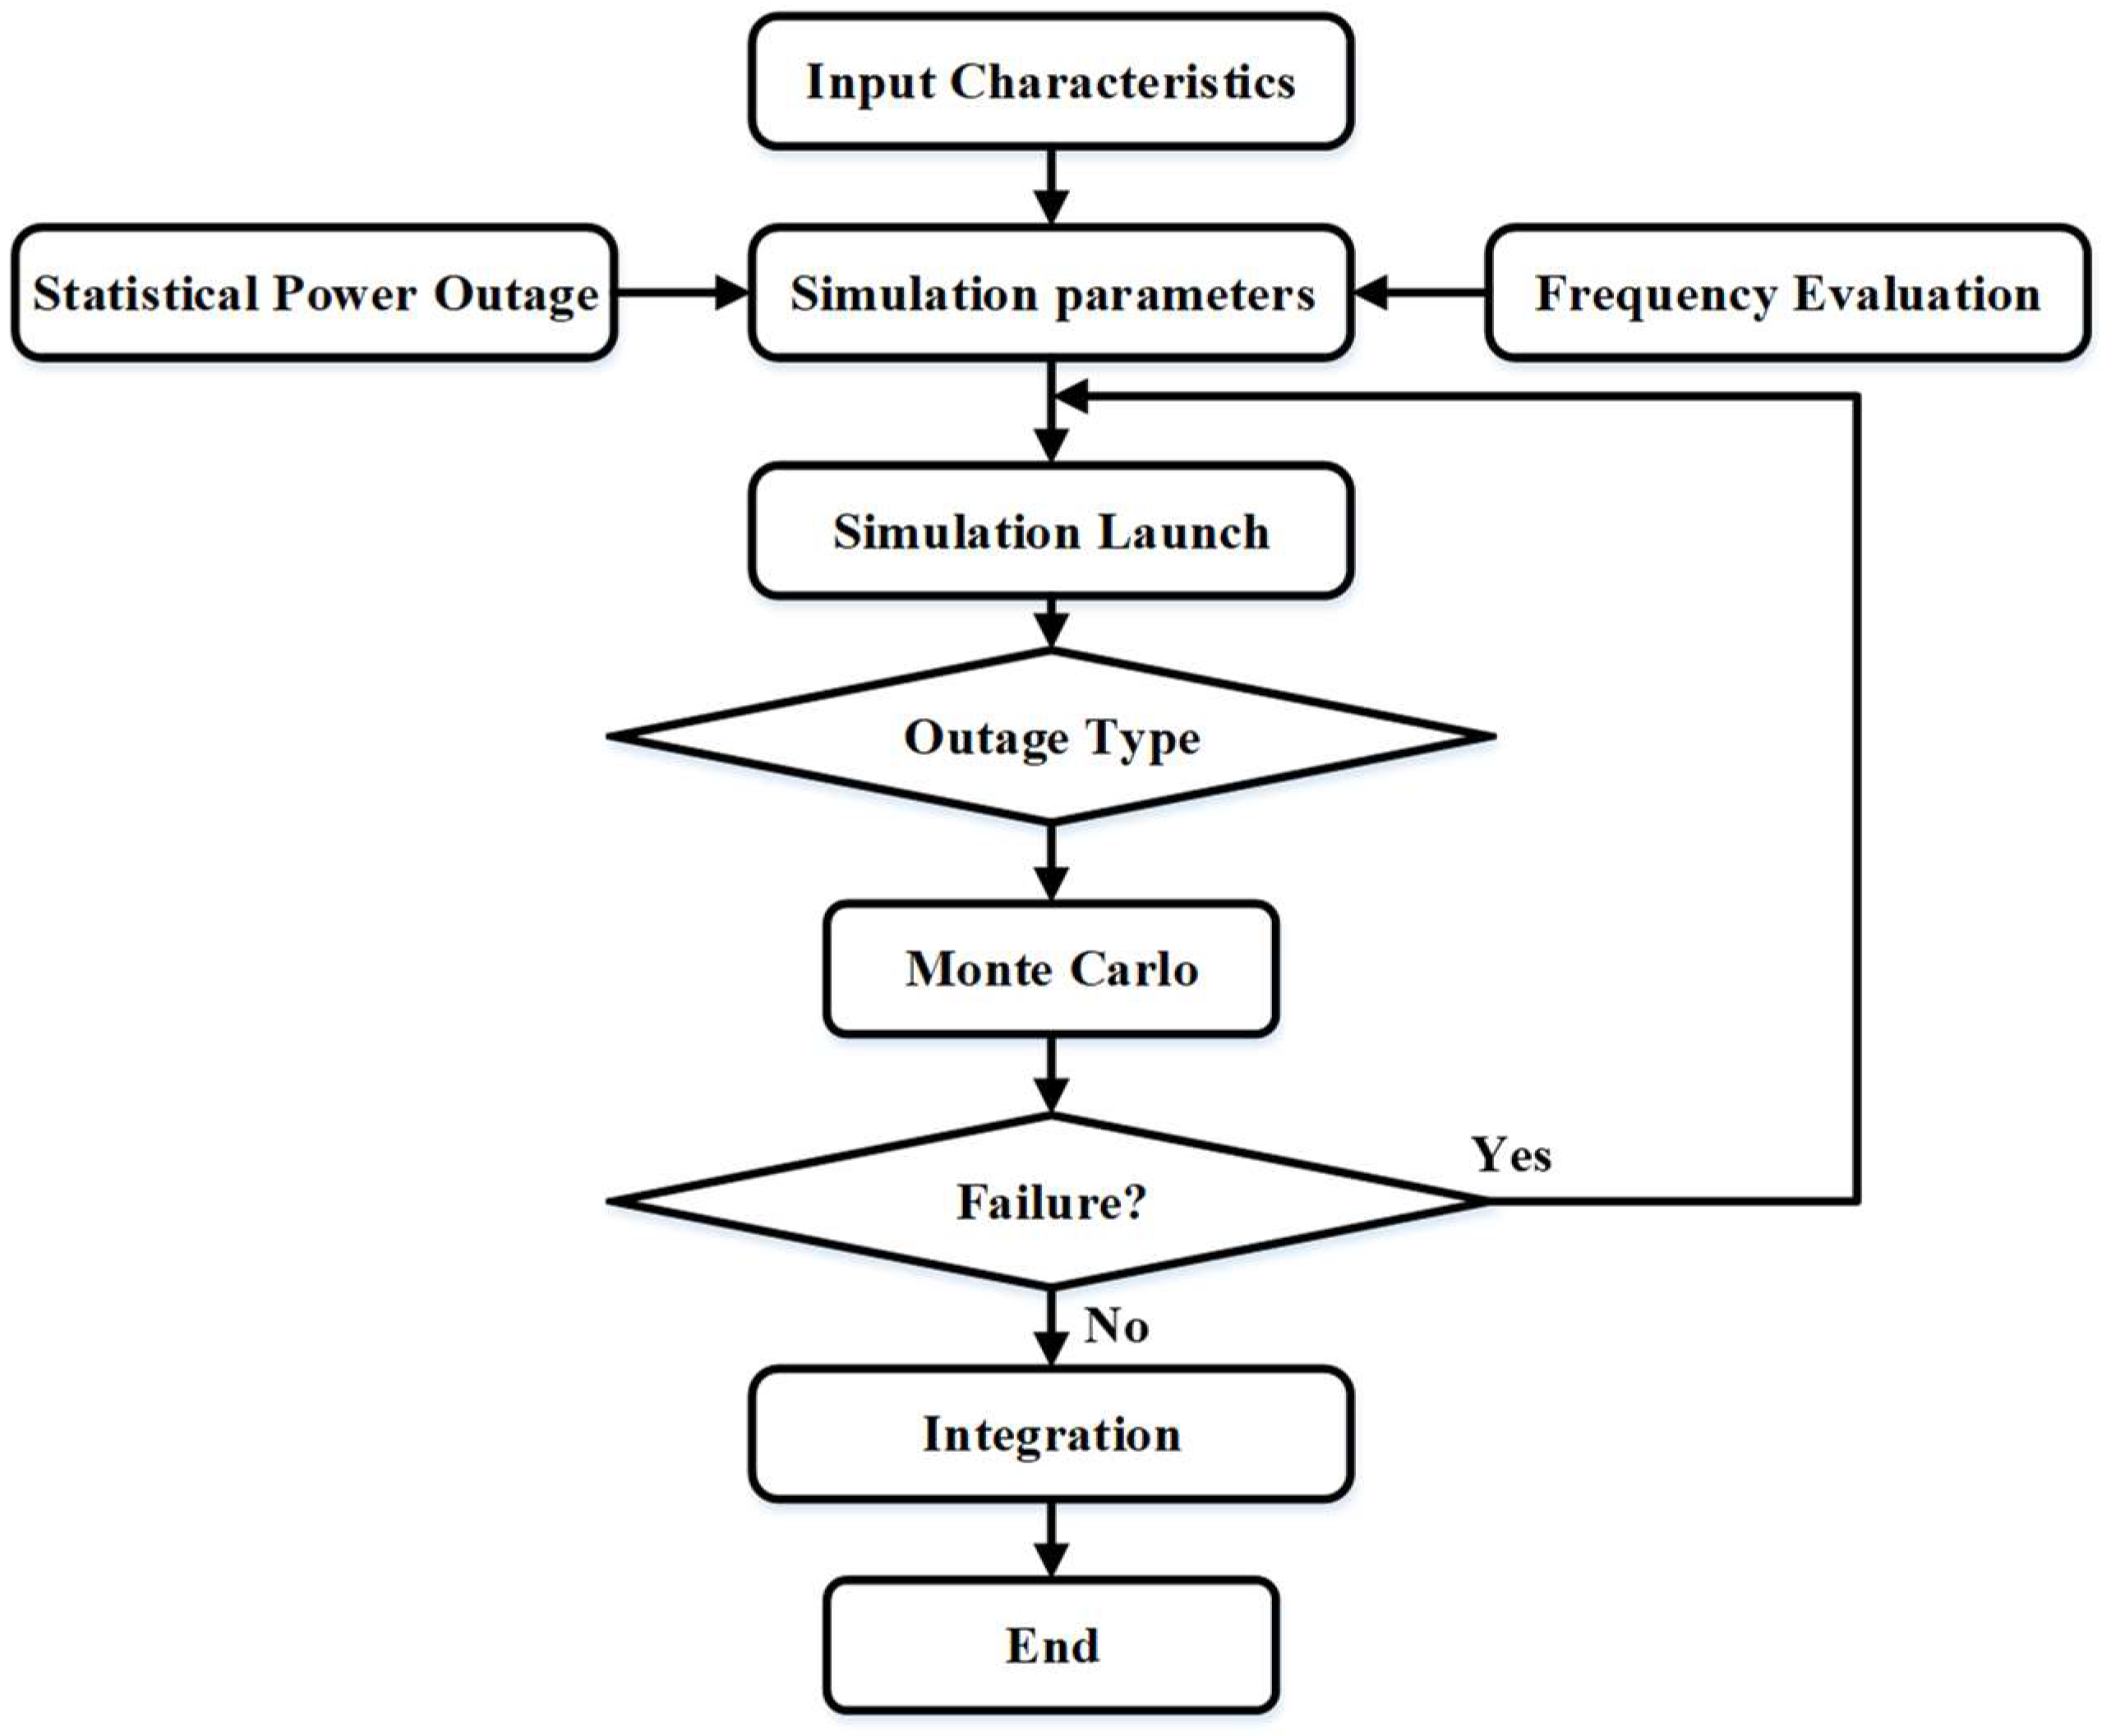
Figure 5 shows the flow chart to predict potential outages in a microgrid's lifetime.
Here are the basic equations for performing Monte Carlo simulation: Outage prediction involves generating multiple scenarios of potential outage events based on historical data and probabilistic models.
Defining probability distribution of outages,
Let P(Outage) be the probability of an outage occurring in a given time period. This probability can be estimated from historical outage data or other relevant sources.
Generate a sequence of random numbers between 0 and 1 using a random number generator.
Simulation of outage events,
For each random number generated, compare it to the probability
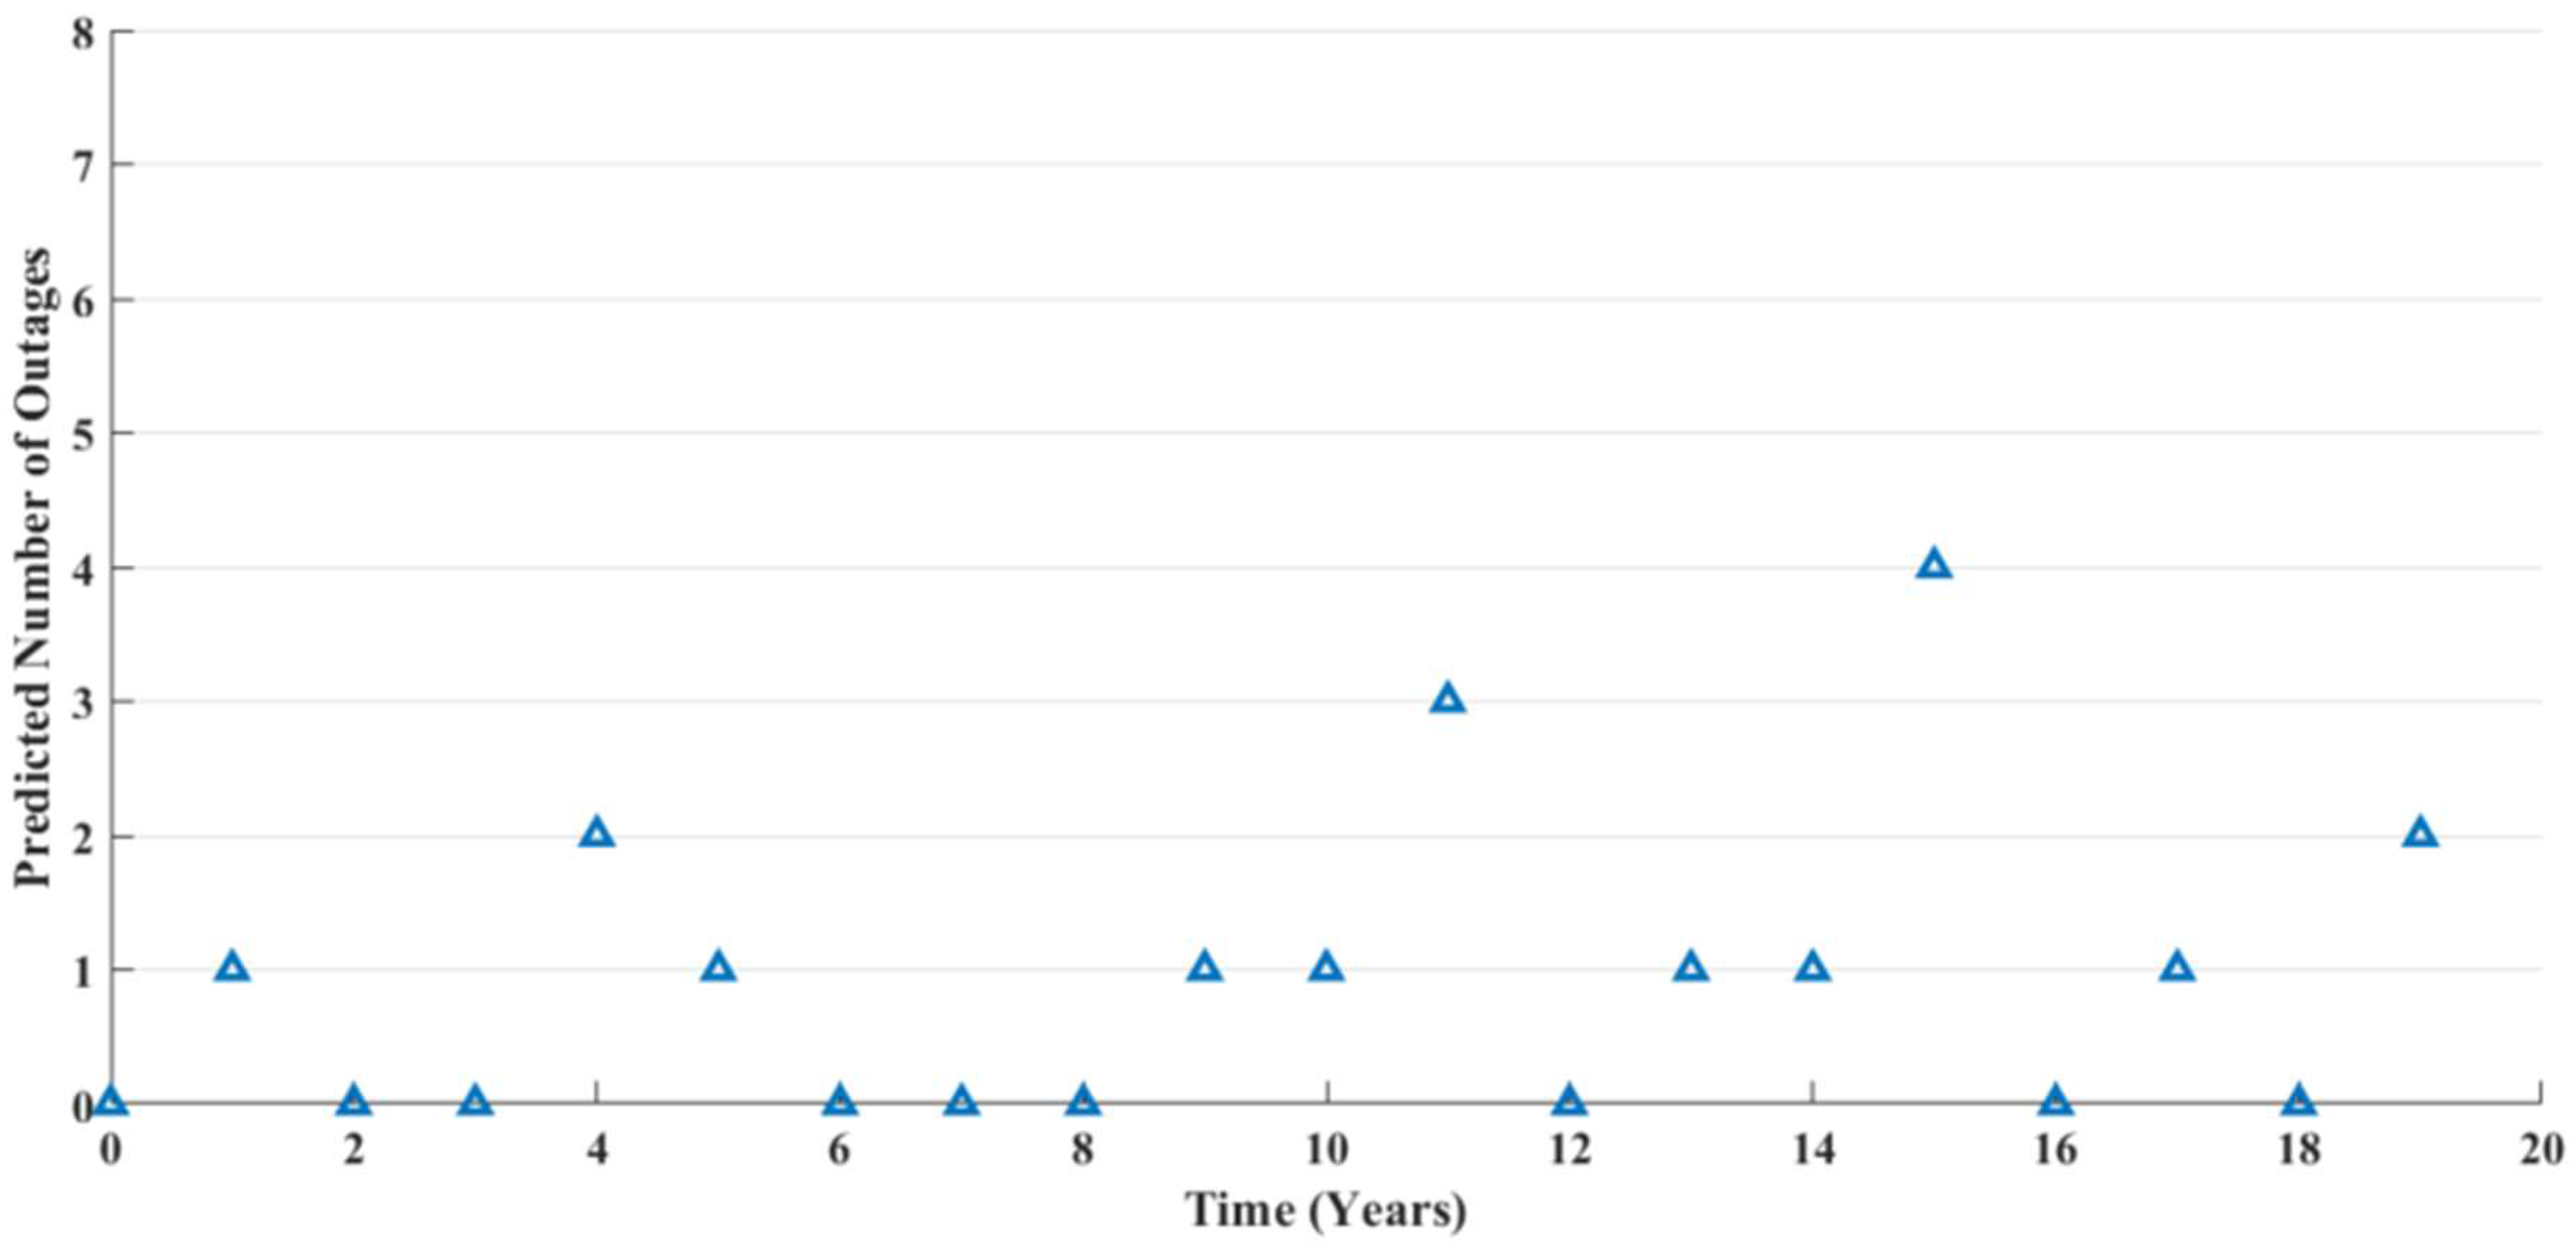
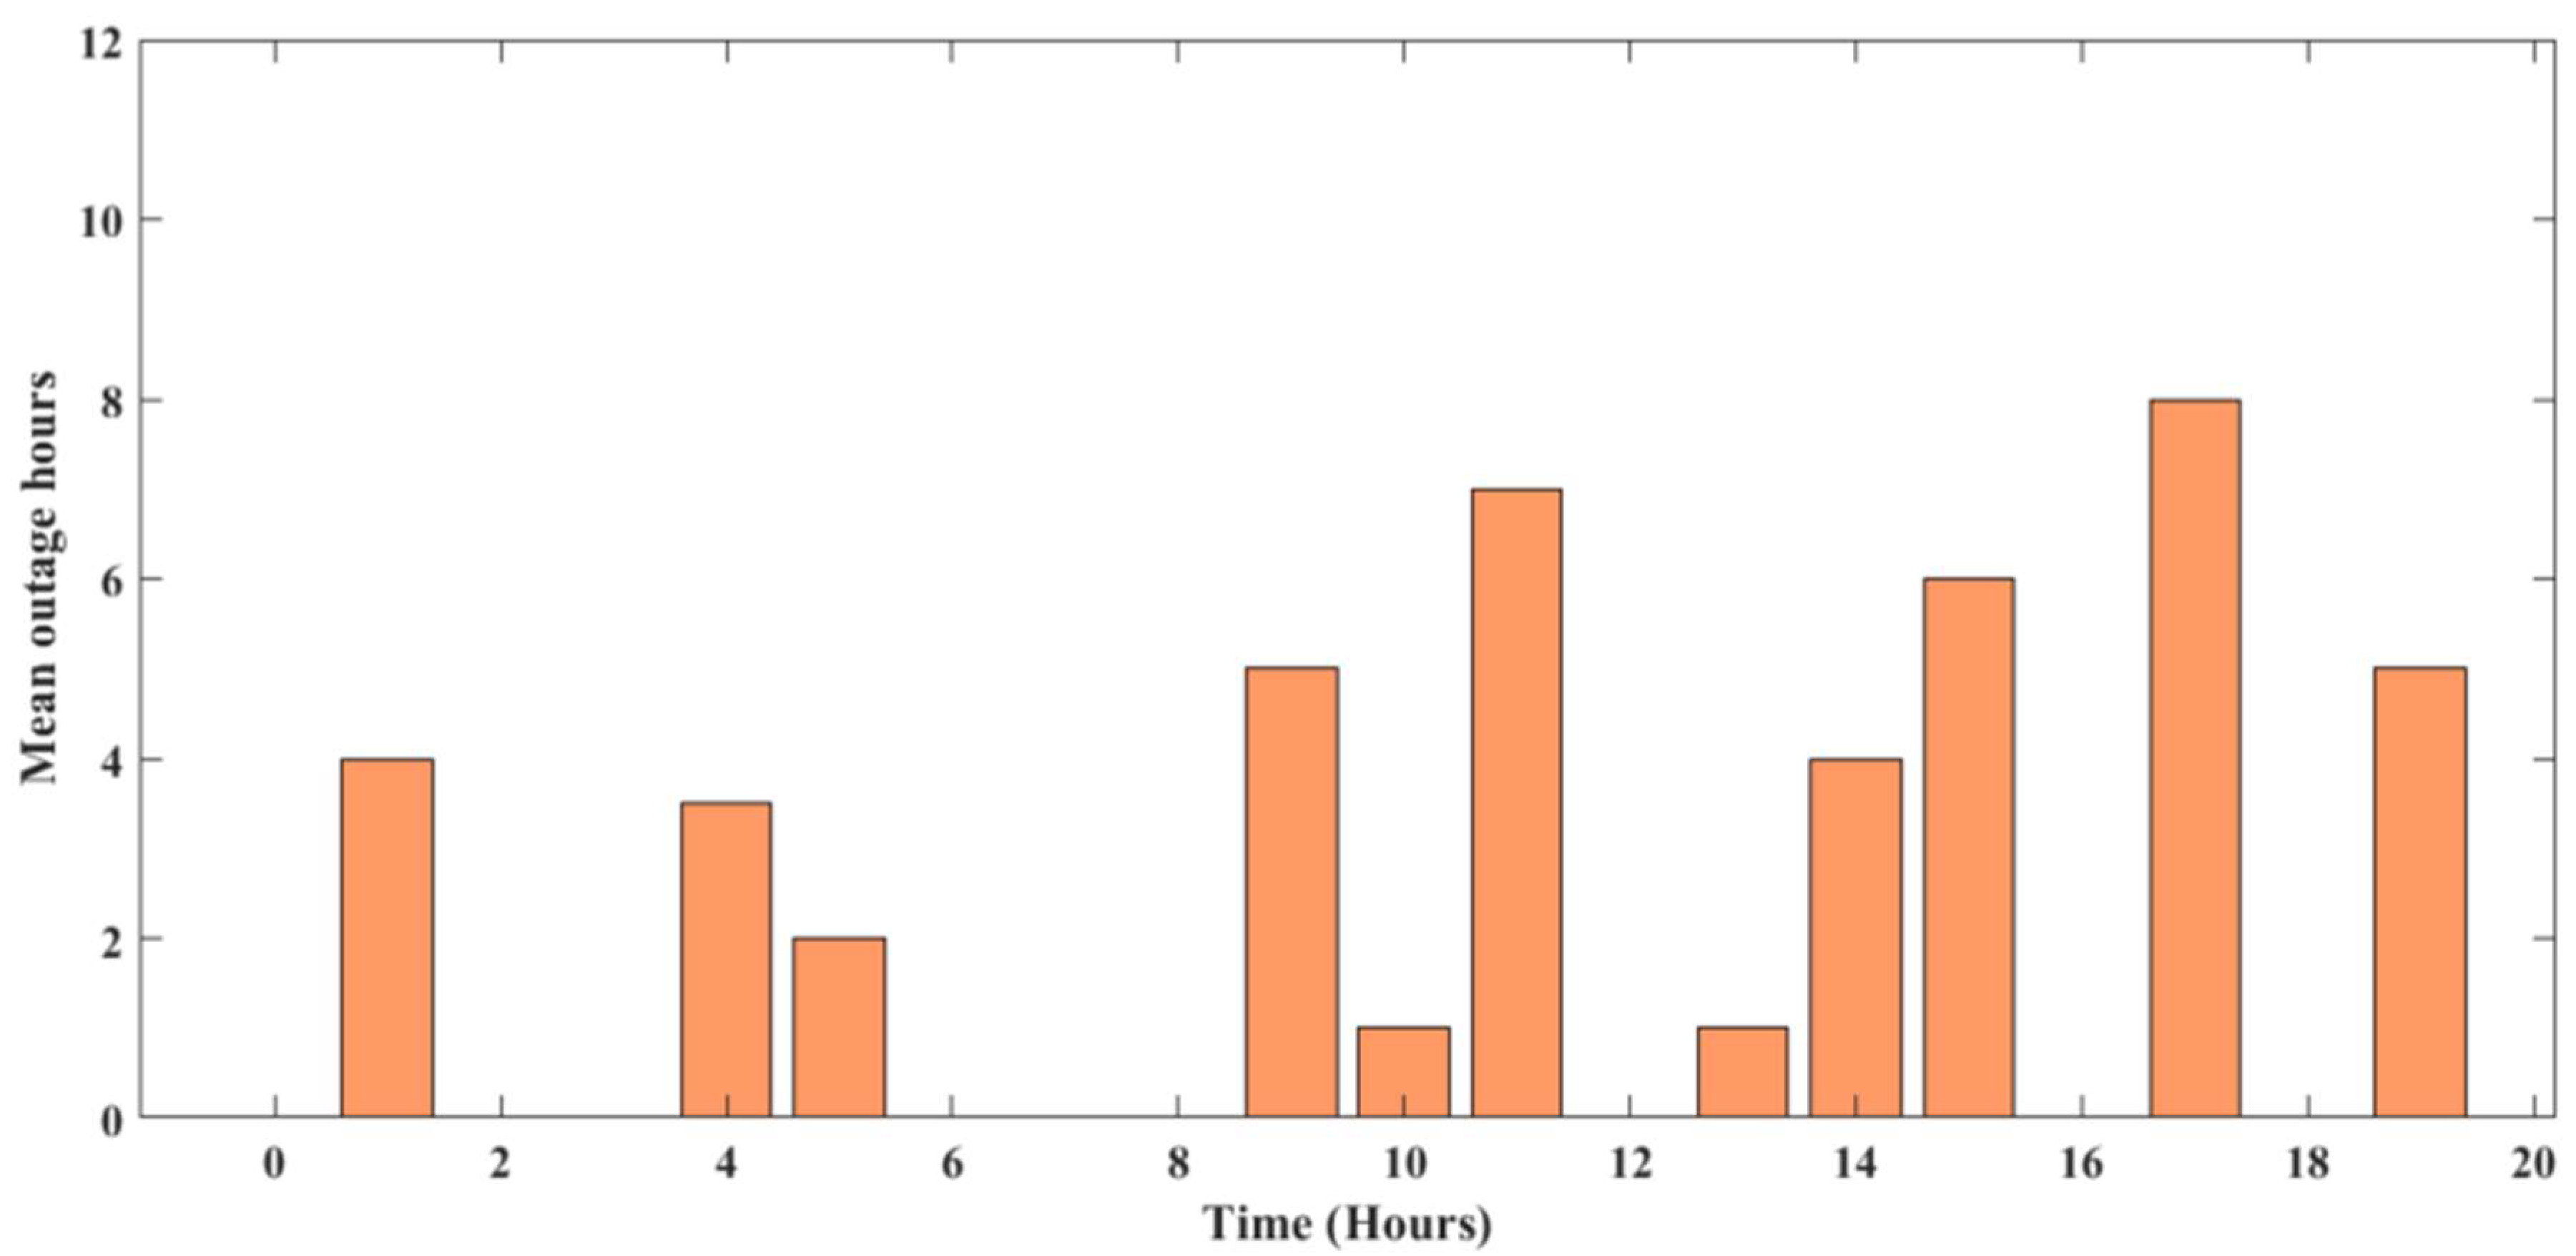
P(Outage). If the random number is less than or equal to P(Outage), an outage event is considered to have occurred in that scenario. Repeating this process for multiple random numbers to generate a set of outage scenarios in the lifetime of the microgrid, as shown in
Figure 6 and
Figure 7, respectively.
Similarly, Battery SoC prediction involves assessing the batteries' state of charge in different future scenarios.
Defining probability distributions for battery charging and discharging rates based on historical data for an existing system and battery characteristics. Let P(Charge) be the probability of the battery being charged, and P(Discharge) be the probability of the battery being discharged.
Generating random numbers to determine whether the battery will be charged or discharged in each outage scenario. Calculate the change in battery SoC for each scenario based on the outcome of the random numbers generated. This change can be calculated as,
Where,
Charge Rate is the rate of battery charging,
Discharge Rate is the rate of battery discharging and
Time Interval is the duration of the simulation time step.
Update the battery SoC based on the calculated ΔSoC for each scenario. The initial SoC for each scenario can be set based on historical data or the current state of the battery.
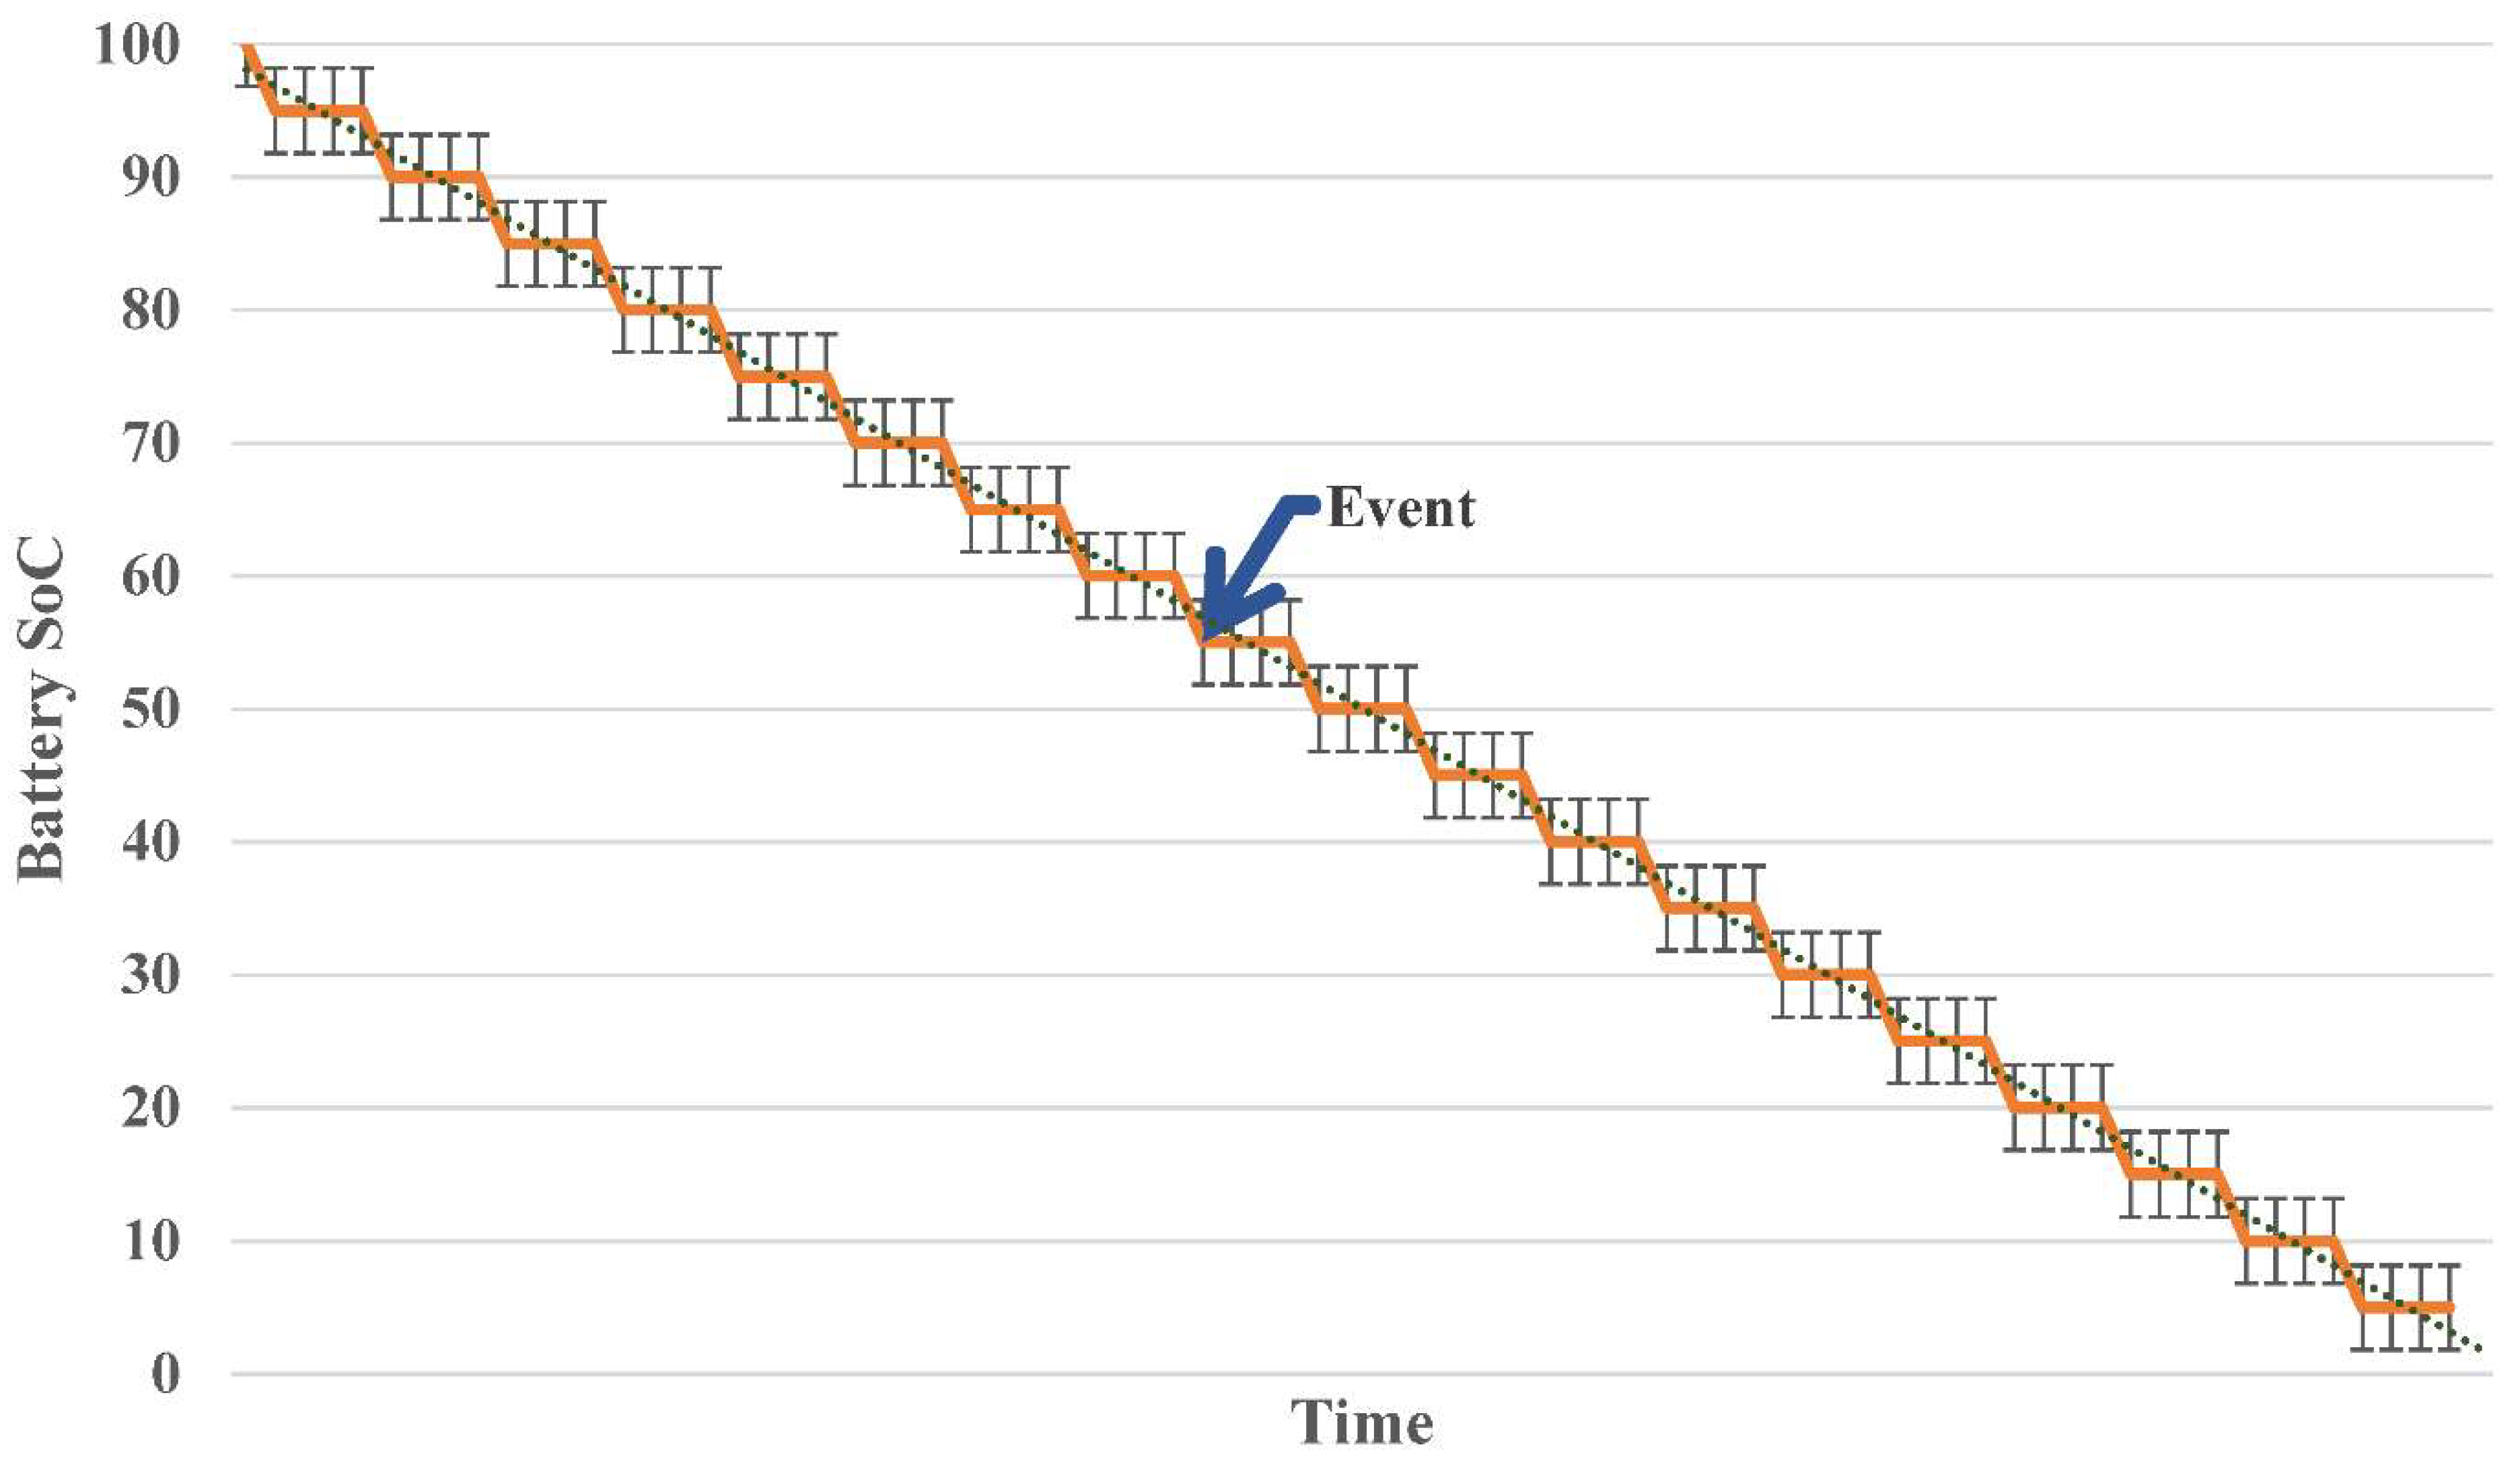
Figure 8 shows the discharging simulation using Monte Carlo, where 1C rated single-string battery has been considered.
By performing Monte Carlo simulations for both outage prediction and battery SoC prediction, it can generate a range of possible future scenarios considering uncertainties, providing valuable insights into the microgrid's resilience and battery performance.
5. Load and Solar Irradiance Forecasting
5.1. Long Short-Term Memory (LSTM)
Long Short-Term Memory (LSTM) networks, a type of recurrent neural network, were utilized to forecast solar irradiance and load profiles for a microgrid [
2,
3,
4]. Solar irradiance prediction is crucial for managing renewable energy sources effectively, while load forecasting aids in optimizing energy distribution. The LSTM model captures temporal dependencies in the data and improves the accuracy of predictions compared to traditional methods.
Figure 9 shows the standard LSTM block, LSTM gates, states, and time series data accumulation process [
54].
The LSTM equations below describe the forward propagation through the LSTM network. These equations calculate the values of the input, forget, cell, and output gates and the updated cell state and hidden state.

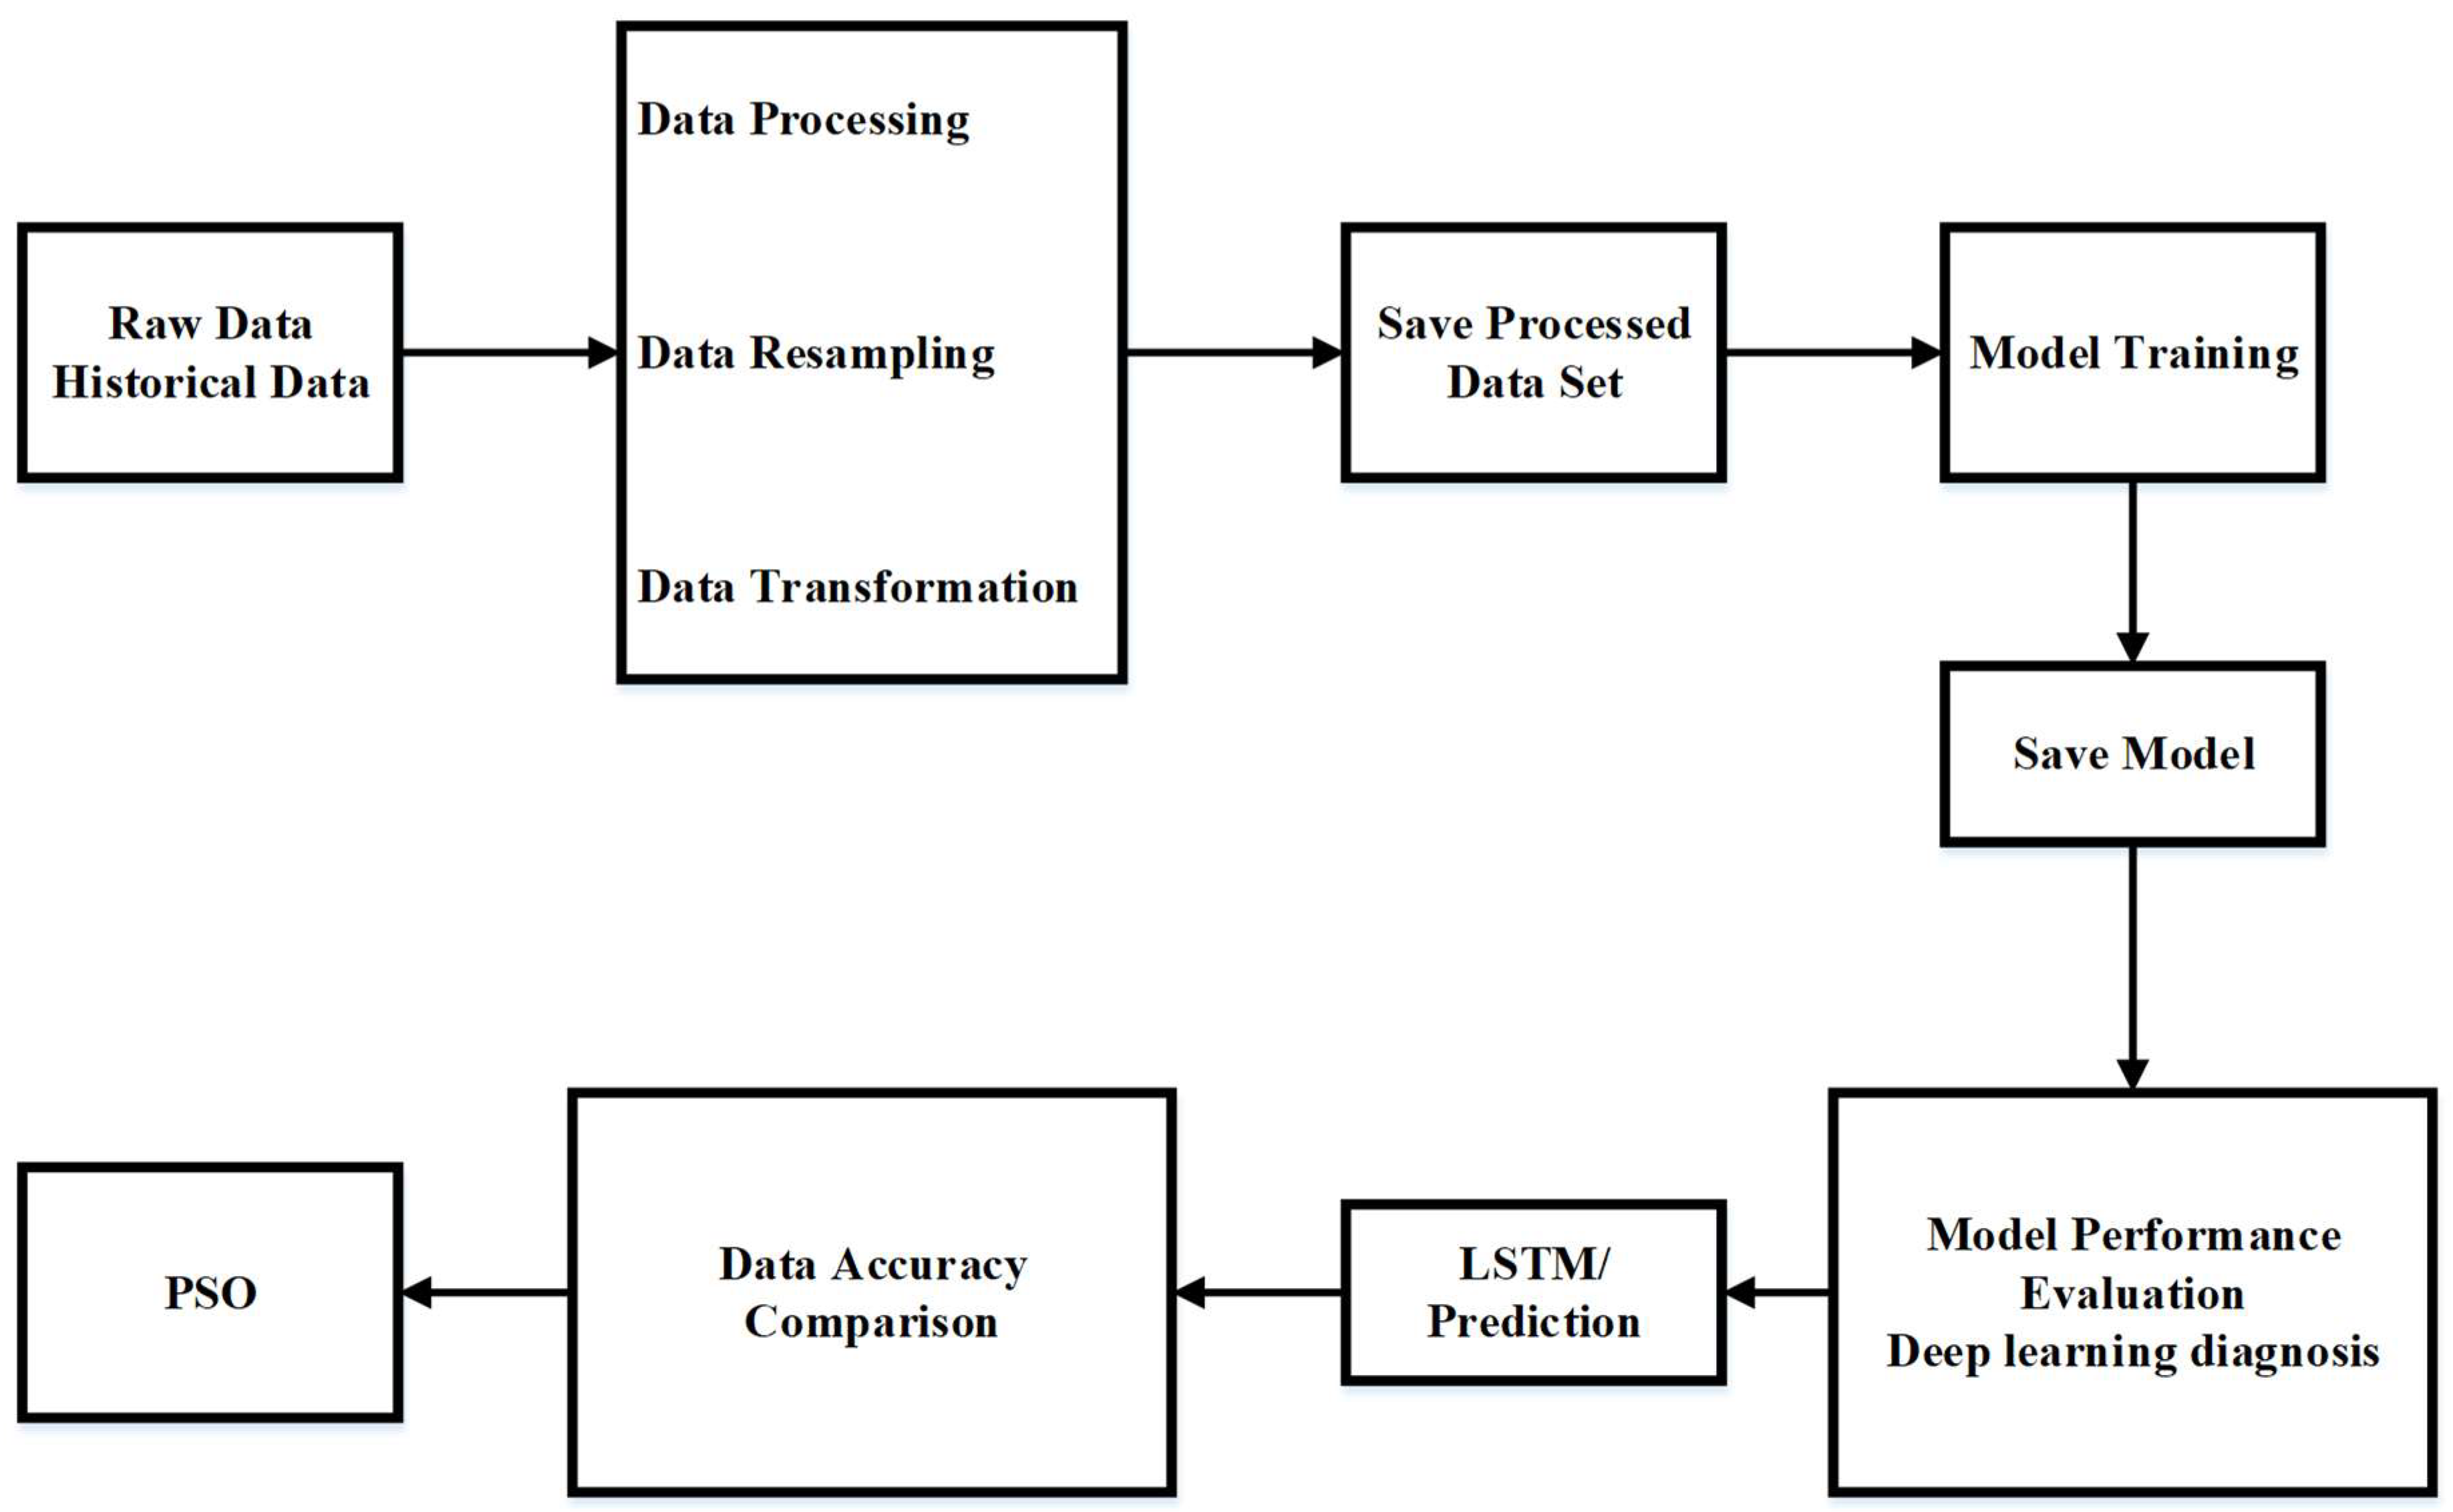
The forecasting process starts with the collection of raw historical data on solar irradiance and load profile, as shown in
Figure 10. The data is then accumulated and preprocessed before being stored in a local storage device. The next step is to train a machine learning model to learn the relationship between solar irradiance and load profile. The parameters of the trained model can then be modified to improve its accuracy. The trained model is then used to forecast solar irradiance and load profile for a future time period. The forecasted data is then compared with the actual data to assess the accuracy of the forecast. An accuracy improvement algorithm can then be used to improve the accuracy of the forecast. The final step is to obtain the results of the PSO algorithm.
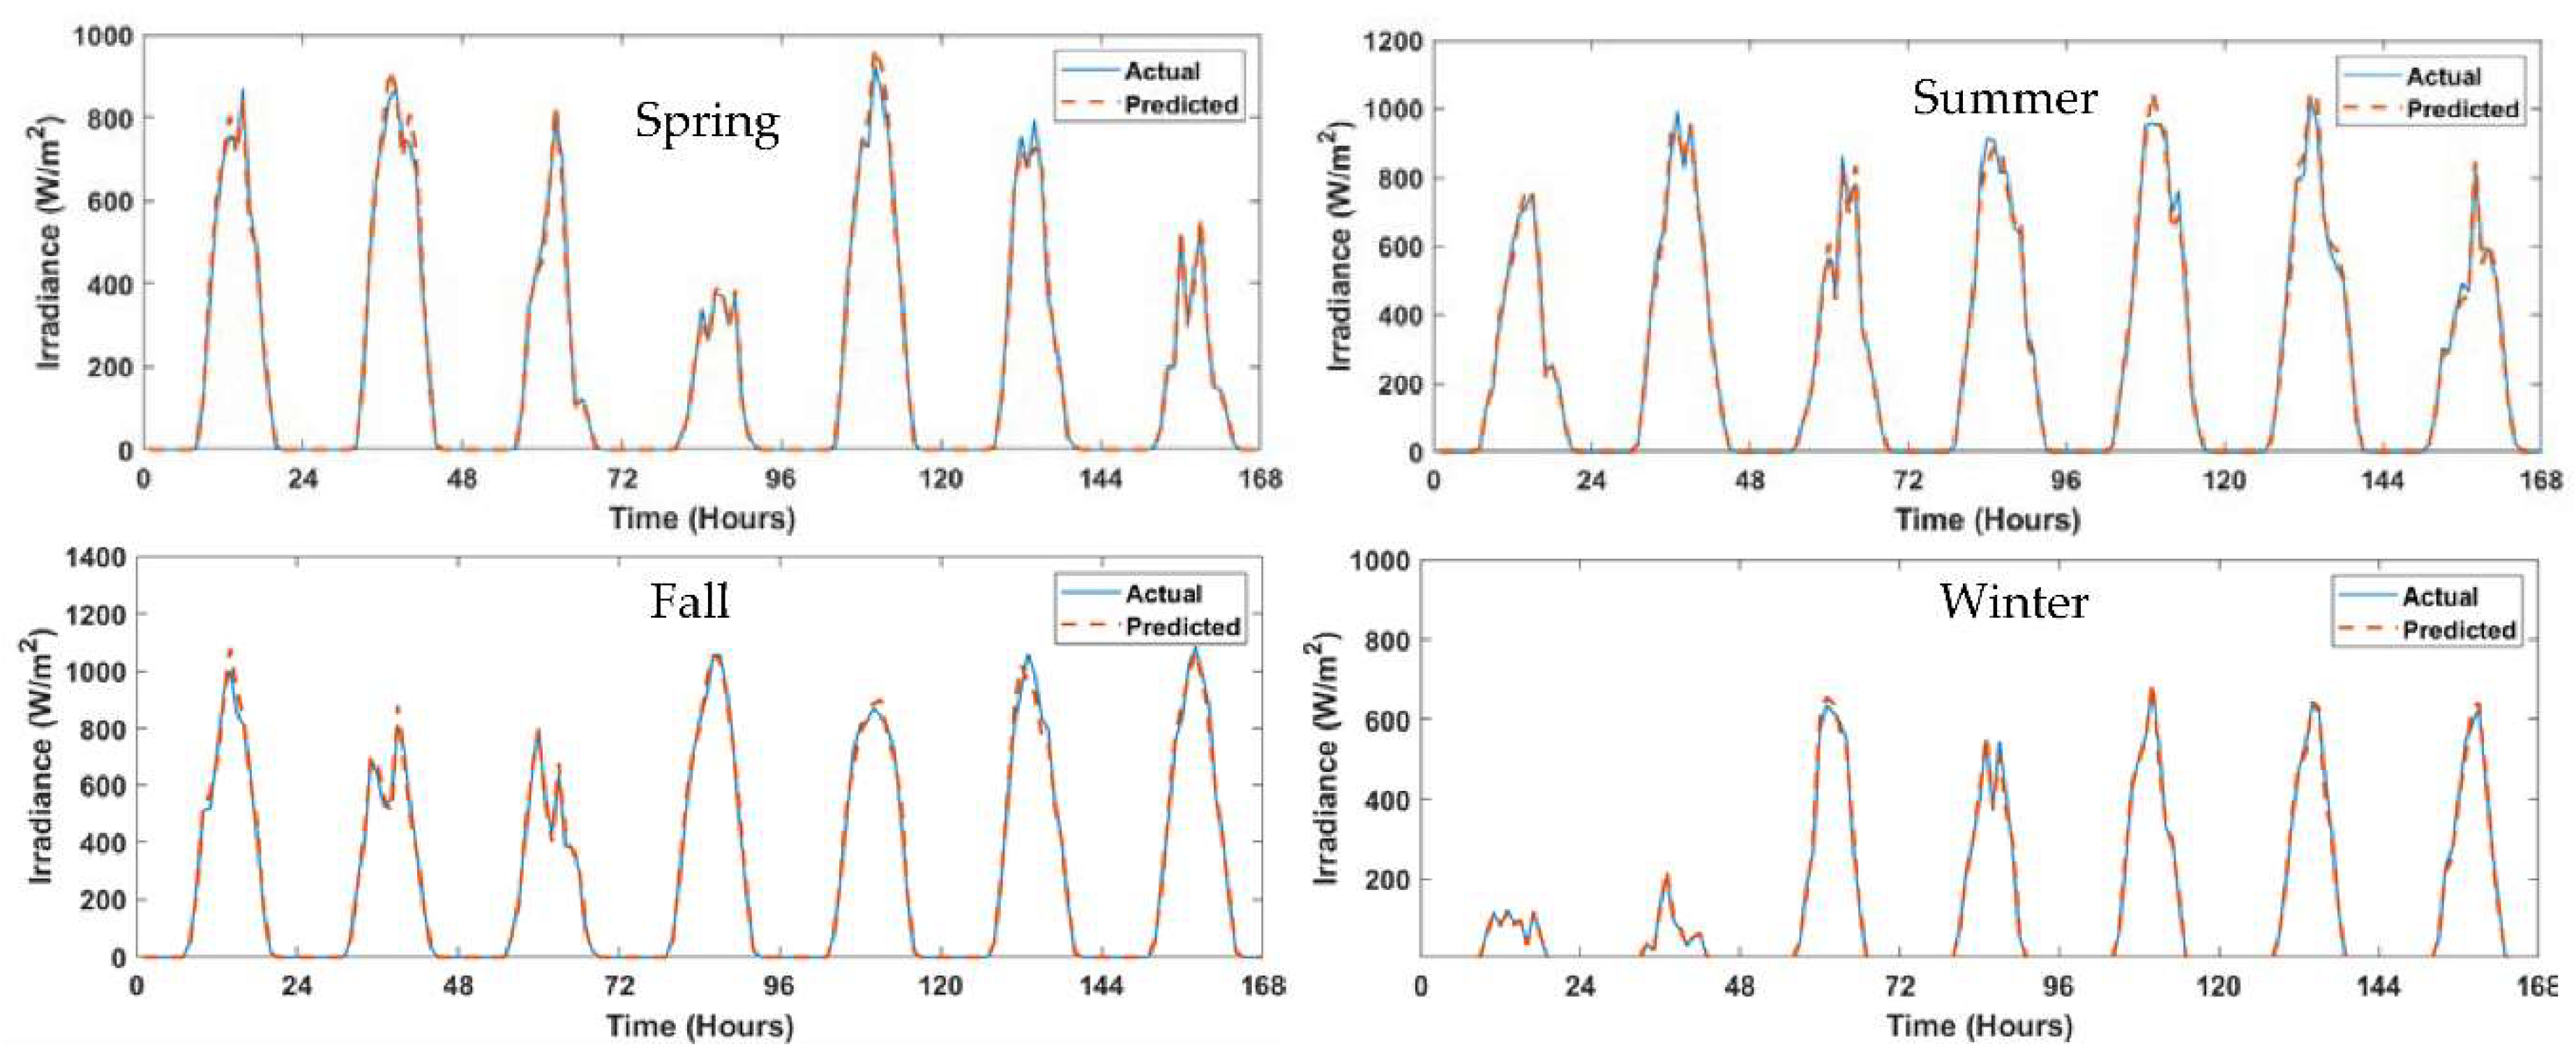
Figure 11 shows the comparisons of forecasted solar irradiance with real-time obtained solar irradiance.
The solar irradiance forecasting outcomes for Lubbock, Texas, utilizing a Long Short-Term Memory (LSTM) model and leveraging hourly historical data spanning from 2009 to 2018, offer a comprehensive insight into the model's capability to predict solar irradiance patterns across diverse seasons. The analysis covers a week's average profiles for each of the four seasons: spring, summer, fall, and winter, highlighting the accuracy of the LSTM model's predictions, which achieved an impressive 92% accuracy rate when compared to the actual observed profiles.
Starting with the spring season, characterized by transitioning weather conditions and increasing sunlight hours, the LSTM model demonstrates its proficiency by accurately forecasting an average daily solar irradiance of 927 . This prediction aligns closely with the actual solar irradiance profile for the week, confirming the model's capacity to capture the evolving solar dynamics during this season.
Moving into the high-sunlight months of summer, the model maintains its precision, projecting an average daily solar irradiance of 981 . This prediction mirrors the observed increase in solar radiation during this time, highlighting the model's adeptness in anticipating intensified solar irradiance, which is crucial for optimizing energy generation and distribution strategies.
Transitioning to fall, as solar irradiance begins to taper off, the LSTM model maintains its accuracy by forecasting an average daily solar irradiance of 857 . This prediction accurately mirrors the observed trends as the season progresses, underscoring the model's adaptability to the changing solar dynamics and ensuring reliable forecasts throughout different conditions.
In the winter season, characterized by reduced daylight hours and lower sun angles, the LSTM model delivers accurate forecasts. It projects an average daily solar irradiance of 401
, effectively capturing the diminished solar radiation characteristic of this season. The alignment between forecasted and observed profiles showcases the model's robustness in navigating even challenging conditions. The consistent % accuracy rate of 82% across all seasons reinforces the LSTM model's potential as a dependable tool for solar irradiance forecasting. This precision contributes significantly to the microgrid's ability to optimize energy production, storage, and distribution strategies. By enabling informed decision-making and enhancing energy management, the LSTM model serves as a key enabler for resilient, cost-effective, and sustainable microgrid operations, particularly in regions with dynamic solar irradiance patterns like Lubbock, TX.
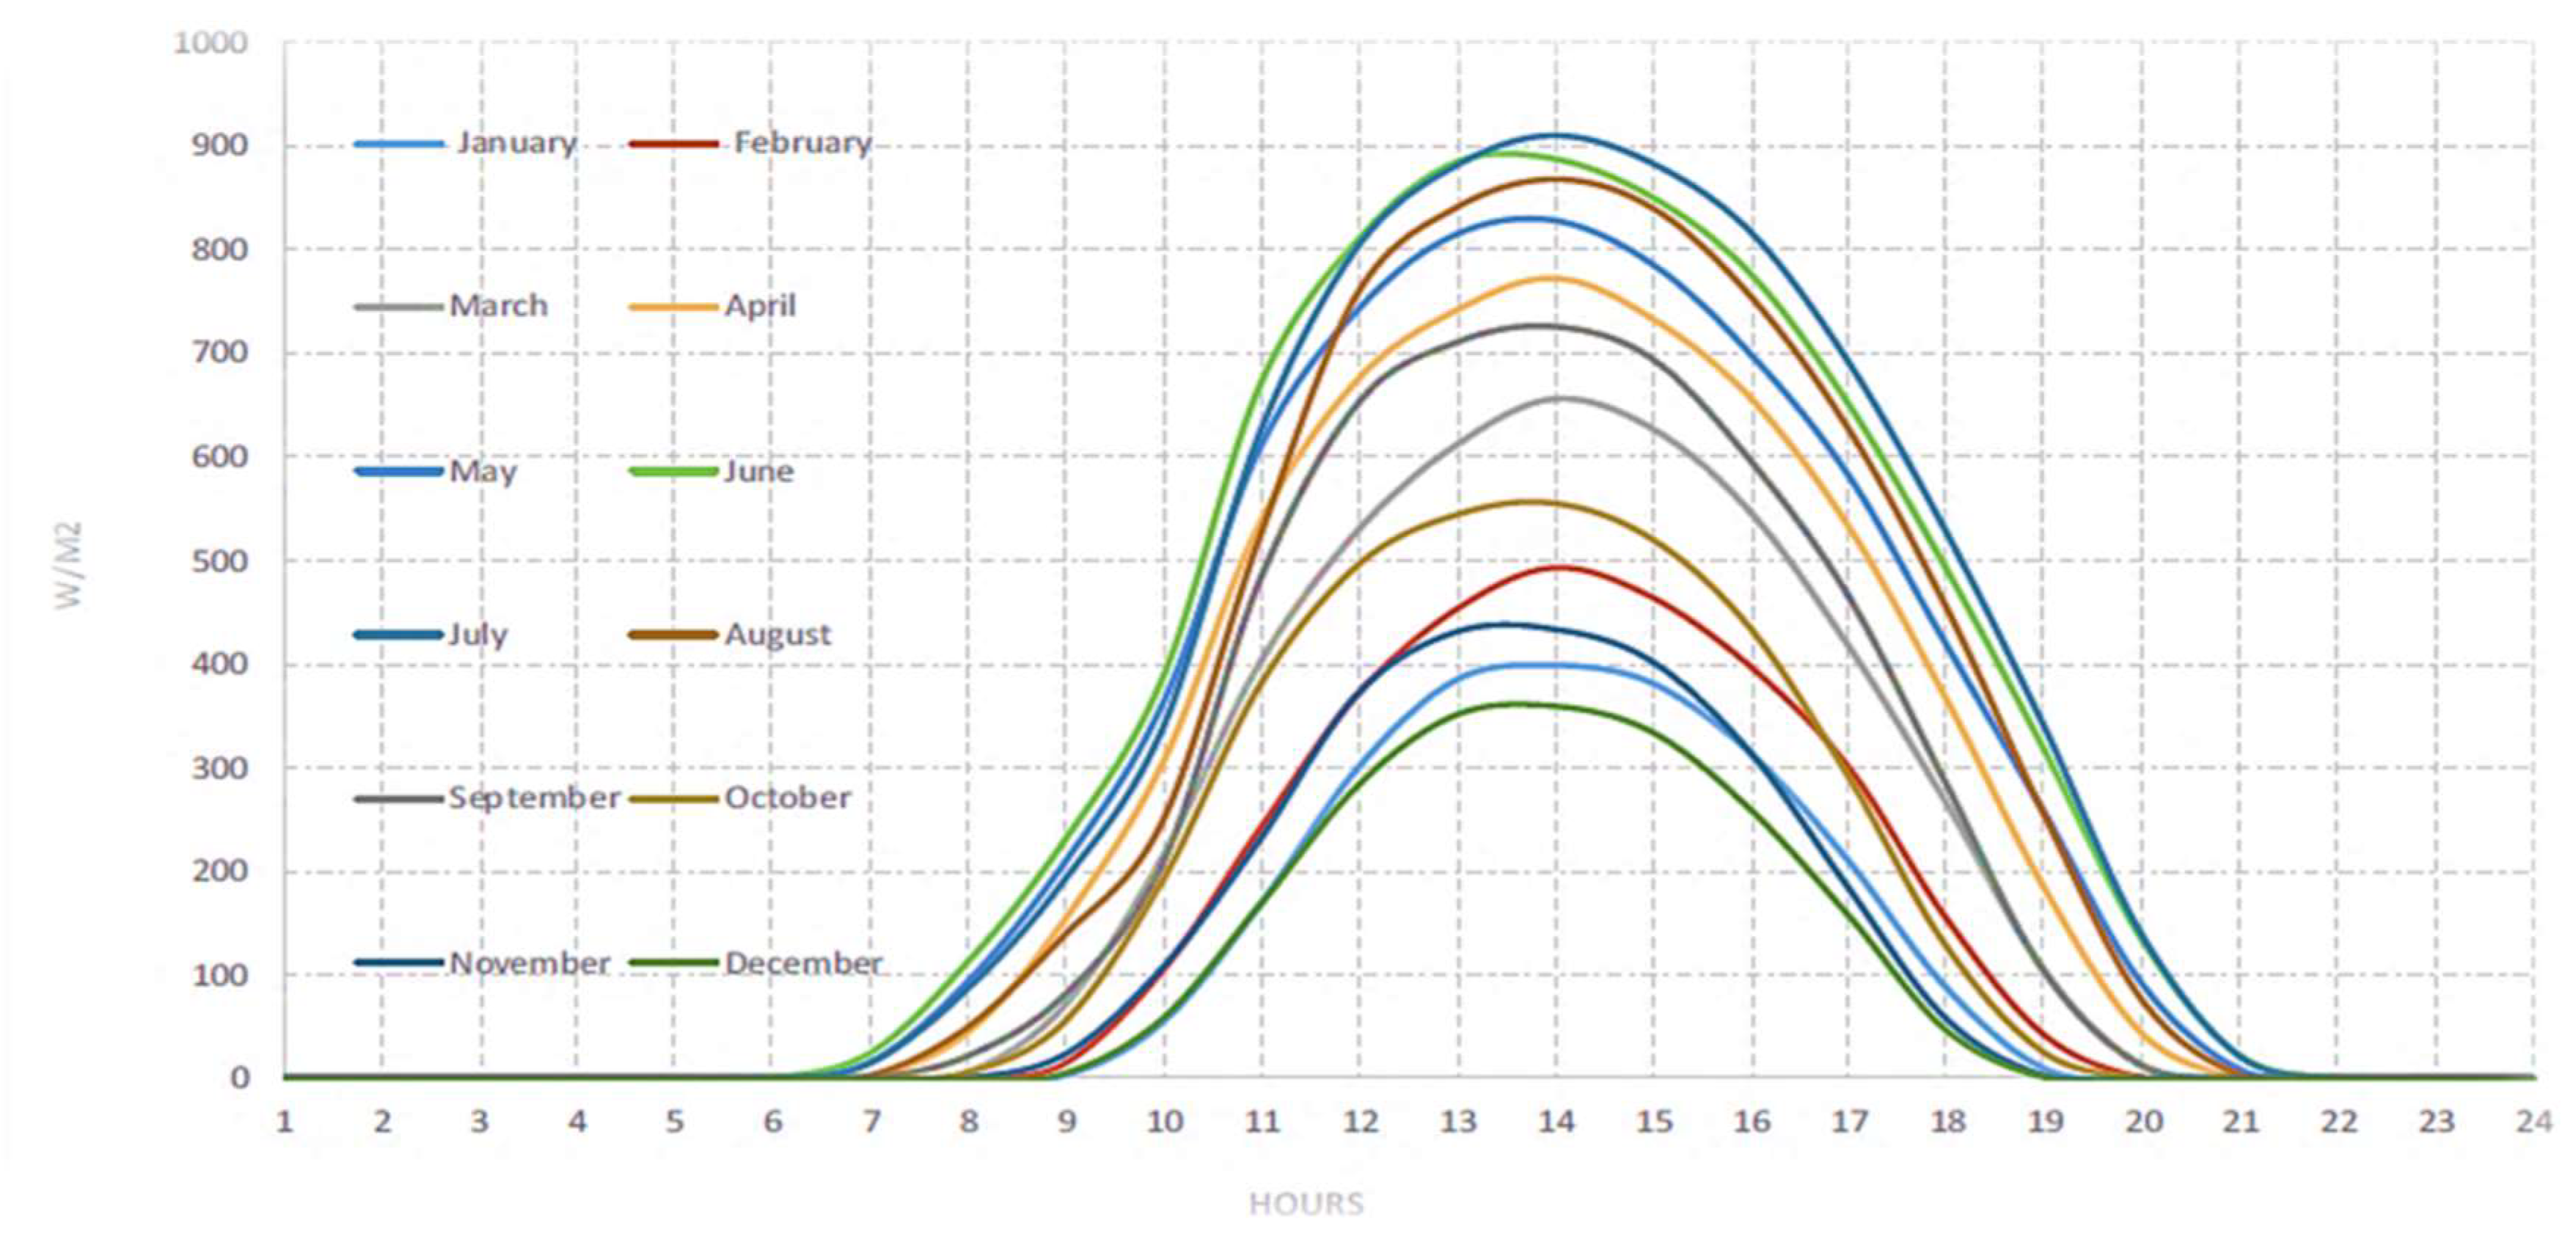
Figure 12 shows the forecasted daily average of solar irradiance for every month.
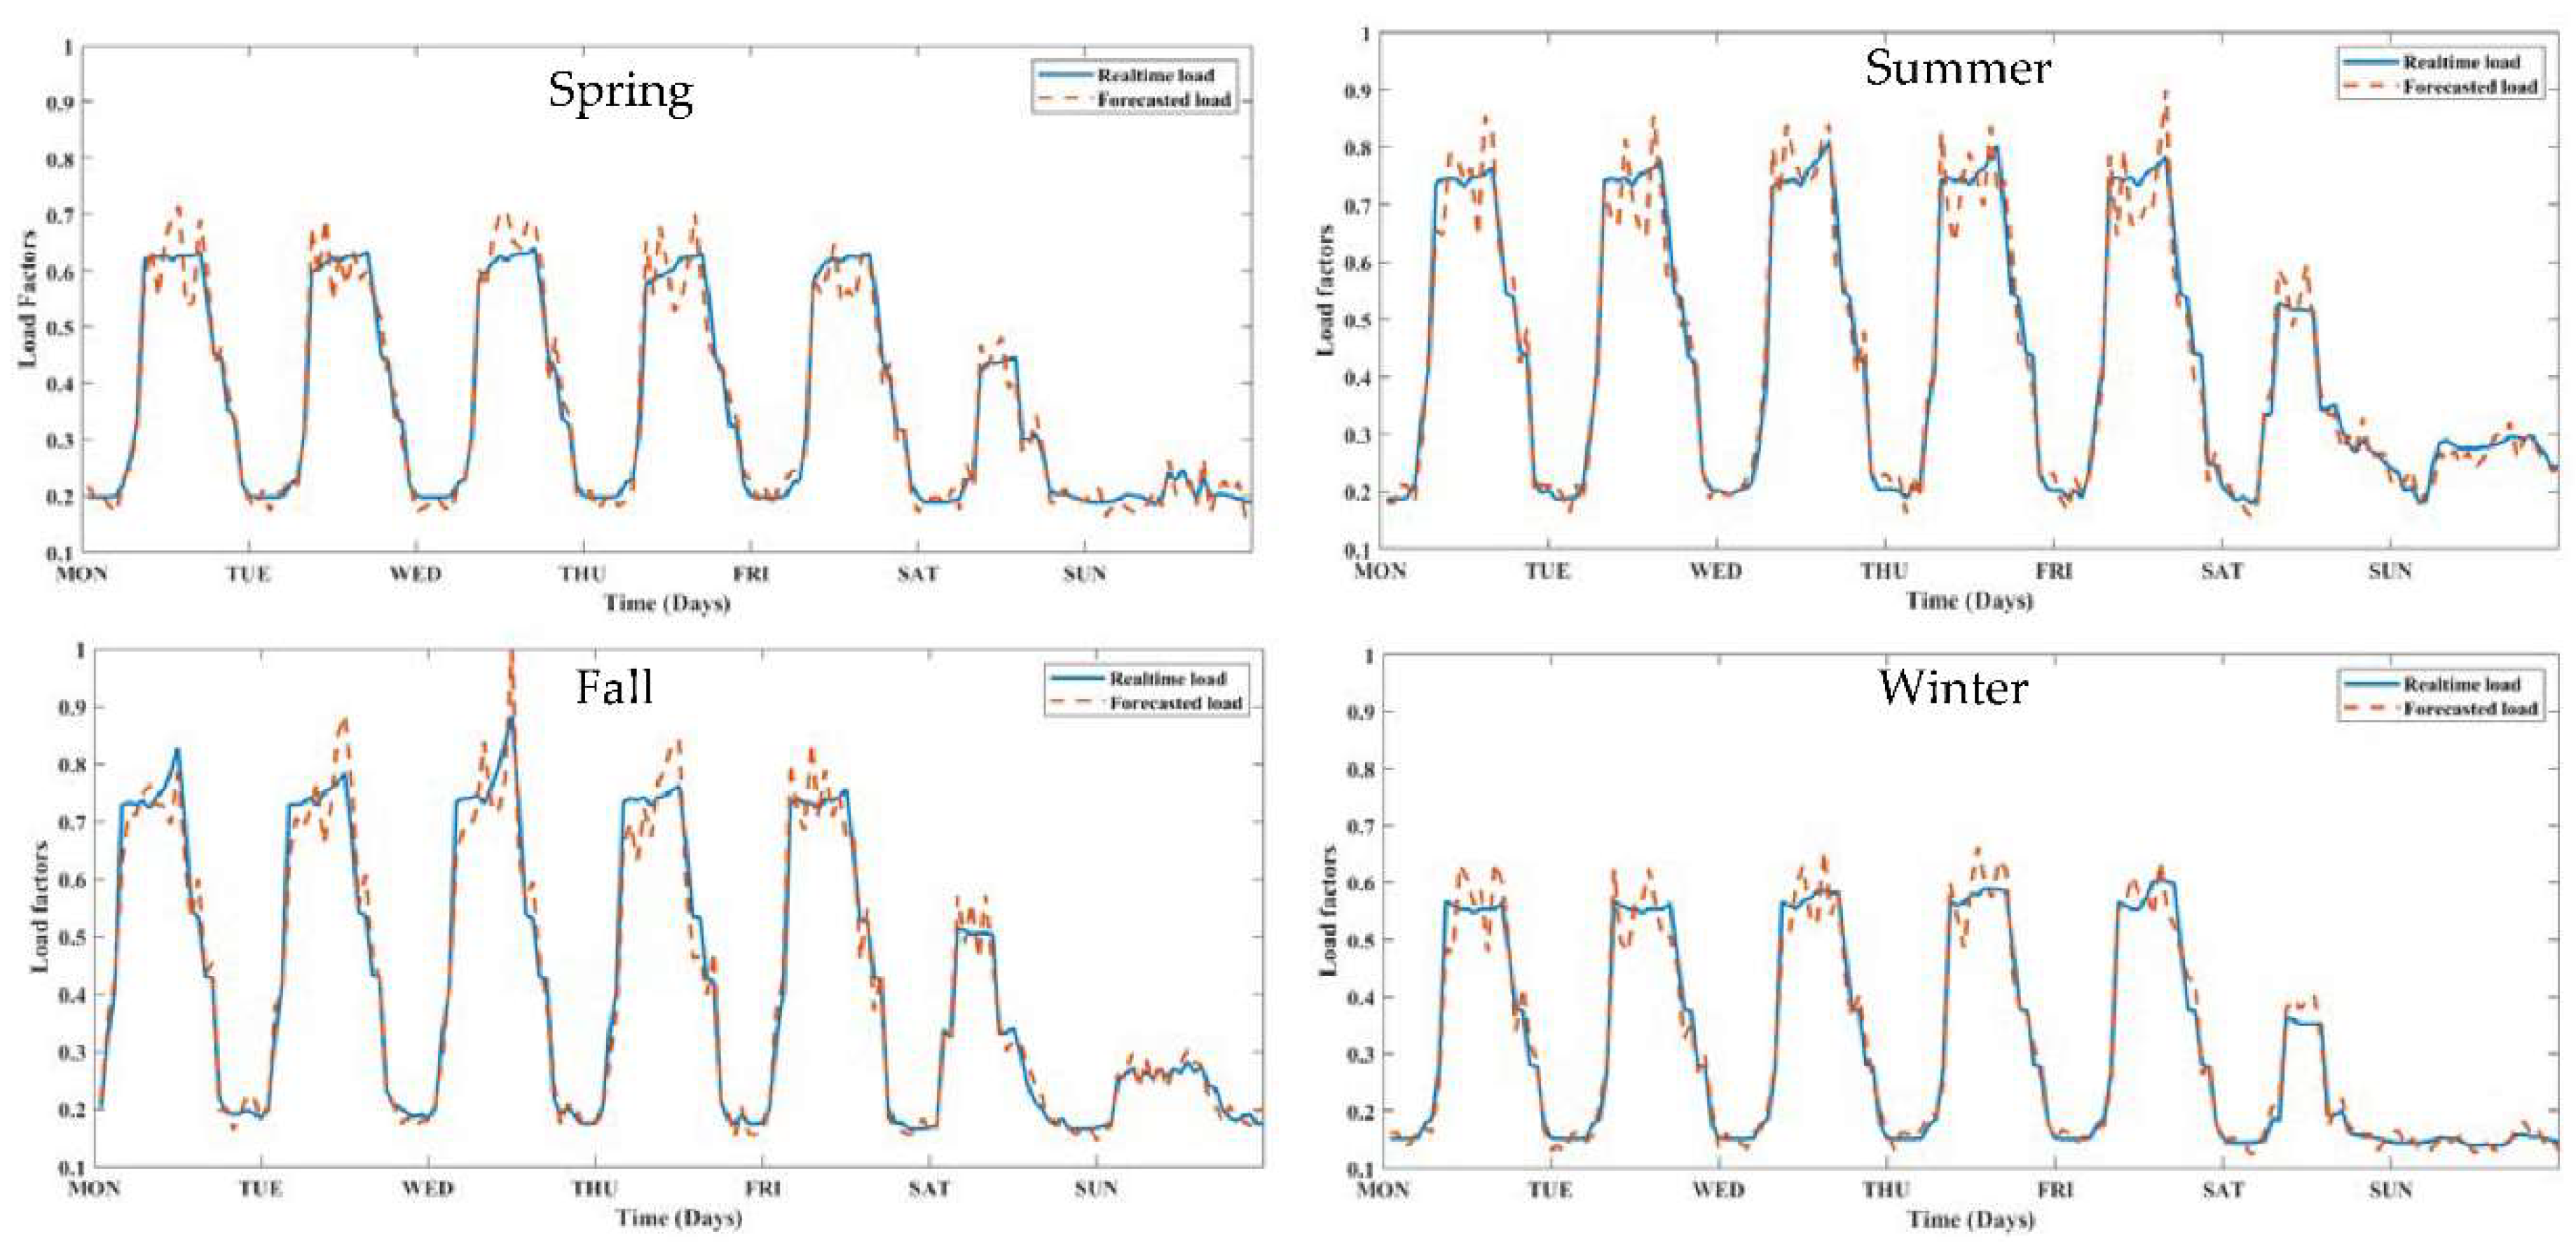
The load profile forecasting results, utilizing an LSTM model trained on hourly historical load data from 2009-2018 and represented in a factorized form, provide a comprehensive understanding of the model's performance across distinct seasons. A week's average load profiles for each season, spring, summer, fall, and winter, offer insights into the LSTM model's accuracy and its ability to anticipate load variations over time.
Figure 13.
One week of forecasted load profiles from each season.
Figure 13.
One week of forecasted load profiles from each season.
In the spring season, marked by changing weather conditions and varying energy demands, the LSTM model showcases its effectiveness by accurately predicting the factorized load profile. When multiplied by the total building demand, this factorized representation yields the load curve. The average daily load profile for the week aligns closely with the actual observed load profile, reflecting the model's capability to capture the evolving energy consumption patterns. The model's accuracy of 81% reinforces its reliability in forecasting load profiles during this transitional season.
As summer arrives with increased energy usage due to cooling demands, the LSTM model continues to demonstrate its precision. The factorized load profile, transformed into the load curve, accurately captures the amplified energy consumption during peak hours. The average daily load profile for the week mirrors the observed load pattern, emphasizing the model's competence in predicting the rising electricity demands of the season. The model's 81% accuracy substantiates its ability to forecast load profiles in this high-demand period.
As temperatures moderate and energy consumption shifts in the fall season, the LSTM model remains reliable in load forecasting. When scaled by the total building demand, the factorized load profile represents the load curve effectively. The average daily load profile for the week closely mirrors the actual consumption pattern, underlining the model's proficiency in capturing the transitioning energy demands. With an accuracy rate of 81%, the model consistently provides valuable insights into load fluctuations during this season.
During the winter season, characterized by heating-related electricity usage, the LSTM model maintains its accuracy in load forecasting. When transformed into the load curve, the factorized load profile accurately captures the increased energy demand during cold periods. The average daily load profile for the week closely tracks the actual observed load, underscoring the model's aptitude in anticipating energy consumption shifts. With an accuracy of 81%, the model ensures reliable predictions of load profiles even during challenging conditions.
The consistent accuracy rate of 81% across all seasons highlights the LSTM model's efficacy in forecasting load profiles. By understanding and anticipating load variations, the model effectively empowers microgrid operators to optimize energy distribution, storage, and management strategies. In scenarios where factorized representations are used, the model's precision in capturing the load curve enables informed decision-making and contributes to resilient, cost-efficient, and sustainable microgrid operations.
5.2. Modified particle swarm optimization (PSO)
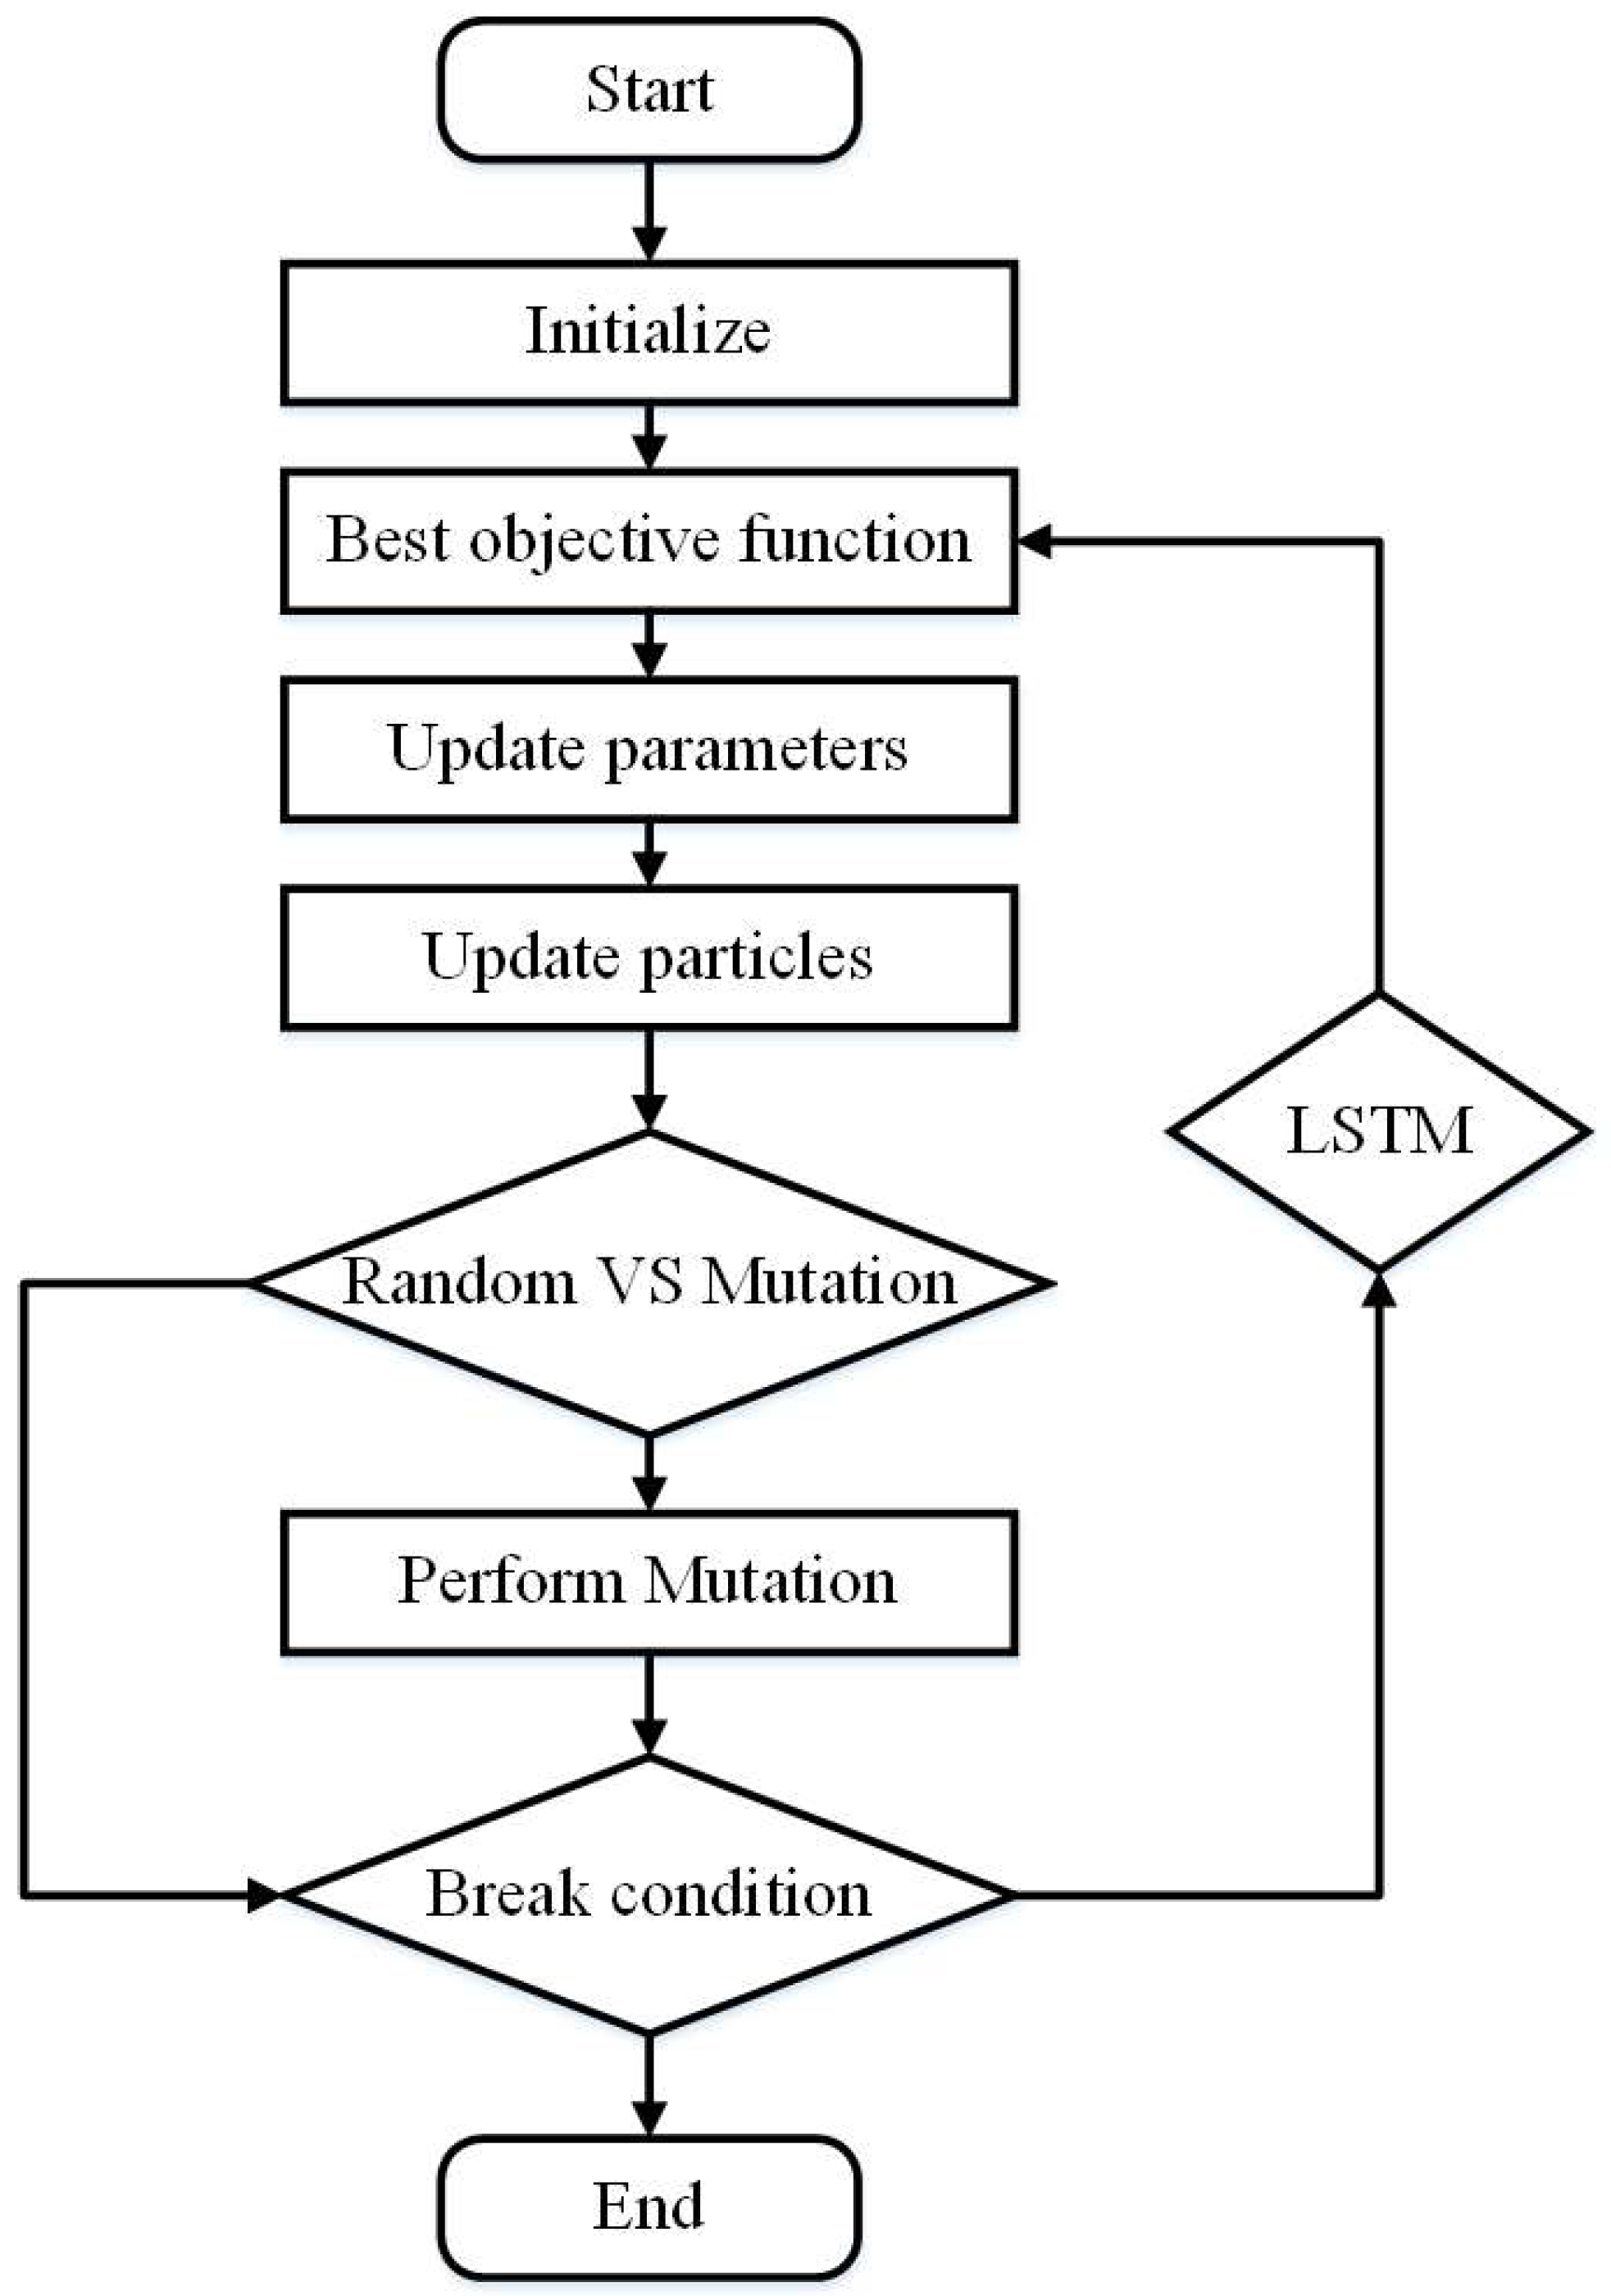
The modified PSO algorithm works by initializing a swarm of particles in a search space. Each particle has a position and velocity. The velocity of a particle is updated at each iteration based on its own best position, the global best position, and a random number. The position of a particle is updated based on its velocity. The algorithm continues to iterate until a stopping criterion is met.
Figure 14 shows the modified PSO-LSTM process.
The process starts with the initialization of the data. This includes the historical data on the variable being predicted, as well as any other relevant data. The data is then divided into two sets: a training set and a test set. The training set is used to train the LSTM model, and the test set is used to evaluate the accuracy of the model. The next step is to evaluate the optimum LSTM-driven objective function. The objective function is a mathematical expression that measures the accuracy of the LSTM model. The objective function is evaluated using the training set. The Pbest and gbest for resilience and economic solution are then updated. The Pbest is the best position that a particle has achieved so far, and the gbest is the best position that any particle has achieved so far. The Pbest and gbest are updated using the objective function. The velocity and position of each particle are then updated. The velocity is a vector that determines how much a particle will move in the next iteration, and the position is the particle's current location. The velocity and position are updated using the Pbest, gbest, and random variables.
where,
-
p is the particle’s position
-
v is the path direction
-
c1 is the weight of local information obtained from LSTM
-
c2 is the weight of global information
-
pBest is the best position of the particle
-
gBest is the best position of the swarm
-
rnd is the random variable
Random variables are generated and compared with the mutation probability. A mutation is performed if the random variables are less than or equal to the mutation probability. Otherwise, the mutation is not performed. If the mutation probability is satisfied, a mutation is performed. A mutation is a change to the particle's position or velocity. The mutation is performed using the random variables. If the mutation result is not feasible, the initialization step with the LSTM model is restarted. A feasible result is a result that satisfies the constraints of the problem. The problem's constraints may include the range of values the variable can take on. If the mutation result is feasible, the result is obtained. The result is the position of the particle that has the best objective function value. The flowchart continues to iterate until a stopping criterion is met. The stopping criterion may be a maximum number of iterations, a minimum error tolerance, or a combination of both.
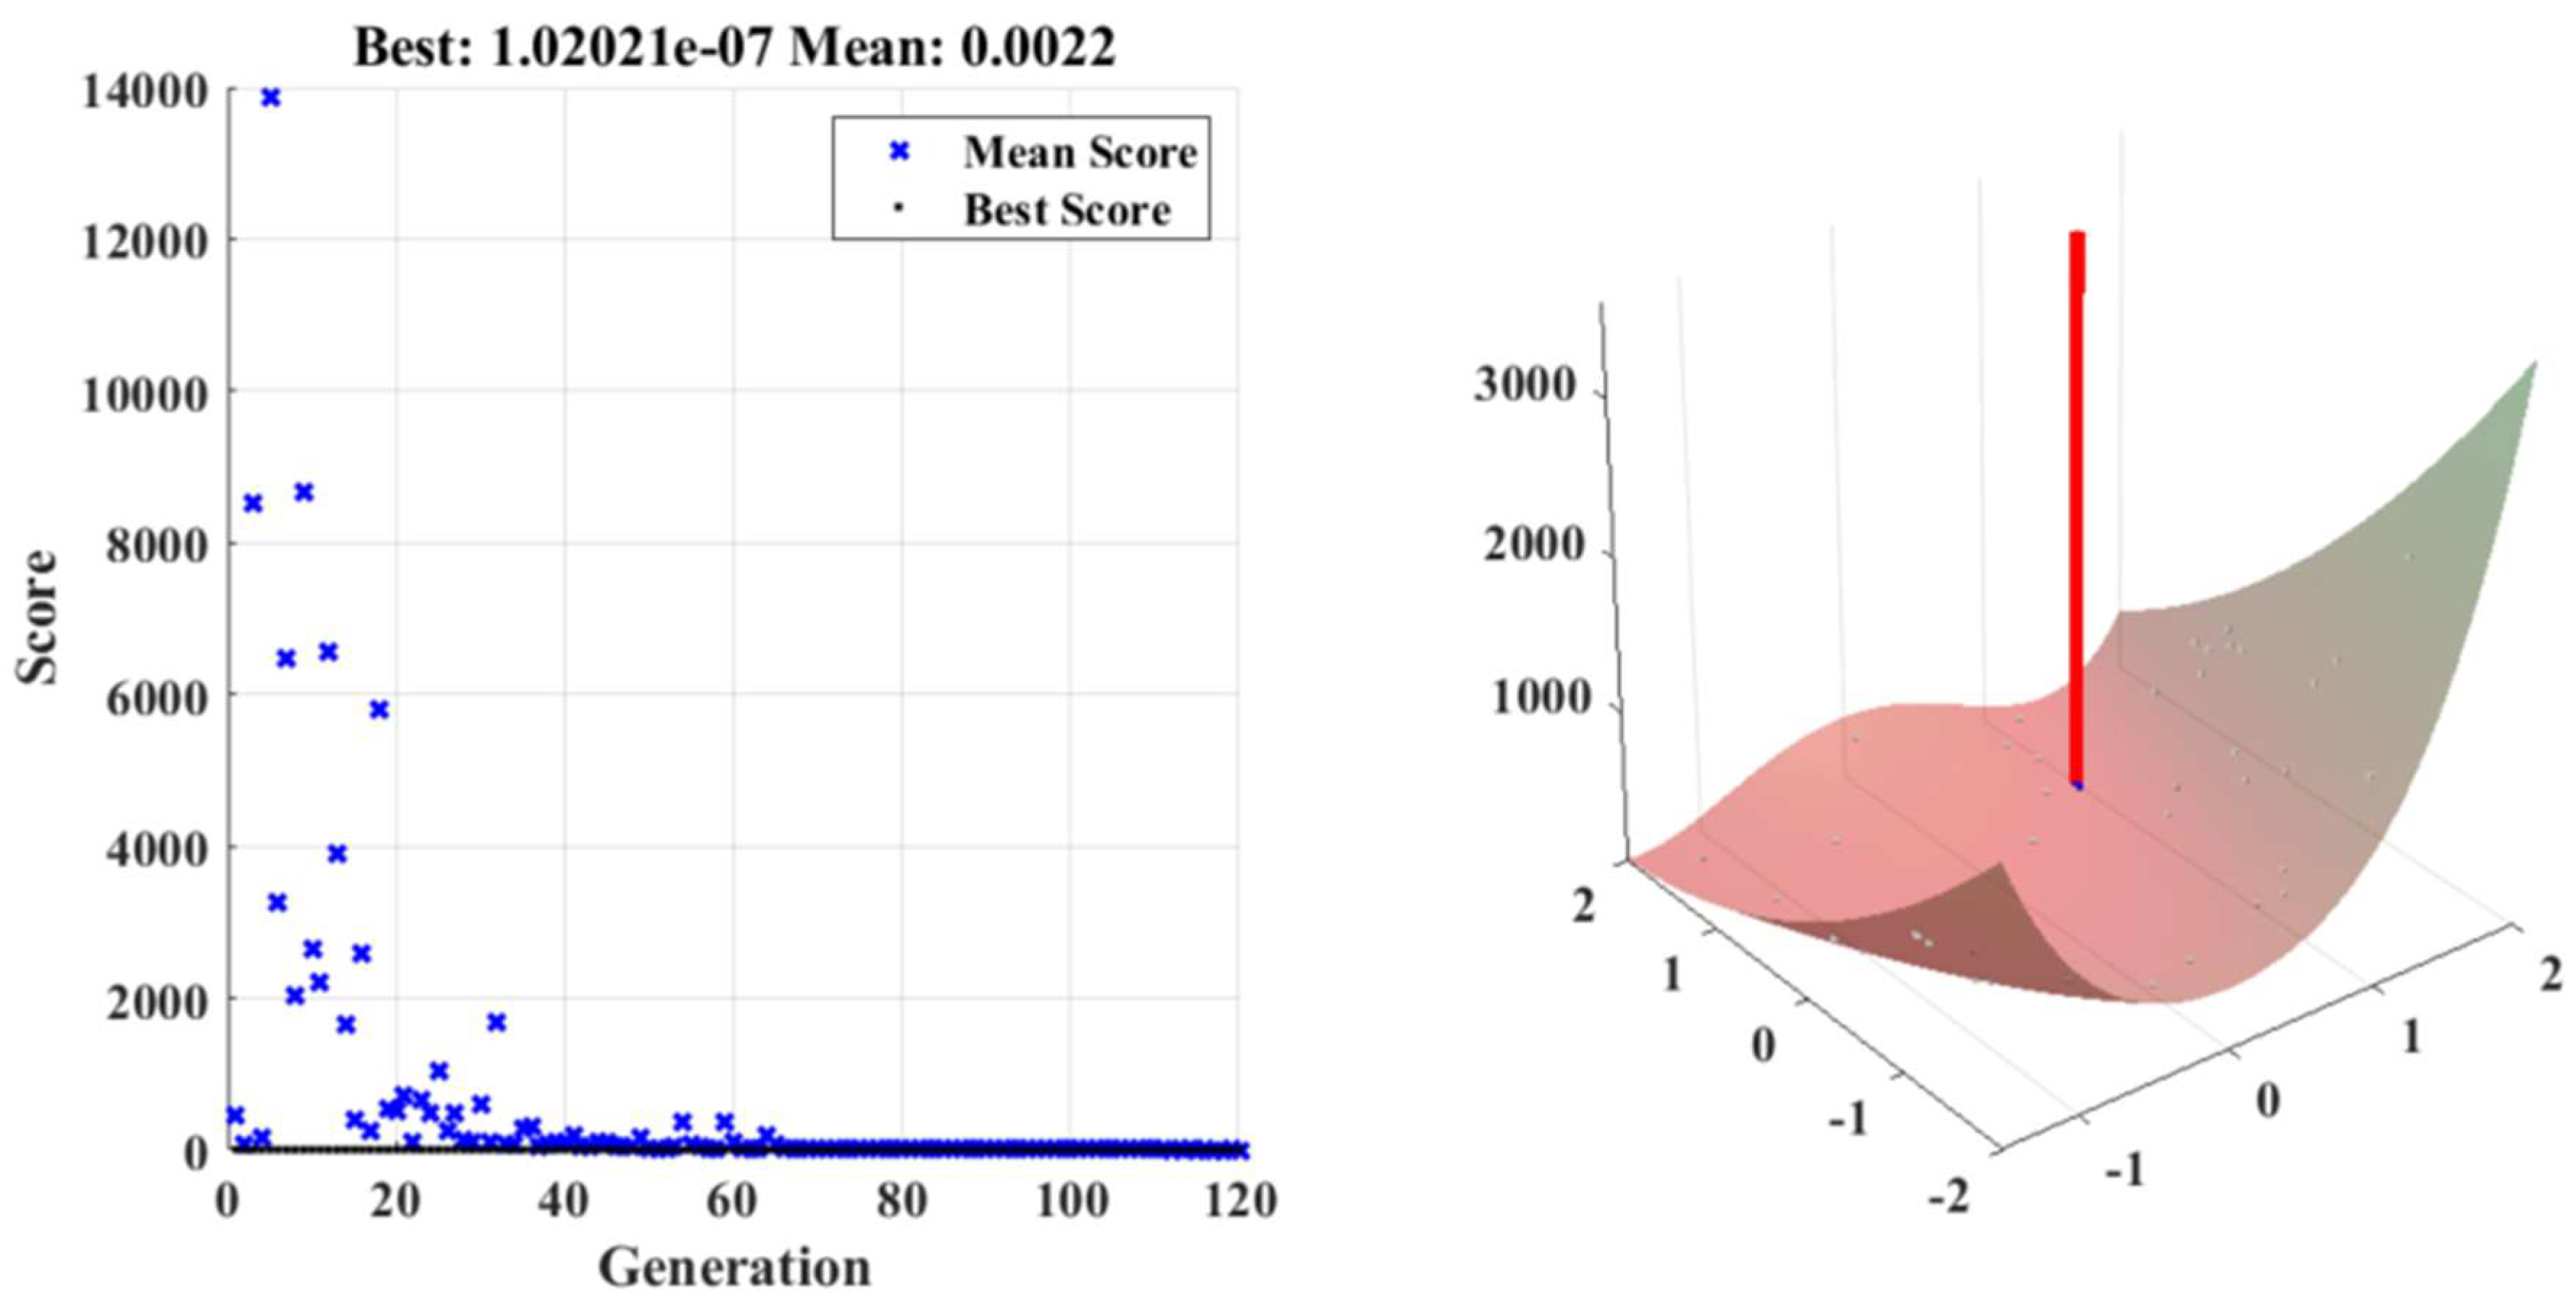
Figure 15 shows the hyperparameter convergence of the system.
The figures illustrating the modified PSO-LSTM algorithm's application in determining the optimal sizing of battery and solar PV components provide a visual insight into the convergence and effectiveness of the optimization process. These figures highlight the algorithm's ability to efficiently explore the solution space and identify the configurations that yield the best performance. The figure depicts the score plotted against the generation number. The scores represent the fitness of individual solutions evaluated during the optimization process. The fitness score measures the quality of a given solution, with lower values indicating better solutions. In this plot, the mean score over generations hovers around 0.0022, signifying that the algorithm consistently improves the solutions it explores. The algorithm's ability to maintain a consistently low mean score is indicative of its efficiency in searching for optimal configurations. The figure showcases the best score achieved across generations. It illustrates the progressive improvement of solutions as the algorithm iteratively refines its search. The graph demonstrates that the best score achieved is 1.02021, indicating the top-performing solution identified by the algorithm. This representation underscores the algorithm's capacity to identify highly competitive configurations within the solution space.
The 3D representation illustrates the convergence of the algorithms over the course of generations. As generations progress, the algorithm converges towards a solution with a significantly improved score. The decreasing trend in scores indicates the algorithm's ability to fine-tune solutions iteratively, reaching a point where the algorithm's search becomes focused and refined. This convergence pattern reflects the algorithm's efficacy in systematically exploring the solution space and narrowing down on optimal sizing configurations.
6. Result Analysis
The sizes of the photovoltaic (PV) system and battery, determined through the modified PSO-LSTM algorithm, were subjected to a comprehensive evaluation by comparing them with the economic and emission benefits obtained from two industry-standard tools: HOMER Pro version 3.14.7524 and REopt. This evaluation aims to validate the effectiveness of the algorithm in generating optimal sizing solutions that align with established commercial software results and further highlight the potential advantages of the proposed approach.
Comparing the sizing results with those obtained from HOMER Pro and REopt, we assess the economic viability of the microgrid system. HOMER Pro's well-established optimization capabilities provide insights into the cost-effectiveness of different system configurations. REopt's analysis further corroborates the economic benefits by identifying the sizing configurations that yield the lowest lifetime costs while meeting the desired energy requirements. Aligning the algorithm-generated sizes with the results from these tools reinforces the reliability of the hybrid approach in optimizing the microgrid's economic performance.
The algorithm-derived sizing configurations are also evaluated for emission reduction benefits using both HOMER Pro and REopt. These tools quantify the environmental impact by estimating the reduction in greenhouse gas emissions associated with the optimal configurations. By comparing the emission benefits calculated by the algorithm with those from HOMER Pro and REopt, we ascertain the algorithm's capability to generate sizing solutions that improve economic efficiency and reduce the microgrid's carbon footprint.
To conduct the economic and environmental benefits, the listed equations are used.
Where is the revenue at time t, s the Cost at time t, r is the discount rate, and
T is the project lifetime.
Levelized Cost of energy,
is the total energy generated at time t.
The simple payback calculates the time it takes for the project's cumulative benefits to offset the initial investment costs.
Where, discount rate is i, and N represents number of years.
Reduction in CO
2 emissions compared to a baseline scenario, considering the energy mix and emissions factors.
Considering all other parameters such as grid energy purchase cost, PV panel cost, battery cost, resilience sensitivity factor, grid power sell back Cost same in the proposed system and 2 of the industry-leading tools to optimize microgrid a detail analysis is shown in
Table 2 and
Table 3 respectively.
Table 1.
Considered input parameters of the proposed system and existing tools.
Table 1.
Considered input parameters of the proposed system and existing tools.
| Aspects |
Inputs |
| Microgrid lifetime |
20 years |
| Discount rate |
5% |
| Inflation rate |
2% |
| Annual load demand |
332 MWh |
| Average outage |
7 hours |
| Existing PV |
0 |
| Existing Battery |
0 |
| Criticality factor |
50% |
The proposed system suggests a PV size of 88 kW and a battery size of 97 kWh. These sizing configurations are notably different from those obtained through HOMER Pro and REopt, highlighting the algorithm's ability to explore alternative solutions that optimize the microgrid's performance. The PSO-LSTM achieves a significantly lower levelized cost of energy (LCOE) of $0.39 compared to $0.51 from HOMER Pro and $0.47 from REopt. Additionally, the simple payback period for the proposed system is notably shorter at 11 years, outperforming both HOMER Pro (17 years) and REopt (14 years). The proposed system enhances the microgrid's resilience with a backup duration of 10 hours, surpassing HOMER Pro (19 hours) and REopt (15 hours). This underscores the algorithm's ability to optimize system configurations that ensure a reliable energy supply during outages. It also demonstrates superior emission reduction, totaling 188 tons, compared to 138 tons from HOMER Pro and 151 tons from REopt. This signifies the algorithm's ability to generate configurations aligning with sustainability goals. Finally, it yields significant cost savings of $18,432, which far exceed the savings of $762 from HOMER Pro and $6,103 from REopt. This demonstrates the algorithm's adeptness at identifying economically efficient solutions.
The proposed system maintains a competitive levelized cost of energy (LCOE) at $0.39, which compares favorably to HOMER Pro's $0.46 and REopt's $0.47.
The simple payback period of the proposed system is remarkably short, at just 11 hours, demonstrating its immediate cost-effectiveness. In comparison, HOMER Pro requires 9 years, and REopt takes 8.25 years to achieve payback. The algorithm ensures a backup duration of 7 hours during outages, enhancing the microgrid's resilience. This surpasses HOMER Pro's 2 hours and REopt's 1 hour (for PV only), emphasizing the algorithm's ability to optimize system configurations for reliable energy supply. It achieves substantial emission reduction, totaling 159 tons, compared to 140 tons from HOMER Pro and 185 tons from REopt. This showcases the algorithm's capability to prioritize sustainability goals. The proposed system offers cost savings of $10,965, making it a financially efficient solution. While HOMER Pro provides savings of $21,354 and REopt offers significant savings of $40,978, the calculation maintains a competitive edge in cost-effectiveness.
The hybrid PSO-LSTM algorithm's alternative sizing solutions outperform established tools across various metrics. The proposed approach consistently yields optimal configurations that balance economic viability, environmental impact, and resilience. The algorithm's ability to provide immediate cost savings, achieve a remarkably simple payback period, enhance energy system resilience, and reduce emissions underscores its potential to revolutionize microgrid design and operation. By aligning economic efficiency with sustainability goals, the hybrid PSO-LSTM algorithm emerges as a powerful tool for creating resilient and sustainable energy systems.
The algorithm collectively showcases the modified PSO-LSTM algorithm's effectiveness in determining the optimal sizing of battery and solar PV components. The consistently low mean score, the identification of the best-performing solution, and the convergence pattern underscore the algorithm's ability to efficiently navigate a complex search space and identify configurations that enhance the microgrid's performance. This hybrid approach improves the accuracy of predictions and contributes to the microgrid's overall resilience, cost-efficiency, and sustainable energy utilization.
7. Conclusions
This article presents a comprehensive approach to enhancing grid-connected microgrids' resilience and economic viability through predictive modeling, hybrid forecasting techniques, optimization, and thorough analysis. The integration of Monte Carlo simulation for outage prediction and battery state of charge estimation, along with the hybrid modified PSO-LSTM model for solar irradiance and load profile forecasting, showcases a robust methodology for anticipating system behavior. The optimization process, driven by Particle Swarm Optimization, effectively balances energy generation, storage, and demand while considering techno-economic constraints. The results reveal a resilient and cost-efficient microgrid configuration, bridging the gap between grid stability and sustainable energy utilization. The holistic insights gained contribute to a deeper understanding of microgrid dynamics and reinforce the role of advanced techniques in shaping the future of resilient and sustainable energy systems.
Author Contributions
Mahtab Murshed: Conceptualization, methodology, data collection, data analysis, writing - original draft, writing - review & editing. Manohar Chamana: Writing - review & editing, project administration. Konrad Erich Kork Schmitt: data analysis, writing - review & editing, visualization. Suhas Pol: review & editing, funding acquisition. Olatunji Adeyanju: Draft manuscript preparation, review & editing, visualization. Stephen Bayne: Conceptualization, review & editing, supervision.
Funding
This work was supported by the US Department of Defense (DOD)' s Environmental Security Technology Certification Program (ESTCP) (No. W912HQ20C0022).
Data Availability Statement
Data sharing is not applicable to this article.
Acknowledgments
The authors of this article would like to acknowledge the help and support provided by the De-partment of Electrical and Computer Engineering and National Wind Institute (NWI) of Texas Tech University, Texas Water Development Board (TWDB) for sharing the TexMesonet wind da-ta, and the Global Laboratory for Energy Asset Management and Manufacturing (GLEAMM).
Conflicts of Interest
The authors declare no conflict of interest.
Nomenclature
| NACA |
National Advisory Committee for Aeronautics |
| NREL |
National Renewable Energy Laboratory |
| BESS |
Battery energy storage system |
| DRE |
Distributed renewable energy |
| SoC |
State of Charge |
| DER |
Distributed energy resources |
| RR |
Renewable resources |
| PV |
Photovoltaic modules |
| VOLL |
Value of lost load |
| EV |
Electric vehicles |
| VAR |
Value At Risk |
| LSTM |
Long short-term memory |
| PSO |
Particle Swarm Optimization |
| CSP |
Concentrating Solar Power |
| GHG |
Green House Gas |
| IRR |
Investment return rate |
| NPV |
Net present value |
| LCOE |
Levelized Cost of energy |
| CFR |
Capital recovery factor |
| EIA |
Environmental Impact Assessment |
| NASA |
National Aeronautics and Space Administration |
| EPRI |
Electric Power Research Institute |
| LASP |
Laboratory for Atmospheric and Space Physics |
| NREL |
National Renewable Energy Laboratory |
References
- AG. Mohy-ud-din; K. M. Muttaqi, Danny Sutanto :xing of Microgrid Compopnents: Variability, Scalability and, Stability of Microgrids" June 6th 2019. [CrossRef]
- C. Shang; J. Gao; H. Liu; F. Liu "Short-Term Load Forecasting Based on PSO-KFCM Daily Load Curve Clustering and CNN-LSTM Model" IEEE Access, 2021 ( Volume: 9). [CrossRef]
- Y. Sun,X. Wang,* and J. Yang "Modified Particle Swarm Optimization with Attention-Based LSTM for Wind Power Prediction" Energies, MDPI, 2022. [CrossRef]
- H. Wang, Y. Liu, B. Zhou, C. Li, G. Cao, N. Voropai, E. Barakhtenko, "Taxonomy research of artificial intelligence for deterministic solar power forecasting" Energy Conversion and Management 2022. [CrossRef]
- R Bhatta, R Shrestha, C Negri, K Schmitt, M Murshed, M Chamana, S. Bayne "Feasibility of a Real-world Test Microgrid Facility to Provide Economic and Resiliency Benefits in Extreme Weather Conditions" IEEE Power & Energy Society Innovative Smart Grid Technologies 2022.
- B. Gu, H. Shen, X. Lei, H. Hu, X. Liu, "Forecasting and uncertainty analysis of day-ahead photovoltaic power using a novel forecasting method" Applied Energy, Volume 299,2021. [CrossRef]
- A Balal, M Murshed "Implementation and comparison of Perturb and Observe, and Fuzzy Logic Control on Maximum Power Point Tracking (MPPT) for a Small Satellite" Journal of Soft Computing & Decision Support Systems 8 (2) 2021.
- Gu, Bo, Xi Li, Fengliang Xu, Xiaopeng Yang, Fayi Wang, and Pengzhan Wang. 2023. "Forecasting and Uncertainty Analysis of Day-Ahead Photovoltaic Power Based on WT-CNN-BiLSTM-AM-GMM" Sustainability 15, no. 8: 6538. [CrossRef]
- MY Arafat, M Murshed, MM Hasan, MA Razzak "Design aspects and performance analysis of inner and outer rotor permanent magnet alternator for direct driven low-speed wind turbine" 2nd International Conference on Advances in Electrical, Electronics 2016.
- M. Aleardi, E. Stucchi"A hybrid residual neural network–Monte Carlo approach to invert surface wave dispersion data" Near Surface Geophysics,2021,19, 397–414, 19 May 2021. [CrossRef]
- Mousavi, R. Cherkaoui, M. Bozorg "Blackouts risk evaluation by Monte Carlo Simulation regarding cascading outages and system frequency deviation" Electric Power Systems Research, Volume 89, 2012, Pages 157-164. [CrossRef]
- KEK Schmitt, I Osman, R Bhatta, M Murshed, M Chamana, S Bayne "A dynamic load control strategy for an efficient building demand response" IEEE Energy Conversion Congress and Exposition (ECCE), 819-826 2021.
- Akram, U.; Khalid, M.; Shafiq, S. Optimal sizing of a wind/solar/battery hybrid grid-connected microgrid system. IET Renewable Power Gener. 2018, 12, 72–80. [CrossRef]
- Höhne, N.; Gidden, M.J.; den Elzen, M.; Hans, F.; Fyson, C.; Geiges, A.; Jeffery, M.L.; Gonzales-Zuñiga, S.; Mooldijk, S.; Hare, W.; et al. Wave of net zero emission targets opens window to meeting the Paris Agreement. Nat. Clim. Change 2021, 11, 820–822. [CrossRef]
- Kelly, J.J.; Leahy, P.G. Sizing battery energy storage systems: Using multi-objective optimization to overcome the investment scale problem of annual worth. IEEE Trans. Sustain. Energy 2020, 11, 2305–2314. [CrossRef]
- Zhang, T.; Gooi, H.B.; Chen, S.; Goh, T. Cost-effectiveness studies of the BESSs participating in frequency regulation. In Proceedings of the IEEE Innovative Smart Grid Technologies—Asia (ISGT ASIA), Bangkok, Thailand, 3–6 November 2015.
- Y Arafat, M Murshed, MA Razzak "Design and analysis of an outer rotor permanent magnet alternator for low-speed wind turbine" 3rd International Conference on Green Energy and Technology (ICGET), 1-7 2015.
- MY Arafat, M Murshed, MM Hasan, MA Razzak "Design and performance analysis of a modified outer rotor permanent magnet alternator for low-speed wind turbine" 9th International Conference on Electrical and Computer Engineering 2016.
- Brown, P., Recht, B., & Fergus, R. (2015). "Understanding the difficulty of training deep feedforward neural networks." Proceedings of the 13th International Conference on Artificial Intelligence and Statistics (AISTATS).
- M Chamana, K Schmitt, R Bhatta, I Osman, S Liyanage, M Murshed "Hierarchical Operation of Flexible Building Microgrids for Distributed Critical Loads Resiliency" Resilience Week (RWS), 1-9 2021.
- K Schmitt, R Bhatta, M Chamana, M Murshed, I Osman, S Bayne, L Canha "A Review on Active Customers Participation in Smart Grids" Journal of Modern Power Systems and Clean Energy 2022.
- Johnson, K. E., Fischer, R. E., Sigrin, B. O., and Fisher, E. C. (2020). "Predicting Power Outages using Smart Meter Data." IEEE Transactions on Smart Grid, 11(3), 2707-2716.
- Kennedy, J., & Eberhart, R. C. (1995). "Particle swarm optimization." Proceedings of IEEE International Conference on Neural Networks.
- Smith, T. L., Johnson, K. E., & Fisher, E. C. (2018). "Predicting and Managing Power Outages." IEEE Transactions on Smart Grid, 9(6), 5804-5811.
- M Murshed, Y Arafat, MA Razzak "Design of blades for a low-speed 400W wind turbine suitable for coastal area of Bangladesh" 3rd International Conference on Green Energy and Technology (ICGET), 1-6 2015.
- Zhang, J., Zheng, Q., & Li, L. (2019). "Short-Term Load Forecasting with Long Short-Term Memory." IEEE Transactions on Smart Grid, 10(4), 3711-3719.
- Aghamohammadi, M.R.; Abdolahinia, H. A new approach for optimal sizing of battery energy storage system for primary frequency control of islanded microgrid. Electr. Power Energy Syst. 2014, 54, 325–333. [CrossRef]
- MY Arafat, M Murshed, MA Razzak "Design and analysis of an in-runner permanent magnet alternator for low-speed wind turbine" 4th International Conference on the Development in the in Renewable Energy 2016.
- Farrokhabadi, M.; König, S.; Cañizares, C.A.; Bhattacharya, K.; Leibfried, T. Battery energy storage system models for microgrid stability analysis and dynamic simulation. IEEE Trans. Power Syst. 2018, 33, 2301–2312. [CrossRef]
- Kerdphol, T.; Qudaih, Y.; Mitani, Y. Battery energy storage system size optimization in microgrid using particle swarm optimization. In Proceedings of the IEEE PES Innovative Smart Grid Technologies, Istanbul, Turkey, 12–15 October 2014. [CrossRef]
- El-Bidairia, K.S.; Nguyena, H.D.; Jayasinghea, S.; Mahmoudb, T.S. A hybrid energy management and battery size optimization for standalone microgrids: A case study for Flinders Island, Australia. Energy Convers. Manag. 2018, 175, 192–212.
- M Murshed, MY Arafat, MA Razzak "Analysis of Air Foils and Design of Blades for a Low-Speed 250W Vertical Axis Wind Turbine Suitable for Coastal Areas of Bangladesh" 1st International Conference on Advances in Science, Engineering 20193.
- Yuqing, Y.; Stephen, B.; Chris, M.; Merlinde, K. Battery energy storage system size determination in renewable energy systems: A review. Renew. Sustain. Energy Rev. 2018, 91, 109–125. Appl. Sci. 2022, 12, 8247 18 of 18.
- Mulleriyawage, U.G.K.; Shen, W.X. Optimally sizing of battery energy storage capacity by operational optimization of residential PV-Battery systems: An Australian household case study. Renew. Energy 2020, 160, 852–864. [CrossRef]
- MY Arafat, M Murshed, MM Hasan, MA Razzak "Impacts of cogging torque and its reduction for an external rotor permanent magnet alternator" 5th International Conference on Informatics, Electronics and Vision 2016.
- M Murshed, M Chamana, KEK Schmitt, R Bhatta, O Adeyanju, S Bayne "Design and Performance Analysis of a Grid-Connected Distributed Wind Turbine" Energies 16 (15), 5778 2023.
- Choi, Y.; Kim, H. Optimal scheduling of energy storage system for self-sustainable base station operation considering battery wear-out Cost. In Proceedings of the Eighth International Conference on Ubiquitous and Future Networks (ICUFN), Vienna, Austria, 5–8 July 2016. [CrossRef]
- Moghimi, M.; Garmabdari, R.; Stegen, S.; Lu, J. Battery energy storage cost and capacity optimization for university research center. In Proceedings of the IEEE/IAS 54th Industrial and Commercial Power Systems Technical Conference (I&CPS), Niagara Falls, ON, Canada, 7–10 May 2018.
- Fedjaev, J.; Amamra, S.; Francois, B. Linear programming based optimization tool for day ahead energy management of a lithium-ion battery for an industrial microgrid. In Proceedings of the IEEE International Power Electronics and Motion Control Conference (PEMC), Varna, Bulgaria, 25–28 September 2016. [CrossRef]
- Grillo, S.; Pievatolo, A.; Tironi, E. Optimal storage scheduling using markov decision processes. IEEE Trans. Sustain. Energy 2016, 7, 755–764. [CrossRef]
- Regis, N.; Muriithi, C.M.; Ngoo, L. Optimal battery sizing of a grid-connected residential photovoltaic system for cost minimization using pso algorithm. Eng. Technol. Appl. Sci. Res. 2019, 9, 4905–4911. [CrossRef]
- Beskirli, A.; Temurtas, H.; Ozdemir, D. Determination with Linear Form of Turkey's Energy Demand Forecasting by the Tree Seed Algorithm and the Modified Tree Seed Algorithm. Adv. Electr. Comput. Eng. 2020, 20, 27–34.
- Suresh, M.; Meenakumari, R. An improved genetic algorithm-based optimal sizing of solar photovoltaic/wind turbine generator/diesel generator/battery connected hybrid energy systems for standalone applications. Int. J. Ambient Energy 2021, 42, 1136–1143. [CrossRef]
- Bahmani-Firouzi, B.; Azizipanah-Abarghooee, R. Optimal sizing of battery energy storage for micro-grid operation management using a new improved bat algorithm. Electr. Power Energy Syst. 2014, 56, 42–54. [CrossRef]
- Nimma, K.S.; Al-Falahi, M.D.A.; Nguyen, H.D.; Jayasinghe, S.D.G.; Mahmoud, T.S.; Negnevitsky, M. Grey Wolf optimizationbased optimum energy-management and battery-sizing method for grid-connected microgrids. Energies 2018, 11, 847. [CrossRef]
- Paliwal, N.K.; Singh, A.K.; Singh, N.K.; Kumar, P. Optimal sizing and operation of battery storage for economic operation of hybrid power system using artificial bee colony algorithm. Int. Trans. Electr. Energy Syst. 2019, 29, e2685. [CrossRef]
- M Murshed, MY Arafat, MA Razzak "Analysis of air foils and design of blades for a low-speed 250W horizontal axis wind turbine suitable for coastal areas of Bangladesh" 4th International Conference on the Development in the in Renewable Energy 2016.
- LawanBukar, A.; WeiTan, C.; YiewLau, K. Optimal sizing of an autonomous photovoltaic/wind/battery/diesel generator microgrid using grasshopper optimization algorithm. Solar Energy 2019, 188, 685–696. [CrossRef]
- Kerdphol, T.; Fuji, K.; Mitani, Y.; Watanabe, M.; Qudaih, Y. Optimization of a battery energy storage system using particle swarm optimization for stand-alone microgrids. Int. J. Electr. Power Energy Syst. 2016, 81, 32–39. [CrossRef]
- M Chamana, KEK Schmitt, R Bhatta, S Liyanage, I Osman, M Murshed, S Bayne "Buildings Participation in Resilience Enhancement of Community Microgrids: Synergy Between Microgrid and Building Management Systems"IEEE Access 10, 100922-100938 2022.
- Sintianingrum, A.; Khairudin; Hakim, L. Optimization of microgrid battery capacity using pso with considering islanding operation. J. Eng. Sci. Res. 2020, 2, 1–4. [CrossRef]
- IEEE Guide for Electric Power Distribution Reliability Indices, IEEE Std 1366-2012 (Revision of IEEE Std 1366-2003), pp. 1–43, May 2012. [CrossRef]
- Chen, S.; Zhang, T.; Gooi, H.B.R.; Masiello, D.; Katzenstein, W. Penetration rate and effectiveness studies of aggregated BESS for frequency regulation. IEEE Trans. Smart Grid 2016, 7, 167–177. [CrossRef]
- Hochreiter, S., and J. Schmidhuber. "Long short-term memory." Neural computation. Vol. 9, Number 8, 1997, pp.1735–1780.
|
Disclaimer/Publisher’s Note: The statements, opinions and data contained in all publications are solely those of the individual author(s) and contributor(s) and not of MDPI and/or the editor(s). MDPI and/or the editor(s) disclaim responsibility for any injury to people or property resulting from any ideas, methods, instructions or products referred to in the content. |
© 2023 by the authors. Licensee MDPI, Basel, Switzerland. This article is an open access article distributed under the terms and conditions of the Creative Commons Attribution (CC BY) license (http://creativecommons.org/licenses/by/4.0/).
