1. Introduction
Beans are among one the most important fabaceous crops grown worldwide. Brazil is the third largest producer of the genus
Phaseolus in the world, behind only Myanmar and India, respectively, and the largest producer and consumer of common bean (P. vulgaris L.), with per capita consumption estimated at 15 kg per year
-1[
1].
Due to the short cycle and superficial and small root system, common bean is a crop demanding nutrients, requiring high availability in adequate time and places. Among the nutritional requirements of the bean plant, nitrogen (N) can be considered the most important since it is a macronutrient present in the constitution of the plant cell, composing nucleic acids, amino acids, and proteins, in addition to taking part in several processes responsible for the cell division and expansion [
2,
3].
The nitrogen needed by the common bean plant can be made available via the soil (through the mineralization of organic matter), industrialized nitrogen fertilizers, non-biological fixation, and biological nitrogen fixation (BNF). Soil N is a limited source that is easily depleted after a few crops [
3]. Using nitrogen fertilizers, in addition to having a high cost and low efficiency, offers an additional ecological cost due to losses through leaching in the form of nitrate and surface runoff and denitrification and volatilization processes, therefore, highly polluting [
4]. Fabaceae, such as common beans, can fix N from the atmosphere into nitrogen assimilable by plants when in symbiosis with bacteria of the Rhizobium genus, which are present in some inoculants. When in contact with the plant, these induce the formation of root nodules, and within these, the BNF process occurs, making this macronutrient available, which is carried by the xylem in the transpiration stream [
5].
Although BNF supplies most of the N demand of common bean plants, it is characterized by rapid senescence of nodules and, therefore, reduction of BNF soon after flowering [
6,
7]. Given this, another practice not yet widely used in research on BNF in common beans would be re-inoculation, late re-inoculation, or supplementary inoculation. The practice consists of carrying out the inoculation at the time of sowing, directly on the seed (inoculation via seed), together with the application of inoculant after the implantation of the crop (inoculation via topdressing), by spraying the product directed to the soil, to promote the formation of new nodules and prolong the period and supply of N throughout the crop cycle. Souza [
8]observed that the supplementary inoculations in topdressing in the soybean crop at the V1, V3, V6, and R1 stages provided a greater number of nodules and higher grain yield.
Other studies have shown that the application of inoculant in the soybean crop at stages close to R6 promoted the addition of nodules in the root system, increasing fixed N and grain yield [
9,
10]. In common bean, Corsini et al. [
11], working with re-inoculation in winter bean, found significant differences for some nodular parameters, where treatments with the presence of re-inoculation with R. tropici showed higher values when compared to the control treatment. Thus, the limited number of studies on the efficiency of reinoculation and the lack of knowledge in field conditions bring the need for investigations on the subject.
2. Materials and Methods
The experiment was carried out in the field during the rainy season in the 2020/2021 harvest in the experimental area of the Goias State Agency for Technical Assistance, Rural Extension, and Agricultural Research - EMATER, located in Anápolis-GO. The climate of the region, according to the Köppen classification, is humid tropical, Aw-type, with a dry season in the autumn-winter period (May-October) and rain in the spring-summer period (November-April), with an average annual temperature of 22ºC and average annual precipitation of 1200 mm [
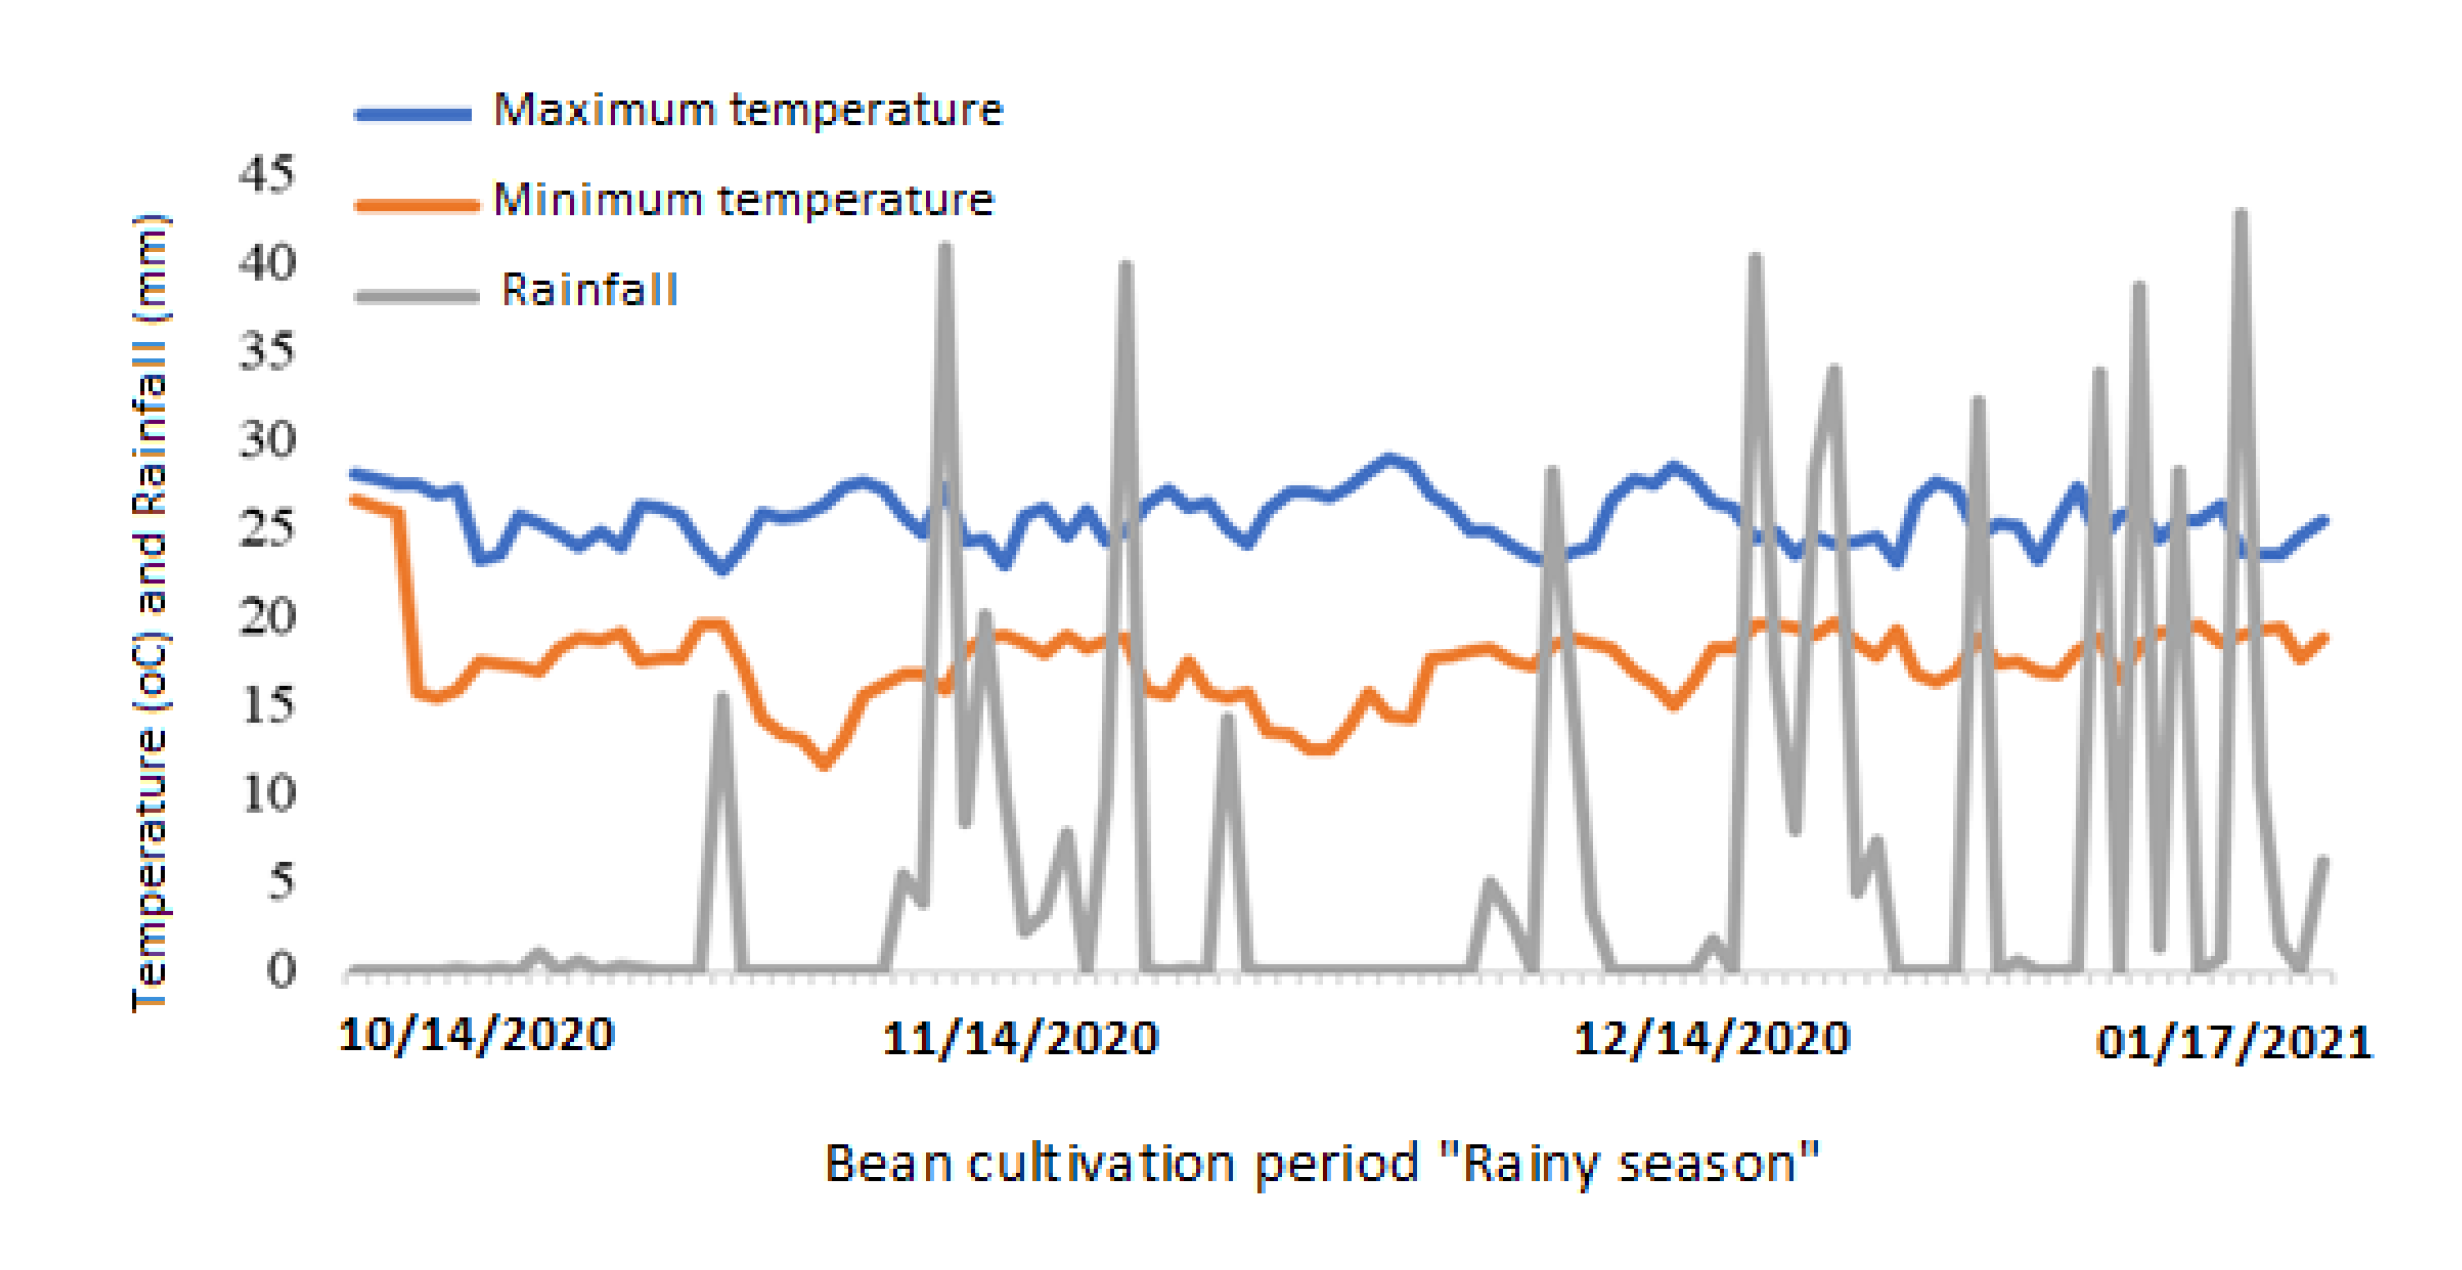
12]. The prevailing climate data during the experiment are shown below (
Figure 1).
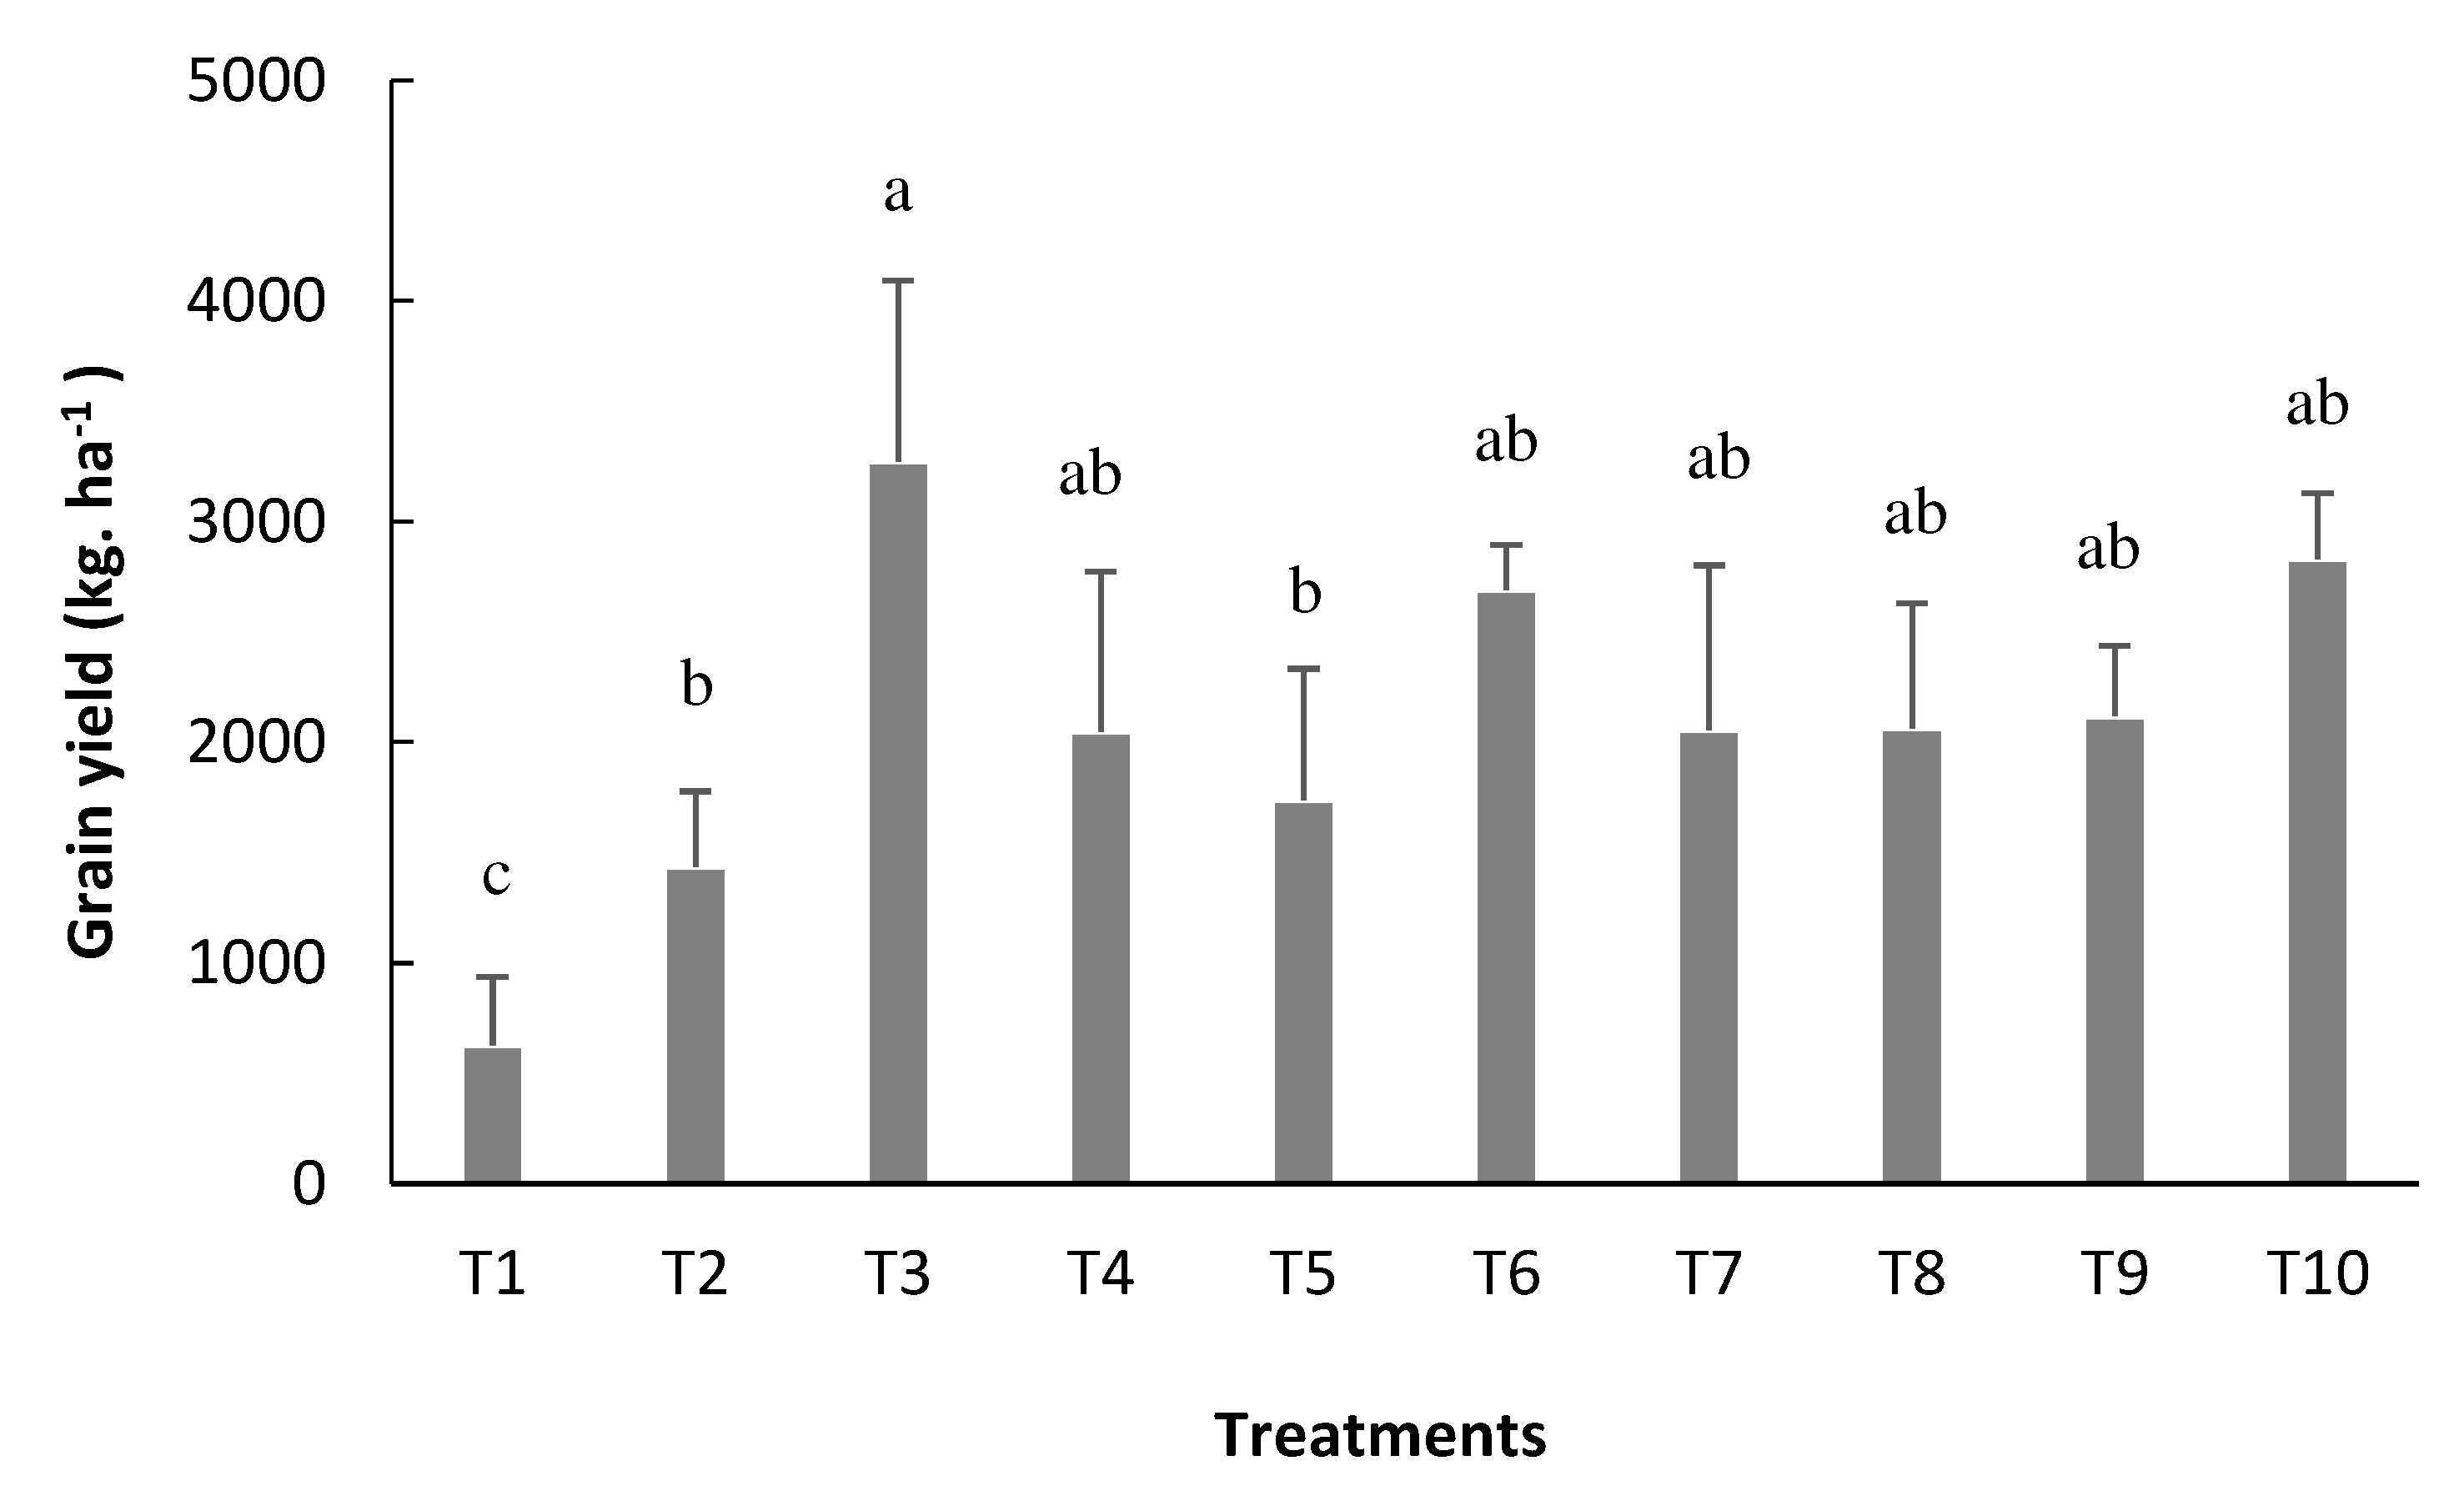
The experiment was conducted in a randomized block design, with ten treatments and four replications, where the treatments were constituted as follows: T1=uninoculated control; T2= inoculation via seed(VS); T3=VS + reinoculation at the V4stage; T4=VS + reinoculation at the R5stage; T5=VS + reinoculation at the R6stage; T6=VS + reinoculation in at V4 and R5stages; T7=VS + reinoculation at V4 and R6stage; T8=VS + reinoculation at R5 and R6stages; T9=VS + reinoculation at V4, R5, and R6stages; and T10=mineral nitrogen fertilization.
For inoculation via seed, a dose of 150 mL was used for 50 kg of seed, and for reinoculation, a dose of 150 mL per hectare was used, according to the recommendationsof the manufacturer. The treatments that received the re-inoculation in more than one bean growth stage received the total dose fractionated in the respective stages in both experiments. The inoculant used was Biomax premium liquid (bean inoculant), based on
Rhizobiumtropici (SEMIA 4077 and SEMIA 4088), with a guarantee of 2x10
9CFU mL
-1. The seeds from the BRS FC402 cultivar were used, characterized by high yield and grain quality, normal cycle, semi-erect architecture, with indeterminate growth habit (Type II), resistance to common mosaic, rust, and moderate resistance to anthracnose, in the case of a common bean from the Pinto bean group [
13].
At the R7 stage, the nodular and morphological characteristics were evaluated utilizing destructive analyses, with five plants being sampled with the aid of a straight shovel, collecting a block of soil with the plant at a depth of 25 cm, aiming to recover the maximum of the root system of the plants. The evaluated characteristics were: total nodules (TN), dry mass of nodules (NDM), taproot length (TRL), shoot dry mass (SDM),root dry mass (RDM), plant height (PH), leaf nitrogen content (NC), and stem diameter (SD).
The agronomic analyses were carried out at the R9 stage (maturation) when the plants showed leaf drops and straw-yellow pods. The components were evaluated based on data from 10 plants collected in the central area of each experimental unit. The yield was obtained by collecting the rest of the plants from the central area of the central rows when the grains had 13% of moisture (dry base), where the evaluations of the number of pods per plant (NPP), number of grains per pod (NGP), 100-grain weight (W100), grain yield (YIELD) and final stand (FS)were carried out.
The data obtained were submitted to analysis of variance (p≤0.05) and, when significant, were submitted to the Tukey test. Statistical analysis was run using the SISVAR 5.6 Software [
14].
3. Results
By the result in the analysis of variance expressed in
Table 1, for the nodular and morphological characteristics analyzes performed at the R7 stage, it was verified that the total nodules (TN), dry mass of nodules (NDM), taproot length (TRL), root dry mass (RDM) and shoot dry mass (SDM) were influenced by the treatments.
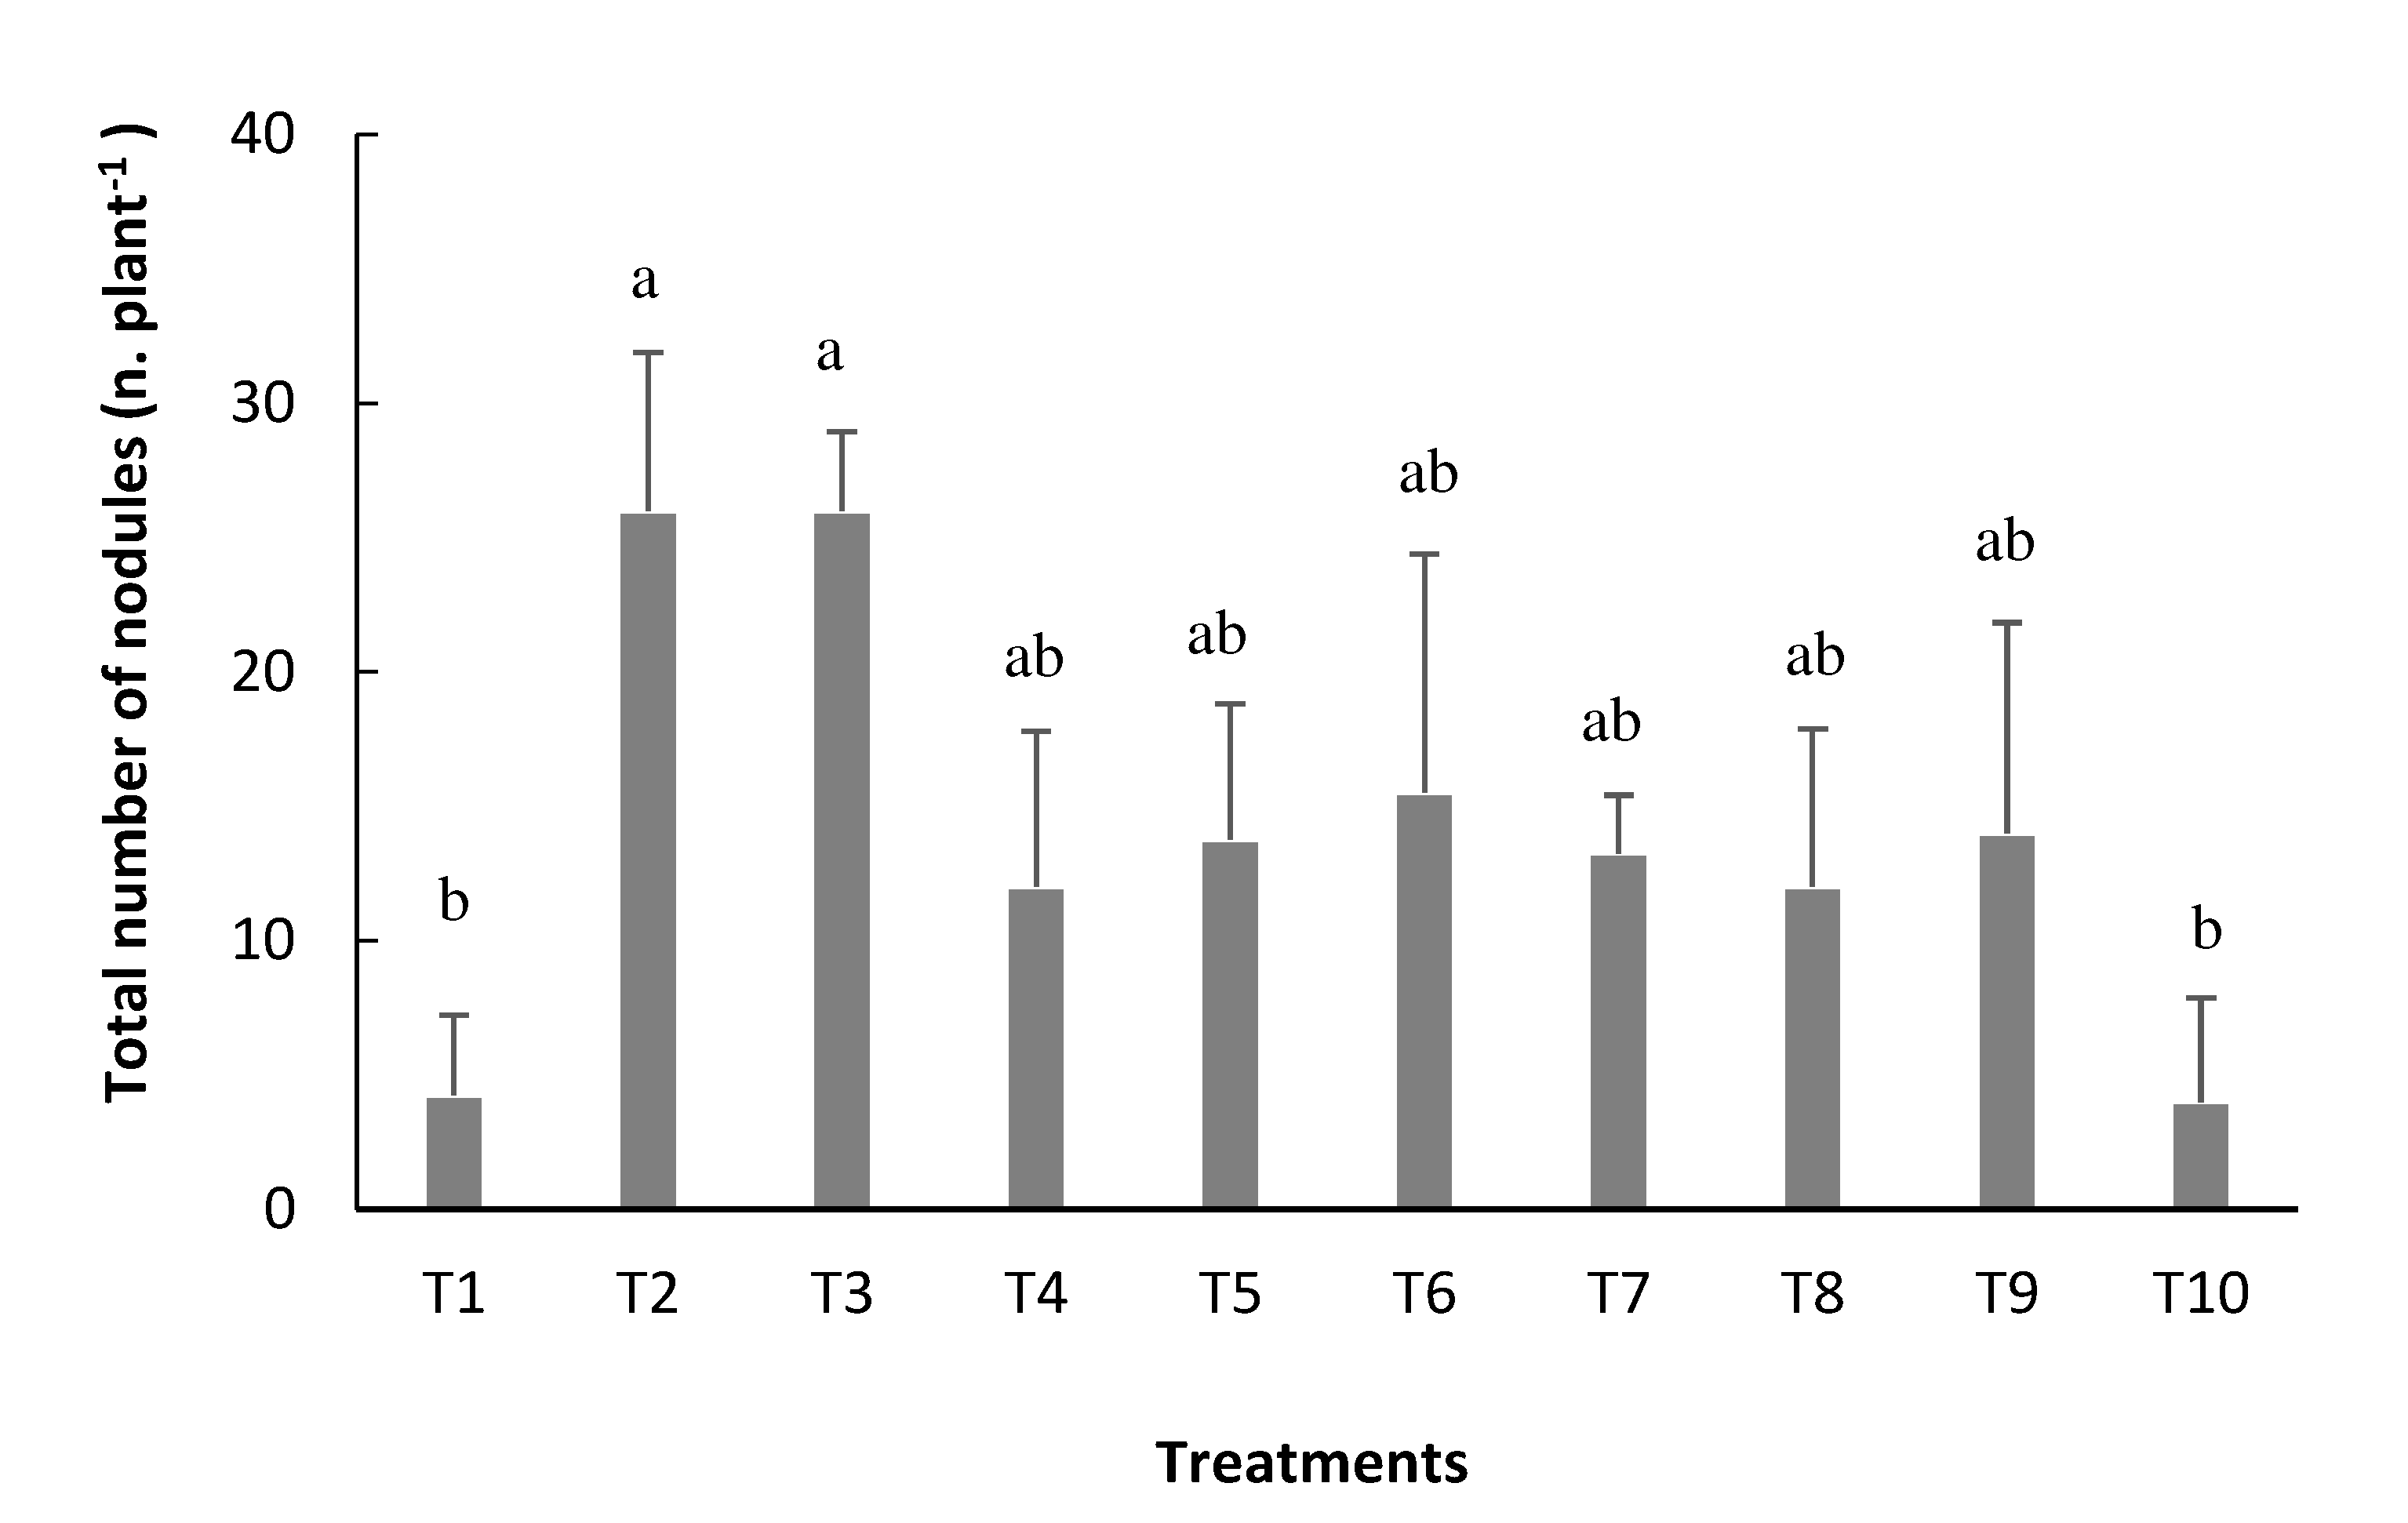
In the case of TN, the inoculation via seed (T2) and the inoculation via seed with reinoculation at V4 stage(T3) presented the highest averages, with 26 nodules plant
-1 in both, not differing, however, from the other inoculated treatments (
Figure 2). generating an increase of 21.7 nodules plant-1 in the formation of new nodules, when compared to the non-inoculated treatment (T1) (
Figure 2).
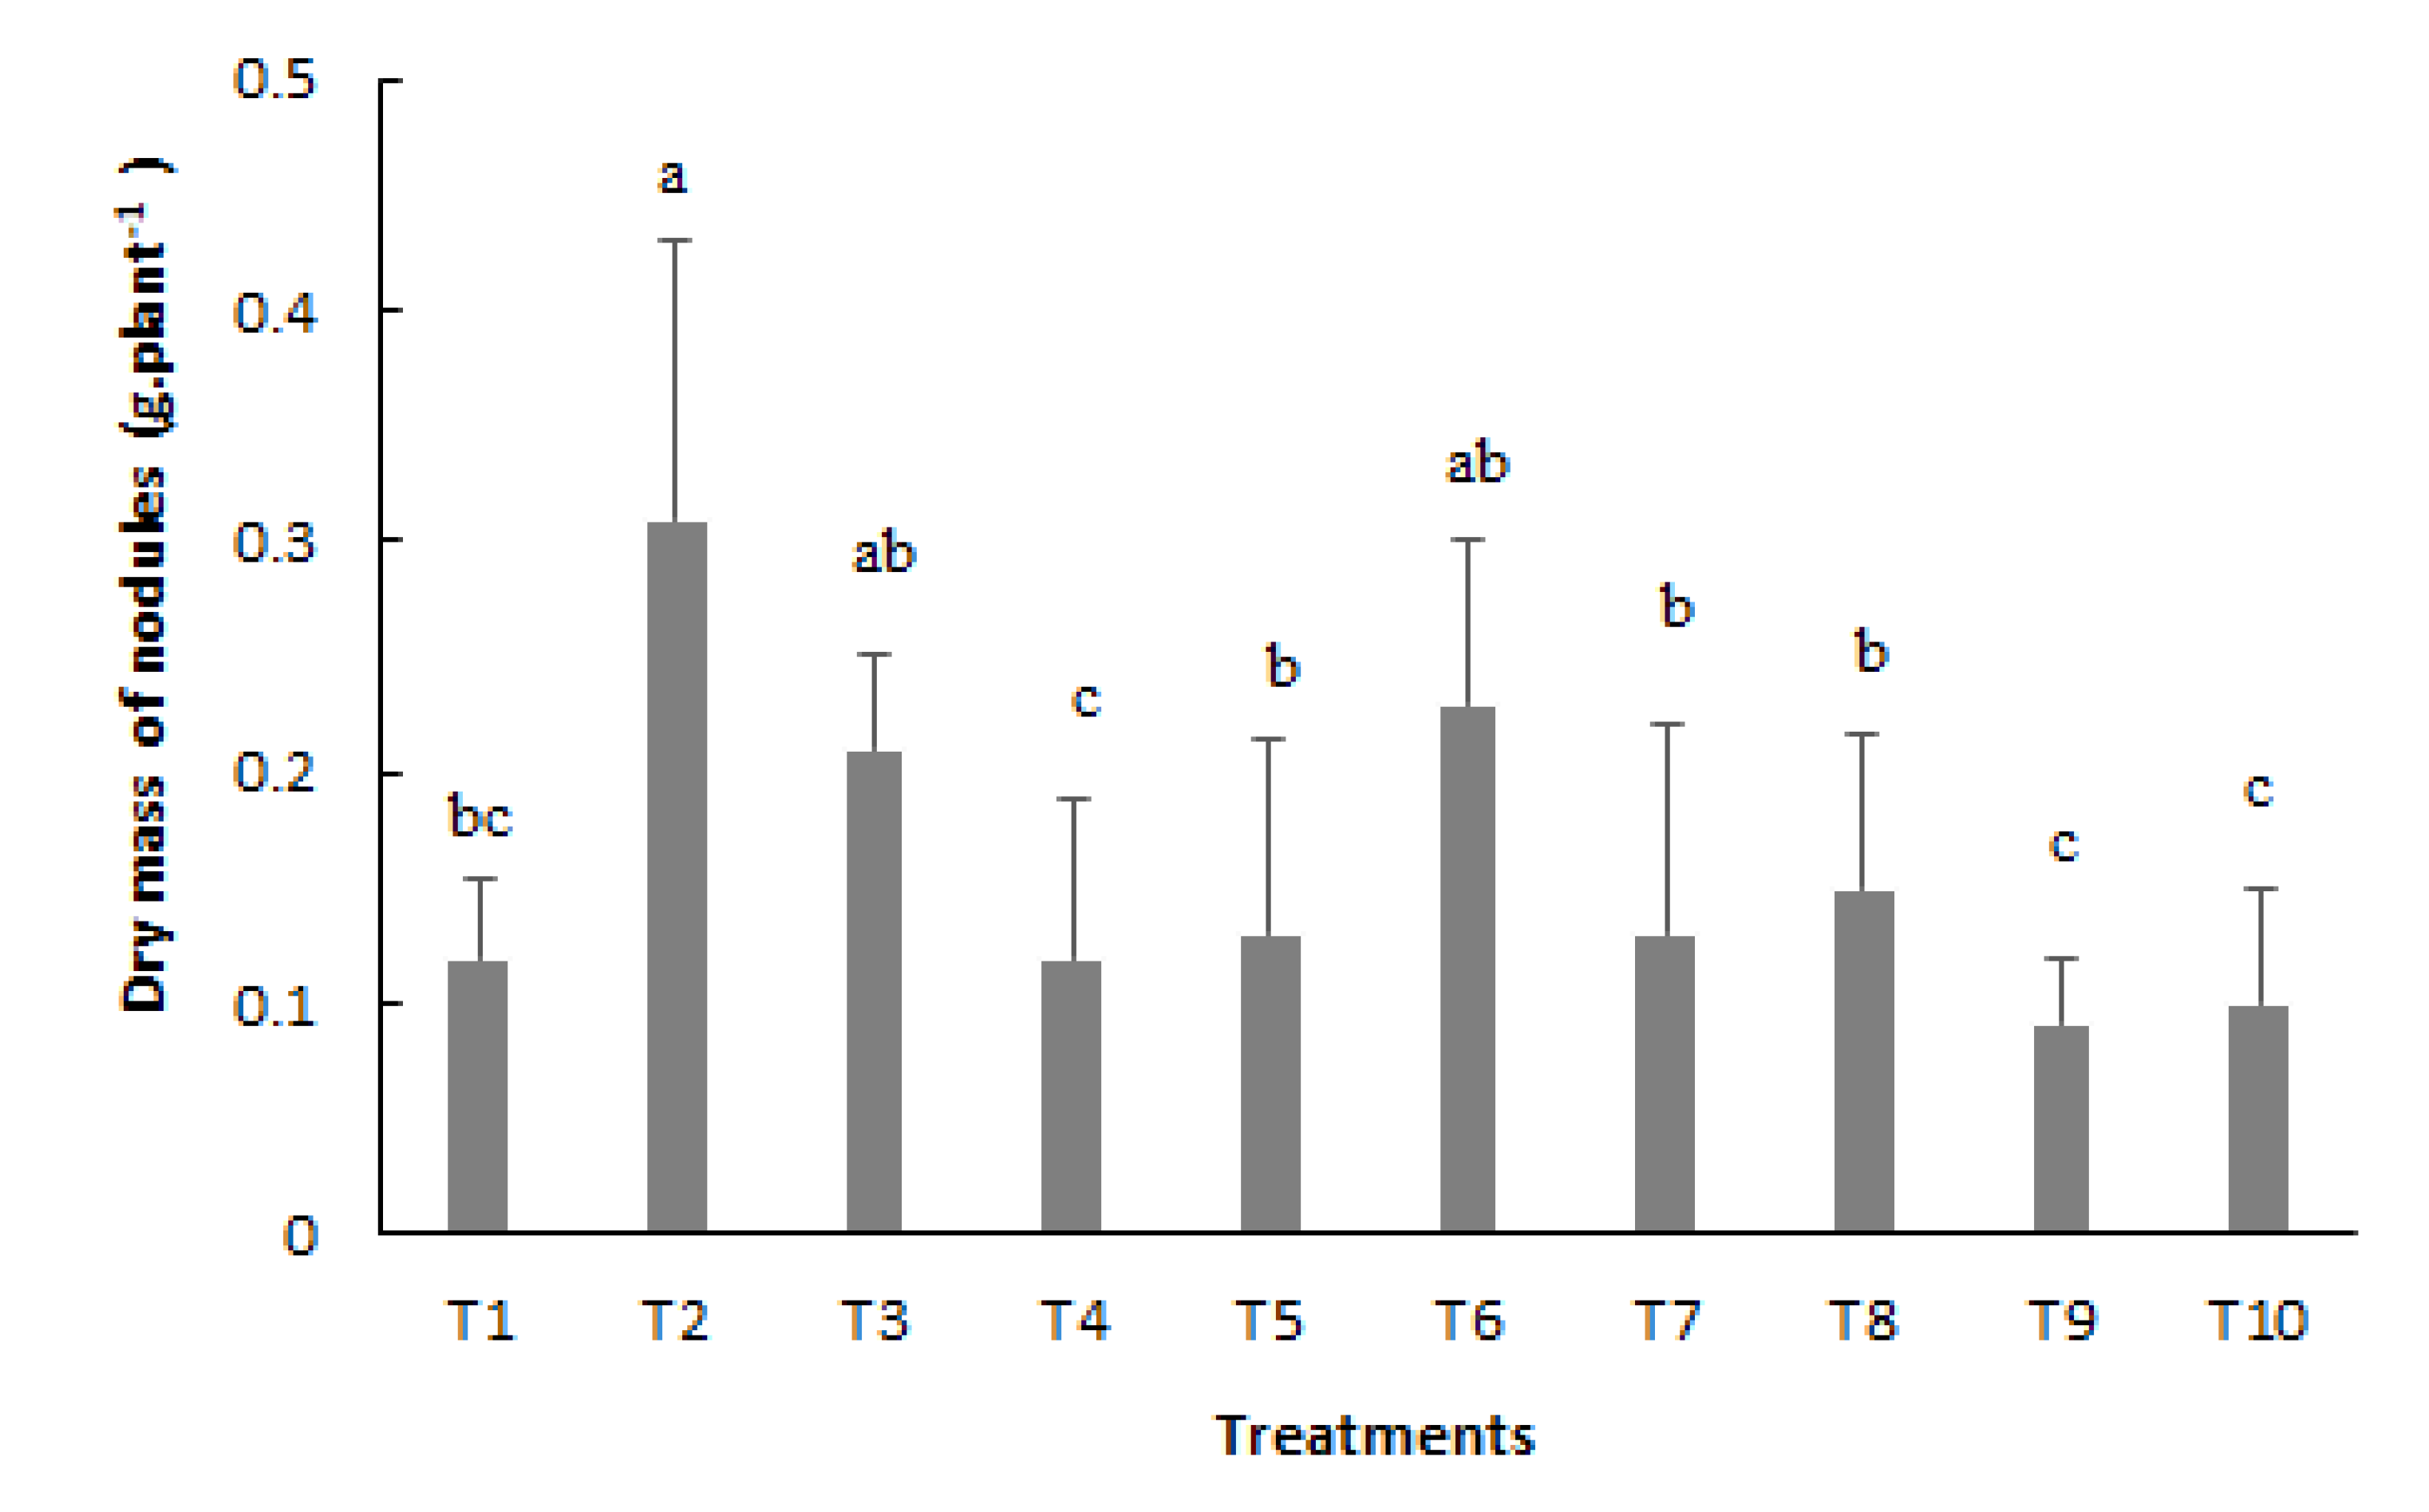
Regarding the dry mass of nodules (NDM) evaluation, it can be noted that the highest averages were verified with inoculation via seed (T2), followed by inoculation via seed with reinoculation at the V4 stage (T3) and inoculation via seed with reinoculation at the V4 and R5 stages (T6) (
Figure 3). The lowest averages were obtained with use the of inoculation via seed and reinoculation at the R5 stage (T4), V4, R5, and R6 stages (T9), and with mineral nitrogen fertilization (T10), partially differentiating the results of several produced nodules, especially with the control treatment (T1).
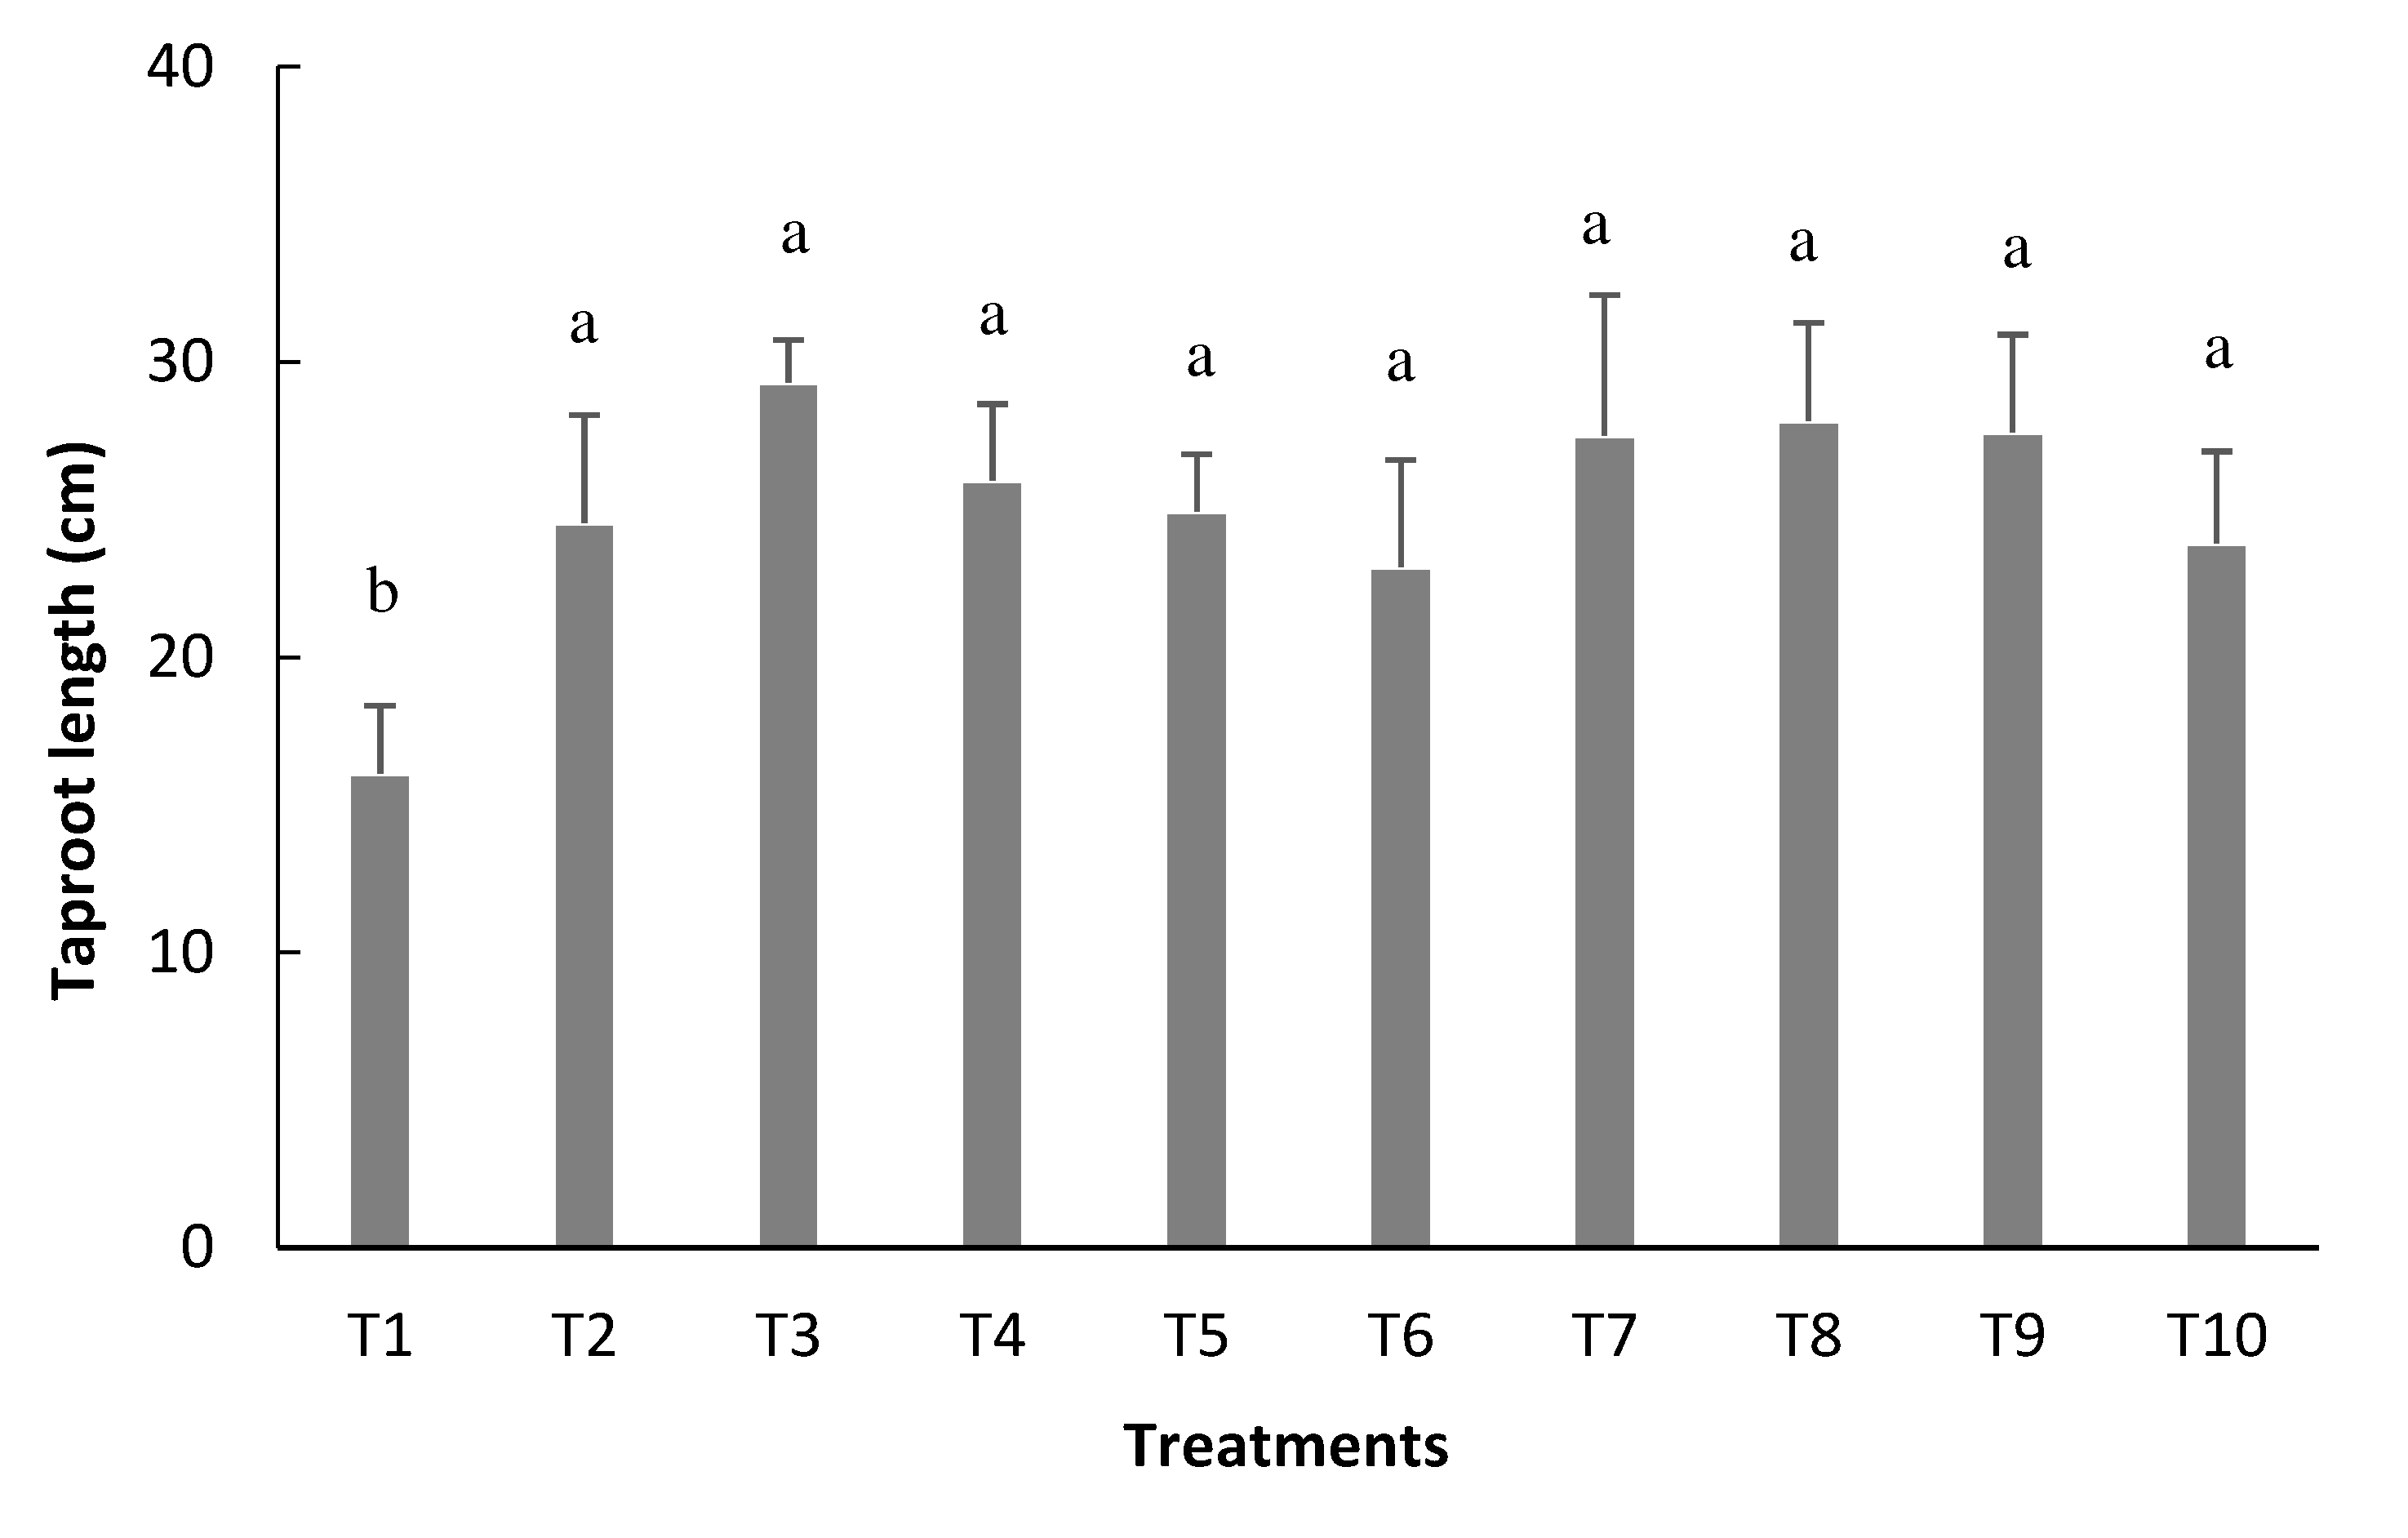
The highest averages of taproot length (TRL) were verified in the treatments in which rhizobium cells were used via seed and in topdressing, equivalent to the treatment in which N was provided by mineral fertilizer (
Figure 4). On the other hand, the lowest average referring to the TRL was found in the non-inoculated treatment (control), with a value of 16.0 cm. The other treatments could generate an increase of up to 13.27 cm.
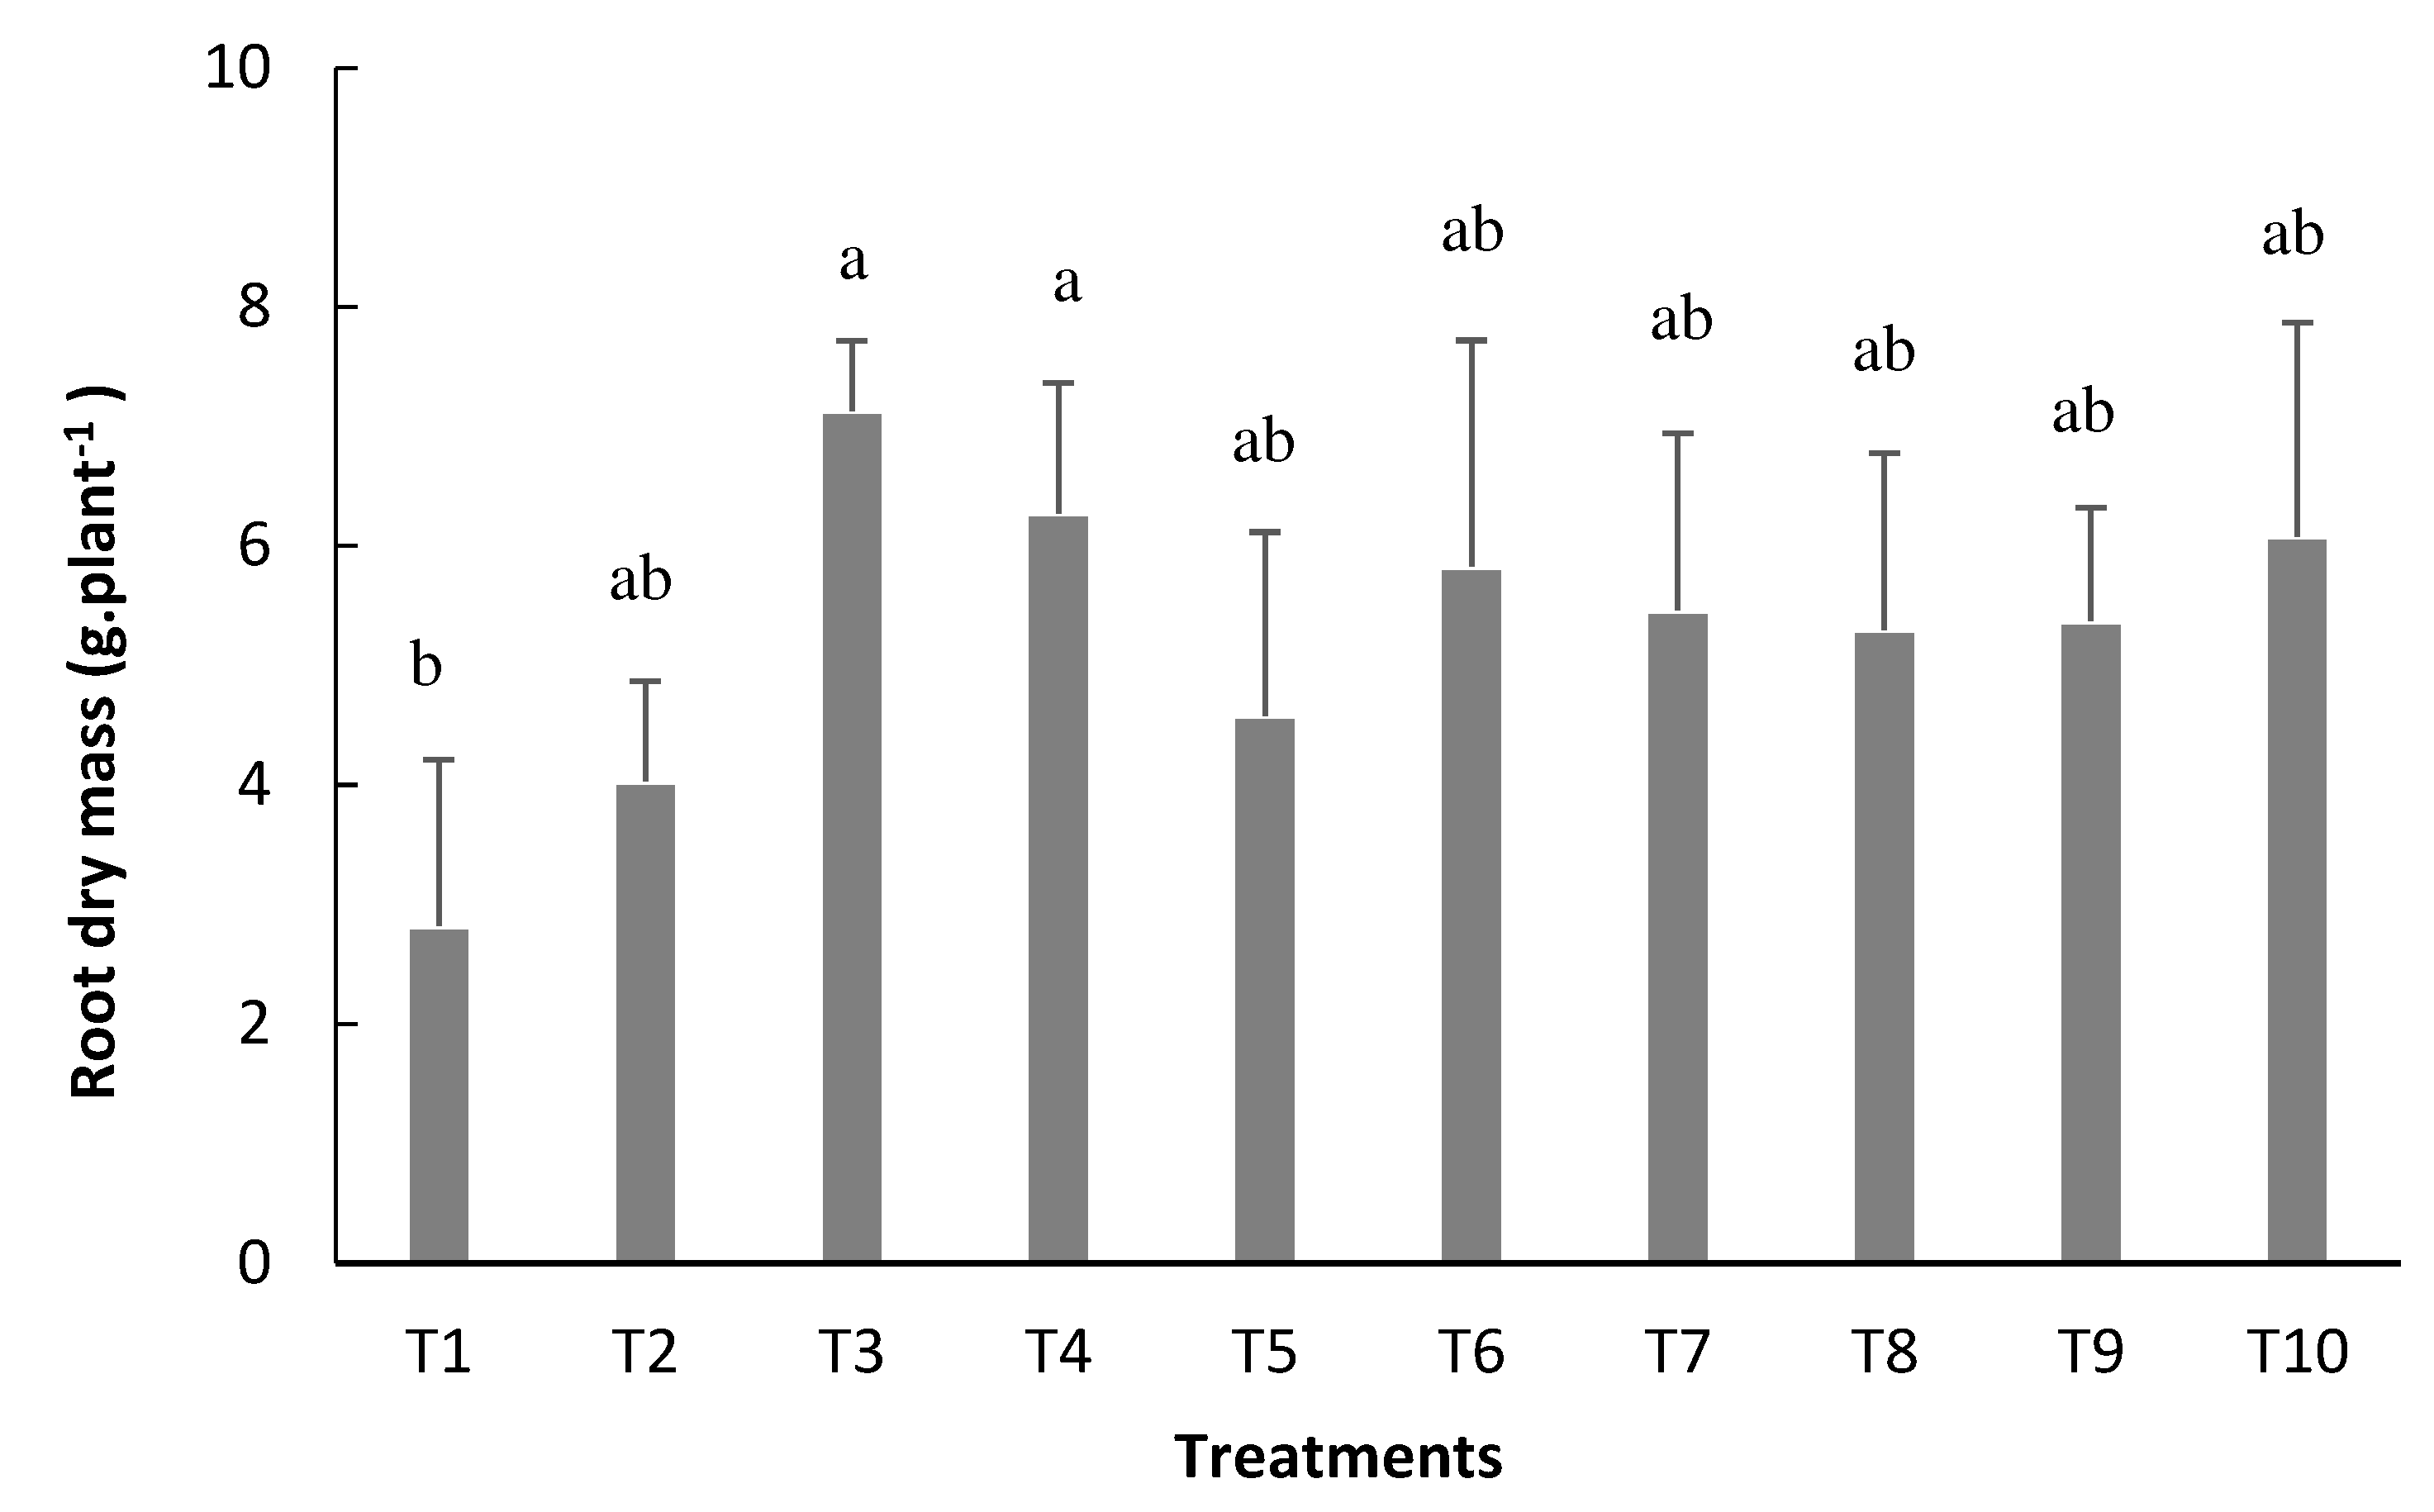
Was possible to verify that inoculation via seed with reinoculation at the V4 stage (T3) and R5 stage (T4) resulted in the highest mean values for the root dry mass (RDM), with values of 7.1 and 6.3 g plant
-1, respectively (
Figure 5). Except for the control treatment, the other treatments showed no statistical difference. The use of inoculation via seed + reinoculation at the V4 stage (T3) generated an increase of 152% in RDM in relation to control and 17% in the treatment that received mineral nitrogen fertilization (T10).
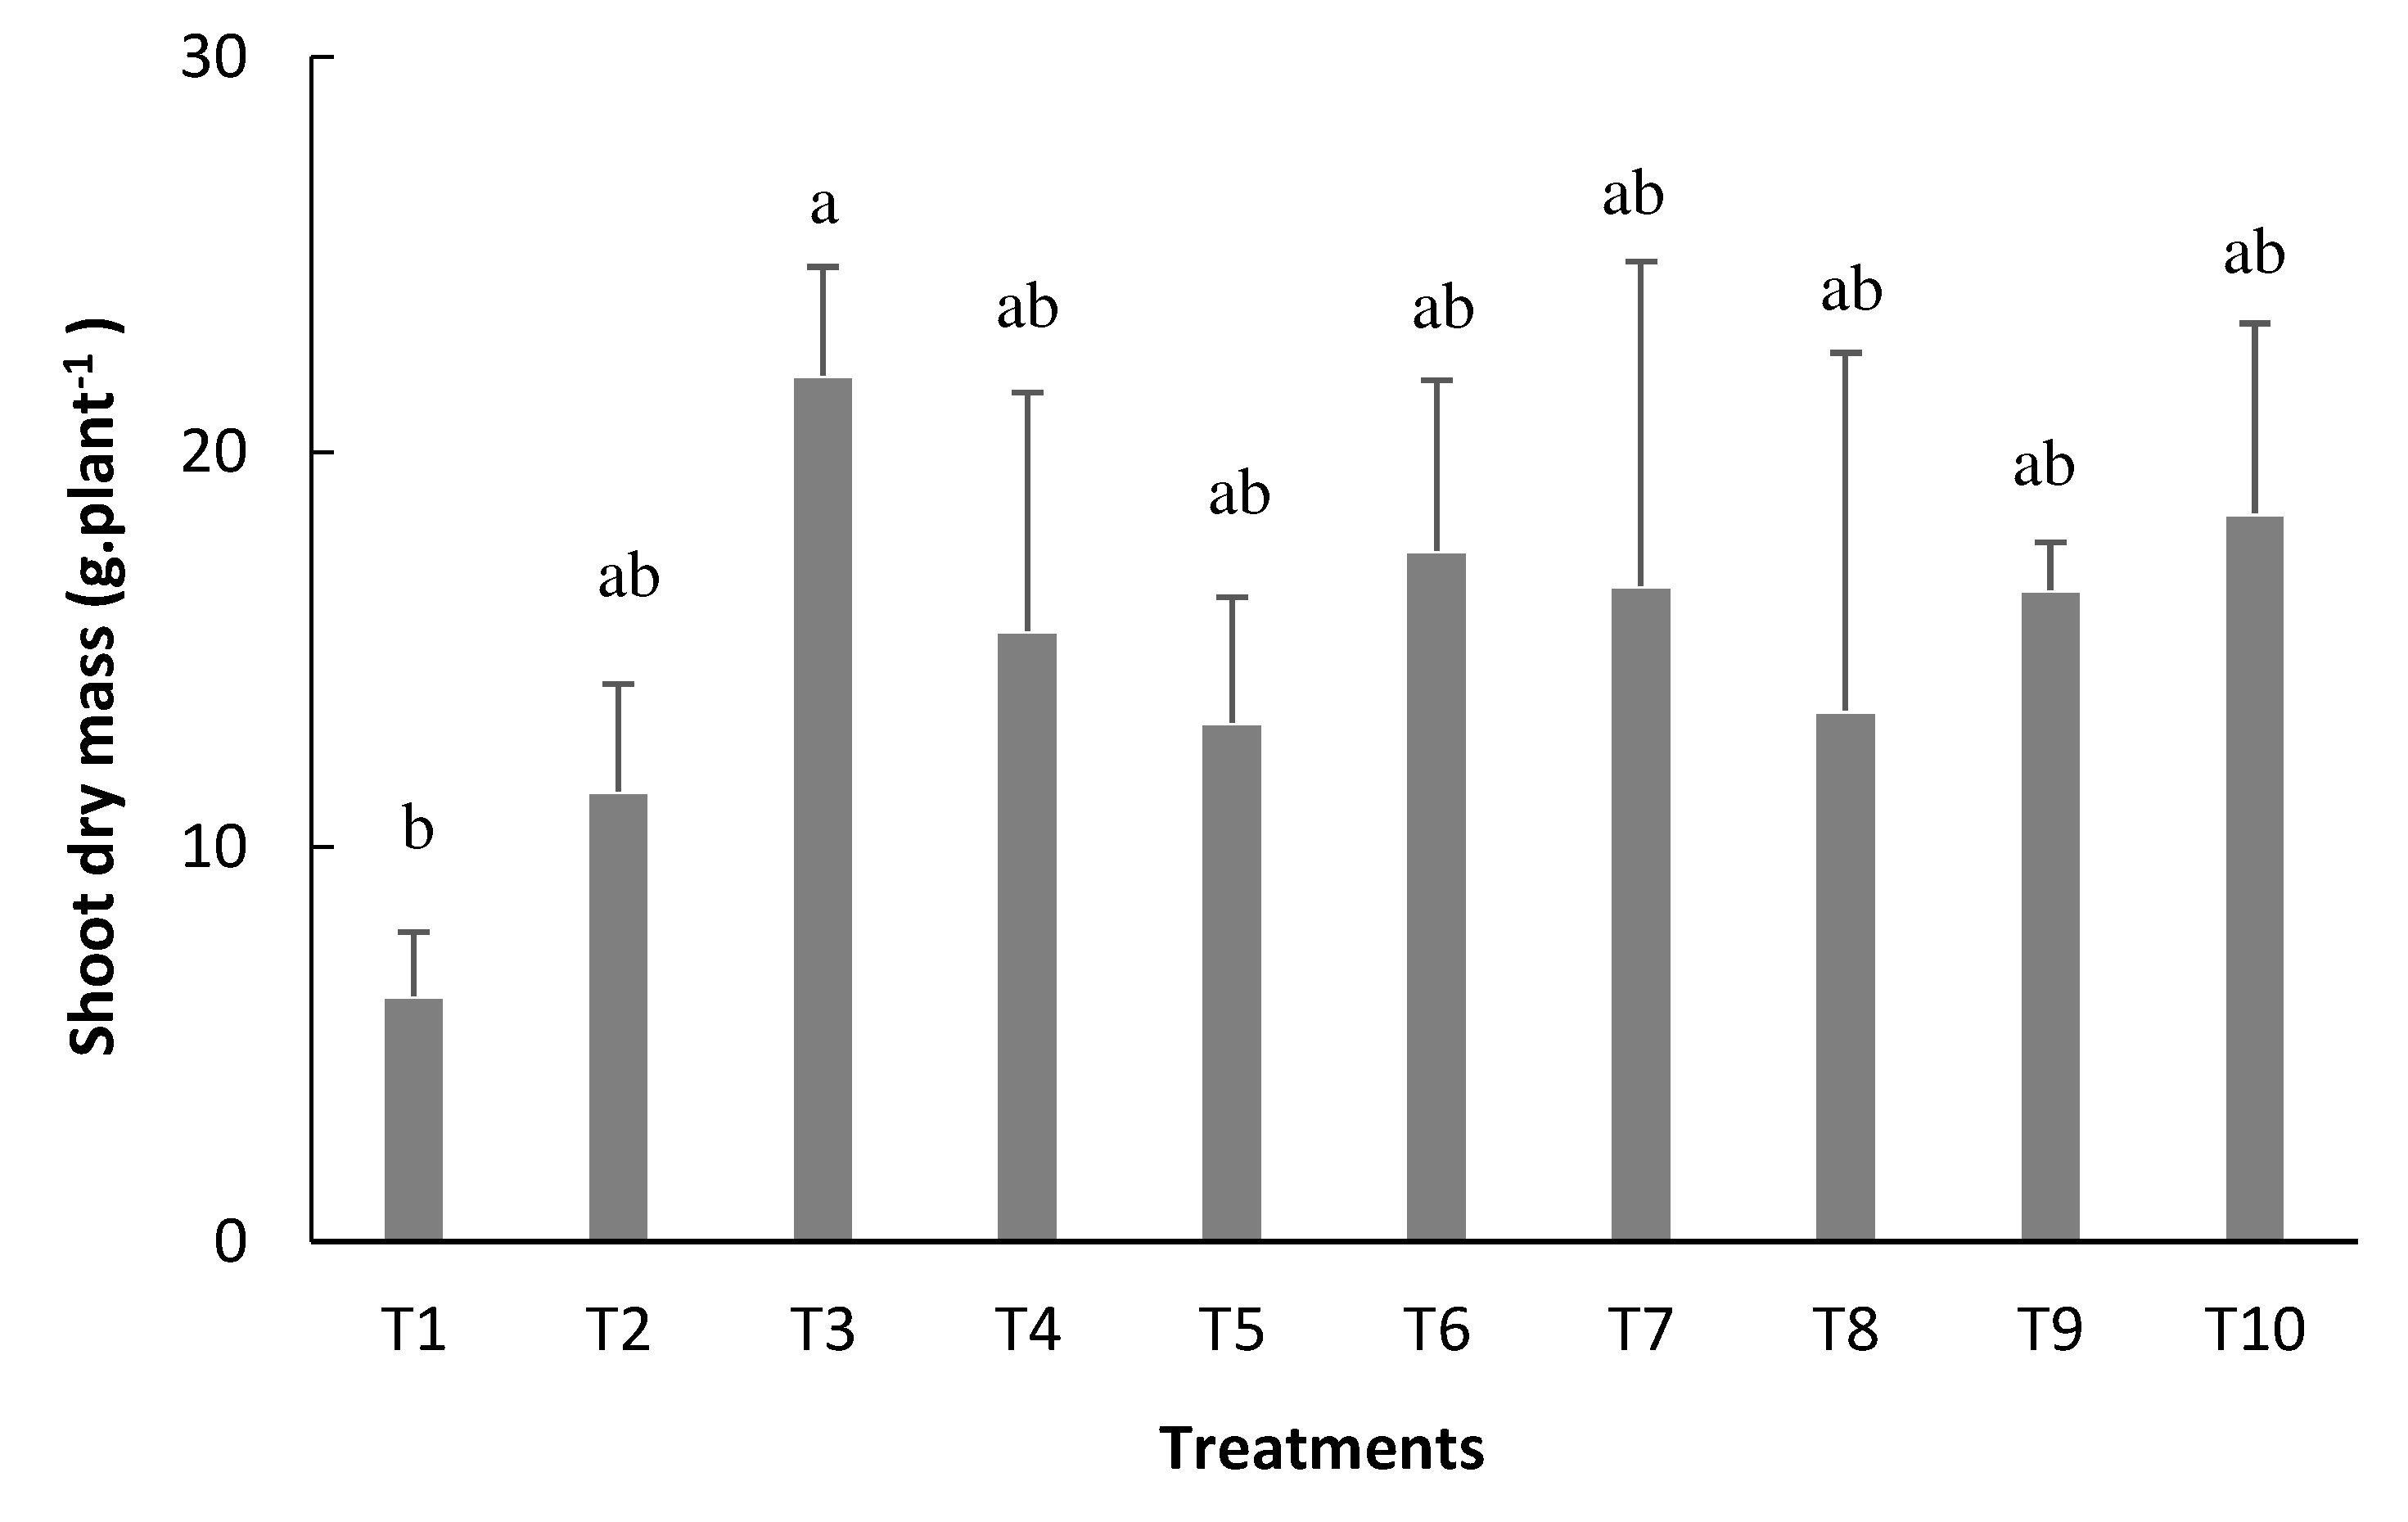
Reinoculated treatment at the V4 stage (T3) presented the highest shoot dry mass average of 21.9g plant
-1 (
Figure 6). The reinoculated treatment at the R5 stage (T4) had 15.4 g plant
-1, and the inoculation just via seed (T2) had an average of 11.42 g plant
-1 (
Figure 6).
The number of pods per plant (NPP), 100-grain weight (W100), and grain yield (YIELD) show a significant effect of the treatments (
Table 3). In contrast to the final stand (FS) and number of grains per pod (NGP) variables, which were not influenced by the treatments.
The final stand of bean plants was not influenced by the treatments and presented mean values that varied between 10 and 12 plants per meter (data not shown), confirming that the tested treatments did not influence the behavior of the data for this variable.
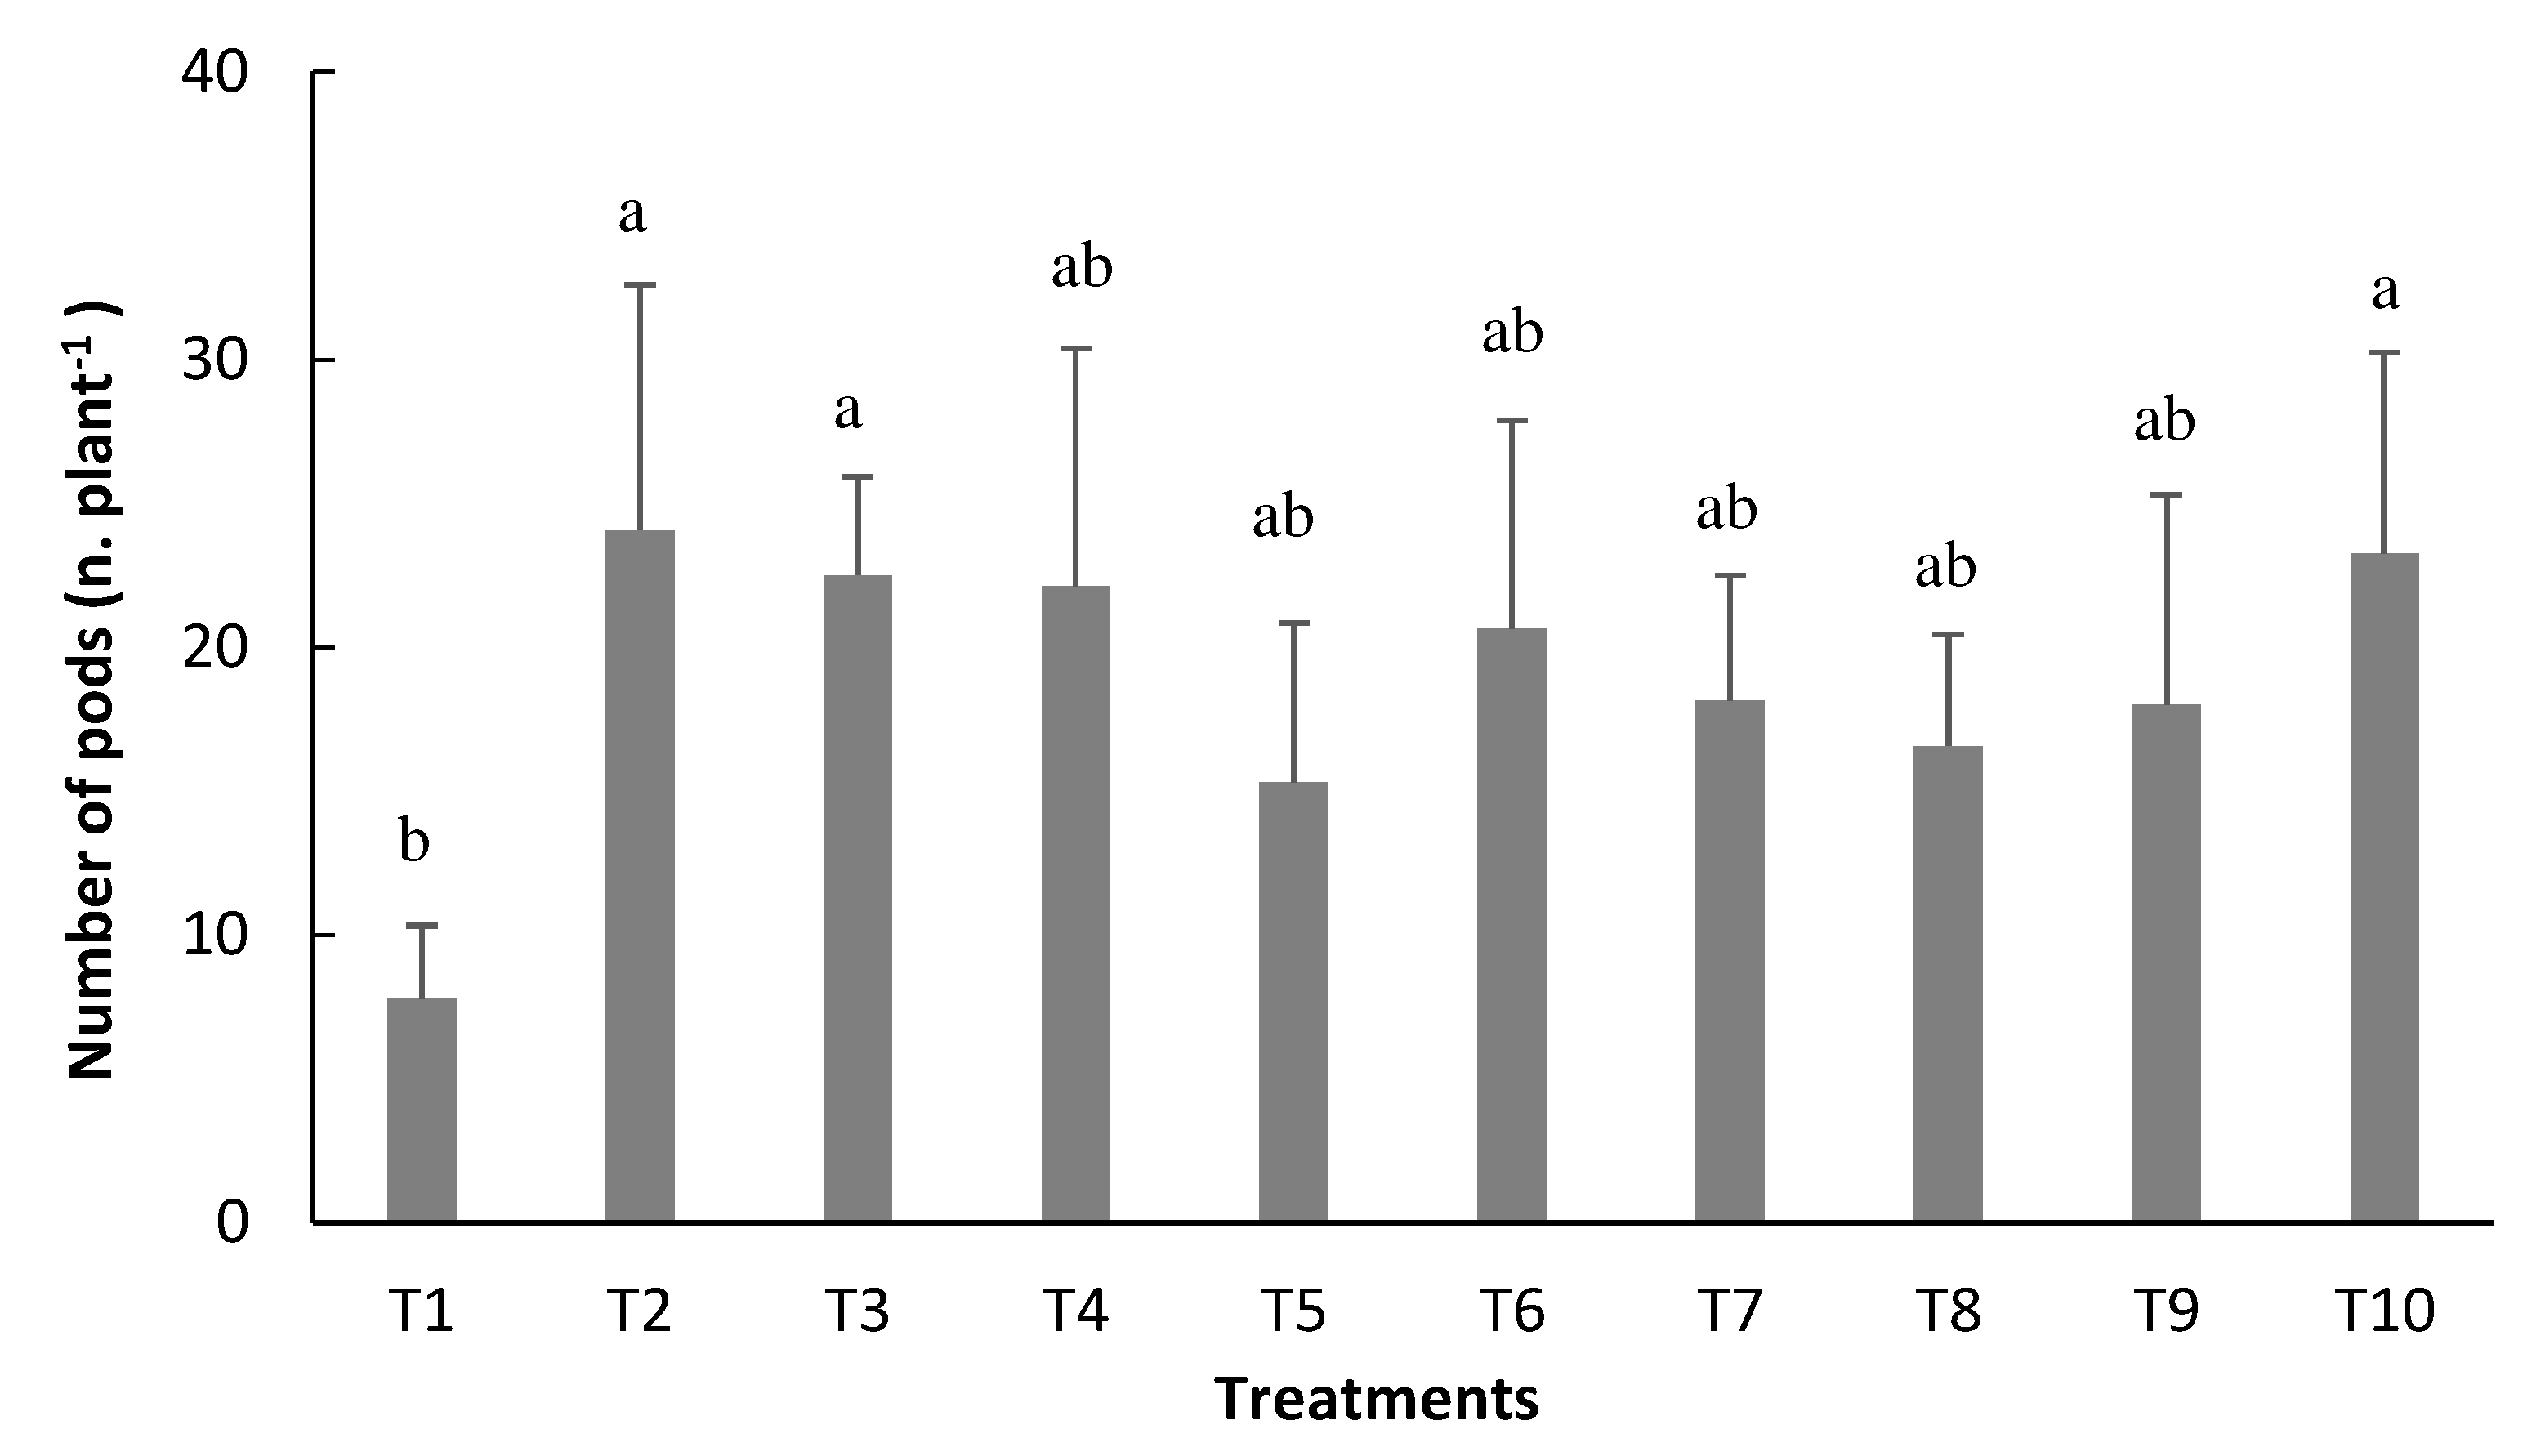
Analysis of variance did not detect significant treatment effects for the number of grains per pod (NGP). Higher averages for the number of pods per plant (NPP) parameter were found in the inoculated treatments, but they did not differ, especially for inoculation via seed (T2) and inoculation via seed with reinoculation at the V4 stage (T3) (
Figure 7), which were statistically equivalent to the treatment with mineral nitrogen fertilizer (T10).
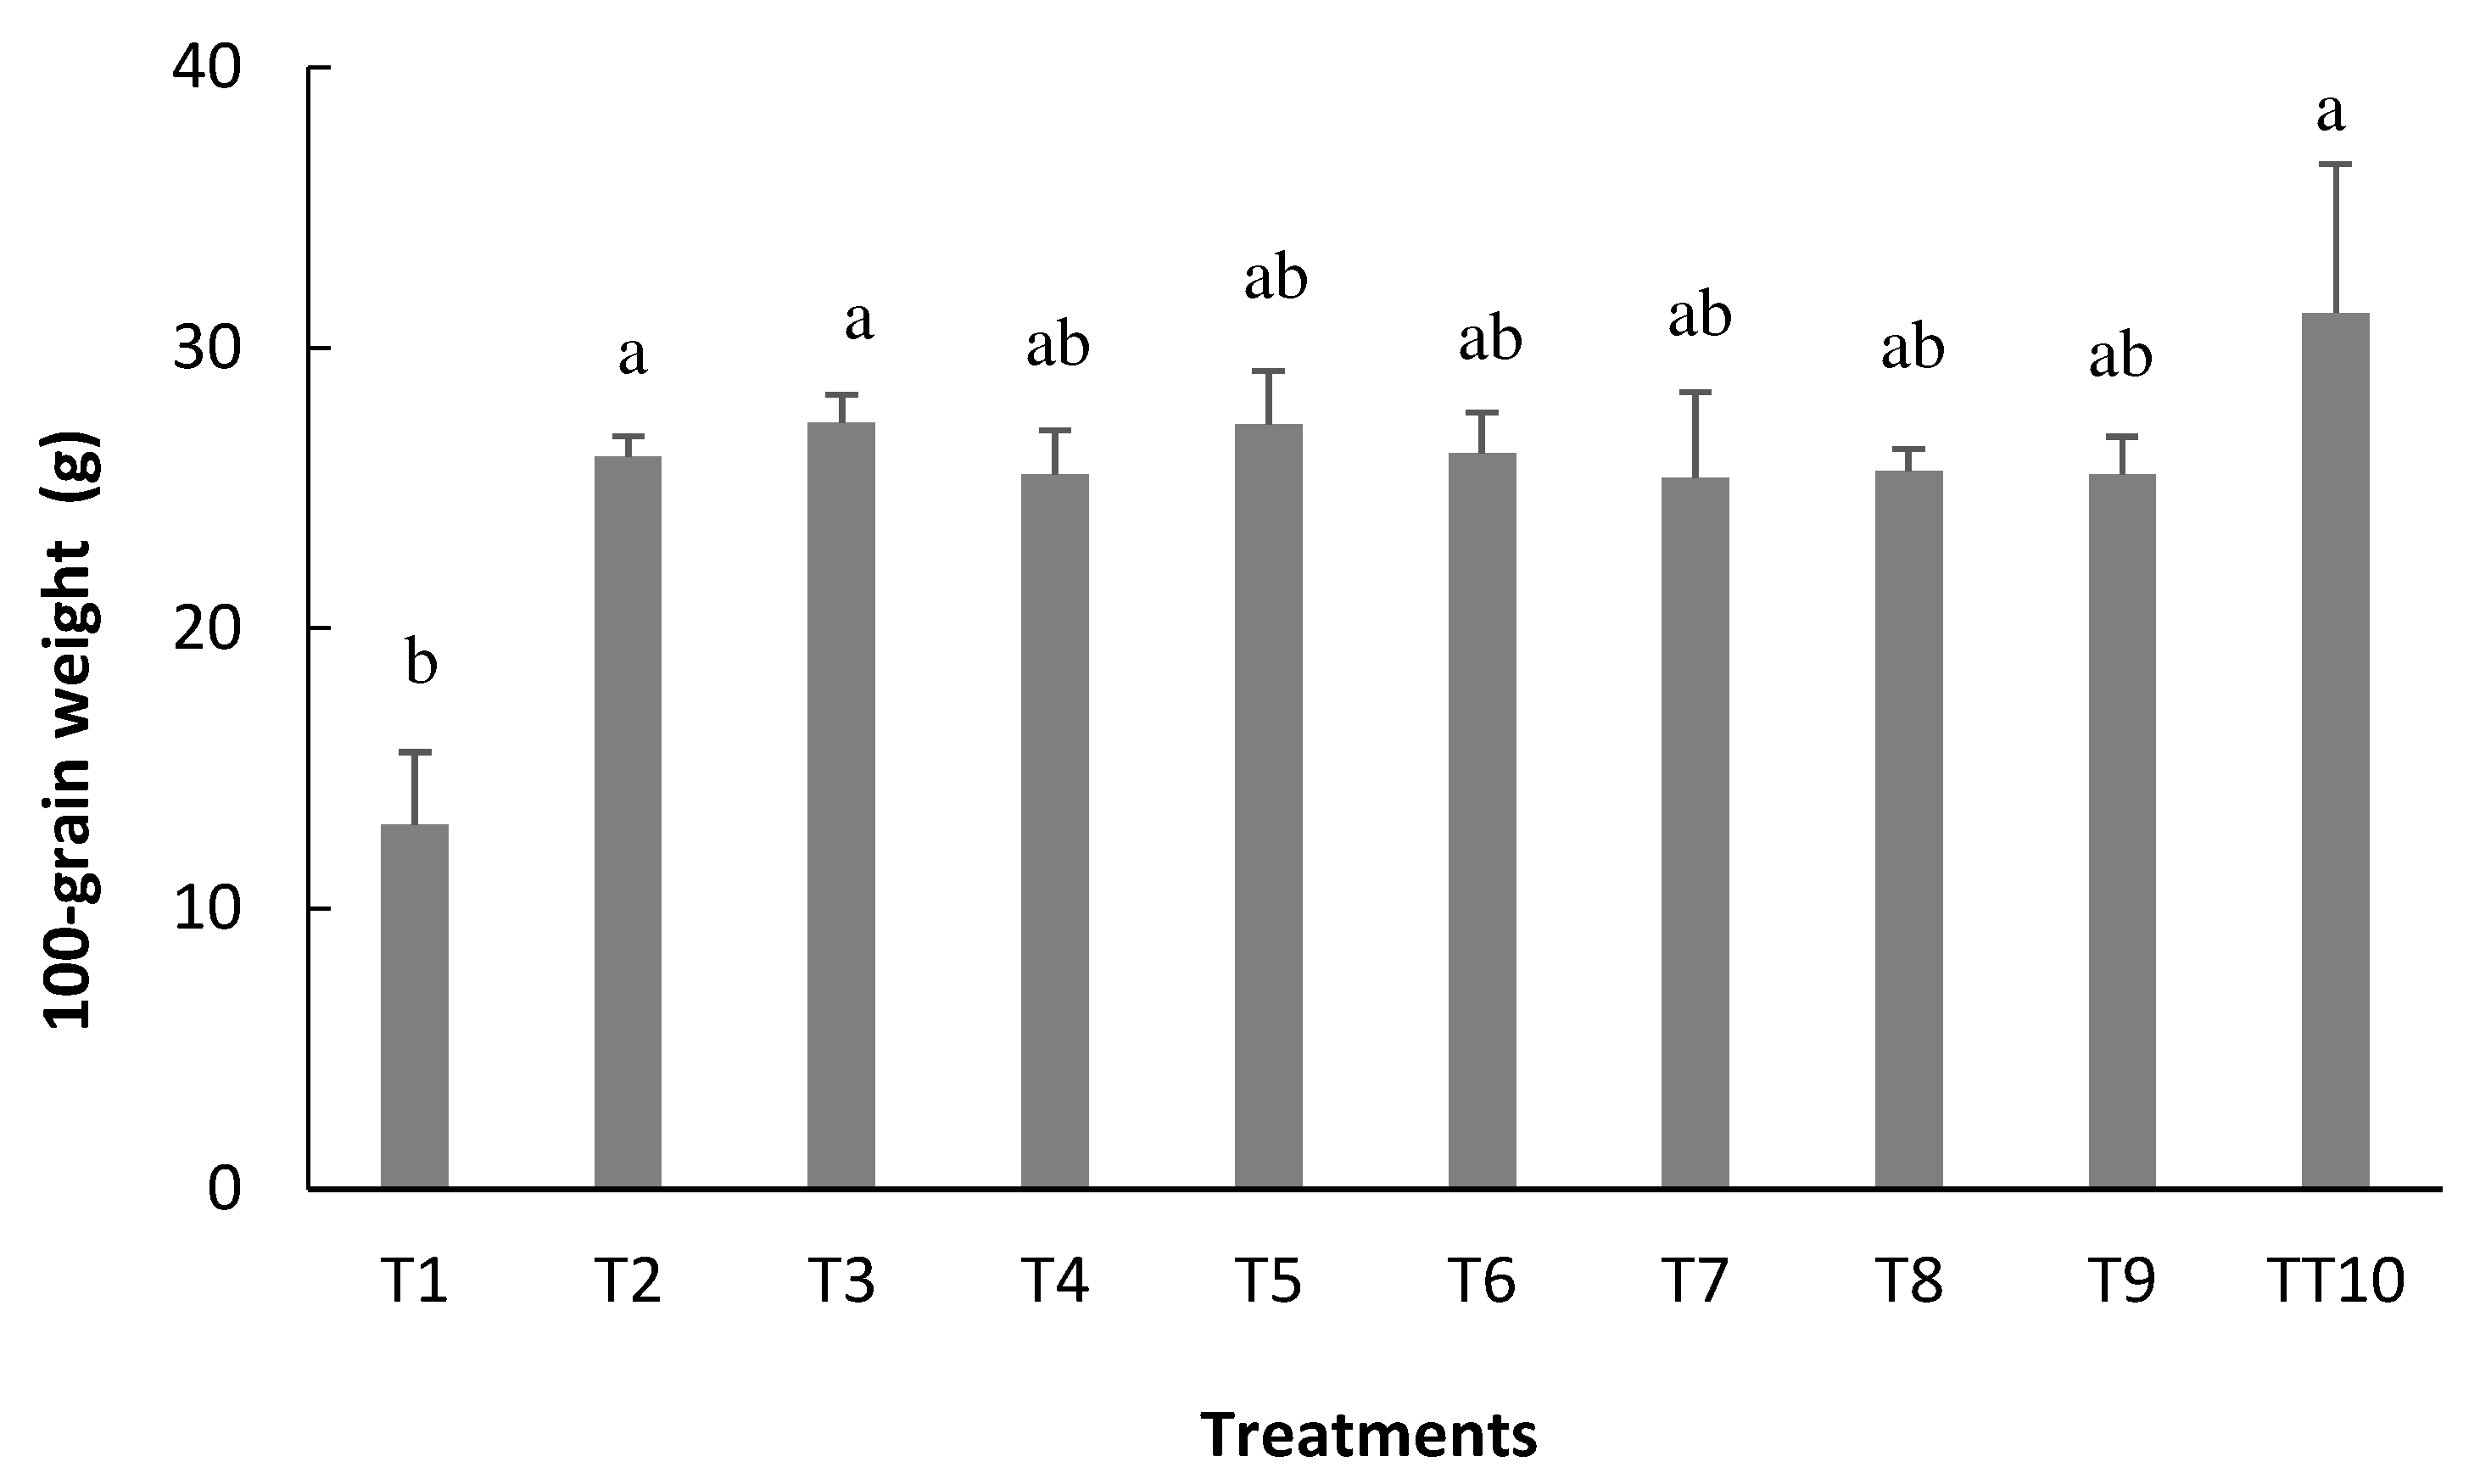
As for one hundred grain weight (W100), which despite being a variable that suffers little influence from the environment, that is, with variation depending on the plant genotype, as well as the NGP, the average values found in this study ranged between 13.0 g and 27.3 g, for treatment that did not receive inoculation (T1) and treatment 3, respectively, the latter being statistically equivalent to T10, which received mineral nitrogen fertilization (
Figure 8).
Following the same trend of its components, the highest grain yield was obtained when inoculation via seed was followed by reinoculation atthe V4 stage (T3), which made it possible to obtain a yield of 3.271 kg ha
-1, the highest found in this study, being 15% higher than treatment with nitrogen formula (T10), but not statistically different from this (
Figure 9).
4. Discussion
It is known that the benefits of symbiosis in bean plants begin between 15 and 20 days after sowing, and there is a decrease in biological nitrogen fixation (BNF) activity from the R5 stage, where reinoculation can promote the maintenance of BNF in periods when this activity begins to decline [
15,
16]. At T1, the population of native bacteria in the soil predominated, with low atmospheric N2 fixation potential, given the low number of nodules produced in that treatment, statistically equal to T10, which used mineral nitrogen fertilizer. Furthermore, as used in the present study, adding mineral N in high doses makes the native fixing bacteria inefficient, thus justifying the low nodulation rate in this treatment.
Based on this context, it can be stated that the non-inoculated treatments showed low nodulation capacity, as previously discussed, contrary to the results of Vieira et al. [
17]and Fullin et al. [
18] who observed nodulation in non-inoculated common bean plants and related the presence of native rhizobia species in the soil. These results can be justified by the greater responsiveness of current bean genotypes to the use of rhizobia, which is more efficient in fixing atmospheric N2 from the
R.tropici species, and which, on the other hand, is less attractive to the bacteria native to soil.It is also noteworthy that the cultivar BRS FC402, due to its indeterminate growth habit (type II) and semi-erect architecture, contributed to the success of reinoculation by spraying in topdressing, allowing the arrival of the product to the soil and subsequently to the root system, enabling the process of infection and formation of nodules.
Despite the non-detection of a significant difference between the treatments that received inoculation, the treatments that received reinoculation in topdressing from the reproductive stage onwards showed a lower nodulation capacity, which can be explained by the proximity of the reinoculations with the phases of greater demand of the plants, which are the flowering and reserve filling phases.
In general, the number of total nodules produced in the present research in the inoculated treatments can be considered high, according to Cardoso et al. [
19], with an average of 15.2 nodules plant
-1, indicating good symbiotic efficiency. However, it is important to emphasize that although the number of nodules formed was considered large, the dry mass of these nodules should also be analyzed since a significant number of nodules with smaller sizes can limit the efficiency of the BNF, because, when very small, may not be able to return properly fixed N to the plants [
20].
In a study conducted by Sales [
21] investigating the ideal time to carry out the reinoculation in topdressing of
Rhizobium tropici in common bean under no-tillage, higher averages were verified for the treatment inoculated in seeds with
R. tropici and reinoculated at V4 or R5 stages, where the reinoculations added to the TN and reflected in a greater NDM. This behavior was not observed in this study since the topdressing reinoculations performed in treatments from T3 to T9 did not show a cumulative effect on this parameter, where only T2 maintained a higher mean value.
Because of this, it can be seen that the inoculation via seed and reinoculation in V4 allowed the maintenance of nodules compared to the treatment that received inoculation only via seed. The reinoculations performed at the other bean growth stages were inefficient in promoting more nodules in evaluations at the R7 stage. It is noteworthy that the Union of the Network of Laboratories for the Recommendation, Standardization, and Dissemination of Microbial Inoculant Technology of Agricultural Interest (RELARE) uses the evaluation of the number of nodules and dry mass of nodules as one of the criteria for evaluating the symbiotic efficiency between rhizobia and Fabaceae [
22,
23].
As for leaf nitrogen content (NC), according to Rosolem [
24], the translocation of nutrients begins in the period of pod formation, where the N, present in the leaves, is directed to the formation of pods and later to the filling of grains. As the sampling in this study took place at the R7 stage, characterized as the period of formation of pods in the common bean, where there is a greater demand for nutrients due to the process of filling grain reserves, NC may have suffered a dilution effect, which occurs with the translocation in the N of the leaf, a place of a higher concentration, to a place of lower concentration (grain filling), thus justifying the non-significance of this parameter when analyzed in leaves. Silva et al. [
25] and Kaneko et al. [
26] also did not observe a significant influence on the leaf nitrogen content in common beans when submitted to treatments with inoculation.
The addition of roots can influence bean yield since the tip of the roots, and the development of piliferous zones increases the plant's water absorption and nutrients, helping their better development [
27]. Capristo et al. [
28], working with common bean under different inoculant doses based on
R. tropici obtained mean taproot length (TRL) values close to those found in this study, for the same inoculant dosage, in analyses carried out at the R6 stage.Since it is the most abundant element in plants and because it participates in processes such as protein synthesis and formation of important nucleotides for cell metabolism, in addition to being present in the composition of proteins, enzymes, and coenzymes, nitrogen becomes a contributor to the growth of the plants, both in the root system and shoot [
29].
Reinoculation at V4 stage (T3) and R5 stage (T4), resulted in highest root dry mass (RDM). This result contradicts what Ramires[
30] found, where the treatment with mineral fertilizer was 25% higher than the inoculated one for the same evaluated parameter.Possibly this result is explained by the greater development of the root system when reinoculation is performed (
Figure 4).It is noteworthy that the RDM is an important parameter to be observed since a more voluminous root system can provide greater absorption of nutrients by the plant due to the greater contact of the root with the soil, thus providing a greater response of the plant regarding its yield potential [
31].
In a study conducted by Sales [
21], it was possible to verify that the reinoculation of
Rhizobiumtropici in common bean influenced the shoot dry mass (SDM) parameter, producing an average of 17.9 g plant
-1 in non-reinoculated treatment; 15.5 g plant
-1 when reinoculated at V4 stage and 16.6 g plant
-1 when reinoculated atthe R5 stage
The variation found for the final stand (FS) is small and does not influence the bean grain yield, even in the smallest stand, because the bean plants compensate for the existing spaces. Furthermore, an FS between 10 and 12 plants per meter, in combination with a spacing of 0.5 m, allows obtaining 200 to 220 thousand plants ha
-1, close, therefore, to the population of 240 thousand plants ha-1, considered suitable for the bean crop according to reports by Araújo [
32].
Treatments did not affect the number of grains per pod. As this characteristic is more intrinsically linked to the genotypic characteristics, being little influenced by the environment, the non-significant result of the treatments applied in this study can be justified, and, normally, these values are between 4 and 5 grains per pod [
33]; values found in the present study (data not shown).
The production of pods per plant (NPP) was higher when using inoculation via isolated seed (T1), or with reinoculation at stage V4 (T3) and mineral fertilization (T10). Contrary to the results of Andrade et al. [
34], when stating that the N supplied in mineral form, both in sowing and in topdressing, results in a higher NPP, compared to the inoculated treatment.On the other hand, the control (T1) provided the lowest average of NPP, confirming that the native bacteria in the soil could not supply the necessary N for the good development of the bean crop. The satisfactory supply of N by the BNF process, with emphasis on treatments 2 and 3, certainly enabled the supply of this nutrient in adequate amounts, ensuring greater production of flowers and, consequently, greater production of pods, corroborating reports by Portes[
15].
The highest NPP found in these treatments, around 24 pods per plant, is higher than the average value of Hawerrothet al. [
35] in their study with inoculation with
Rhizobium for the cultivar Carioca, where they obtained an average of 22 pods per plant. It should be noted that, among the yield components, NPP is the one that most influences bean grain yield [
23]. Furthermore, in a study carried out by Fonseca et al. [
36] with eight cultivars of common bean and two strains of
Rhizobium, it was possible to verify the dependence of the strain used on the number of pods per plant. In contrast, Ferreira et al. [
37] state that the number of pods per plant is more closely related to the cultivar and that it does not suffer interference from the strain used in the inoculation. It is noteworthy that, regardless of the choice of strain and cultivar in the NPP analysis, we can observe significant increases in this parameter when inoculation is performed, ensuring statistical equivalence with mineral nitrogen fertilization.
It is noteworthy that the treatments that received inoculation and T10 presented average values of 25g, close to the parameter of cultivar BRS FC402, which is 26g. According to Silva et al. [
38], this small difference can be attributed to the management employed and the environmental conditions, which can influence the final result for this parameter. According to reports by Fageria et al. [
39], all yield components must reach their maximum levels and proper balance to achieve maximum bean grain yield.
Figure 1.
Meteorological data during the rainy season of the 2020/2021 harvest. Anápolis/GO, INMET.
Figure 1.
Meteorological data during the rainy season of the 2020/2021 harvest. Anápolis/GO, INMET.
Figure 2.
Total nodules (TN) of bean plants depending on the treatments: T1=uninoculated control; T2=inoculation via seed (VS); T3=VS + reinoculation at the V4 stage; T4=VS + reinoculation at the R5 stage; T5=VS + reinoculation at the R6 stage; T6=VS + reinoculation in at V4 and R5 stages; T7=VS + re-inoculation at V4 and R6 stage; T8=VS + reinoculation at R5 and R6 stages; T9=VS + reinoculation at V4, R5, and R6 stages, and T10=mineral nitrogen fertilization. Means followed by the same letter do not differ by the Tukey test at 5% probability.
Figure 3.
Dry mass of nodules (NDM) of bean plants depending on the treatments: T1=uninoculated control; T2=inoculation via seed (VS); T3=VS + reinoculation at the V4 stage; T4=VS + reinoculation at the R5 stage; T5=VS + reinoculation at the R6 stage; T6=VS + reinoculation in at V4 and R5 stages; T7=VS + re-inoculation at V4 and R6 stage; T8=VS + reinoculation at R5 and R6 stages; T9=VS + reinoculation at V4, R5, and R6 stages, and T10=mineral nitrogen fertilization. Means followed by the same letter do not differ by the Tukey test at 5% probability.
Figure 4.
Taproot length (TRL) of bean plants depending on the treatments: T1=uninoculated control; T2=inoculation via seed (VS); T3=VS + reinoculation at the V4 stage; T4=VS + reinoculation at the R5 stage; T5=VS + reinoculation at the R6 stage; T6=VS + reinoculation in at V4 and R5 stages; T7=VS + re-inoculation at V4 and R6 stage; T8=VS + reinoculation at R5 and R6 stages; T9=VS + reinoculation at V4, R5, and R6 stages, and T10=mineral nitrogen fertilization. Means followed by the same letter do not differ by the Tukey test at 5% probability.
Figure 5.
Root dry mass (RDM) of bean plants depending on the treatments: T1=uninoculated control; T2=inoculation via seed (VS); T3=VS + reinoculation at the V4 stage; T4=VS + reinoculation at the R5 stage; T5=VS + reinoculation at the R6 stage; T6=VS + reinoculation in at V4 and R5 stages; T7=VS + re-inoculation at V4 and R6 stage; T8=VS + reinoculation at R5 and R6 stages; T9=VS + reinoculation at V4, R5, and R6 stages, and T10=mineral nitrogen fertilization. Means followed by the same letter do not differ by the Tukey test at 5% probability.
Figure 6.
Shoot dry mass (SDM) of bean plants depending on the treatments: T1=uninoculated control; T2=inoculation via seed (VS); T3=VS + reinoculation at the V4 stage; T4=VS + reinoculation at the R5 stage; T5=VS + reinoculation at the R6 stage; T6=VS + reinoculation in at V4 and R5 stages; T7=VS + re-inoculation at V4 and R6 stage; T8=VS + reinoculation at R5 and R6 stages; T9=VS + reinoculation at V4, R5, and R6 stages, and T10=mineral nitrogen fertilization. Means followed by the same letter do not differ by the Tukey test at 5% probability.
Figure 7.
Number of pods per plant (NPP) of beandepending on the treatments: T1=uninoculated control; T2=inoculation via seed (VS); T3=VS + reinoculation at the V4 stage; T4=VS + reinoculation at the R5 stage; T5=VS + reinoculation at the R6 stage; T6=VS + reinoculation in at V4 and R5 stages; T7=VS + re-inoculation at V4 and R6 stage; T8=VS + reinoculation at R5 and R6 stages; T9=VS + reinoculation at V4, R5, and R6 stages, and T10=mineral nitrogen fertilization. Means followed by the same letter do not differ by the Tukey test at 5% probability.
Figure 8.
100-grain weight (W100) of bean plants depending on the treatments: T1=uninoculated control; T2=inoculation via seed (VS); T3=VS + reinoculation at the V4 stage; T4=VS + reinoculation at the R5 stage; T5=VS + reinoculation at the R6 stage; T6=VS + reinoculation in at V4 and R5 stages; T7=VS + re-inoculation at V4 and R6 stage; T8=VS + reinoculation at R5 and R6 stages; T9=VS + reinoculation at V4, R5, and R6 stages, and T10=mineral nitrogen fertilization. Means followed by the same letter do not differ by the Tukey test at 5% probability.
Figure 9.
Grain yield (YIELD) of bean plants depending on the treatments: T1=uninoculated control; T2=inoculation via seed (VS); T3=VS + reinoculation at the V4 stage; T4=VS + reinoculation at the R5 stage; T5=VS + reinoculation at the R6 stage; T6=VS + reinoculation in at V4 and R5 stages; T7=VS + re-inoculation at V4 and R6 stage; T8=VS + reinoculation at R5 and R6 stages; T9=VS + reinoculation at V4, R5, and R6 stages, and T10=mineral nitrogen fertilization. Means followed by the same letter do not differ by the Tukey test at 5% probability.
Table 1.
Summary of analysis of variance for total nodules (TN) and dry mass of nodules (NDM) of bean plants.
Table 1.
Summary of analysis of variance for total nodules (TN) and dry mass of nodules (NDM) of bean plants.
| Scheme . |
D.F |
Mean Square |
|
|
|
|
|
|
| TN |
NDM |
TRL |
RDM |
PH |
SDM |
NC |
SD |
| Treatment |
9 |
169.37** |
0.021** |
56.556** |
5.983** |
614.450ns
|
74.275* |
0.205ns
|
1.251ns
|
| Block |
3 |
94 |
0.017 |
28.677 |
1.748 |
142.35 |
6.829 |
0.095 |
0.934 |
| Residue |
27 |
34.14 |
0.003 |
7.732 |
1.872 |
305.9 |
27.764 |
0.154 |
0.604 |
| C.V(%) |
|
38.4 |
33.9 |
11.7 |
25.8 |
17.7 |
34.9 |
7.4 |
14.1 |
Table 3.
Summary of the analysis of variance for the number of pods per plant (NPP), number of grains per pod (NGP), 100-grain weight (W100), grain yield (YIELD), and final stand (FS) of bean plants.
Table 3.
Summary of the analysis of variance for the number of pods per plant (NPP), number of grains per pod (NGP), 100-grain weight (W100), grain yield (YIELD), and final stand (FS) of bean plants.
| Sources of variation |
D.F |
Mean Square |
| NPP |
NGP |
W100 |
YIELD |
FS |
| Treatment (T) |
8 |
95.81* |
0.1652ns
|
195.39** |
2221299.5** |
3.5583ns
|
| Block |
3 |
52.95 |
0.0036 |
89.26 |
350187.91 |
5.7583 |
| Residue |
24 |
36.09 |
0.1502 |
15.68 |
280791.7 |
3.3509 |
| C.V(%) |
|
21.8 |
7.6 |
11.5 |
25.3 |
18.6 |
