Preprint
Article

Impact of Inflammation on the In Vivo Activity of the Renal Transporters OAT1/3 in Pregnant Women Diagnosed with Acute Pyelonephritis

Submitted:

29 August 2023

Posted:

31 August 2023

You are already at the latest version

A peer-reviewed article of this preprint also exists.

Abstract
Inflammation can regulate hepatic drug metabolism enzymes and transporters. The impact of inflammation on renal drug transporters remains to be elucidated. We aimed to quantify the effect of inflammation (caused by acute pyelonephritis) on the in vivo activity of renal OAT1/3, using the probe drug furosemide. Pregnant women (2nd or 3rd trimester) received a single oral dose of furosemide 40 mg during acute pyelonephritis (Phase 1; n = 7) and after its resolution (Phase 2; n = 7; by treatment with intravenous cefuroxime 750 mg TID for 3-7 days), separated by 10 to 14 days. IL-6, IFN-γ, TNF-α, MCP-1, and C-reactive protein plasma concentrations were higher in Phase I vs Phase II. The pregnant women had a lower geometric mean [CV%] furosemide CLsecretion (3.9 [43.4] vs 6.7 [43.8] L/h) and formation clearance to the glucuronide (1.1 [85.9] vs 2.3 [64.1] L/h) in Phase 1 vs. Phase 2. Inflammation reduced the in vivo activity of renal OAT1/3 (mediating furosemide CLsecretion) and UGT1A9/1A1 (mediating the formation of furosemide glucuronide) by approximately 40% and 54%, respectively, presumably by elevating plasma cytokine concentrations. The dosing regimens of narrow therapeutic window OAT drug substrates may need to be adjusted during inflammatory conditions.
Keywords: 
Subject: 
Medicine and Pharmacology  -   Pharmacology and Toxicology

1. Introduction

Substantial evidence indicates that inflammation plays a crucial role in the regulation of drug-metabolizing enzymes and transporters (DMET). In vitro and animal studies have demonstrated that increased plasma concentrations of multiple cytokines such as interleukin (IL) 6, tumor necrosis (TNF) α, and interferon (IFN) γ, can alter the expression and/or activity of DMET [1,2,3]. However, these studies do not mimic physiological inflammatory conditions in humans, making it difficult to translate the findings to changes in the in vivo pharmacokinetics (PK) of drugs in humans. To date, the impact of inflammation on the in vivo PK of drugs has focused primarily on drugs cleared by CYP enzymes [4] and not on those drugs cleared by transporters. In addition, with respect to the latter, studies have primarily focused on hepatic or intestinal transporters [5,6,7]. To date, there are no studies on the impact of inflammation on the in vivo activity of renal transporters.
Acute pyelonephritis results in inflammation caused by pro-inflammatory cytokines. For example, in non-pregnant women with acute pyelonephritis, the plasma concentrations of the pro-inflammatory cytokines IL-6 and IL-8, TNF-α and protein C reactive (CRP) [8,9,10] can reach 2 to 75 times the concentrations in healthy pregnant and non-pregnant women [8,9,10]. Acute pyelonephritis results from ascending urinary tract infection (UTI) which is caused mostly by intestinal flora gram-negative bacteria Escherichia coli, but also by the bacteria of the Enterobacter and Proteus and by the gram-positive bacteria of the genus Streptococcus group B [11]. Despite a relatively low prevalence during pregnancy (1-2%), acute pyelonephritis is one of the most common causes of prenatal hospitalization, which can lead to maternal-fetal death and is the primary cause of septic shock in pregnant women [11]. The treatment of acute pyelonephritis requires hospitalization and the use of antibiotics to resolve the condition and to prevent progression to septicemia [11].
The primary goal of this study was to study the impact of inflammation, caused by acute pyelonephritis (in pregnant women), on the renal secretion clearance of furosemide, a renal organic anion transporters (OAT)1/3 probe. Since UGT1A9 and UGT1A1 mediate the formation of furosemide glucuronide[12,13], which is excreted unchanged in the urine, our secondary goal was to evaluate the effect of inflammation on the in vivo activity of these two enzymes.

2. Materials and Methods

2.1. Clinical Study

The research protocols were conducted according to the guidelines of the Declaration of Helsinki and approved by the Research Ethics Committee of the School of Medicine of Ribeirão Preto from the University of São Paulo (HCFMRP-USP) and by the Brazilian Registry of Clinical Trials (ReBEC, http://www.ensaiosclinicos.gov.br) under ID number RBR-4npsyxz. All participants received a detailed explanation about the purpose of the study, its duration, the procedures, and possible risks involved. Informed consent was obtained from all subjects involved in the study. Participants were free to refuse to participate or withdraw their consent at any stage of the research, without penalty or prejudice to their care and/or treatment.
Pregnant women, aged over 18 years, diagnosed with acute pyelonephritis and with indications for treatment with antibiotics were investigated. The acute pyelonephritis diagnosis was based on clinical (costovertebral angle tenderness, fever, general malaise) and laboratory (pyuria, positive nitrite in urine, and urine culture showing at least 10,000 colony-forming units) exams. The participants were excluded from the study if they presented at least one of the following conditions: chronic renal failure, hypertensive syndromes (chronic arterial hypertension and/or pre-eclampsia), chronic fetal distress, or other inflammatory conditions. Participants were excluded from the protocol if they used drugs that inhibit OAT 1/3.
The clinical protocol was divided into 2 Phases (Figure 1). In Phase 1, after the patient's diagnosis and indication of antibiotic treatment by the medical team, 2 mL of heparinized blood containing EDTA was collected to quantify the plasma concentration of cytokines. Anthropometric, biochemical, and hematological assessments were routinely performed by the local hospital, and such data were subsequently accessed via electronic medical records. After administration of the first dose of antibiotic (intravenous cefuroxime, 750 mg, TID), the pregnant women received a single oral dose of 40 mg of furosemide with 200 mL of water. Serial blood samples were collected before and after administration of furosemide at 30 min, 1; 1.5; 2; 4; 6; 8; 10; 12; 16, and 24 h [14]. Blood samples were centrifuged, and plasma was stored at -80 ºC. Urine was collected over 0-24 h, the pH was immediately adjusted to 4-5 to avoid hydrolysis of furosemide glucuronide [15] and the volume was measured. Aliquots (10 mL) of urine were separated and stored at -80 ºC. According to the local hospital protocol, after continued treatment with intravenous cefuroxime (TID for 3 to 7 days) and after showing improvement in the clinical condition, the pregnant women were discharged from the hospital and continued the treatment with oral cefuroxime (250 mg, TID) for 10-14 days.
After the end of cefuroxime treatment, the resolution of acute pyelonephritis was confirmed, and the second phase of the protocol was carried out within the shortest possible time so that the pregnant women were in the same trimester of pregnancy as in Phase 1. In Phase 2, the pregnant women received a single oral dose of 40 mg of furosemide with 200 mL of water. Similar to Phase I, blood and urine samples were collected to determine furosemide pharmacokinetics, for the quantification of plasma cytokines, and for biochemical and hematological assessments.

2.2. Power Analysis

The sample size was calculated based on furosemide pharmacokinetics in healthy volunteers administered a single dose (40 mg, PO) of furosemide [16]. This calculation indicated that to observe a difference of at least 40 % in the renal secretion clearance (CLsecretion) of furosemide at p < 0.05 and power >80%, 7 participants would be needed to study in a pairwise fashion.

2.3. Analyses of Furosemide and Furosemide-Glucuronide in Plasma, Urine, and Plasma Ultrafiltrate

Furosemide and its glucuronide metabolite (FUR-GLU) concentrations in the plasma, urine and the ultrafiltrate (from protein binding studies) were quantified by liquid chromatography coupled to tandem mass spectrometry (LC/MS), as developed, and validated by us [17]. Briefly, 50 µL of plasma, urine, or ultrafiltrate were used for analyses. The plasma samples were analyzed by acidified liquid-liquid extraction, while urine and plasma ultrafiltrate were simply diluted with the mobile phase. The ultrafiltrate was obtained after centrifuging 200 µL of plasma through the Centrifree® Ultrafiltration Device (Millipore Corp., Carrigtwohill, Ireland) as follows. The samples were centrifuged at 1875 × g for 40 min in a centrifuge with a fixed-angle rotor (angle of 36°) (Model NT 825, Nova Técnica, Piracicaba, Brazil). The calibration lines of total and unbound furosemide analysis were linear in the range of 0.50 – 2.500 and 0.125 – 250 ng/mL, respectively. Additionally, calibration lines for furosemide and FUR-GLU in urine were linear in the range 50 – 20,000 ng/mL. The coefficients of variation and the relative standard errors of the standard curve and quality control samples were lower than 15 %.

2.4. Quantification of Plasma Cytokine Concentrations

Blood samples of all participants enrolled in this study were stored at 4 ºC and centrifuged (2500×g, 10 min, 4 °C) within 2 h of collection. The harvested plasma samples were stored at −80 °C until analysis. A broad panel of cytokines was evaluated, including IFN-γ, IL-1β, IL-2, IL-6, IL-8, IL-10, IL-12p40, IL-12p70, TNF-α, monocyte chemoattractant protein (MCP) 1 and CRP. Fifty microliters of undiluted freshly thawed plasma and 25 µL freshly thawed plasma diluted 1:40,000 were used for cytokines and CRP analyses, respectively. These samples were analyzed using a 96-well plate assay, as per the manufacturer’s instructions, using the Luminex® xMAP® magnetic bead platform (Milliplex Map Human Cytokine Panel; Millipore, Billerica, USA). Standards provided by the manufacturer were assayed in duplicates to generate calibration lines in the range of 3.2 to 10,000 pg/mL for each cytokine and 0.01 to 50 ng/mL. The coefficients of variation and the relative standard errors of the standard curve and quality control samples were <15 %.

2.5. Pharmacokinetic Analyses

Furosemide pharmacokinetic parameters were estimated by non-compartmental analyses using Phoenix WinNonlin®, version 8.3.4.295 (Certara USA, Inc., Princeton, EUA). The parameters, maximum plasma concentration (Cmax) and the time to Cmax (Tmax), were documented. The area under the plasma concentration-time curve (AUC) was calculated using the linear trapezoidal rule and extrapolated to infinite by Clast/Kel, where Clast is the last predicted plasma concentration based on terminal elimination rate (Kel) estimated from log-linear regression of the last four data points. The unbound fraction of furosemide (fu) in plasma was determined by the ratio of unbound plasma concentration and the total plasma concentration in the Cmax samples (furosemide plasma protein binding has been documented to be concentration-independent) [18]. Furosemide oral clearance (CL/F) was estimated as CL/F = dose/AUC and the renal clearance (CLrenal) was estimated as CLrenal = Ae/AUC0-24h, where Ae is the amount of furosemide excreted unchanged into the urine over 24 h (the half-life of furosemide in our study and in others was 3-5 h [14,16]). The CLsecretion was estimated as CLsecretion = CLrenalfu × creatinine clearance (CrCL), where CrCL was estimated by the Cockcroft-Gault equation and the participant’s actual body weight [19], a recommended approach to evaluate CrCL in pregnant women. Non-renal clearance (CL/Fnon-renal) was estimated as CL/Fnon-renal = CL/F – CLrenal. Finally, the formation clearance to the metabolite FUR-GLU (CLformation, FUR-GLU) was estimated as the AeFUR-GLU/AUC0-24, furosemide where the AeFUR-GLU is the amount of furosemide excreted as FUR-GLU (i.e. the total amount of FUR-GLU recovered in the urine multiplied by the ratio furosemide/FUR-GLU molecular weight). This estimation assumes that over 24 h, most, if not all the metabolite formed in the body is recovered in the urine, with minimal non-renal excretion or sequential metabolism.

2.6. Statistical Analyses

The normality of the log-transformed data was accessed by the Shapiro-Wilk statistical test. Normally distributed parameters were compared by Student’s t-test and are shown as geometric mean and 90% confidence interval, whereas non-normally distributed parameters were compared by Wilcoxon test and are shown as median (interquartile range) [20]. Also, the 90% confidence interval of the ratio (presence vs. absence of acute pyelonephritis) of geometric means of the furosemide CLrenal, CLsecretion, CLformation, FUR-GLU was computed. If this 90% confidence interval fell within the 0.8 – 1.25 range (i.e., the bioequivalence range), the groups were considered not significantly different [20]. Statistical analyses were performed using the software R (https:// www.r-proje ct.org/) version 4.2.0.

3. Results

Seven pregnant women treated for acute pyelonephritis participated in both Phase I and II of the study. Though an additional 3 women participated in Phase 1, they did not participate in Phase II. Since our goal was paired comparison, they were excluded from all data analyses. Most of the participants were in their third trimester (5 out of 7; see Table 1 for pregnant women demographic, biochemical, and hematological parameters). Higher median concentrations of CRP and plasma cytokines were observed during Phase I when compared to Phase II for IL-6, IFN-γ, TNF-α, MCP-1, but not for the other cytokines (Table 2).
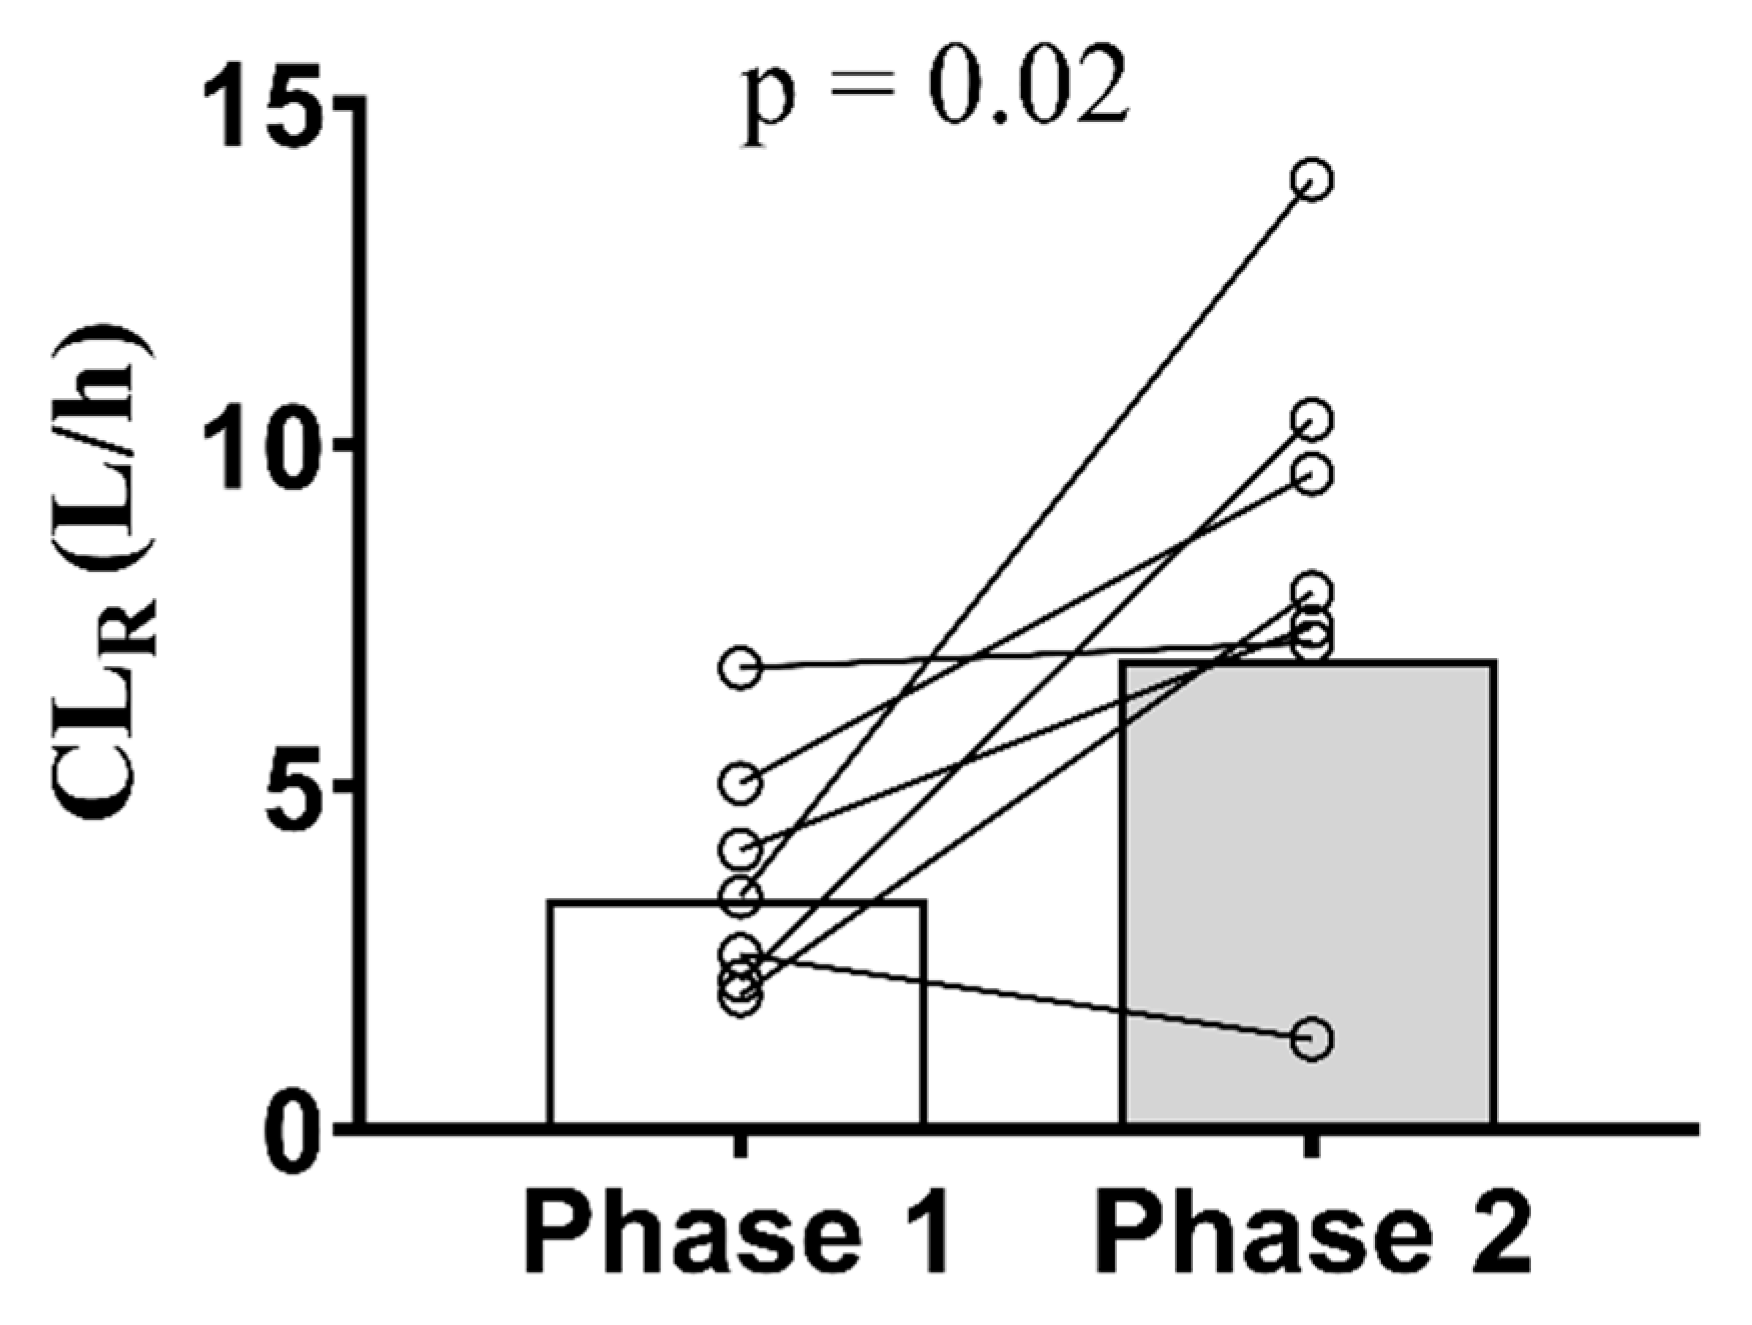
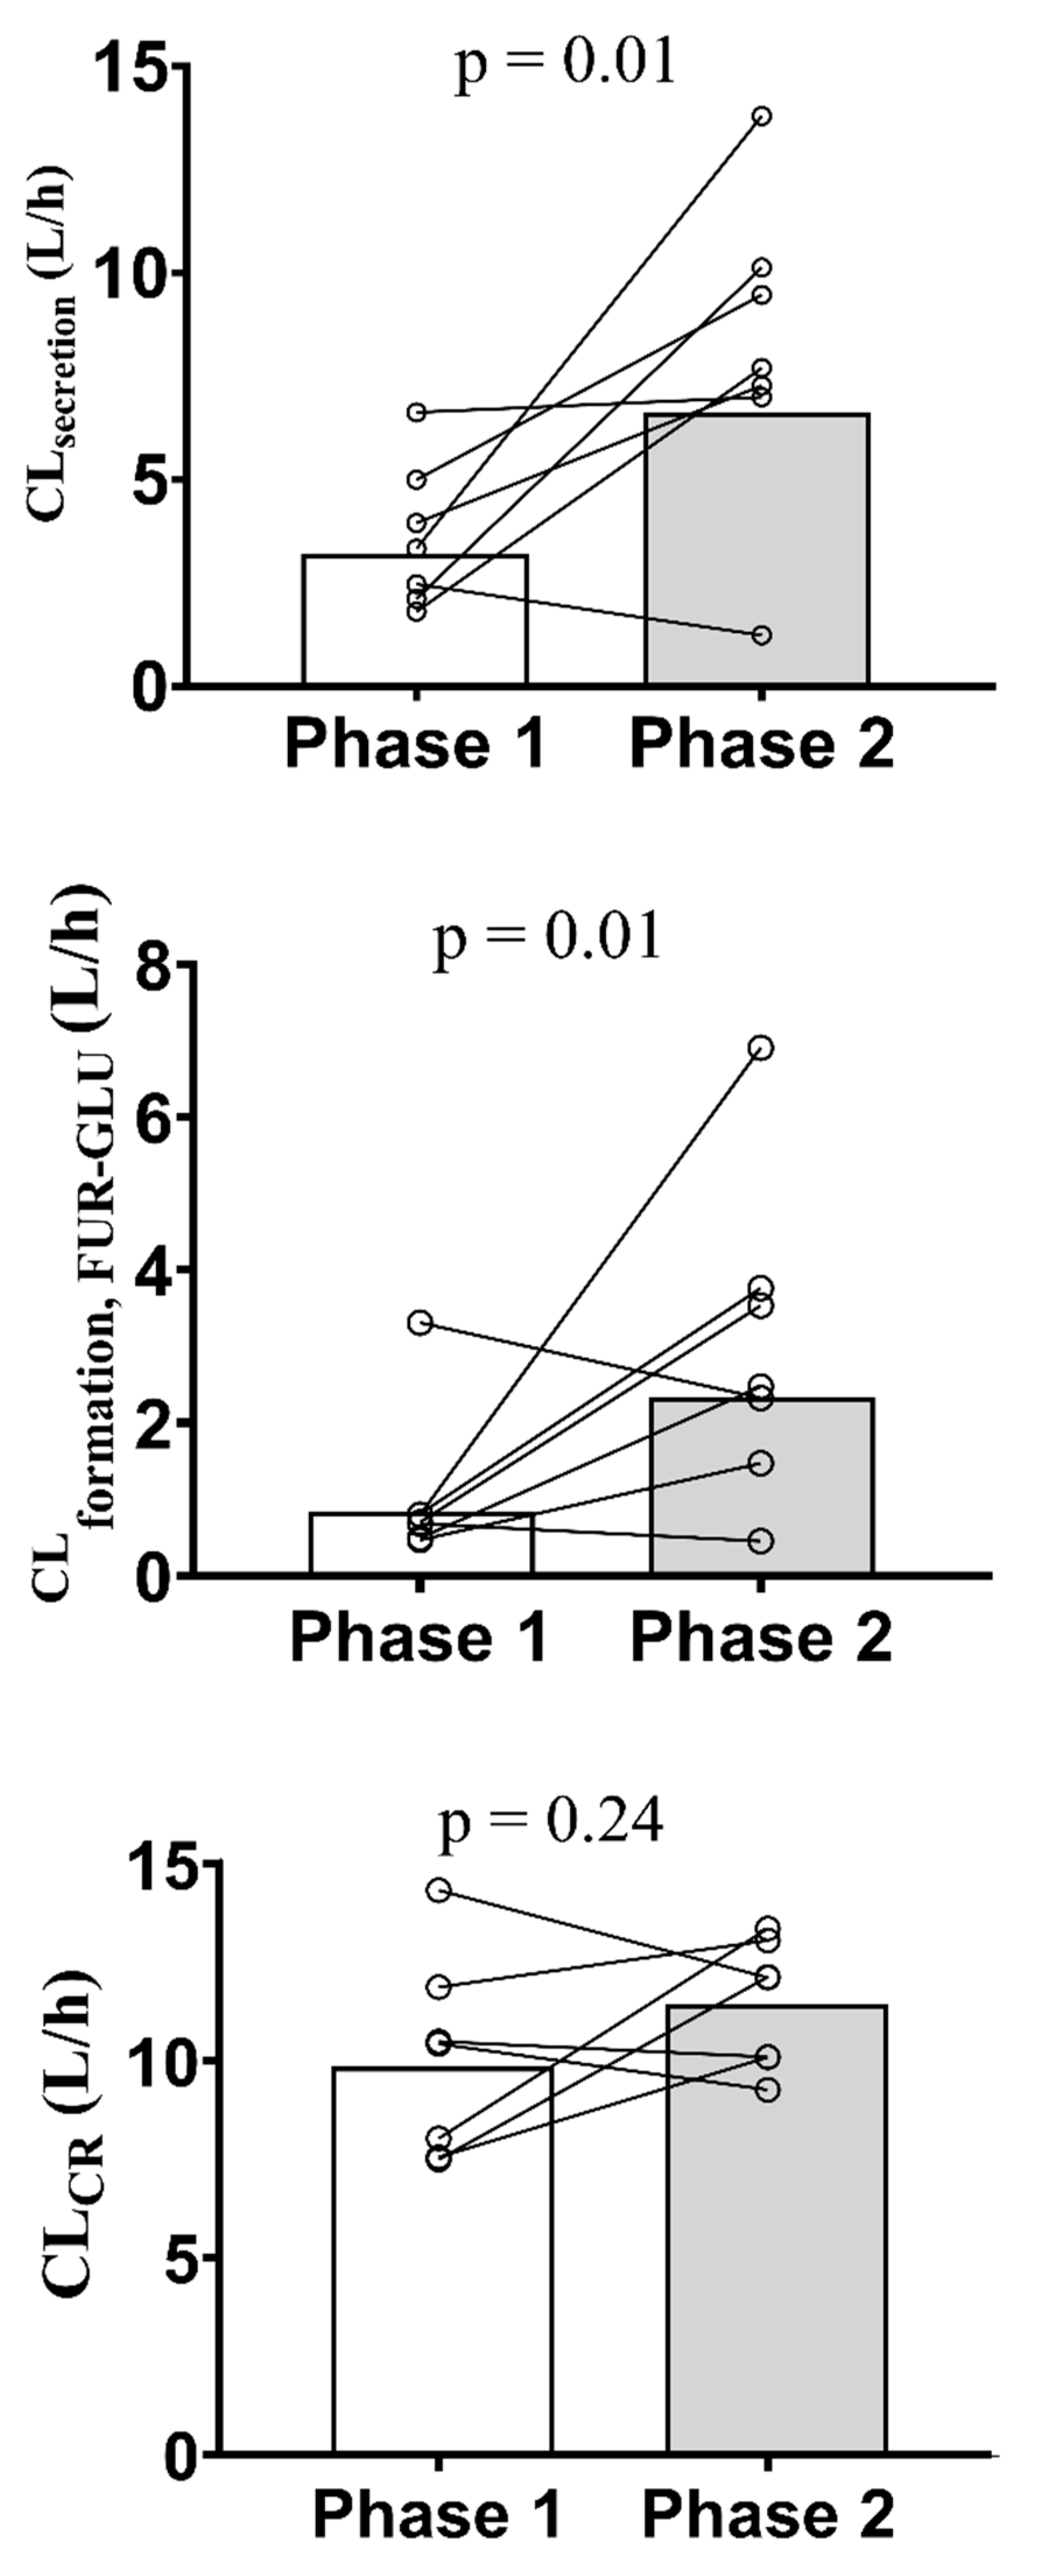
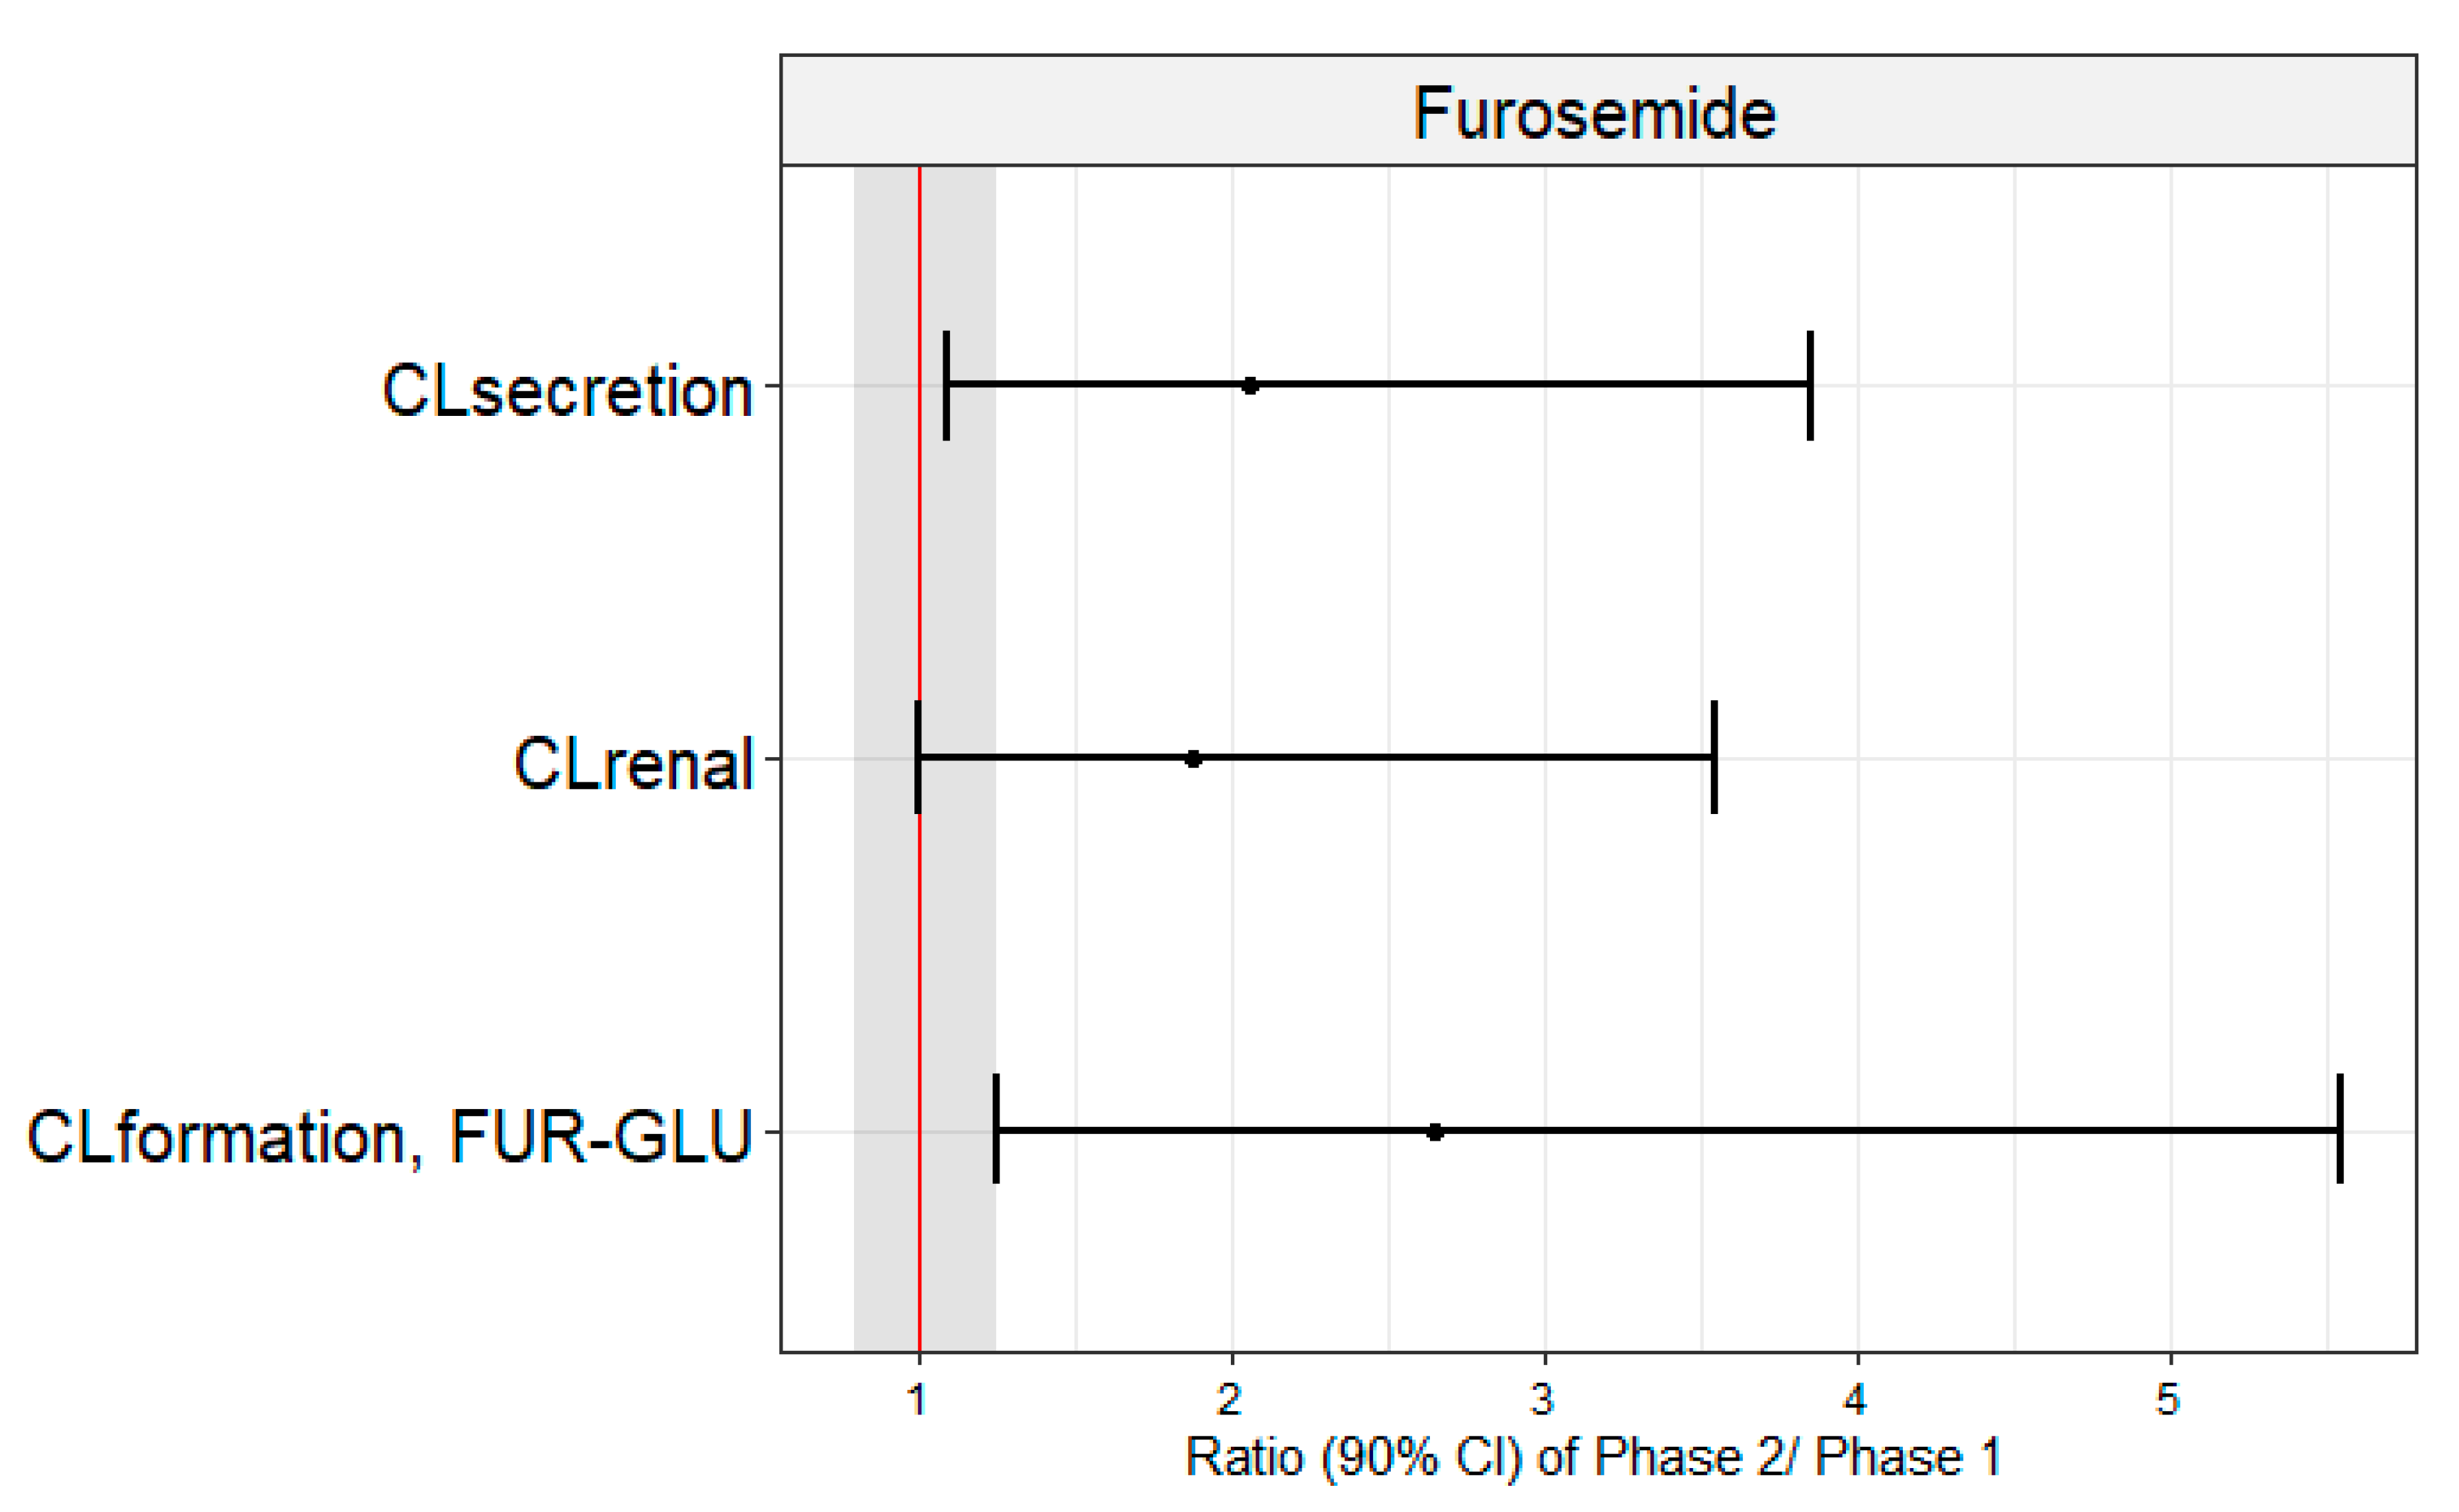
The geometric means of CLrenal (4.2 vs 6.9 L/h), CLsecretion (3.9 vs 6.7 L/h) and CLformation, FUR-GLU (1.1 vs 2.3 L/h) were significantly lower in Phase 1 when compared to Phase 2 (Table 3; Figure 2). This conclusion was confirmed when the Phase 2/Phase 1 geometric mean ratios of these parameters and their 90% confidence intervals were examined. None of the 90% confidence intervals fell within the bioequivalence threshold of 0.8 – 1.25 (Figure 3). In contrast, Tmax, Cmax, AUC0-24, AUC0-∞, CL/F, fu, Ae and CL/Fnon-renal were not significantly different between Phase 1 and Phase 2 (Table 3). These results did not differ if 3 pregnant women, previously excluded from analyses, were included and the data analyzed using an unpaired approach (data not shown).

4. Discussion

This study reports for the first time the reduction of in vivo activity of the renal transporters OAT1/3 (~40%) and UGT1A9/1A1 (~50%) due to systemic inflammation caused by acute pyelonephritis. The advantage of using acute pyelonephritis as a model infection is that the infection can be resolved by a short course of cephalosporin (usually cefuroxime). Thus, this allowed us to study the impact of inflammation on the renal OATs in the presence and absence of acute pyelonephritis where the same subject acted as her own control. We chose to study OAT1/3 transporters because they are involved in the renal secretion of many drugs used to treat a variety of infections that result in inflammation (e.g. pyelonephritis, sepsis, hepatitis). Additionally, the paired study minimized the important interindividual variability in plasma cytokine concentrations [22]. This paired design allowed us to have sufficient power to determine a significant difference in furosemide CLsecretion with only 7 subjects. We chose to use furosemide as a probe OAT1/3 drug because most (~65-85%) of an intravenous dose of furosemide is eliminated renally by the uptake transporters OAT1/3 and the efflux transporter MRP4[23]. A smaller fraction (~35%) [24] is metabolized (likely in the liver and the kidneys) into the glucuronide by the UGT1A9 isoform and to a lesser extent by 1A1 [13]. Less than 12% of the drug is excreted unchanged in the feces [25].
Our primary endpoint was CLsecretion rather than other systemic parameters such CL/F or AUC, Cmax as these can be influenced by absorption (potentially modulated by intestinal OATP2B1, BCRP and MRP4 [24]) and metabolic processes. We and others [16,24,26] interpreted furosemide CLsecretion to reflect in vivo activity of renal OAT1/3 transporters. This interpretation assumes that the OAT1/3 mediated active secretion was the only rate-determining step in furosemide CLsecretion and CLrenal since the latter approximates the former. Additionally, furosemide is documented not to be an OAT2 substrate[27]Since furosemide exhibits CLsecretion and CLrenal that is much smaller than the renal blood flow (Qrenal; approximately 1.2 L/min), and its blood-to-plasma partition (B/P) value is 0.6, possible changes in Qrenal by acute pyelonephritis can be disregarded as a confounding factor in the interpretation of the data. Also, acute pyelonephritis did not affect the fu of furosemide in plasma. Thereby, we can conclude that renal OAT 1/3 activity was reduced by inflammation as evidenced by lower CLsecretion (~43%) and CLrenal (~38.5%) in Phase 1 vs. Phase 2 (Table 3; Figure 2 and Figure 3). Furosemide CLsecretion was estimated by its filtration CL, which in turn was estimated by CrCL. Though creatinine CL is routinely used to estimate GFR, it is also partially secreted by OAT2 [28]. However, we observed no change in CrCL (Table 1; Figure 2), indicating that inflammation, resulting from acute pyelonephritis, reduces the tubular secretion of furosemide by OAT1/3 rather than the glomerular filtration.
UGT1A9/1A1 activity was also reduced by inflammation as evidenced by a decrease in CLformation, FUR-GLU (~54 %). In contrast, inflammation did not affect the other furosemide pharmacokinetic parameters (Table 3; Supplement furosemide). The lack of change in AUC, Cmax, Tmax suggests that the rate and extent of furosemide absorption are not affected by the inflammation and thus the activity of the intestinal OATP2B1, BCRP and MRP4 does not appear to be affected by inflammation. Moreover, inflammation did not appear to affect the biliary clearance of furosemide.
Inflammation is an important component of a range of clinical conditions such as bacterial, viral, fungal, and protozoal infections, chronic diseases such as type 2 diabetes mellitus, neoplasms, and autoimmune diseases such as rheumatoid arthritis and systemic lupus erythematosus [4,29,30]]. Chronic or acute inflammation can result in changes in pharmacokinetics, resulting in variability in the efficacy and toxicity of drugs [4,30,31]. For example, total clearance of meropenem was reduced by ~30-40% in critically ill patients and CRP was identified as a covariate for this reduction [32]. Meropenem is primarily eliminated renally (70%) by OAT1/3 and multidrug resistance-associated protein (MRP)4 [32,33]. Similarly, higher plasma exposure (~70%) to the immunosuppressive mycophenolate mofetil [34,35] (primarily metabolized by the hepatic UGT1A9) was observed in transplanted patients with cytomegalovirus infection, an inflammatory viral disease [36]. However, the literature lacks in vivo studies that characterize the activity of renal drug transporters in inflammatory conditions. Limited data show a reduction in OAT1/3 mRNA (and other renal transporters) in a rat experimental inflammation model generated with lipopolysaccharide or polyinosinic:polycytidylic [37,38].
When compared to Phase II, the Phase I participants showed higher median values of some plasma cytokines such as IL-6 (97-fold), IFN-γ (6-fold), CRP (11-fold), MCP-1 (2-fold) and TNF-α (2-fold) (Table 2). Higher or similar fold-plasma concentrations (4 to 75-fold) of IL-6 were observed in non-pregnant women with acute pyelonephritis vs. patients with asymptomatic bacteriuria, after acute pyelonephritis treatment or healthy volunteers [8,9,10]. Yet, in those studies, CRP and TNF-α values were similar (11.2 mg/dL and 35.0 pg/mL, respectively) in patients before and 24 h after acute pyelonephritis treatment to those observed in Phase 1 of our study [10]. Additionally, we report for the first time that MCP-1 plasma concentrations were elevated during acute pyelonephritis, reaching similar values observed in critically ill COVID-19 patients. MCP-1 is also relevant in other infectious/inflammatory diseases such as tuberculosis, inflammatory bowel disease and rheumatoid arthritis [39]. The elevated plasma concentrations of CRP and the cytokines evaluated in the present study were also observed in other inflammatory conditions such as rheumatoid arthritis, systemic lupus erythematosus, visceral leishmaniasis and COVID-19 [5,7,40,41].
The cytokines IL-6, TNF-α and IL-1β have been associated with changes in DMET expression and activity in in vitro studies. But these have all focused on transporters expressed in human hepatocytes. Plated human hepatocytes treated with 100 to 10,000 pg/mL of IL-6 (a concentration range that includes the highest concentrations observed in this study) for 8 to 48 h resulted in reduced expression of mRNA of several transporters, such as P-gp, MRP2, BCRP, Na+-taurocholate co-transporting polypeptide (NTCP), organic anion transporting polypeptide (OATP)2B1, OATP1B1, OATP1B3, organic cation transport (OCT) 1 and OAT 2 [2,42,43]. To date, there are no in vitro studies that characterize the activity or expression of renal transporters in the presence of cytokines. Nevertheless, we interpret the impact of pyelonephritis on reduced renal OAT1/3 activity as due to the elevation in plasma cytokine concentrations reported here.
This study has some limitations. First, we assumed that the effect of acute pyelonephritis on furosemide CLsecretion was caused solely by the resulting inflammation leading to elevation in plasma cytokine concentrations. However, we cannot discount the possibility that other physiological changes caused by the disease (or disease-pregnancy interaction) also contributed to the observed change. Second, we assumed that furosemide CLsecretion is not rate-determined by MRP4. If it is, it is possible that inflammation reduced the activity of one or some combination of the three renal transporters (OAT1/3 and MRP4). Third, we assumed that the administration of cefuroxime during Phase 1 did not affect furosemide CLsecretion. Cefuroxime, a cephalosporin antibiotic, may be an OAT1/3 substrate [44,45]. Even if it is an OAT1/3 substrate, based on the following data, we do not believe that the plasma concentrations of cefuroxime observed in the study inhibited OAT1/3. The plasma Cmax of cefuroxime observed in this study (unbound geometric mean and CV% of 28.81 [30.97]) mg/L) is lower than the reported cefuroxime’s IC50 (250 mg/L) to inhibit OATs [46]. Finally, no drug-drug interaction was observed when intravenous cefuroxime (1.5 g) was administered simultaneously with the known OAT substrate, NXY-059 [47].

5. Conclusions

In conclusion, data from this paired study show that systemic inflammation, due to bacterial infection caused by acute pyelonephritis, reduces the in vivo activity of the renal transporters OAT1/3 and renal UGT1A9/1A1 in pregnant women by approximately 40% and 50%, respectively. This magnitude of change would necessitate adjustment in the dosing regimen of drugs that have a narrow therapeutic window and are predominately cleared by OAT1/3 and/or UGT1A9/1A1.

Author Contributions

J.R.L.B: wrote the manuscript, designed the research, performed the research, and analyzed the data. P.P.S: performed the research. G.D: designed and performed the research. J.D.U.: reviewed and edited the manuscript. V.L.L: wrote the manuscript, designed the research, analyzed the data, reviewed and edited the manuscript.

Funding

This research was funded by the São Paulo Research Foundation (FAPESP) grant numbers 2018/05616-3, 2019/03429-4 and 2021/10292-5, the Coordination for the Improvement of Higher Education Personnel (CAPES, Brazil, Finance Code 001), the Brazilian National Council for Scientific and Technological Development (CNPq) and in part by NIH Grant R01HD102786.

Institutional Review Board Statement

The research protocols were conducted according to the guidelines of the Declaration of Helsinki and approved by the Research Ethics Committee of the School of Medicine of Ribeirão Preto from the University of São Paulo (HCFMRP-USP), CAAE: 06827219.50000.5403 and 06827219.5.3001.5440 and by the Brazilian Registry of Clinical Trials (ReBEC, http://www.ensaiosclinicos.gov.br) under ID number RBR-4npsyxz.

Informed Consent Statement

Informed consent was obtained from all subjects involved in the study.

Data Availability Statement

Data are available on reasonable request from the corresponding author.

Conflicts of Interest

The authors declare no conflict of interest.

References

  1. Morgan, E.T. Impact of Infectious and Inflammatory Disease on Cytochrome P450-Mediated Drug Metabolism and Pharmacokinetics. Clin Pharmacol Ther 2009, 85, 434–438. [Google Scholar] [CrossRef] [PubMed]
  2. Fardel, O.; Le Vée, M. Regulation of Human Hepatic Drug Transporter Expression by Pro-Inflammatory Cytokines. Expert Opin Drug Metab Toxicol 2009, 5, 1469–1481. [Google Scholar] [CrossRef] [PubMed]
  3. Klöditz, K.; Tewolde, E.; Nordling, Å.; Ingelman-Sundberg, M. Mechanistic, Functional and Clinical Aspects of pro-Inflammatory Cytokine Mediated Regulation of ADME Gene Expression in 3D Human Liver Spheroids. Clin Pharmacol Ther 2023. [Google Scholar] [CrossRef]
  4. Lenoir, C.; Rollason, V.; Desmeules, J.A.; Samer, C.F. Influence of Inflammation on Cytochromes P450 Activity in Adults: A Systematic Review of the Literature. Front Pharmacol 2021, 12, 1–44. [Google Scholar] [CrossRef]
  5. Caris, J.A.; Benzi, J.R. de L.; de Souza, F.F.L.; de Oliveira, R.D.R.; Donadi, E.A.; Lanchote, V.L. Rheumatoid Arthritis Downregulates the Drug Transporter OATP1B1: Fluvastatin as a Probe. Eur. J. Pharm. Sci. 2020, 146, 1–7. [Google Scholar] [CrossRef]
  6. Pippa, L.F.; Vieira, C.P.; Caris, J.A.; Rocha, A.; Marques, M.P.; Garcia, C.P.; Rezende, R.E.F.; Lanchote, V.L. Effect of Chronic Hepatitis C on the Activity of the Membrane Transporters P-gp and OATP1B1/BCRP on Patients With Different Stages of Hepatic Fibrosis. Clin Pharmacol Ther 2023, 114, 173–181. [Google Scholar] [CrossRef] [PubMed]
  7. Cestari, R.N.; de Oliveira, R.D.R.; de Souza, F.F.L.; Pippa, L.F.; Nardotto, G.H.B.; Rocha, A.; Donadi, E.A.; Lanchote, V.L. Systemic Lupus Erythematosus Activity Affects the Sinusoidal Uptake Transporter OATP1B1 Evaluated by the Pharmacokinetics of Atorvastatin. Clin Transl Sci 2020, 13, 1227–1235. [Google Scholar] [CrossRef]
  8. Hedges, S.; Stenqvist, K.; Lidin-Janson, G.; Martinell, J.; Sandberg, T.; Svanborg, C. Comparison of Urine and Serum Concentrations of Interleukin-6 in Women with Acute Pyelonephritis or Asymtomatic Bacteriuria. J Infect Dis 1992, 166, 653–659. [Google Scholar] [CrossRef] [PubMed]
  9. Jacobson, S.H.; Hylander, B.; Wretlind, B.; Brauner, A. Interleukin-6 and Interleukin-8 in Serum and Urine in Patients with Acute Pyelonephritis in Relation to Bacterial-Virulence-Associated Traits and Renal Function. Nephron 1994, 67, 172–179. [Google Scholar] [CrossRef]
  10. Horcajada, J.P.; Velasco, M.; Filella, X.; Alvarez, L.; De Làzzari, E.; Marín, J.L.; Collvinent, B.; Smithson, A.; Martínez, J.A.; Noguero, M.; et al. Evaluation of Inflammatory and Renal-Injury Markers in Women Treated with Antibiotics for Acute Pyelonephritis Caused by Escherichia Coli. Clin Diagn Lab Immunol 2004, 11, 142–146. [Google Scholar] [CrossRef]
  11. Saleh, P.; Noshad, H.; Mallah, F.; Ramouz, A. Acute Pyelonephritis in Pregnancy and the Outcomes in Pregnant Patients. Arch Clin Infect Dis 2015, 10, 1–4. [Google Scholar] [CrossRef]
  12. Hammarlund-Udenaes, M.; Benet, L.Z. Furosemide Pharmacokinetics and Pharmacodynamics in Health and Disease-An Update. J Pharmacokinet Biopharm 1989, 17, 1–46. [Google Scholar] [CrossRef] [PubMed]
  13. Kerdpin, O.; Knights, K.M.; Elliot, D.J.; Miners, J.O. In Vitro Characterisation of Human Renal and Hepatic Frusemide Glucuronidation and Identification of the UDP-Glucuronosyltransferase Enzymes Involved in This Pathway. Biochem Pharmacol 2008, 76, 249–257. [Google Scholar] [CrossRef]
  14. Gonçalves, P.V.B.; Moreira, F. de L.; Benzi, J.R. de L.; Duarte, G.; Lanchote, V.L. A Pilot Study of the Maternal-Fetal Pharmacokinetics of Furosemide in Plasma, Urine, and Amniotic Fluid of Hypertensive Parturient Women Under Cesarean Section. J Clin Pharmacol 2020, 60, 1655–1661. [Google Scholar] [CrossRef] [PubMed]
  15. Mizuma, T.; McDonagh, A.F.; Lin, E.T.; Benet, L.Z. Photoinduced Covalent Binding of Frusemide and Frusemide Glucuronide to Human Serum Albumin. Br. J. Clin. Pharmacol. 1999, 48, 79–87. [Google Scholar] [CrossRef] [PubMed]
  16. Shen, H.; Holenarsipur, V.K.; Mariappan, T.T.; Drexler, D.M.; Cantone, J.L.; Rajanna, P.; Gautam, S.S.; Zhang, Y.; Gan, J.; Shipkova, P.A.; et al. Evidence for the Validity of Pyridoxic Acid (PDA) as a Plasma-Based Endogenous Probe for OAT1 and OAT3 Function in Healthy Subjects. J. Pharmacol. Exp. Ther. 2019, 368, 136–145. [Google Scholar] [CrossRef]
  17. Benzi, J.R. de L.; Rocha, A.; Colombari, J.C.; Pego, A.M.G.; dos Santos Melli, P.P.; Duarte, G.; Lanchote, V.L. Determination of Furosemide and Its Glucuronide Metabolite in Plasma, Plasma Ultrafiltrate and Urine by HPLC-MS/MS with Application to Secretion and Metabolite Formation Clearances in Non-Pregnant and Pregnant Women. J Pharm Biomed Anal 2023, 235, 115635. [Google Scholar] [CrossRef]
  18. Klinkmann, G.; Klammt, S.; Jäschke, M.; Henschel, J.; Gloger, M.; Reuter, D.A.; Mitzner, S. Impact of Albumin Binding Function on Pharmacokinetics and Pharmacodynamics of Furosemide. Medicina (Lithuania) 2022, 58, 1–13. [Google Scholar] [CrossRef]
  19. Zaghloul, D.E.; Ryu, R.; Kestenbaum, B.; Smith, C.; Fay, E.; Hebert, M.F. Renal Function Estimating Equations Performance during Pregnancy and Postpartum. Pharmacotherapy 2023, 43, 359–372. [Google Scholar] [CrossRef]
  20. Statistical Guide for Clinical Pharmacology Therapeutics. Clin Pharmacol Ther 2010, 88, 150–152. [CrossRef]
  21. Abbassi-Ghanavati, M.; Greer, L.G.; Cunningham, F.G. Pregnancy and Laboratory Studies A Reference Table for Clinicians. Obstet Gynecol 2009, 114, 1326–1357. [Google Scholar] [CrossRef] [PubMed]
  22. Kim, H.O.; Kim, H.S.; Youn, J.C.; Shin, E.C.; Park, S. Serum Cytokine Profiles in Healthy Young and Elderly Population Assessed Using Multiplexed Bead-Based Immunoassays. J Transl Med 2011, 9, 1–7. [Google Scholar] [CrossRef] [PubMed]
  23. Hasegawa, M.; Kusuhara, H.; Adachi, M.; Schuetz, J.D.; Takeuchi, K.; Sugiyama, Y. Multidrug Resistance-Associated Protein 4 Is Involved in the Urinary Excretion of Hydrochlorothiazide and Furosemide. Journal of the American Society of Nephrology 2007, 18, 37–45. [Google Scholar] [CrossRef] [PubMed]
  24. Chapa, R.; Li, C.Y.; Basit, A.; Thakur, A.; Ladumor, M.K.; Sharma, S.; Singh, S.; Selen, A.; Prasad, B. Contribution of Uptake and Efflux Transporters to Oral Pharmacokinetics of Furosemide. ACS Omega 2020, 5, 32939–32950. [Google Scholar] [CrossRef]
  25. Prandota, J.; Witkowska, M.; Man, I. Pharmacokinetics and Metabolism of Furosemide in Man. Eur J Drug Metab Pharmacokinet 1976, 4, 177–181. [Google Scholar] [CrossRef]
  26. Mathialagan, S.; Feng, B.; Rodrigues, A.D.; Varma, M.V.S. Drug-Drug Interactions Involving Renal OCT2/MATE Transporters: Clinical Risk Assessment May Require Endogenous Biomarker-Informed Approach. Clin Pharmacol Ther 2021, 110, 855–859. [Google Scholar] [CrossRef] [PubMed]
  27. Hasannejad, H.; Takeda, M.; Taki, K.; Shin, H.J.; Babu, E.; Jutabha, P.; Khamdang, S.; Aleboyeh, M.; Onozato, M.L.; Tojo, A.; et al. Interactions of Human Organic Anion Transporters with Diuretics. J. Pharmacol. Exp. Ther. 2004, 308, 1021–1029. [Google Scholar] [CrossRef]
  28. Lepist, E.I.; Zhang, X.; Hao, J.; Huang, J.; Kosaka, A.; Birkus, G.; Murray, B.P.; Bannister, R.; Cihlar, T.; Huang, Y.; et al. Contribution of the Organic Anion Transporter OAT2 to the Renal Active Tubular Secretion of Creatinine and Mechanism for Serum Creatinine Elevations Caused by Cobicistat. Kidney Int 2014, 86, 350–357. [Google Scholar] [CrossRef]
  29. Stanke-Labesque, F.; Gautier-Veyret, E.; Chhun, S.; Guilhaumou, R. Inflammation Is a Major Regulator of Drug Metabolizing Enzymes and Transporters: Consequences for the Personalization of Drug Treatment. Pharmacol Ther 2020, 215, 1–12. [Google Scholar] [CrossRef]
  30. Evers, R.; Piquette-Miller, M.; Polli, J.W.; Russel, F.G.M.; Sprowl, J.A.; Tohyama, K.; Ware, J.A.; de Wildt, S.N.; Xie, W.; Brouwer, K.L.R. Disease-Associated Changes in Drug Transporters May Impact the Pharmacokinetics and/or Toxicity of Drugs: A White Paper From the International Transporter Consortium. Clin Pharmacol Ther 2018, 104, 900–915. [Google Scholar] [CrossRef] [PubMed]
  31. Cressman, A.M.; Petrovic, V.; Piquette-Miller, M. Inflammation-Mediated Changes in Drug Transporter Expression/Activity: Implications for Therapeutic Drug Response. Expert Rev Clin Pharmacol 2012, 5, 69–89. [Google Scholar] [CrossRef] [PubMed]
  32. Shibayama, T.; Sugiyama, D.; Kamiyama, E.; Tokui, T.; Hirota, T.; Ikeda, T. Characterization of CS-023 (RO4908463), a Novel Parenteral Carbapenem Antibiotic, and Meropenem as Substrates of Human Renal Transporters. 41 Drug Metab. Pharmacokinet 2007, 22, 41–47. [Google Scholar] [CrossRef]
  33. Akanuma, S.I.; Uchida, Y.; Ohtsuki, S.; Kamiie, J.I.; Tachikawa, M.; Terasaki, T.; Hosoya, K.I. Molecular-Weight-Dependent, Anionic-Substrate-Preferential Transport of β-Lactam Antibiotics via Multidrug Resistance-Associated Protein 4. Drug Metab Pharmacokinet 2011, 26, 602–611. [Google Scholar] [CrossRef] [PubMed]
  34. Okamoto, M.; Wakabayashi, Y.; Higuchi, A.; Kadotani, Y.; Ogino, S.; Ushigome, H.; Akioka, K.; Kaihara, S.; Yoshimura, N. Therapeutic Drug Monitoring of Mycophenolic Acid in Renal Transplant Recipients. Transplant Proc 2005, 37, 859–860. [Google Scholar] [CrossRef]
  35. Sommerer, C.; Müller-Krebs, S.; Schaier, M.; Glander, P.; Budde, K.; Schwenger, V.; Mikus, G.; Zeier, M. Pharmacokinetic and Pharmacodynamic Analysis of Enteric-Coated Mycophenolate Sodium: Limited Sampling Strategies and Clinical Outcome in Renal Transplant Patients. Br J Clin Pharmacol 2010, 69, 346–357. [Google Scholar] [CrossRef]
  36. García-Torre, A.; Bueno-García, E.; López-Martínez, R.; Rioseras, B.; Díaz-Molina, B.; Lambert, J.L.; Quirós, C.; Alonso-Álvarez, S.; Alonso-Arias, R.; Moro-García, M.A. CMV Infection Is Directly Related to the Inflammatory Status in Chronic Heart Failure Patients. Front Immunol 2021, 12, 1–11. [Google Scholar] [CrossRef]
  37. Pour, N.K.; McColl, E.R.; Piquette-Miller, M. Impact of Viral Inflammation on the Expression of Renal Drug Transporters in Pregnant Rats. Pharmaceutics 2019, 11, 1–11. [Google Scholar] [CrossRef]
  38. Höcherl, K.; Schmidt, C.; Bucher, M. COX-2 Inhibition Attenuates Endotoxin-Induced Downregulation of Organic Anion Transporters in the Rat Renal Cortex. Kidney Int 2009, 75, 373–380. [Google Scholar] [CrossRef] [PubMed]
  39. Deshmane, S.L.; Kremlev, S.; Amini, S.; Sawaya, B.E. Monocyte Chemoattractant Protein-1 (MCP-1): An Overview. J. Interferon Cytokine Res 2009, 29, 313–325. [Google Scholar] [CrossRef]
  40. Lanchote, V.L.; Almeida, R.; Barral, A.; Barral-Netto, M.; Marques, M.P.; Moraes, N. V.; Da Silva, A.M.; Souza, T.M.V.; Suarez-Kurtz, G. Impact of Visceral Leishmaniasis and Curative Chemotherapy on Cytochrome P450 Activity in Brazilian Patients. Br J Clin Pharmacol 2015, 80, 1160–1168. [Google Scholar] [CrossRef]
  41. Lenoir, C.; Terrier, J.; Gloor, Y.; Curtin, F.; Rollason, V.; Desmeules, J.A.; Daali, Y.; Reny, J.L.; Samer, C.F. Impact of SARS-CoV-2 Infection (COVID-19) on Cytochromes P450 Activity Assessed by the Geneva Cocktail. Clin Pharmacol Ther 2021, 110, 1358–1367. [Google Scholar] [CrossRef] [PubMed]
  42. Le Vee, M.; Lecureur, V.; Stieger, B.; Fardel, O. Regulation of Drug Transporter Expression in Human Hepatocytes Exposed to the Proinflammatory Cytokines Tumor Necrosis Factor-α or Interleukin-6. Drug Metab. Dispos. 2009, 37, 685–693. [Google Scholar] [CrossRef] [PubMed]
  43. Le Vee, M.; Jouan, E.; Stieger, B.; Lecureur, V.; Fardel, O. Regulation of Drug Transporter Expression by Oncostatin M in Human Hepatocytes. Biochem Pharmacol 2011, 82, 304–311. [Google Scholar] [CrossRef] [PubMed]
  44. Coppola, P.; Kerwash, E.; Cole, S. The Use of Pregnancy Physiologically Based Pharmacokinetic Modeling for Renally Cleared Drugs. J Clin Pharmacol 2022, 62, S129–S139. [Google Scholar] [CrossRef] [PubMed]
  45. Li, J.; Olaleye, O.E.; Yu, X.; Jia, W.; Yang, J.; Lu, C.; Liu, S.; Yu, J.; Duan, X.; Wang, Y.; et al. Supporting Information for High Degree of Pharmacokinetic Compatibility Exists between the Five-Herb Medicine XueBiJing and Antibiotics Comedicated in Sepsis Care. Acta Pharm Sin B 2019, 9, 1035–1049. [Google Scholar] [CrossRef]
  46. Verhagen, C.A.; Mattie, H.; Van Strijen, E. The Renal Clearance of Cefuroxime and Ceftazidime and the Effect of Probenecid on Their Tubular Excretion. Br J clin Pharmac 1994, 37, 193–197. [Google Scholar] [CrossRef]
  47. Kågedal, M.; Nilsson, D.; Huledal, G.; Reinholdsson, I.; Cheng, Y.F.; Åsenblad, N.; Pekar, D.; Borgå, O. A Study of Organic Acid Transporter-Mediated Pharmacokinetic Interaction between NXY-059 and Cefuroxime. J Clin Pharmacol 2007, 47, 1043–1048. [Google Scholar] [CrossRef]
Figure 1. The in vivo impact of inflammation on the activity of the renal transporters OAT1/3 was quantified using a paired study design. Pregnant women diagnosed with (Phase 1) and without acute pyelonephritis (Phase 2) received a single dose of furosemide (40 mg, PO). Plasma and urine samples were collected (0-24 h). During Phase 1, acute pyelonephritis was treated with intravenous cefuroxime TID over 24 h. Phase 2 was conducted after pyelonephritis was resolved by 10-14 days of treatment with cefuroxime (250 mg/TID).
Preprints 83638 g001
Figure 2. Furosemide renal (CLrenal; top left panel) and secretion (CLsecretion; top right panel) clearances, furosemide glucuronide formation clearance (CLformation, FUR-GLU; bottom left panel), and creatinine clearance (CLCr; bottom right panel) estimation in the presence (Phase 1) and absence (Phase 2) of acute pyelonephritis in 7 pregnant women after a single furosemide dose (40 mg, PO). Data are presented for each individual and the bars represent the geometric mean. The difference in the indicated parameter between Phase 1 and Phase 2 was evaluated by the paired Student’s T-test (P > 0.05). CLCr was estimated by the Cockcroft-Gault equation and the participant’s actual body weight.
Preprints 83638 g002aPreprints 83638 g002b
Figure 3. Geometric mean ratios (dots) and confidence intervals of 90% (lines) of furosemide renal (CLrenal) and secretion (CLsecretion) clearances and furosemide glucuronide formation clearances (CLformation, FUR-GLU) in pregnant women in the presence (Phase 1) and absence (Phase 2) of acute pyelonephritis. These mean ratios did not fall within the bioequivalence range (0.80 – 1.25; shaded area).
Preprints 83638 g003
Table 1. Clinical characteristics of the pregnant women investigated in the presence (Phase 1) and absence (Phase 2) of acute pyelonephritis.
Reference range# Phase 1 (n = 7) Phase 2 (n = 7)
Age (years) - 24.3 (16.1) 24.3 (17.4)
Gestational age (weeks) - 26.7 (19.2) 29.6 (17.3)
Body mass index (kg/m2) - 28.7 (17.0) 29.3 (17.2)
Serum creatinine (mg/dL) 0.6 – 1.1 0.63 (25.1) 0.5 (23.0)
Estimated creatinine clearance* (mL/min) > 90.0 161.1 (21.3) 189.2 (14.1)
AST (U/L) 3.0 – 32.0 22.0 (42.1) 22.7 (162.0)
ALT (U/L) 3.0 – 33.0 16.0 (66.1) 24.0 (187.4)
GGT (U/L) 7.0 – 32.0 17.5 (66.5) 27.9 (42.8)
Total plasma proteins (g/dL) 6.1 – 7.90 5.9 (6.72) 6.2 (4.70)
Albumin (g/dL) 3.4 – 4.8 3.5 (9.31) 3.6 (8.10)
α1-Acid glycoprotein 50.0 – 120.0 86.9 (35.1) 65.0 (23.4)
Alkaline phosphatase (U/L) 65.0 – 300.0 157.1 (23.6) 169.5 (22.7)
Fasting glycemia (mg/dL) 70.0 – 100.0 79.8 (12.1) 76.7 (11.2)
Medications in use cefuroxime; oseltamivir; ferrous sulfate; metamizole; tramadol; folic acid; scopolamine; tinidazole (topical); terbutaline; betamethasone; levothyroxine; ondansetron; progesterone; heparin; sulfamethoxazole and trimethoprim ferrous sulfate; metamizole; folic acid; miconazole (topic); levothyroxine; heparin
Data are presented as geometric mean (coefficient of variation %). * = Creatinine clearance was estimated by the Cockcroft-Gault equation and the participant’s actual body weight; ALT: Alanine aminotransferase; AST: Aspartate aminotransferase; GGT: Gamma-glutamyl transferase. #[21].
Table 2. Plasma CRP and cytokines concentrations in the presence (Phase 1) and absence (Phase 2) of acute pyelonephritis in pregnant women.
Cytokines (pg/mL) and
CRP (mg/dL)
Phase 1 (n = 7) Phase 2 (n = 7) p-value
IFN-γ 5.80 (5.50 – 9.41) 0.92 (0.73 – 1.91) 0.0313
IL-10 32.30 (19.79 – 113.80) 3.12 (1.53 – 49.7) 0.3125
IL-12p40 3.28 (1.17 – 35.32) 1.34 (1.07 – 17.4) >0.999
IL-12p70 1.85 (1.04 – 2.37) 1.04 (1.04 – 1.32) 0.1563
IL-1β 1.00 (0.59 – 4.18) 1.10 (0.60 – 2.40) >0.999
IL-2 0.76 (0.62 – 1.21) 0.68 (0.61 – 1.16) 0.6875
IL-6 34.04 (1.97 – 126.60) 0.21 (0.11 – 23.7) 0.0469
IL-8 4.70 (0.22 – 100.83) 0.28 (0.15 – 31.4) 0.8438
MCP-1 807.34 (418.20 – 1232.50) 373.32 (277.00 – 403.45) 0.0313
TNF-α 41.63 (17.28 – 54.15) 17.01 (13.30 – 21.42) 0.0313
CRP 21.54 (13.46 – 58.84) 2.34 (1.10 – 3.54) 0.0313
Data presented as median (interquartile range). CRP: C-reactive protein; IFN: interferon; IL: interleukin; MCP: Monocyte chemoattractant protein; TNF: Tumor necrosis factor. Phases were compared by the Wilcoxon signed-rank test.
Table 3. Furosemide (40 mg, PO) pharmacokinetic parameters in the presence (Phase 1) and absence (Phase 2) of acute pyelonephritis in pregnant women.
Geometric mean (CV%) Geometric mean ratios (90% CI) p-value
Phase 1 (n = 7) Phase 2 (n = 7) Phase 2/Phase 1
AUC0-24 (ng×h/mL) 1303.0 (38.3) 1065.0 (7.1) 0.67 (0.45 – 1.01) 0.2386
AUC0-∞ (ng×h/mL) 1373.0 (38.3) 1196.0 (14.1) 0.72 (0.48 – 1.08) 0.4465
CL/F (L/h) 29.1 (38.8) 37.6 (7.20) 1.61 (1.10 – 2.35) 0.2300
CLrenal (L/h) 4.2 (45.5) 6.9 (43.3) 1.89 (1.01 – 3.54) 0.0262
CLsecretion (L/h) 3.9 (43.4) 6.7 (43.8) 2.06 (1.12 – 3.80) 0.0126
CLformation, FUR-GLU (L/h) 1.1 (85.9) 2.3 (64.1) 2.65 (1.28 – 5.49) 0.0161
Ae (mg) 5.5 (20.8) 7.3 (46.3) 1.29 (0.73 – 2.28) 0.3006
CL/Fnon-renal (L/h) 21.5 (62.4) 29.1 (14.6) 1.65 (0.92 – 2.96) 0.6999
Cmax (ng/mL) 337.2 (48.5) 377.4 (39.8) 0.95 (0.51 – 1.77) 0.3525
Tmax (h) 1.5 (1.0 – 4.0)* 1.0 (1.0 – 2.0)* 0.7 (0.5 – 1.0) 0.0938
fu 0.010 (32.0) 0.011 (40.3) 1.04 (0.77 – 1.42) 0.6499
AUC: area under the plasma concentration-time curve; CL/F: oral clearance; CLrenal: renal clearance; CLsecretion: secretion clearance; CLformation, FUR-GLU: formation clearance to furosemide glucuronide; Ae: the amount of furosemide excreted unchanged in urine over 24 h; CL/Fnon-renal: non-renal clearance; Cmax: maximum plasma concentration; Tmax: time to observe Cmax; fu: fraction unbound in the plasma. Tmax was compared between phases by the Wilcoxon test, whereas all others were compared by the paired Student’s T-test. * = Median (interquartile range).
Disclaimer/Publisher’s Note: The statements, opinions and data contained in all publications are solely those of the individual author(s) and contributor(s) and not of MDPI and/or the editor(s). MDPI and/or the editor(s) disclaim responsibility for any injury to people or property resulting from any ideas, methods, instructions or products referred to in the content.
Copyright: This open access article is published under a Creative Commons CC BY 4.0 license, which permit the free download, distribution, and reuse, provided that the author and preprint are cited in any reuse.
Alerts
Prerpints.org logo

Preprints.org is a free preprint server supported by MDPI in Basel, Switzerland.

Subscribe

© 2025 MDPI (Basel, Switzerland) unless otherwise stated