1. Introduction
In recent years, the interest in advanced materials with improved mechanical and thermal properties has driven significant advancements in composite materials [1-3]. Among these, aluminum metal matrix reinforced with micrometric and nanometric reinforcement as silicon carbide (SiC) have gained considerable attention due to their potential to offer exceptional mechanical strength, enhanced wear resistance, and improved thermal stability. Incorporating nanometric particles into aluminum matrices exploits the inherent properties of both materials and introduces synergistic effects that can lead to superior material performance [
3].
The growing development of advanced composites with an aluminum matrix is based on the possibility of producing components with extraordinary properties that conventional materials do not have. Different particles can be used to improve the properties of aluminum materials. Some of the most reported are SiC, Al2O3, TiC and carbon-based nanoparticles such as carbon nanotubes (CNTs). Among these, SiC, a hard and chemically inert ceramic material, has demonstrated remarkable mechanical and thermal attributes, making it a convincing candidate for use as a reinforcing of aluminum matrix [3-7].
These composites can be produced mainly through powder metallurgy [
8] or stir casting [
9] processes. However, the successful production of these nanocomposites depends on factors such as: (a) obtaining a uniform dispersion of the reinforcement, (b) a strong interface between matrix and reinforcement, and (c) reducing the chemical reaction that may occur between the reinforcement and the matrix.
Powder metallurgy avoids the wettability problem obtained using the casting process, but the distribution of nanoparticles in the aluminum matrix is challenging. The development of dispersion techniques is crucial for the success of the production of these nanocomposites. For instance, Zeng et al. [
8] proposed a dispersion and mixture process that combines ultrasonication and ball milling to produce Al-SiC nanocomposites by conventional powder metallurgy. The microstructural and mechanical characterization revealed that the process effectively produced the nanocomposites. The SiC nanoparticles adhered to the Al particles with a relatively uniform distribution. After extrusion, the microstructural characterization results of the samples reveal a homogeneous reinforcement dispersion throughout the matrix. Vickers microhardness showed an increase of 26%, 34% and 40% in the samples reinforced with 1.0, 2.0 and 3.0% SiC, respectively, compared to the pure aluminum samples. In addition to higher hardness and ductility values, the presence of SiC hinders the movement of dislocations and subsequently limits the deformation of the material. Shahradami et al. [
10] investigated the combination of carbon nanotubes and SiC in producing nanocomposites. The mixture was performed by planetary ball milling. Different volume fractions of the reinforcement in the microstructure and mechanical properties were evaluated. The results revealed that the increase in SiC leads to increased compressive strength.
The combination of the powder metallurgy with deformation processes has shown to be effective in producing aluminum matrix reinforced with SiC nanoparticles. Soltani et al. [
11] investigated the production of these nanocomposites using cold pressing and hot extrusion. The nanocomposites exhibited an increase in microhardness of 44% and in the tensile strength of 40%. In addition, the mechanical properties of the nanocomposites at high temperatures can be improved.
However, to date, few studies have focused on producing Al reinforced with SiC nanoparticles, mainly in developing dispersion techniques. In this context, the aim of this investigation, Al-SiC nanocomposites were produced by conventional powder metallurgy. The ultrasonication was selected as the dispersion and mixture process based on the success demonstrated in previous works to produce aluminum matrix with CNTs [11-14]. Different dispersion and mixing conditions were evaluated, as well as the volume fraction of the reinforcement. The microstructure of the nanocomposites was evaluated using different characterization techniques, such as optical microscopy (OM), scanning electron microscopy (SEM) with energy dispersive X-ray spectroscopy (EDS) and electron backscatter diffraction (EBSD). The mechanical properties were also investigated to define the conditions for successfully obtaining the nanocomposites.
2. Materials and Methods
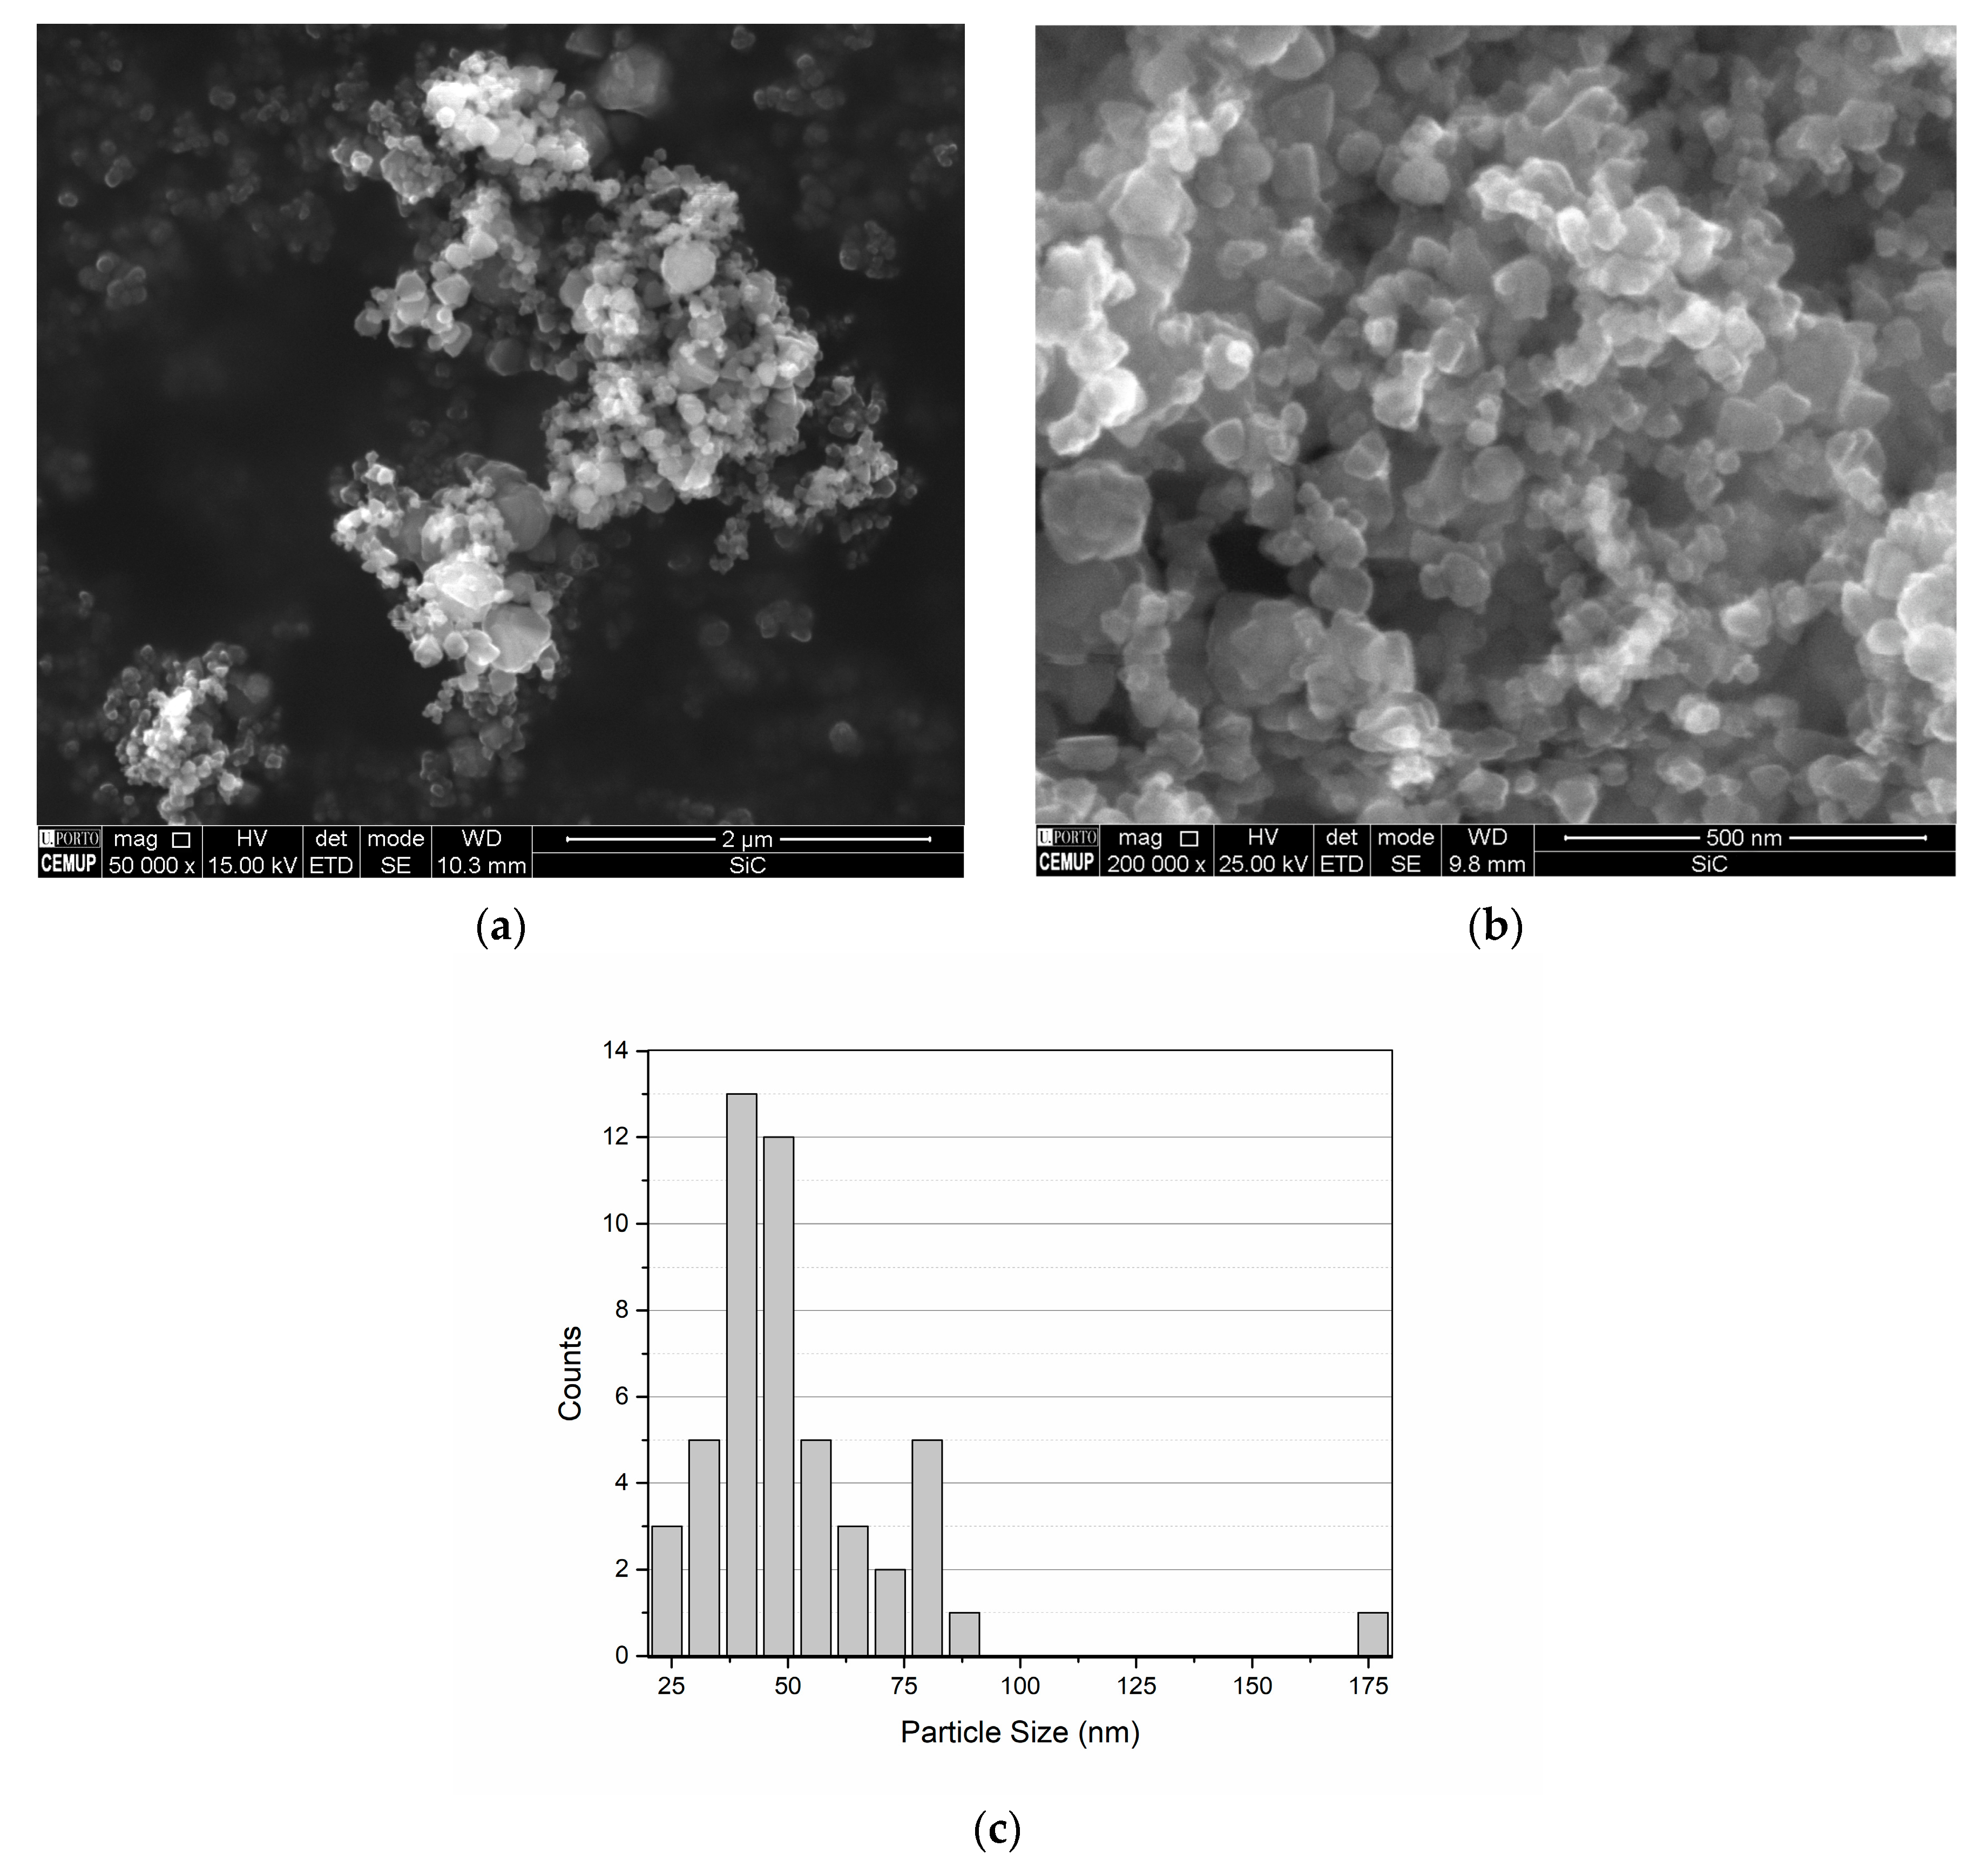
The Al powders used were obtained from Goodfellow Cambridge Ltd. (Huntingdon, UK) with a maximum size of less than 60 µm. The as-received powders and particles were characterized by scanning electron microscopy (SEM) using a FEI QUANTA 400 FEG equipment (Hillsboro, OR, USA) and the chemical composition by energy dispersive X-ray spectroscopy (EDS, Oxford Instrument, Oxfordshire, UK). The morphology and size of SiC nanoparticles supplied by Merck (Darmstadt, Germany) can be observed in
Figure 1. The SiC nanoparticles are characterized by an average particle size of 50 nm. However, there is a high standard deviation value due to particles with a wide range of sizes, most of which are less than 100 nm.
Table 1 shows the EDS chemical composition of the SiC particles and Al powders. The Al powders are characterized by the presence of a small amount of Fe.
The nanocomposites were produced by powder metallurgy. The dispersion and mixing of Al and SiC nanometric particles were conducted by ultrasonication in isopropanol and ethanol for 15 min with a frequency of 20.4 Hz. The conditions were selected based on the previous works [12-15] that investigated the dispersion of nanoreinforcements. The isopropanol or ethanol was filtered, and the powder mixtures were dried and cold pressed at 300 MPa into discs of around 6 mm diameter and 2 mm thickness. The different volume fraction of SiC reinforcement was investigated (0.5, 1.0, 1,5, and 2.0 vol.%). Sintering was performed in a horizontal tubular furnace, under an argon atmosphere, at 640 °C for 90 min. The sintering condition was selected based on the previous works on producing Al reinforced with carbon nanotubes nanocomposites [12-15].
The microstructural characterization of the nanocomposites was performed by optical microscopy (OM), SEM, and electron backscatter diffraction (EBSD). The equipment used for this characterization was an optical microscope, M 4000 M, with Leica Application Suite software (version 4.13.0, Leica Microsystems, Wetzlar, Germany) and a Thermo Fisher Scientific QUANTA 400 FEG SEM (Thermo Fisher Scientific, Hillsboro, OR, USA) with an EBSD TSL-EDAX detector unit (EDAX Inc. (Ametek), Mahwah, NJ, USA). The EBSD data were analyzed by TSL OIM Analysis 5.2 (Ametek Inc., Devon-Berwyn, PA, USA) and the ATEX version 3.28 (University of Lorraine, Metz, France) [
16].
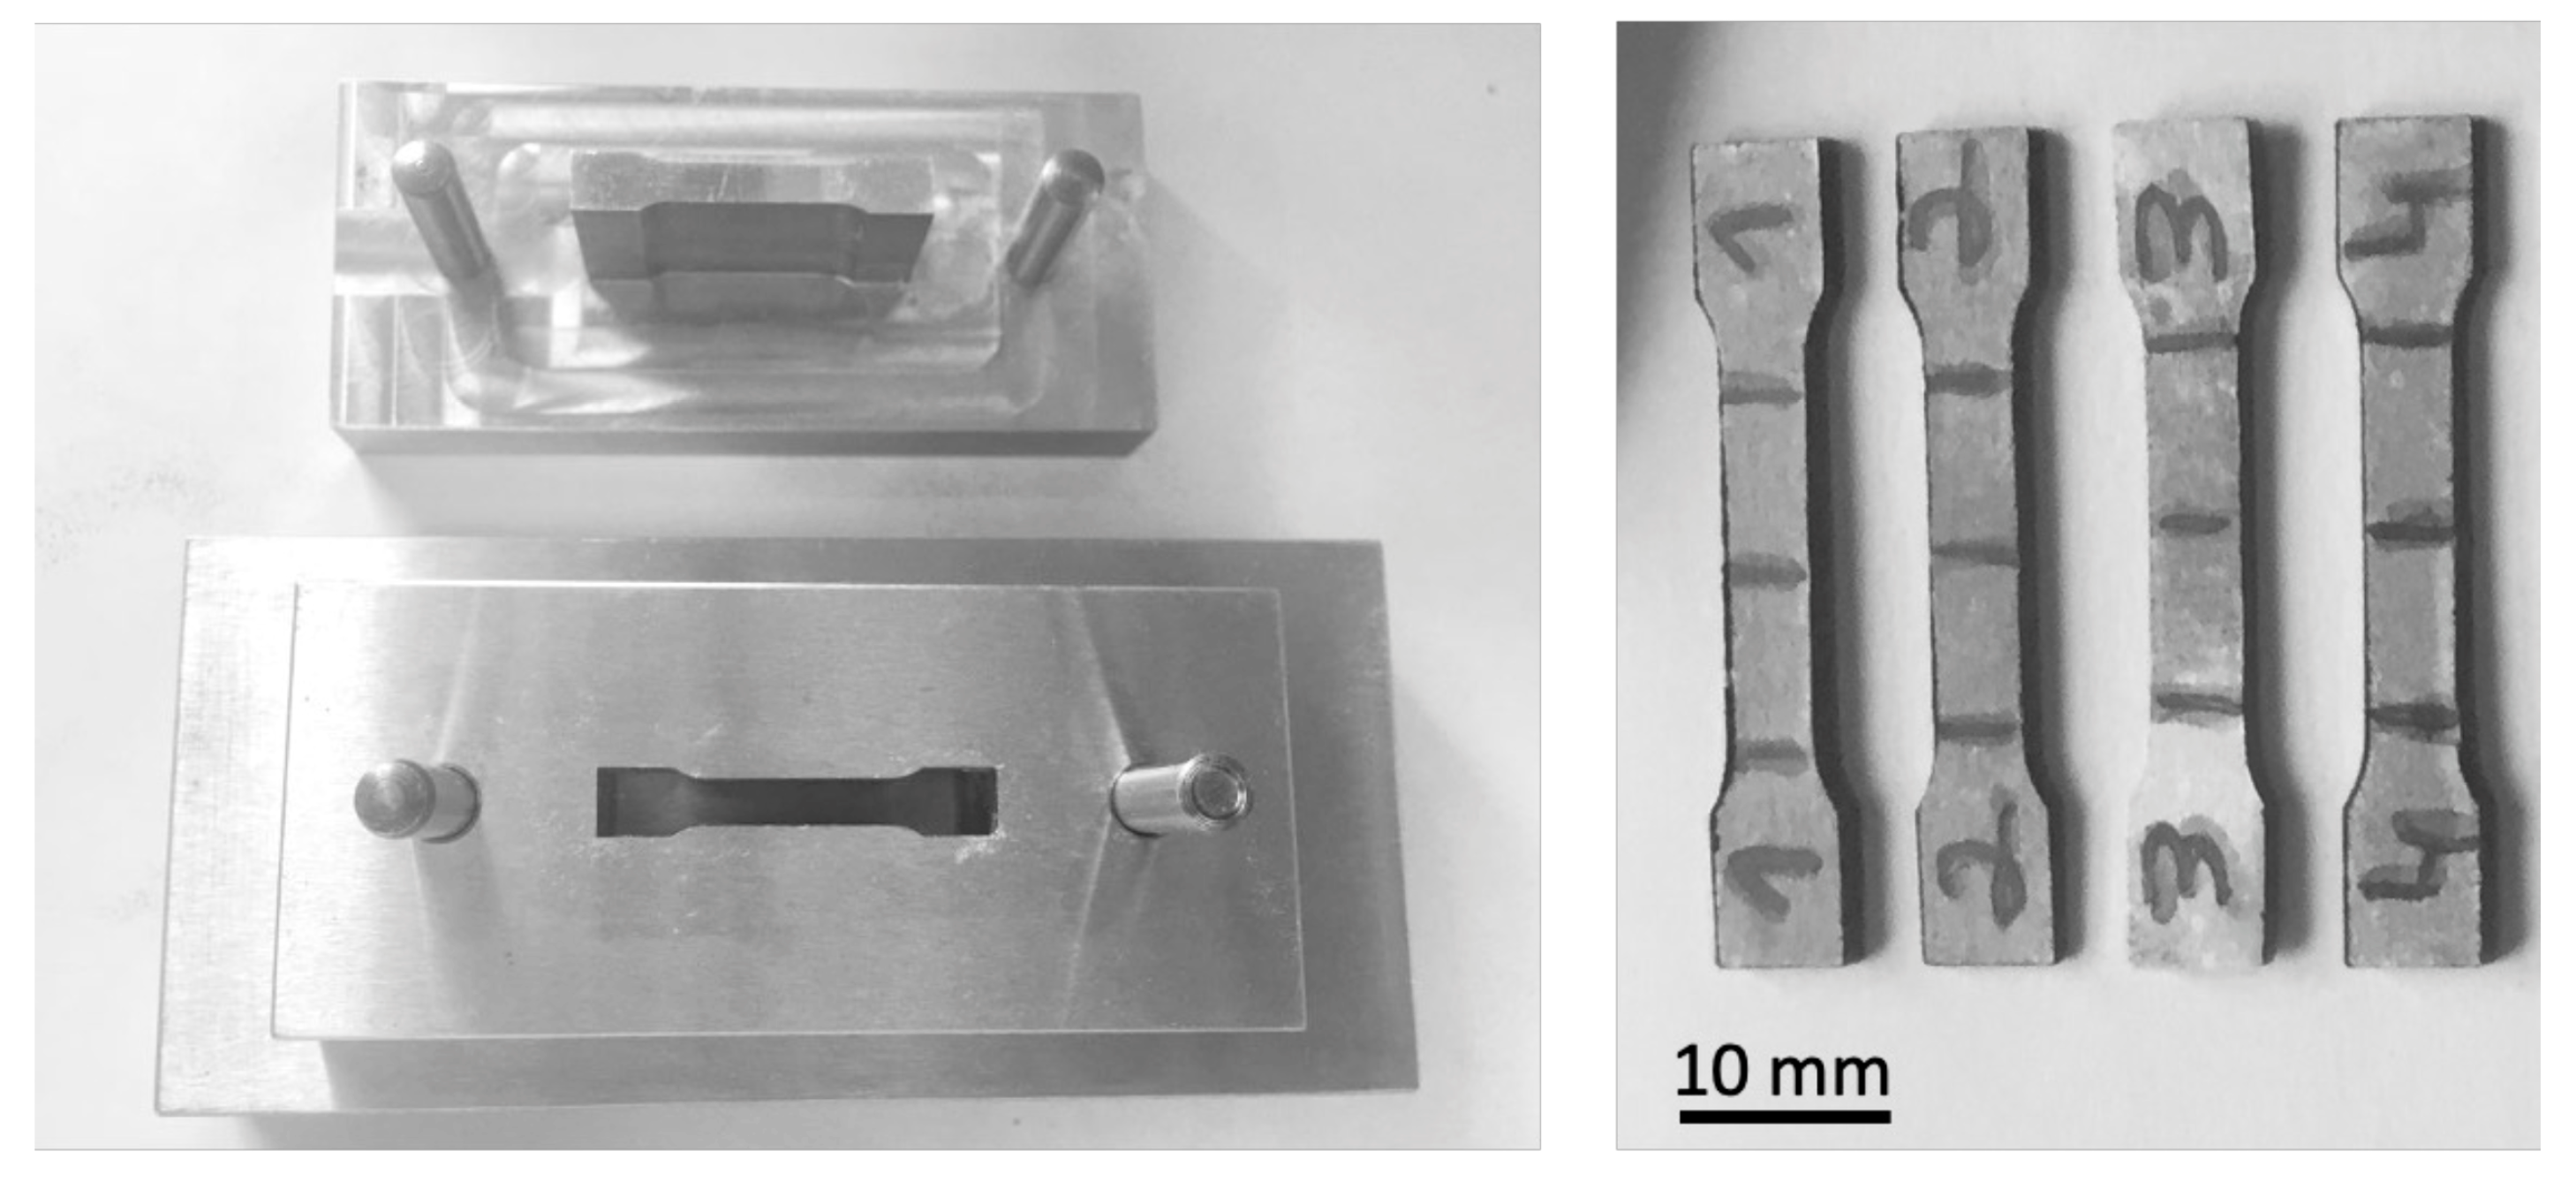
The mechanical properties were studied using microhardness Vickers tests (98 mN for 15 s) to evaluate the hardness evolution. These tests were performed on Duramin-1 equipment (Struers, Ballerup, Denmark). The tensile test was performed with a velocity of 1 mm/s, using Shimadzu EZ Test equipment (Shimadzu Corporation, Kyoto, Japan), and four samples of each nanocomposite and aluminum matrix were tested. The tensile specimens were produced by cold pressing with the mold shown in
Figure 2, followed by sintering. This figure also shows four samples of the nanocomposites produced.
3. Results and Discussion
Nanocomposites of aluminum reinforced with nanometric SiC were successfully produced by powder metallurgy using ultrasonication as a dispersion/mixture process. Different fraction of reinforcement was evaluated to determine the optimal conditions for producing these nanocomposites. In addition, different conditions of the dispersion/mixture were also tested. The microstructural and mechanical characterizations were performed in the nanocomposites with the best results regarding dispersion and volume fraction of SiC.
3.1. Investigation of conditions of dispersion and mixture technique
SiC-reinforced aluminum nanocomposites were successfully produced by powder metallurgy using ultrasonication as a dispersion/mixing process. Experiments were carried out with different liquids to evaluate the influence of the dispersing agent.
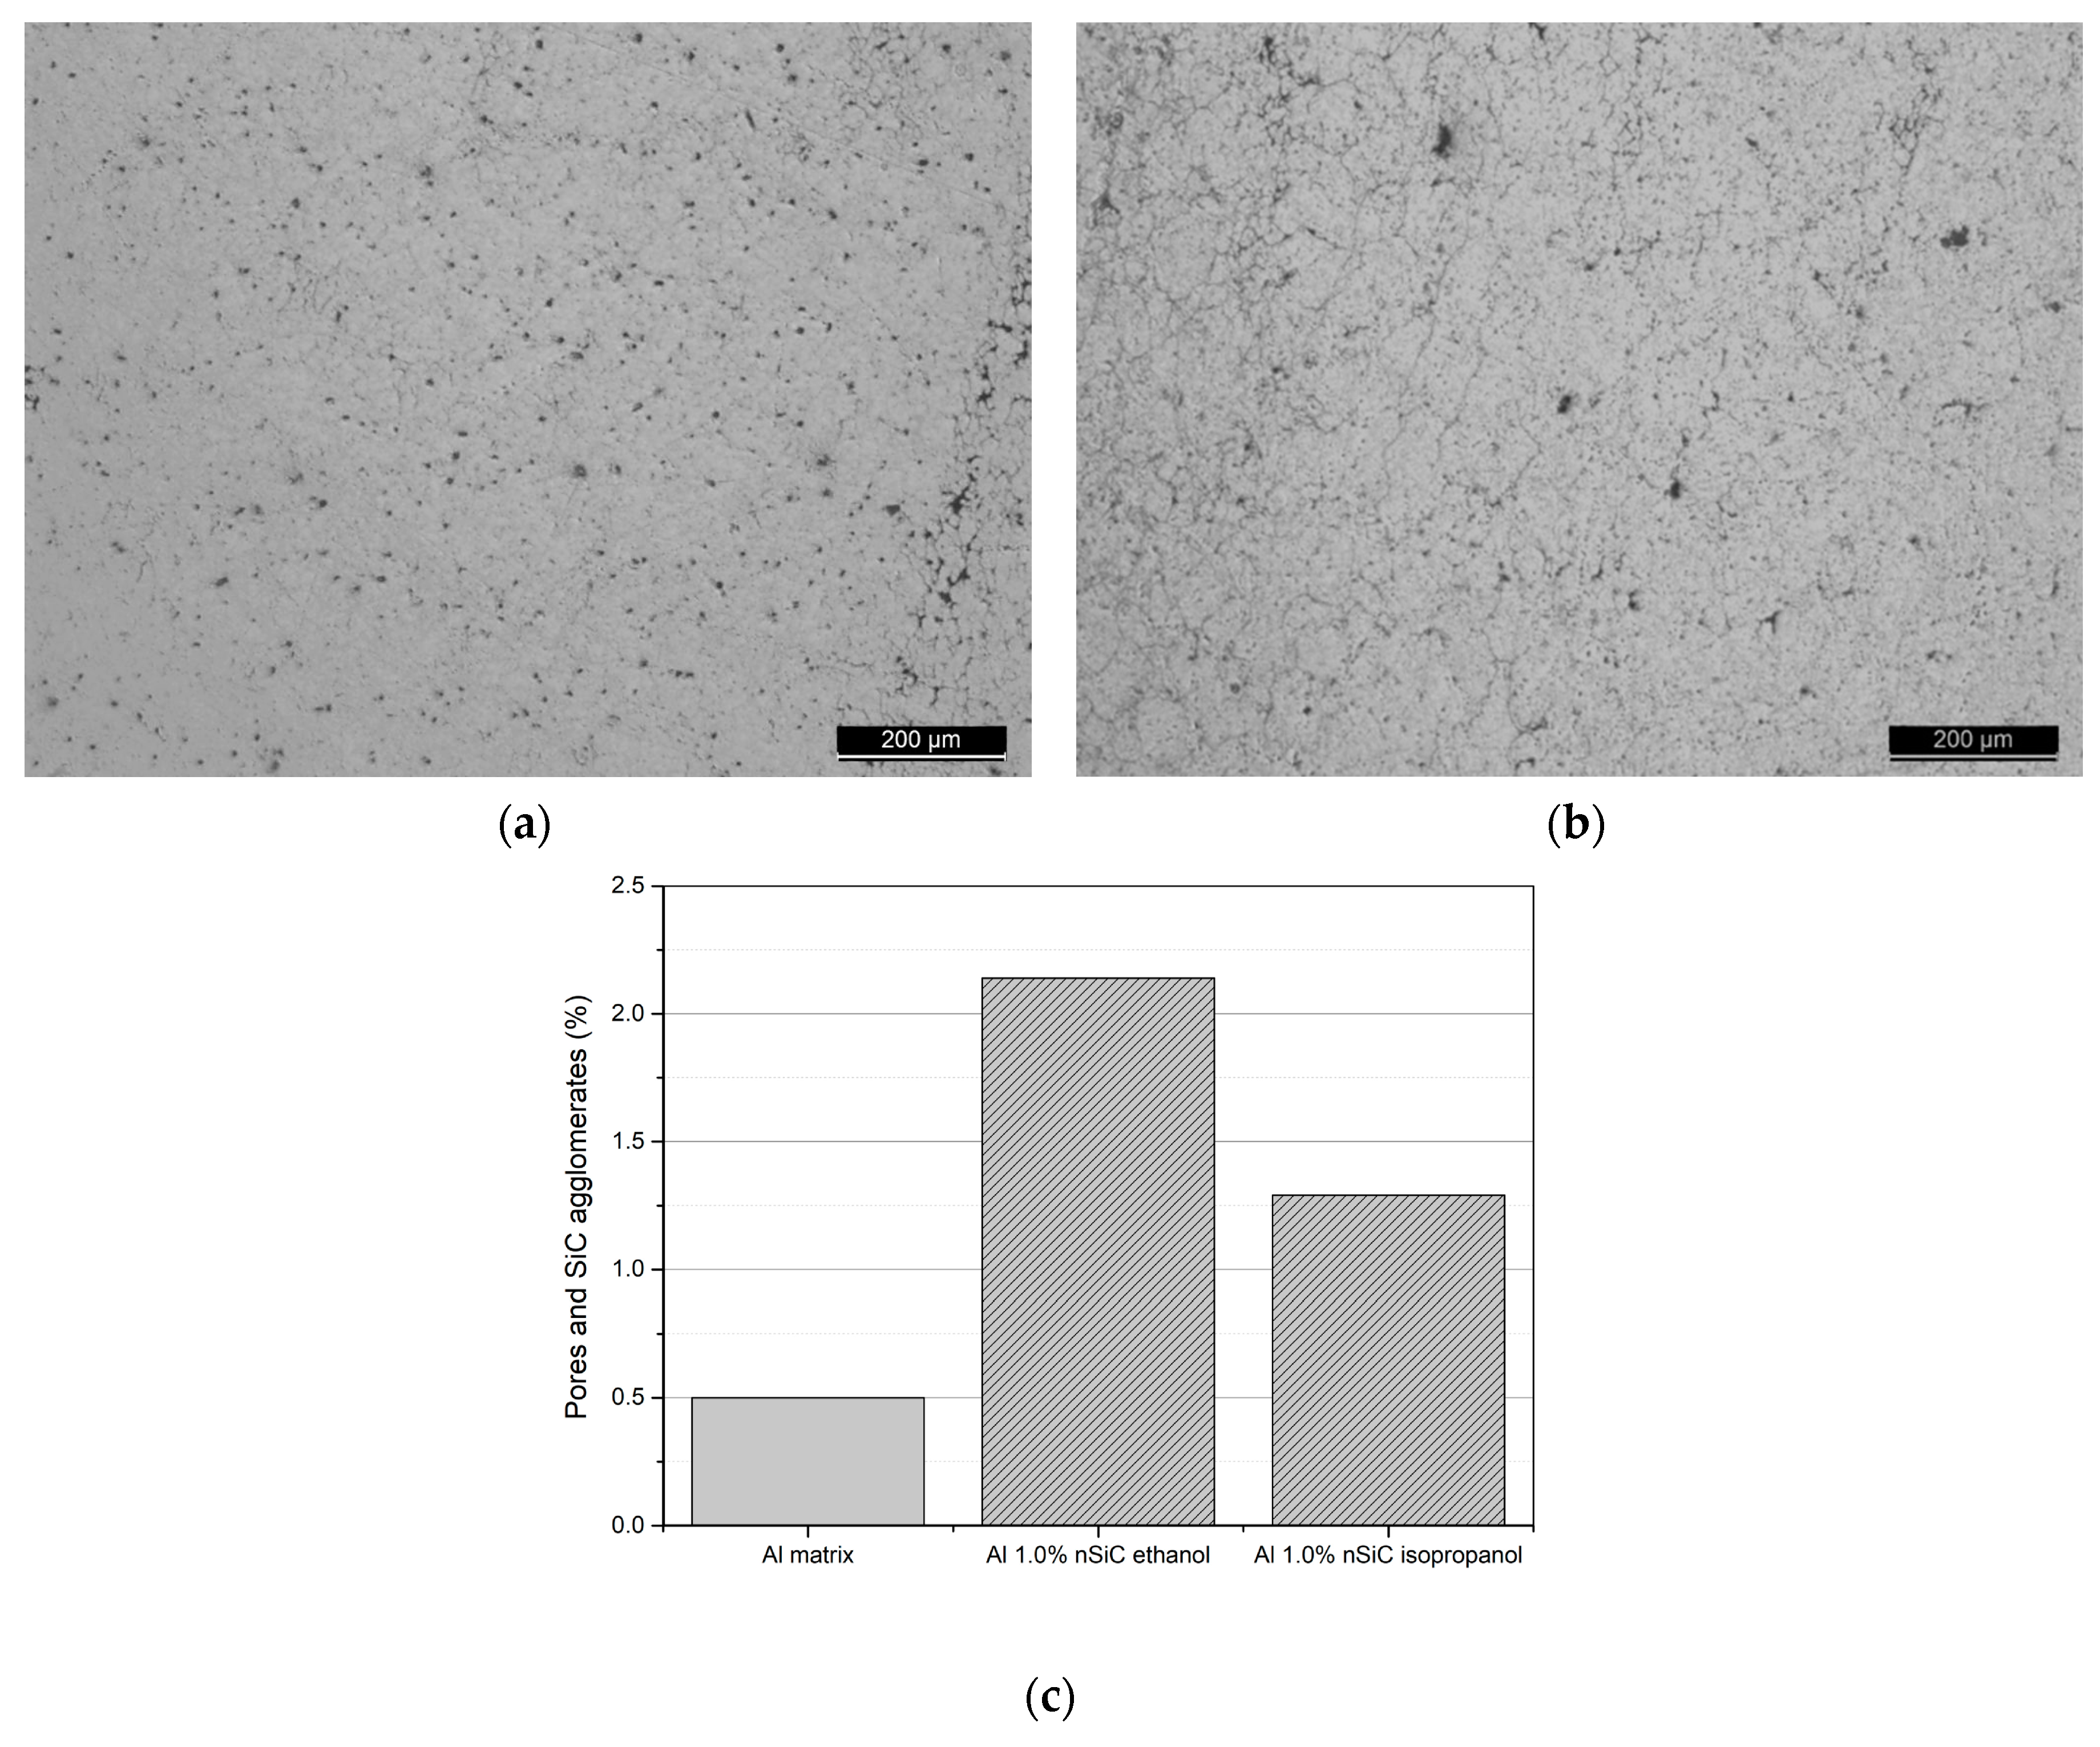
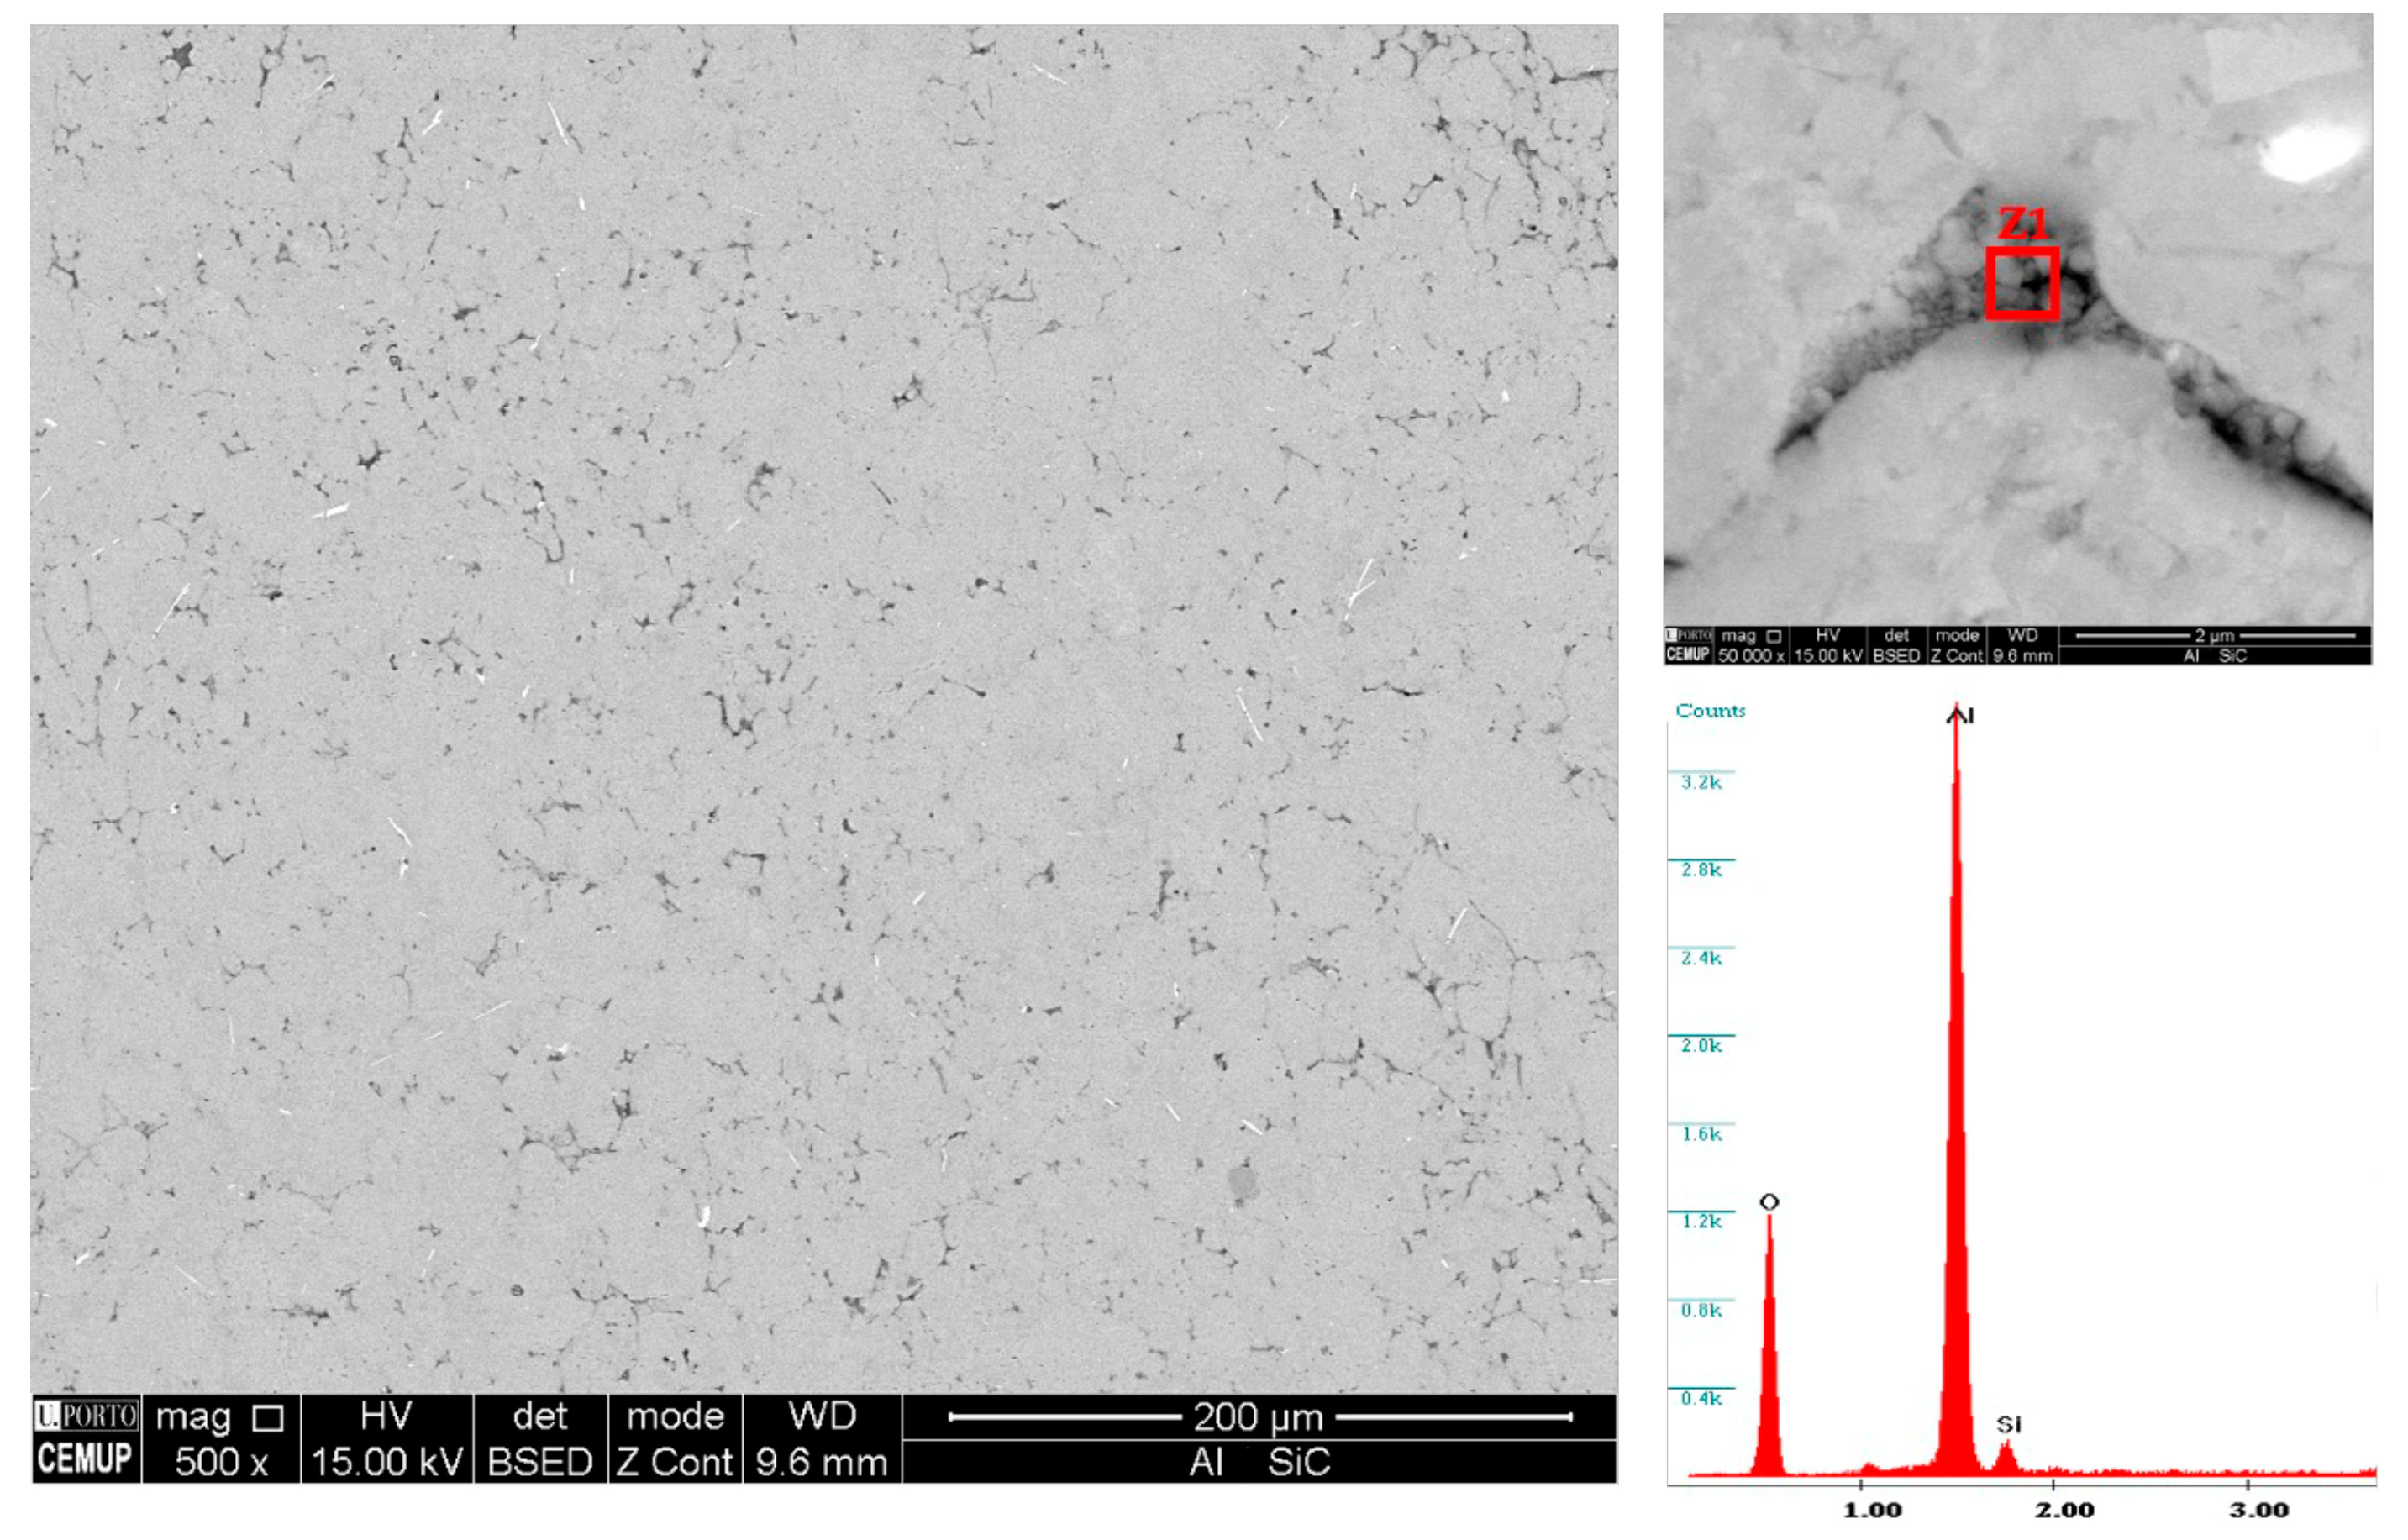
Figure 3 shows the microstructure images of the nanocomposite in OM, and the results of a fraction of SiC pores and agglomerates produced using ethanol or isopropanol as a liquid in ultrasound. The nanocomposites were characterized by a brighter matrix (Al matrix) and a darker phase (SiC agglomerates and pores). Based on the results, it is possible to confirm that SiC agglomeration decreased using isopropanol, which may be due to better dispersion. The SEM images combined with the EDS analysis confirm the presence of SiC, as seen in
Figure 4. Some agglomerates are observed, showing that there is still a possibility of improving their dispersion. In previous works, it was also impossible to eliminate the reinforcement agglomerates using the same dispersion and mixture method to produce nanocomposites reinforced with carbon nanotubes (CNTs) [12-14].
The dispersion of the SiC particles was tested in different liquids without Al powders to confirm the effect of different dispersion conditions and agents.
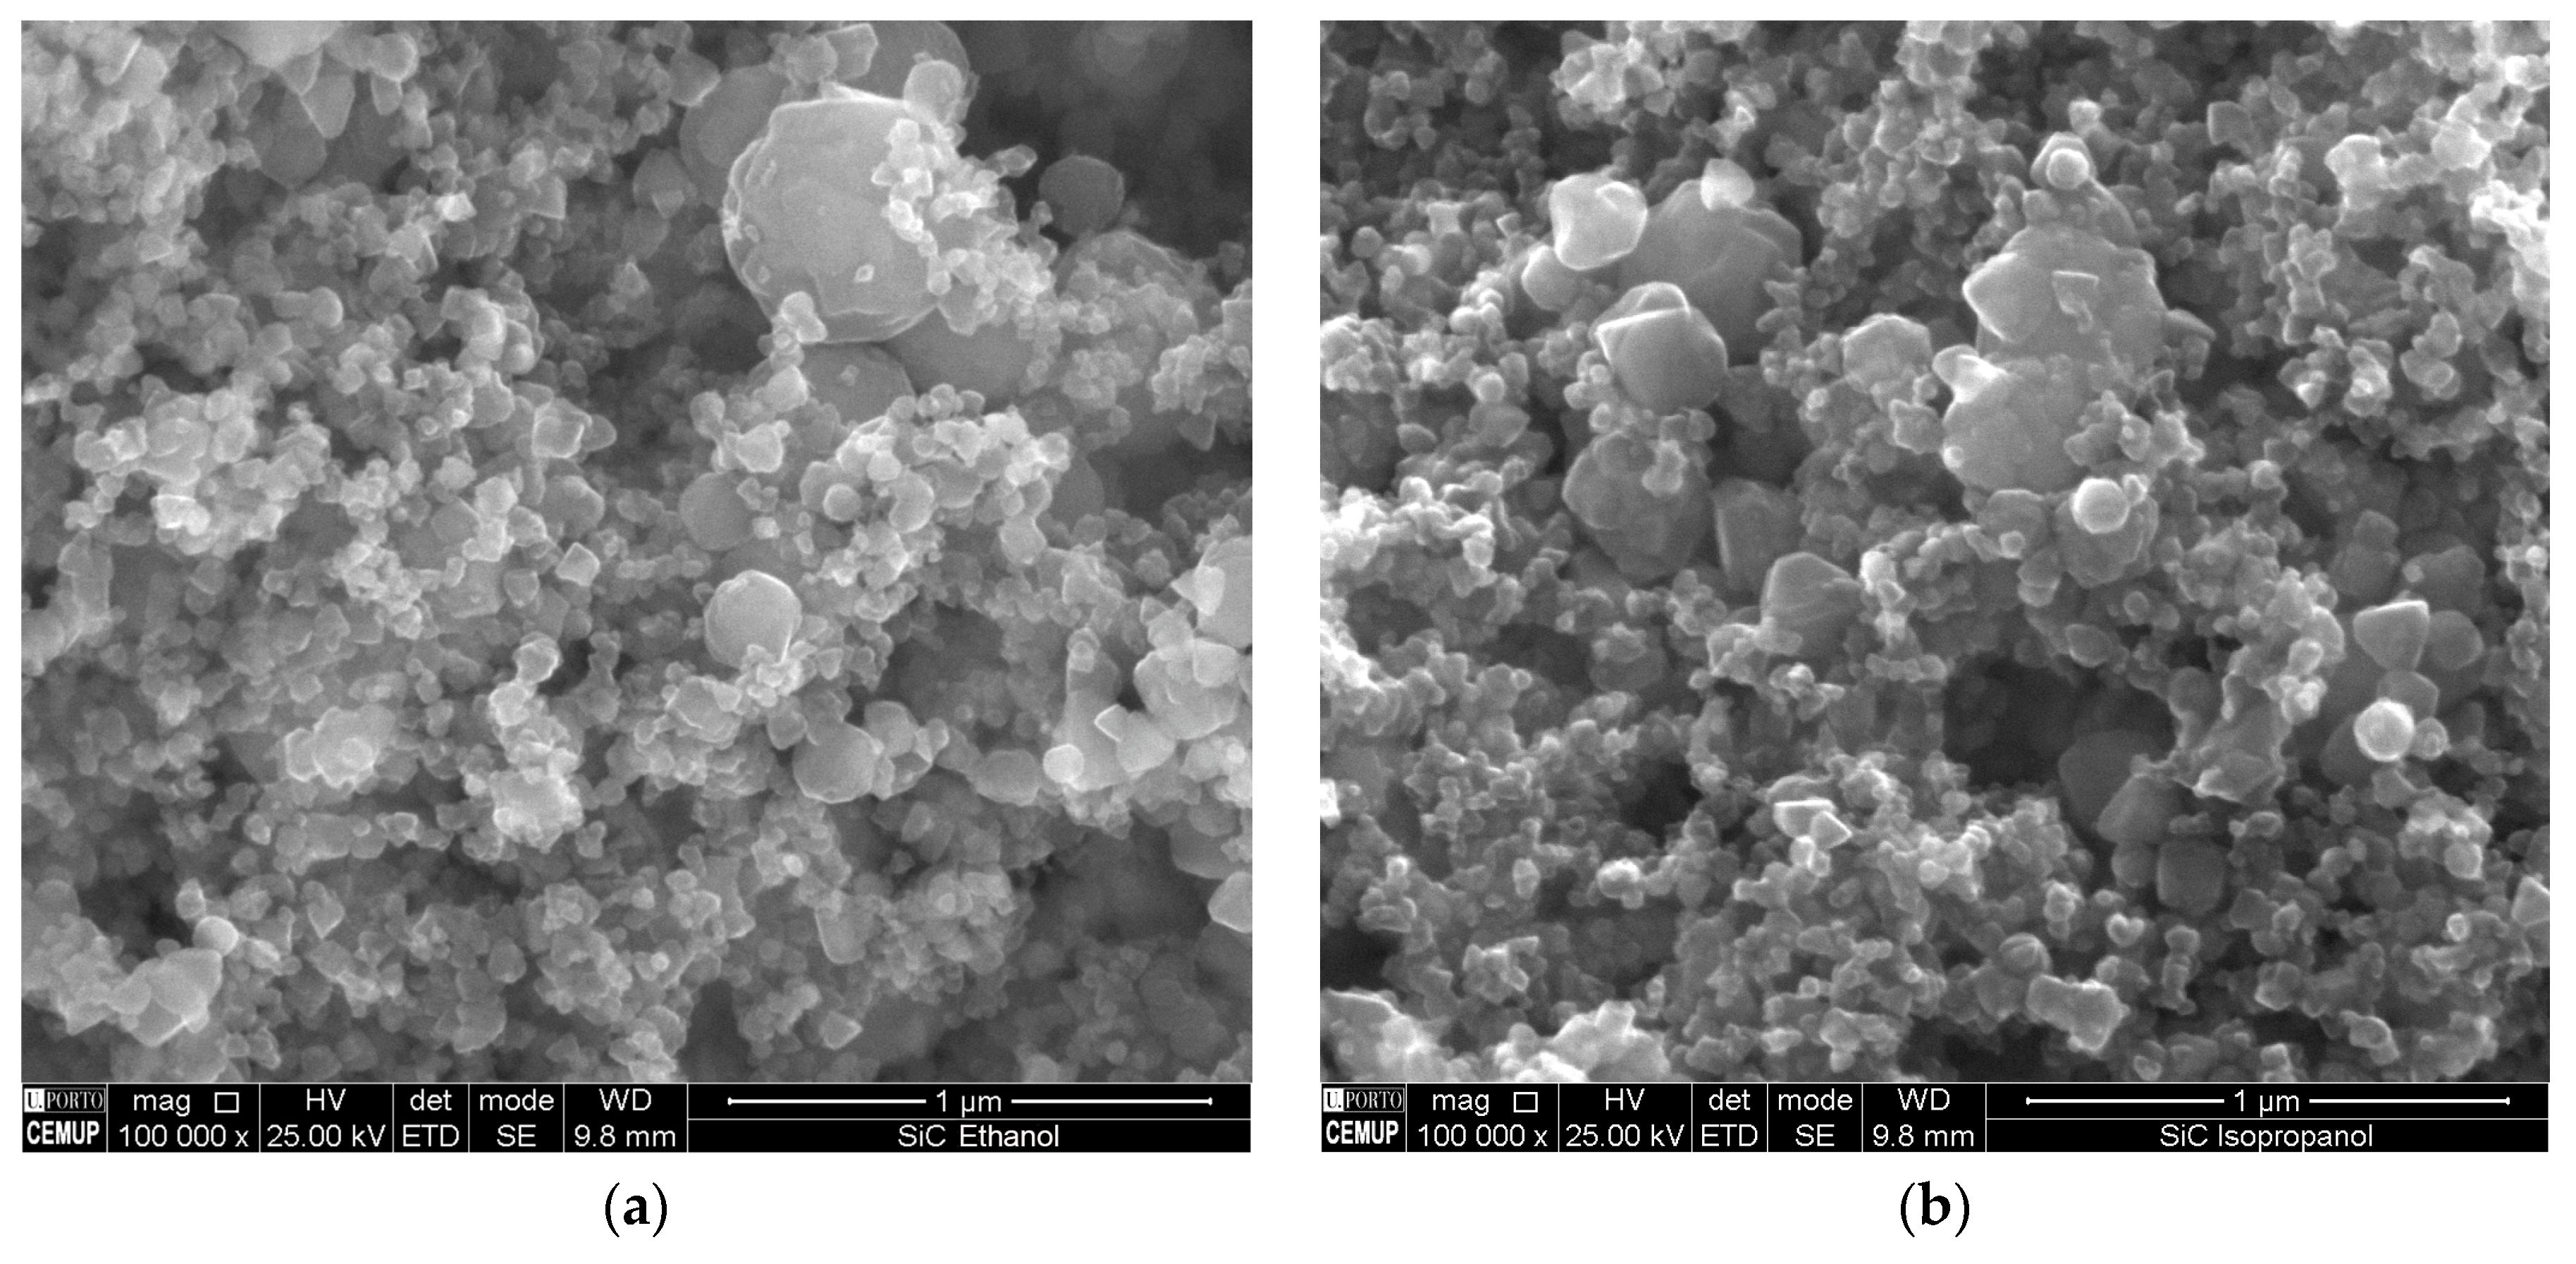
Figure 5 shows the SEM images of the SiC particles dispersed in ethanol and isopropanol. Isopropanol is effective in obtaining fewer agglomerated particles. In the images, the nanometric particles in isopropanol are more widely spaced than those in ethanol. Based on these results, the influence of volume fraction was studied using isopropanol in ultrasonication of SiC nanoparticles and Al powders.
3.2. Effect of the volume fraction of the SiC nanoparticles
The effect of the volume fraction of the nanometric SiC was investigated in the microstructure and mechanical properties of the nanocomposites. The ultrasonication was conducted in isopropanol using dispersion and a mixture of the reinforcement and Al powders.
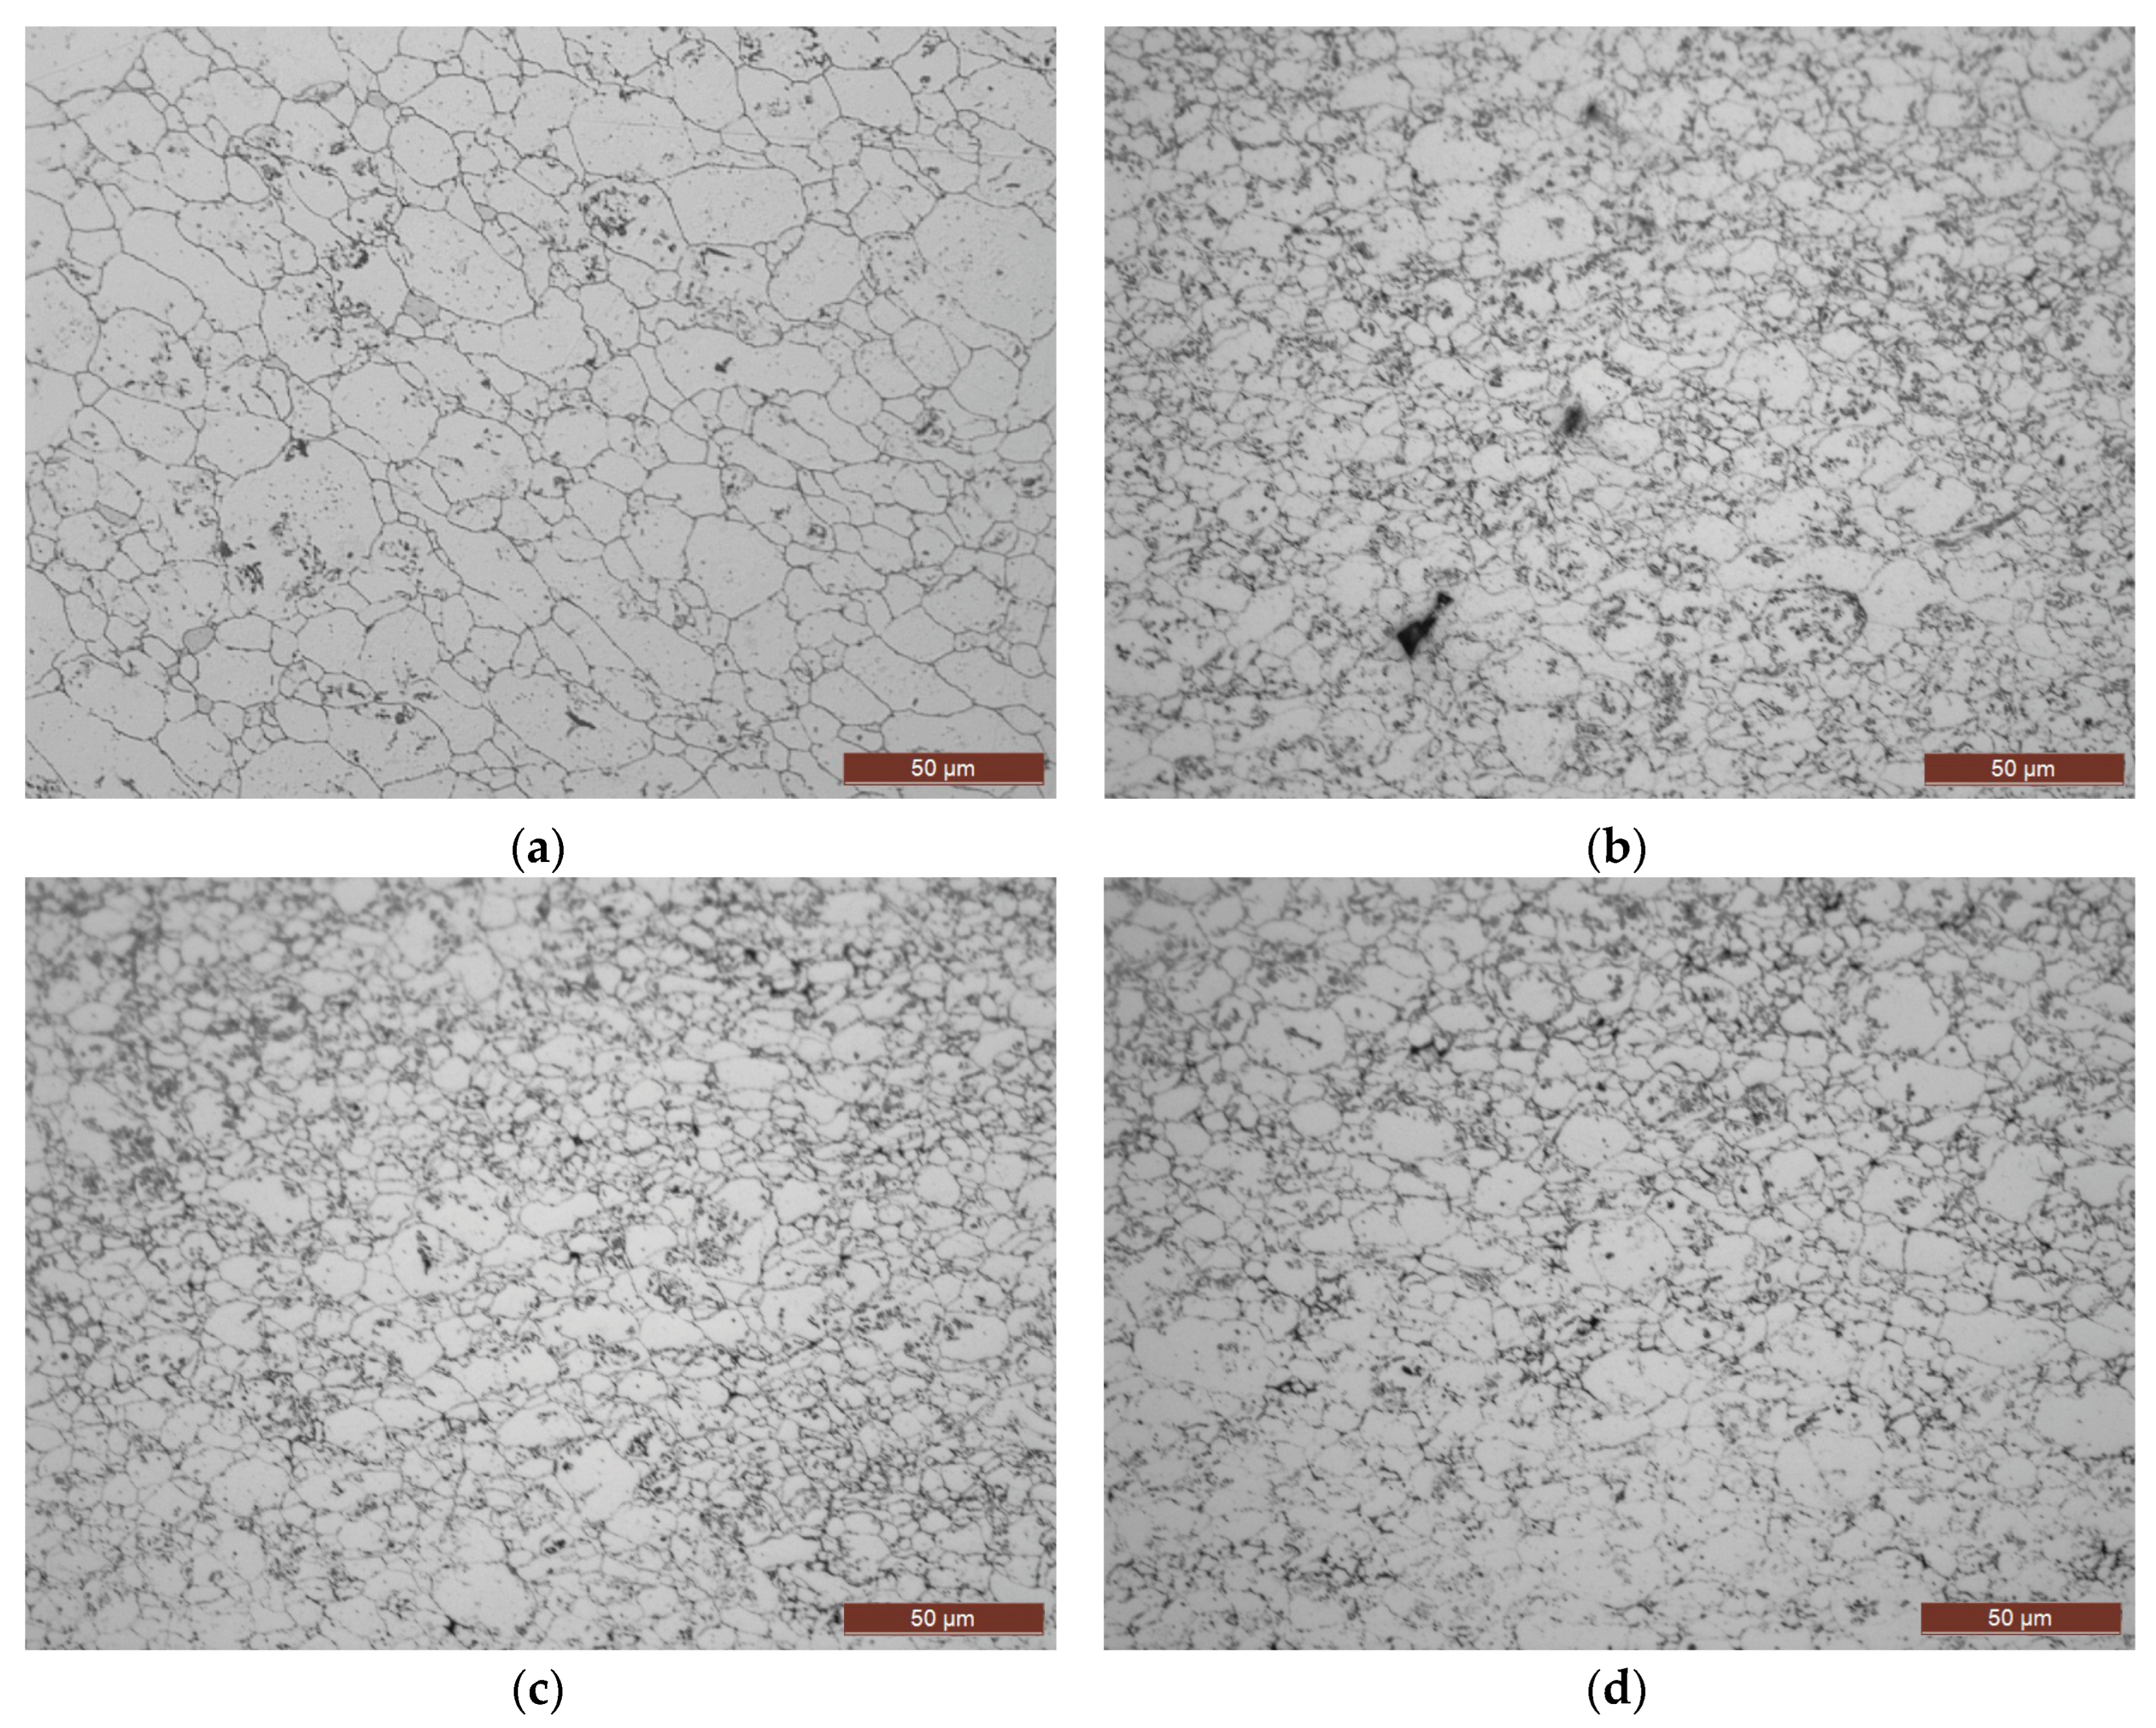
Figure 6 shows the nanocomposite microstructure images in OM, and
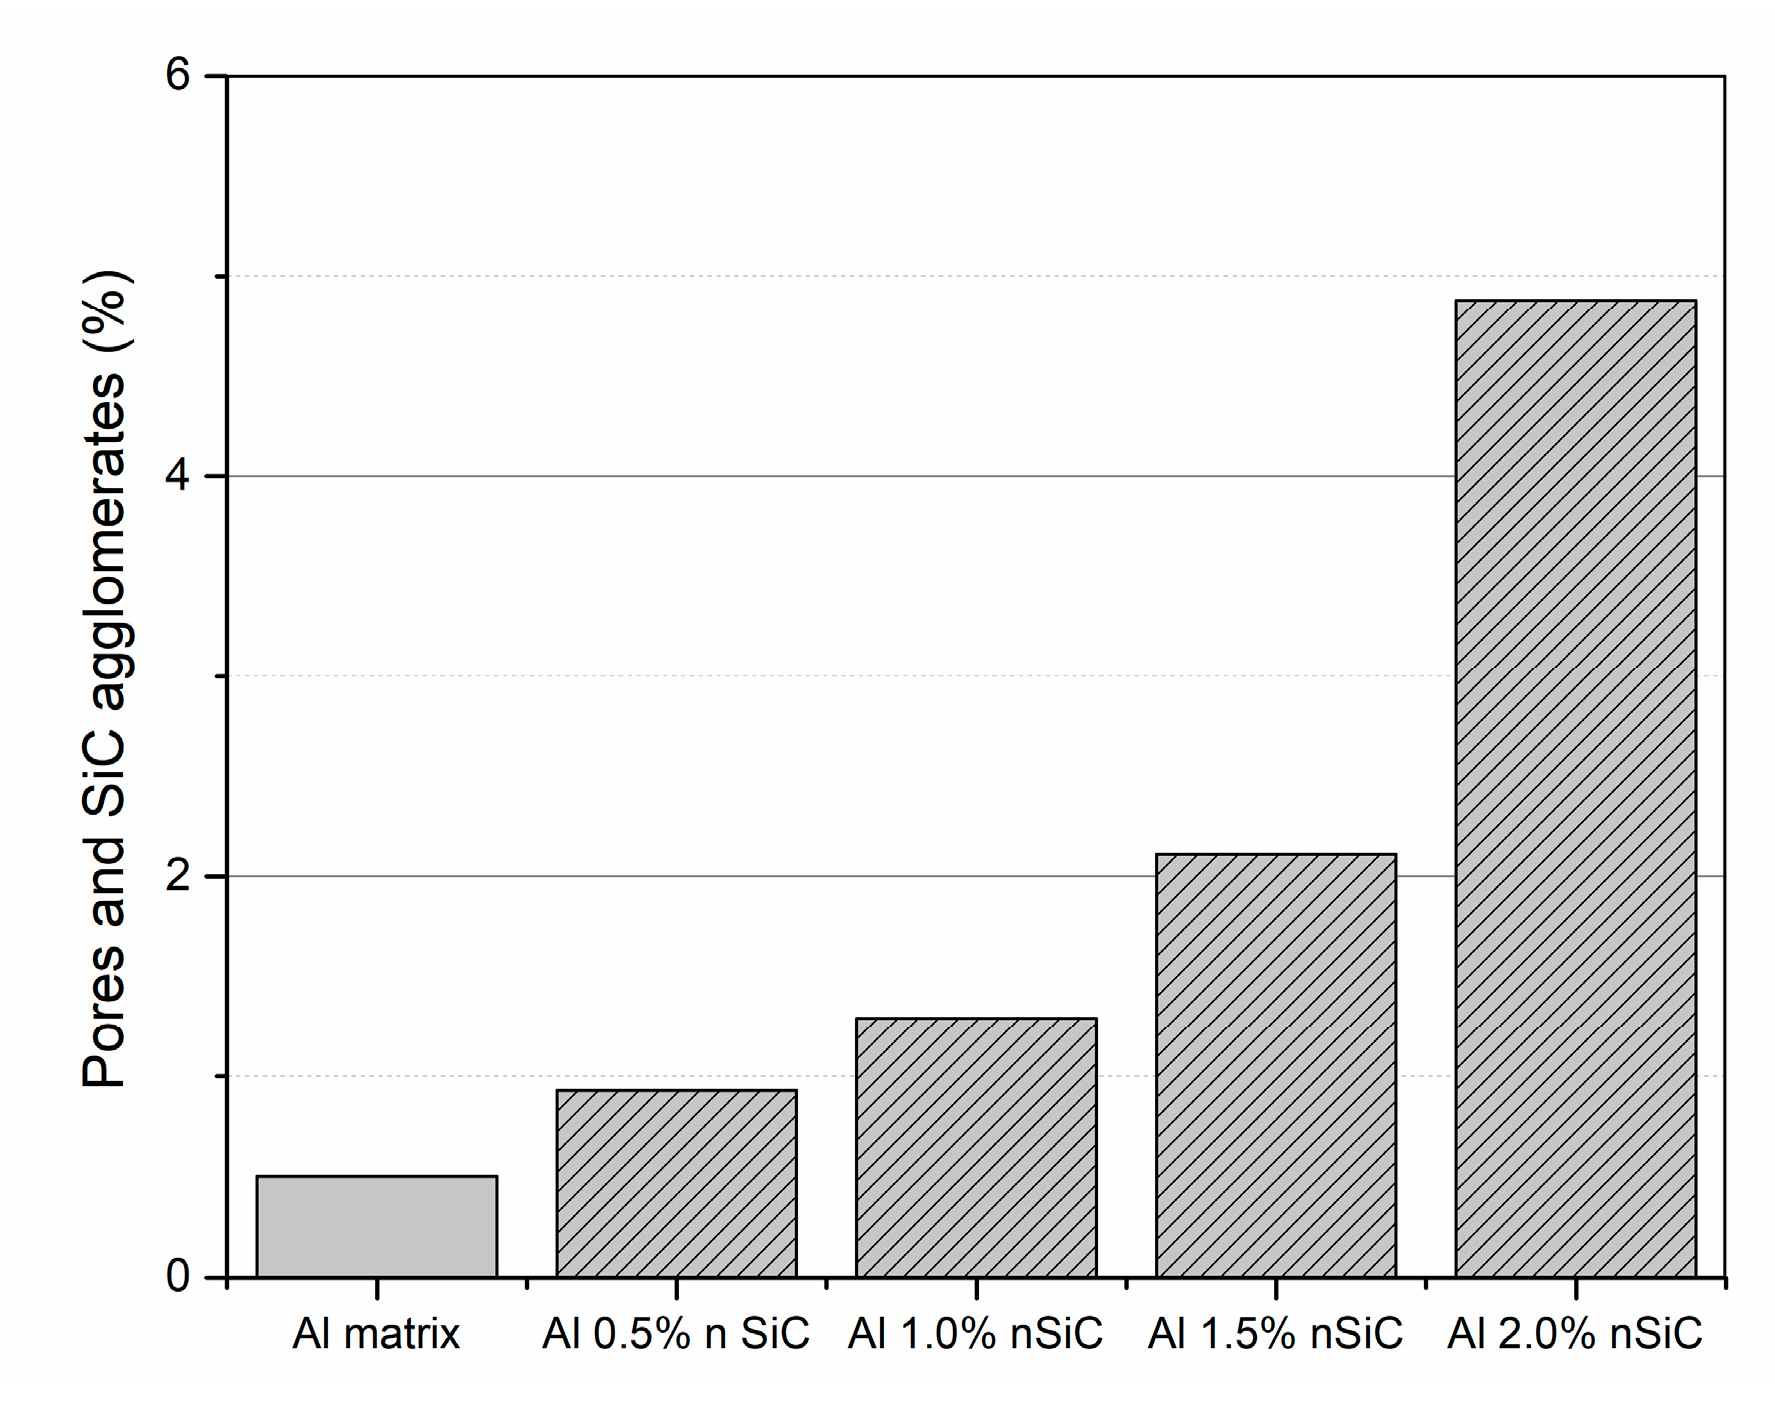
Figure 7 the results of the fraction of pores and agglomerates of SiC produced using different volume fractions of the reinforcement. The number and size of the agglomeration of the SiC depends on the fraction volume. As the fraction of reinforcement increases, the size and the number of agglomerates also increase. Nanocomposites produced with 1.0 vol. % of SiC show less agglomeration. Similar results were observed for other aluminum matrix nanocomposites reinforced with carbon nanotubes using ultrasonication as a dispersion/mixture process [12-14].
Other authors observe similar results on the nanocomposites of Al reinforced with SiC nanoparticles. Shaikh et al. [
17], who analyzed the influence of the SiC content added to the nanocomposite, observed an increase in porosity as the fraction of SiC added increased. These authors support the presence and development of porosities by the difference between the coefficient of thermal expansion of the matrix and the reinforcement and by the agglomeration of particles.
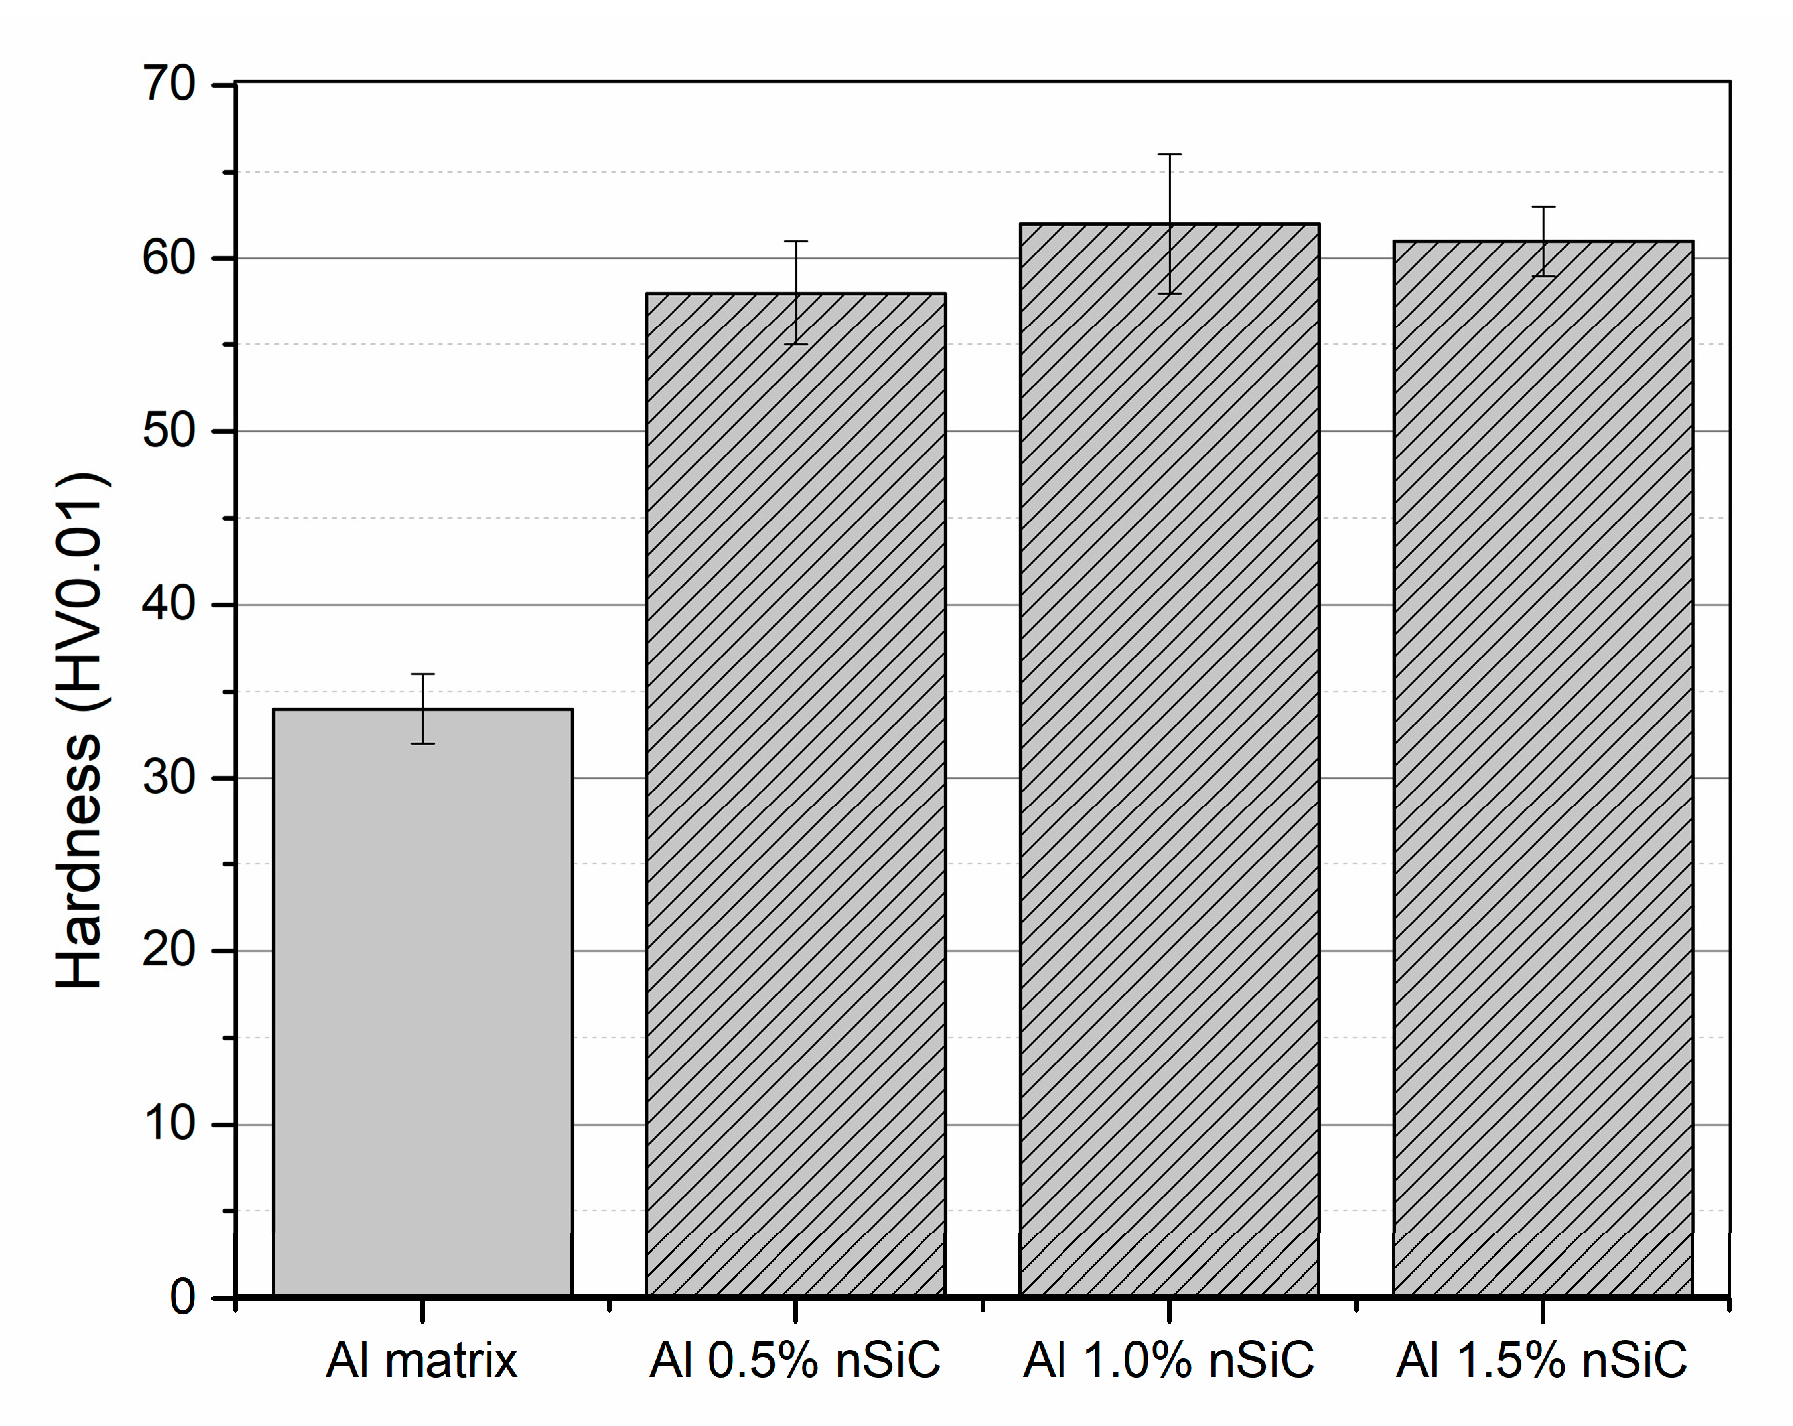
The increase of the SiC volume fraction added to the aluminum matrix is expected to influence the mechanical properties of the composite, promoting the strengthening effect. Vickers microhardness tests (HV 0.01) were carried out to determine these and the evolution of the hardness with the volume fraction of SiC can be observed in
Figure 8. Analysis of the results shows that adding SiC particles had the desired hardness effect. As the SiC content increased, there was an increase in the hardness values of the samples, peaking at 1.0 vol% of SiC. Only a small decrease is observed for the 1.5 vol% of SiC. However, since the dispersion results show that for 1.5 vol % SiC, there is a significant increase in agglomerates, the value of 1.0 vol% SiC is the fraction that allows the best properties to be obtained. This higher hardness value can be attributed to the fact that the reinforcement is made up of particles with a higher hardness than the matrix, which increases the properties of the nanocomposite. Other authors have observed similar results [
8] in the nanocomposites produced by powder metallurgy. However, the dispersion and mixture technique in this work proved effective as it allowed for a more significant increase in the hardness of the nanocomposites of around 70% compared with the Al matrix produced with the same conditions.
3.3. Characterization of Al nanocomposites reinforced with 1.0 vol% of SiC
Detailed microstructural and mechanical characterizations were performed in the nanocomposites produced with 1.0 vol %SiC using ultrasonication in isopropanol.
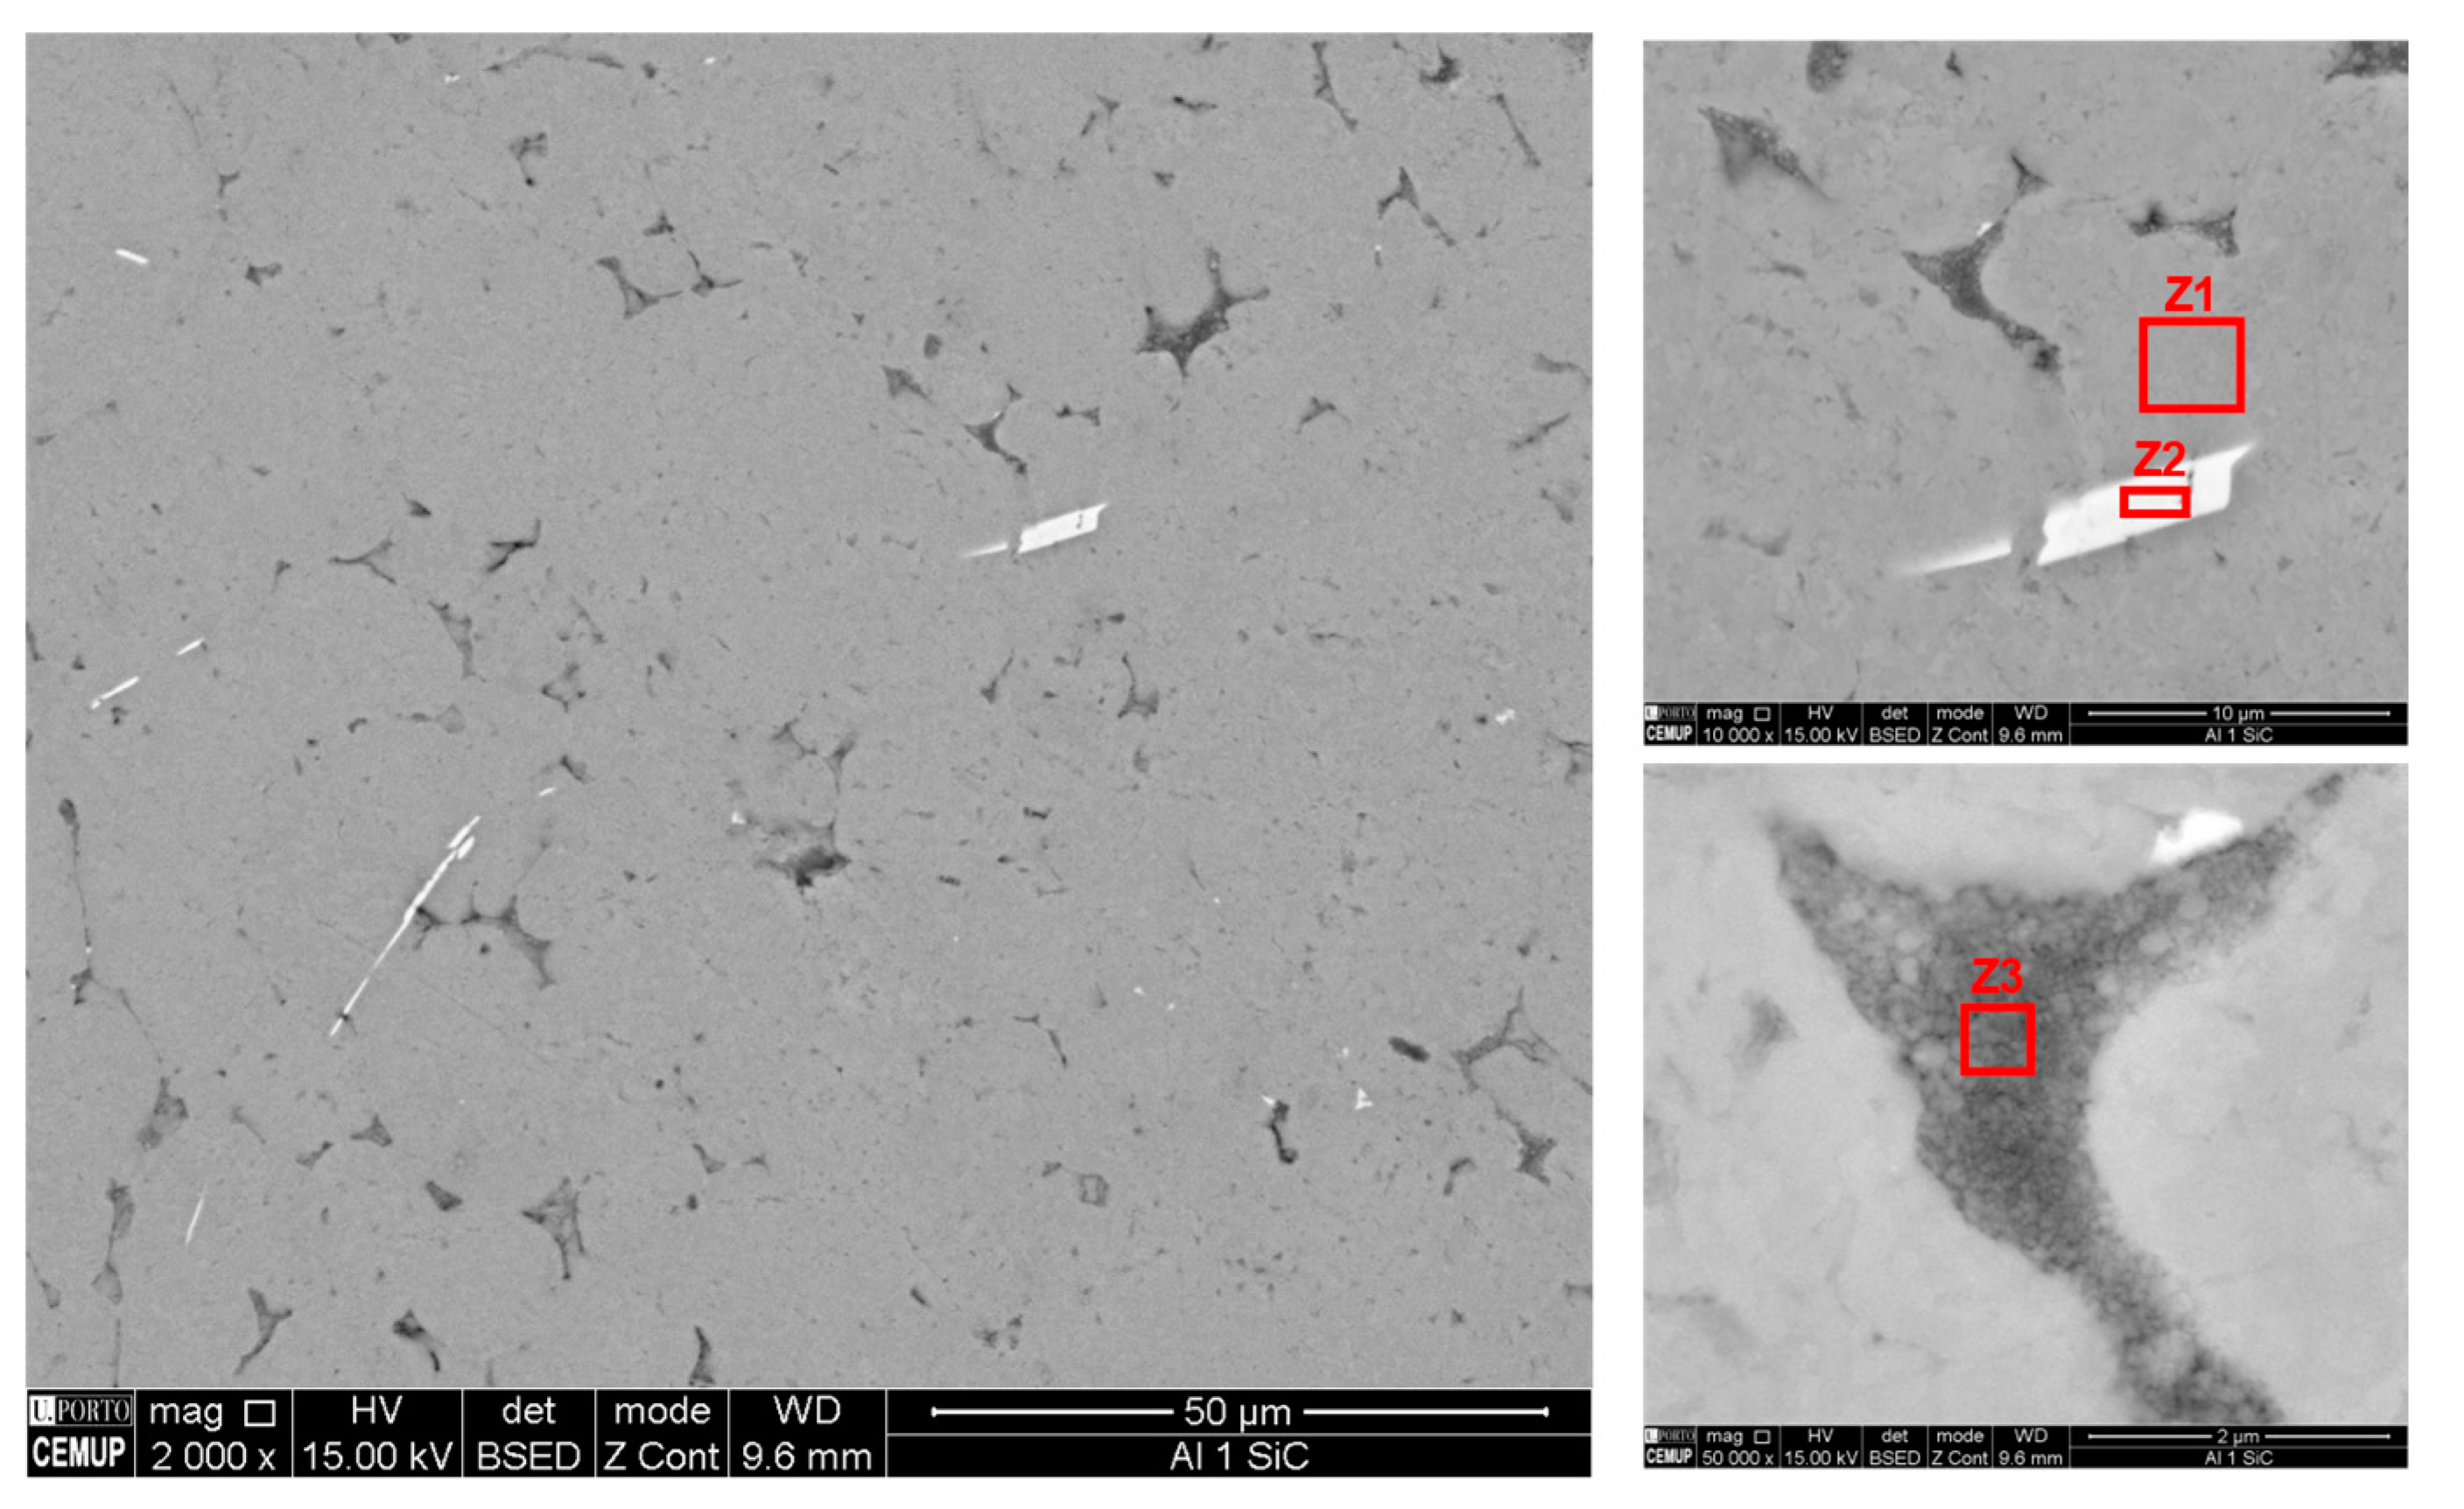
Figure 9 shows the SEM image of the microstructure of the nanocomposites. Based on these images, it is possible to confirm that the presence of SiC is present in the matrix of the nanocomposites. In addition, it is possible to detect bright particles throughout the Al matrix. EDS analyzed the different regions and can be observed in
Table 2. The presence of SiC is detected and is possibly observed in detail in
Figure 9. The high Al value is due to the interaction volume characteristic of this technique. Also, the brighter particles detected are characterized by Fe. This can be formed since as-received powders present an amount of Fe that, during the sintering, promotes the formation of these precipitates.
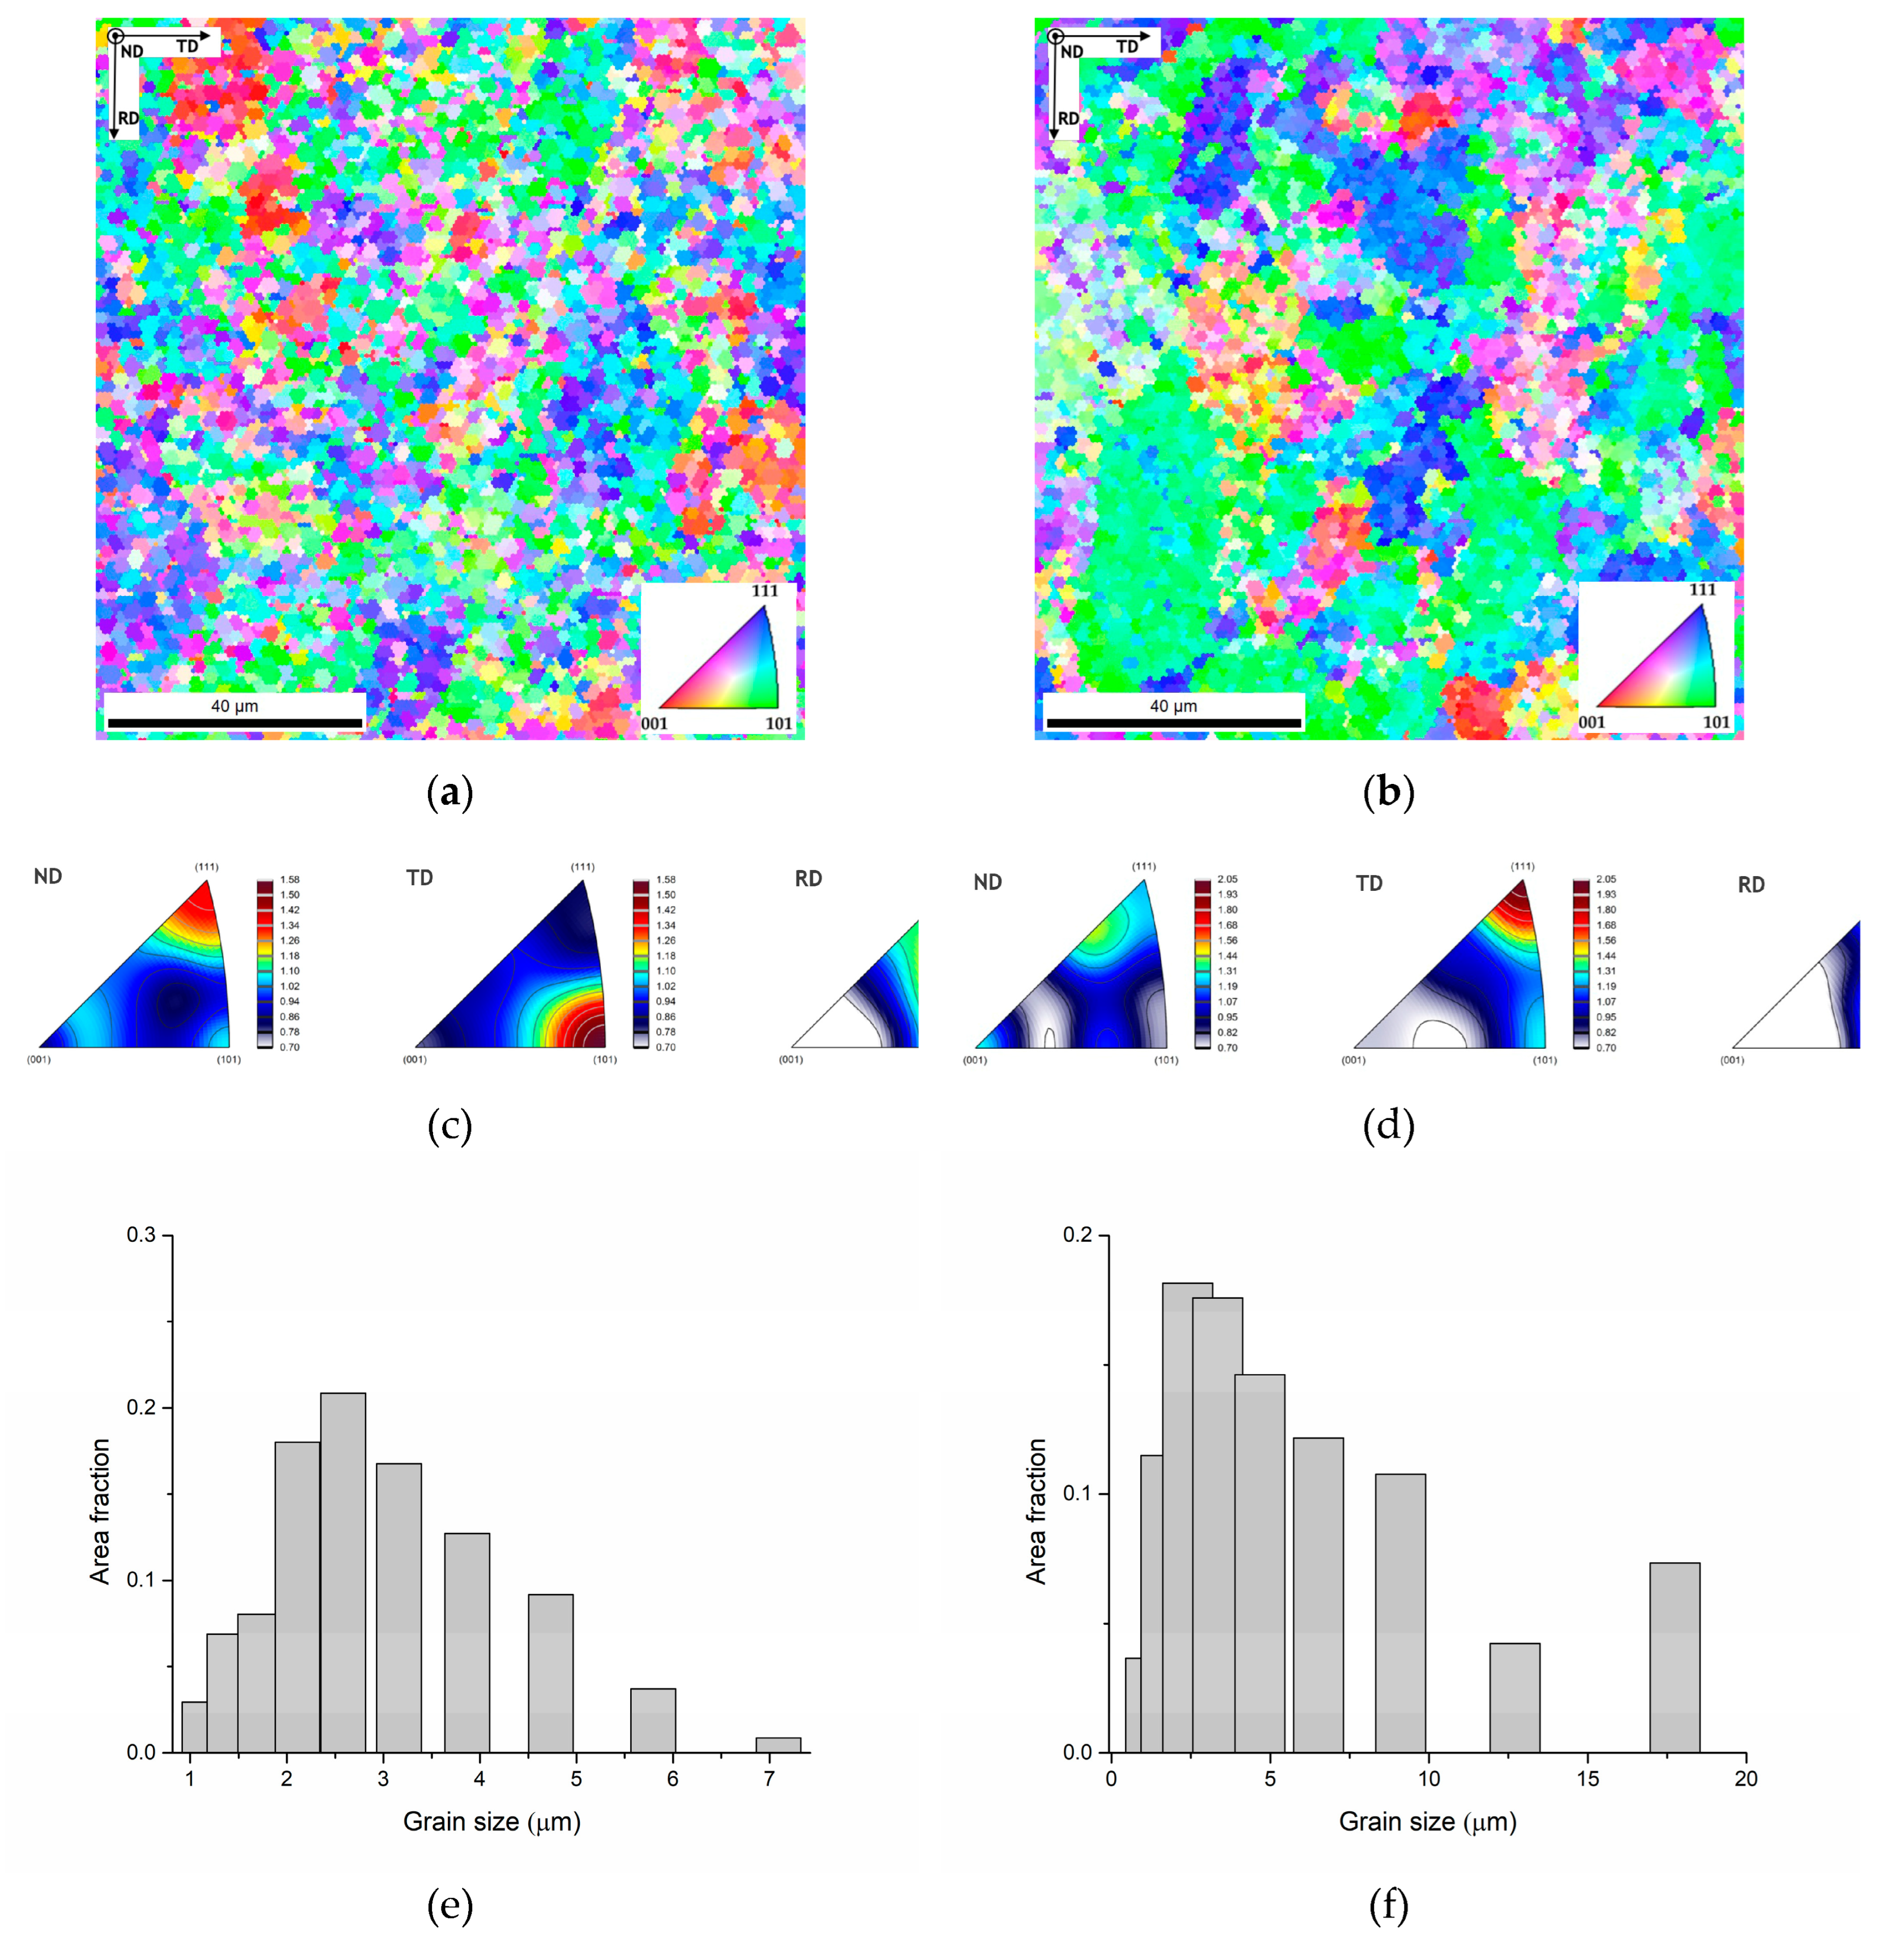
Electron backscatter diffraction (EBSD) was used to evaluate the grain size and crystallographic orientation of the Al matrix and nanocomposites.
Figure 10 shows the maps of inverse pole figures (IPF), the inverse pole figures (IPF) and the grain size distributions of the Al matrix and the nanocomposites produced with 1.0 vol% SiC. These results show that although the average grain size of the samples was close, the nanocomposites revealed a slightly larger grain size with significant variation (higher standard deviation). This could be due to a non-uniform SiC distribution. During sintering, the non-uniform distribution of the reinforcement will promote a microstructure characterized by grains of different sizes. This is because the SiC makes it difficult for the grain boundaries to move, promoting smaller sizes where SiC hinders their movement. However, this effect does not significantly affect the average grain size (2.3 μm) relative to the matrix with a more uniform grain size (2.1 μm).
The samples revealed a different crystallographic orientation but did not exhibit texture. With the analysis of IPF and IPF maps, the addition of SiC significantly affects the crystallographic orientation of Al grains. It can be analyzed in the transverse direction (TD) that the grains of the Al matrix present strong intensity in the <001> planes, and the nanocomposites present high intensity for <111>. Also, for the Al matrix in the normal direction (ND), the <111> present a strong intensity while for the nanocomposites it is not observed. This result can be explained due to the influence of SiC on grain rotation during sintering. This change promoted by the SiC addition can be important in strengthening the nanocomposite. Similar results are reported in aluminum matrix nanocomposites produced by powder metallurgy [
14,
15]. A higher magnification EBSD analysis is present in
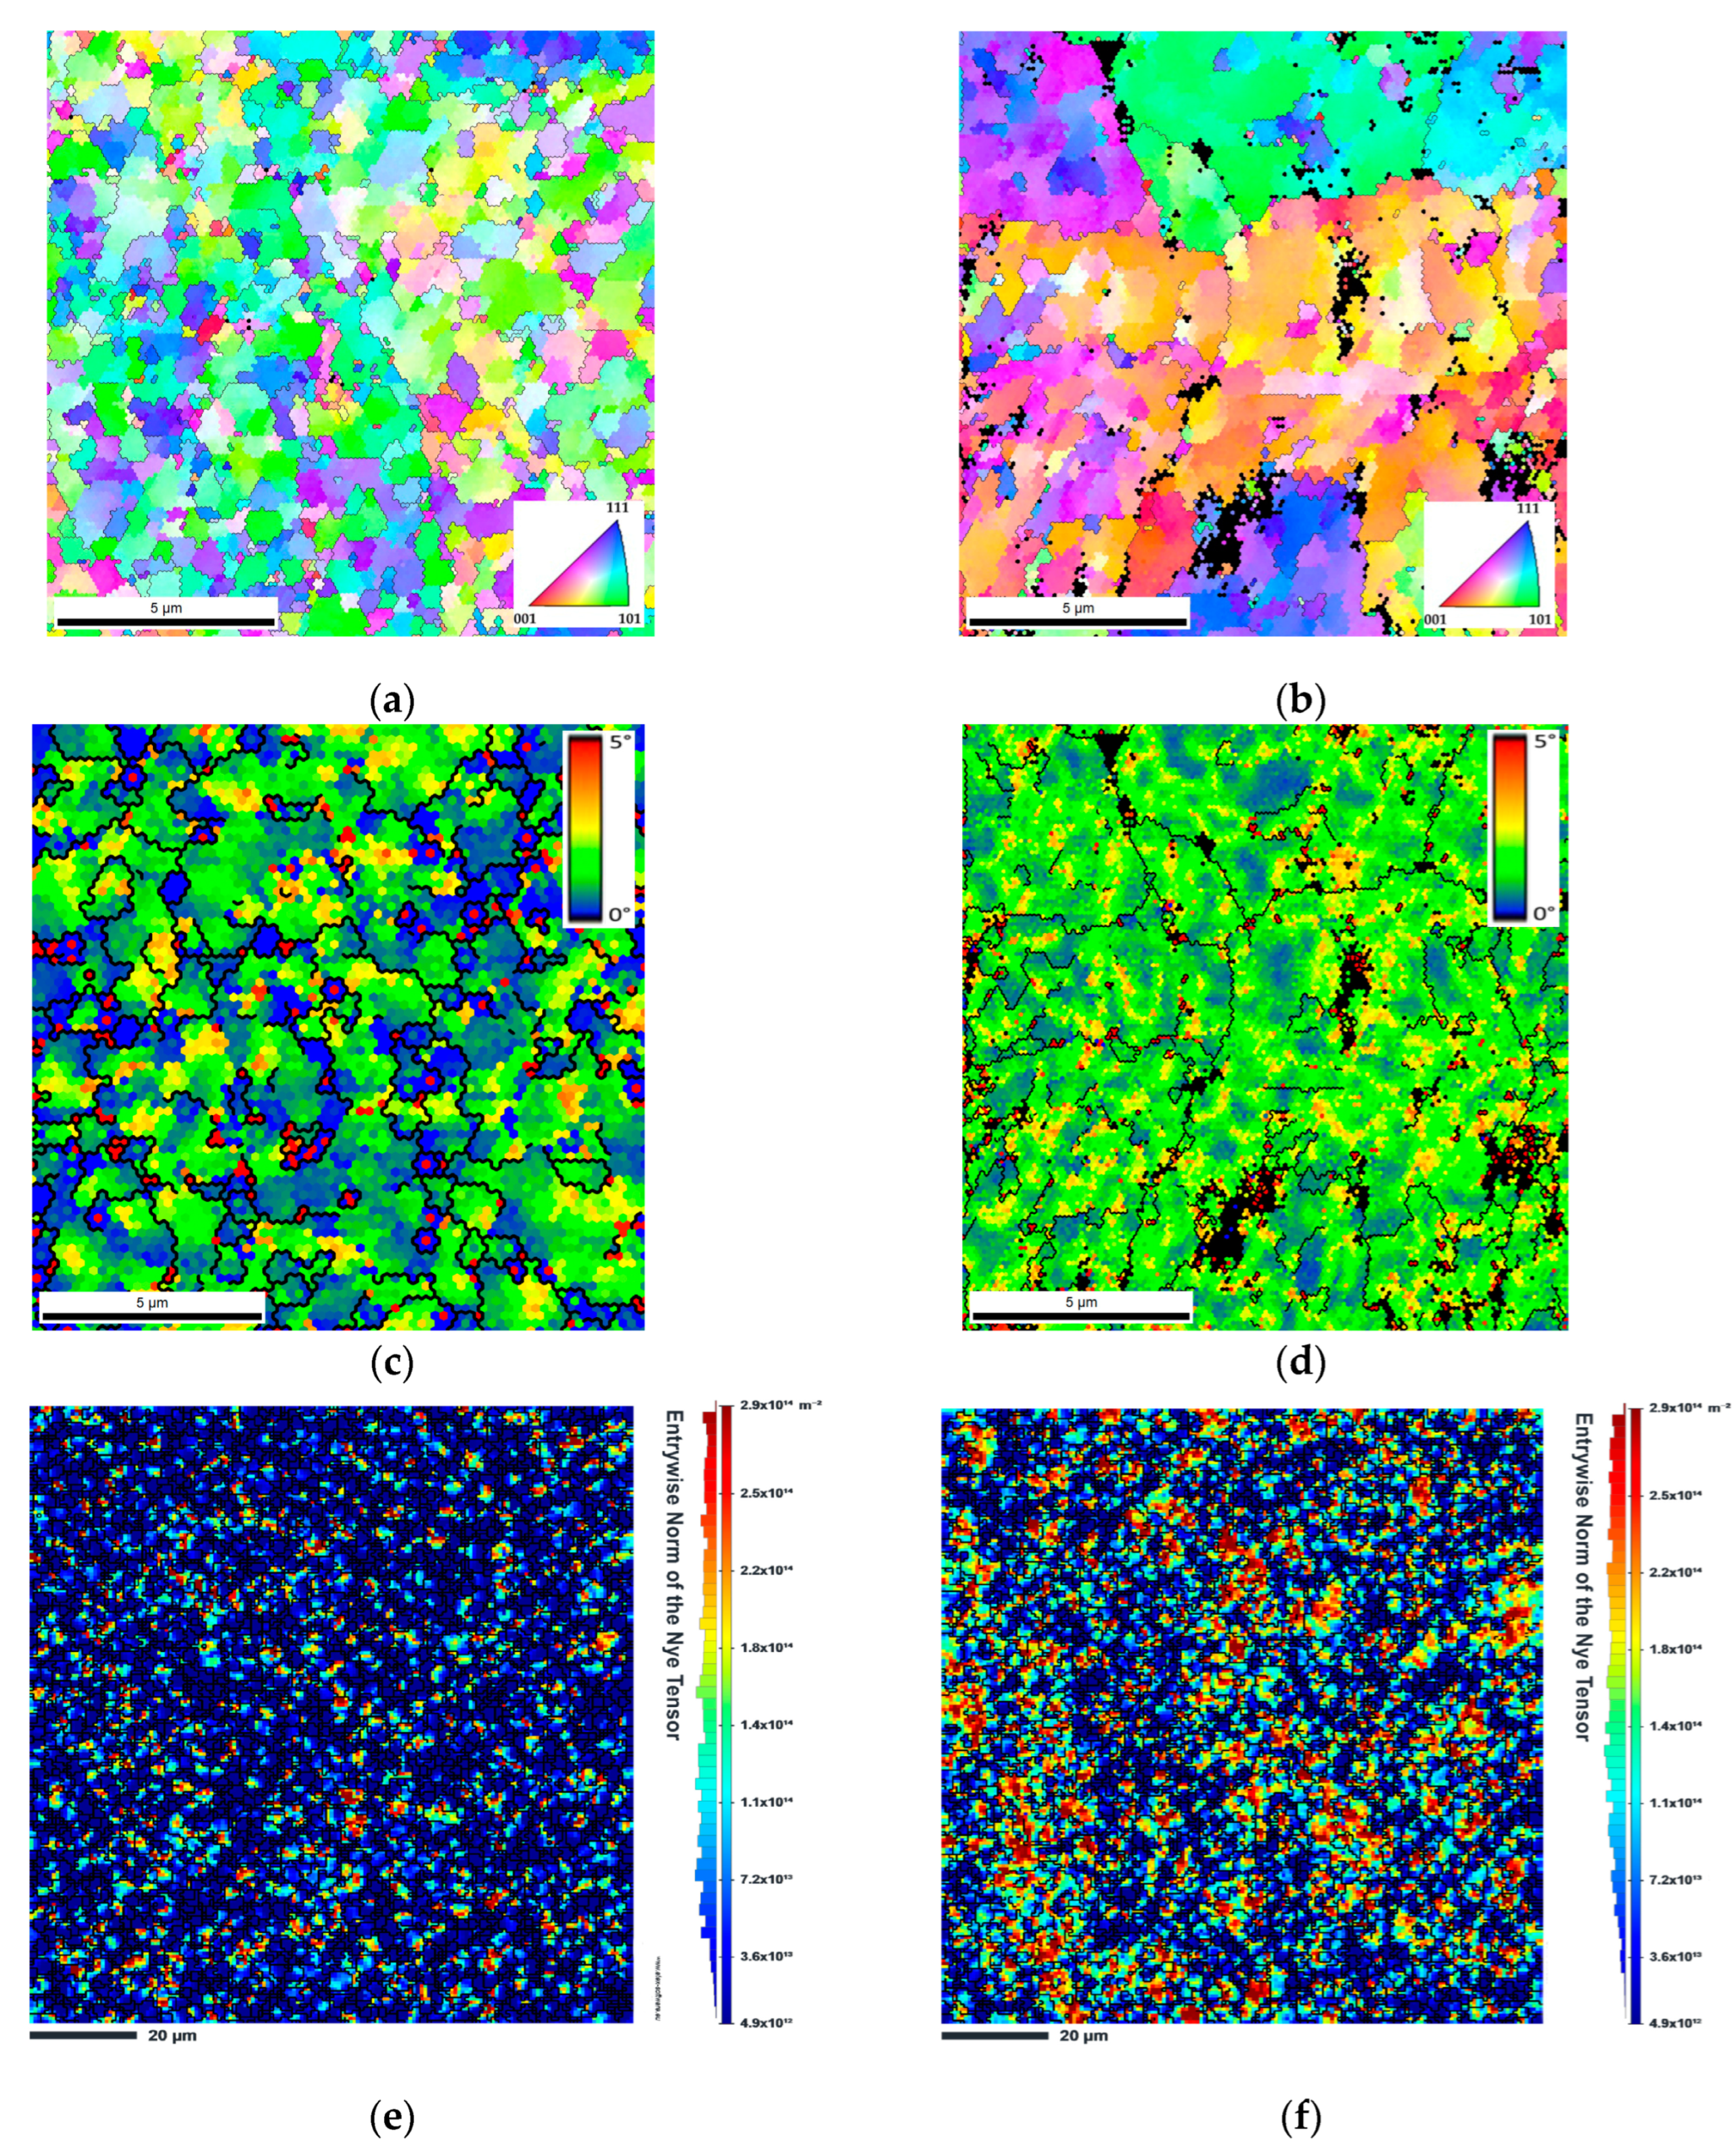
Figure 11.
Figure 11 shows the IPF, Kernel average misorientation (KAM) and geometry necessary dislocations (GNDs) density maps of Al matrix and the nanocomposite produced with 1.0 vol% of SiC. This analysis reveals that adding SiC significantly affects the Al matrix's microstructure. Based on the IPF maps, it is noted that the nanocomposites have more intense orientation domains than the Al matrix, confirming the significant influence of reinforcement on the crystallographic orientation of the matrix. The fact that the reinforcement is present in the matrix will not only influence the dynamics of the sintering process. Still, it can also clearly influence recovery and recrystallization processes. Based on the Kernel average misorientation (KAM) maps, it is possible to observe that Al-SiC presents a higher average misorientation. This can be related to the higher density of dislocation that promotes an angle of misorientation until 5º. The average geometrically necessary dislocations (GNDs) density maps confirm that a higher density of estimated dislocations characterizes the nanocomposites. The estimated density of GNDs for Al is 4.6 x 10
13 m
-2, while for the nanocomposites is 9.6 x 10
13 m
-2. Due to the difference in the coefficient of thermal expansion between the soft matrix and the hard reinforcement, stresses are created, promoting an increase in the density of dislocations in the nanocomposites. In addition, the SiC particles will also act as obstacles to the movement of the dislocations. These results indicate that the Orowan strengthening effect can be one of the mechanisms present in these nanocomposites. Any deformation promoted in the early stages of the production process is eliminated in the Al matrix through sintering. These results show that the increase in dislocation density is an active strain-strengthening mechanism in these nanocomposites. Still, this process is hindered in the nanocomposites, proving that the reinforcement affects the recovery process of the nanocomposites. Based on the microstructural characterization, the higher density of dislocations and different crystallographic orientations of the nanocomposites can be important in strengthening these nanocomposites.
The mechanical properties of the nanocomposites were determined by Vickers microhardness and tensile to confirm the effect of the SiC particles on the Al matrix. The hardness tests revealed that with the introduction of this nanoreinforcement it is possible to obtain a 77% increase in hardness with 1.0% vol SiC, an increase from 34 (Al matrix) to 62 (nanocomposites) HV0.01. This improvement in the hardness can be an indication that a good interface between the soft phase of Al and hard phase of the SiC is achieved. This increase of the hardness of the Al-SiC nanocomposites is significantly higher than reported in the literature [
8,
11]. Zeng et al. [
8], who conducted Vickers microhardness tests on Al samples reinforced with 1.0, 2.0, and 3.0 wt.% of SiC, obtained hardness values of 50, 54 and 56 HV. However, the higher hardness value was found in the sample with 3.0 wt% SiC, with a 40% increase compared to the pure aluminum samples. Similar results were observed by Soltani et al. [
11] for the nanocomposites of Al reinforced with 3.0 vol% of SiC. The authors attributed the hardness increase to the milling process and to the hardening effect of the nanometric SiC.
Table 3 shows the results of the tensile tests. For the nanocomposites, a decrease in the elongation and yield strength is observed with a slight increase in tensile strength. These results can be explained due to the SiC agglomeration that will impair the tensile properties of the nanocomposites. The strengthening effect is because the silicon carbide acts as an obstacle to the movement of the dislocations, thus hindering the plastic deformation of the material. The value of increased tensile strength is according to the value reported by other authors [
8], reaching a 25% increase compared with the tensile strength of the Al matrix. However, a more effective strength is observed when the nanocomposites are produced with the combination of powder metallurgy and deformation processes. Soltani et al. [
11] showed that it is possible to obtain an increase of 40 % in the tensile strength at room temperature by adding nanometric SiC particles into the Al matrix. In addition, the authors observed a significant improvement in the high-temperature properties of the nanocomposites.
Several mechanisms can contribute to the improvement of the mechanical properties of the nanocomposites [
15,
18,
19]. The mechanisms that are more reported to play an essential role in the mechanical properties of the nanocomposites are load transfer, grain refinement or texture hardening, Orowan strengthening, second-phase formation and an increase in the dislocation density. Based on the combined results of microstructural and mechanical characterization, it is possible to attest to the reinforcement of the Al matrix, and the mechanisms most important are the load transfer, the increase in density of dislocation, and the texture hardening.
4. Conclusions
SiC-reinforced aluminum nanocomposites have been successfully produced using powder metallurgy. The conditions of the dispersion and mixing process influenced the production of these compounds significantly. The dispersion agent was investigated, and the best results were obtained with ultrasonication in isopropanol.
The volume fraction of the reinforcement also plays an important role in the production of the nanocomposites. Different fractions were evaluated, and the results showed that with the increase of the reinforcement fraction, there is an increase in the hardness of the nanocomposites, but their dispersion is more difficult. The highest hardness value was obtained with 1.0 vol% SiC sample that presented less fraction of agglomerates.
The microstructural characterization revealed that the introduction of reinforcement significantly affects the microstructure of the nanocomposites. For nanocomposites, a greater variation in grain size is observed due to the presence of SiC agglomeration in the matrix. Furthermore, the nanocomposites reveal a different crystallographic orientation of the Al matrix, showing that it could be one of the active reinforcement mechanisms in these nanocomposites. In addition to the change in grain rotation during sintering, the presence of SiC proved important in the dislocation density of the nanocomposite. A higher density of dislocations is observed, which can be explained due to the difference in the coefficient of thermal expansion of the matrix and reinforcement.
The mechanical properties of the nanocomposites attest to the reinforcing effect of nanometric SiC particles. There was a significant increase in hardness of 77% compared to Al produced under the same conditions and an increase of 25% in tensile strength. However, due to the agglomeration of SiC particles, a significant decrease in the ductility of the nanocomposites can be observed.
Load transfer, texture hardening, Orowan strengthening, and increase in dislocation density are the main strengthening mechanisms that act simultaneously in these nanocomposites, promoting an improvement in the mechanical properties.
Author Contributions
Investigation, F.R. and S.S.; formal analysis, writing—original draft preparation, F.R.; writing—review and editing, visualization, supervision, S.S. All authors have read and agreed to the published version of the manuscript.
Data Availability Statement
Data can be available upon request from the authors.
Acknowledgments
The authors are grateful to CEMUP—Centro de Materiais da Universidade do Porto for the expert assistance with SEM.
Conflicts of Interest
The authors declare no conflict of interest.
References
- Singla, D.; Amulya, K.; Murtaza, Q. CNT reinforced aluminium matrix composite-a review. Mater. Today: Proceeding. 2015, 2, 2886–2895. [Google Scholar] [CrossRef]
- Reddy, M.P.; Manakari, V.; Parande, G.; Ub aid, F.; Shakoor, R.; Mohamed, A.; Grupta, M. Enhancing compressive, tensile, thermal and damping response of pure Al using BN nanoparticles. J Alloys Compds 2018, 762, 398–408. [Google Scholar] [CrossRef]
- Reddy, M.P.; Manakari, V.; Parande, G.; Shakoor, R.; Mohamed, A.; Grupta, M. Structural, mechanical and thermal characteristics of Al-Cu-Li particle reinforced Al-matrix composites synthesized by microwave sintering and hot extrusion. Compos. B: Eng. 2019, 164, 485–492. [Google Scholar] [CrossRef]
- Lu, L.; Thong, K.K.; Gupta, M. Mg-based composite reinforced by Mg2Si. Compos. Sci. Technol. 2003, 63, 627–632. [Google Scholar] [CrossRef]
- Zhang, X.; Zhang, Q.; Hu, H. Tensile behaviour and microstructure of magnesium AM60-based hybrid composite containing Al2O3 fibres and particles. Mater. Sci. Eng. A. 2014, 2014 607, 269–276. [Google Scholar] [CrossRef]
- Lu, D.; Jiang, Y.; Zhou, R. Wear performance of nano-Al2O3 particles and CNTs reinforced magnesium matrix composites by friction stir processing. Wear 2013, 305, 286–290. [Google Scholar] [CrossRef]
- Bharathi, P.; Sampath Kumar, T. Mechanical Characteristics and Wear Behaviour of Al/SiC and Al/SiC/B4C Hybrid Metal Matrix Composites Fabricated Through Powder Metallurgy Route. Silicon 2023, 2023 15, 4259–4275. [Google Scholar] [CrossRef]
- Zeng, X.; Liu, W. ; Xu; B.; Shu, G.; Li, Q. Microstructure and Mechanical Properties of Al–SiC Nanocomposites Synthesized by Surface-Modified Aluminium Powder. Metals, 2018; 8, 253. [Google Scholar] [CrossRef]
- Naher, S.; Brabazon, D.; Looney, L. Development and assessment of a new quick quench stir caster design for the production of metal matrix composites. J. Mater. Process. Technol. 2004, 166, 430–439. [Google Scholar] [CrossRef]
- Shahrdami, L.; Sedghi, A.; Shaeri, M.H. Microstructure and mechanical properties of Al matrix nanocomposites reinforced by different amounts of CNT and SiCW. Compos. B: Eng. 2019, 175, 107081. [Google Scholar] [CrossRef]
- Soltani, M.; Atrian, A. High temperature tensile behavior and microstructure of Al-SiC nanocomposite fabricated by mechanical milling and hot extrusion technique. Mat Res Express 2018, 2018 5, 025026. [Google Scholar] [CrossRef]
- Simões, S.; Viana, F.; Reis, M.A.L.; Vieira, M.F. Improved dispersion of carbon nanotubes in aluminum nanocomposites. Compos. Struct. 2014, 108, 992–1000. [Google Scholar] [CrossRef]
- Simões, S.; Viana, F.; Vieira, M.F. Carbon Nanotubes and Their Nanocomposites. In Nanomaterials and Nanocomposites: Zero- to Three-Dimensional Materials and Their Composites, 1st ed.; Visakh, P.M., Morlanes, M.J.M., Eds.; Wiley-VCH Verlag GmbH & Co. KGaA: Weinheim, Germany, 2016. [Google Scholar]
- Simões, S.; Viana, F.; Reis, M.A.L.; Vieira, M.F. Aluminum and Nickel Matrix Composites Reinforced by CNTs: Dispersion/Mixture by Ultrasonication. Metals 2017, 7, 279. [Google Scholar] [CrossRef]
- Carneiro, Í.; Fernandes, J.V.; Simões, S. Strengthening Mechanisms of Aluminum Matrix Nanocomposites Reinforced with CNTs Produced by Powder Metallurgy. Metals 2021, 11, 1711. [Google Scholar] [CrossRef]
- Beausir, B.; Fundenberger, J.-J. Analysis Tools for Electron and X-ray Diffraction, ATEX-Software; Université de Lorraine-Metz. 2017. Available online: www.atex-software.eu (accessed on 28 August 2023).
- Shaikh, M. B. N.; Aziz, T.; Arif, S.; Ansari, A. H.; Karagiannidis, P. G.; Uddin, M. Effect of sintering techniques on microstructural, mechanical and tribological properties of Al-SiC composites. Surf. Interfaces 2020, 20, 100598. [Google Scholar] [CrossRef]
- Carneiro, I.; Simões, S. Strengthening Mechanisms in Carbon Nanotubes Reinforced Metal Matrix Composites: A Review. Metals 2021, 2021 11, 1613. [Google Scholar] [CrossRef]
- Ryu, H.J.; Cha, S.I.; Hong, S.H. Generalized shear-lag model for load transfer in SiC/Al metal-matrix composites. J. Mat. Res 2003, 12, 2851–2858. [Google Scholar] [CrossRef]
Figure 1.
Scanning electron microscopy (SEM) of the as-received SiC nanoparticles (a) low magnification image; (b) a detail showing the morphology and size of the particles and (c) distribution of the particles size.
Figure 1.
Scanning electron microscopy (SEM) of the as-received SiC nanoparticles (a) low magnification image; (b) a detail showing the morphology and size of the particles and (c) distribution of the particles size.
Figure 2.
Images of the mold of the tensile samples and four nanocomposite tensile samples.
Figure 2.
Images of the mold of the tensile samples and four nanocomposite tensile samples.
Figure 3.
Optical microscopy (OM) images of the nanocomposites produced by ultrasonication using: (a) ethanol; (b) isopropanol, and (c) percentage of the pores and SiC agglomerates of the Al matrix and the nanocomposites. .
Figure 3.
Optical microscopy (OM) images of the nanocomposites produced by ultrasonication using: (a) ethanol; (b) isopropanol, and (c) percentage of the pores and SiC agglomerates of the Al matrix and the nanocomposites. .
Figure 4.
SEM images of the Al-SiC nanocomposites show a detailed identity as SiC by an EDS spectrum.
Figure 4.
SEM images of the Al-SiC nanocomposites show a detailed identity as SiC by an EDS spectrum.
Figure 5.
SEM images of the SiC particles dispersed in: (a) ethanol; (b) isopropanol.
Figure 5.
SEM images of the SiC particles dispersed in: (a) ethanol; (b) isopropanol.
Figure 6.
OM images of: (a) Al matrix; (b) nanocomposite with 0.5 vol % SiC; (c) nanocomposite with 1.0 vol % SiC; and (d) nanocomposite with 1.5 vol % SiC.
Figure 6.
OM images of: (a) Al matrix; (b) nanocomposite with 0.5 vol % SiC; (c) nanocomposite with 1.0 vol % SiC; and (d) nanocomposite with 1.5 vol % SiC.
Figure 7.
Pores and SiC agglomerates of the Al matrix and nanocomposites produced with 0.5, 1.0, 1.5 and 2.0 vol % SiC.
Figure 7.
Pores and SiC agglomerates of the Al matrix and nanocomposites produced with 0.5, 1.0, 1.5 and 2.0 vol % SiC.
Figure 8.
Vickers microhardness (HV0.01) evolution of the Al matrix and nanocomposites produced with 0.5, 1.0 and 1.5 vol % SiC.
Figure 8.
Vickers microhardness (HV0.01) evolution of the Al matrix and nanocomposites produced with 0.5, 1.0 and 1.5 vol % SiC.
Figure 9.
SEM image of the nanocomposite produced with 1.0 vol% of SiC.
Figure 9.
SEM image of the nanocomposite produced with 1.0 vol% of SiC.
Figure 10.
Inverse pole figures (IPF) maps, inverse pole figures (IPFs) and grain size distribution of: (a, c, e) Al matrix and (b, d, f) nanocomposite produced with 1.0 vol.% of SiC.
Figure 10.
Inverse pole figures (IPF) maps, inverse pole figures (IPFs) and grain size distribution of: (a, c, e) Al matrix and (b, d, f) nanocomposite produced with 1.0 vol.% of SiC.
Figure 11.
IPF, Kernel average misorientation (KAM) and geometry necessary dislocations (GNDs) density maps of: (a, c , e) Al matrix and (b, d, f) nanocomposites.
Figure 11.
IPF, Kernel average misorientation (KAM) and geometry necessary dislocations (GNDs) density maps of: (a, c , e) Al matrix and (b, d, f) nanocomposites.
Table 1.
EDS chemical composition (in at. % ) of the as-received SiC nanometric particles and Al powders.
Table 1.
EDS chemical composition (in at. % ) of the as-received SiC nanometric particles and Al powders.
| |
Si |
C |
Al |
Fe |
| SiC nanoparticles |
35.3 |
64.7 |
_ |
_ |
| Al powders |
_ |
_ |
96.3 |
3.7 |
Table 2.
EDS chemical composition (at. %) of the regions marked in
Figure 9.
Table 2.
EDS chemical composition (at. %) of the regions marked in
Figure 9.
| Zone |
Al |
Fe |
Si |
C |
| Z1 |
100 |
_ |
_ |
_ |
| Z2 |
64.8 |
35.2 |
_ |
_ |
| Z3 |
54.3 |
_ |
26.2 |
19.5 |
Table 3.
Mechanical properties of Al matrix and the nanocomposites obtained by tensile tests.
Table 3.
Mechanical properties of Al matrix and the nanocomposites obtained by tensile tests.
| |
Tensile Strength (MPa) |
Yield Strength (MPa) |
Elongation
(%) |
| Al matrix |
64 |
40 |
23 |
| Al 1.0 vol% SiC |
86 |
36 |
8 |
|
Disclaimer/Publisher’s Note: The statements, opinions and data contained in all publications are solely those of the individual author(s) and contributor(s) and not of MDPI and/or the editor(s). MDPI and/or the editor(s) disclaim responsibility for any injury to people or property resulting from any ideas, methods, instructions or products referred to in the content. |
© 2023 by the authors. Licensee MDPI, Basel, Switzerland. This article is an open access article distributed under the terms and conditions of the Creative Commons Attribution (CC BY) license (http://creativecommons.org/licenses/by/4.0/).
