Submitted:
31 August 2023
Posted:
31 August 2023
You are already at the latest version
Abstract
Keywords:
1. Introduction
1.1. Background
1.2. Related Works
- (1)
- Current studies focus more on the intensity of park usage and level of physical activities (sedentary, walking, vigorous), leaving a gap for more fine-grained studies in the categorization of park events;
- (2)
- For the methodology, traditional studies rely heavily on questionnaires and personal interviews, which is time consuming and restricted;
- (3)
- In recent studies that incorporate technologies, the categorization methods are either inefficient or not specific to park events.
- (1)
- By focusing the analysis on the categorization of park events;
- (2)
- By incorporating the use of publicly available imagery to increase the efficiency of analysis;
- (3)
- By proposing transfer learning on pre-trained Convolutional Neural Networks (CNNs) to calibrate the model towards the park event identification task, achieving a 0.876 accuracy and a 0.620 mean average precision.
2. Dataset and Methods
2.1. Research Framework
2.2. Dataset
2.3. Data Preprocessing
2.3.1. Refining the Categorization
2.3.2. Remove Non-Photographic Imagery
2.4. Classification Modeling
2.4.1. Model Selection
- Baseline: Histogram of Oriented Gradients (HOG) – Support Vector Machine (SVM) based model
- 2.
- Convolutional Neural Networks (CNNs) based models
- 3.
- State-of-the-Art Approach: C-Tran
2.4.2. Training
2.4.3. Evaluation Metrics
3. Results
3.1. Descriptive Statistics
3.2. Overall Performance of Event Classification
3.3. Transfer Learning Approaches
4. Conclusion
Author Contributions
Funding
Data Availability Statement
Conflicts of Interest
Appendix A
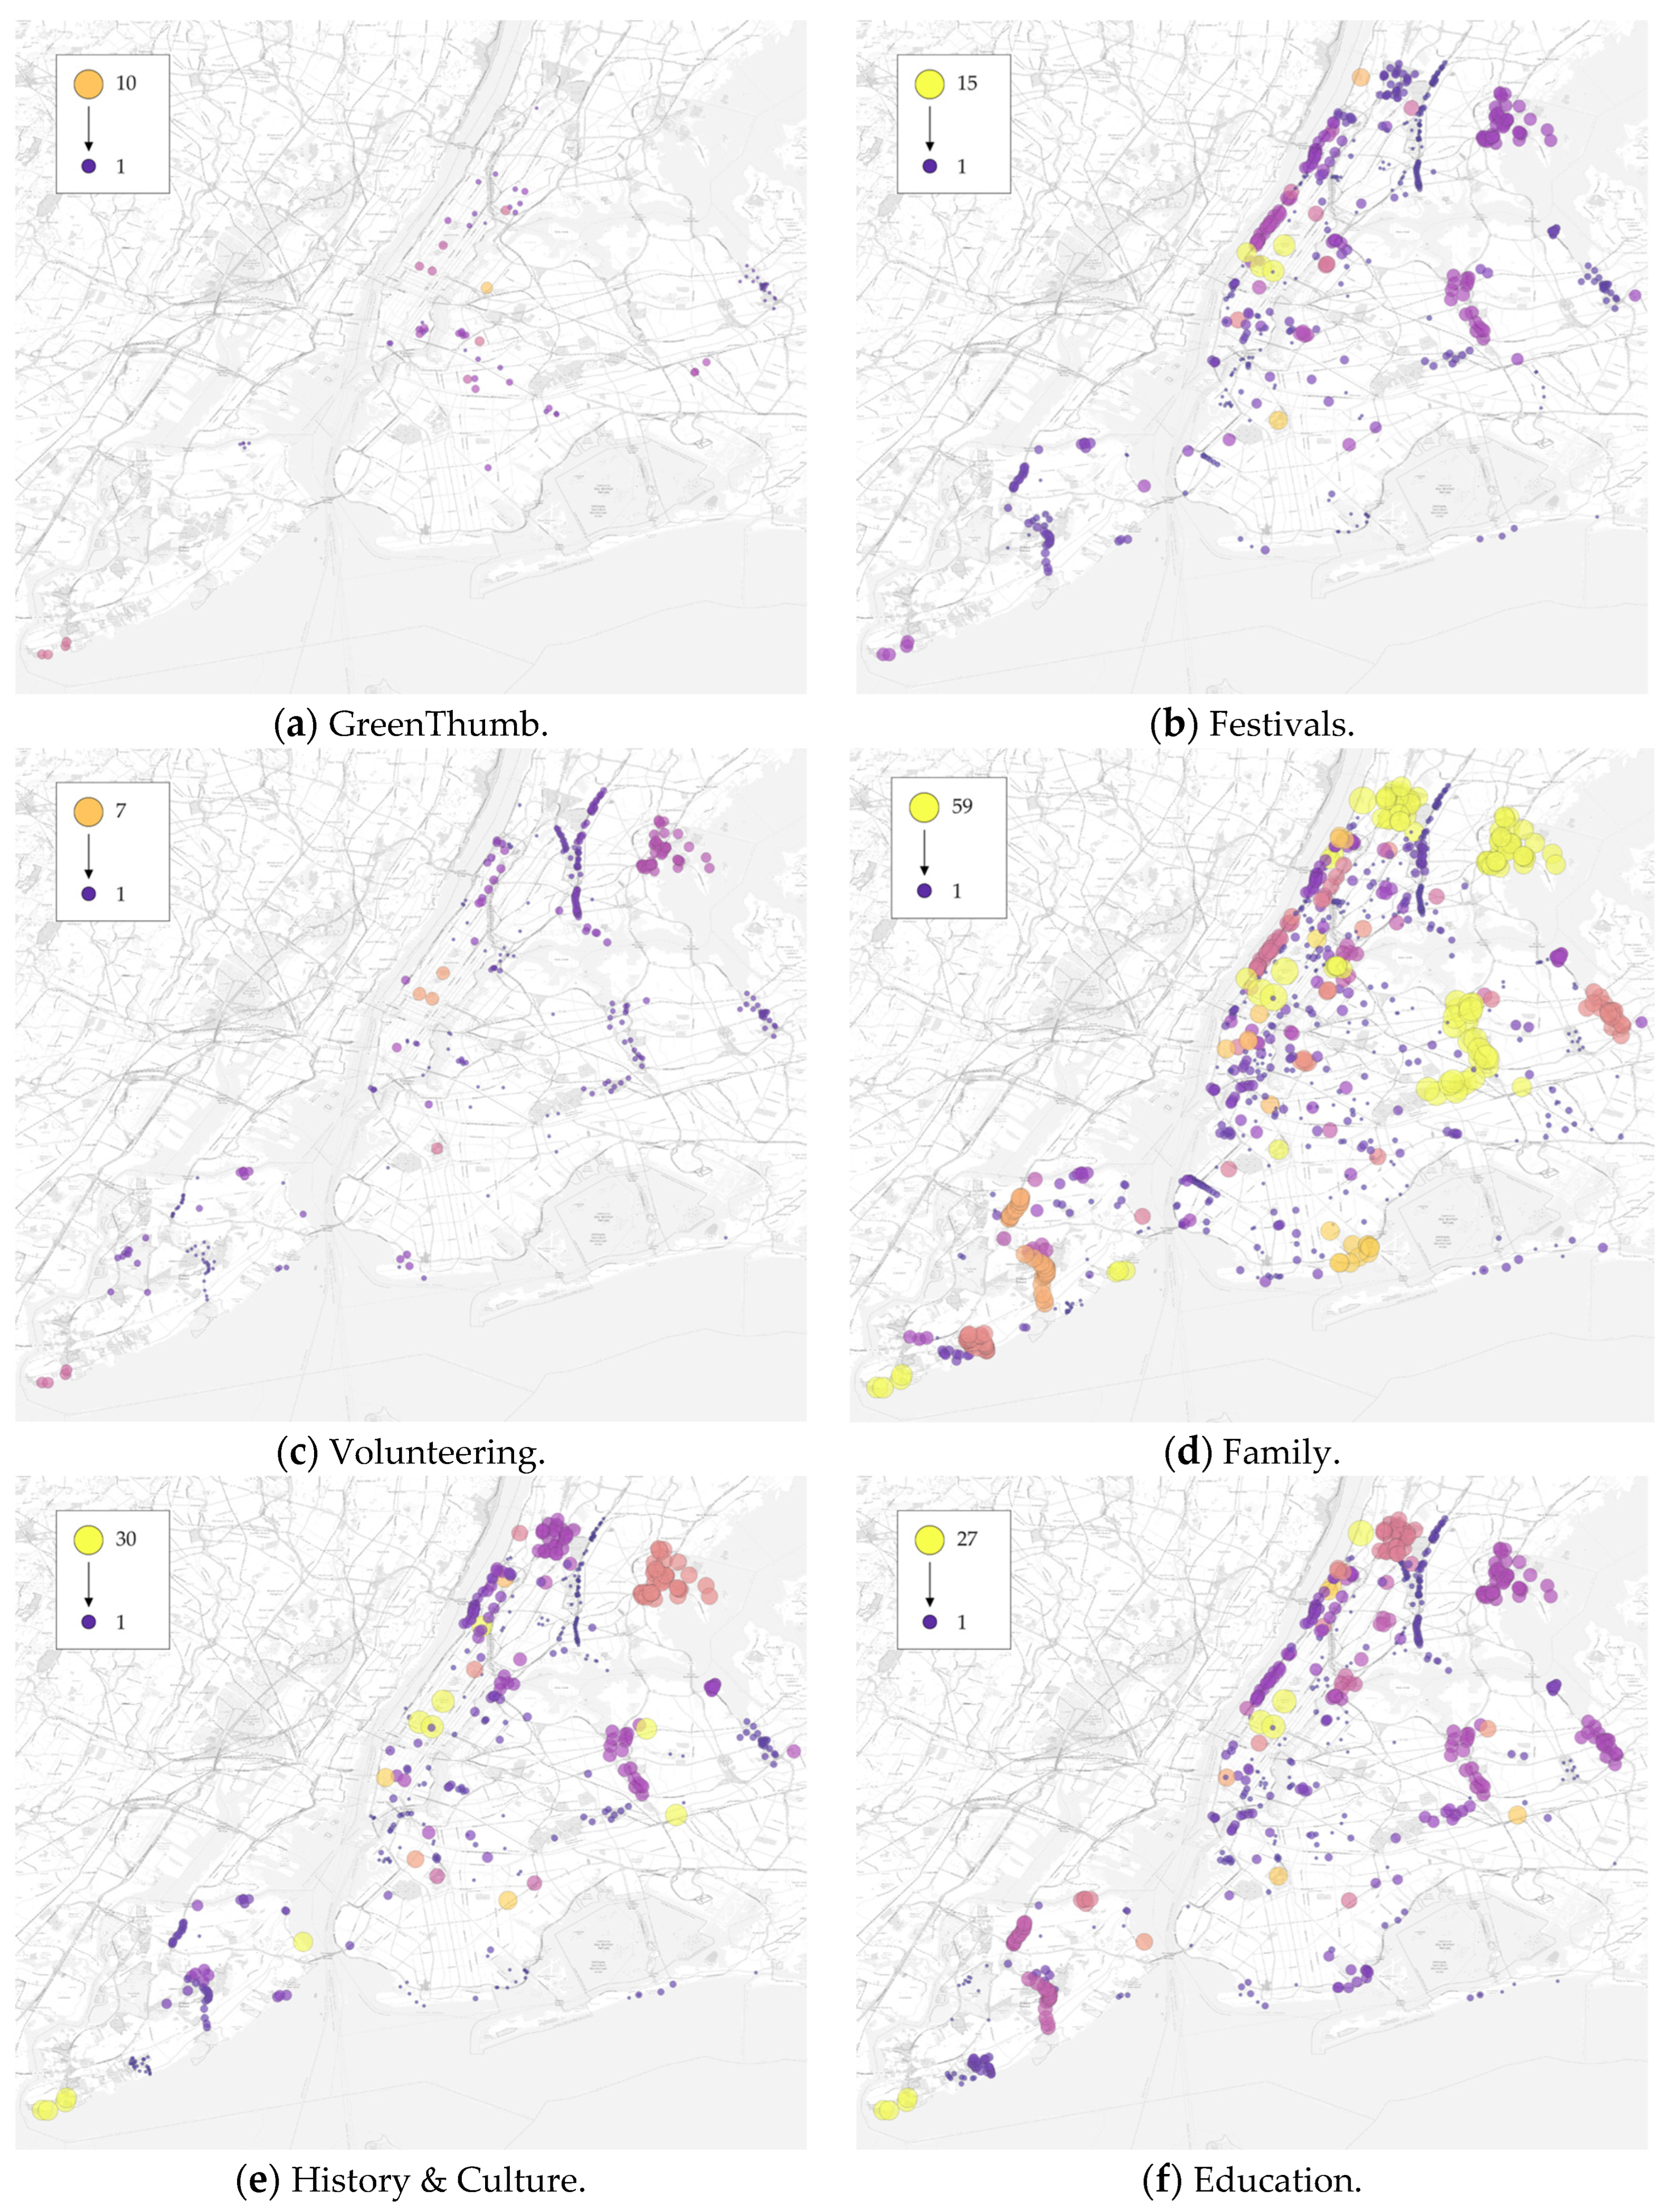
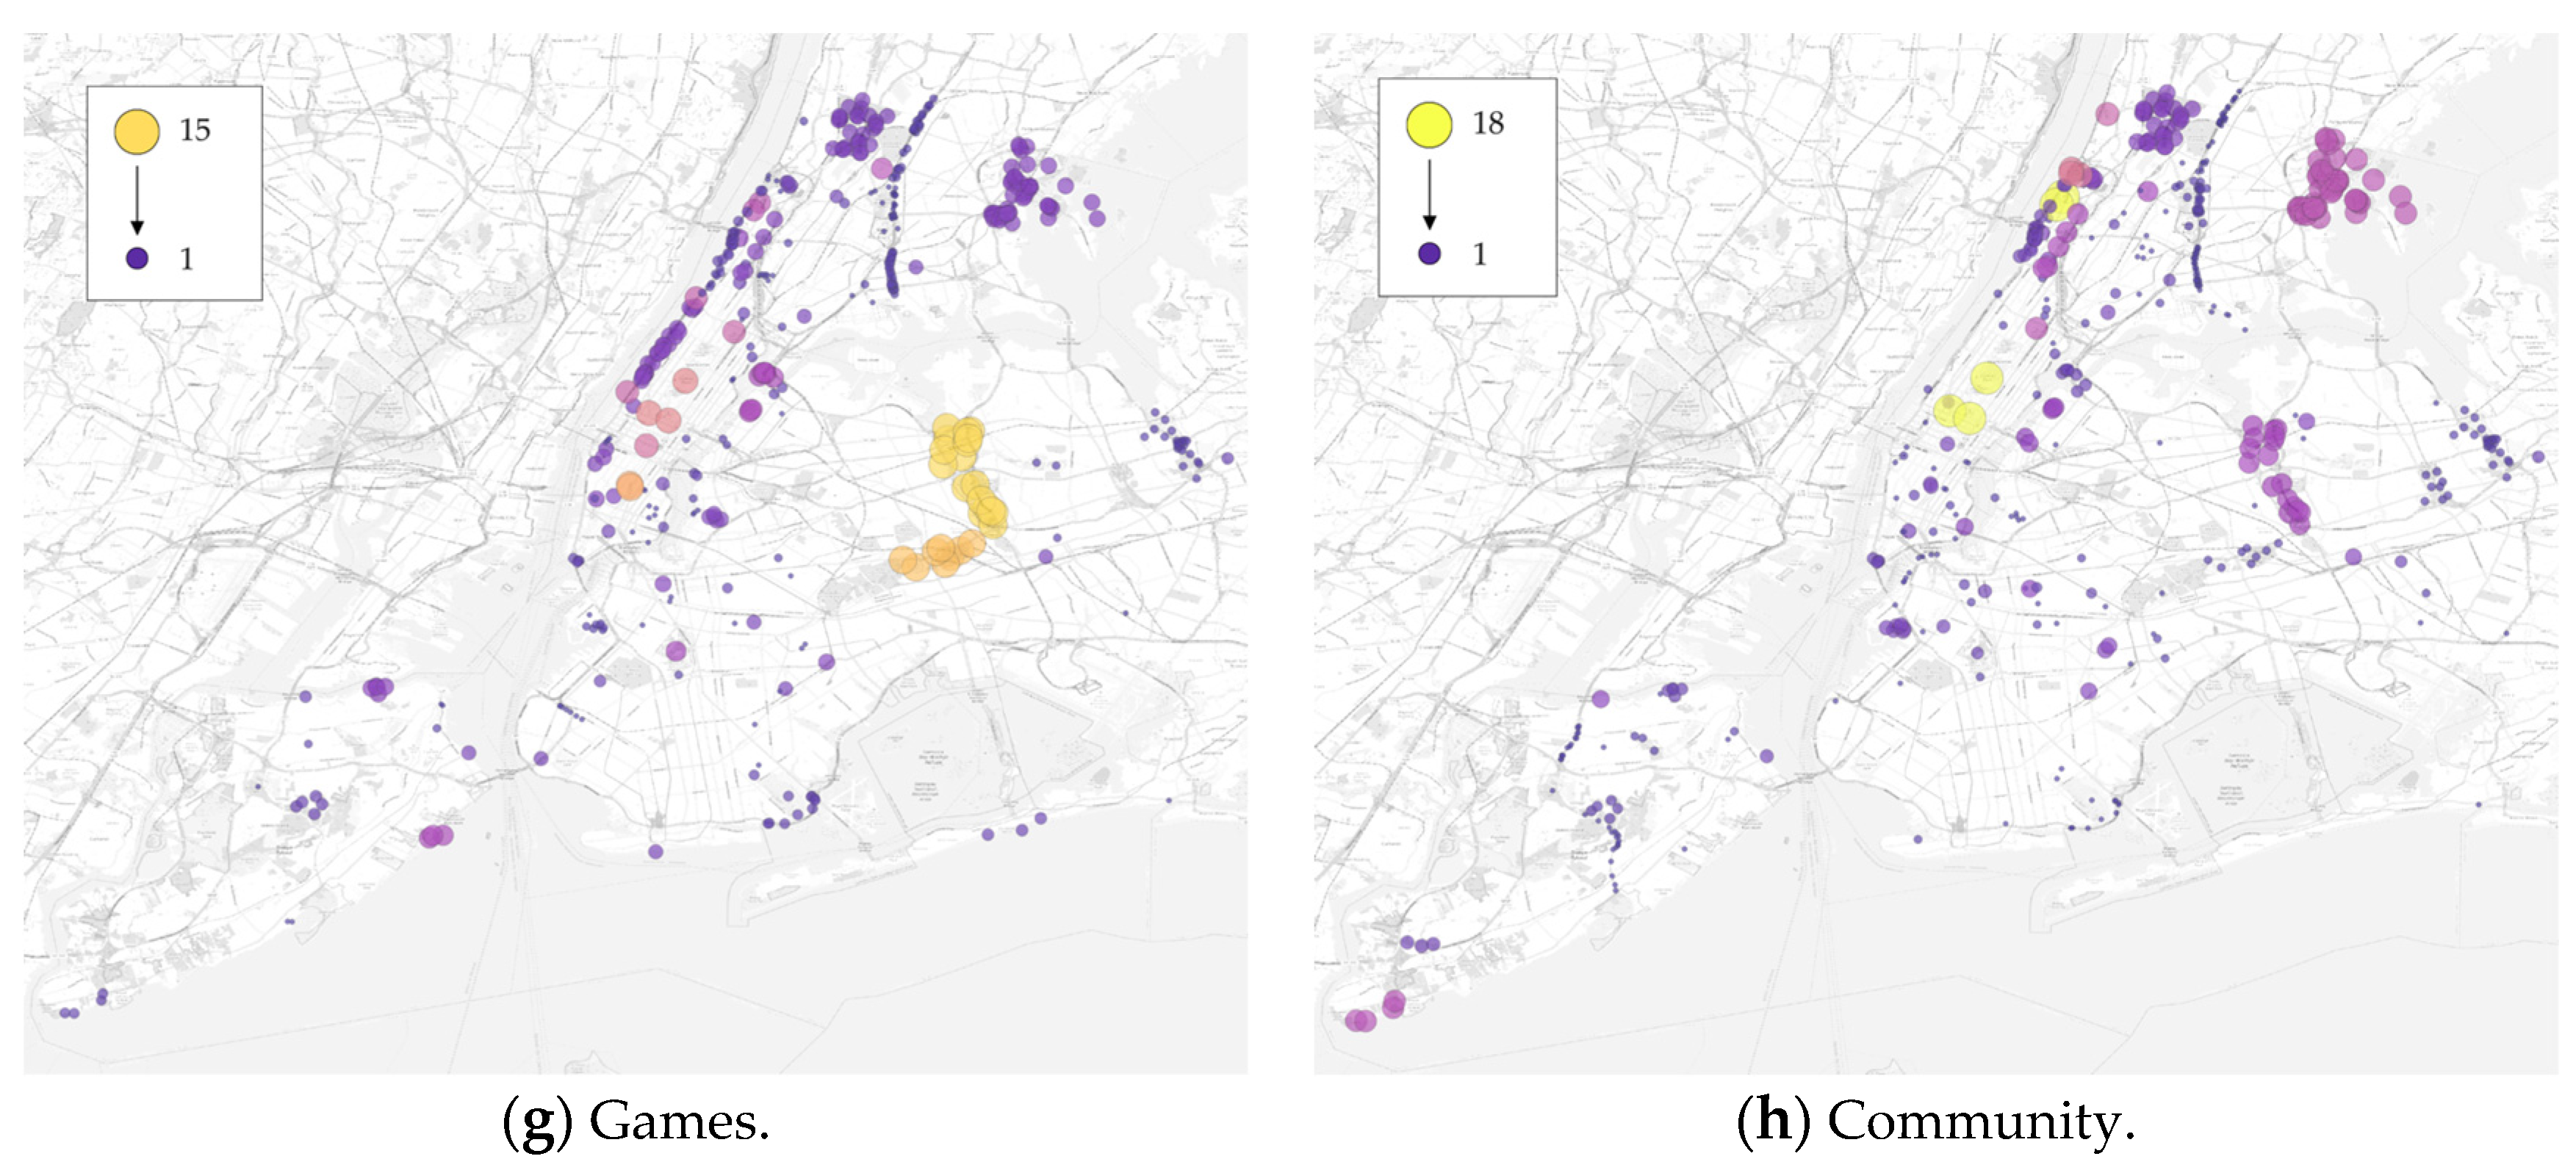
References
- Konijnendijk, C.; Annerstedt, M.; Nielsen, A.B.; Maruthaveeran, S. Benefits of Urban Parks: A Systematic Review; International Federation of Parks and Recreation Administration, 2013;
- Sadeghian, M.M.; Vardanyan, Z. The Benefits of Urban Parks, a Review of UrbanResearch. J Nov. Appl Sci. 2013, 2 (8), 231–237.
- Smith, A.; Vodicka, G. Events in London’s Parks: The Friends’ Perspective; Zenodo, 2020;
- Smith, A.; Vodicka, G.; Colombo, A.; Lindstrom, K.N.; McGillivray, D.; Quinn, B. Staging City Events in Public Spaces: An Urban Design Perspective. IJEFM 2021, 12, 224–239. [CrossRef]
- Smith, A.; Osborn, G.; Vodicka, G. Private Events in a Public Park: Contested Music Festivals and Environmental Justice in Finsbury Park, London. In Whose Green City?; Plüschke-Altof, B., Sooväli-Sepping, H., Eds.; Sustainable Development Goals Series; Springer International Publishing: Cham, 2022; pp. 83–102 ISBN 978-3-031-04635-3.
- Neal, S.; Bennett, K.; Jones, H.; Cochrane, A.; Mohan, G. Multiculture and Public Parks: Researching Super-Diversity and Attachment in Public Green Space: Multiculture and Public Parks. Popul. Space Place 2015, 21, 463–475. [CrossRef]
- Citroni, S.; Karrholm, M. Neighbourhood Events and the Visibilisation of Everyday Life: The Cases of Turro (Milan) and Norra Fäladen (Lund). European Urban and Regional Studies 2019, 26, 50–64. [CrossRef]
- Schipperijn, J. et al. 2010. Factors influencing the use of green space: Results from a Danish national representative survey. Landscape and Urban Planning 2010, 95(3), 130–137. [CrossRef]
- Moran, M.R.; Rodríguez, D.A.; Cotinez-O’Ryan, A.; Miranda, J.J. Park Use, Perceived Park Proximity, and Neighborhood Characteristics: Evidence from 11 Cities in Latin America. Cities 2020, 105, 102817. [CrossRef]
- Neuvonen, M.; Sievänen, T.; Tönnes, S.; Koskela, T. Access to Green Areas and the Frequency of Visits – a Case Study in Helsinki. Urban Forestry & Urban Greening, 2007, 6(4), 235–47. [CrossRef]
- Analysis of Activities and Participation Questionnaire; South Gloucestershire Council: Page Park.
- Heikinheimo, V.; Tenkanen, H.; Bergroth, C.; Järv, O.; Hiippala, T.; Toivonen, T. Understanding the Use of Urban Green Spaces from User-Generated Geographic Information. Landscape and Urban Planning 2020, 201(103845). [CrossRef]
- Brown, G. A Review of Sampling Effects and Response Bias in Internet Participatory Mapping (PPGIS/PGIS/VGI): Sampling Effects and Response Bias in Internet Participatory Mapping. Trans. in GIS 2017, 21, 39–56. [CrossRef]
- NYC parks events listing – event listing: NYC open data. Available online: https://data.cityofnewyork.us/browse?Data-Collection_Data-Collection=NYC+Parks+Events&sortBy=alpha (accessed on 9 December 2021).
- Kaczynski, A.T.; Besenyi, G.M.; Stanis, S.A.; Koohsari, M.J.; Oestman, K.B.; Bergstrom, R.; Potwarka, L.R.; Reis, R.S. Are Park Proximity and Park Features Related to Park Use and Park-Based Physical Activity among Adults? Variations by Multiple Socio-Demographic Characteristics. International Journal of Behavioral Nutrition and Physical Activity 2014, 11(1). [CrossRef]
- Nielsen, T.S.; Hansen, K.B. Do Green Areas Affect Health? Results from a Danish Survey on the Use of Green Areas and Health Indicators. Health & Place 2007, 13(4), 839–50. [CrossRef]
- Bjork, J.; Albin, M.; Grahn, P.; Jacobsson, H.; Ardo, J.; Wadbro, J.; Ostergren, P.O.; Skarback, E. Recreational Values of the Natural Environment in Relation to Neighbourhood Satisfaction, Physical Activity, Obesity and Wellbeing. Journal of Epidemiology & Community Health 2008, 62(4). [CrossRef]
- Larson, L.R.; Zhang, Z.; Oh, J.I.; Beam, W.; Ogletree, S.S.; Bocarro, J.N.; Lee, K.J. et al. Urban Park Use during the COVID-19 Pandemic: Are Socially Vulnerable Communities Disproportionately Impacted? Frontiers in Sustainable Cities 2021, 3. [CrossRef]
- Li, F.; Li, F.; Li, S.; Long, Y. Deciphering the Recreational Use of Urban Parks: Experiments Using Multi-Source Big Data for All Chinese Cities. Science of The Total Environment 2020, 701(134896). [CrossRef]
- Dong, L.; Jiang, H.; Li, W.; Qiu, B.; Wang, H.; Qiu, W. Assessing Impacts of Objective Features and Subjective Perceptions of Street Environment on Running Amount: A Case Study of Boston. Landscape and Urban Planning 2023, 235, 104756. [CrossRef]
- Su, N.; Li, W.; Qiu, W. Measuring the Associations between Eye-Level Urban Design Quality and on-Street Crime Density around New York Subway Entrances. Habitat International 2023, 131, 102728. [CrossRef]
- Qiu, W.; Zhang, Z.; Liu, X.; Li, W.; Li, X.; Xu, X.; Huang, X. Subjective or Objective Measures of Street Environment, Which Are More Effective in Explaining Housing Prices? Landscape and Urban Planning 2022, 221, 104358. [CrossRef]
- Qiu, W.; Li, W.; Liu, X.; Zhang, Z.; Li, X.; Huang, X. Subjective and Objective Measures of Streetscape Perceptions: Relationships with Property Value in Shanghai. Cities 2023, 132, 104037. [CrossRef]
- Kaczynski, A.T.; Potwarka, L.R.; Smale, B.J.; Havitz, M.E. Association of Parkland Proximity with Neighborhood and Park-Based Physical Activity: Variations by Gender and Age. Leisure Sciences 2009, 31(2), 174–91. [CrossRef]
- Floyd, M.F.; Spengler, J.O.; Maddock, J.E.; Gobster, P.H.; Suau, L,J. Park-Based Physical Activity in Diverse Communities of Two U.S. Cities: An Observational Study. American Journal of Preventive Medicine 2008, 34(4), 299-305, ISSN 0749-3797. [CrossRef]
- Lin, B.B.; Fuller, R.A.; Bush, R.; Gaston, K.J.; Shanahan, D.F. Opportunity or Orientation? Who Uses Urban Parks and Why. PLoS ONE 2014, 9, e87422. [CrossRef]
- Evenson, K.R.; Jones, S.A.; Holliday, K.M.; Cohen, D.A.; McKenzie, T.L. Park Characteristics, Use, and Physical Activity: A Review of Studies Using SOPARC (System for Observing Play and Recreation in Communities). Preventive Medicine 2016, 86, 153–166. [CrossRef]
- Brown, G.; Schebella, M.F.; Weber, D. Using participatory GIS to measure physical activity and urban park benefits. Landscape and Urban Planning 2014, 121, 34-44, ISSN 0169-2046. [CrossRef]
- Ghermandi, A.; Depietri, Y.; Sinclair, M. In the AI of the Beholder: A Comparative Analysis of Computer Vision-Assisted Characterizations of Human-Nature Interactions in Urban Green Spaces. Landscape and Urban Planning 2022, 217, 104261. [CrossRef]
- Coles, R.W.; Bussey, S.C. Urban Forest Landscapes in the UK — progressing the Social Agenda. Landscape and Urban Planning 2000, 52(2–3), 181–188. [CrossRef]
- Peschardt, K.K.; Schipperijn, J.; Stigsdotter, U.K. Use of Small Public Urban Green Spaces (SPUGS). Urban Forestry & Urban Greening 2012, 11(3), 235–44. [CrossRef]
- Veitch, J.; Ball, K.; Crawford, D.; Abbott, G.R.; Salmon, J. Park Improvements and Park Activity. American Journal of Preventive Medicine 2012, 42, 616–619. [CrossRef]
- McKenzie, T.L.; Cohen, D.A.; Sehgal, A.; Williamson, S.; Golinelli, D. System for observing play and recreation in communities (SOPARC): reliability and feasibility measures. J. Phys. Act. Health 2006, 3 (s1), S208–S222. [CrossRef]
- Heikinheimo, V.; Minin, E.D.; Tenkanen, H.; Hausmann, A.; Erkkonen, J.; Toivonen, T. User-Generated Geographic Information for Visitor Monitoring in a National Park: A Comparison of Social Media Data and Visitor Survey. IJGI 2017, 6, 85. [CrossRef]
- Ahas, R.; Silm, S.; Saluveer, E.; Järv, O. Modelling Home and Work Locations of Populations Using Passive Mobile Positioning Data. In Location Based Services and TeleCartography II; Gartner, G., Rehrl, K., Eds.; Lecture Notes in Geoinformation and Cartography; Springer Berlin Heidelberg: Berlin, Heidelberg, 2009; pp. 301–315 ISBN 978-3-540-87392-1.
- Vision AI. Available online: https://cloud.google.com/vision (accessed on 18 August 2023).
- General Image Recognition. Available online: https://www.clarifai.com/models/general-image-recognition (accessed on 18 August 2023).
- Azure AI Vision with OCR and AI. Available online: https://azure.microsoft.com/en-us/products/ai-services/ai-vision#:~:text=Azure%20AI%20Vision%20is%20a,)%2C%20and%20responsible%20facial%20recognition. (accessed on 18 August 2023).
- About Parks: NYC Parks. Available online: https://www.nycgovparks.org/about (accessed on 18 August 2023).
- Simonyan, K.; Zisserman, A. Very Deep Convolutional Networks for Large-Scale Image Recognition. In Proceedings of the International Conference on Learning Representations, San Diego, CA, USA, 7-9 May 2015.
- Deng, J.; Dong, W.; Socher, R.; Li, L.-J.; Li, K.; Fei-Fei, L. ImageNet: A Large-Scale Hierarchical Image Database. IEEE Computer Vision and Pattern Recognition (CVPR), 2009.
- Freeman, W.T.; Roth, M. Orientation Histograms for Hand Gesture Recognition. In Proceedings of the IEEE Intl. Wkshp. on Automatic Face and Gesture Recognition, Zurich, Switzerland, June, 1995.
- Cortes, C.; Vapnik, V. Support-vector networks. Machine Learning, 1995, 20 (3), 273–297. [CrossRef]
- Valueva, M.V.; Nagornov, N.N.; Lyakhov, P.A.; Valuev, G.V.; Chervyakov, N.I. Application of the residue number system to reduce hardware costs of the convolutional neural network implementation. Mathematics and Computers in Simulation, 2020, Elsevier BV. 177, 232–243. [CrossRef]
- He, K.; Zhang, X.; Ren, S.; Sun, J. Deep Residual Learning for Image Recognition. In Proceedings of the IEEE Conference on Computer Vision and Pattern Recognition (CVPR), Las Vegas, NV, USA, 2016, pp. 770-778. [CrossRef]
- Szegedy, C. et al., Going deeper with convolutions, In Proceedings of the IEEE Conference on Computer Vision and Pattern Recognition (CVPR), Boston, MA, USA, 2015, pp. 1-9. [CrossRef]
- Lanchantin, J.; Wang, T.; Ordonez, V.; Qi, Y. General Multi-label Image Classification with Transformers, Nashville, TN, USA, 19-25 June 2021.
- City of Chicago: Millennium Park Calendar. Available online: https://www.chicago.gov/city/en/depts/dca/supp_info/mp_calendar.html (accessed on 18 August 2023).

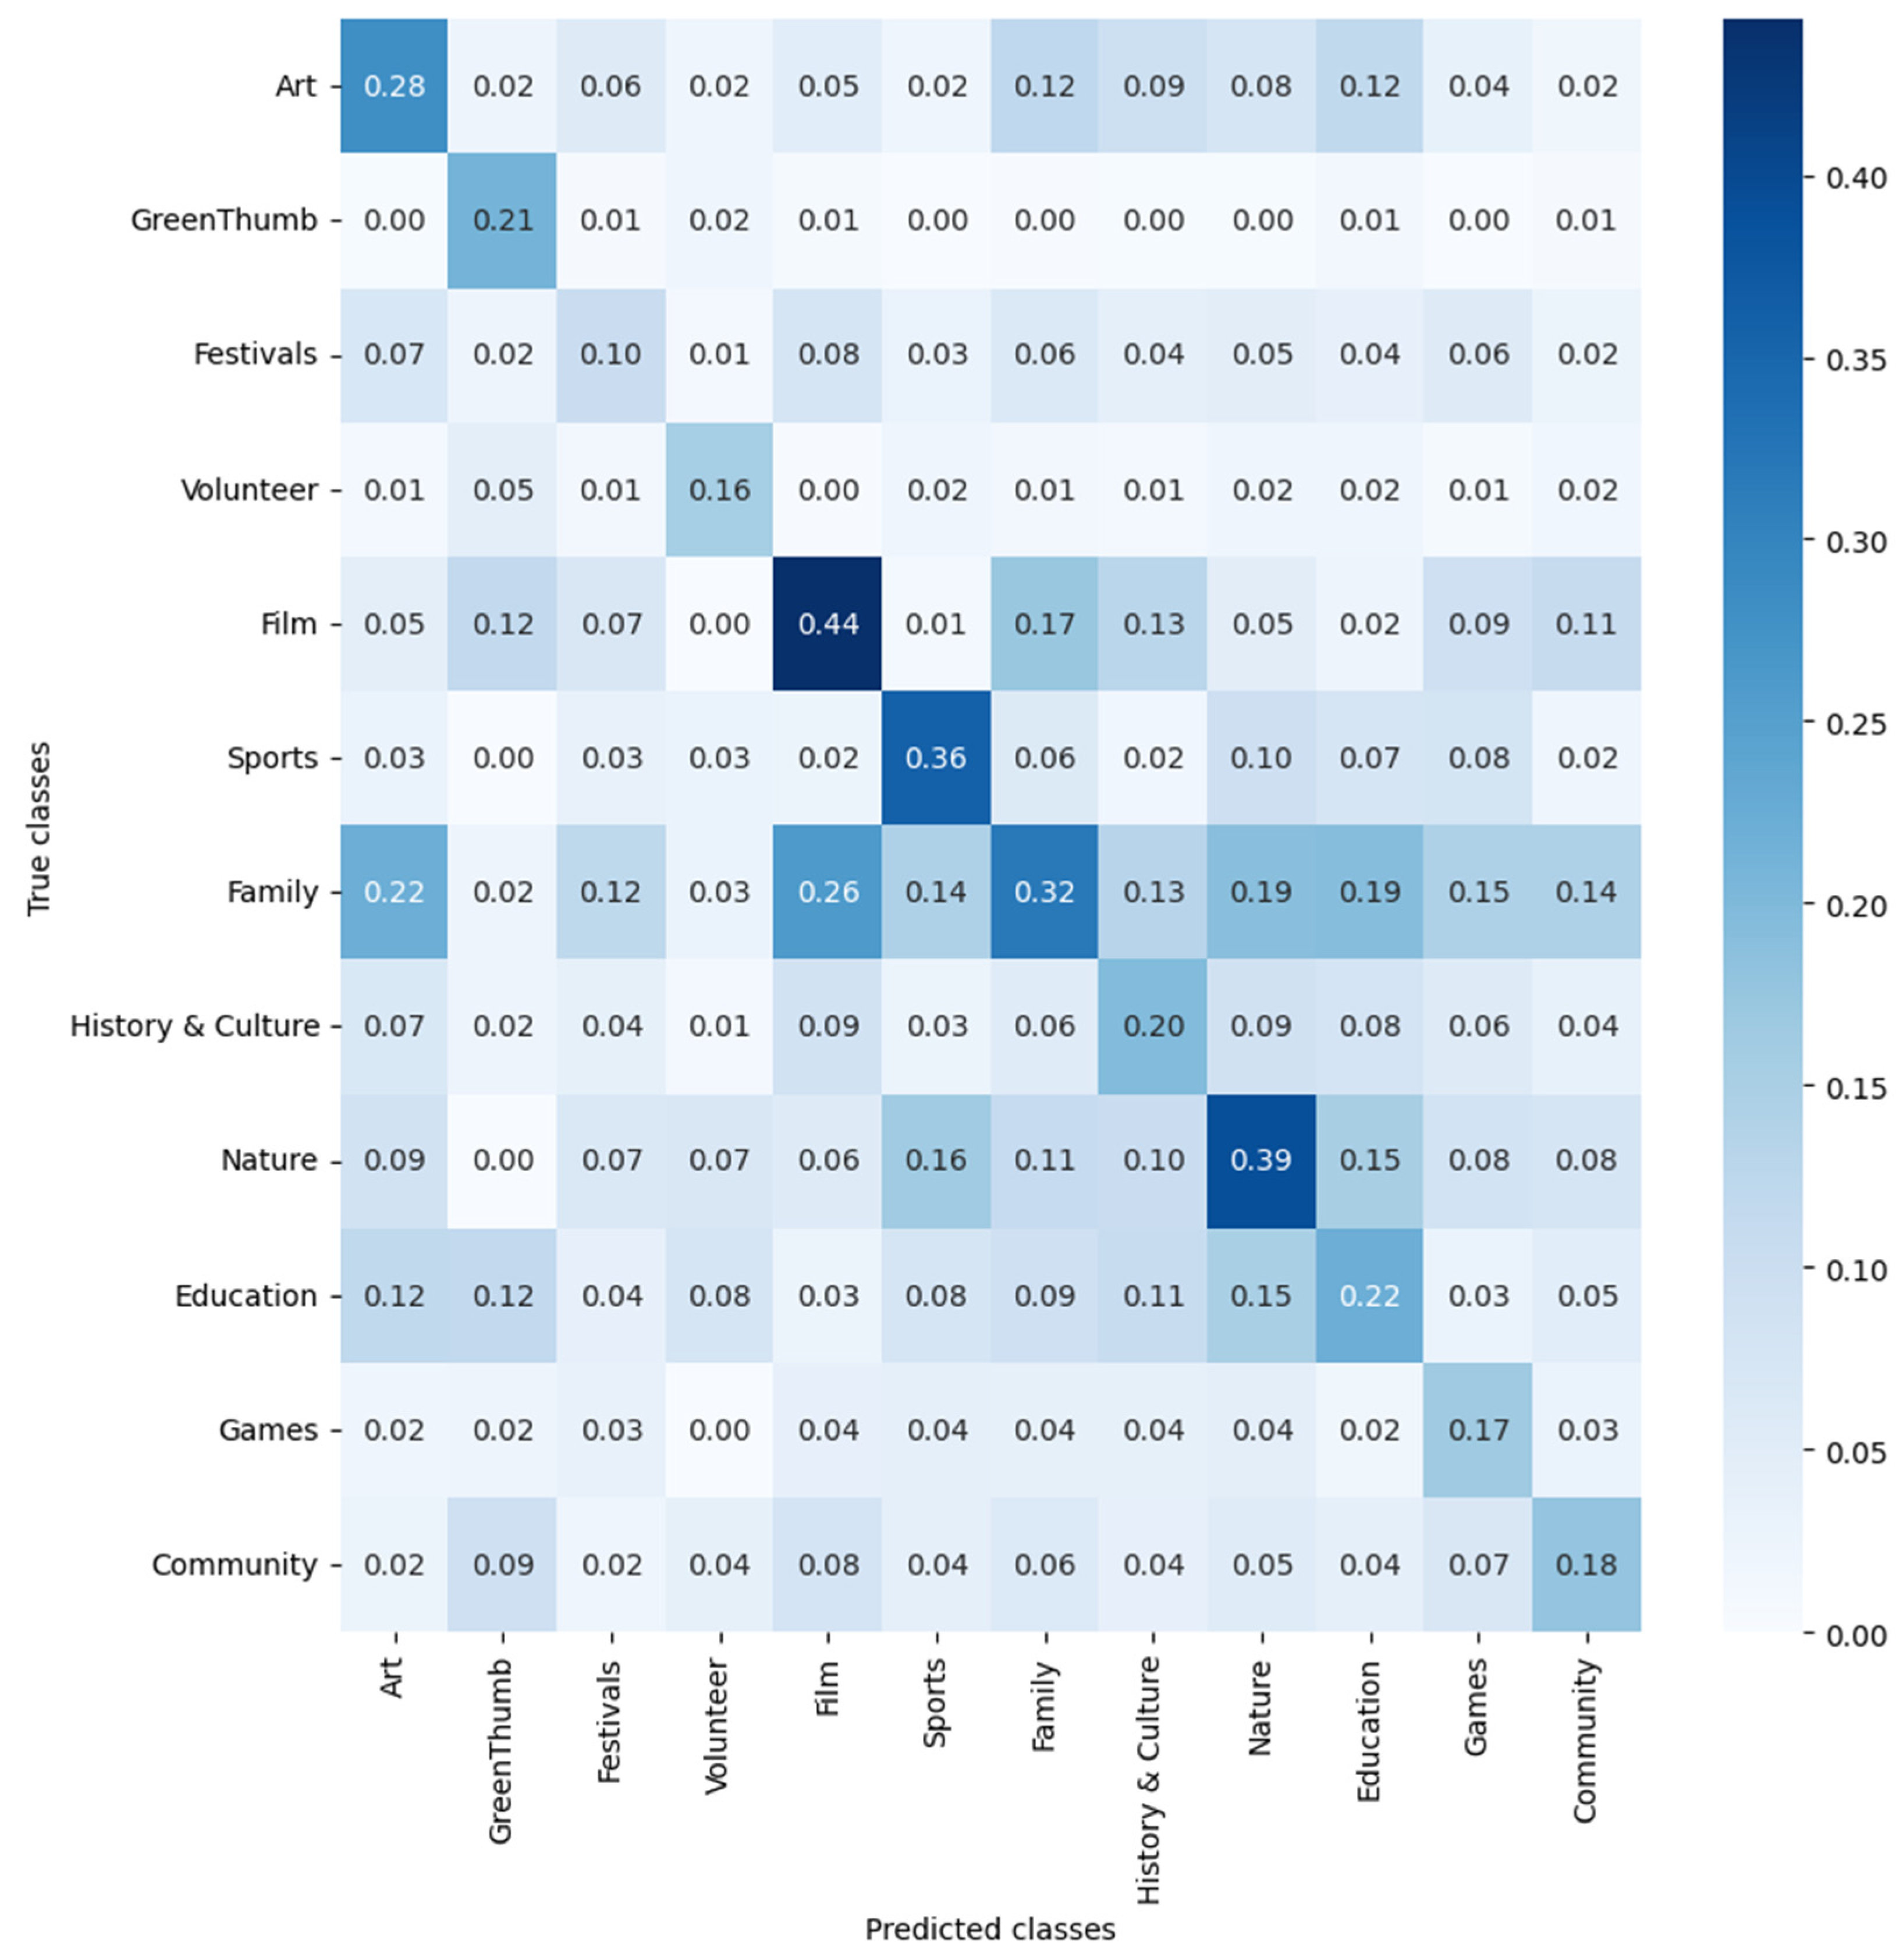
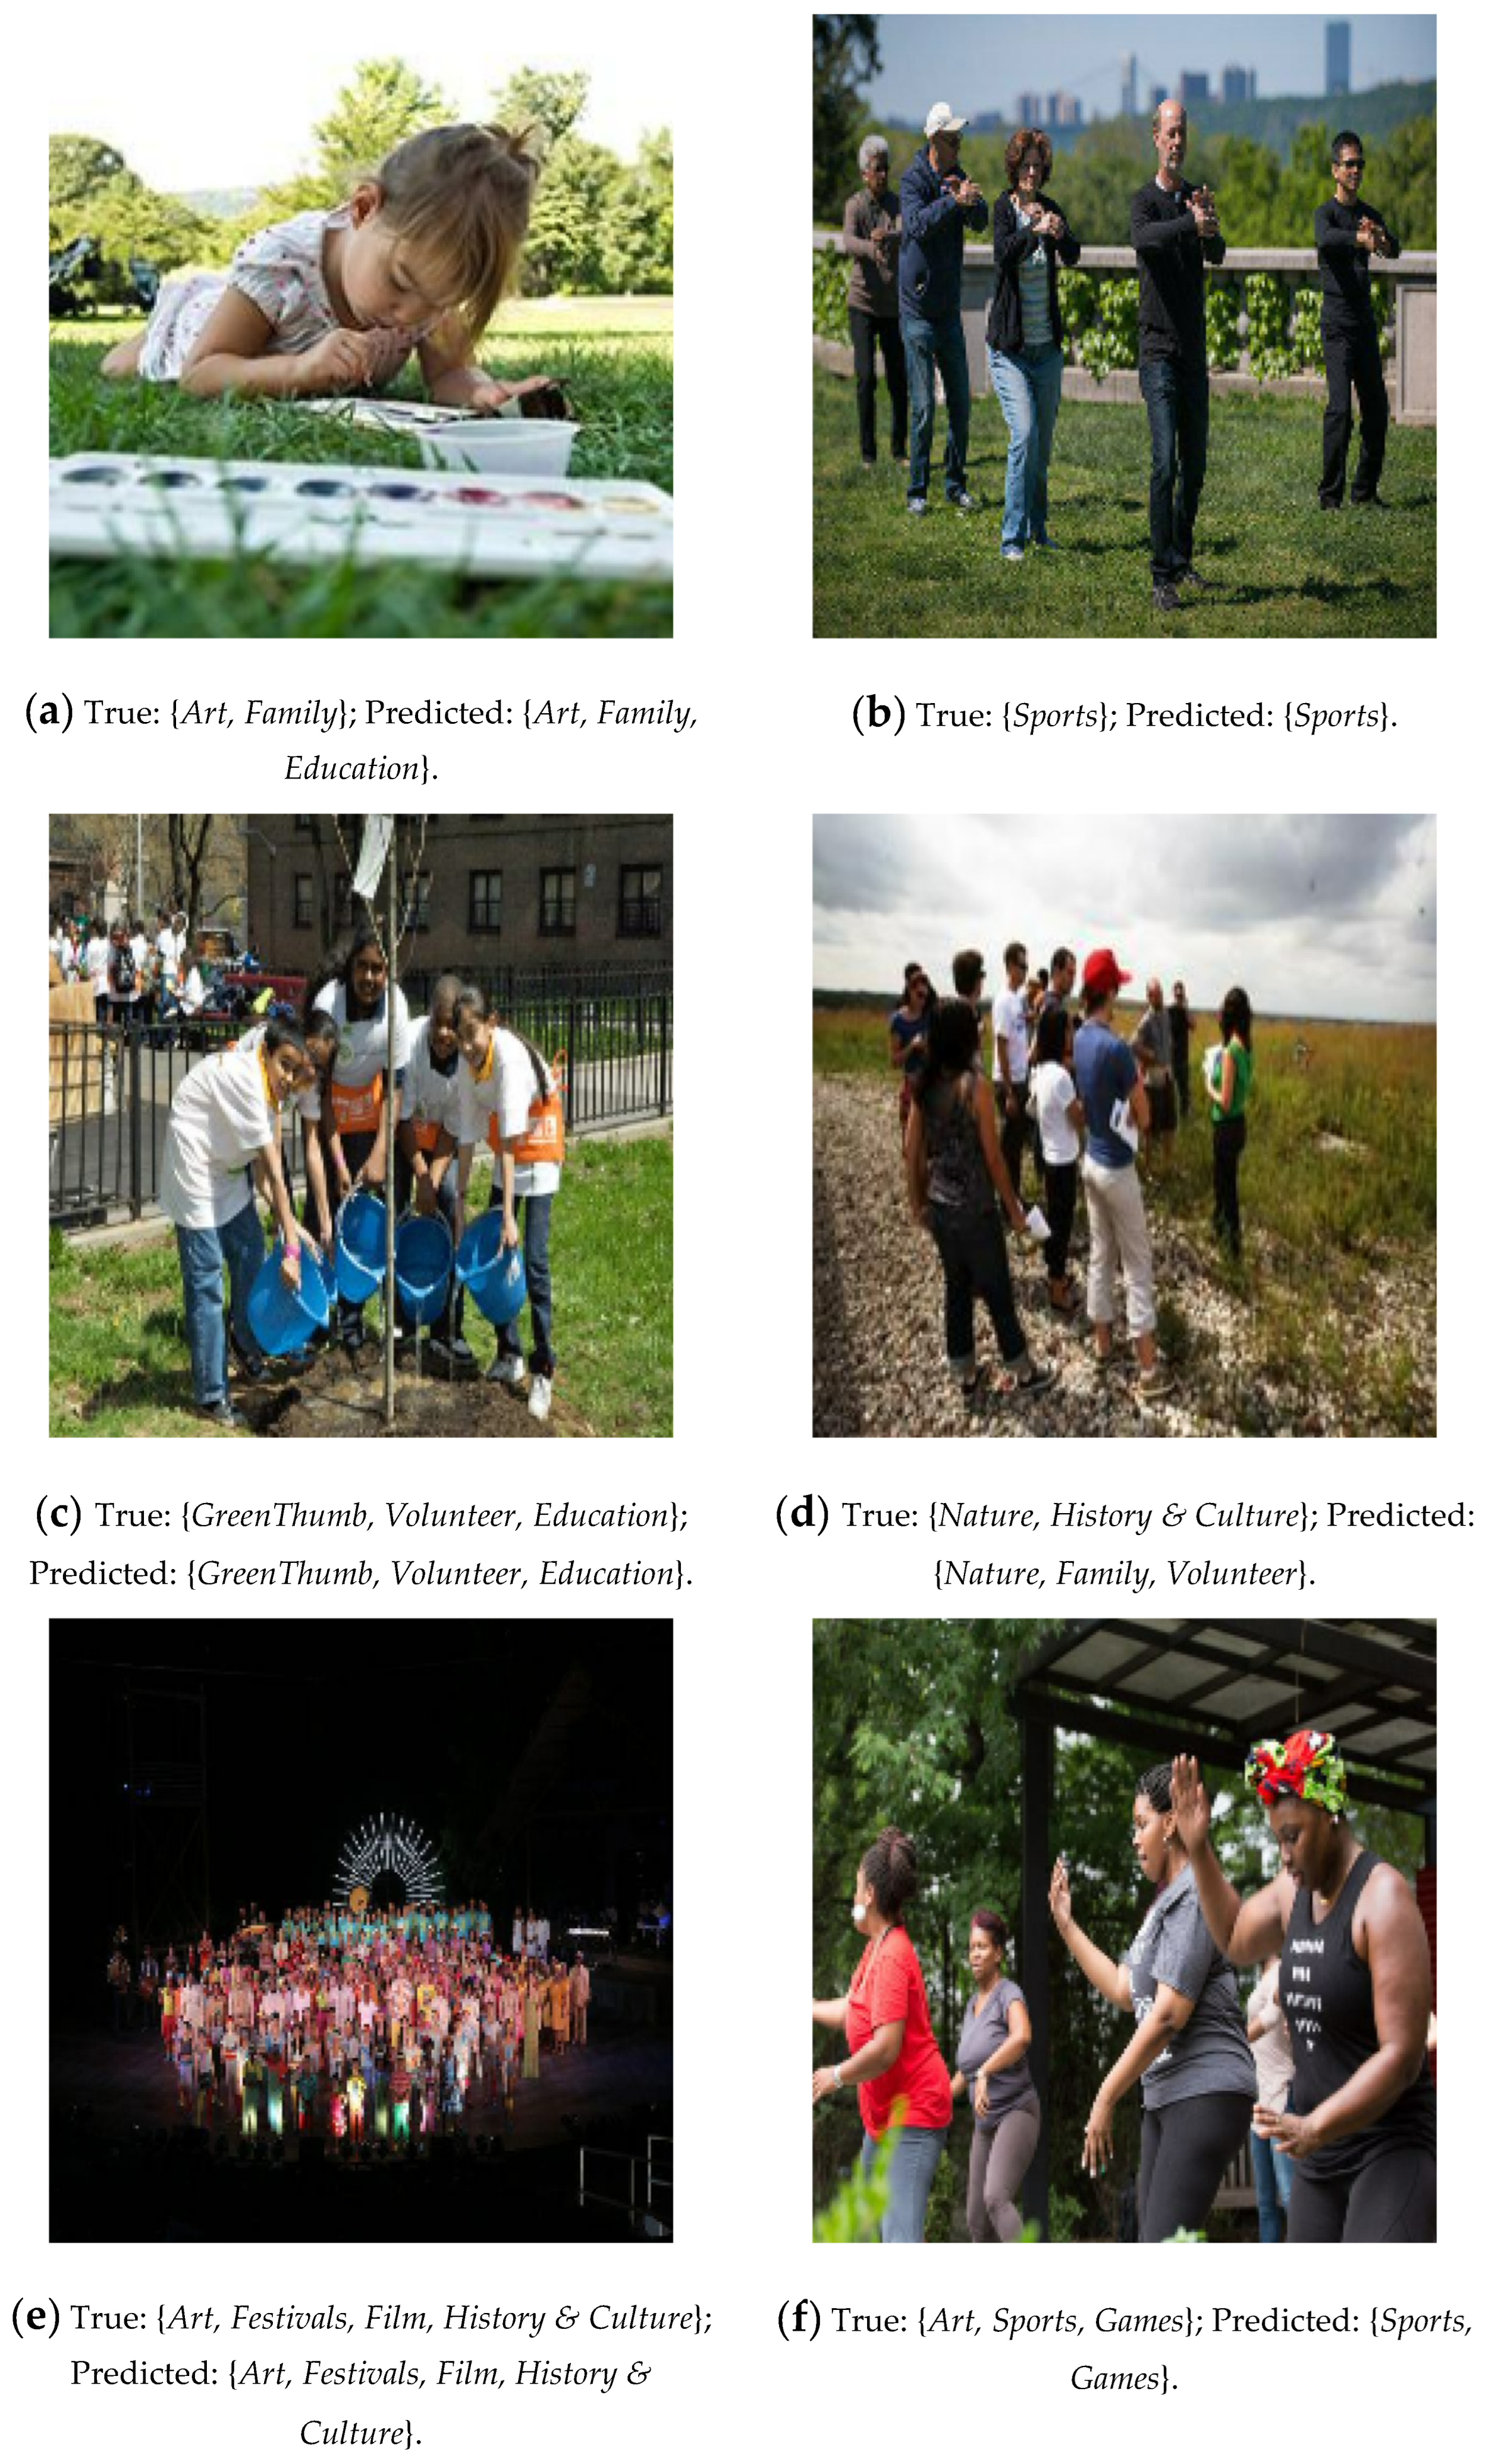
| Final Category | Original Category |
|---|---|
| Art | Art, Arts & Crafts, Art in the Parks: Celebrating 50 Years, Art in the Parks: UNIQLO Park Expressions Grant |
| GreenThumb | GreenThumb Events, GreenThumb Partner Events, GreenThumb 40th Anniversary, GreenThumb Workshops |
| Festivals | Festivals, Historic House Trust Festival, Valentine’s Day, Halloween, Saint Patrick’s Day, Earth Day & Arbor Day, Mother’s Day, Father’s Day, Holiday Lightings, Santa’s Coming to Town, Lunar New Year, Pumpkin Fest, Summer Solstice Celebrations, Easter, Fall Festivals, New Year’s Eve, Winter Holidays, Thanksgiving, National Night Out, Black History Month, Women’s History Month, LGBTQ Pride Month, Hispanic Heritage Month, Native American Heritage Month, Fourth of July, City of Water Day, She’s On Point |
| Volunteering | Volunteer, MillionTreesNYC: Volunteer: Tree Stewardship and Care, Martin Luther King Jr. Day of Service, MillionTreesNYC: Volunteer: Tree Planting |
| Film | Film, Free Summer Movies, Theater, Free Summer Theater, Movies Under the Stars, Concerts, Free Summer Concerts, SummerStage, CityParks PuppetMobile |
| Sports | Fitness, Outdoor Fitness, Running, Bike Month NYC, Hiking, Learn To Ride, Sports, Kayaking and Canoeing, National Trails Day, Brooklyn Beach Sports Festival, Summer Sports Experience, Fishing, Girls and Women in Sports, Bocce Tournament |
| Family | Best for Kids, Kids Week, CityParks Kids Arts, School Break, Family Camping, Dogs, Dogs in Parks: Town Hall, Seniors, Accessible |
| History & Culture | History, Historic House Trust Sites, Arts, Culture & Fun Series, Shakespeare in the Parks |
| Nature | Nature, Birding, Wildlife, Wildflower Week, Cherry Blossom Festivals, Waterfront, Rockaway Beach, Bronx River Greenway, Fall Foliage, Summer on the Hudson, Living With Deer in New York City, Tours, Freshkills Tours, Freshkills Park, Urban Park Rangers, Reforestation Stewardship |
| Education | Talks, Education, Astronomy, Partnerships for Parks Tree Workshops |
| Games | Dance, Games, Recreation Center Open House, NYC Parks Senior Games, Mobile Recreation Van Event |
| Community | Open House New York, Community Input Meetings, Fort Tryon Park Trust, Poe Park Visitor Center, Shape Up New York, City Parks Foundation, Forest Park Trust, City Parks Foundation Adults, Partnerships for Parks Training and Grant Deadlines, Community Parks Initiative, Anchor Parks, Markets, Food |
| Model | Transfer Learning Mode | Batch Size | Learning Rate | Epochs |
|---|---|---|---|---|
| VGG16 | Feature Extraction | 64 | 0.0002 | 80 |
| Fine-Tuning | 64 | 0.0002 | 80 | |
| ResNet50 | Feature Extraction | 64 | 0.0002 | 100 |
| Fine-Tuning | 64 | 0.0002 | 70 | |
| ResNet18 | Feature Extraction | 32 | 0.0002 | 20 |
| Fine-Tuning | 32 | 0.0001 | 10 | |
| GoogLeNet | Feature Extraction | 64 | 0.0002 | 80 |
| Fine-Tuning | 64 | 0.0002 | 60 | |
| C-Tran | From Scratch | 1 | 0.00001 | 40 |
| Model | Transfer Learning Mode | Accuracy | mAP * |
|---|---|---|---|
| HOG + SVM | From Scratch | 0.861 | 0.345 |
| VGG16 | Feature Extraction | 0.844 | 0.462 |
| Fine-Tuning | 0.854 | 0.564 | |
| ResNet50 | Feature Extraction | 0.823 | 0.360 |
| Fine-Tuning | 0.876 | 0.620 | |
| ResNet18 | Feature Extraction | 0.809 | 0.291 |
| Fine-Tuning | 0.870 | 0.601 | |
| GoogLeNet | Feature Extraction | 0.857 | 0.551 |
| Fine-Tuning | 0.876 | 0.602 | |
| CTran | From Scratch | - | 0.200 |
Disclaimer/Publisher’s Note: The statements, opinions and data contained in all publications are solely those of the individual author(s) and contributor(s) and not of MDPI and/or the editor(s). MDPI and/or the editor(s) disclaim responsibility for any injury to people or property resulting from any ideas, methods, instructions or products referred to in the content. |
© 2023 by the authors. Licensee MDPI, Basel, Switzerland. This article is an open access article distributed under the terms and conditions of the Creative Commons Attribution (CC BY) license (http://creativecommons.org/licenses/by/4.0/).


