Submitted:
31 August 2023
Posted:
31 August 2023
You are already at the latest version
Abstract
Keywords:
1. Introduction
- (1)
- To explore dynamic emotion recognition and social inference abilities between adults with and without TBI
- (2)
- To determine if adults with TBI exhibited different fixation patterns compared to adults without TBI in response to dynamic social interactions
- (3)
- To investigate relationships between fixation duration and fixation counts to AOI and emotion recognition and social inference accuracy scores
2. Materials and Methods
2.1. Participants
2.1.1. Inclusion/exclusion criteria
- Participants were required to be at least one-year post injury to ensure that chronic rather than acute effects of brain injury were measured
- Aged between 18 and 65 to account for any effects of natural aging
- History of psychiatric illness
- Significant depression and anxiety using the Hospital Anxiety and Depression Scale (HADS) [27]
2.1.2. Injury severity
2.2. Design
2.2.1. Stimuli and procedure
2.2.2. Apparatus Eye-Tracker
2.2.3. Eye tracking metrics
3. Results
3.1. Emotion Evaluation Test
3.1.1. Behavioural data
4. Discussion
5. Conclusions
Author Contributions
Funding
Institutional Review Board Statement
Informed Consent Statement
Data Availability Statement
Acknowledgments
Conflicts of Interest
Appendix A
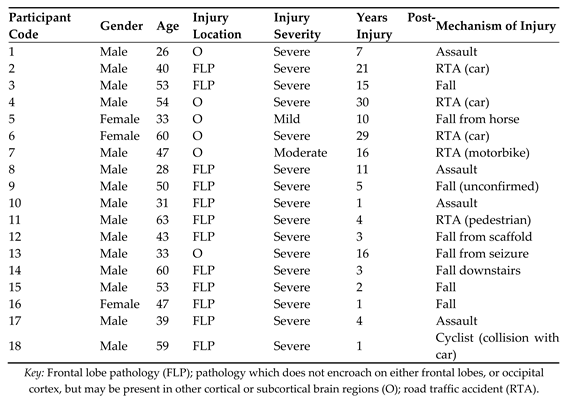
Appendix B
Appendix C.
- (1)
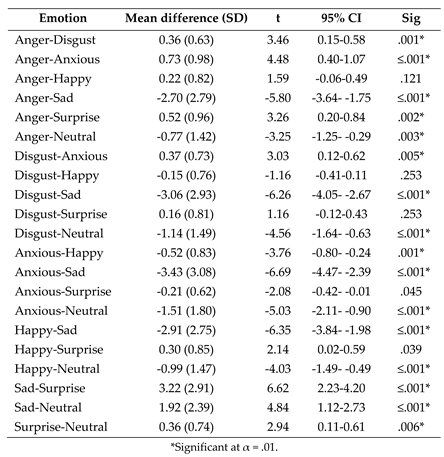
- Post-hoc paired samples t tests exploring the effect of emotion on fixation duration to the eyes following the significant ANOVA interaction between AOI and emotion.
- (2)
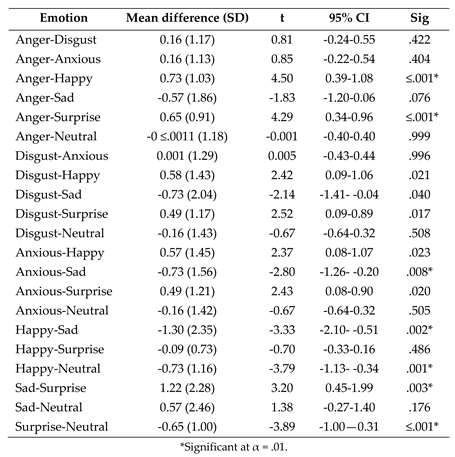
- Post-hoc paired samples t tests exploring the effect of emotion on fixation duration to the nose following the significant one-way ANOVA interaction between AOI and emotion.
- (3)
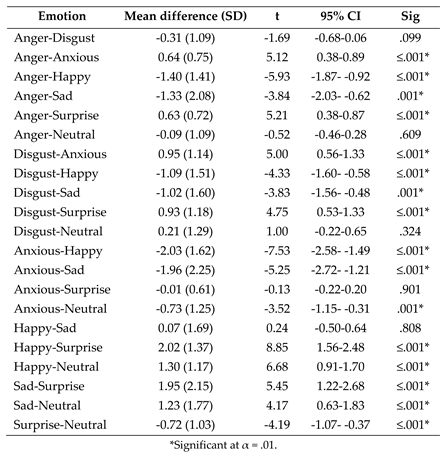
- Post-hoc paired samples t tests exploring the effect of emotion on fixation duration to the mouth following the significant one-way ANOVA interaction between AOI and emotion.
Appendix D.
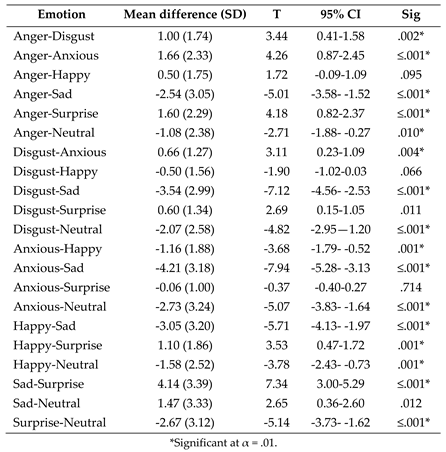
- (1)
- Post-hoc paired samples t tests exploring the effect of emotion on fixation count to the eyes following the significant one-way ANOVA interaction between AOI and emotion.
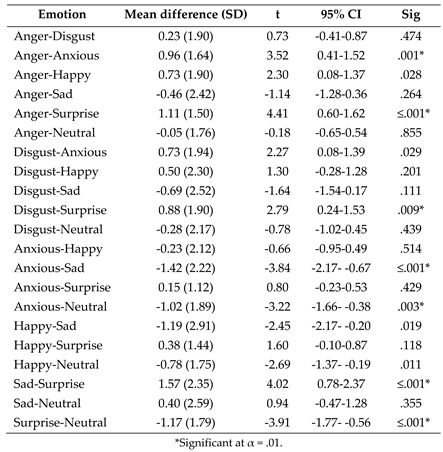
- (2)
- Post-hoc paired samples t tests exploring the effect of emotion on fixation count to the nose following the significant one-way ANOVA interaction between AOI and emotion.
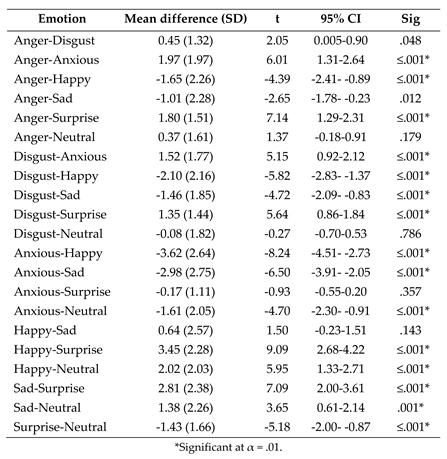
- (3)
- Post-hoc paired samples t tests exploring the effect of emotion on fixation count to the mouth following the significant one-way ANOVA interaction between AOI and emotion.
References
- Dewan, M.C.; Rattani, A.; Gupta, S.; Baticulon, R.E.; Hung, Y.C.; Punchak, M.; Agrawal, A.; Adeleye, A.O.; Shrime, M.G.; Rubiano, A.M.; et al. Estimating the global incidence of traumatic brain injury. J Neurosurg 2018, 1–18. [Google Scholar] [CrossRef] [PubMed]
- Pavlovic, D.; Pekic, S.; Stojanovic, M.; Popovic, V. Traumatic brain injury: neuropathological, neurocognitive and neurobehavioral sequelae. Pituitary 2019, 22, 270–282. [Google Scholar] [CrossRef] [PubMed]
- Theadom, A.; McDonald, S.; Starkey, N.; Barker-Collo, S.; Jones, K.M.; Ameratunga, S.; Wilson, E.; Feigin, V.L. Social cognition four years after mild-TBI: An age-matched prospective longitudinal cohort study. Neuropsychology 2019, 33, 560–567. [Google Scholar] [CrossRef] [PubMed]
- Venkatesan, U.M.; Lancaster, K.; Lengenfelder, J.; Genova, H.M. Independent contributions of social cognition and depression to functional status after moderate or severe traumatic brain injury. Neuropsychol Rehabil 2021, 31, 954–970. [Google Scholar] [CrossRef]
- Wearne, T.; Kelly, M.; McDonald, S. Disorders of social cognition in adults with acquired brain injury. In Clinical Disorders of Social Cognition; Routledge: 2021; pp. 145–177.
- Milders, M. Relationship between social cognition and social behaviour following traumatic brain injury. Brain Inj 2019, 33, 62–68. [Google Scholar] [CrossRef]
- Rigon, A.; Turkstra, L.S.; Mutlu, B.; Duff, M.C. Facial-affect recognition deficit as a predictor of different aspects of social-communication impairment in traumatic brain injury. Neuropsychology 2018, 32, 476–483. [Google Scholar] [CrossRef]
- Grayson, L.; Brady, M.C.; Togher, L.; Ali, M. The impact of cognitive-communication difficulties following traumatic brain injury on the family; a qualitative, focus group study. Brain Inj 2021, 35, 15–25. [Google Scholar] [CrossRef]
- Maggio, M.G.; Maresca, G.; Stagnitti, M.C.; Anchesi, S.; Casella, C.; Pajno, V.; De Luca, R.; Manuli, A.; Calabrò, R.S. Social cognition in patients with acquired brain lesions: An overview on an under-reported problem. Applied Neuropsychology: Adult 2022, 29, 419–431. [Google Scholar] [CrossRef]
- Kelly, M.; McDonald, S.; Frith, M.H.J. A Survey of Clinicians Working in Brain Injury Rehabilitation: Are Social Cognition Impairments on the Radar? Journal of Head Trauma Rehabilitation 2017, 32, E55–E65. [Google Scholar] [CrossRef]
- Murphy, J.M.; Bennett, J.M.; de la Piedad Garcia, X.; Willis, M.L. Emotion Recognition and Traumatic Brain Injury: a Systematic Review and Meta-Analysis. Neuropsychology Review 2022, 32, 520–536. [Google Scholar] [CrossRef]
- Lin, X.; Zhang, X.; Liu, Q.; Zhao, P.; Zhang, H.; Wang, H.; Yi, Z. Theory of mind in adults with traumatic brain injury: A meta-analysis. Neuroscience & Biobehavioral Reviews 2021, 121, 106–118. [Google Scholar] [CrossRef]
- McDonald, S. Impairments in Social Cognition Following Severe Traumatic Brain Injury. Journal of the International Neuropsychological Society 2013, 19, 231–246. [Google Scholar] [CrossRef] [PubMed]
- McDonald, S.; Flanagan, S.; Rollins, J.; Kinch, J. TASIT: A new clinical tool for assessing social perception after traumatic brain injury. J Head Trauma Rehabil 2003, 18, 219–238. [Google Scholar] [CrossRef] [PubMed]
- Rosenberg, H.; McDonald, S.; Dethier, M.; Kessels, R.P.; Westbrook, R.F. Facial emotion recognition deficits following moderate-severe Traumatic Brain Injury (TBI): re-examining the valence effect and the role of emotion intensity. J Int Neuropsychol Soc 2014, 20, 994–1003. [Google Scholar] [CrossRef]
- Babbage, D.R.; Yim, J.; Zupan, B.; Neumann, D.; Tomita, M.R.; Willer, B. Meta-analysis of facial affect recognition difficulties after traumatic brain injury. Neuropsychology 2011, 25, 277–285. [Google Scholar] [CrossRef]
- Biszak, A.M.; Babbage, D.R. Facial affect recognition difficulties in traumatic brain injury rehabilitation services. Brain Inj 2014, 28, 97–104. [Google Scholar] [CrossRef]
- Jack, R.E.; Schyns, P.G. The Human Face as a Dynamic Tool for Social Communication. Curr Biol 2015, 25, R621–R634. [Google Scholar] [CrossRef]
- Turkstra, L.S. Conversation-based assessment of social cognition in adults with traumatic brain injury. Brain Injury 2008, 22, 397–409. [Google Scholar] [CrossRef]
- Greene, L.; Barker, L.A.; Reidy, J.; Morton, N.; Atherton, A. Emotion recognition and eye tracking of static and dynamic facial affect: A comparison of individuals with and without traumatic brain injury. J Clin Exp Neuropsychol 2022, 44, 461–477. [Google Scholar] [CrossRef]
- Olivetti Belardinelli, M.; Hünefeldt, T.; Meloni, R.; Squitieri, F.; Maffi, S.; Migliore, S. Abnormal visual scanning and impaired mental state recognition in pre-manifest Huntington disease. Experimental Brain Research 2021, 239, 141–150. [Google Scholar] [CrossRef]
- Black, M.H.; Chen, N.T.M.; Lipp, O.V.; Bölte, S.; Girdler, S. Complex facial emotion recognition and atypical gaze patterns in autistic adults. Autism 2019, 24, 258–262. [Google Scholar] [CrossRef]
- Greene, L.; Barker, L.A.; Reidy, J.; Morton, N.; Atherton, A. Emotion recognition and eye tracking of static and dynamic facial affect: A comparison of individuals with and without traumatic brain injury. Journal of Clinical and Experimental Neuropsychology 2022, 44, 461–477. [Google Scholar] [CrossRef]
- Douglas, J.; Vassallo, S.; White, E. Interpreting facial expression after traumatic brain injury: The role of visual scanning. In Proceedings of the International Brain Injury Association’s Eighth World Congress on Brain Injury; 2010. [Google Scholar]
- Vassallo, S.; Douglas, J.; White, E. Visual scanning in the recognition of facial affect in traumatic brain injury. i-Perception 2011, 2, 250–250. [Google Scholar] [CrossRef]
- Vassallo, S.; White, E.; Douglas, J. Visual Scanning to Emotional Facial Expressions is Impaired After Severe Traumatic Brain Injury. Investigative Ophthalmology & Visual Science 2010, 51, 2547–2547. [Google Scholar]
- Oatley, A.E.A.; Torsein, A.; Sadeghi, M.; Green, R.E.A. Reading Facial Emotions After Traumatic Brain Injury (TBI): Implications for Social Functioning and Treatment Development. Archives of Physical Medicine and Rehabilitation 2014, 95, e48. [Google Scholar] [CrossRef]
- Barker, L.A.; Andrade, J.; Morton, N.; Romanowski, C.A.J.; Bowles, D.P. Investigating the ‘latent’ deficit hypothesis: Age at time of head injury, implicit and executive functions and behavioral insight. Neuropsychologia 2010, 48, 2550–2563. [Google Scholar] [CrossRef]
- Barker, L.A.; Morton, N. Editorial: Executive Function(s): Conductor, Orchestra or Symphony? Towards a Trans-Disciplinary Unification of Theory and Practice Across Development, in Normal and Atypical Groups. Frontiers in Behavioral Neuroscience 2018, 12. [Google Scholar] [CrossRef]
- Calbi, M.; Langiulli, N.; Siri, F.; Umiltà, M.A.; Gallese, V. Visual exploration of emotional body language: a behavioural and eye-tracking study. Psychological Research 2021, 85, 2326–2339. [Google Scholar] [CrossRef]
- Calvo, M.G.; Fernández-Martín, A.; Gutiérrez-García, A.; Lundqvist, D. Selective eye fixations on diagnostic face regions of dynamic emotional expressions: KDEF-dyn database. Scientific reports 2018, 8, 1–10. [Google Scholar] [CrossRef]
- Pérez-Moreno, E.; Romero-Ferreiro, V.; García-Gutiérrez, A. Where to look when looking at faces: Visual scanning is determined by gender, expression and tasks demands. Psicológica 2016, 37, 127–150. [Google Scholar]
- Schurgin, M.W.; Nelson, J.; Iida, S.; Ohira, H.; Chiao, J.Y.; Franconeri, S.L. Eye movements during emotion recognition in faces. J Vis 2014, 14, 14. [Google Scholar] [CrossRef]
- Knox, L.; Douglas, J. Long-term ability to interpret facial expression after traumatic brain injury and its relation to social integration. Brain and Cognition 2009, 69, 442–449. [Google Scholar] [CrossRef]
- Wechsler, D. Wechsler abbreviated scale of intelligence. 1999.
- Dziobek, I.; Fleck, S.; Kalbe, E.; Rogers, K.; Hassenstab, J.; Brand, M.; Kessler, J.; Woike, J.K.; Wolf, O.T.; Convit, A. Introducing MASC: A Movie for the Assessment of Social Cognition. Journal of Autism and Developmental Disorders 2006, 36, 623–636. [Google Scholar] [CrossRef]
- McDonald, S. New Frontiers in Neuropsychological Assessment: Assessing Social Perception Using a Standardised Instrument, The Awareness of Social Inference Test. Australian Psychologist 2012, 47, 39–48. [Google Scholar] [CrossRef]
- Brent, J.; Neumann, D.; Hammond, F. Exploring Changes in Social Inferencing and Negative Attributions Following an Intervention for Individuals with Brain Injury. Archives of Physical Medicine and Rehabilitation 2022, 103, e16. [Google Scholar] [CrossRef]
- Naz, S.I.; Neumann, D.; Mueid, R.; Christopher, L. Using Machine Learning Classification to Predict Social Inferencing Performance from Eye-tracking Data in Participants with and without Brain Injury. Archives of Physical Medicine and Rehabilitation 2021, 102, e27. [Google Scholar] [CrossRef]
- Neumann, D.; Mayfield, R.; Sander, A.M.; Jang, J.H.; Bhamidipalli, S.S.; Hammond, F.M. Examination of Social Inferencing Skills in Men and Women After Traumatic Brain Injury. Archives of Physical Medicine and Rehabilitation 2022, 103, 937–943. [Google Scholar] [CrossRef]
- Tobii Technologies Stockholm, Sweden.
- Finch, H. Comparison of the performance of nonparametric and parametric MANOVA test statistics when assumptions are violated. Methodology: European Journal of Research Methods for the Behavioral and Social Sciences 2005, 1, 27. [Google Scholar] [CrossRef]
- Feng, C.; Wang, H.; Lu, N.; Chen, T.; He, H.; Lu, Y.; Tu, X.M. Log-transformation and its implications for data analysis. Shanghai Arch Psychiatry 2014, 26, 105–109. [Google Scholar] [CrossRef]
- Bird, G.; Press, C.; Richardson, D.C. The role of alexithymia in reduced eye-fixation in Autism Spectrum Conditions. J Autism Dev Disord 2011, 41, 1556–1564. [Google Scholar] [CrossRef]
- Klin, A.; Jones, W.; Schultz, R.; Volkmar, F.; Cohen, D. Visual fixation patterns during viewing of naturalistic social situations as predictors of social competence in individuals with autism. Arch Gen Psychiatry 2002, 59, 809–816. [Google Scholar] [CrossRef]
- McDonald, S. Neuropsychological Studies of Sarcasm. Metaphor and Symbol 2000, 15, 85–98. [Google Scholar] [CrossRef]
- Deliens, G.; Antoniou, K.; Clin, E.; Kissine, M. Perspective-taking and frugal strategies: Evidence from sarcasm detection. Journal of Pragmatics 2017, 119, 33–45. [Google Scholar] [CrossRef]
- Turkstra, L.S.; Norman, R.S.; Mutlu, B.; Duff, M.C. Impaired theory of mind in adults with traumatic brain injury: A replication and extension of findings. Neuropsychologia 2018, 111, 117–122. [Google Scholar] [CrossRef]
- Alves, N.T. Recognition of static and dynamic facial expressions: a study review. Estudos de Psicologia (Natal) 2013, 18, 125–130. [Google Scholar] [CrossRef]
- Barrett, L.F.; Mesquita, B.; Gendron, M. Context in Emotion Perception. Current Directions in Psychological Science 2011, 20, 286–290. [Google Scholar] [CrossRef]
- Ibañez, A.; Manes, F. Contextual social cognition and the behavioral variant of frontotemporal dementia. Neurology 2012, 78, 1354–1362. [Google Scholar] [CrossRef]
- McCamy, M.B.; Otero-Millan, J.; Di Stasi, L.L.; Macknik, S.L.; Martinez-Conde, S. Highly Informative Natural Scene Regions Increase Microsaccade Production during Visual Scanning. The Journal of Neuroscience 2014, 34, 2956. [Google Scholar] [CrossRef]
- Kilts, C.D.; Egan, G.; Gideon, D.A.; Ely, T.D.; Hoffman, J.M. Dissociable Neural Pathways Are Involved in the Recognition of Emotion in Static and Dynamic Facial Expressions. NeuroImage 2003, 18, 156–168. [Google Scholar] [CrossRef]
- Trautmann-Lengsfeld, S.A.; Domínguez-Borràs, J.; Escera, C.; Herrmann, M.; Fehr, T. The perception of dynamic and static facial expressions of happiness and disgust investigated by ERPs and fMRI constrained source analysis. PLoS One 2013, 8, e66997. [Google Scholar] [CrossRef]
- Kujawa, K.; Żurek, A.; Gorączko, A.; Olejniczak, R.; Zurek, G. Monitoring Eye Movements Depending on the Type of Visual Stimulus in Patients with Impaired Consciousness Due to Brain Damage. Int J Environ Res Public Health 2022, 19. [Google Scholar] [CrossRef]
- Blais, C.; Fiset, D.; Roy, C.; Saumure Régimbald, C.; Gosselin, F. Eye fixation patterns for categorizing static and dynamic facial expressions. Emotion 2017, 17, 1107–1119. [Google Scholar] [CrossRef]
- Stoesz, B.M.; Jakobson, L.S. A sex difference in interference between identity and expression judgments with static but not dynamic faces. J Vis 2013, 13, 26. [Google Scholar] [CrossRef]
- Rothermich, K.; Schoen Simmons, E.; Rao Makarla, P.; Benson, L.; Plyler, E.; Kim, H.; Henssel Joergensen, G. Tracking nonliteral language processing using audiovisual scenarios. Can J Exp Psychol 2021, 75, 211–220. [Google Scholar] [CrossRef]
- Arcara, G.; Tonini, E.; Muriago, G.; Mondin, E.; Sgarabottolo, E.; Bertagnoni, G.; Semenza, C.; Bambini, V. Pragmatics and figurative language in individuals with traumatic brain injury: fine-grained assessment and relevance-theoretic considerations. Aphasiology 2020, 34, 1070–1100. [Google Scholar] [CrossRef]
- Königs, M.; Engenhorst, P.J.; Oosterlaan, J. Intelligence after traumatic brain injury: meta-analysis of outcomes and prognosis. Eur J Neurol 2016, 23, 21–29. [Google Scholar] [CrossRef]
| Demographic Variable | TBI group mean (SD) | Non-TBI group mean (SD) | p | d. |
|---|---|---|---|---|
| Gender | m = 15, f = 3 | m = 15, f = 3 | ||
| Age at test | 44.94 (11.69) | 43.83 (12.26) | .696 | 0.09 |
| Age at injury | 36.44 (13.79) | |||
| Post-injury years | 8.50 (8.68) | |||
| Years of education | 14.83 (4.25) | 5.56 (3.65) | .389 | 0.18 |
| Verbal IQ | 84.06 (18.71) | 95.33 (8.66) | .007 | 0.77 |
| Performance IQ | 91.00 (17.50) | 104.72 (11.64) | 0.15 | 0.94 |
| Full IQ score | 90.25 (19.69) | 100.06 (10.44) | .025 | 0.65 |
| TASIT EET Score | TBI Mean (SD) | Non-TBI Mean (SD) |
|---|---|---|
| Overall Correct | 19.67 (3.99) | 24.28 (1.60) |
| Happy | 3.11 (1.13) | 3.28 (0.67) |
| Surprised | 3.22 (0.81) | 3.67 (0.49) |
| Neutral | 2.00 (0.91) | 2.72 (0.83) |
| Sad | 2.72 (1.32) | 3.50 (0.71) |
| Angry | 3.00 (1.08) | 3.56 (0.51) |
| Anxious | 2.89 (1.32) | 3.94 (0.24) |
| Revolted | 2.72 (1.02) | 3.56 (0.62) |
| EET Emotions | Groups combined Mean (SD) |
TBI Mean (SD) | Non-TBI Mean (SD) |
|---|---|---|---|
|
Angry Eyes Nose Mouth |
3.97 (3.01) 1.15 (1.25) 1.59 (1.80) 1.23 (0.90) |
2.92 (2.12) 0.92 (1.08) 0.93 (1.16) 1.07 (0.90) |
5.03 (3.43) 1.37 (1.40) 2.26 (2.10) 1.40 (0.90) |
|
Revolted Eyes Nose Mouth |
3.76 (3.06) 0.78 (0.97) 1.43 (2.05) 1.54 (1.56) |
3.01 (1.99) 0.72 (0.97) 0.82 (1.04) 1.48 (1.35) |
4.50 (3.76) 0.85 (0.99) 2.05 (2.60) 1.61 (1.78) |
|
Anxious Eyes Nose Mouth |
2.44 (2.74) 0.41 (0.61) 1.43 (1.99) 0.60 (0.87) |
1.53 (2.10) 0.51 (0.74) 0.60 (1.06) 0.42 (0.76) |
3.35 (3.05) 0.32 (0.44) 2.27 (2.36) 0.77 (0.96) |
|
Happy Eyes Nose Mouth |
4.41 (2.35) 0.93 (1.13) 0.86 (1.02) 2.62 (1.70) |
4.04 (2.32) 0.62 (0.96) 0.69 (0.68) 2.73 (1.74) |
4.79 (2.38) 1.24 (1.23) 1.02 (1.28) 2.53 (1.71) |
|
Sad Eyes Nose Mouth |
8.56 (6.68) 3.84 (3.53) 2.16 (3.16) 2.56 (2.60) |
6.92 (5.48) 3.40 (3.91) 1.05 (1.13) 2.47 (2.59) |
10.21 (7.50) 4.28 (3.16) 2.37 (3.99) 2.65 (2.67) |
|
Surprised Eyes Nose Mouth |
2.18 (1.95) 0.63 (1.05) 0.94 (1.22) 0.61 (0.68) |
1.64 (1.77) 0.70 (1.28) 0.51 (0.66) 0.43 (0.46) |
2.72 (2.01) 0.55 (0.79) 1.38 (1.49) 0.79 (0.82) |
|
Neutral Eyes Nose Mouth |
4.84 (2.92) 1.92 (2.22) 1.59 (1.49) 1.33 (1.23) |
4.36 (2.76) 1.85 (2.36) 1.13 (1.23) 1.38 (1.51) |
5.32 (3.08) 1.98 (2.14) 2.06 (1.61) 1.27 (0.90) |
| Overall (emotions combined) | 3.82 (2.82) | 2.93 (2.32) | 4.69 (3.05) |
| Eyes | 0.98 (1.21) | 0.87 (1.29) | 1.57 (1.58) |
| Nose | 1.37 (1.65) | 0.72 (0.89) | 1.57 (1.56) |
| Mouth | 1.47 (1.16) | 1.35 (1.16) | 1.68 (1.88) |
| EET Emotions | Groups combined Mean (SD) |
TBI Mean (SD) | Non-TBI Mean (SD) |
|---|---|---|---|
|
Angry Eyes Nose Mouth |
8.80 (5.52) 2.67 (2.76) 2.98 (2.74) 3.14 (1.98) |
6.54 (3.75) 1.93 (2.14) 1.69 (1.70) 2.92 (1.99) |
11.06 (6.15) 3.42 (3.16) 4.26 (3.01) 3.38 (1.99) |
|
Revolted Eyes Nose Mouth |
7.12 (4.93) 1.68 (1.66) 2.75 (3.00) 2.69 (2.13) |
6.36 (4.07) 1.66 (1.68) 2.02 (2.35) 2.68 (2.02) |
7.89 (5.68) 1.70 (1.69) 3.48 (3.45) 2.71 (2.29) |
|
Anxious Eyes Nose Mouth |
4.21 (4.25) 1.02 (1.24) 2.02 (2.52) 1.17 (1.65) |
3.00 (3.51) 1.12 (1.39) 0.92 (1.13) 0.96 (1.65) |
5.41 (4.68) 0.91 (1.11) 3.11 (3.05) 1.39 (1.65) |
|
Happy Eyes Nose Mouth |
9.22 (4.19) 2.17 (2.12) 2.25 (1.77) 4.79 (2.60) |
8.79 (3.99) 1.42 (1.38) 2.07 (1.65) 5.30 (2.88) |
9.64 (4.45) 2.92 (2.49) 2.43 (1.92) 4.29 (2.26) |
|
Sad Eyes Nose Mouth |
12.81 (8.24) 5.22 (3.77) 3.44 (3.98) 4.15 (3.26) |
11.15 (7.00) 4.96 (4.08) 2.21 (2.51) 3.99 (3.09) |
14.47 (9.21) 5.49 (3.53) 4.67 (4.81) 4.32 (3.49) |
|
Surprised Eyes Nose Mouth |
4.29 (3.28) 1.08 (1.16) 1.87 (2.15) 1.34 (1.29) |
3.37 (2.89) 1.02 (1.19) 1.19 (1.32) 1.16 (1.15) |
5.21 (3.47) 1.13 (1.16) 2.54 (2.60) 1.53 (1.42) |
|
Neutral Eyes Nose Mouth |
9.56 (5.42) 3.75 (3.72) 3.03 (2.46) 2.78 (2.03) |
7.81 (4.34) 2.98 (3.08) 2.12 (2.10) 2.71 (2.29) |
11.31 (5.93) 4.52 (4.21) 3.94 (2.50) 2.84 (1.78) |
| Overall | 7.38 (4.61) | 5.82 (3.72) | 8.94 (4.97) |
| Eyes | 2.02 (1.84) | 1.57 (1.58) | 2.48 (2.01) |
| Nose | 2.54 (2.44) | 1.57 (1.56) | 3.51 (2.80) |
| Mouth | 2.82 (1.80) | 2.68 (1.88) | 2.96 (1.76) |
| SI-M Score | TBI Mean (SD) | Control Mean (SD) |
|---|---|---|
| Simple sarcasm | 15.28 (3.63) | 17.71 (2.11) |
| Paradoxical sarcasm | 15.94 (4.01) | 18.18 (2.24) |
| Sincere | 15.39 (3.31) | 19.76 (1.48) |
| SI-M Score | TBI Mean (SD) | Non-TBI Mean (SD) |
|---|---|---|
| Intentions | 11.39 (2.73) | 13.82 (1.07) |
| Meaning | 11.78 (2.21) | 13.83 (0.95) |
| Beliefs | 11.11 (2.47) | 13.71 (1.05) |
| Feelings | 12.89 (1.75) | 14.00 (0.94) |
| Conversational Style | Overall mean (SD) | TBI mean (SD) | Control mean (SD) |
|---|---|---|---|
|
Simple sarcasm Eyes Nose Mouth |
1.70 (1.54) 0.34 (0.54) 0.55 (0.67 0.81 (0.79) |
1.77 (1.47) 0.44 (0.65) 0.51 (0.56) 0.82 (0.75) |
1.63 (1.65) 0.23 (0.37) 0.58 (0.78) 0.81 (0.86) |
|
Paradoxical sarcasm Eyes Nose Mouth |
0.74 (0.66) 0.21 (0.26) 0.29 (0.39) 0.24 (0.28) |
0.80 (0.62) 0.26 (0.30) 0.24 (0.30) 0.30 (0.33) |
0.68 (0.72) 0.15 (0.19) 0.35 (0.48) 0.18 (0.20) |
|
Sincere Eyes Nose Mouth |
2.79 (1.82) 0.59 (0.82) 0.95 (0.92) 1.25 (1.23) |
3.02 (2.24) 0.68 (1.00) 1.01 (0.98) 1.34 (1.51) |
2.53 (1.26) 0.49 (0.59) 0.89 (0.88) 1.15 (0.88) |
| Conversational Style | Overall mean (SD) | TBI mean (SD) | Control mean (SD) |
|---|---|---|---|
|
Sarcasm Eyes Nose Mouth |
4.52 (3.21) 0.95 (1.27) 1.55 (1.46) 2.02 (1.58) |
4.62 (2.74) 1.22 (1.49) 1.48 (1.76) 1.92 (1.43) |
4.41 (3.72) 0.67 (0.96) 1.61 (1.75) 2.13 (1.76) |
|
Paradoxical sarcasm Eyes Nose Mouth |
1.97 (1.48) 0.62 (0.63) 0.75 (0.78) 0.61 (0.50) |
2.12 (1.44) 0.76 (0.71) 0.73 (0.69) 0.63 (0.56) |
1.82 (1.56) 0.46 (0.52) 0.76 (0.89) 0.59 (0.46) |
|
Sincere Eyes Nose Mouth |
5.73 (3.41) 1.67 (2.06) 1.94 (1.56) 2.12 (1.69) |
5.44 (3.71) 1.55 (1.62) 1.91 (1.67) 1.98 (1.90) |
6.04 (3.16) 1.79 (2.49) 1.98 (1.49) 2.27 (1.48) |
| SI-E Score | TBI Mean (SD) | Control Mean (SD) |
|---|---|---|
| Sarcastic | 22.56 (4.77) | 29.41 (3.37) |
| Lie | 25.33 (4.38) | 27.76 (3.11) |
| SI-E Score | TBI Mean (SD) | Control Mean (SD) |
|---|---|---|
| Intentions | 11.28 (2.49) | 14.82 (1.63) |
| Meaning | 11.17 (2.60) | 14.47 (1.70) |
| Beliefs | 13.33 (1.81) | 14.47 (0.72) |
| Feelings | 12.11 (2.47) | 14.12 (2.45) |
| Conversational Style | Overall mean (SD) | TBI mean (SD) | Control mean (SD) |
|---|---|---|---|
|
Sarcasm Eyes Nose Mouth |
0.98 (0.92) 0.37 (0.45) 0.35 (0.39) 0.26 (0.25) |
0.85 (0.70) 0.31 (0.37) 0.29 (0.30) 0.25 (0.19) |
1.11 (1.10) 0.43 (0.53) 0.41 (0.47) 0.28 (0.30) |
|
Lie Eyes Nose Mouth |
0.38 (0.57) 0.14 (0.24) 0.11 (0.20) 0.13 (0.22) |
0.25 (0.30) 0.12 (0.19) 0.07 (0.11) 0.06 (0.08) |
0.51 (0.75) 0.17 (0.30) 0.14 (0.25) 0.20 (0.29) |
| Conversational Style | Overall mean (SD) | TBI mean (SD) | Control mean (SD) |
|---|---|---|---|
|
Sarcasm Eyes Nose Mouth |
3.90 (2.74) 1.33 (1.25) 1.39 (1.22) 1.18 (0.82) |
3.62 (2.04) 1.21 (1.10) 1.24 (0.83) 1.16 (0.72) |
4.20 (3.37) 1.45 (1.42) 1.55 (1.55) 1.20 (0.95) |
|
Lie Eyes Nose Mouth |
1.48 (1.94) 0.47 (0.63) 0.49 (0.74) 0.52 (0.77) |
1.12 (0.98) 0.44 (0.53) 0.35 (0.39) 0.33 (0.31) |
1.86 (2.58) 0.49 (0.74) 0.65 (0.98) 0.72 (1.03) |
Disclaimer/Publisher’s Note: The statements, opinions and data contained in all publications are solely those of the individual author(s) and contributor(s) and not of MDPI and/or the editor(s). MDPI and/or the editor(s) disclaim responsibility for any injury to people or property resulting from any ideas, methods, instructions or products referred to in the content. |
© 2023 by the authors. Licensee MDPI, Basel, Switzerland. This article is an open access article distributed under the terms and conditions of the Creative Commons Attribution (CC BY) license (http://creativecommons.org/licenses/by/4.0/).


