Submitted:
31 August 2023
Posted:
31 August 2023
You are already at the latest version
Abstract
Keywords:
1. INTRODUCTION
2. EXPERIMENTAL DETAILS
2.1. Synthesis Procedure
2.2. Characterization
2.3. Sensor Fabrication and Measurements
3. RESULTS AND DISCUSSION
3.1. X-ray diffraction, surface morphology and Chemical Composition
3.2. Gas sensing properties
3.2.1. Gas sensing Mechanism

4. CONCLUSIONS
Supplementary Materials
Acknowledgments
References
- Majhi, S.M.; Naik, G.K.; Lee, H.-J.; Song, H.-G.; Lee, C.-R.; Lee, I.-H.; Yu, Y.-T. Au@NiO core-shell nanoparticles as p-type gas sensor: Novel synthesis, characterization, and their gas sensing properties with sensing mechanism. Sensors and Actuators B 2018, 268, 223–231. [Google Scholar] [CrossRef]
- Bhati, V.S.; Kumar, M.; Banerjee, R. Gas sensing performance of 2D nanomaterials/metal oxide nanocomposites: a review. J. Mater. Chem. C 2021, 9, 8776–8808. [Google Scholar] [CrossRef]
- Qin, W.; Yuan, Z.; Gao, H.; Zhang, R.; Meng, F. Perovskite-structured LaCoO3 modified ZnO gas sensor and investigation on its gas sensing mechanism by first principle. Sensors Actuators B: Chem. 2021, 341, 130015. [Google Scholar] [CrossRef]
- Ji, H.; Zeng, W.; Li, Y. Gas sensing mechanisms of metal oxide semiconductors: a focus review. Nanoscale 2019, 11, 22664–22684. [Google Scholar] [CrossRef]
- Vraj Shah, Jaydip Bhaliya, Gautam M. Patel, Priyanka Joshi. Room-Temperature Chemiresistive Gas Sensing of SnO2 Nanowires: A Review. Journal of Inorganic and Organometallic Polymers and Materials 2022, 32, 741–772. [Google Scholar] [CrossRef]
- Zhu, L.; Zeng, W. Room-temperature gas sensing of ZnO-based gas sensor: A review. Sensors and Actuators A 2017, 267, 242–261. [Google Scholar] [CrossRef]
- Malik, R.; Tomer, V.K.; Mishra, Y.K.; Lin, L. Functional gas sensing nanomaterials: A panoramic view. Appl. Phys. Rev. 2020, 7, 021301. [Google Scholar] [CrossRef]
- G. J. Thangamani, S. K. khadheer pasha. Titanium dioxide (TiO2) nanoparticles reinforced polyvinyl formal (PVF) nanocomposites as chemiresistive gas sensor for sulphur dioxide (SO2) monitoring. Chemosphere 2021, 275, 129960. [Google Scholar] [CrossRef]
- Walker, J.M.; Akbar, S.A.; Morris, P.A. Synergistic effects in gas sensing semiconducting oxide nano-heterostructures: A review. Sensors Actuators B: Chem. 2019, 286, 624–640. [Google Scholar] [CrossRef]
- Kumar, E.R.; Kamzin, A.; Janani, K. Effect of annealing on particle size, microstructure and gas sensing properties of Mn substituted CoFe2O4 nanoparticles. J. Magn. Magn. Mater. 2016, 417, 122–129. [Google Scholar] [CrossRef]
- Zhou, T.; Cao, S.; Zhang, R.; Tu, J.; Fei, T.; Zhang, T. Effect of cation substitution on the gas sensing performances of ternary spinel MCo2O4 (M= Mn, Ni, and Zn). Journal of applied Materials Interfaces. 2019, 11, 28023–28032. [Google Scholar] [CrossRef] [PubMed]
- Patil, J.; Nadargi, D.; Mulla, I.S.; Suryavanshi, S. Spinel MgFe2O4 thick films: A colloidal approach for developing gas sensors. Mater. Lett. 2018, 213, 27–30. [Google Scholar] [CrossRef]
- Shozi, N.N.; Kortidis, I.; Mkwae, P.S.; Chonco, N.P.; Leshabane, N.; Jozela, M.; Kroon, R.E.; Swart, H.C.; Nkosi, S.S. Extremely sensitive and selective flammable liquefied hydrocarbon gas sensing and inter-dependence of fluctuating operating temperature and resistance: Perspective of rare-earth doped cobalt nanoferrites. J. Alloy. Compd. 2021, 859, 157846. [Google Scholar] [CrossRef]
- Koli, P.B.; Kapadnis, K.H.; Deshpande, U.G. Nanocrystalline-modified nickel ferrite films: an effective sensor for industrial and environmental gas pollutant detection. J. Nanostructure Chem. 2019, 9, 95–110. [Google Scholar] [CrossRef]
- Nemufulwi, M.I.; Swart, H.C.; Mhlongo, G.H. A comprehensive comparison study on magnetic behaviour, defects-related emission and Ni substitution to clarify the origin of enhanced acetone detection capabilities. Sens. Actuators B Chem. 2021, 339, 129860. [Google Scholar] [CrossRef]
- Manikandan, V.; Singh, M.; Yadav, B.C.; Mane, R.S.; Vigneselvand, S.; Mirzaei, A.; Chandrasekaran, J. Room temperature LPG sensing properties of tin substituted copper ferrite (Sn-CuFe2O4) thin film. Materials Chemistry and Physics 2020, 240, 122265. [Google Scholar] [CrossRef]
- Wu, S.; Li, X.; Xu, Y.; Wu, J.; Wang, Z.; Han, Y.; Zhang, X. Hierarchical spinel NixCo1-xFe2O4 microcubes derived from Fe-based MOF for high-sensitive acetone sensor. Ceramics International 2018, 44, 19390–19396. [Google Scholar] [CrossRef]
- Gonçalves, J.M.; Rocha, D.P.; Silva, M.N.T.; Martins, P.R.; Nossol, E.; Angnes, L.; Rout, C.S.; Munoz, R.A.A. Feasible strategies to promote the sensing performances of spinel MCo2O4 (M= Ni, Fe, Mn, Cu and Zn) based electrochemical sensors: a review. Journal of Materials Chemistry C. 2021, 9, 7852–7887. [Google Scholar] [CrossRef]
- Almessiere, M.A.; Slimani, Y.; Baykal, A. Synthesis and characterization of Co1-2xNixMnxFe2-yCeyO4 nanoparticles. Journal of Rare Earths 2020, 38, 188–194. [Google Scholar] [CrossRef]
- Shankar, P.; Rayappan, J.B.B. Gas sensing mechanism of metal oxide: The role of ambient atmosphere, type of semiconductor and gases- A review. Science Letters Journal 2015, 4, 126. [Google Scholar]
- Zhang, J.; Qin, Z.; Zeng, D.; Xie, C. Metal-oxide-based semiconductor gas sensor: screening, preparation and integration. Journal of Physical Chemistry 2017, 19, 6313–6329. [Google Scholar] [CrossRef] [PubMed]
- Walker, J.M.; Akbar, S.A.; Morris, P.A. Synergistic effects in gas sensing semiconducting oxide nano-heterostructures: A review. Sensors Actuators B: Chem. 2019, 286, 624–640. [Google Scholar] [CrossRef]
- Pi, W.; Chen, X.; Humayun, M.; Yuan, Y.; Dong, W.; Zhang, G.; Chen, B.; Fu, Q.; Lu, Z.; Li, H.; Tang, Z.; Luo, W. Highly Sensitive Chemiresistive H2S Detection at Subzero Temperature over the Sb-Doped SnO2@g-C3N4 Heterojunctions under UV Illumination. Applied Materials and Interfaces 2023, 11, 14979–14989. [Google Scholar] [CrossRef] [PubMed]
- P. Munindra, M. Sai Bhargava Reddy, B. Geeta Rani, N. Jayarambabu, Saraswathi Kailasa, P. Srinivasa Subba Rao, K. Venkateswara Rao. A high-performance low-temperature LPG detection by MgFe2O4/BiVO4 chemiresistive sensor. Journal of Materials Science: Materials in Electronics 2020, 31, 2370–2377. [Google Scholar]
- Almessiere, M.A.; Slimani, Y.; Ali, S.; Baykal, A.; Ercan, I.; Sozeri, H. Nd3+ Ion-Substituted Co1−2xNixMnxFe2−yNdyO4 Nanoparticles: Structural, Morphological, and Magnetic Investigations. Journal of Inorganic and Organometallic Polymers and Materials 2019, 29, 783–791. [Google Scholar] [CrossRef]
- Almessiere, M.A.; Slimani, Y.; Güner, S.; Nawaz, M.; Baykal, A.; Aldakheel, F.; Akhtar, S.; Ercan, I.; Beleli, I.; Ozҫelik, B. magnetic and structural characterization of Nb3+ -substututed CoFe2O4 nanoparticles. Ceramics International 2019, 45, 8222–8232. [Google Scholar] [CrossRef]
- Rani, B.J.; Ravina, M.; Saravanakumar, B.; Ravi, G.; Ganesh, V.; Ravichandran, S.; Yuvakkumar, R. Ferrimagnetism in cobalt ferrite (CoFe 2 O 4 ) nanoparticles. Nano-Structures Nano-Objects 2018, 14, 84–91. [Google Scholar] [CrossRef]
- Motaung, D.E.; Tshabalala, Z.P.; Makgwane, P.R.; Mahmoud, F.A.; Oosthuizen, D.N.; Cummings, F.R.; Leshabane, N.; Hintsho-Mbita, N.; Li, X.; Ray, S.S.; et al. Multi-functioning of CeO2-SnO2 heterostructure as room temperature ferromagnetism and chemiresistive sensors. J. Alloy. Compd. 2021, 906, 164317. [Google Scholar] [CrossRef]
- Kirankumar, V.S.; Mayank, N.; Sumathi, S. Photocatalytic performance of cerium doped copper aluminate nanoparticles under visible light irradiation. Journal of the Taiwan Institute of Chemical Engineers 2019, 95, 602–615. [Google Scholar] [CrossRef]
- Nurhasanah, I.; Safitri, W.; Arifin, Z.; Subagio, A.; Windarti, T. Antioxidant activity and dose enhancement factor of CeO2 nanoparticles synthesized by precipitation method. IOP Conf. Series: Mater. Sci. Eng. 2018, 432, 012031. [Google Scholar] [CrossRef]
- Mkwae, P.S.; Ogundipe, S.A.; Jozela, M.; Revaprasadu, N.; Nkosi, S.S. The heat rate kinetics on the liquefied hydrocarbon gases sensing and food quality control detecting strategy. Mater. Chem. Phys. 2022, 277. [Google Scholar] [CrossRef]
- Chandamma, N.; Santhosh Kumar, M.V.; Shankarmurthy, G.J.; Melagiriyappa, E.; Nagaraja, K.K. Effect of gamma irradiation on some electrical and dielectric properties of Ce3+ substituted Ni–Zn nano ferrites. Chin. J. Phys. 2017, 55, 1729–1738. [Google Scholar] [CrossRef]
- Wang, J.; Sun, A.; Jiang, Y.; Huang, X.; Shao, L.; Zhang, Y. Structural and magnetic properties of Ce3+doped Mg-Co ferrite prepared by sol–gel method. J. Mater. Sci. Mater. Electron. 2022, 33, 11881–11895. [Google Scholar] [CrossRef]
- Li, L.-Z.; Zhong, X.-X.; Wang, R.; Tu, X.Q.; He, L.; Wang, F.-H. Effects of Ce substitution on structural and electromagnetic properties of NiZn nano ferrite. Journal of Magnetism and Magnetic Materials 2019, 475, 1–4. [Google Scholar] [CrossRef]
- Mustapha, S.; Tijani, J.O.; Ndamitso, M.M.; Abbdulkareem, A.S.; Shuahib, D.T.; Amigun, A.T.; Abubakar, H.L. Facile synthesis and characterisation of TiO2 nanoparticles: X-ray peak profile analysis using Williamson-Hall and Debye-Scherrer methods. International Nano Letters 2021, 11, 241–261. [Google Scholar] [CrossRef]
- Khalfaoui, M.; Knani, S.; Hachicha, M.A.; Lamine, A.B. New theoretical expreesions for the five adsorption isotherms classifield by BET based on statistical physics treatment. Journal of colloid and interface science 2003, 263, 350–356. [Google Scholar] [CrossRef]
- Hailstone, R.K.; DiFrancesco, A.G.; Leong, J.G.; Allston, T.D.; Reed, K.J. A Study of Lattice Expansion in CeO2 Nanoparticles by Transmission Electron Microscopy. J. Phys. Chem. C 2009, 113, 15155–15159. [Google Scholar] [CrossRef]
- Tiberio Magno de Lima Alves, Bruno Ferreira Amorim, Marco Antonio Morales Torres, Claudionor Gomes Bezerra, Suzana Nobrega de Medeiros, Pedro Lana Gastelois, Luis Eugenio Fernandez Outon, Waldemar Augusto de Almeida Macedo. Wasp-waisted behavior in magnetic hysteresis curves of CoFe2O4 Nano powder at a low temperature: experimental evidence and theoretical approach. Journal of Royal Society Chemistry Advance 2017, 7, 22187. [Google Scholar]
- Gumbi, S.W.; Mkwae, P.S.; Kortidis, I.; Kroon, R.E.; Swart, H.C.; Moyo, T.; Nkosi, S.S. Electronic and simple oscillatory conduction in ferrite gas sensing: Gas-sensing mechanism, Long-term gas monitoring, Heat transfer, and other anomalies. Journal of Applied Material Interfaces 2020, 12, 43231–43249. [Google Scholar] [CrossRef]
- Mirzaei, A.; Bonyani, M.; Torkian, S.; Feizpour, M.; Bonavita, A.; Leonardi, S.G.; Neri, G. A comparative study on the electrical and gas sensing properties of thick films prepared with synthesized nano-sized and commercial micro-sized Fe2O3 powders. Process. Appl. Ceram. 2017, 11, 265–274. [Google Scholar] [CrossRef]
- Rai, P.; Majhi, S.M.; Yu, Y.-T.; Lee, J.-H. Nobel metal@metal oxide semiconductor core@shell nano-architectures as a new platform for gas sensing applications. RSC Adv. 2015, 5, 76229. [Google Scholar] [CrossRef]
- Nikolic, M.V.; Milovanovic, V.; Vasiljevic, Z.Z.; Stamenkovic, Z. Semiconductor Gas Sensors: Materials, Technology, Design, and Application. Sensors 2020, 20, 6694. [Google Scholar] [CrossRef] [PubMed]
- Das, S.; Mojumder, S.; Saha, D.; Pa, M. Influence of major parameters on the sensing mechanism of semiconductor metal oxide based chemiresitive gas sensors: A review focused on personalized healthcare. Sensors & Actuators: B. Chemical 2022, 352, 131066. [Google Scholar]
- Staerz, A.; Weimar, U.; Barsan, N. Current state of knowledge on the metal oxide based gas sensing mechanism. Sensors Actuators B: Chem. 2022, 358, 131531. [Google Scholar] [CrossRef]
- Choudhary, S.; Annapoorni, S.; Malik, R. Evolution and growth mechanism of hexagonal ZnO nanorods and their LPG sensing response at low operating temperature. Sensors Actuators A: Phys. 2019, 293, 207–214. [Google Scholar] [CrossRef]
- Nakate, U.T.; Patil, P.; Ghule, B.; Nakate, Y.T.; Ekar, S.; Ambare, R.C.; Mane, R. Room temperature LPG sensing properties using spray pyrolysis deposited nano-crystalline CdO thin films. Surfaces Interfaces 2019, 17, 100339. [Google Scholar] [CrossRef]
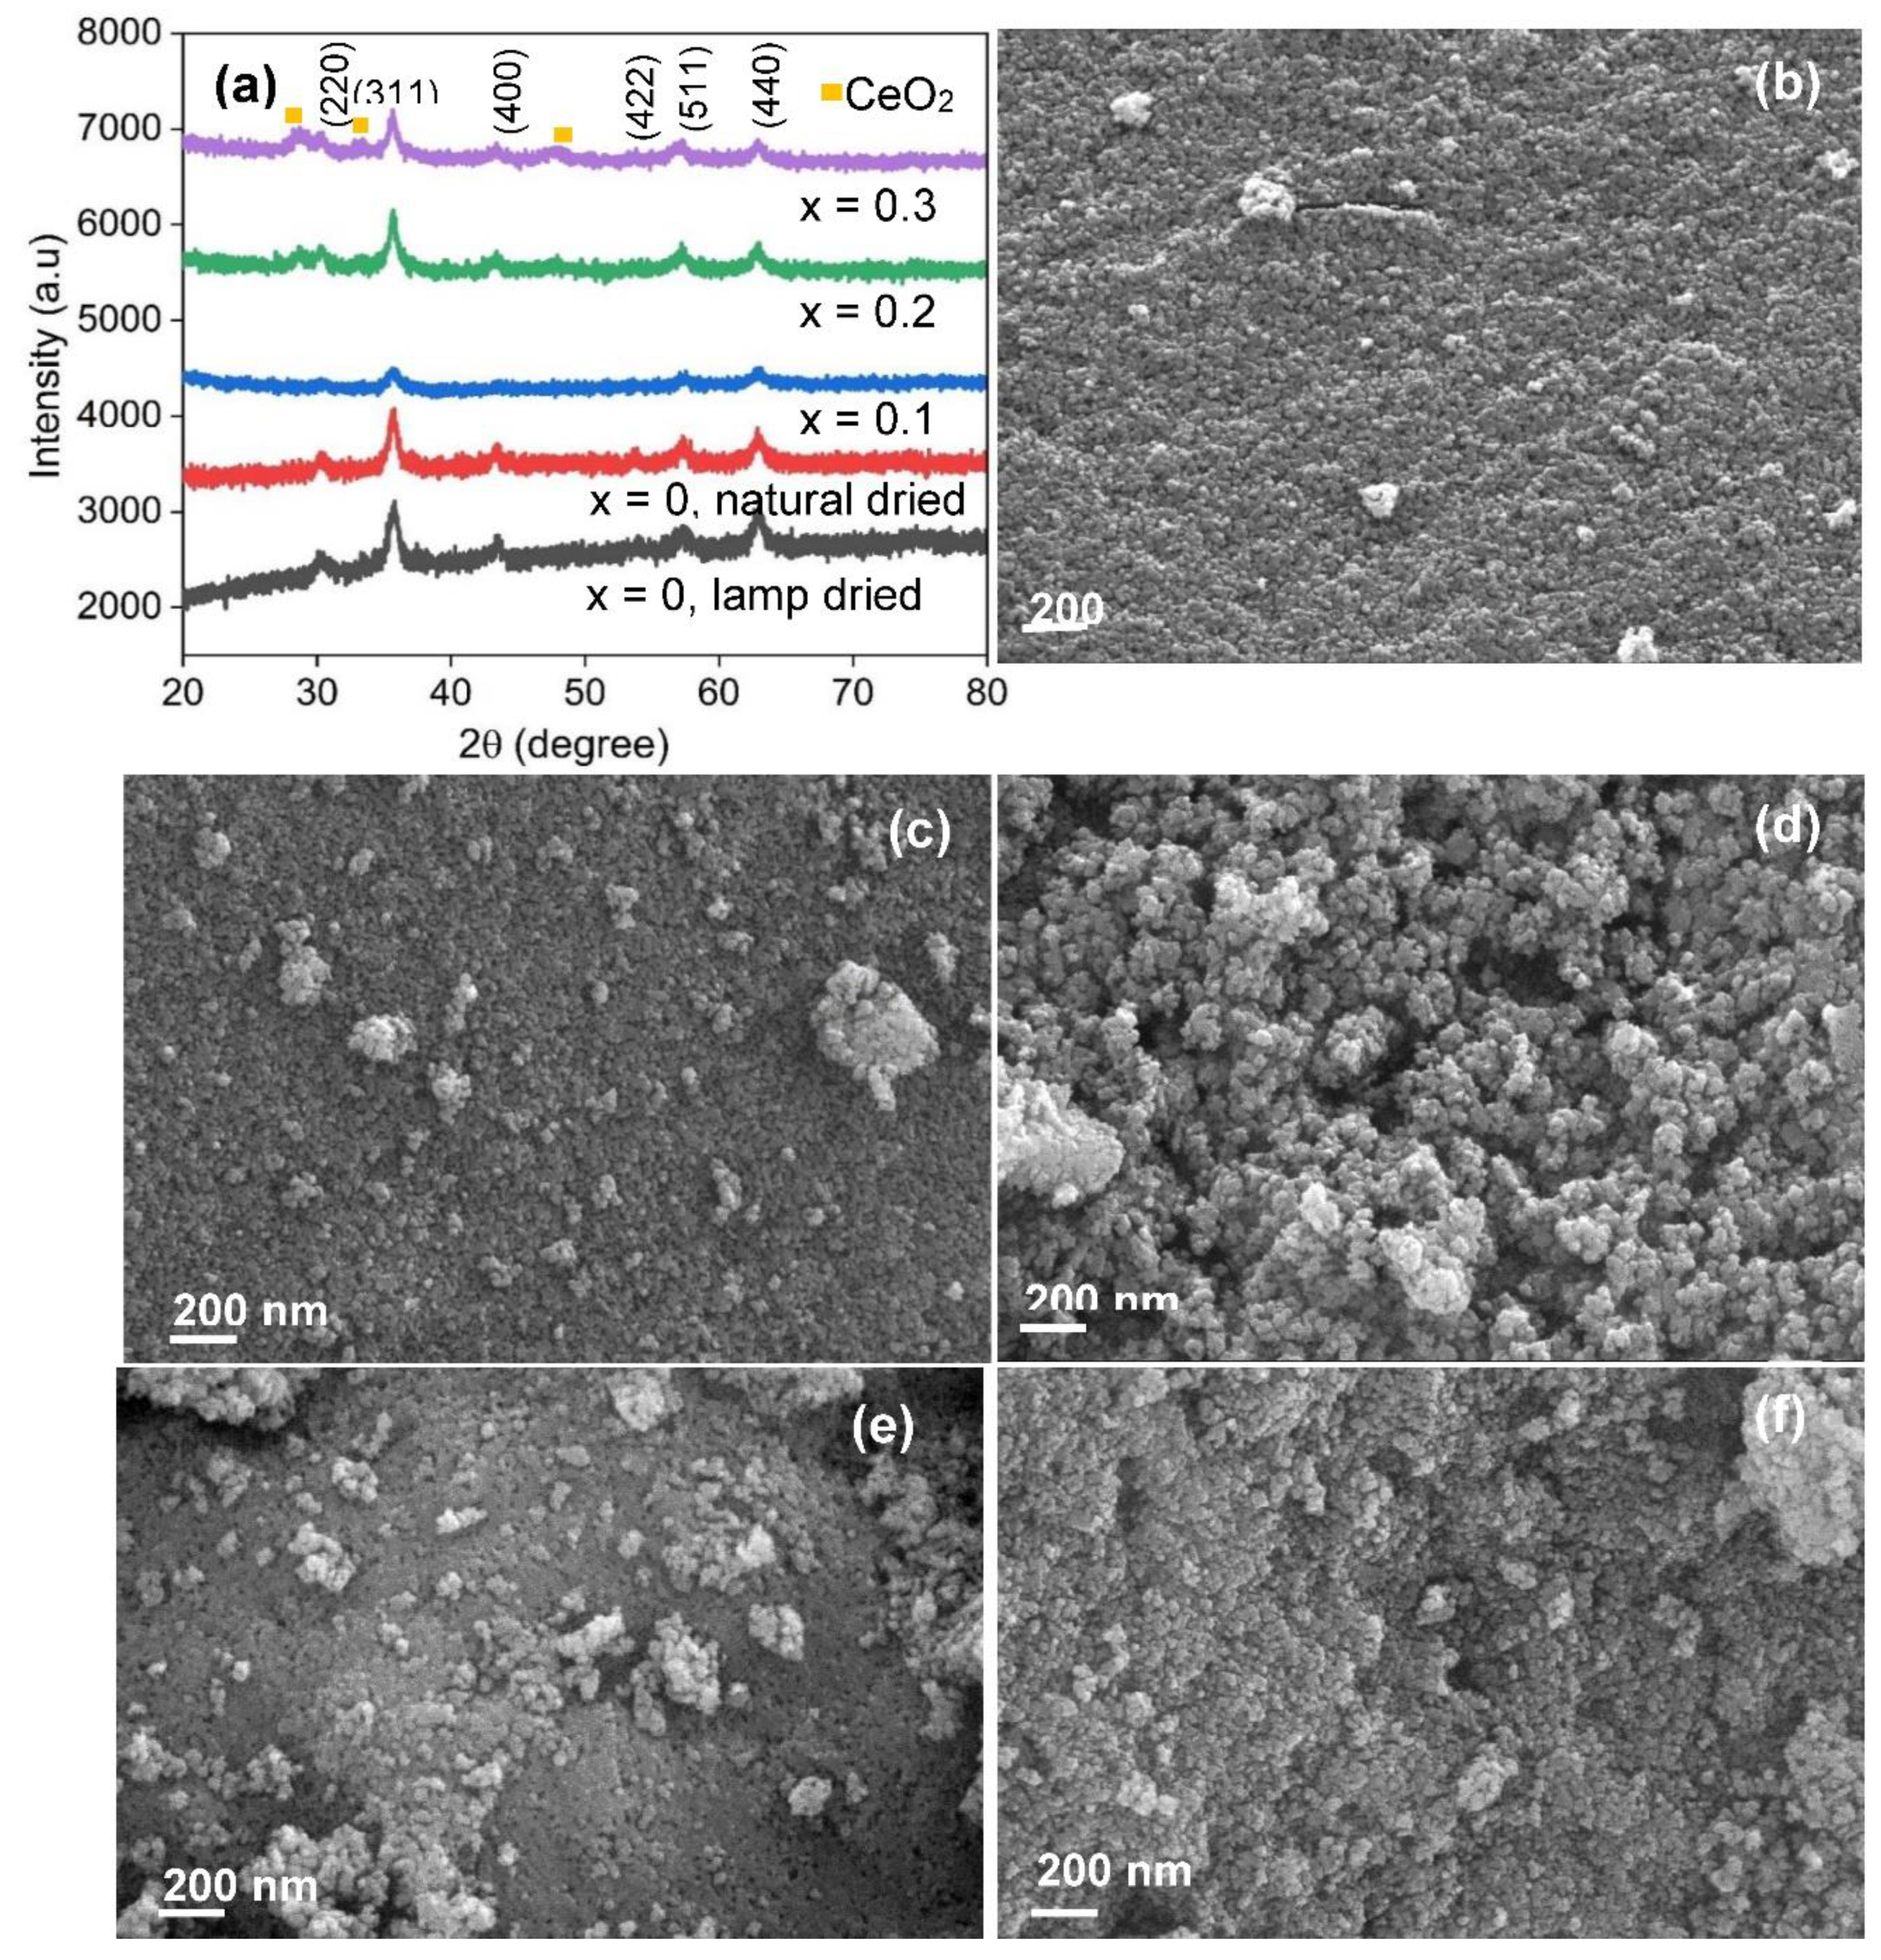
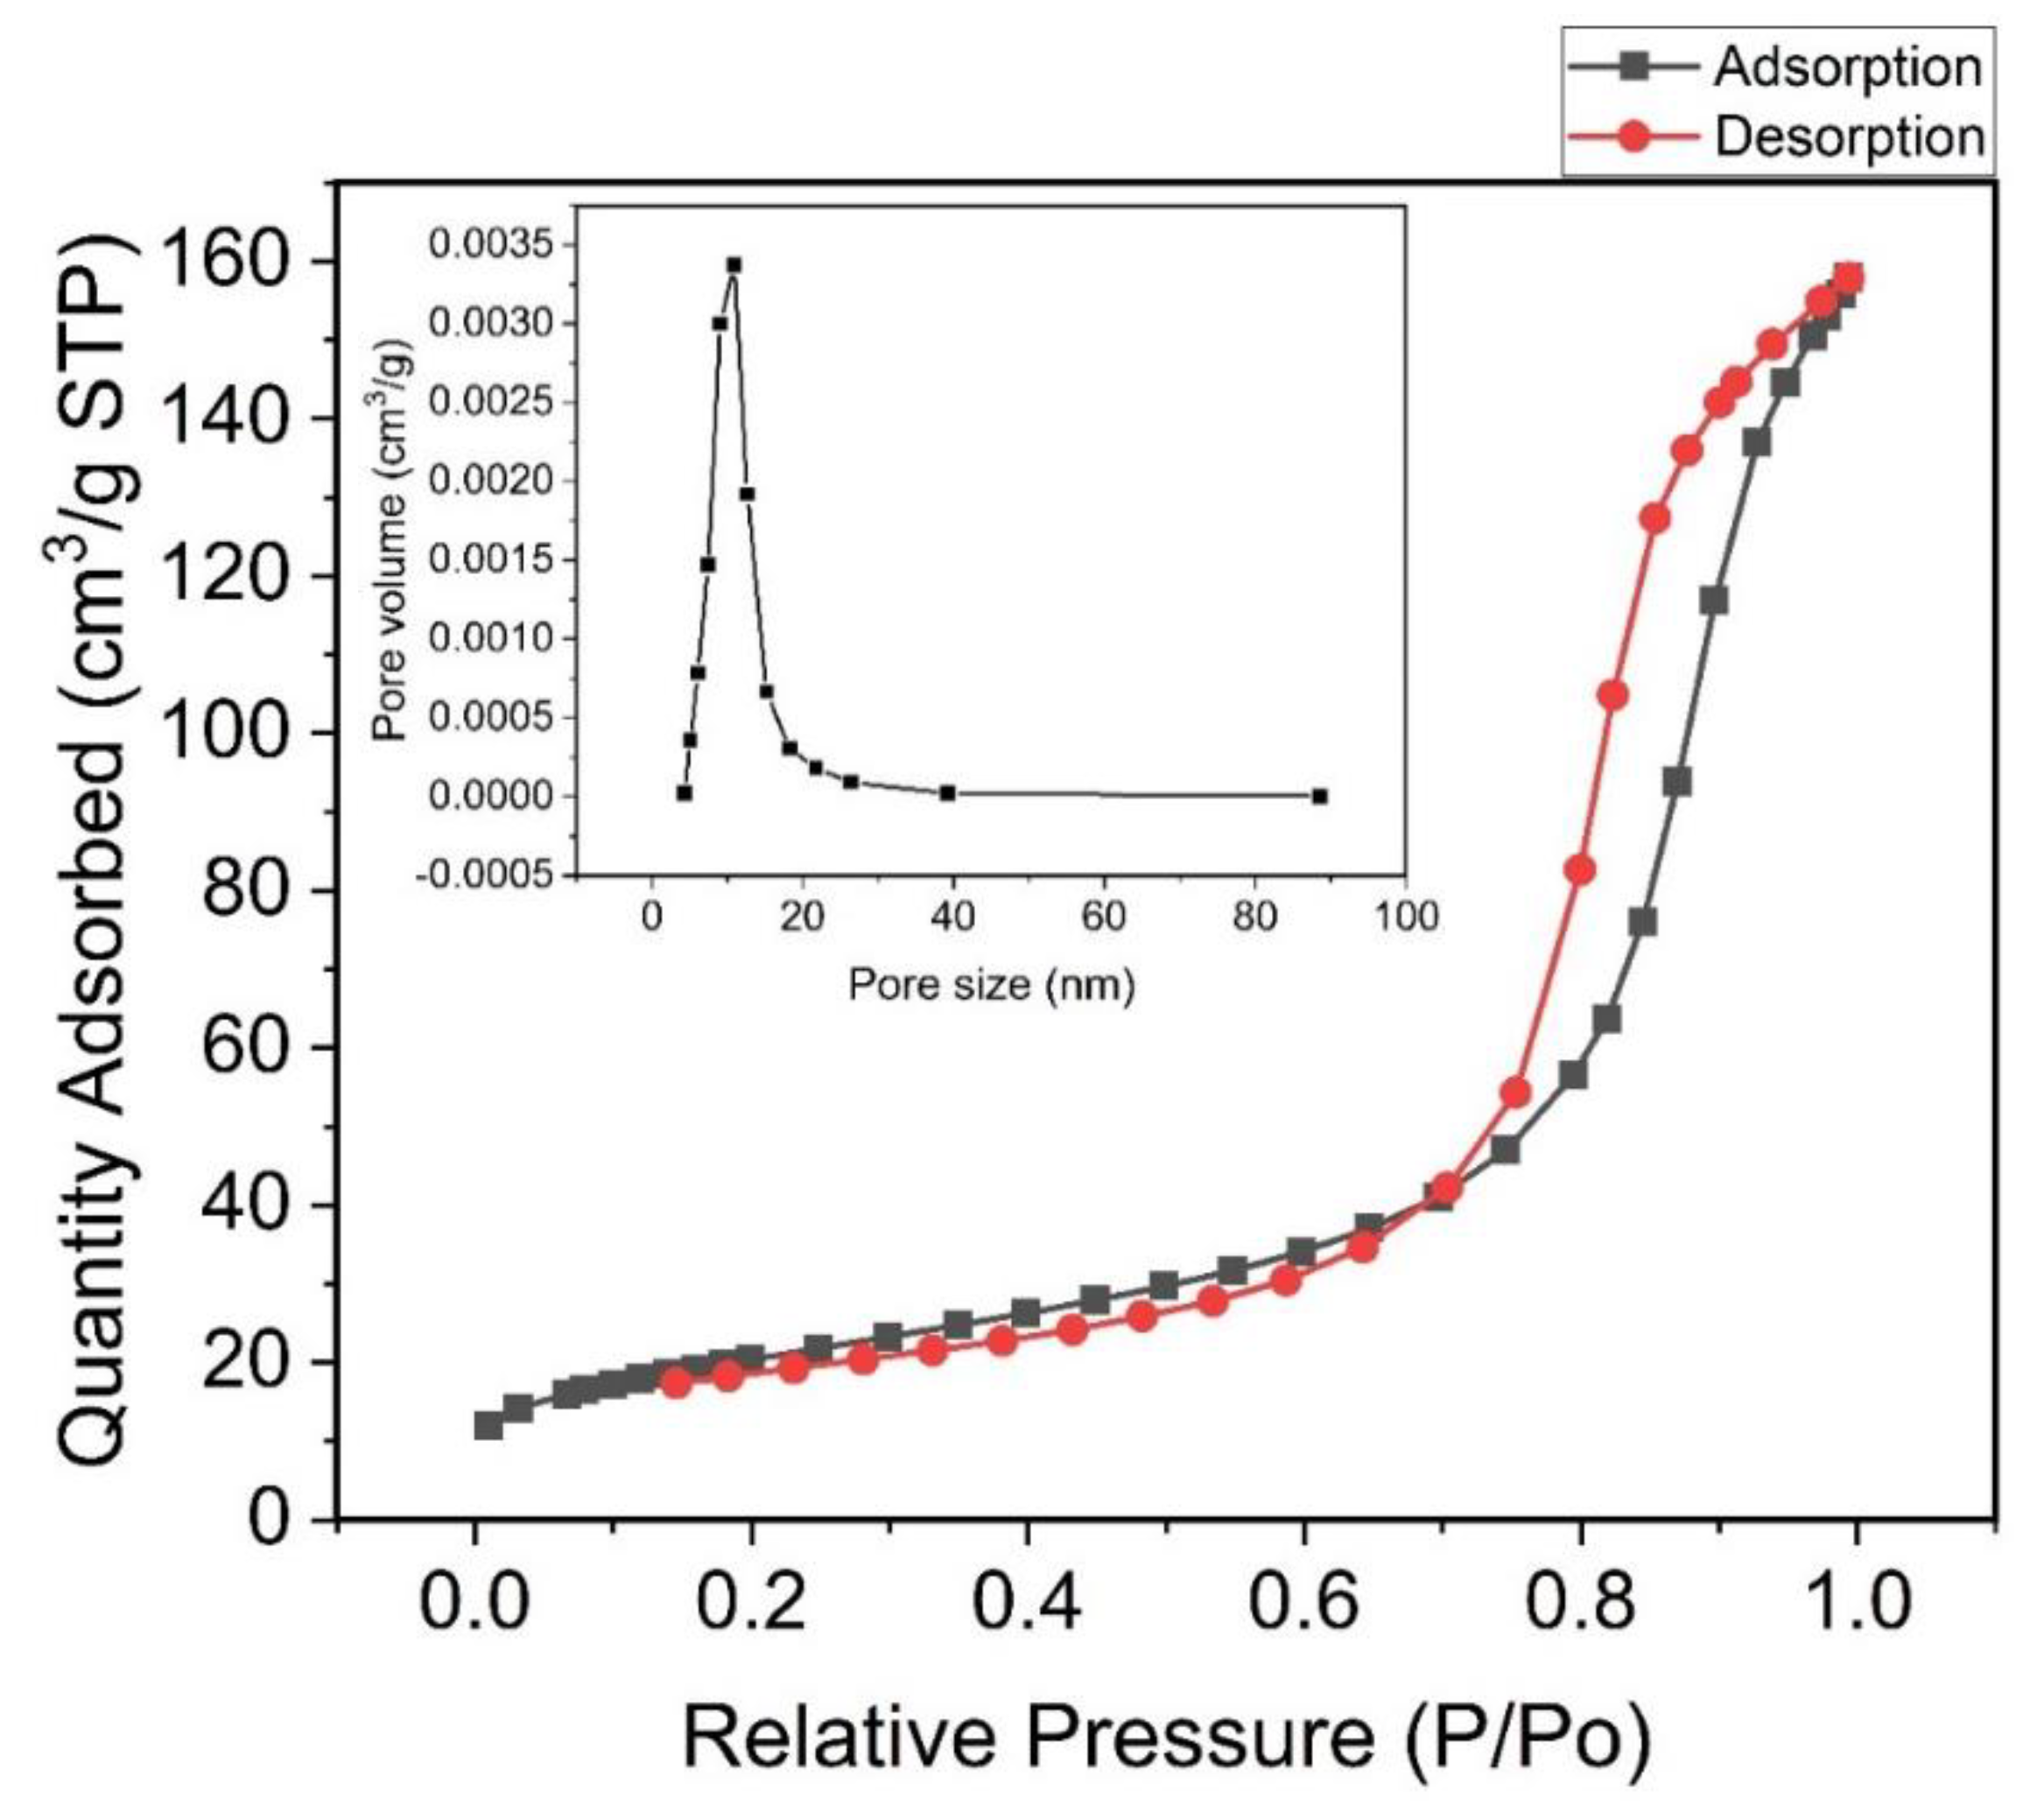
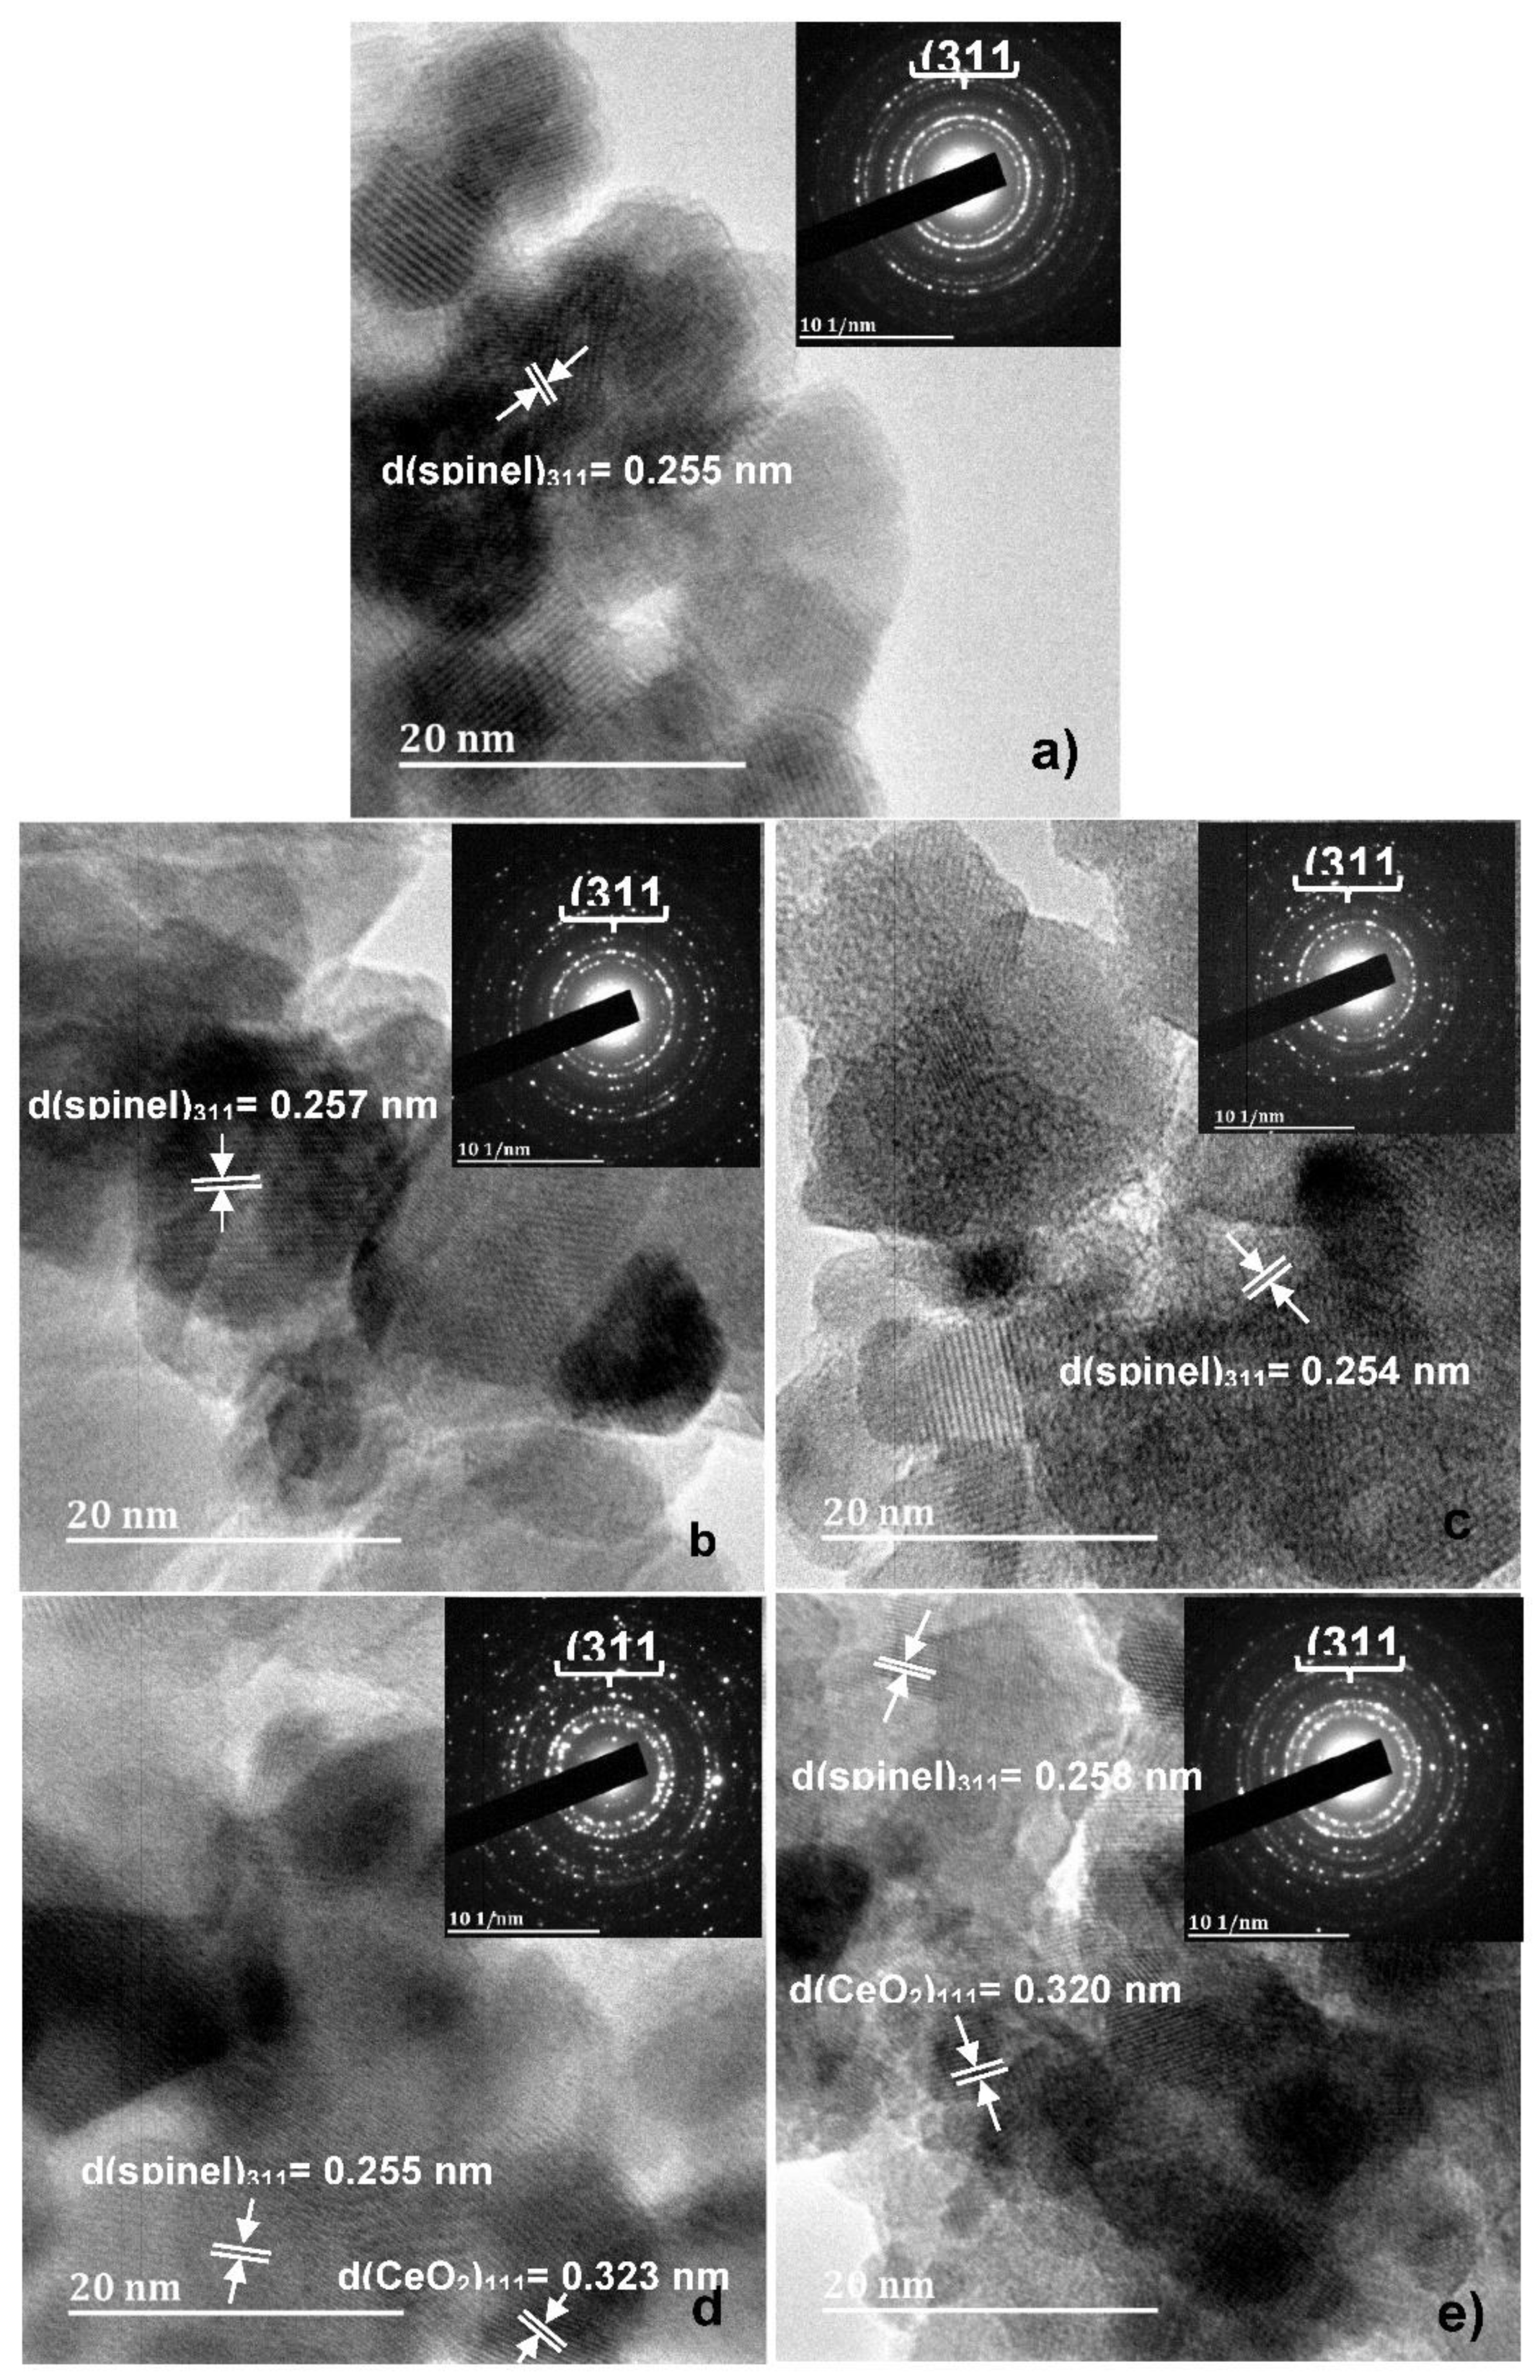
| Co1-2xNixMnxFe2-yCeyO4 | D311 (nm) | Pore Size (nm) | Specific surface Area (m2/g) |
|---|---|---|---|
| x = y = 0, lamp-dried | 9.99 | 11.38 | 66.99 |
| x = y = 0, natural-dried | 11.30 | 11.96 | 62.48 |
| x = y = 0.1 | 9.28 | 12.34 | 72.82 |
| x = y = 0.2 | 12.05 | 10.52 | 51.93 |
| x = y = 0.3 | 12.30 | 13.29 | 60.76 |
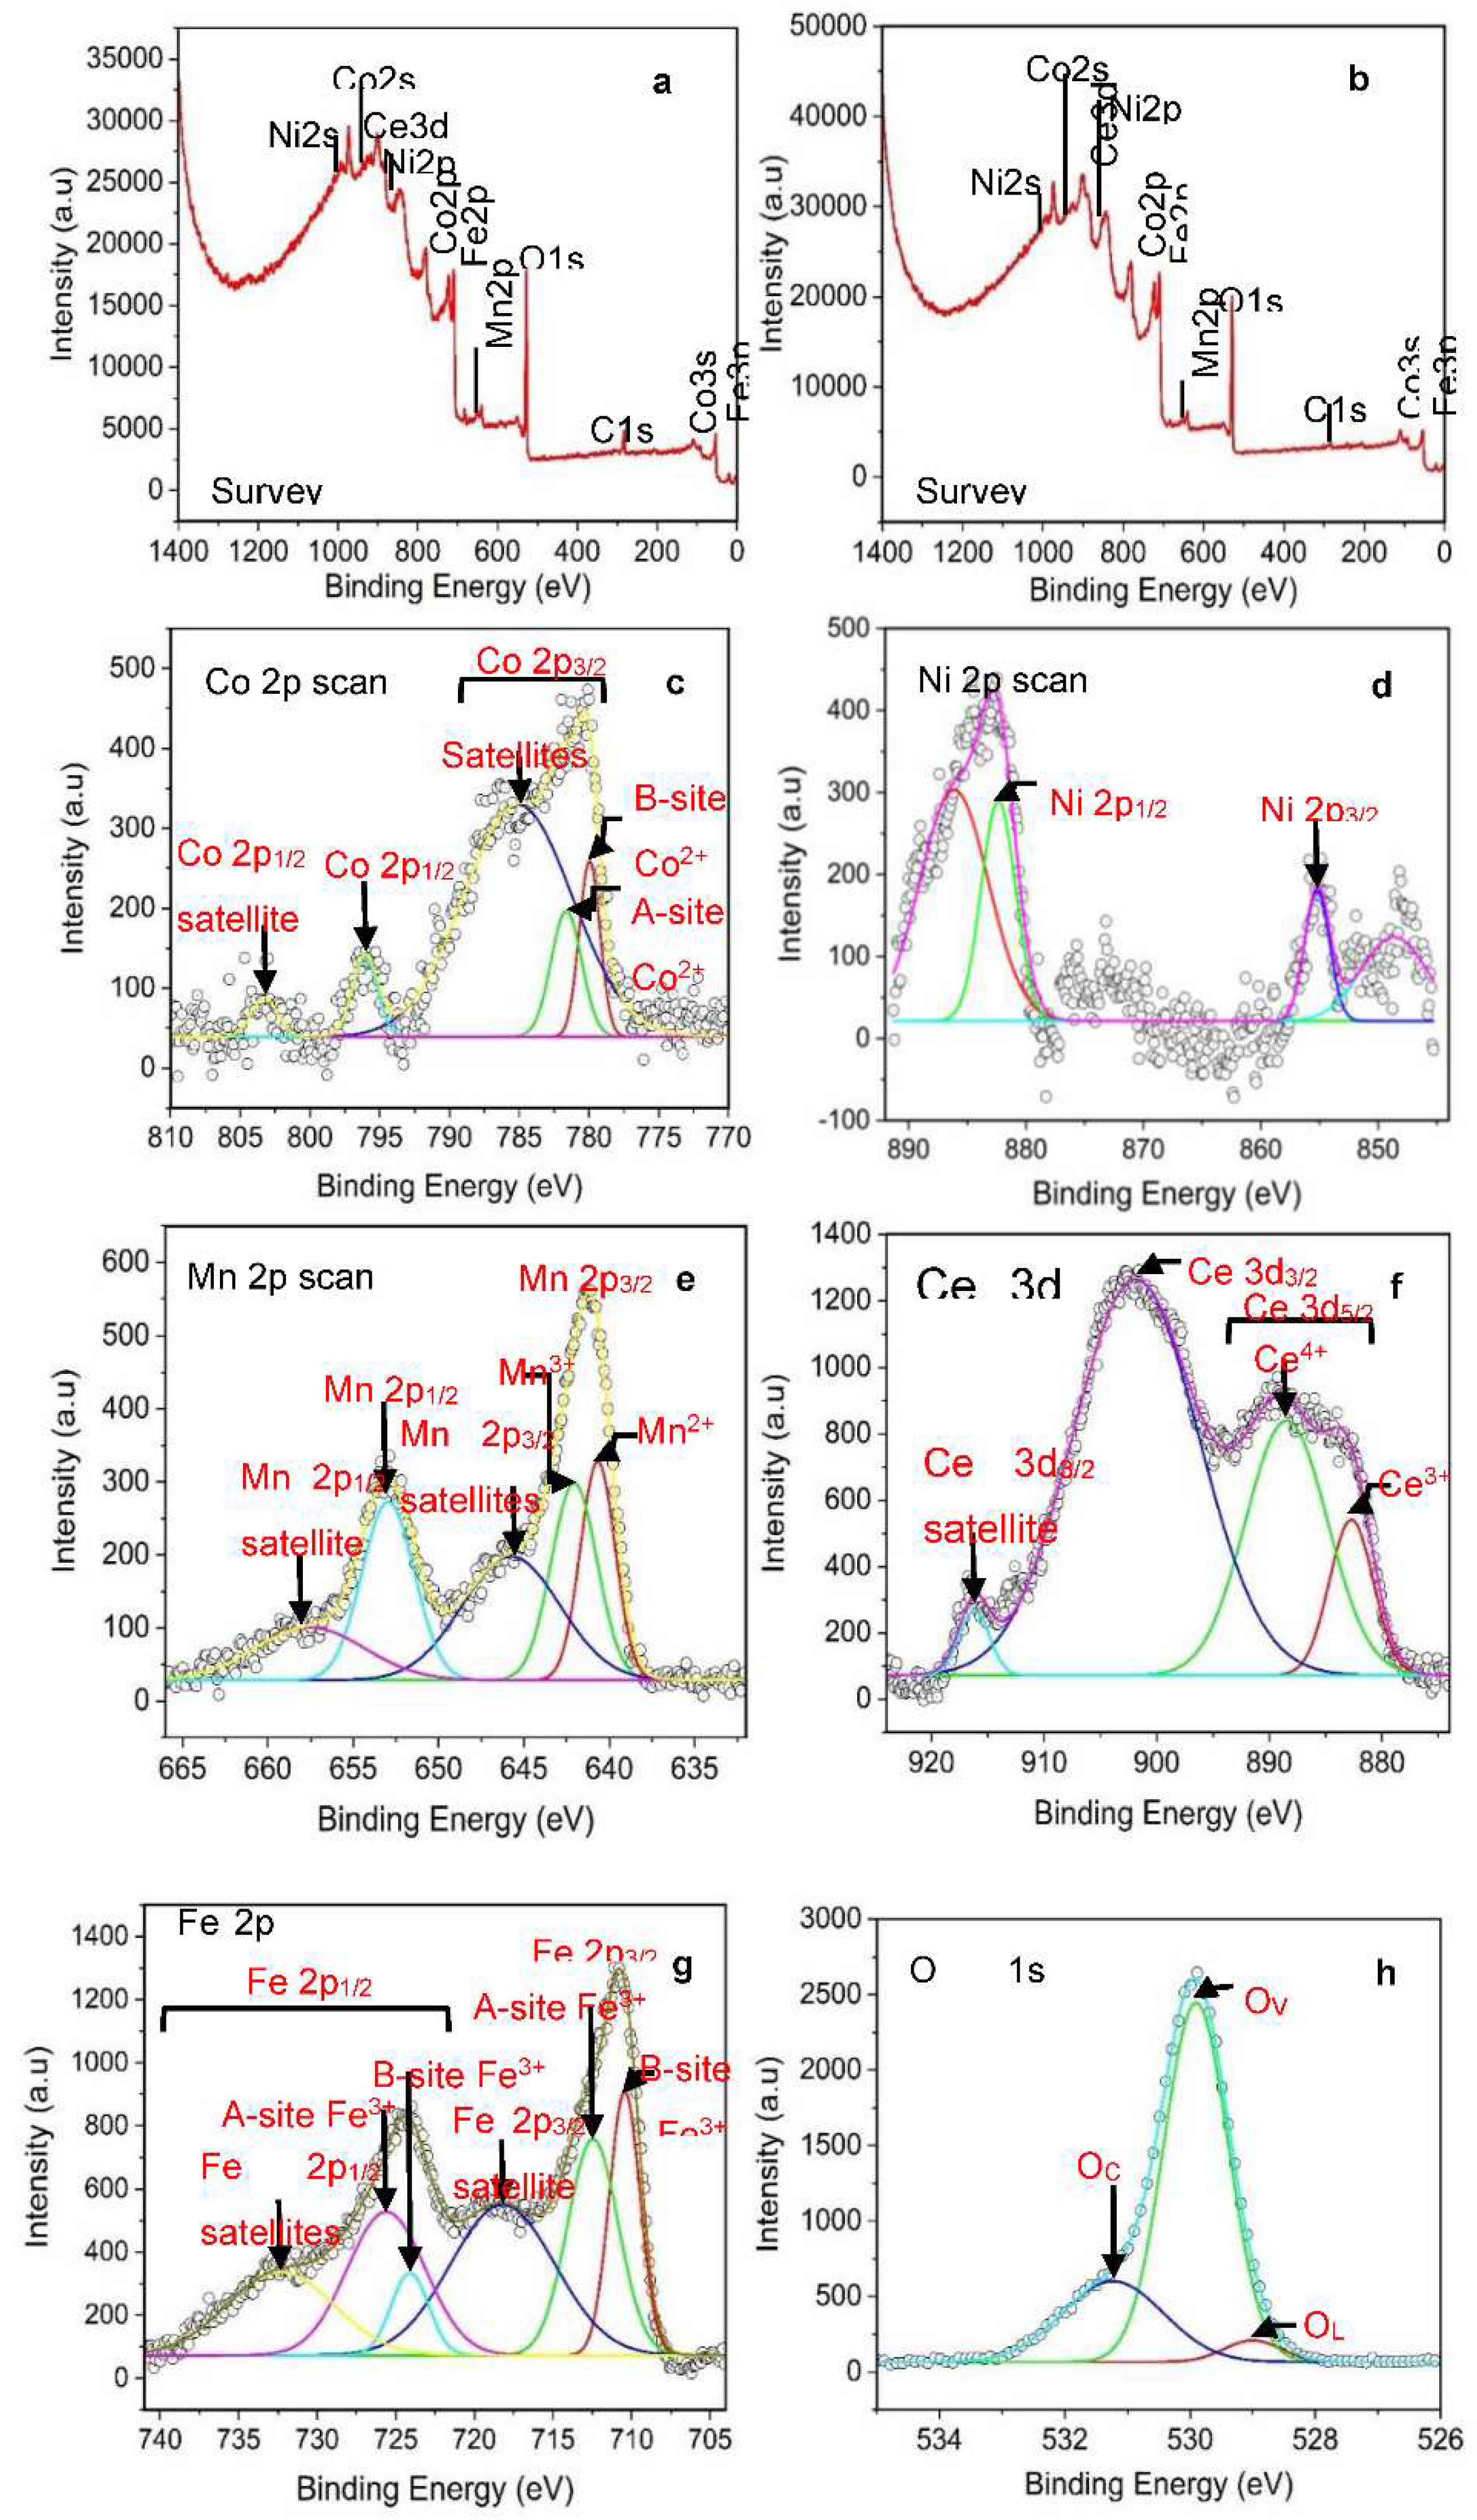
| Co1-2xNixMnxFe2-yCeyO4 | OL: | (OV+OC): | (OL+OV): |
|---|---|---|---|
| x = y = 0, lamp-dried | 0.55 | 0.45 | - |
| x = y = 0, natural-dried | 0.69 | OV = 0.31 | - |
| x = y = 0.1 | 0.04 | 0.96 | - |
| x = y = 0.2 | 0.84 | OV = 0.16 | - |
| x = y = 0.3 | 0.61 | OV = 0.39 | - |
| Carrier Gas | Resistance (kΩ) | Response |
|---|---|---|
| Dry air | 641.03 | 5.87 |
| Nitrogen | 28.57 | 5.28 |
| Helium | 769.23 | 116.43 |
| Argon | - | - |
| Material | Carrier gas | Operating temp. (°C) | Concentration (ppm) | Response | Ref. |
|---|---|---|---|---|---|
| ZnO | Dry air | 200 | 100 | 49% | [45] |
| CdO | Dry air | 50 | 10 000 | 4.6% | [46] |
| MgFe2O4 | Dry air | 225 | 10 000 | 395.47 | [31] |
| MgFe2O4/BiVO4 | Dry air | 50 | 500 | 58% | [24] |
| Sn-CuFe2O4 | Dry air | 25 | 2 000 | 78% | [16] |
| Co0.8Ni0.1Mn0.1Fe1.9Ce0.1O4 | Dry air | 225 | 3 000 | 3.35 | This work |
| Co0.8Ni0.1Mn0.1Fe1.9Ce0.1O4 | Helium gas | 225 | 6 000 | 116.43 | This work |
Disclaimer/Publisher’s Note: The statements, opinions and data contained in all publications are solely those of the individual author(s) and contributor(s) and not of MDPI and/or the editor(s). MDPI and/or the editor(s) disclaim responsibility for any injury to people or property resulting from any ideas, methods, instructions or products referred to in the content. |
© 2023 by the authors. Licensee MDPI, Basel, Switzerland. This article is an open access article distributed under the terms and conditions of the Creative Commons Attribution (CC BY) license (http://creativecommons.org/licenses/by/4.0/).


