1. Introduction
Mergers and Acquisitions (M&A) involve the transfer or consolidation of ownership of companies or their operating units with other firms, allowing businesses to expand, reduce in size, or alter their competitive position or nature of operations[1]. In mergers, each company exchanges purchases of the other company’s shares. In an acquisition, the acquirer usually offers to purchase a company’s stock at a premium above the current price, which drives up the stock price. Merger arbitrage is an investment strategy that aims to generate profits from completed mergers and/or takeovers by capitalizing on differences between stock prices before and after M&A deals.[2] Traditionally successful merger arbitrage on a larger scale has been limited to those with significant financial resources. However, recent developments in Natural Language Processing (NLP) Algorithms have enabled more accurate predictions of short-term stock prices, putting valuable information into the hands of ordinary traders. By utilizing transformers and new Machine Learning (ML) advances, we can predict the completion of the deal and the company’s short-term stock prices, ultimately granting valuable insight about the course of an M&A deal to all traders. M&A deals are integral to an economy’s fluctuation and function, which is why it attracts great research attention. Globally, the value of M&A deals in 2022 was $3.15 trillion.[3] However, forecasting these events can prove difficult, as shown by previous research in this field.
Economists’ previous findings mostly conclude that the stock market can be framed by a random walk pattern (Efficient Market Hypothesis) that is influenced by unpredictable external factors[4]. Sentiment analysis on Twitter data combined with previous days’ Dow Jones Industrial Average has been used to predict stock market movements[5]. Although finding moderately high correlations between the “happy” emotion and increasing stocks, their results were general and unrelated to a specific M&A stance. On the other hand, stance detection, a lesser-used NLP technique, has also been used on political and social events such as the 2016 US presidential election[6]. Given that stance detection can be used to predict the result of an election, this highlights the technique’s potential predictive power in other fields. There have been plenty of works on short-term stock prediction, such as Shen and Shafiq[7], which explored various different deep learning models, but these are unspecific to merger arbitrage. The recently published research paper utilized company stock signals to predict online stance detection with high degrees of accuracy[8]. This paper aims to do the opposite: predict stock with stance detection.
In this paper, we use a multilingual stance detection model and the next-day stock prices of the target companies through a Recurrent Neural Network (RNN) meta-model. This project uses the Will They-Won’t They (WT-WT) dataset and a collection of tweets about five M&A deals. While existing papers have performed sentiment analysis on tweets to predict stock price fluctuations, our SD model leverages Transformers and specifies the target on tweets relevant to recent M&A deals from the Twitter python API called Tweepy. Further, the BERT model is used to incorporate tweets in other languages. Afterward, each stance is given a weighted value and added to the meta-model as a feature column. Finally, the stance and financial variable data will be preprocessed and run through a specific RNN model called a Long Short-Term Memory (LSTM) network.
The rest of the paper is structured as follows. The second section briefly explains the advantages of Transformers over other outdated NLP techniques. The third section introduces the datasets we used in this research, the Tweepy API and Yahoo Finance API, and discusses how we processed the datasets for our use. The fourth section discusses the process of building the different types of stance detection models and includes each one’s performance. The fifth section demonstrates the methods we use to combine stance detection and stock price prediction. The process of building the meta-model is explained in detail, including the performance comparisons of different meta-models. The last section concludes the paper with the results of the meta-model, that is, the next day and/or future seven days stock price predictions of the target companies. An analysis of the results and advice for future studies is included in this section as well.
2. Data Annotation
2.1. WT-WT
Our Stance Detection model is trained using the Will- They-Won’t-They (WT-WT) dataset, which contains 51,284 annotated tweets on five completed M&A deals listed in
Table 1:
Specifically, we acquired 32,000 tweets from WT-WT, and each tweet is previously labeled ‘support’, ‘refute’, ‘comment’, or ‘unrelated’, with an approximate ratio of 1:1:3:3. Tweets labeled “support” express an opinion that the M&A deal will go through, such as the tweet “Cigna to spend about 52 billion for express scripts”, while tweets labeled “refute” express the opposite, such as “Cigna investor Carl Icahn plans to vote against express scripts deal”. Tweets labeled “comment” relate to the M&A deal but do not express an opinion on its completion, and “unrelated” tweets are unrelated to the deal. We dropped all the duplicated tweets and related features and split the rest into two datasets, one containing only texts and stances, the other containing relevant user-profile features such as retweet count, tweet favorite count, and user follower count. We aimed to perform Stance Detection by creating NLP models and a non-NLP ensemble model separately and then ensemble the two models by weighing each result.
2.2. Yahoo Finance
We obtained daily stock prices with financial metrics including ‘volume’, ‘open’, ‘high’, ‘low’, and ‘close’ of the target companies of the five M&A deals in WT-WT from the Yahoo Finance API. More features such as the original financial metrics and aggregated daily stance along with volatility from a GARCH model were later added to the dataset. The Equation for weighing the individual stance of a tweet is included in the Approaches section.
3. M&A Completion Stance Detection
3.1. Stance Detection Approaches
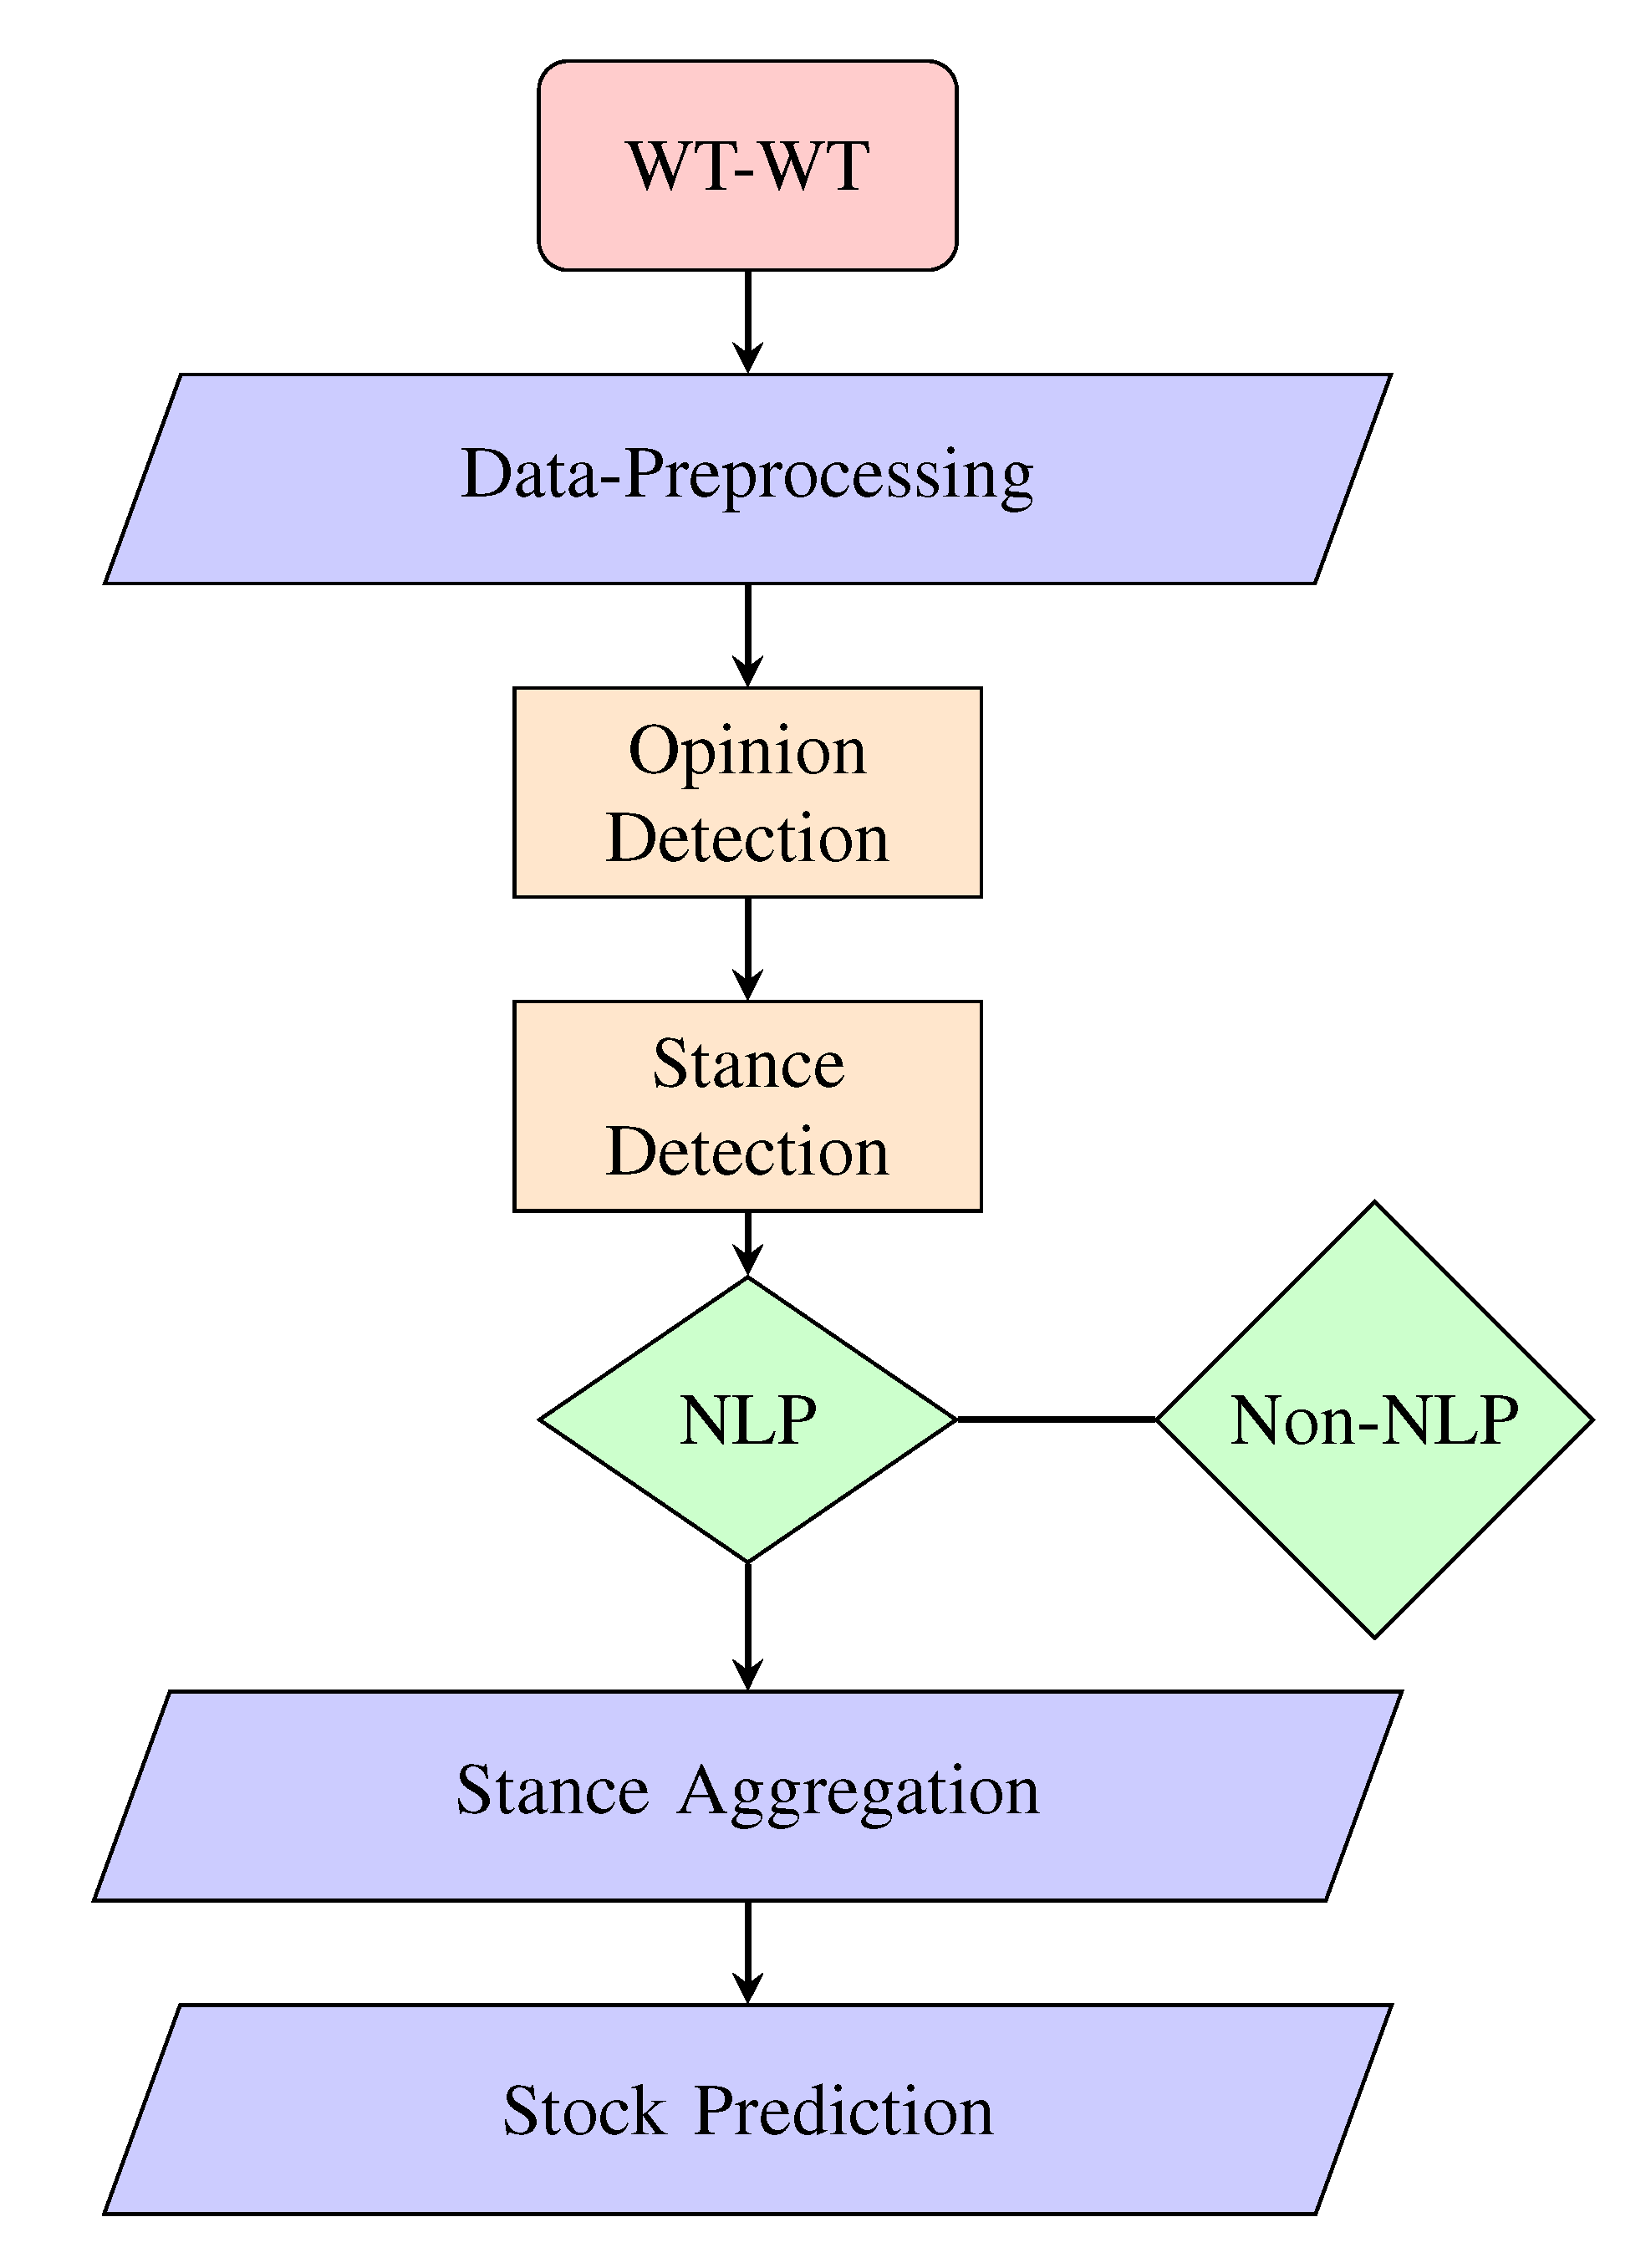
Based on the previously annotated stances, we first split the WT-WT dataset into support/refute and comment/unrelated sets in order to achieve more analyzable results. We trained a transformer-based opinion-detection model to predict whether a tweet has an opinion (support/refute) or is neutral (comment/unrelated). We then trained an NLP on just the opinionated tweets. As there are more tweets labeled comment/unrelated, we trained on balanced data (equal amount of support/refute tweets and comment/unrelated tweets). Using the pre-trained Finbert sentiment detection model, we achieved 0.75 accuracy on the balanced data and 0.701 accuracy on the entire dataset.
On the Support/Refute dataset, we then trained an NLP and non-NLP model to predict stance.
For the NLP model using Transformers, we first dropped URLs and converted everything to lowercase. We then removed whitespace, duplicated words, and special characters. Next we filtered out non-English tweets and removed tweets from before the deal was announced or after the deal was completed. The text sequence was then tokenized for the model. We then used a Test-Train-Split where 70% was used for training data, 15% for validation, and 15% for test data. Then we separated the English tweets from the rest and trained them with the Roberta-base model. We also trained all the tweets on the bert-base-multilingual-cased model to compare the results with the English-only model. We also trained an LSTM and SVM text classification model using the English-only dataset as both a baseline and a part of our ensemble. The results are listed in
Table 3.
For the non-NLP model, we implemented four basic supervised classification models on the support/refute English dataset: Logistic Regression, Random Forest, Support-Vector Machine, and XG-Boost. Furthermore, we ensembled the four models using Voting Classifier, and we tried applying Neural Networks as well. The table of results are also is included in
Table 3.
We did some hyperparameter tuning on both the NLP and non-NLP models. For the NLP models, we used the built-in Hyperparameter Tuning algorithms from the Huggingface and Ray-tune libraries, eventually finding the following hyperparameters to be the best:
Table 2.
Hyperparameters
| Epochs |
20 |
| Batch Size |
32 |
| Learning Rate |
3e-5 |
| Optimizer |
Adam |
| Loss |
MSE |
Table 3.
NLP Stance Detection Accuracy
Table 3.
NLP Stance Detection Accuracy
| Models |
Accuracy |
F1_Score |
Comments |
| Roberta-base |
0.692 |
0.594 |
NLP, English only |
| bert-base |
0.667 |
0.579 |
NLP |
| SVM |
0.649 |
0.546 |
NLP, English |
| LSTM |
0.584 |
0.304 |
NLP, English |
| Voting-Classifier |
0.597 |
|
|
| Neural-Networks |
0.584 |
|
|
The LSTM and transformer models also included dropout layers, and the LSTM model used Binary Crossentropy loss.
3.2. Transformers
In the NLP Stance Detection model, we leveraged the power of Transformers with the Huggingface Library, a state-of-art neural network model developed in 2017 that utilizes attention mechanisms to analyze the context and connections between inputs and outputs. [9] The two pre-trained Transformer models we used specifically for our Stance Detection models are Roberta-base and bert-base-multilingual-cased. Roberta-base is a pre-trained model on English data with the Masked language modeling (MLM) objective. It differs from traditional RNN in that it randomly selects words from the entire data piece rather than receiving one word after another. Bert-base-multilingual-cased is a pre-trained model on 104 languages also using MLM objective. Similar to Roberta-base, bert-base-multilingual is trained using raw texts only, with manual labeling, and hence enables it to use a large amount of publicly available data.
3.3. LSTM
In both the non-NLP and NLP Stance Detection models, we applied the Long-Short Term Memory (LSTM) neural network model. Building on Recurrent Neural Network (RNN), LSTM specializes in sequence predictions. It has three gates: an input gate, a long-term gate, and a forget gate. LSTM exhibits selective memory, namely, in every layer of the network, the important information goes into the long-term gate and will be input again into the next layer, while other information goes into the forget-gate and will not be included in the next input. LSTM contains feedback connections with previously important data points and applies them to new points. IDEA: Flowchart for NN progression.
4. Stock Price Detection
4.1. ARIMA-GARCH
We applied ARIMA-GARCH, a combination of linear ARIMA and variance GARCH models in the stock prediction task. ARIMA-GARCH is a highly potential model in the domain of finance with lots of applications including stock pre-diction using multiple financial features. The acronym ARIMA stands for Auto-Regressive Integrated Moving Average, it’s a popular model capable of forecasting events over time series by processing the historical data through auto-regression. The acronym GARCH stands for Generalized AutoRegressive Conditional Heteroskedasticity, a statistical model that incorporates autocorrelated variance errors. Therefore, ARIMA-GARCH is not only able to predict future returns using a linear combination of past returns and residuals but also takes into account the changes in variance over time.
4.2. Stock Prices Prediction
The equation we used to weigh each tweet’s stance is determined by three user profile features that had a high correlation with the overall stance: tweet retweet count, tweet favorite count, and user follower count.
Weight Equation:
To find the stance of a single day, we summed the weighted stances from the surrounding week, then divided the weighted sum “support” tweets by the weighted sum “refute” tweets.
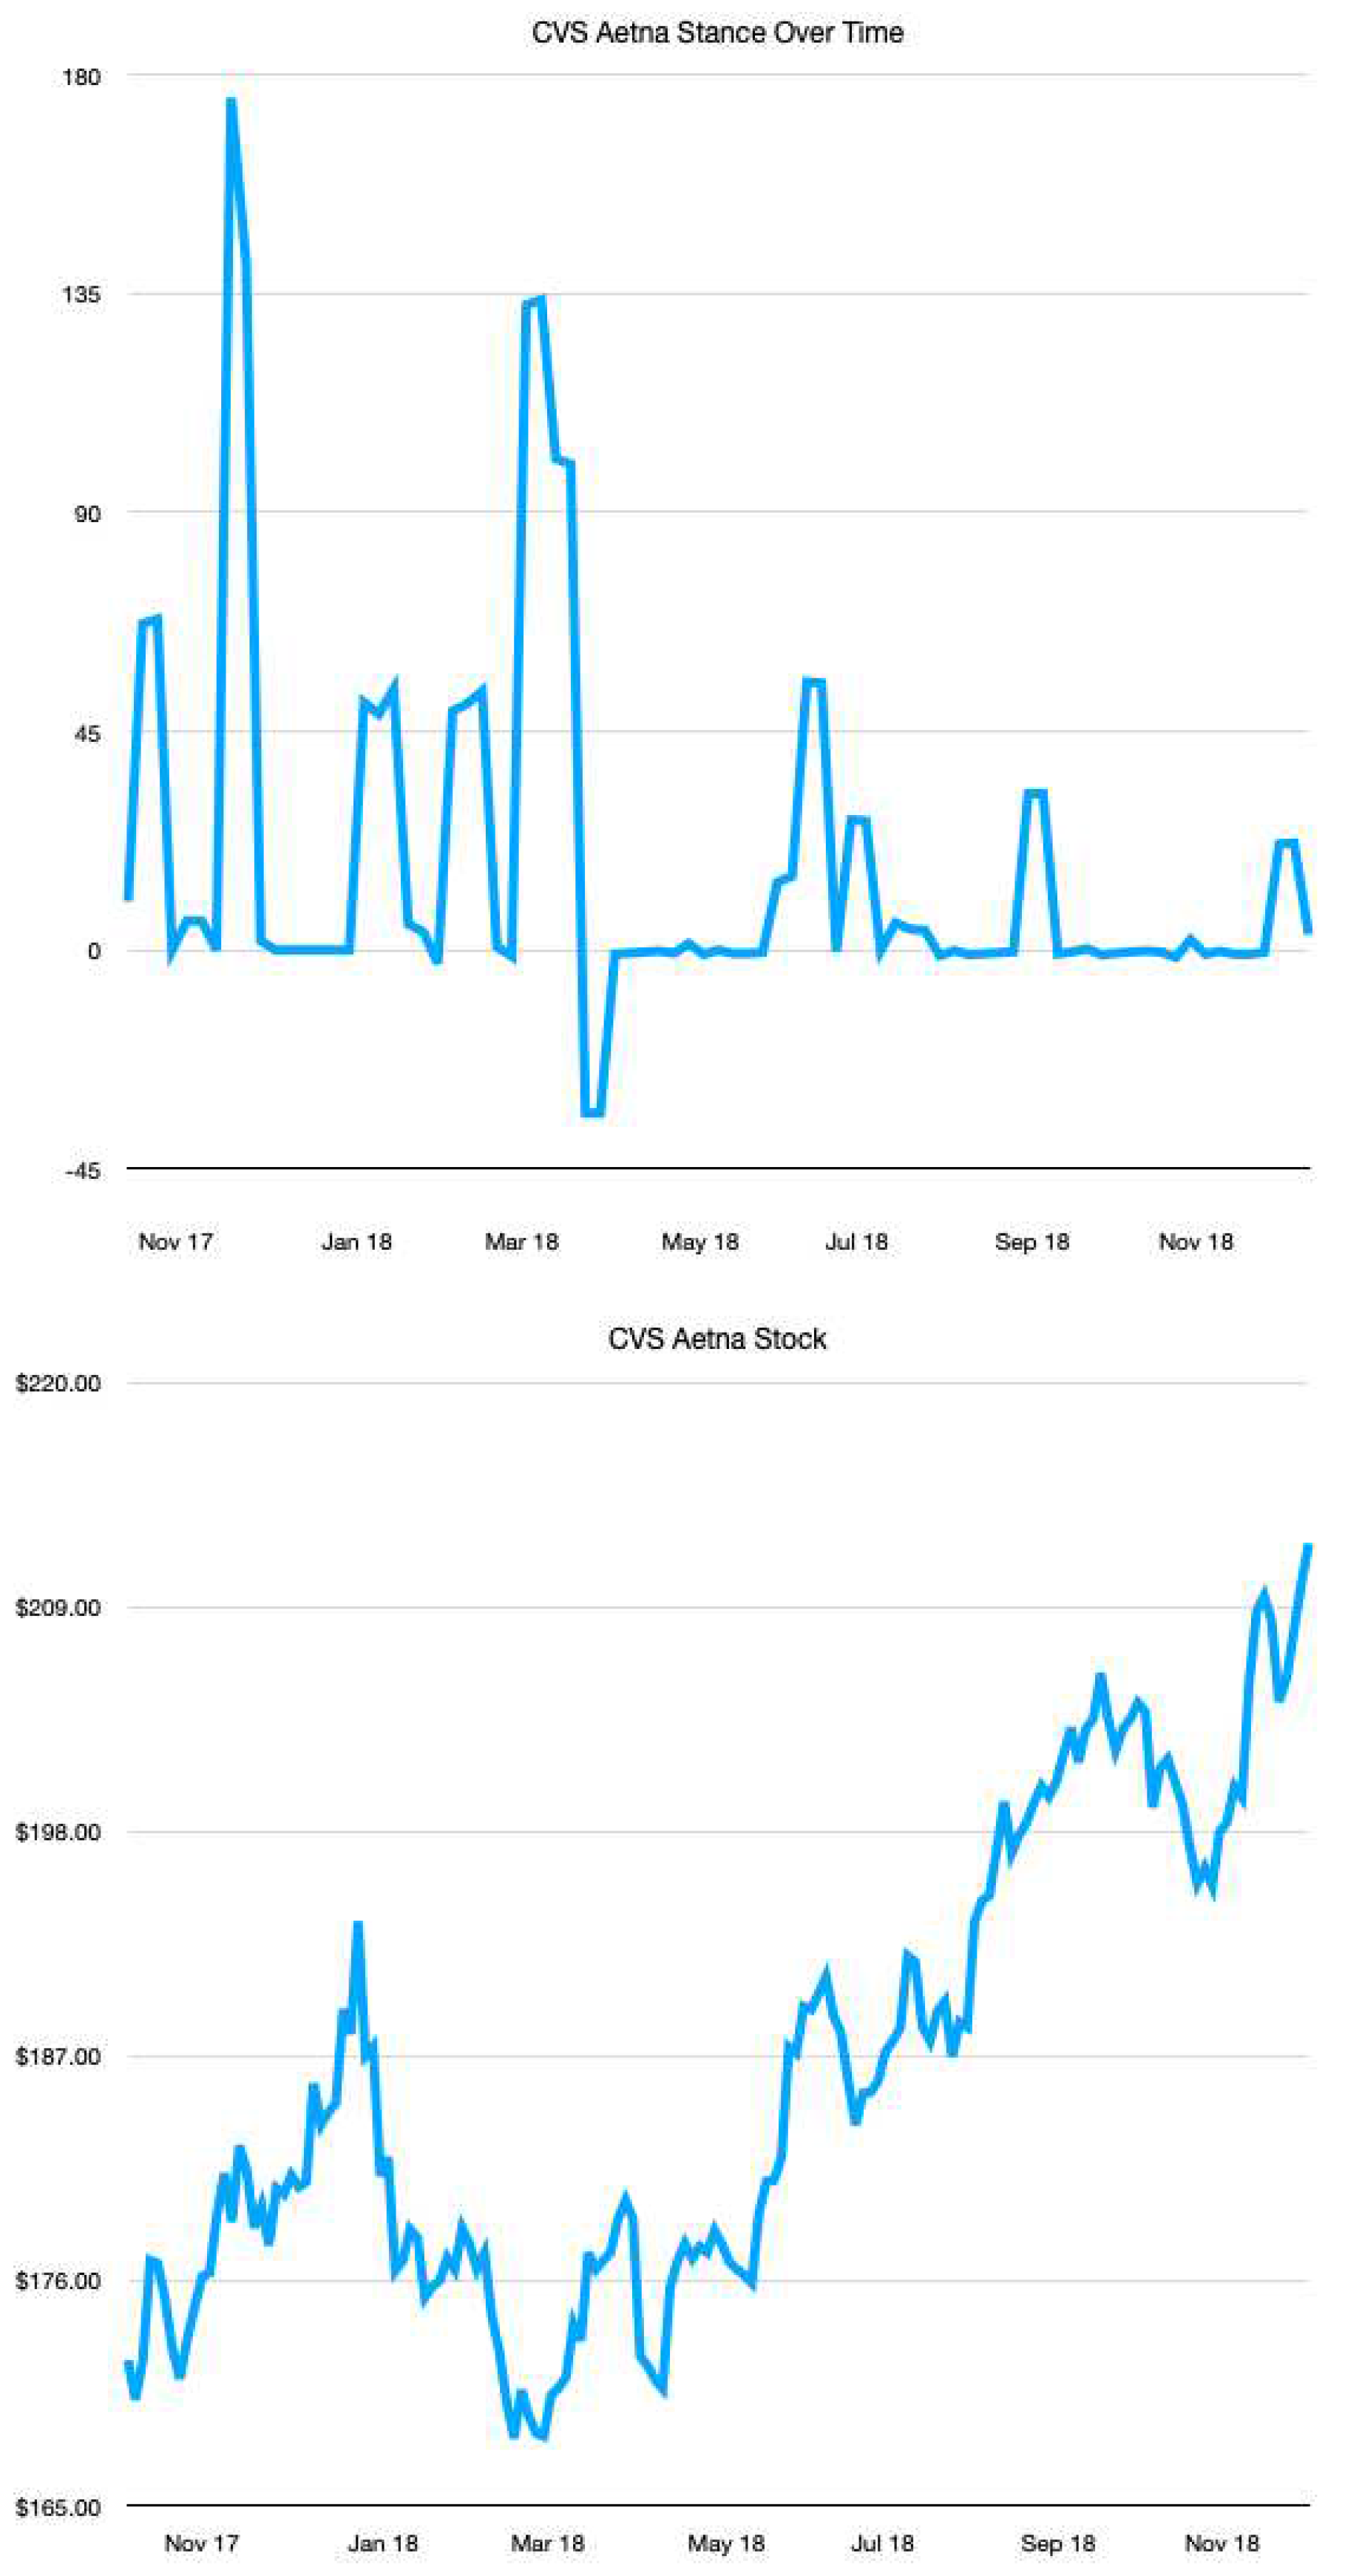
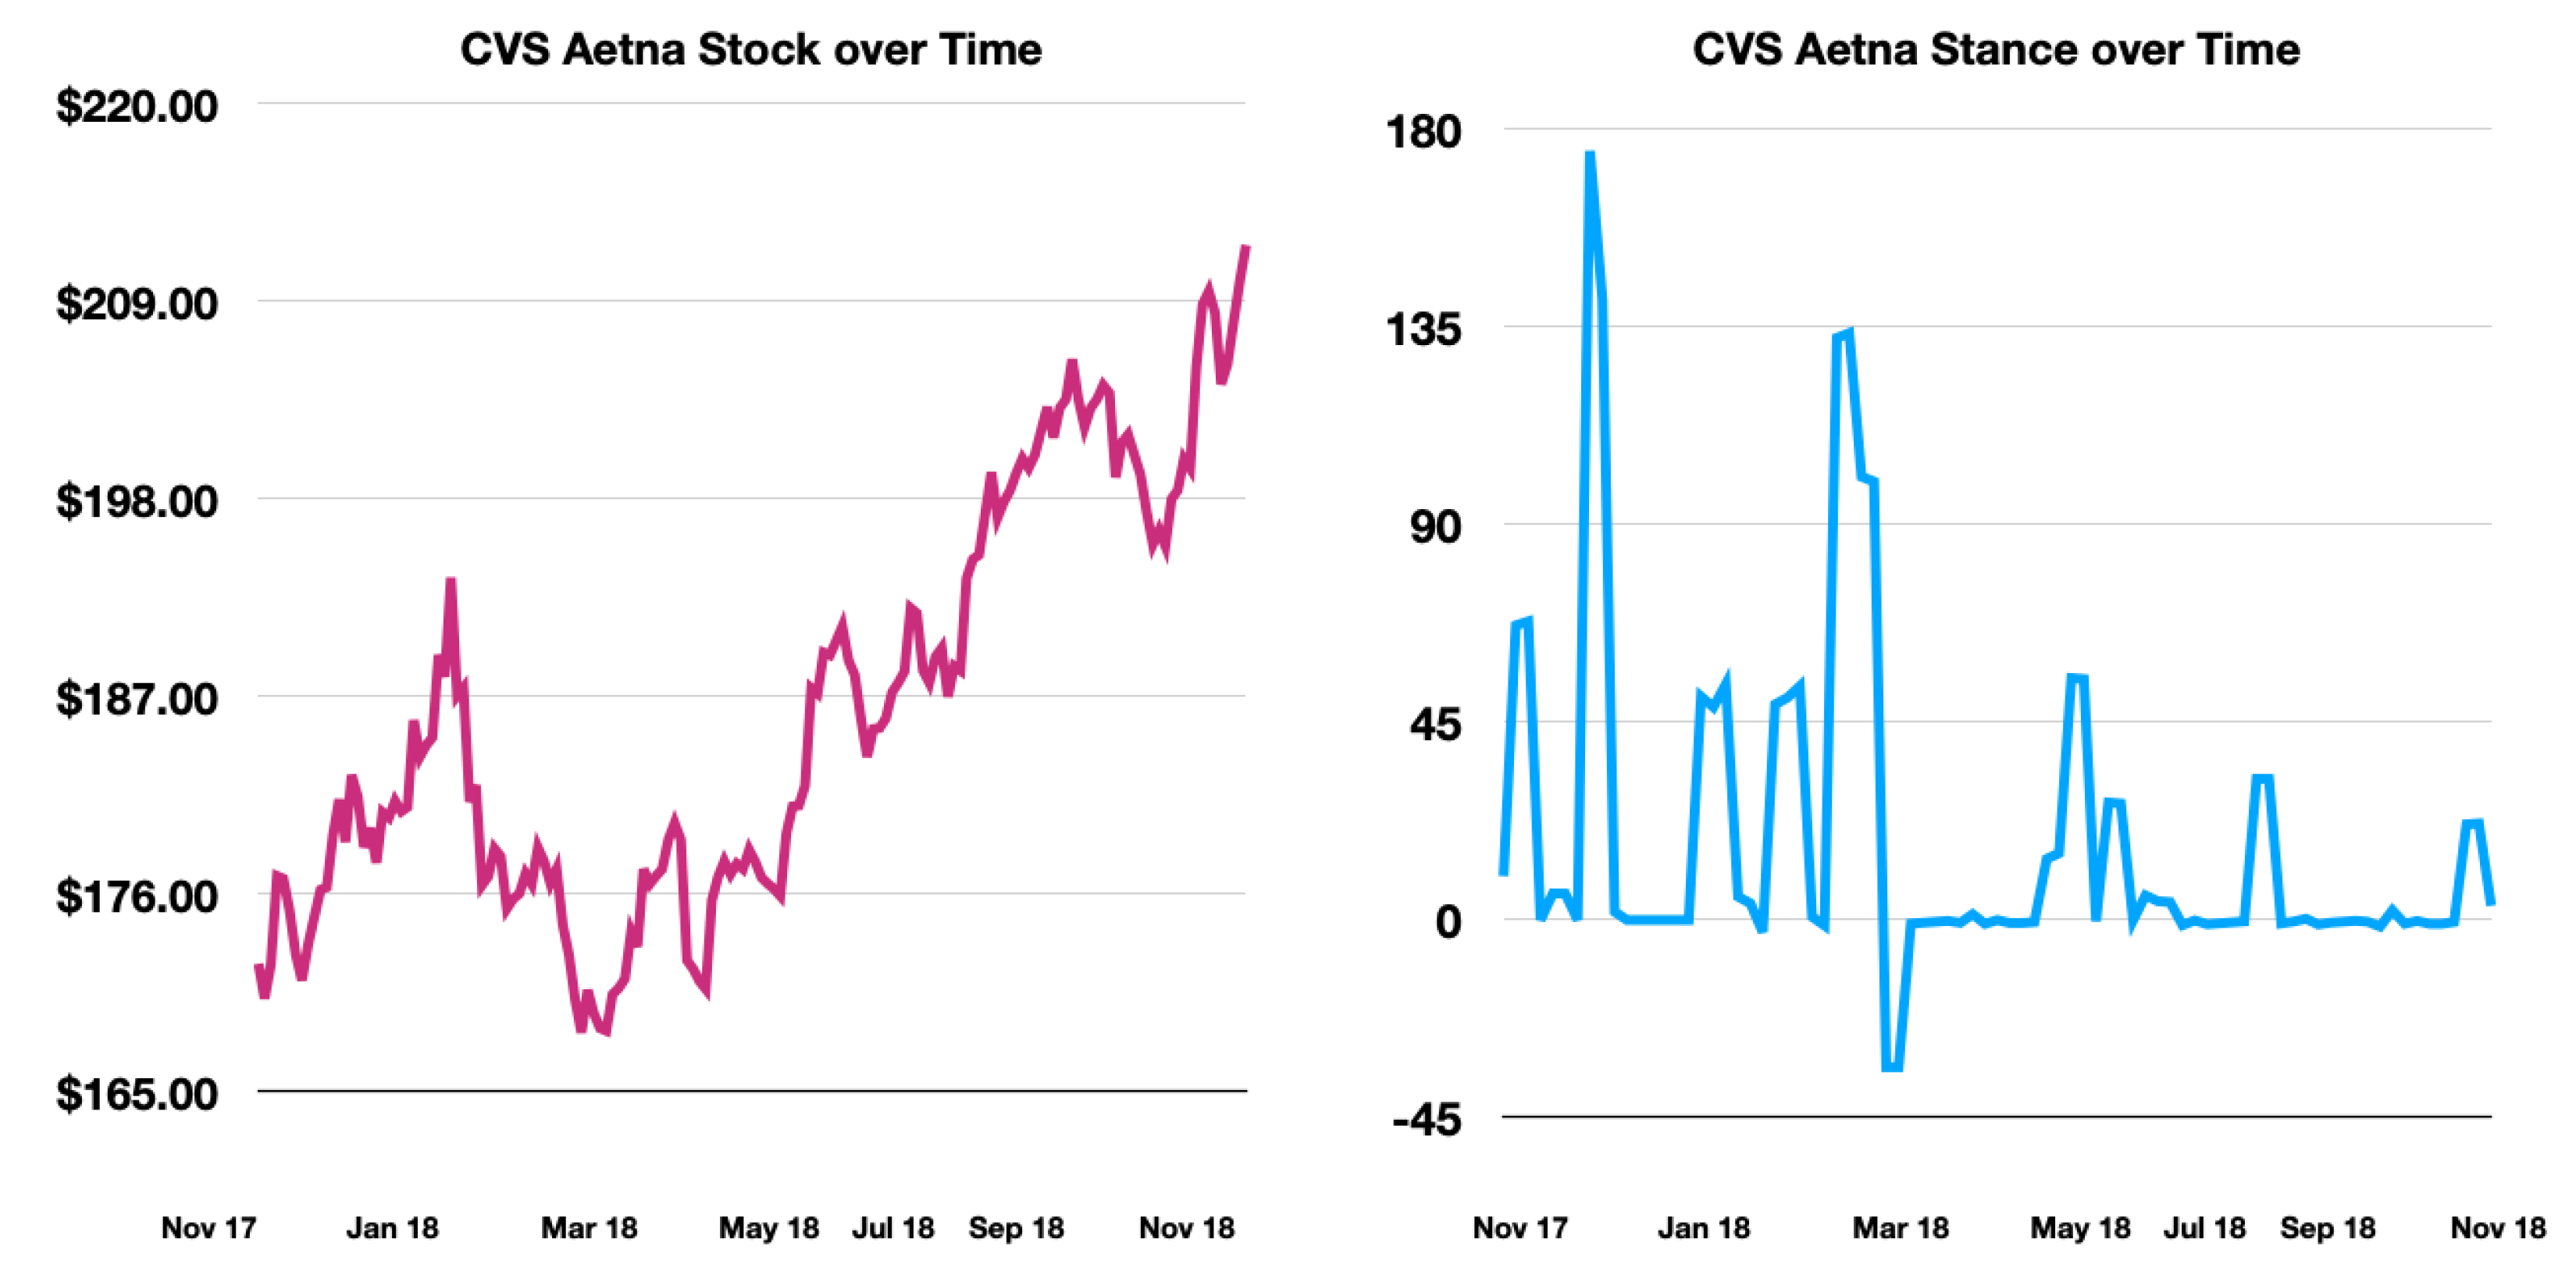
Figure 1 shows the stock prices and aggregate stances throughout the duration of the CVS-Aetna deal. The stock follows a logical trend. At the start when the merger is announced, the online stance is very “supportive.” The early increase in stock price reflects this. Later, as potential complications arise, the stock prices go down, and this can be seen in the aggregate stance, which drops below 0. Towards the end, the stock prices increase as the merger nears completion. Nevertheless, the stance and stock are not perfectly correlated, getting an R correlation value of 0.23. March 2018 is a perfect example of this.
We split the stock data in a 3:1 ratio, training the models on the first three-quarters of an MA deal and testing on the final quarter. In addition, we scaled the data using Sklearn’s MinMaxScaler to make it easier for the models to handle.
We trained a regressive LSTM model to predict future daily and weekly stock prices using the aggregated stance and financial metrics previously discussed. In addition, beyond predicting actual prices, we also tried predicting the percent change in price for testing purposes, but it yielded similar results to just predicting the numerical price.
We also trained a combined ARIMA and GARCH with the same features to predict daily and weekly stock prices. As part of the preprocessing, we differenced the stock price data once to ensure that the data was stationary (uncorrelated and without a directional trend).
Hyperparameters for Stock Prediction:
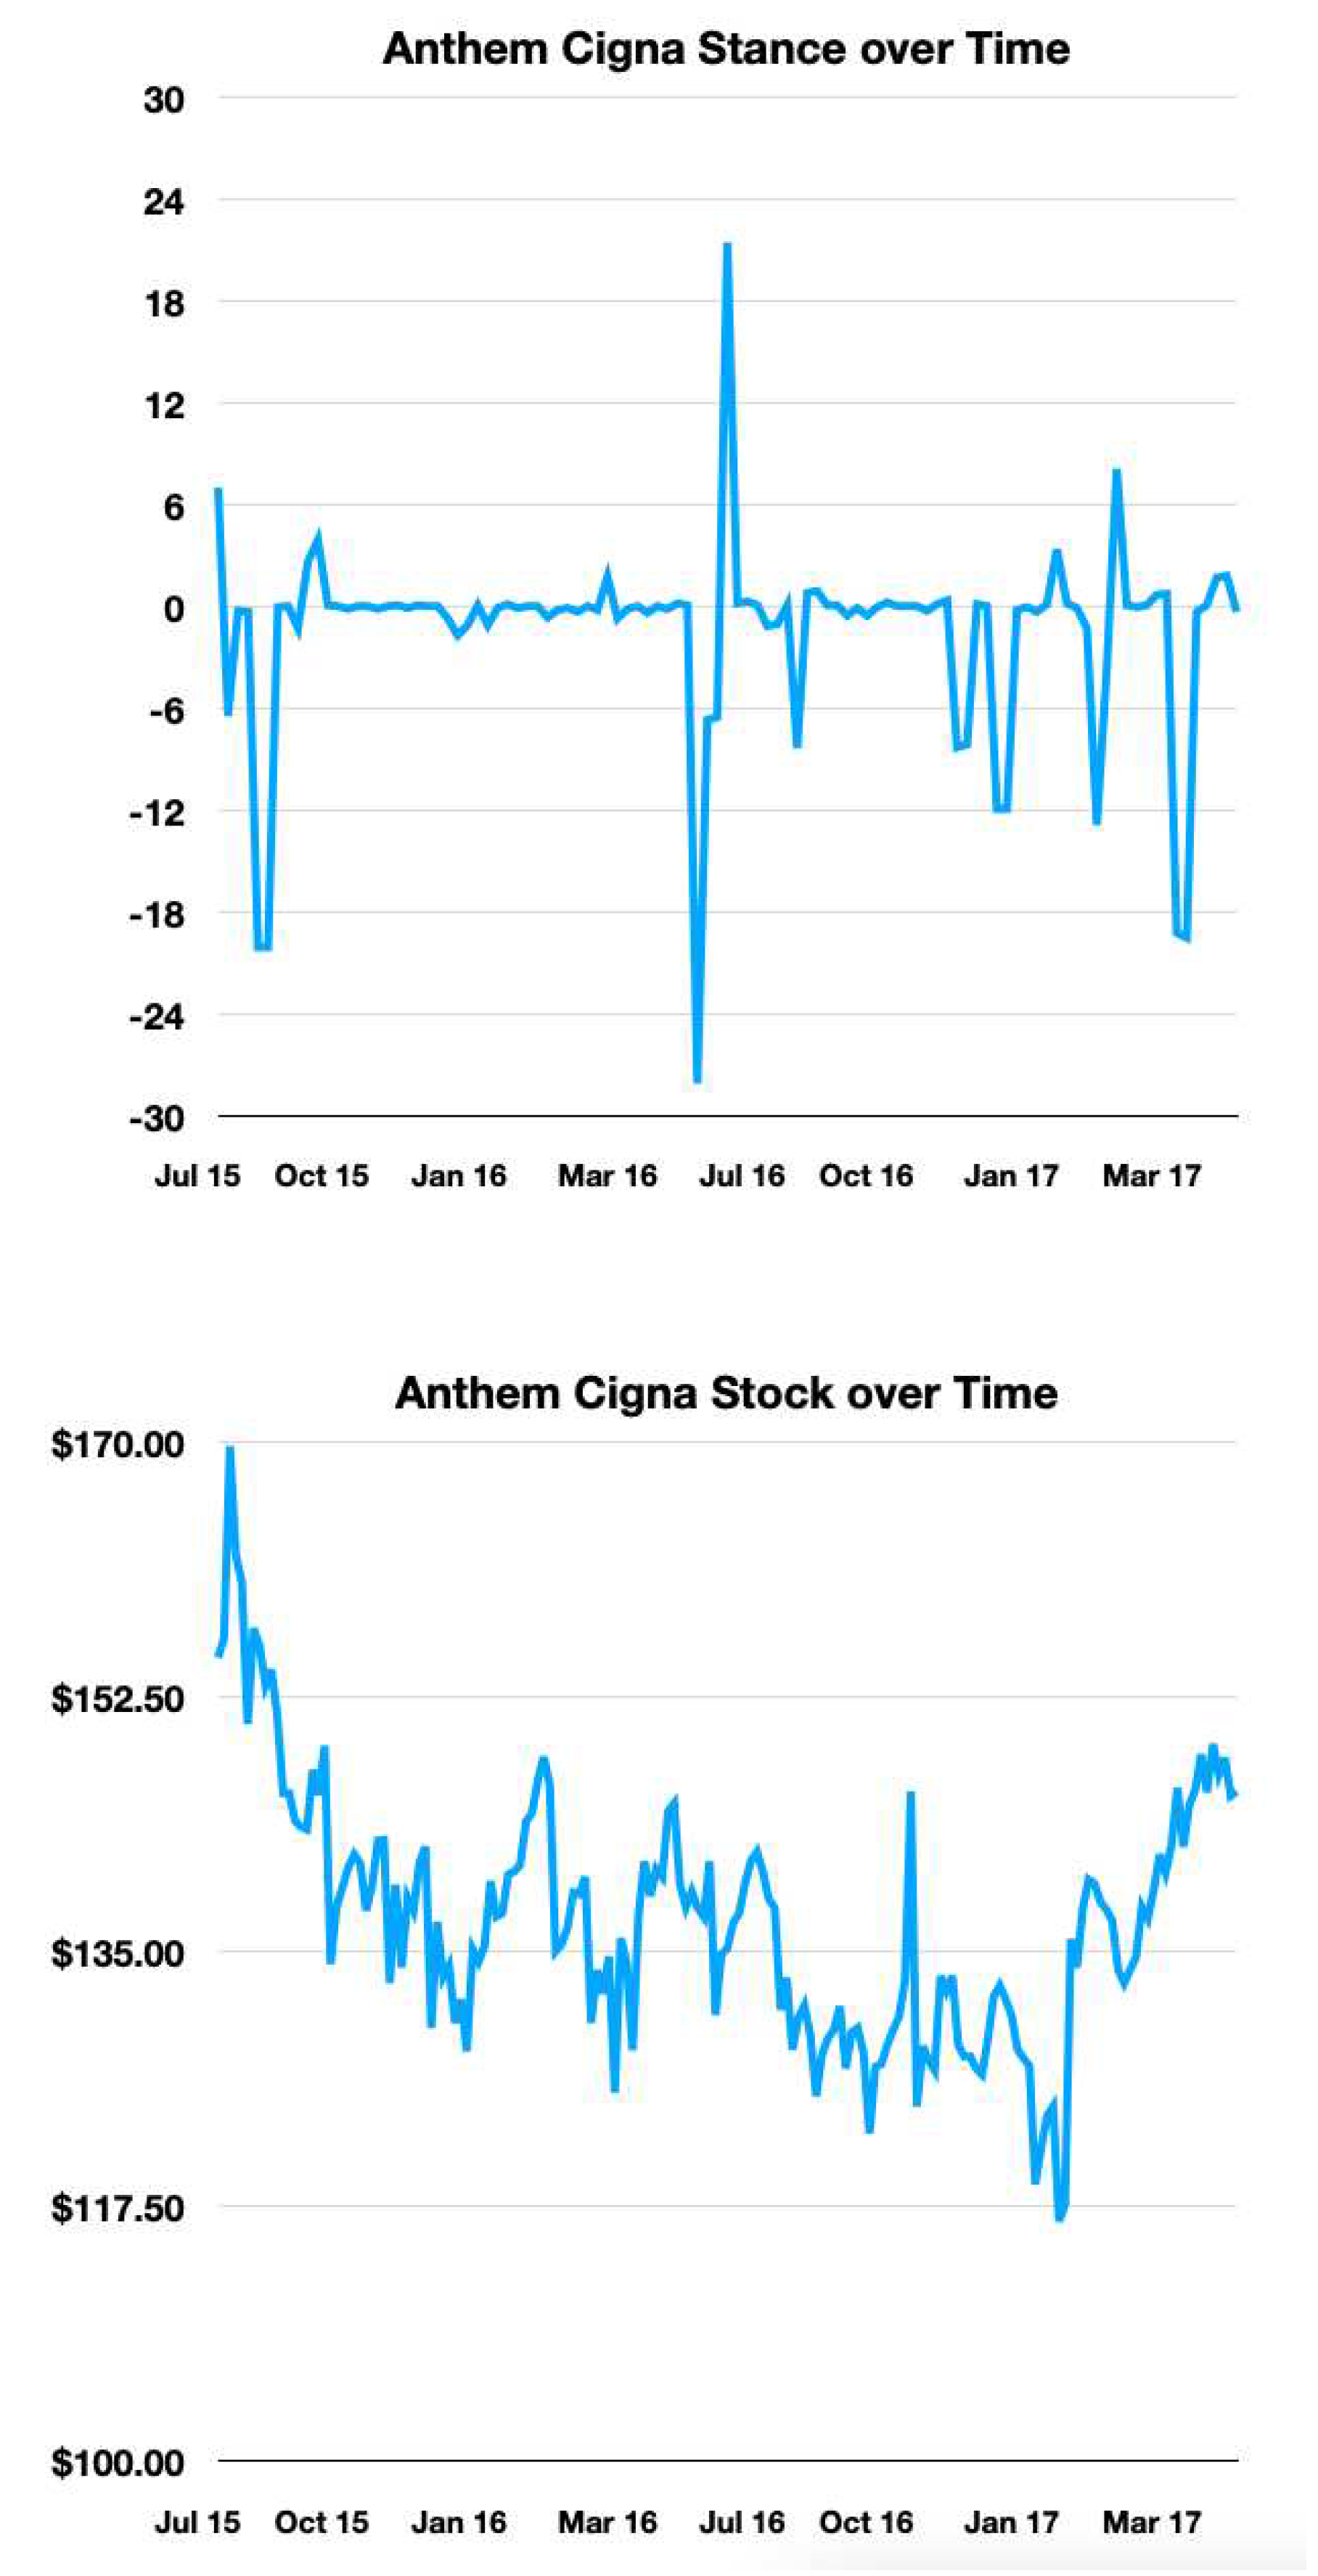
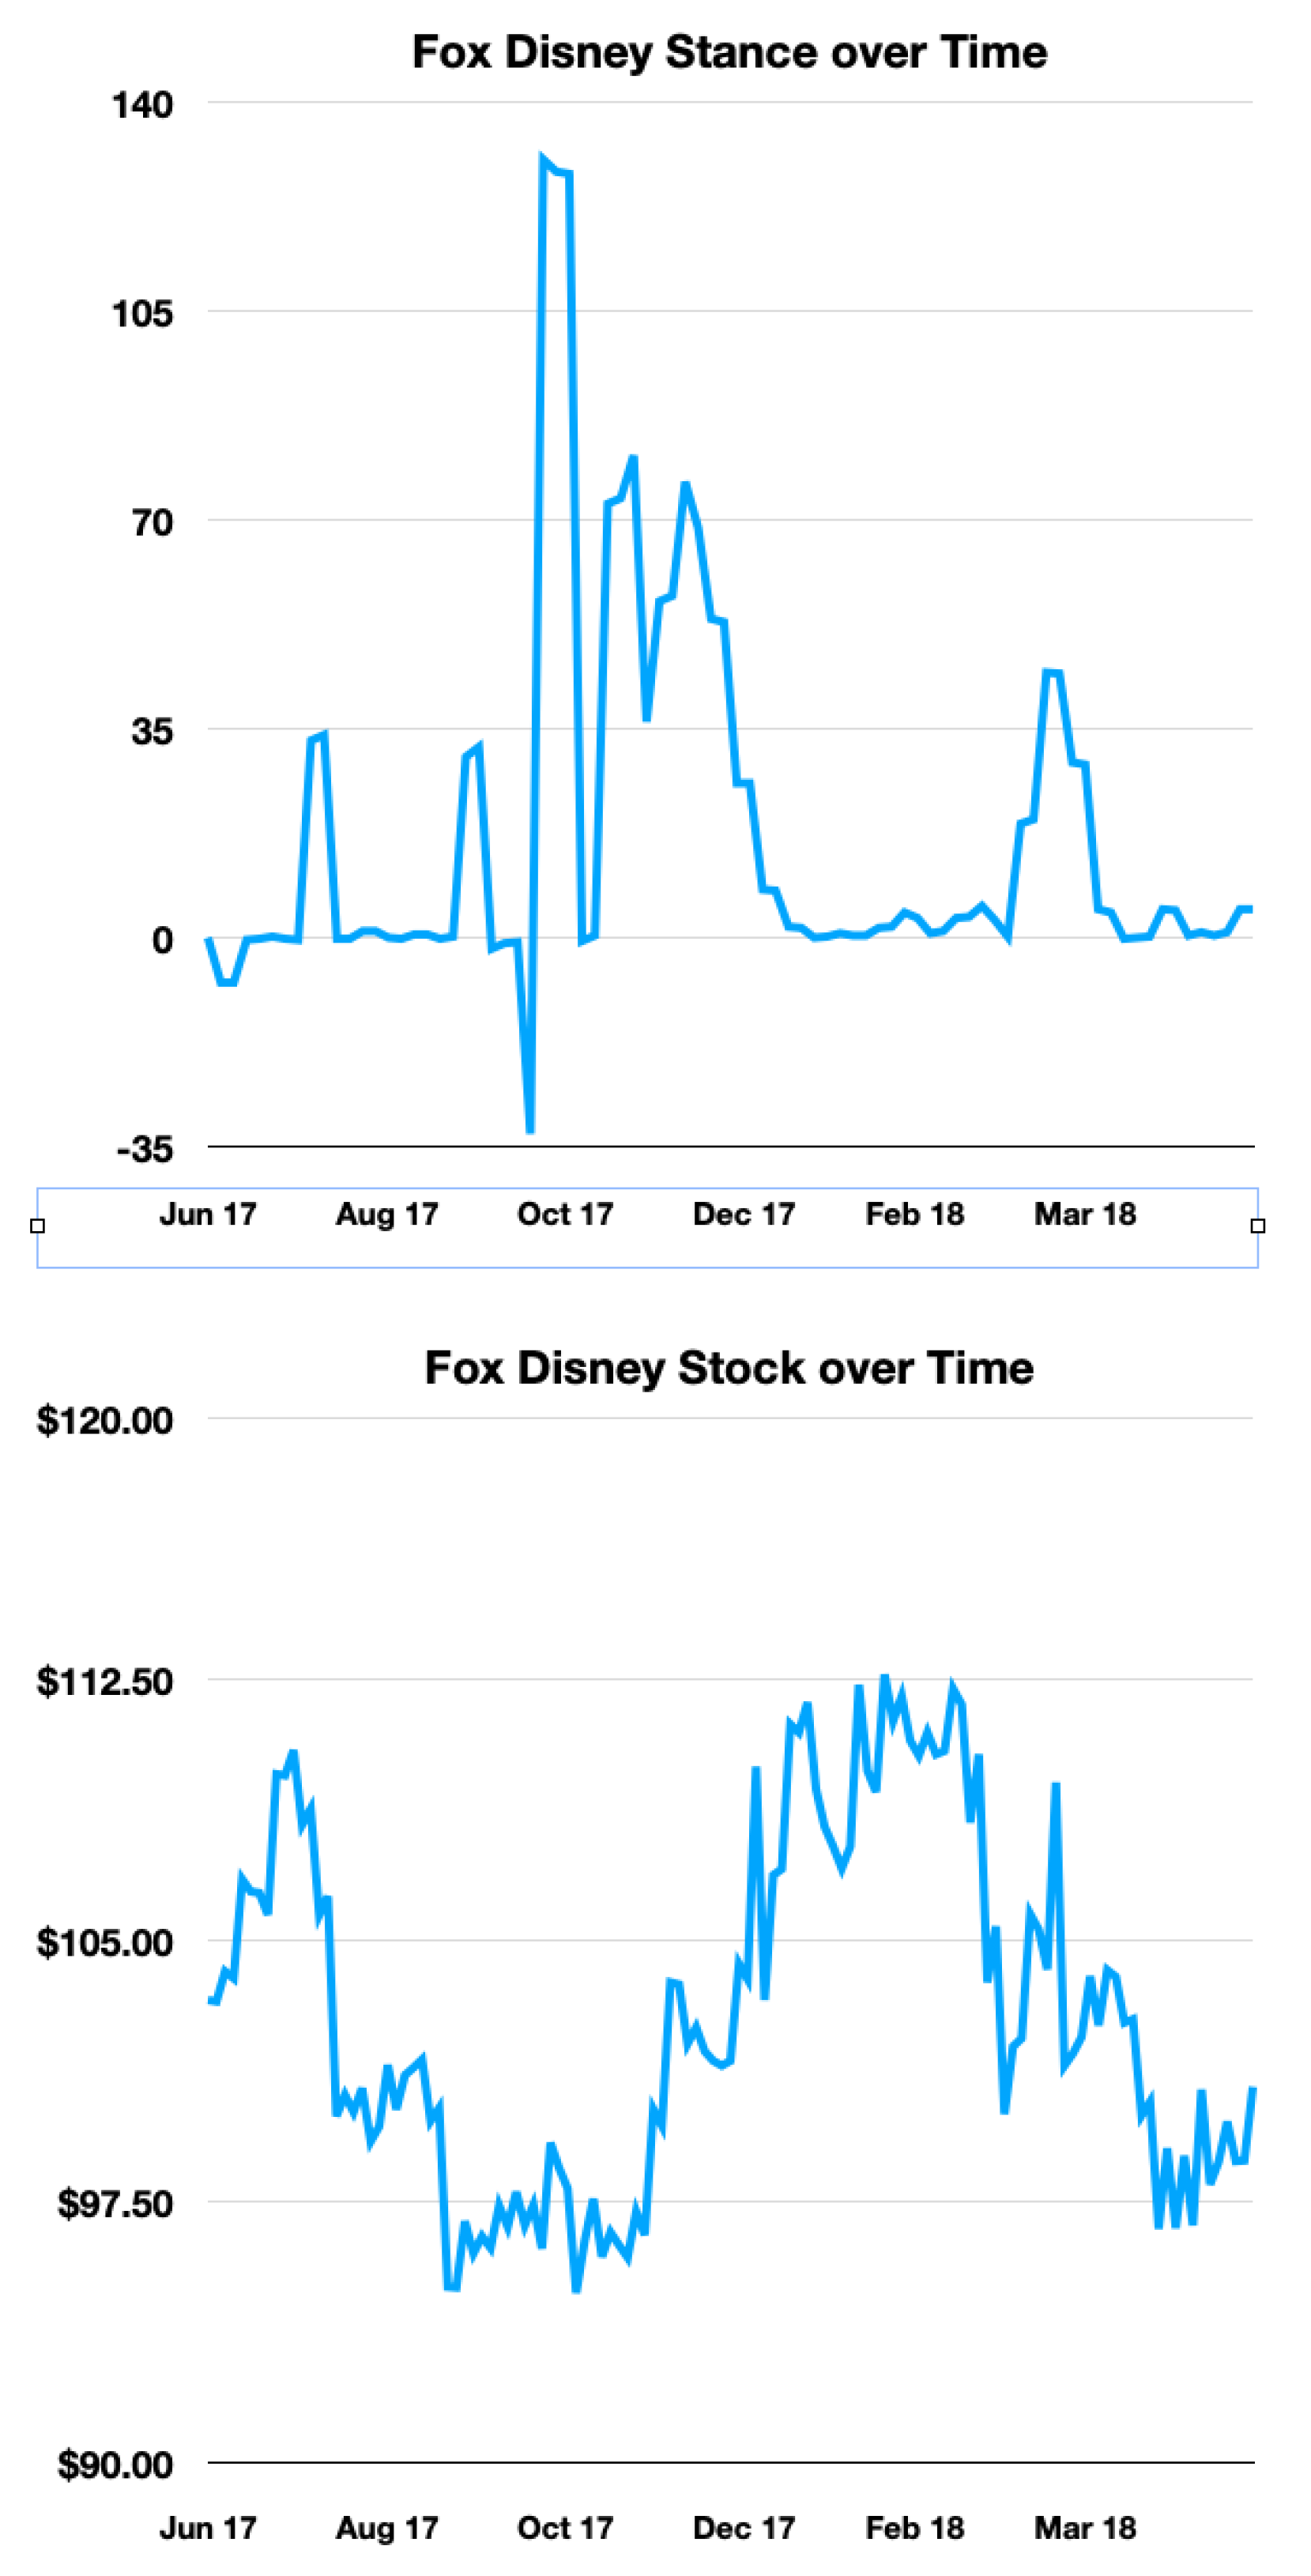
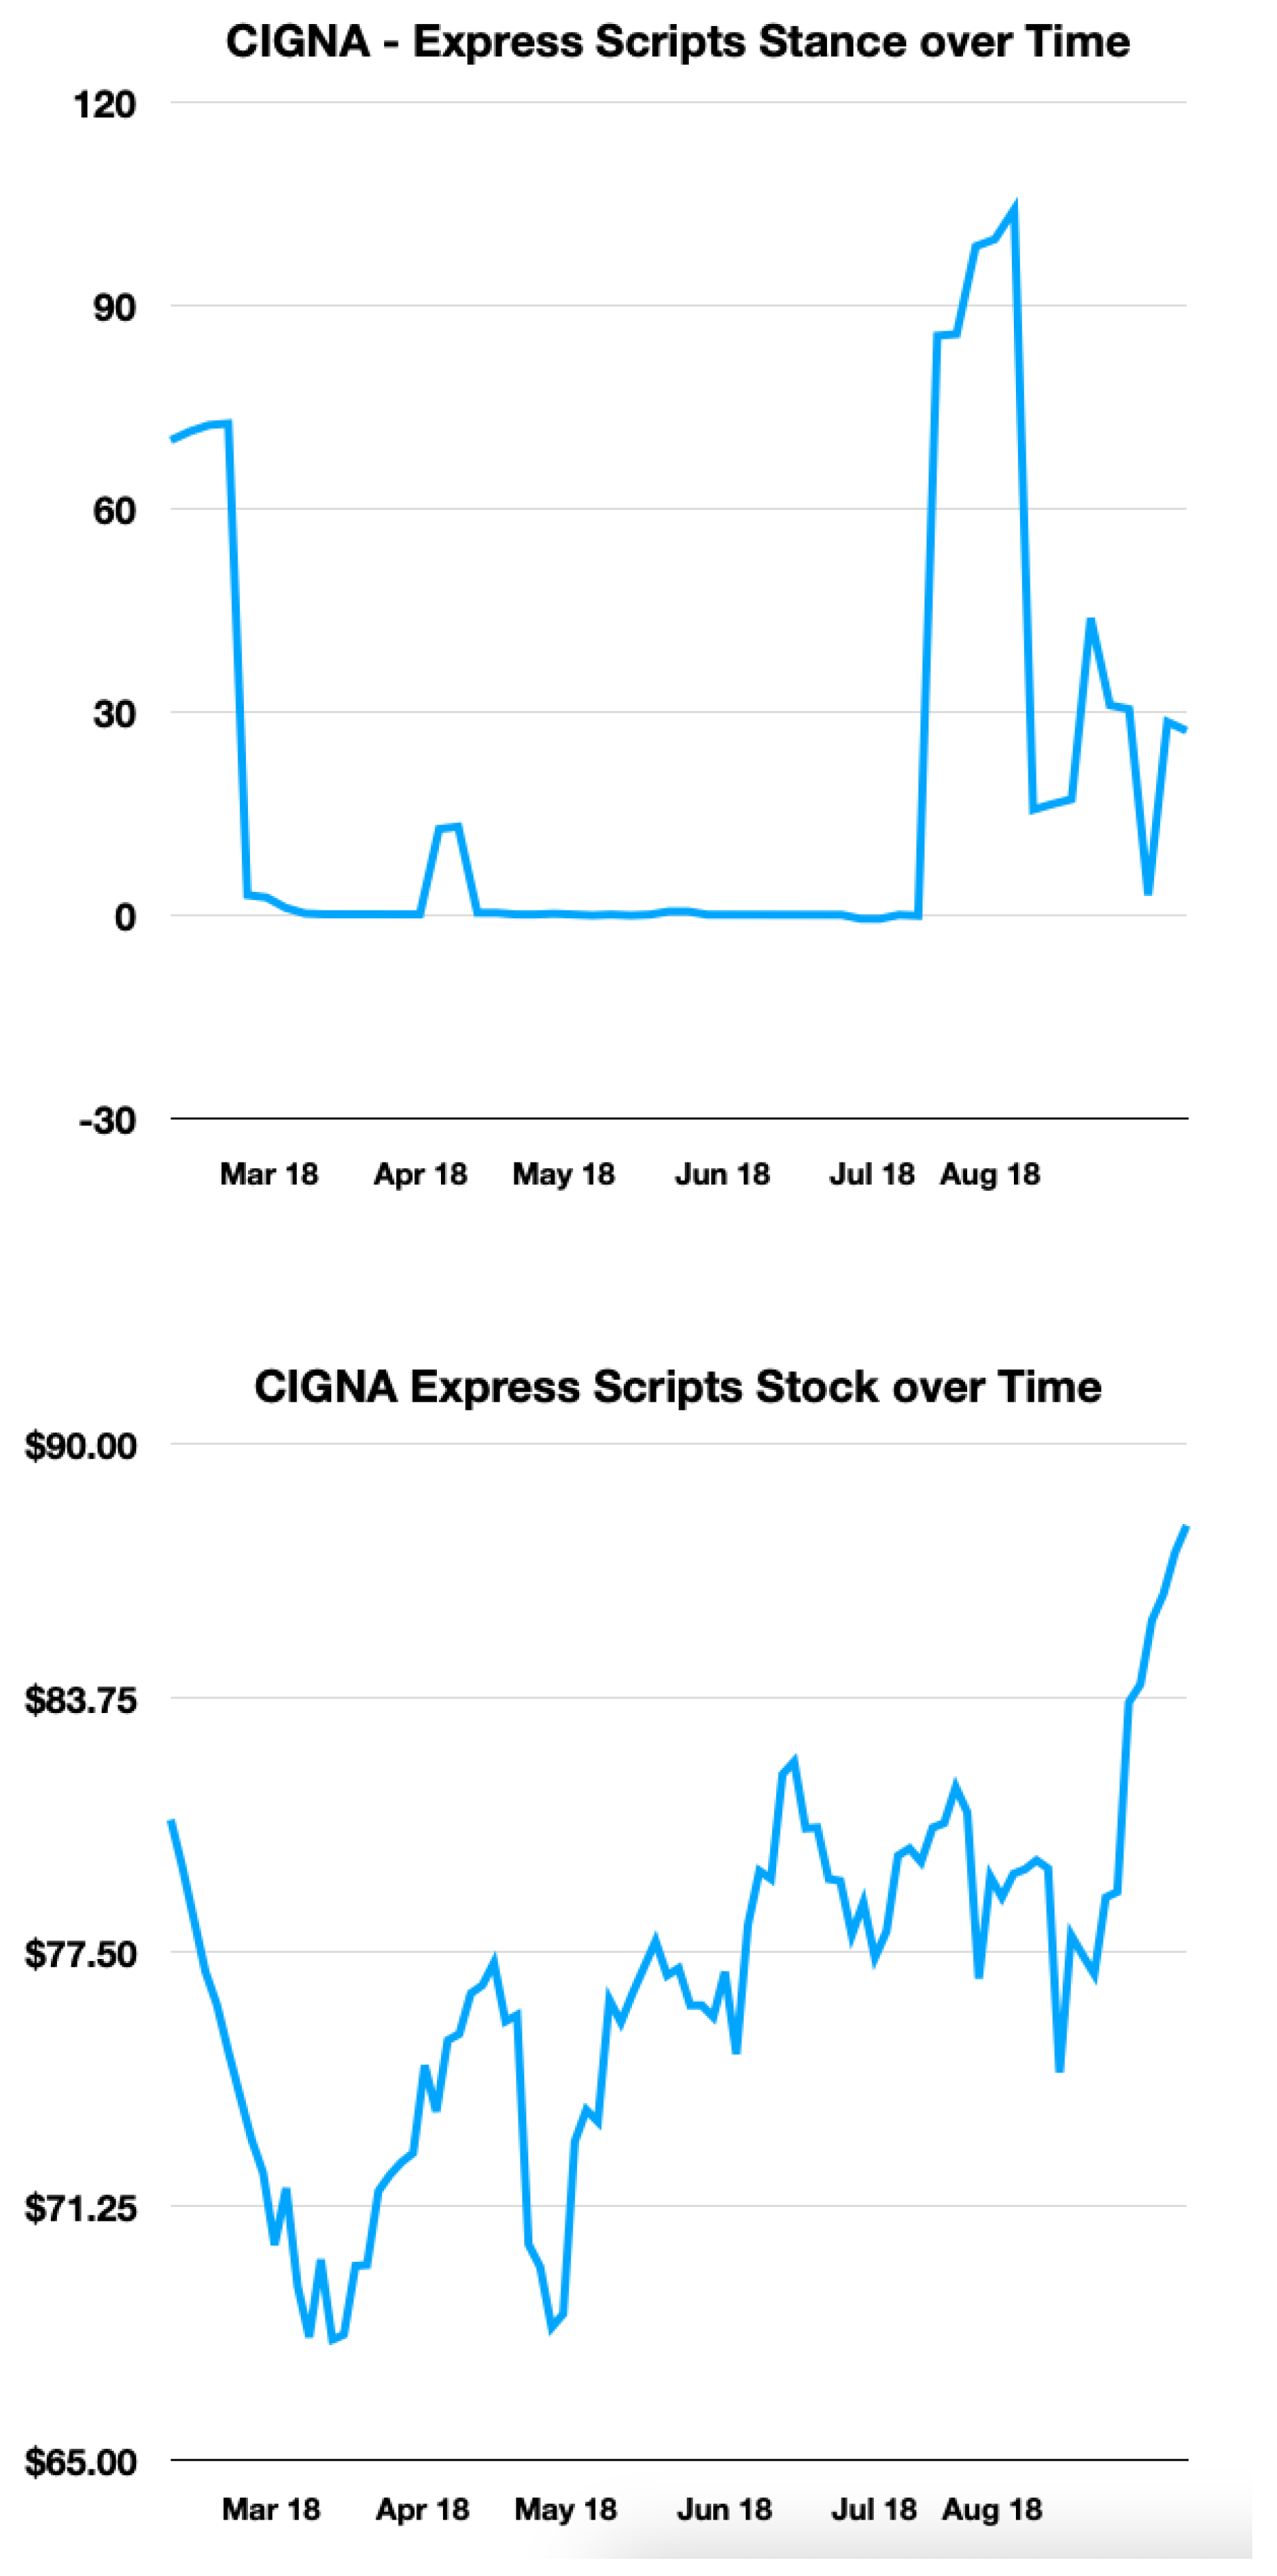
As seen in the
Figure 2,
Figure 3,
Figure 4,
Figure 5 and
Figure 6 below, while the overall correlation between stance and stock may be limited, moments of high stance are often found near spikes or dips in stock price. Thus, for each merger deal, we filtered out days with a stance level that has an absolute value of less than 0.05 * the maximum stance level for that merger deal. Afterward, we trained various different classifier models, including Random Forest Classifier, neural networks, and LSTM, to predict whether a stock goes up or down in the days following a spike in stance level.
Figure 3.
Fox Disney Stance and Stock
Figure 3.
Fox Disney Stance and Stock
Figure 4.
CVS Aetna Stance and Stock
Figure 4.
CVS Aetna Stance and Stock
Figure 5.
CIGNA Express Scripts Stance and Stock
Figure 5.
CIGNA Express Scripts Stance and Stock
Figure 6.
Stance Averages
Figure 6.
Stance Averages
4.3. Merger Completition
Besides predicting stock price, we also developed a method to find the correlation between online Twitter stance and the completion of an M&A deal. As each support tweet was given a 1 and each refutes tweet was given a -1, we found the total sum of all the stances for 1 M&A deal. We could not use the weekly aggregation that we did for stock price because that would count each stance 7 times. Afterward, using the formula below (Sum Stance / Total Tweets per deal), we found the average stance over the entire deal.
Average Stance = Stance Sum / Total Tweets
5. Metrics and Results
5.1. Stance Detection Results and Analysis
To evaluate the accuracy of our Stance Detection models, we employed simple accuracy and F1 scores. Our only opinion detection model, a fin-BERT NLP transformer, achieved an accuracy of 0.701, which is relatively high given the imbalanced data, but still has room for improvement. Notably, transformer models performed the best among all models, with an accuracy of 0.692 for the Roberta-Base model and 0.667 for the Bert-base-multilingual model. We decided not to combine NLP and non-NLP models into a larger ensemble, given that NLP models outperformed non-NLP models by about 8 percent.
Our results suggest that transformers are currently the best models for Natural Language Processing stance detection. However, the overall accuracy remains relatively low, underscoring the difficulty of the WT-WT Dataset and indicating the potential for improvement in NLP and Transformers in the future. The discrepancy between the higher accuracy score and the lower F1 score may be attributed to the data imbalance, as the dataset comprises more supporting tweets than refuting tweets, which could lead the model to assign a "support" stance more frequently. Notably, the model trained solely on English outperformed the multilingual model, likely due to the limited number of non-English tweets (around 500) compared to a large number of English tweets (26,000).
5.2. Stock Prediction Results and Analysis
This section is composed of two parts: stock price prediction and stock trend prediction. For the first one, we fed in previous 30-day data into two different models, namely, LSTM and ARIMAX (-GARCH), to predict the price in one day and seven days. Again, we used MAE, MAPE, as well as RMSE to assess the accuracy of each prediction. From the Tables 4 and 5 below we could see that in the first case (next day prediction), LSTM outperformed ARIMAX (-GARCH) while in the second case (next 7 days), the opposite occurred. This reflects ARIMAX’s ability in predicting long-term prices. It is also worth mentioning that we deployed GARCH as well to further test out its potential but it is not helpful when predicting short-predict stock prices like one week. However, the performance was improved when predicting monthly prices.
Table 4.
Next Day
| Metrics/Models |
MAE |
MAPE |
RMSE |
| LSTM |
2.442 |
0.037 |
3.479 |
| ARIMAX(-GARCH) |
2.294 |
0.021 |
3.372 |
Table 5.
Next 7 days
| Metrics/Models |
MAE |
MAPE |
RMSE |
| LSTM |
3.534 |
0.042 |
3.674 |
| ARIMAX(-GARCH) |
3.609 |
0.048 |
3.907 |
For the second part, since we were not satisfied with the result of stock price predictions, we decided to test out the models’ ability to predict the overall up and down trend of the stocks. Still, we obtained only 54% accuracy on our best model (using random forest), a fairly strong classification model that did not yield a strong result.
5.3. Merger Completion
Our analysis of the correlation between online stance and M&A completion yielded highly informative results, as depicted in
Figure 5. Specifically, we observed that three deals (CVS/AET/FOXA/DIS/CI/ESRX) had a positive average stance, while two deals (AET/HUM/ANTM/CI) had a negative average stance. Notably, all three deals with positive stances were successfully completed, whereas both deals with negative stances fell through. Additionally, we found that the deals that went to completion (CI_ESRX, CVS_AET, FOXA_DIS) had average stances well above zero, whereas the deals that did not go through (ANTM_CI, AET_HUM) had negative average stances (more refute tweets).
5.4. Analysis
The highest accuracy of the Transformers, achieved by Roberta-base, was only 0.69, demonstrating that there is still room for improvement in NLP Transformer models. As such, we decided to use the expert annotated stance from the WT-WT dataset itself instead of applying the predictions of the Transformers model for our stock prediction models. Once more developed Transformers or more refined tweets datasets appear in the future, it might be a better time for researchers to combine the predictions of stance detection models with the stock prediction ones into a single larger model.
In this study, we aimed to predict the Up-Down movement of the stock price for the next day using classification models, including Logistic Regression, Random Forest Classifier, and Neural Networks. Additionally, we utilized LSTM and ARIMAX-GARCH models to predict stock prices in a rolling pattern for one deal over the next week or days. Among all Up-Down prediction models, the LSTM model achieved the highest accuracy of 0.54 in predicting the next day’s direction using the previous 30 days of stock prices and average stance.
Regarding the stock price prediction models, LSTM achieved the lowest Root Mean Square Error (RMSE) of 3.674 for predicting the next week’s stock prices in Cigna Express, whereas ARIMAX achieved the lowest RMSE of 3.372 for predicting the next day’s stock prices. We observed that the GARCH model was less useful in predicting short-term stock prices, such as one day or one week, but performed better when dealing with long-term predictions. Our findings suggest that short-term stock price predictions are challenging due to the high variability of the stock market. Although the results are not ideal, they provide valuable insights into the difficulty of predicting short-term stock prices in practice.
Still, from
Figure 2,
3 and
4 we can see that during days that high stance aggregation occurs, the stance trend tends to match more closely with the stock price fluctuations. Therefore, we select time periods in which high-stance days occur and form a high-stance data frame to test our observations further.
Moreover, while the direct R-value between the stance and the stock price was only 0.112, our results from
Figure 4 indicate that the social media stance is correlated with merger completion or non-completion. This suggests a strong positive correlation between stance and M&A completion, which could make stance a valuable feature for predicting M&A outcomes or stock prices. Integrating stance into M&A analysis could help others more accurately predict M&A outcomes.
6. Conclusion
This paper’s goal was to use stance detection to predict how M&A deals can affect stock prices. Specifically, the project used a meta-model incorporating Hugging Face’s transformers to find a high correlation between stances (either support or refute) with stock prices.
After data preprocessing, we used a pre-trained transformer Fin-BERT model to separate the dataset into opinionated tweets and neutral tweets. We then used a Roberta-Base transformer model for stance detection. We also used a Long Short Term Memory neural network (LSTM), Support Vector Machine (SVM), and a non-NLP ensemble using Twitter data to compare their results to the NLP transformers. Next, we aggregated the daily stance by weighing them with user profile features and appended this to stock data, feeding this data into a hybrid ARIMA-GARCH model along with an LSTM regression model to predict future stock prices and whether a stock will go up or down in the following day. We also used our aggregate stance data to find the correlation between stance and the competition of a merger deal.
Unsurprisingly, NLP transformers provided the best results for opinion detection and stance detection, with 0.701 accuracy for opinion detection and 0.692 for stance detection. For stock price prediction, ARIMA-GARCH performed slightly better than LSTMs with an MAE of around 2.00 for next-day prediction.
Future research projects could obtain more refined, accurate stance data either by creating a new dataset or by annotating the WT-WT dataset themselves for higher accuracy. Training on more tweets and M&A deals would also benefit the models, such as hundreds of merger deals instead of just five. Future researchers could attempt to effectively utilize the correlation between how far a company is into a merger deal and its stock price. For example, the first announcement of a deal often leads to a spike in stock price. Most crucially,
Figure 3 demonstrates that there exists a high correlation between overall stance and completion, showing that there is potential for using online stance for predicting merger outcomes. This suggests that future works can improve upon our utilization of stance in innovative ways, such as by filtering out low-stance-activity days. Future works could also explore the correlation between the different magnitudes of stance and stock price change on a given day; for example, a high stance day may signal a volatile stock price day a few days later. Ultimately, we hope our novel exploration into the relationship between online M&A discourse and stock price trajectory incites additional exploration.
Acknowledgments
We wish to thank Michael Lutz, Director of the Blast AI research program for his assistance and guidance.
References
- Gartner. Mergers and acquisitions (m&a) - gartner finance glossary, Year not specified. Accessed: August 1, 2023.
- WallStreetPrep. Merger arbitrage. Accessed: 1, 2023.
- Wilmer Hale(s). 2022 M&A review and outlook, 2022. Accessed: 2023.
- https://thescipub.com/pdf/jmssp.2010.342.346.pdf.
- Mittal, A., & Goel, A. (2011) Stock Prediction Using Twitter Sentiment Analysis.
- Bryan R Routledge, Stefano Sacchetto, and Noah A Smith. Predicting merger targets and acquirers from text. In Carnegie Mellon University working paper. Citeseer, 2013.
- Jingyi Shen and M Omair Shafiq. Short-term stock market price trend prediction using a comprehensive deep learning system. Journal of big Data, 7(1):1–33, 2020.
- Costanza Conforti, Jakob Berndt, Mohammad Taher Pilehvar, Chryssi Giannitsarou, Flavio Toxvaerd, and Nigel Collier. Incorporating stock market signals for twitter stance detection. In Proceedings of the 60th Annual Meeting of the Association for Computational Linguistics (Volume 1: Long Papers), pages 4074–4091, 2022.
- Will-They-Won’t-They: A Very Large Dataset for Stance Detection on Twitter.
|
Disclaimer/Publisher’s Note: The statements, opinions and data contained in all publications are solely those of the individual author(s) and contributor(s) and not of MDPI and/or the editor(s). MDPI and/or the editor(s) disclaim responsibility for any injury to people or property resulting from any ideas, methods, instructions or products referred to in the content. |
© 2020 by the authors. Licensee MDPI, Basel, Switzerland. This article is an open access article distributed under the terms and conditions of the Creative Commons Attribution (CC BY) license (https://creativecommons.org/licenses/by/4.0/).

