1. Introduction
Based on the widespread utilization of renewable energy, the study in this field has fundamental and crucial role. Over the past decade according to the growing energy demanding trend, the environmental pollution and discharge the sources of fossil fuel the focus on renewable energy surged significantly [
1,
2]. These energies have the crucial role in the world and prepare over 14% of the total energy in the world [
3]. The wind energy is an accessible energy in comparison with the other sources of energy. The output power of wind turbines will be the function of various terms, including a blade twist angle, a rotational speed of the motor, wind velocity, disturbances characteristics, and wind velocity gradient in the location of the power plant. The aerodynamic simulation of designing the rotor blade and improvement in the performance of the turbomachines is an important and necessary problem [
4,
5]. Therefore, this requires to validate the new methods and improve the accuracy and efficiency of results. Generally, researches on wind turbines are categorized into two groups of a horizontal and vertical axis. It is proved that horizontal axis wind turbines have the pivotal role in the future of the insand particlessry [
6]. Therefore, many types of research have been done to study the performance of an axial wind turbine as one of the most important renewable energy equipment [
7,
8,
9,
10,
11,
12].
Song et al. [
13] investigated numerically the wake flow in the farm in order to optimize the modified large greedy method. They used particles simulation in order to determine the intensity of wake flow.
The recent researches in order to extend and validate this new framework are conducted by Porte’ Agel et al. [
14] by large eddy simulation (LES) method. They implemented several models such as a standard actuator-disk model without rotation that computes an overall thrust force and distributes it uniformly over the rotor disk area; an actuator-disk model with rotation that computes the local lift and drag forces (based on blade-element momentum theory) and distributes them over the entire rotor disk area; and an actuator-line model that calculates those forces along lines that follow the position of the blades in LES code program.
Bartl et al. [
15] measured flow field characteristics between two particular types of turbines. Their aim was collecting the empirical data regarding the method of yielding power in a downstream turbine.
Elvira et al. [
16] presented a numerical code based on the
k-ε turbulence model in order to the proper simulation of the wake. In this code the axial symmetry hypothesis not considered.
Whale et al. [
17] investigated the structure of vortex in a wake region of the blade in an experimental scale. The experimental data was conducted by the Particles image velocimetry method. Bouhelal et al. [
18] studied the effect of different Reynolds average Navier-Stocks (RANS) turbulence models on two near wall approaches on prediction performance of horizontal axis wind turbines. The results show that the
k-ε turbulence model was considered to be the best accurate model. Cheng et al. [
19] investigated the turbulence flow around an array of cube cylinders in order to compare LES and
k-ε models. It is found that both grids have an acceptable ability in this flow region. However, LES method showed more robustness and ability in this flow region. Sanderes et al. [
20] used LES and Reynolds average Navier-Stocks method. Zhang et al. [
21] investigated the wake region of a wind turbine in an experimental scale in Minnesota university of United-states. They focus on the effect of surface temperature on velocity profiles.
According to the presented literature review, studies on the effect of sand particless are not seen in the literature. In the present work, a CFD method which is validated with experimental data. Then the influences of air in clean and sand particless condition were analyzed. Also, the Mechanical power and the effect of the blade tip on the yielding and extending of the vortexes were investigated. The results show a development in mechanical power and thrust, by increasing wind velocity, but larger sand particless sizes, reduce power, thrust, and torque in more wind velocity.
2. Numerical Simulation
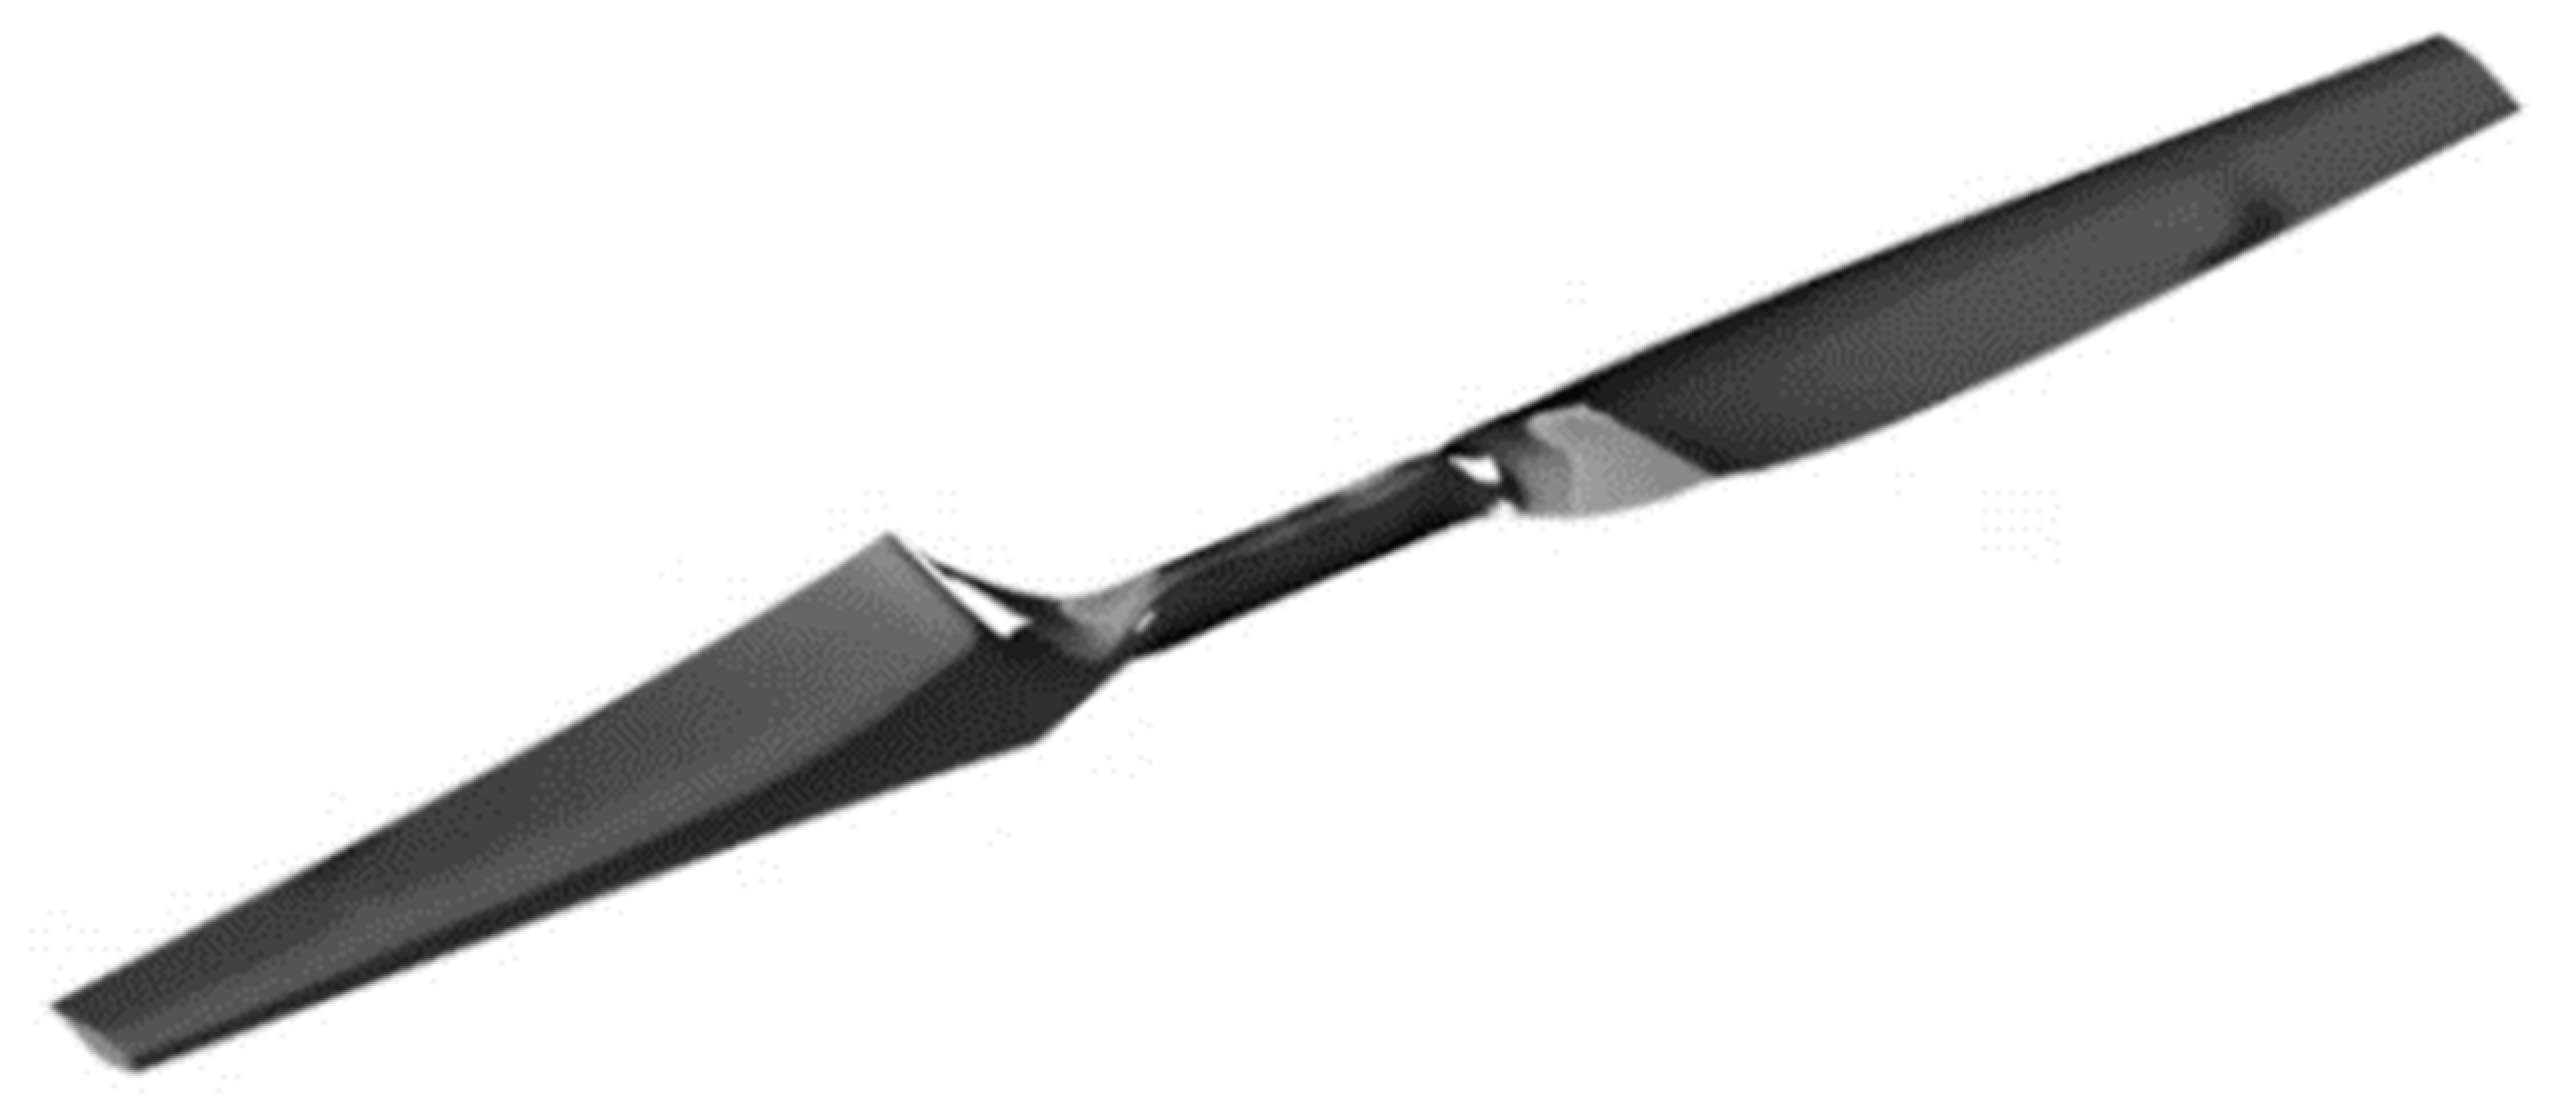
One of the crucial element in wind turbine insand particlessry is the proper design of blade so that yield the maximum power and torque. After comparing several types of axial wind turbines NREL phase vi is selected for simulating in this study. This turbine consists of two blades with 10.058 m diameters and designed based on the characteristics mentioned in
Table 1 [
22]. The schematic of the axial wind turbine used in the simulation is shown in
Figure 1. The airfoils are twisted in various sections in order to improve aerodynamic quality in rotation time.
2.1. Equations Governing
The axial wind turbine is simulated using a CFD code. Also, additional transport equations for the turbulence model are solved because the flow is 3-D and turbulent. The governing equations for numerical simulation are based on the assumptions of unsteady state and compressible fluid. Finally, based on the comparison results, complex flow behavior and also available data in the literature [
23,
24,
25,
26] the shear stress transport (SST) model was selected as the most appropriate model. The SST turbulence model has similar forms to standard k-ω model can be written as follows [
27]:
In these equations Gk is the sign of kinetic energy which is rooted in average velocity gradient. Gω is showed the production of ω, Γk, Γω are illustrated effective diffusion of k, ω terms. In addition Yk, Yω determined the disturbances rooted in k, ω, Dω are transverse diffusion terms.
It is necessary to apply a discrete phase model to calculate the rate of the sand particless particles production. A model based on the drag force equation is used in the present study. The force balance equates the particles inertia with the forces acting on the particles. The drag force equation is given by:
Where,
Up is the particles velocity,
Fd (U-Up) is the drag force per unit particles mass,
Fx is an additional acceleration term,
U is the relative speed between airfoil and flow,
μ is the fluid dynamic viscosity coefficient,
ρ is the air density,
ρp is the density of the sand particles,
dp is the sand particles diameter, Re
p is the relative Reynolds number for the sand particles.
2.2. Boundary Conditions
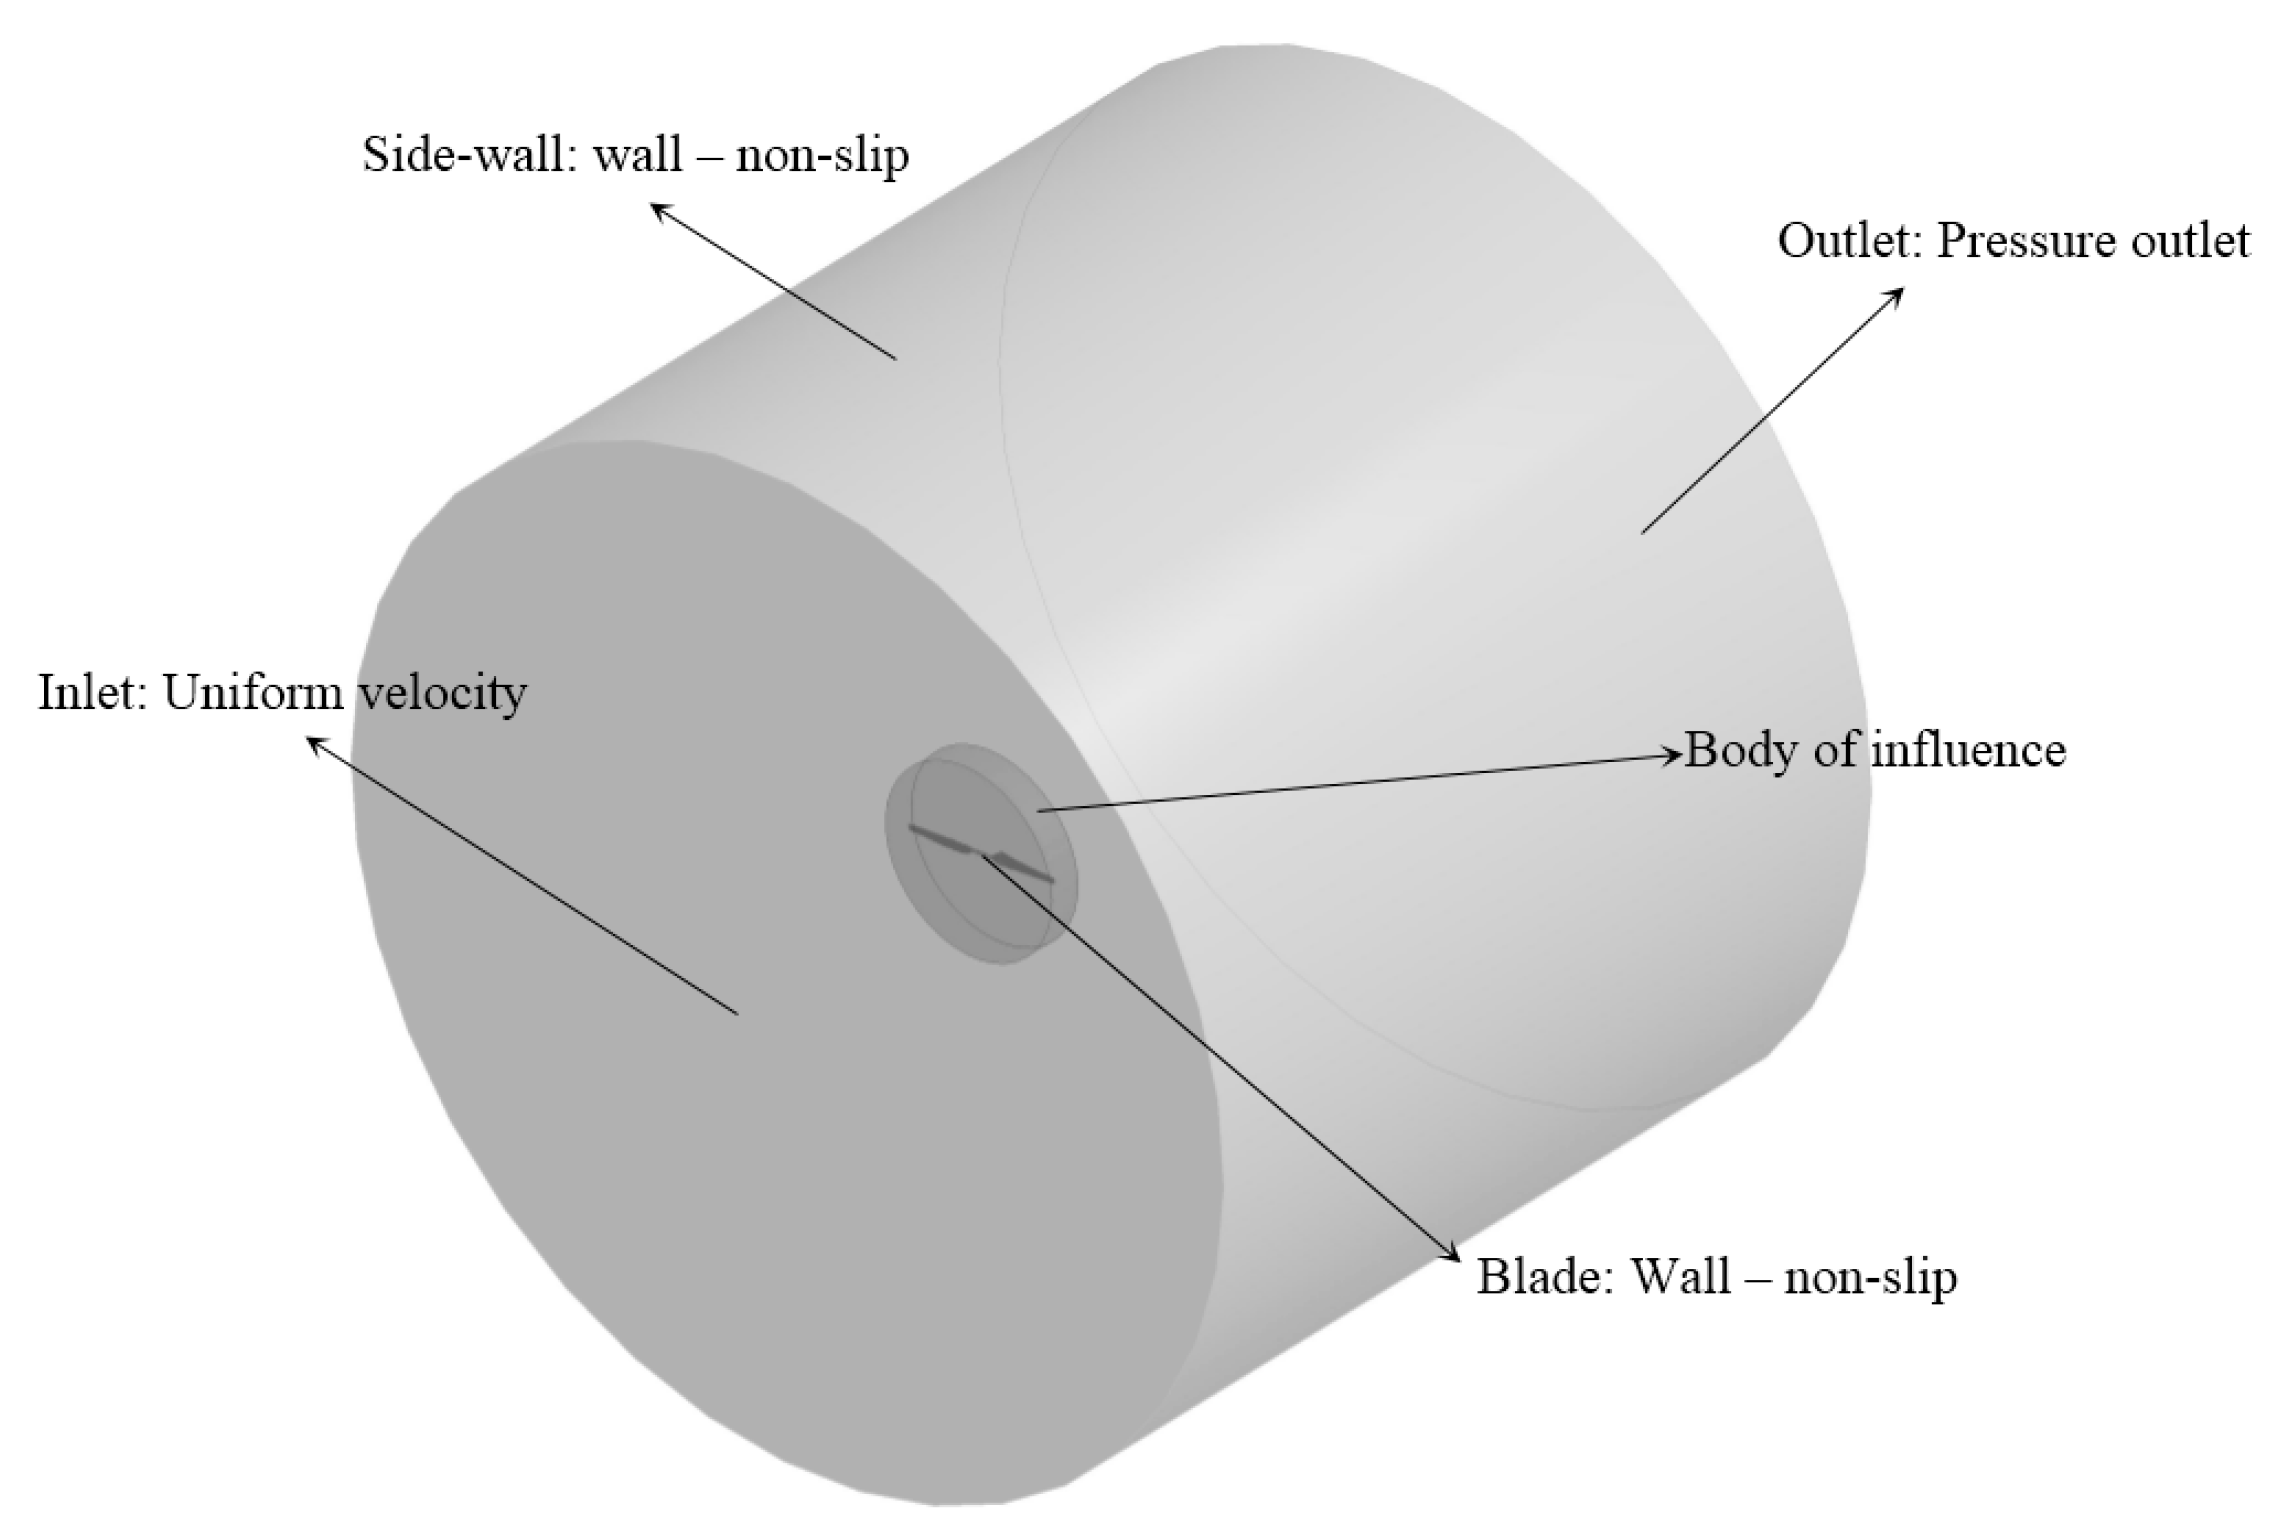
A computational fluid dynamics method is used for an axial wind turbine. Validation part was done by empirical results which are shown the acceptable agreement of an implemented framework. Three-dimensional Navier-Stocks equations and Reynolds average Navier-Stocks turbulence model (SST) are used in order to a proper simulation of circulation flow around the axial wind turbine. The computational domain is illustrated in (
Figure 2). Slide wall and outlet boundaries are considered as Far-field boundary-condition and the velocity is assumed to equal to inlet rotation velocity. The rest of the boundary are considered non-slip boundary condition. The turbulence intensity is considered 5% which is suitable for flow at the inlet of the duct.
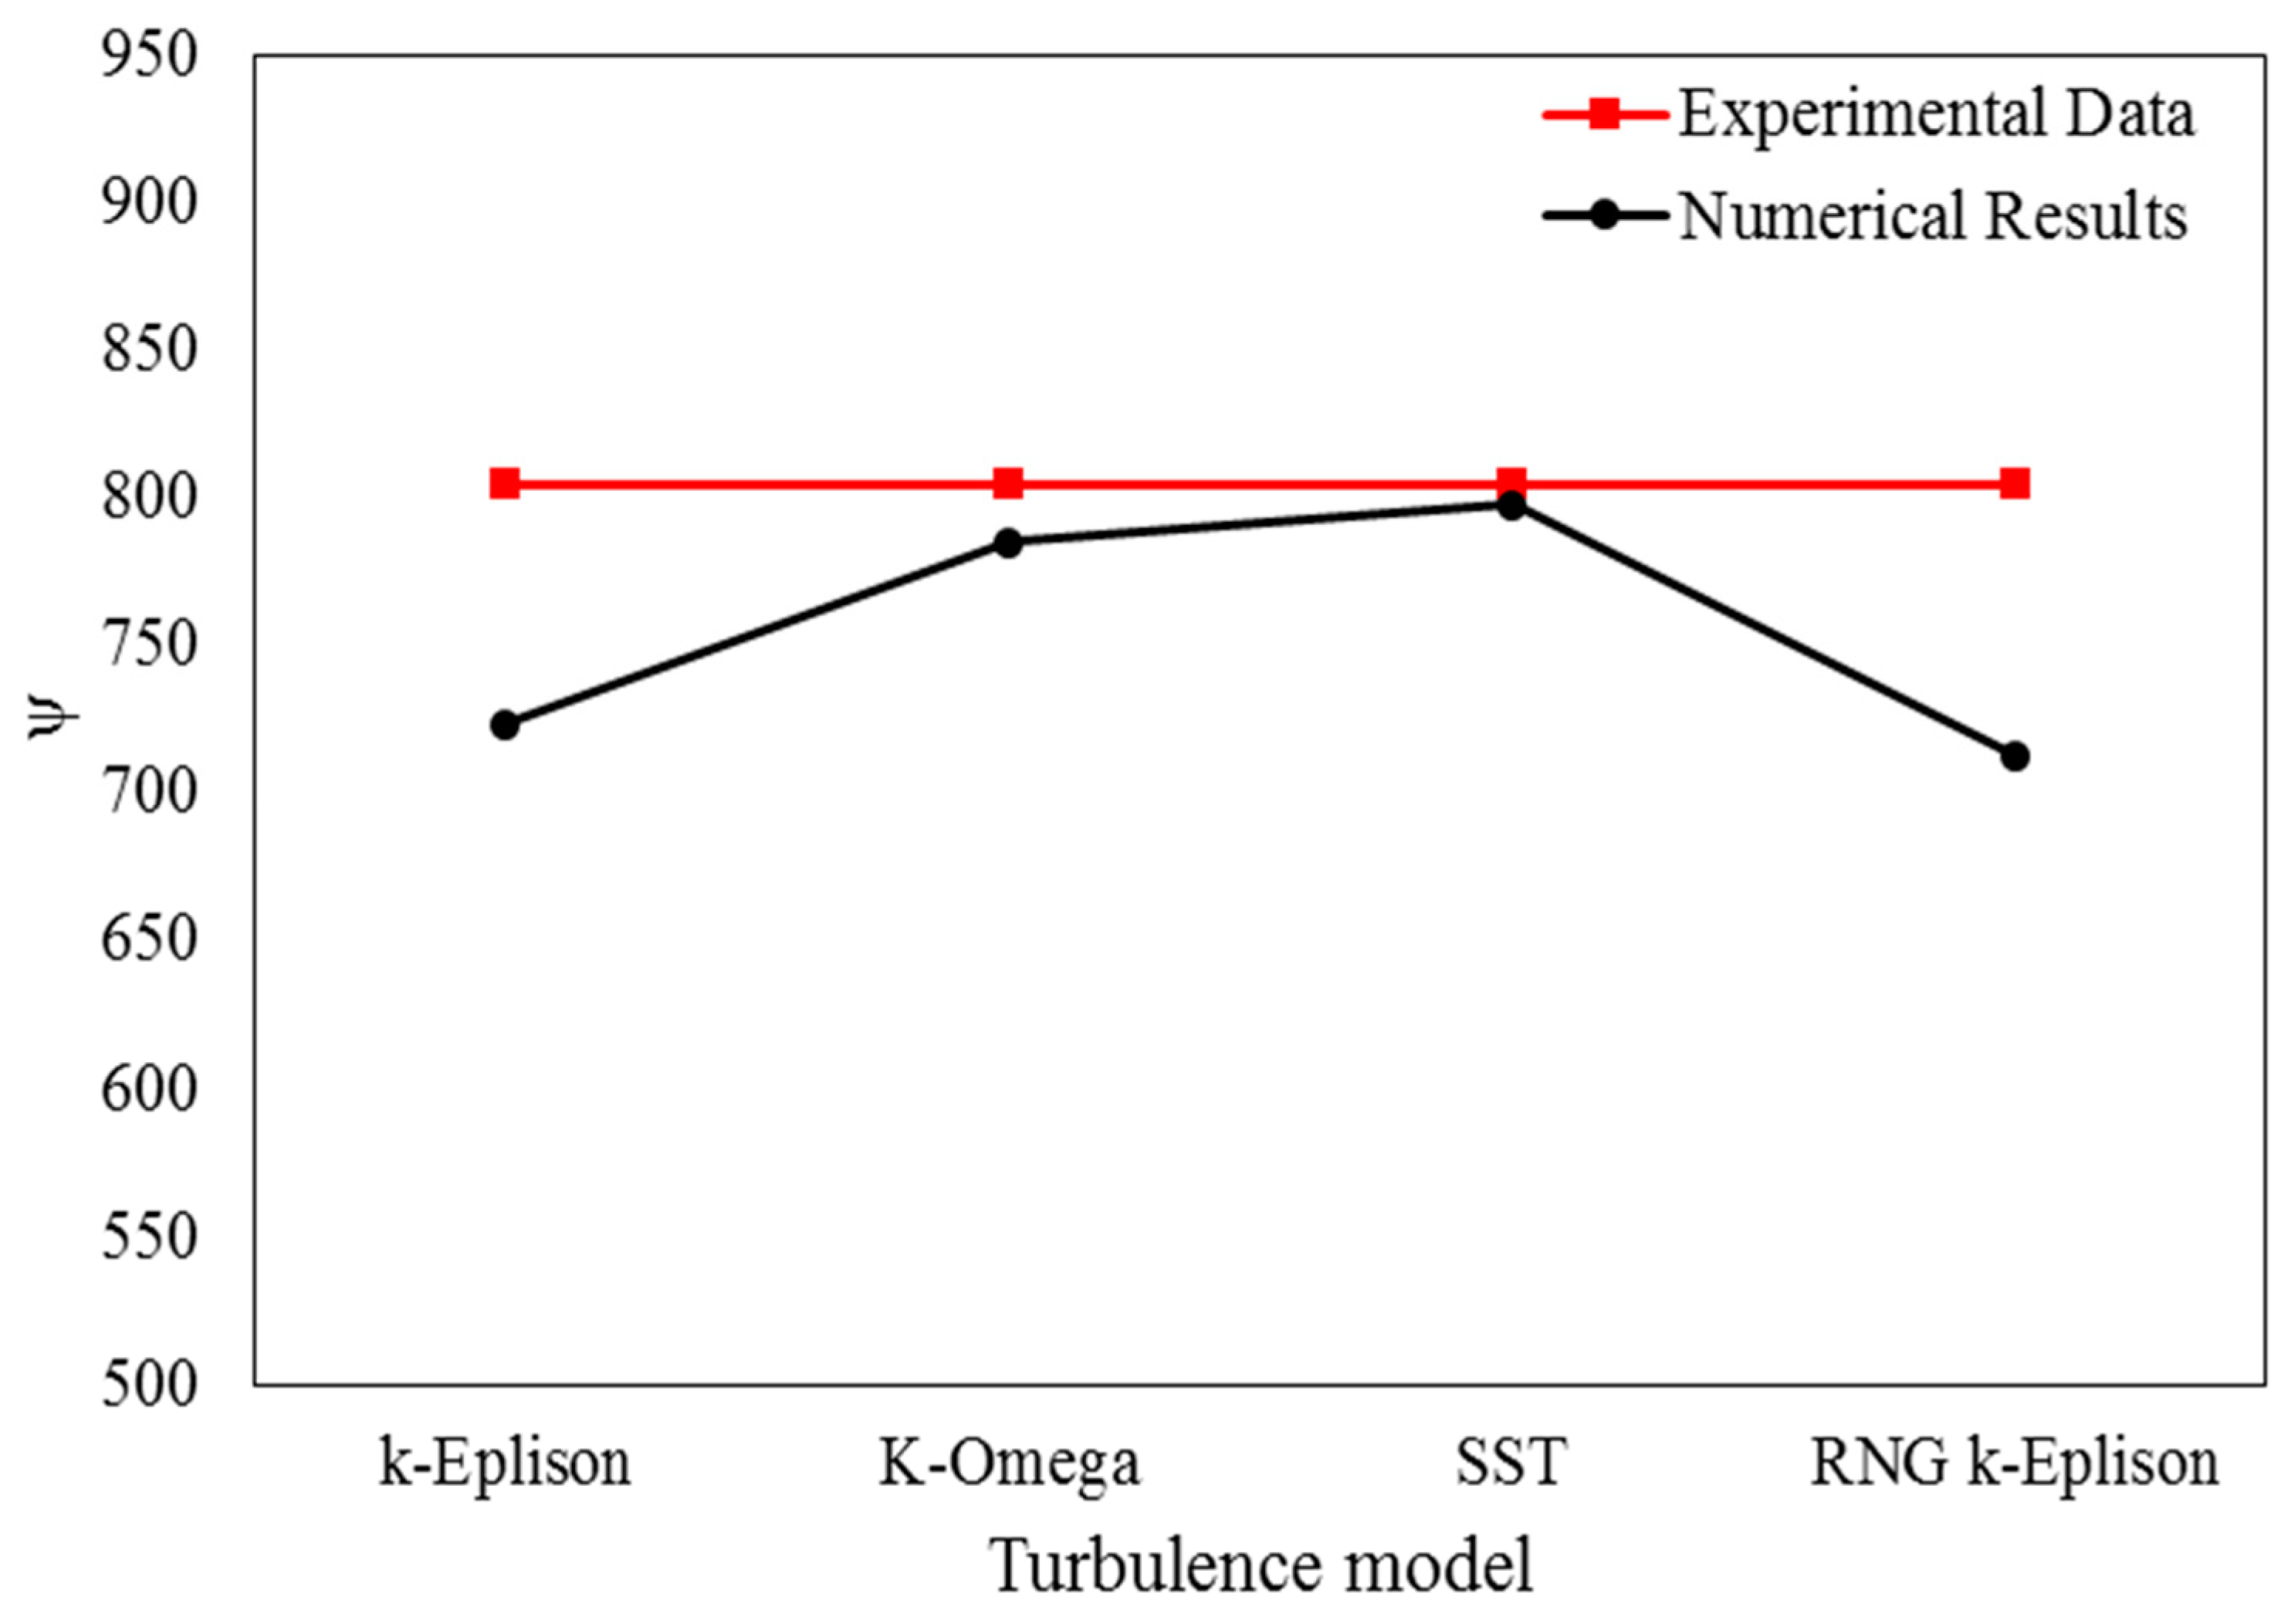
Four types of turbulence models (k-ε, SST, RNG k-ε, k-ω) are considered for simulation and the validation. The comparison between turbulence models in velocity of 7m/s are shown in (
Figure 3). According to differences between experimental and numerical results, it can be concluded that the SST turbulence model has the best agreement than other models.
2.3. Grid Generation and Evaluation of the Numerical Simulation
The performance conditions which are elaborated in
Table 2 [
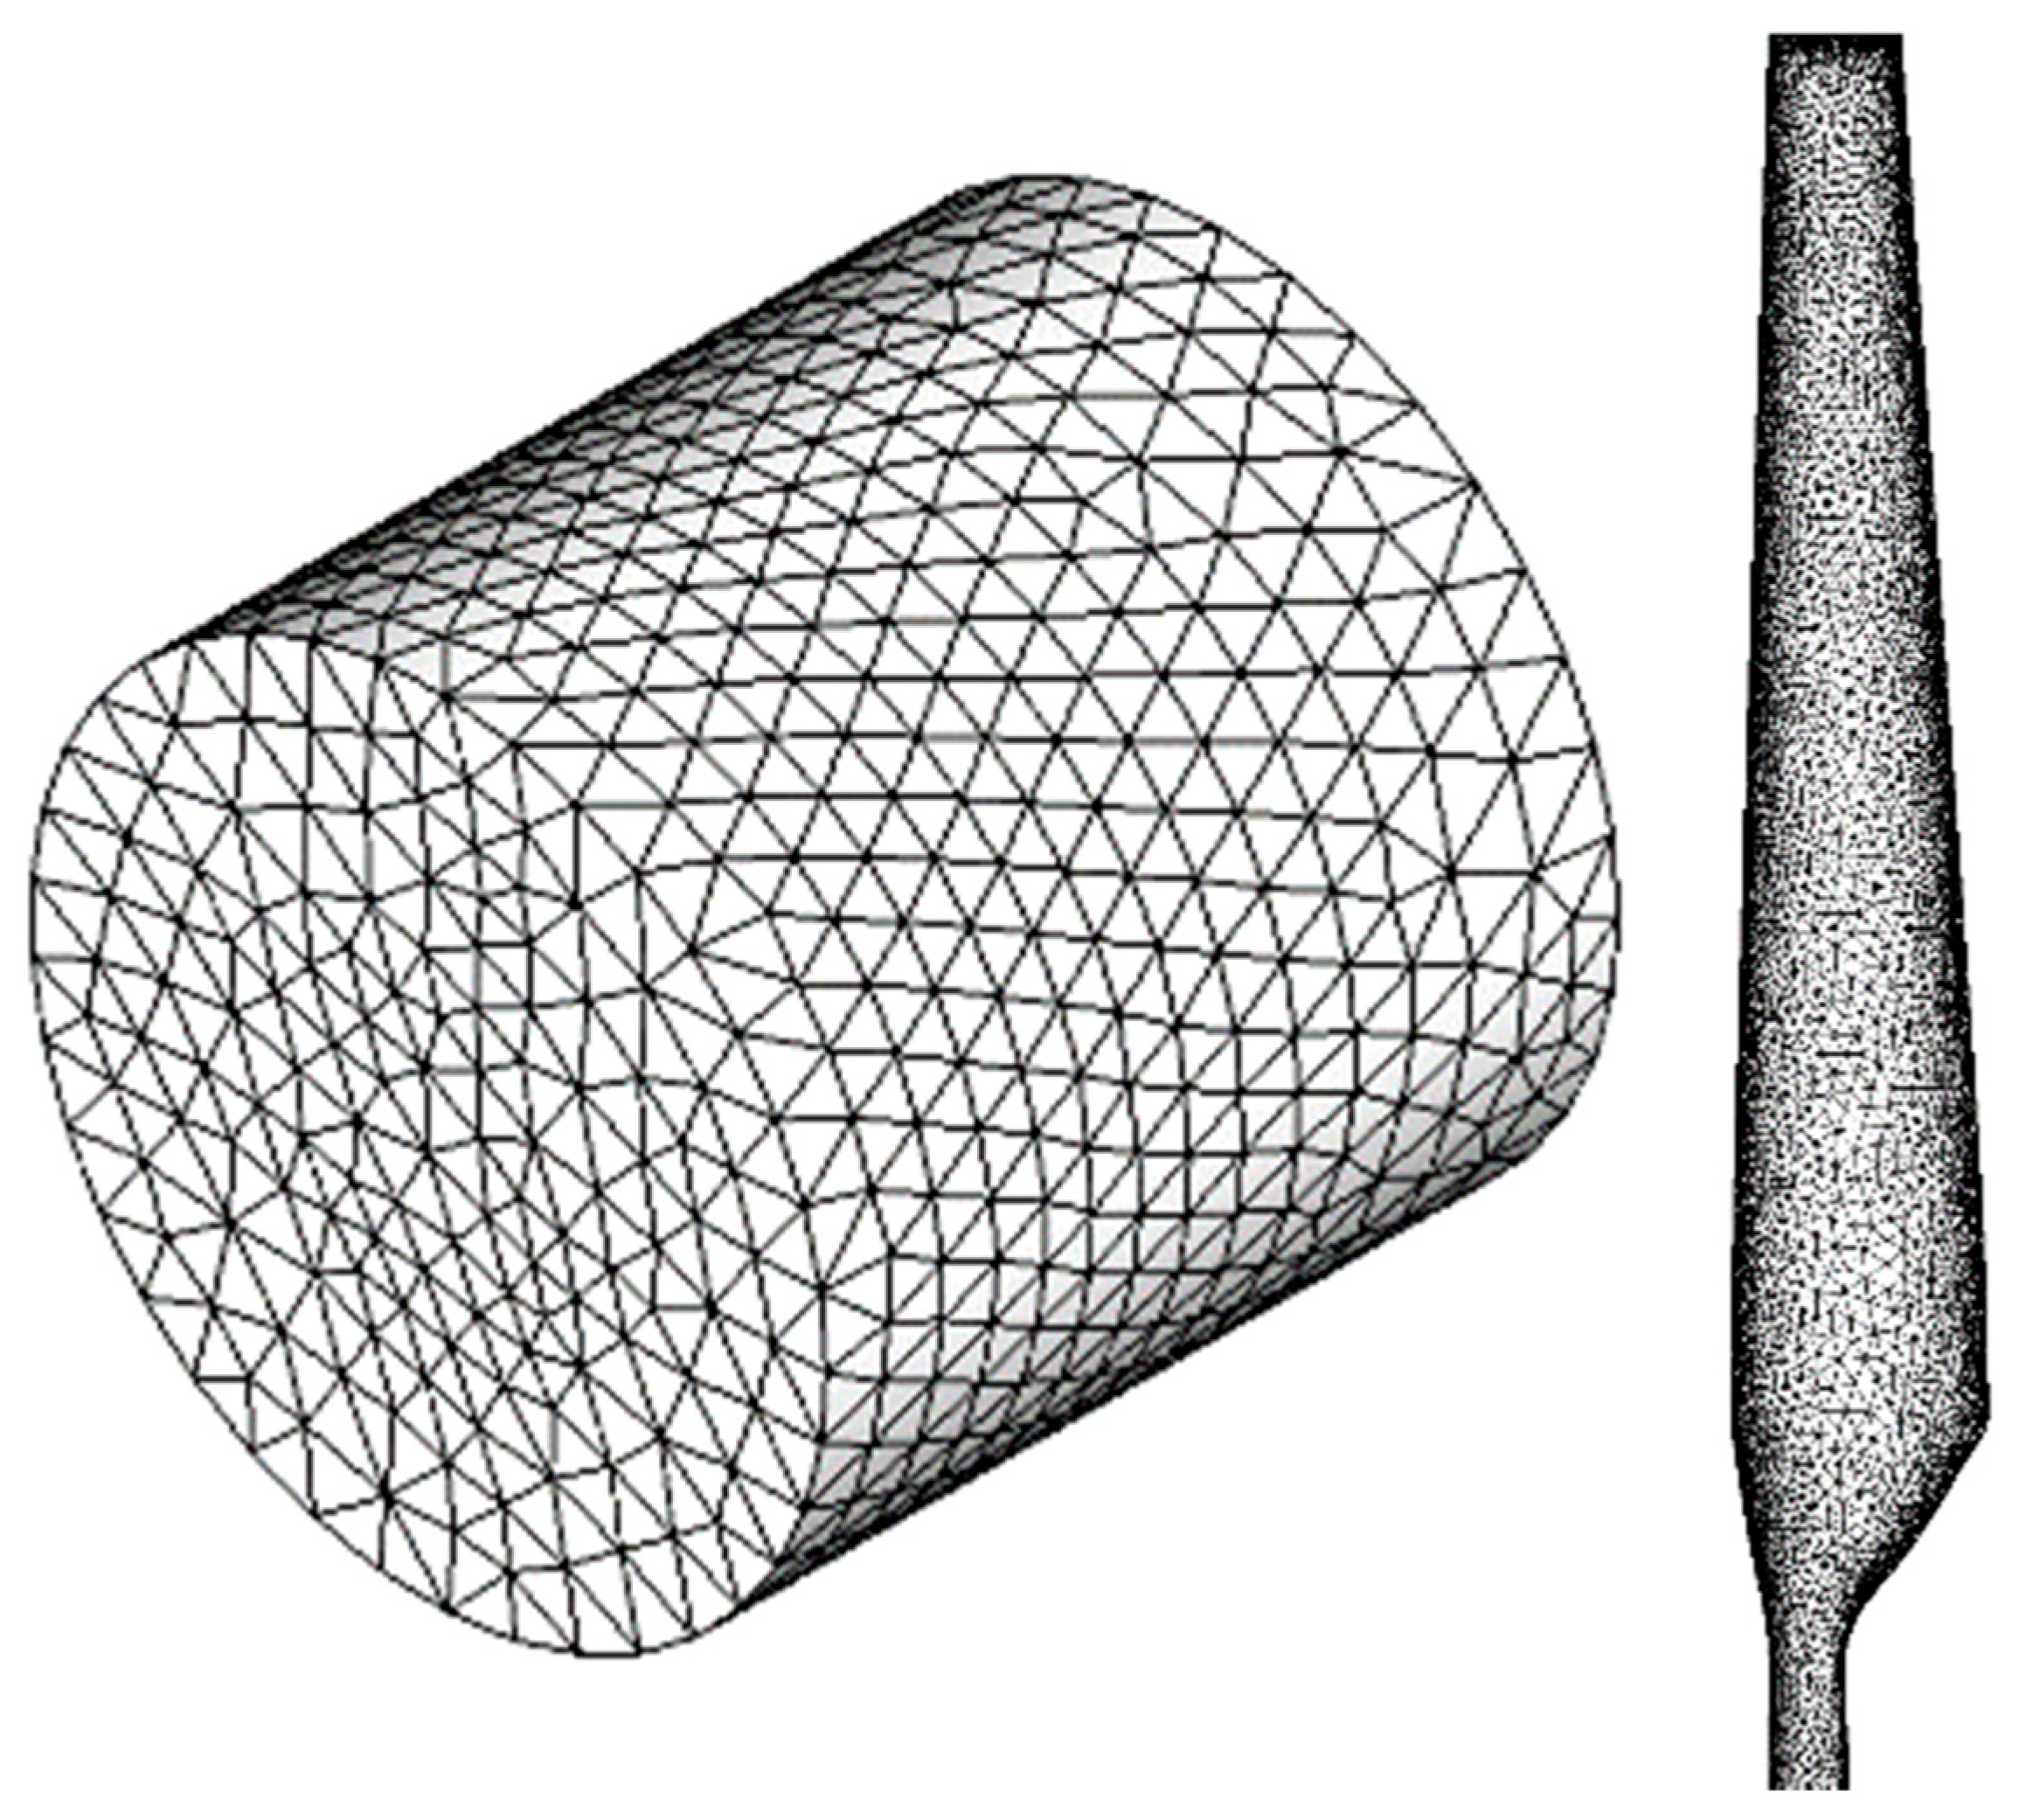
28] are implemented for simulating. The tetrahedral unstructured elements are considered for the axial wind turbine (
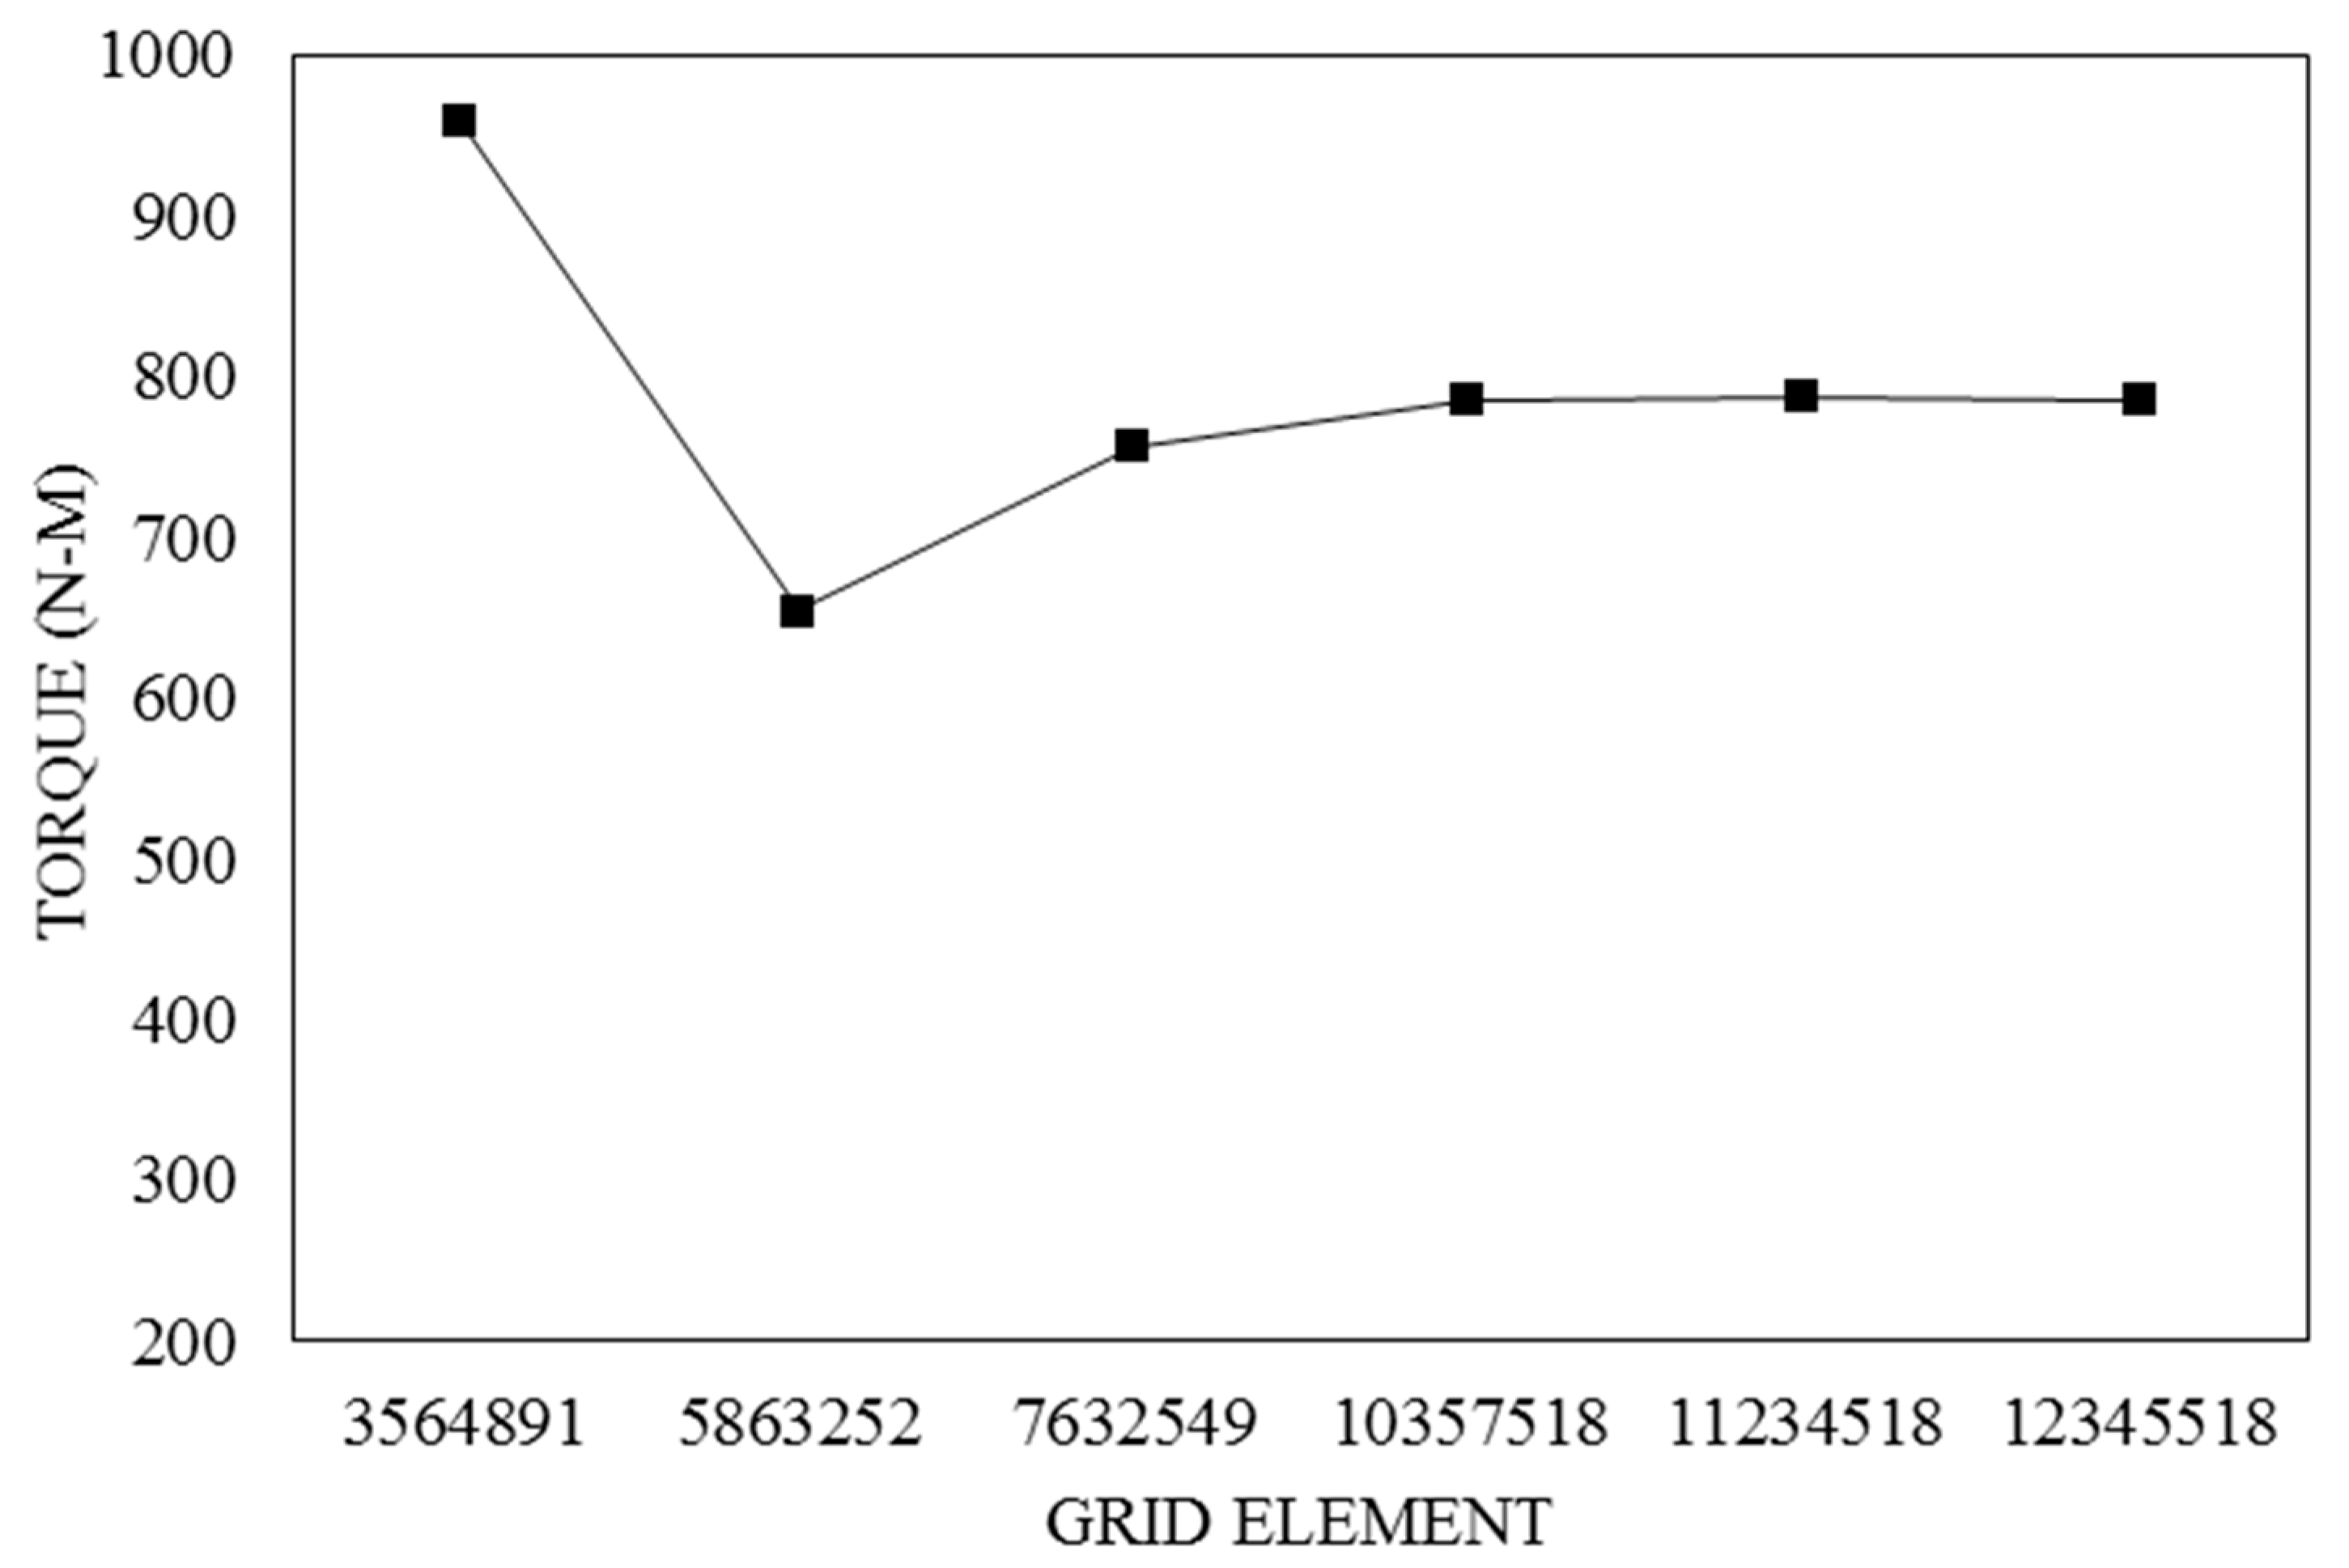
Figure 5). To study the grid independency, the governing equations for different numbers of grids are solved and the results of numerical simulation for the axial wind turbine torque are displayed in
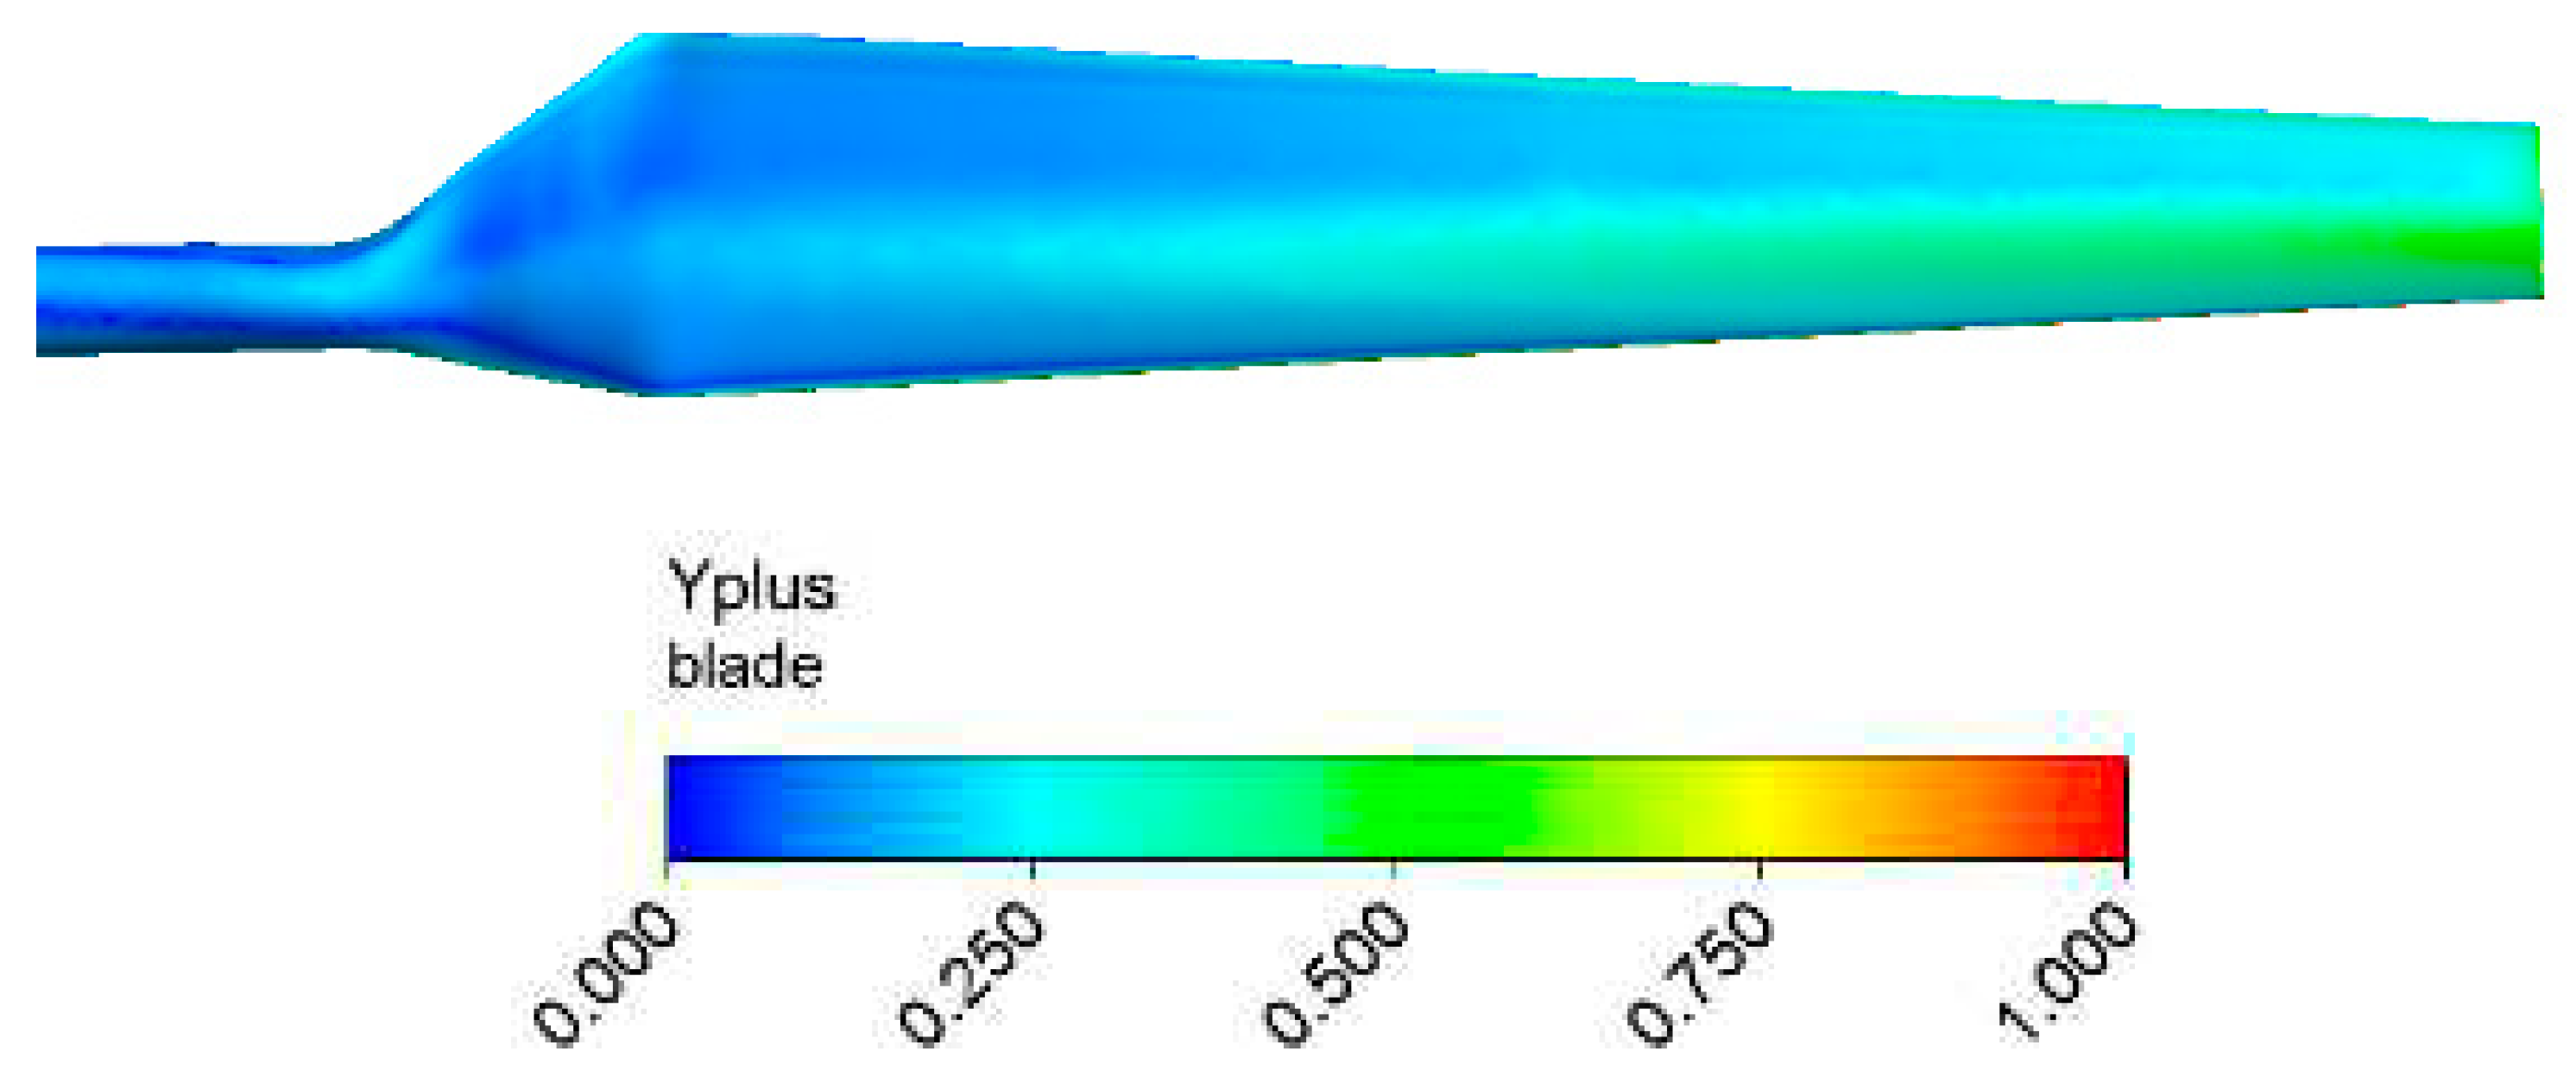
Figure 5. As listed, by considering 10357518 cells, no change in torque can be observed. Therefore the grid with this number of cells is used for numerical simulation. Also, 20 layers are considered in the boundary layer that has 10
-6 m in the first layer and the value of
Y+ is lower than one (
Figure 6).
3. Evaluation of the Numerical Model
In order to investigate the aerodynamic performance of the blades which are installed on a wind turbine, various tests are done. Investigating the tip blade vortexes that its results are evaluated in the following has direct effects on its power ratio. In addition, the vortexes which are formed behind the wind turbine is evaluated by the CFD method and compared with wind tunnel results. In the following CFD results are checked by experimental data at first then the effect of sand particless sizes on the performance of a real sized wind turbine is studied in different variables.
3.1. Numerical Simulation under Clean air Condition (Single Phase)
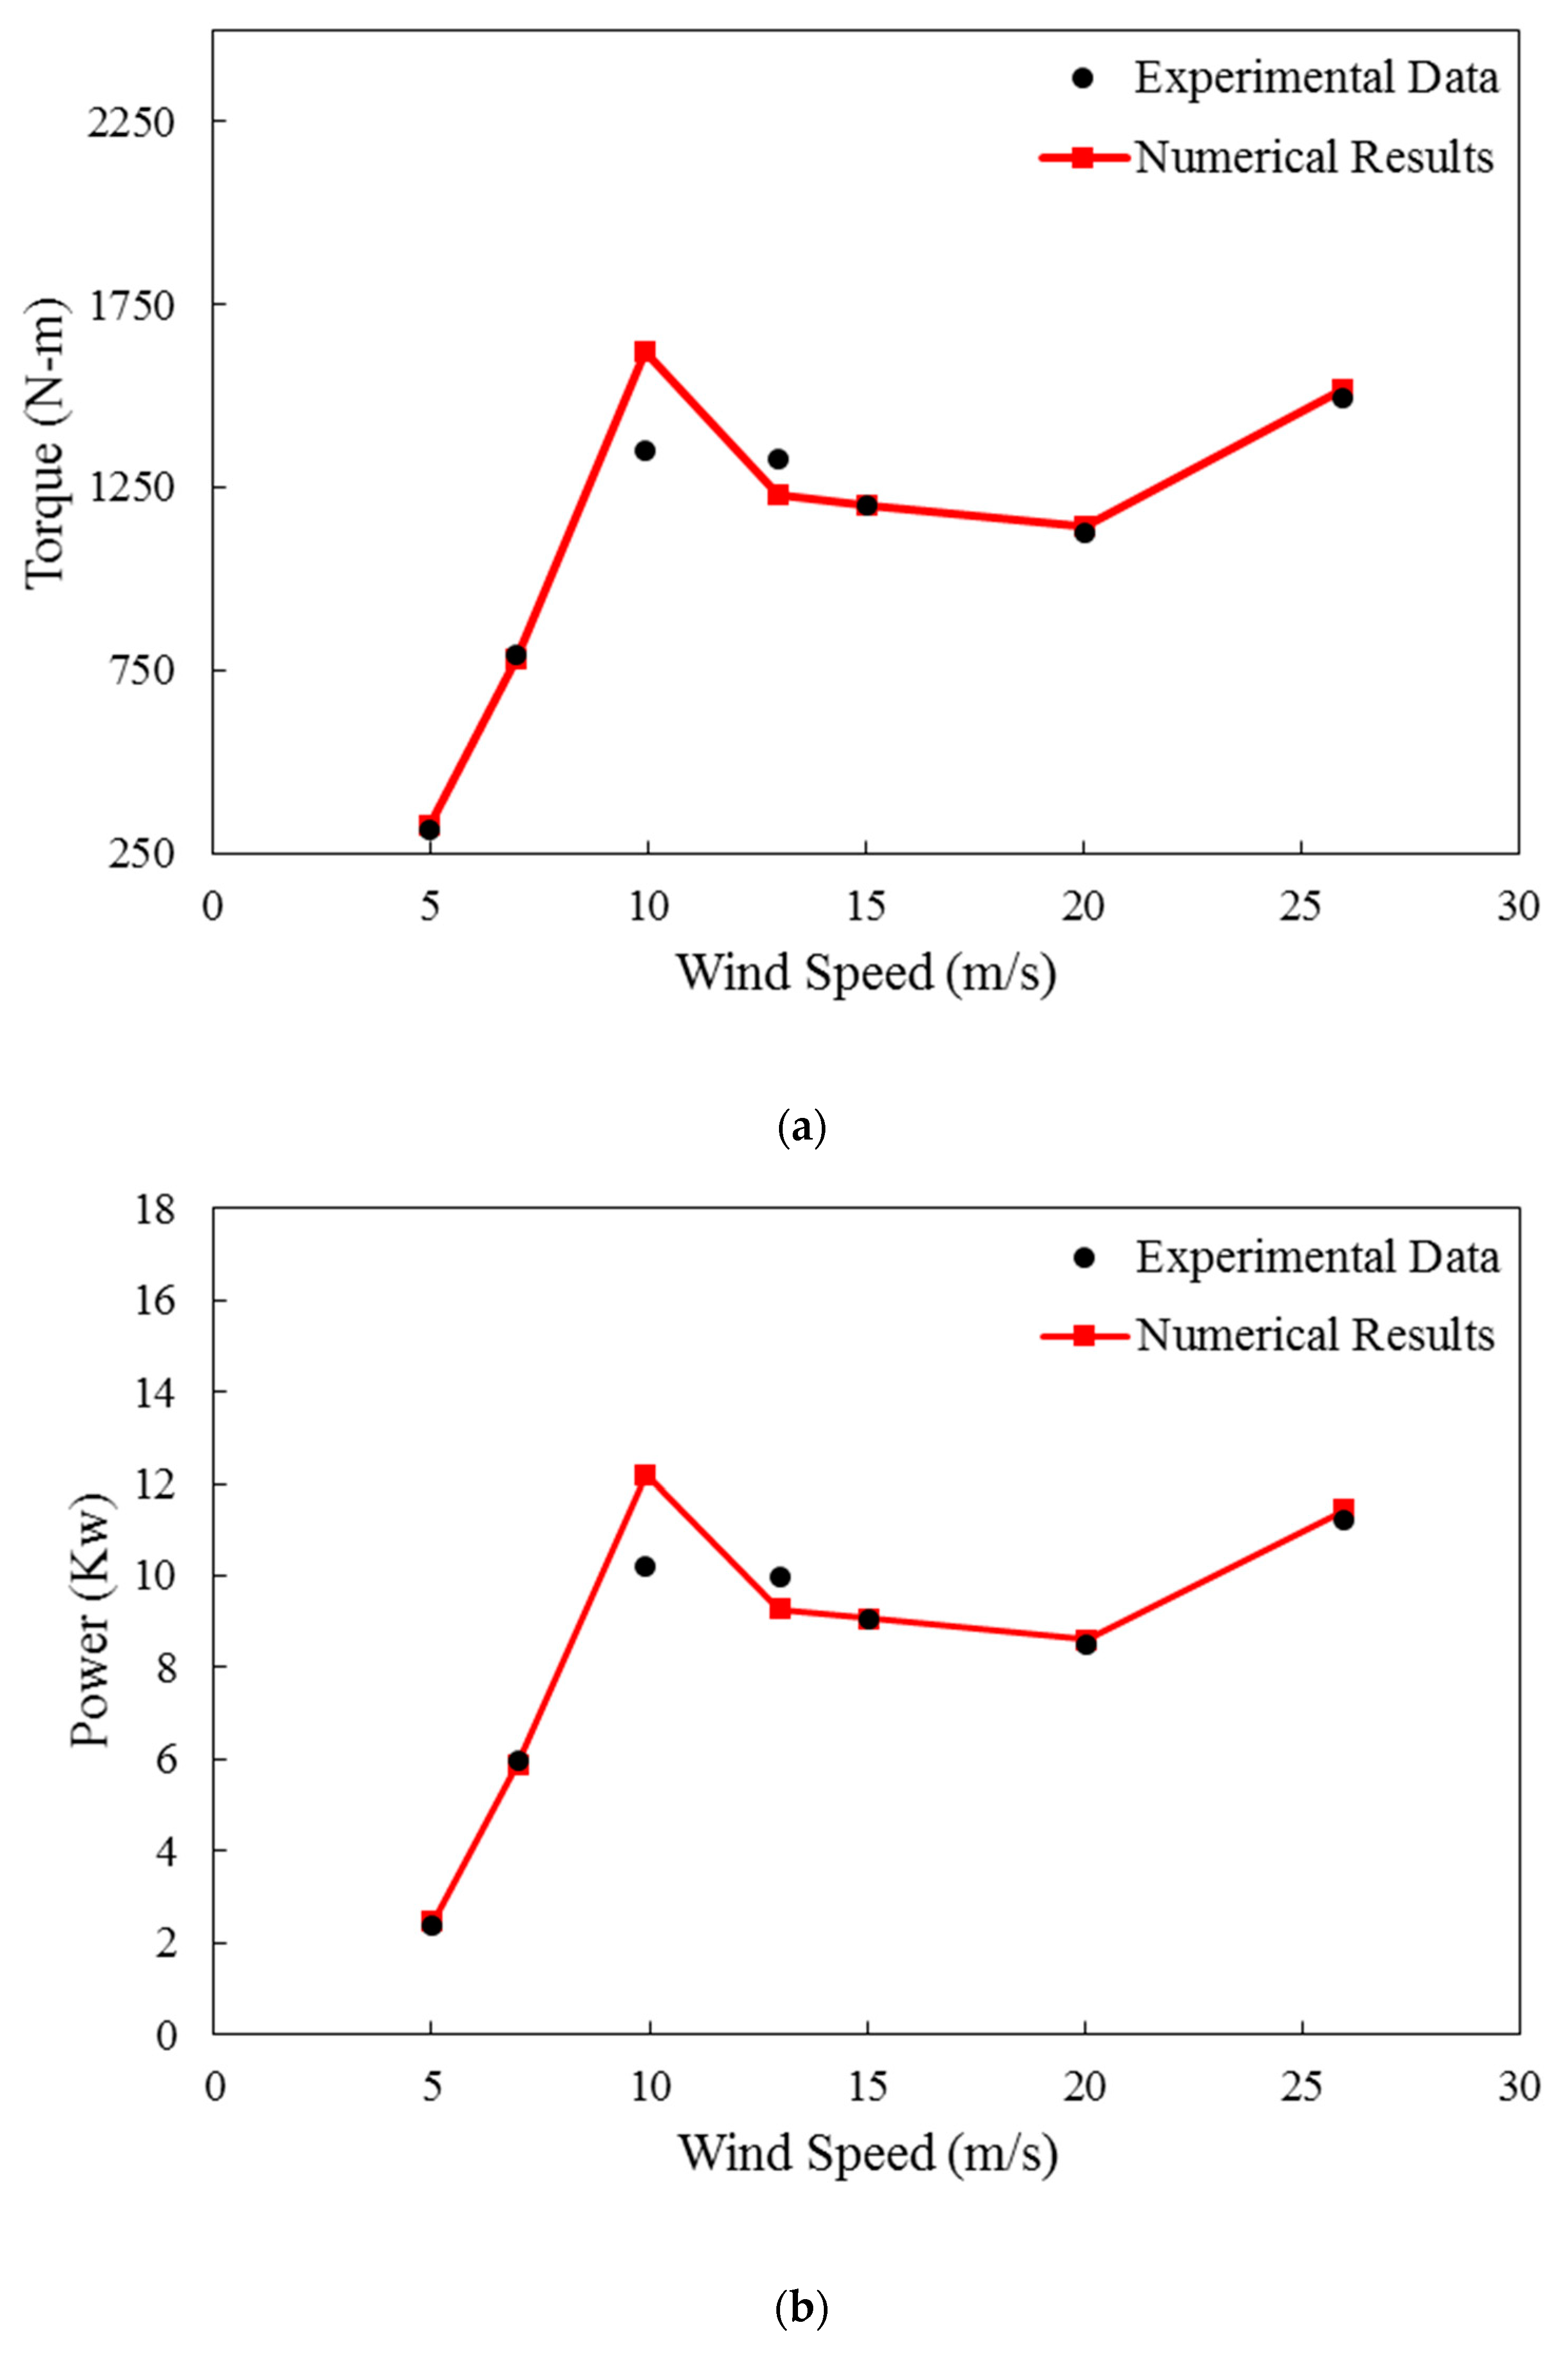
Results of single-phase flow simulations are presented in
Figure 7a,b in terms of mechanical power and torque against wind velocity. These results are compared with empirical results. It is understandable that the designed framework has acceptable adaption with empirical results and illustrates in order mechanical power and the torque which are rooted in axial wind turbine rotation in several velocities of the wind turbine. It is obviously understandable that by increasing wind velocity more energy is transmitted through the wind to the wind turbine and the value of torque and mechanical power is increased. At almost values of the wind velocity, the discrepancy between numerical and experimental results is reliable. It is obvious in both graphs that the maximum value of the error has occurred in 10m/s for both torque and mechanical power of the axial wind turbine but the numerical results in other wind velocities, have excellent accuracy and the average error in both graphs is around 5%. Although, this region can be predicted precisely by controlling the physical time step and solution convergence. This leads to the conclusion that mechanical power is mostly influenced by the axial wind turbine.
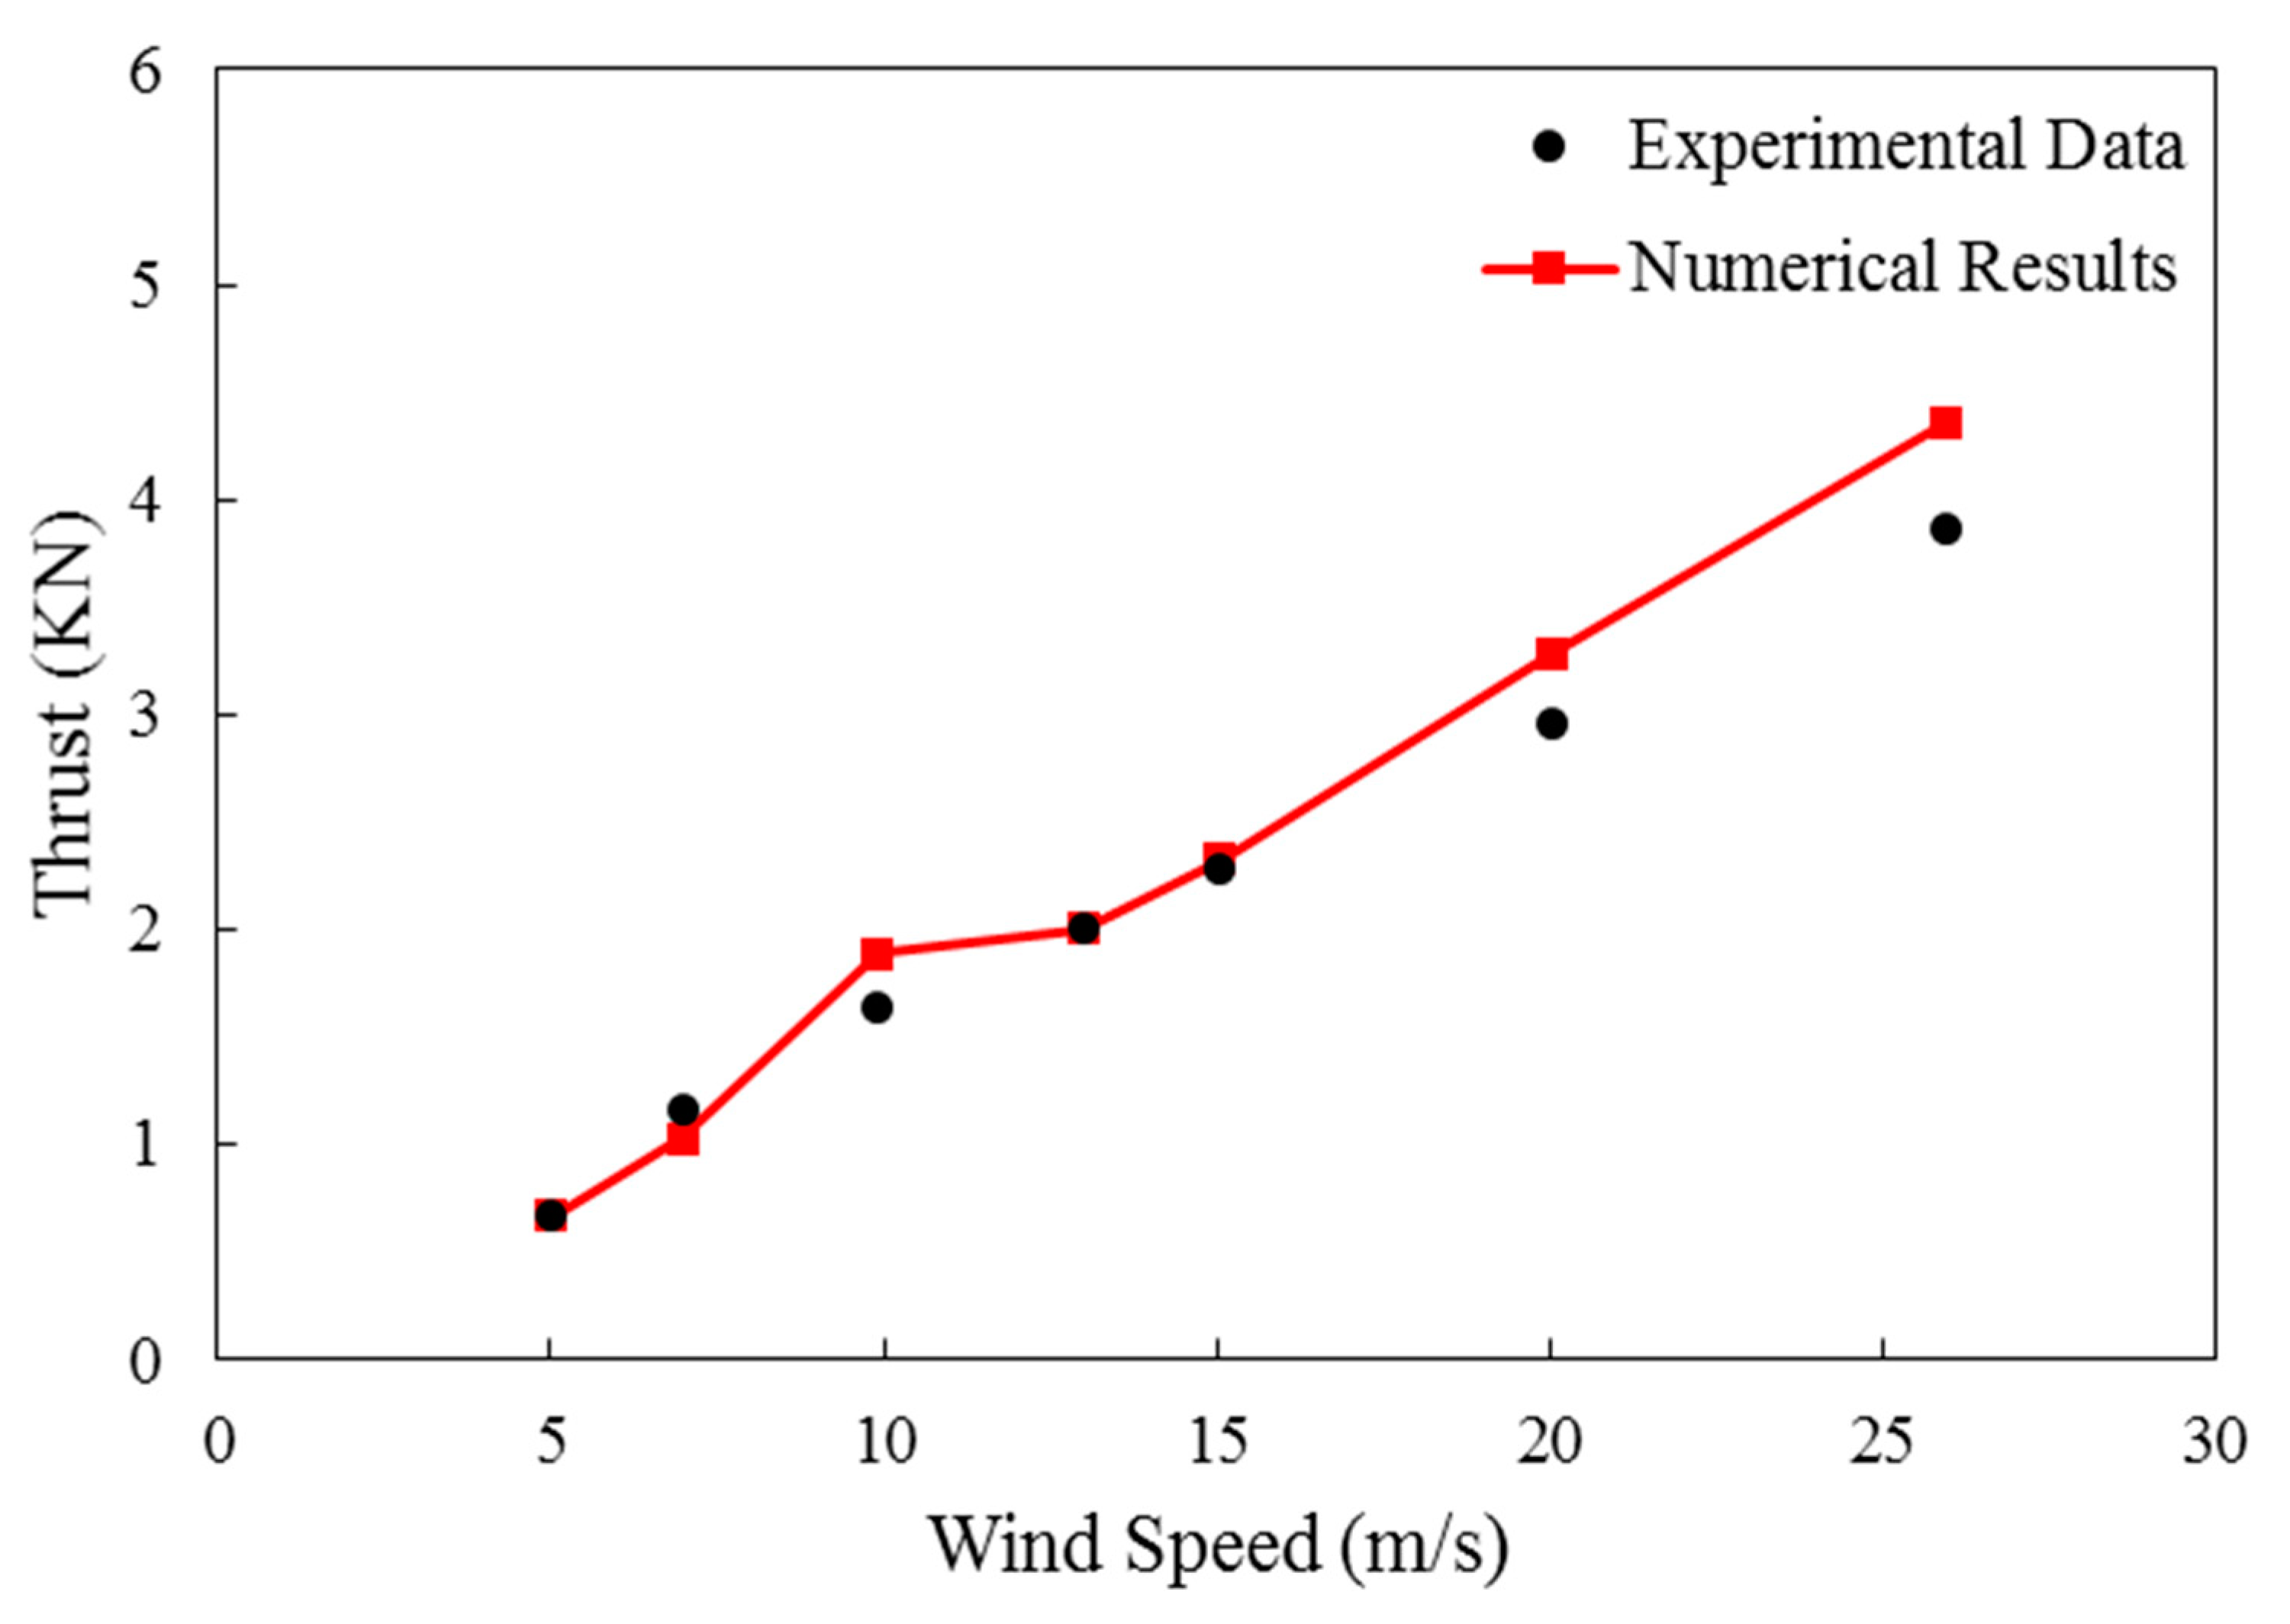
Figure 8 presented the turbine thrust which is compared with empirical results. By increasing wind velocity the value of the thrust is increased because the wind has more kinetic energy and changes the pressure distribution behind the turbine. As shown in
Figure 8, it is obvious that the accuracy of the numerical method is decreased by increasing wind velocity. As can be seen, the average value of the error is lower than 8% in this curve. According to the aforementioned descriptions, the steady case is studied by computational fluid dynamics method in various velocities.
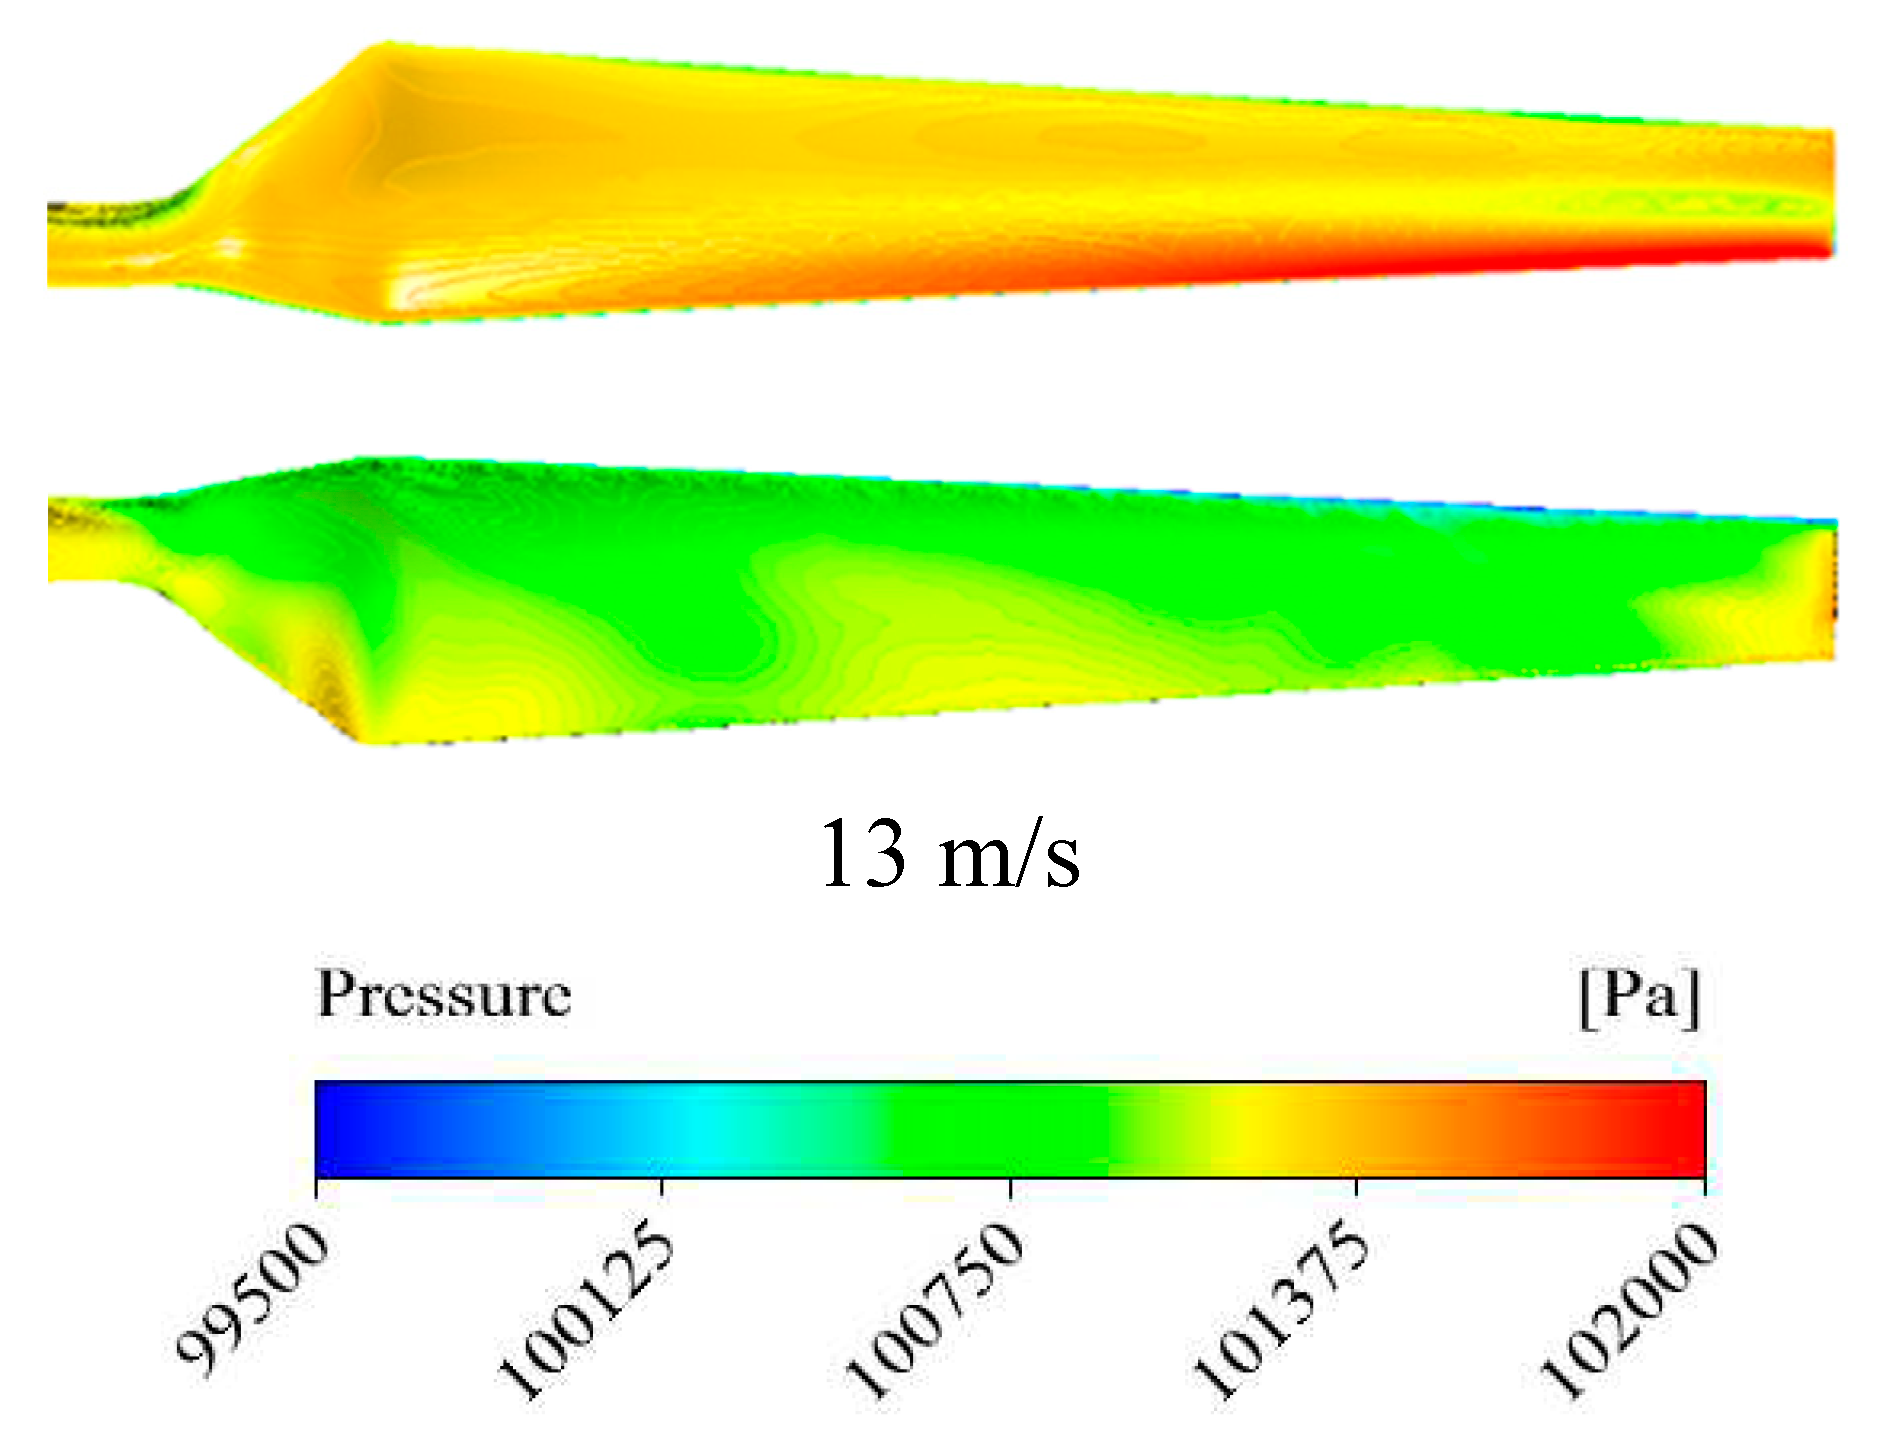
As shown in
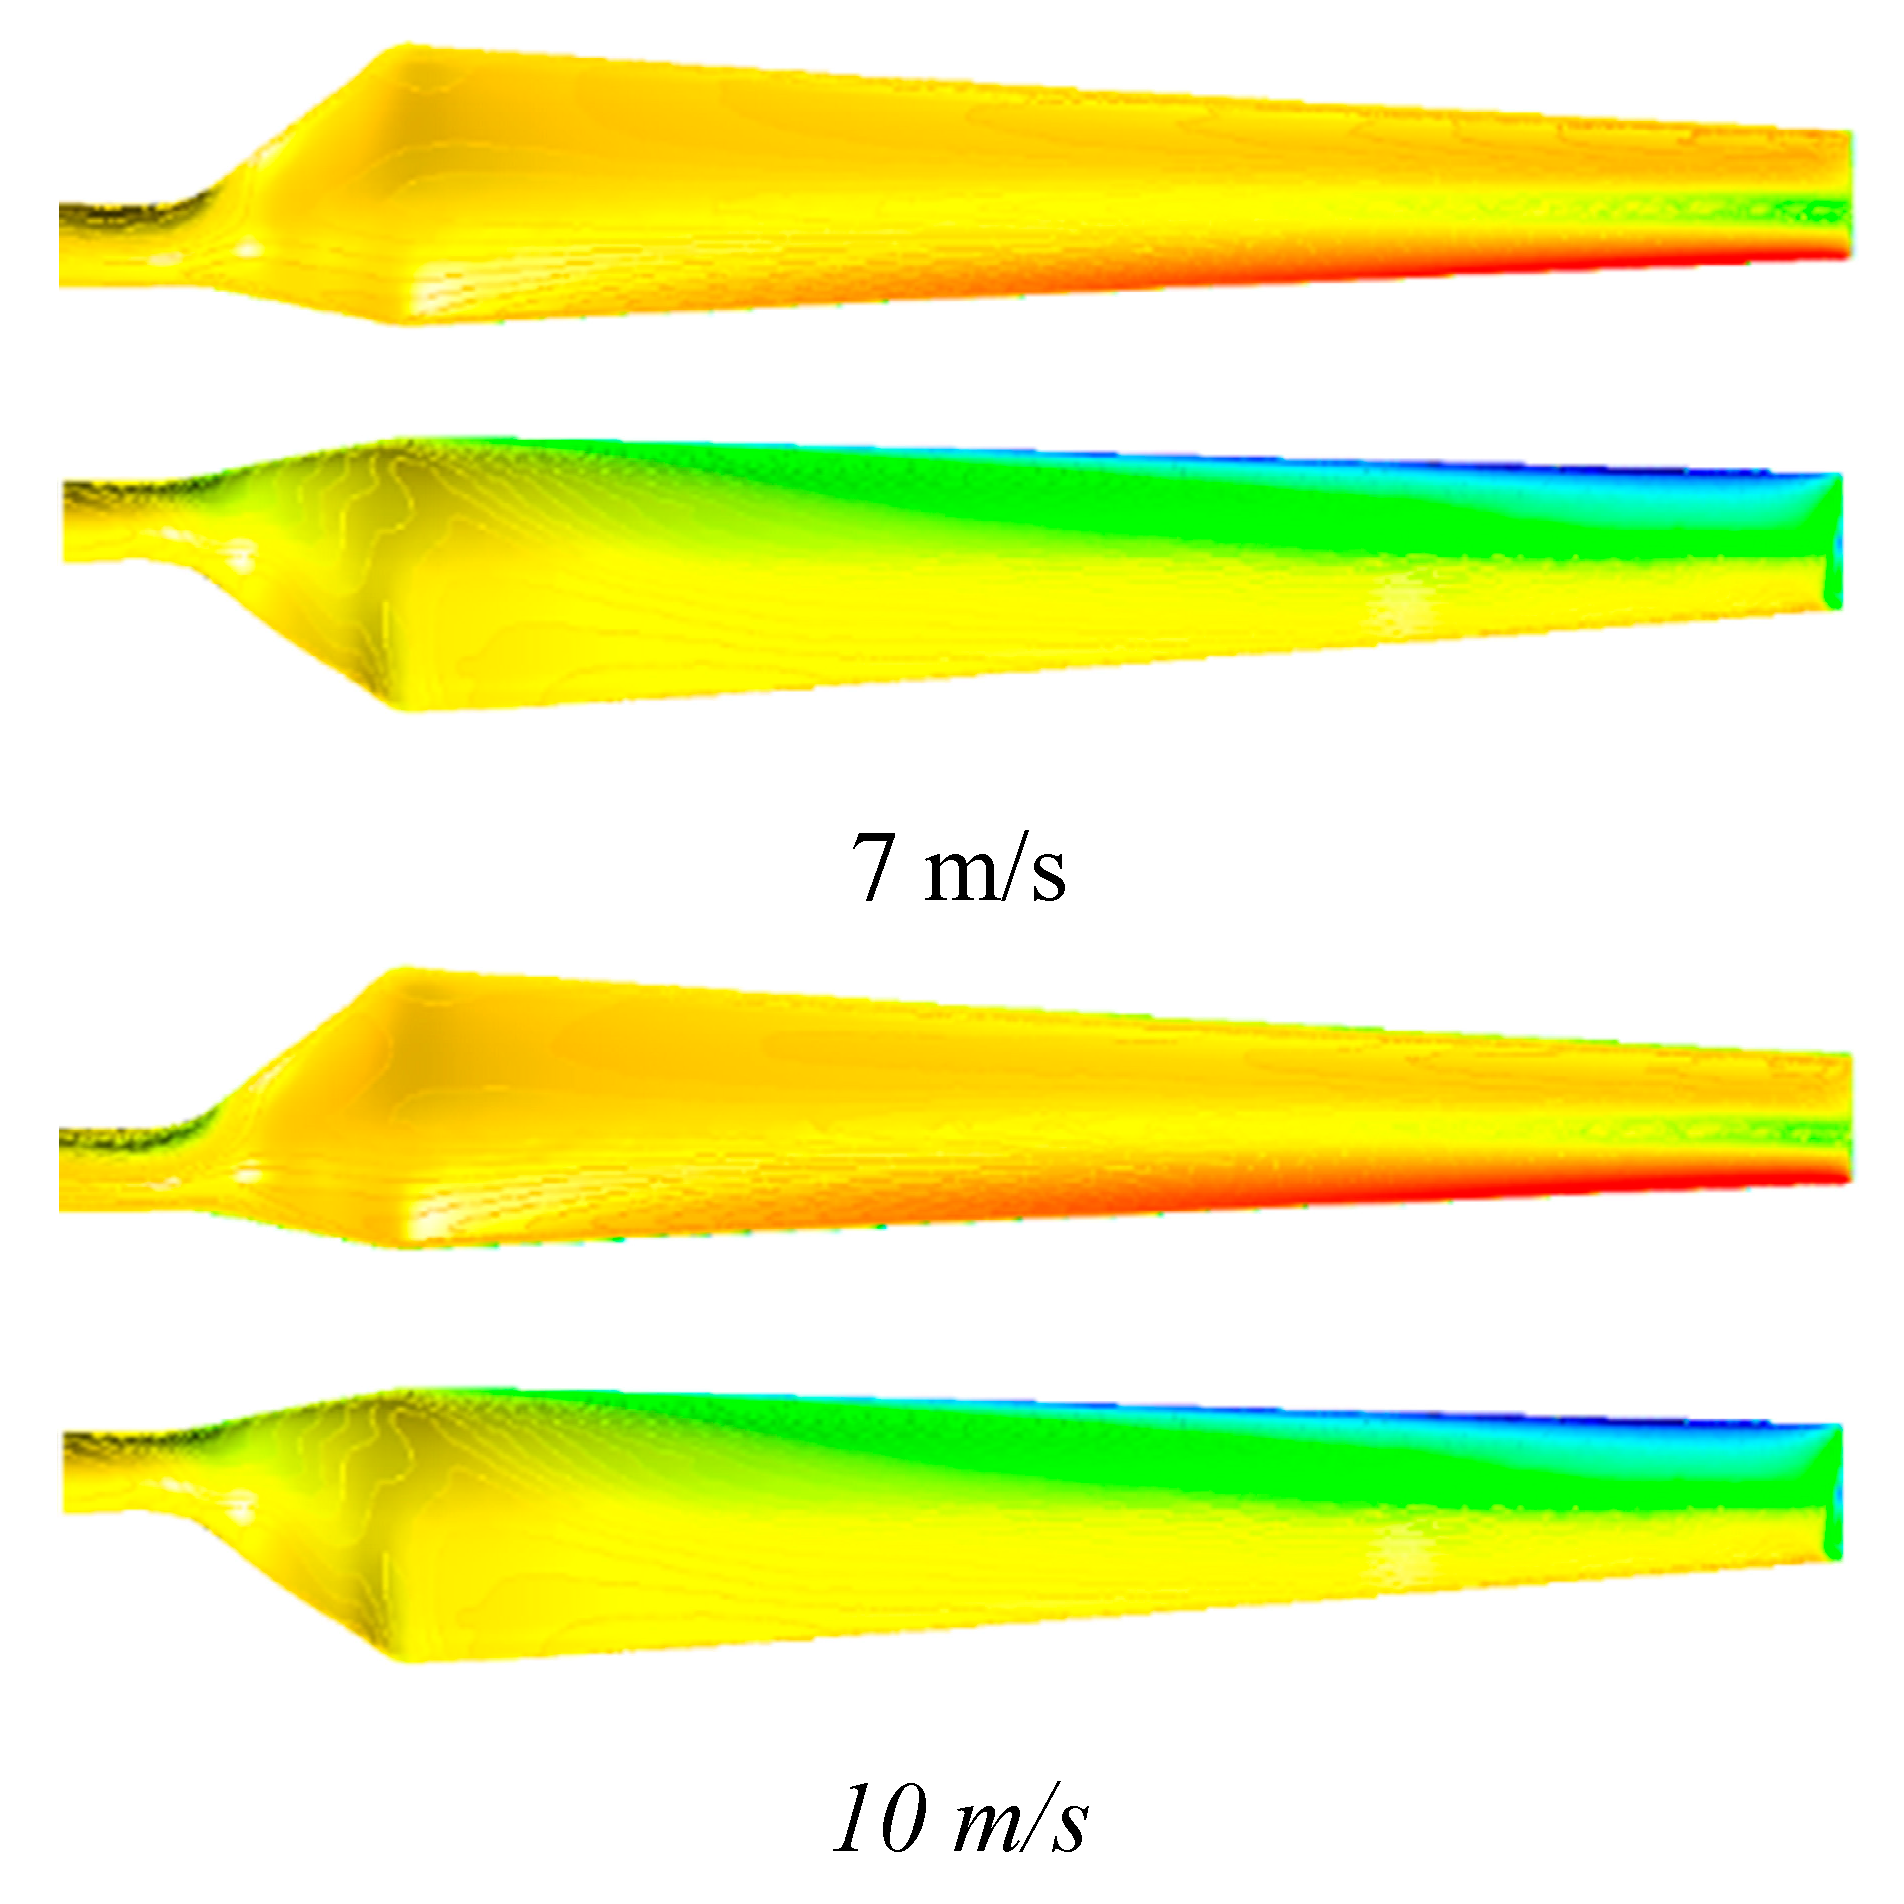
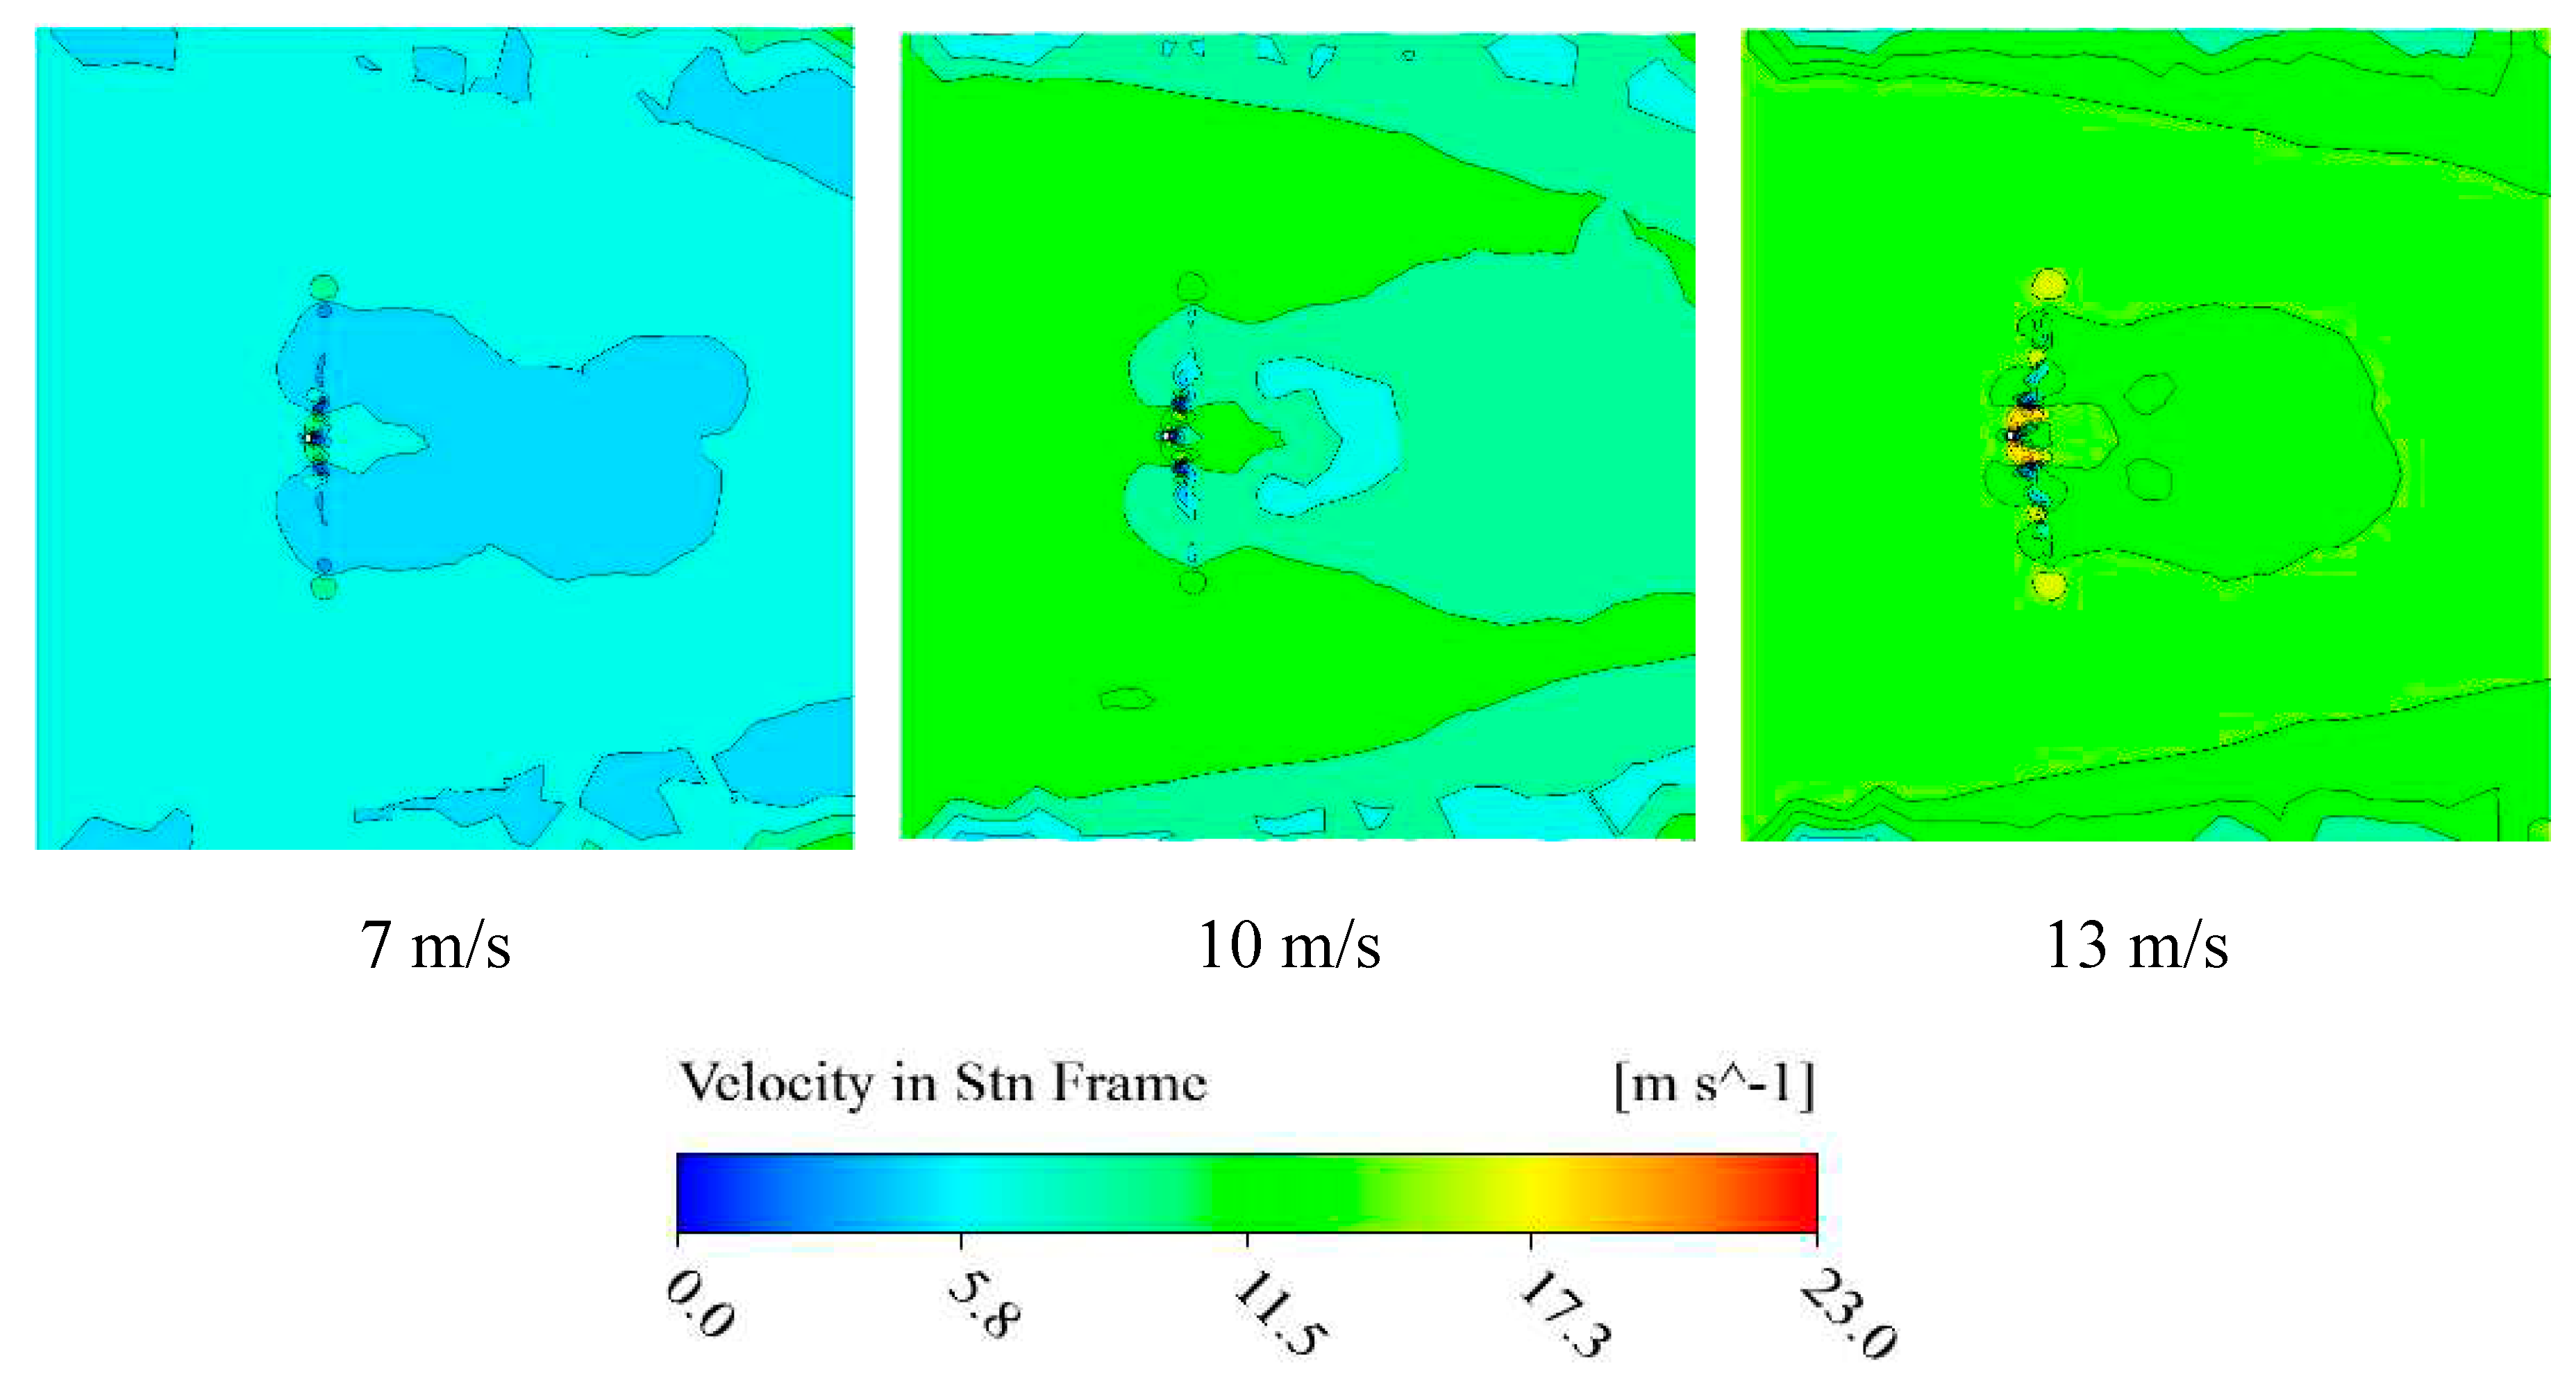
Figure 9 the pressure distributions of suction and pressure sides of wind turbine blades are illustrated in 7, 10, 13m/s velocity. It is found that the maximum pressure and minimum pressure is observed in the leading edge and the tip of the blade in the suction side. As indicated, the velocity distribution on a plane that across the center of the blade is showed in
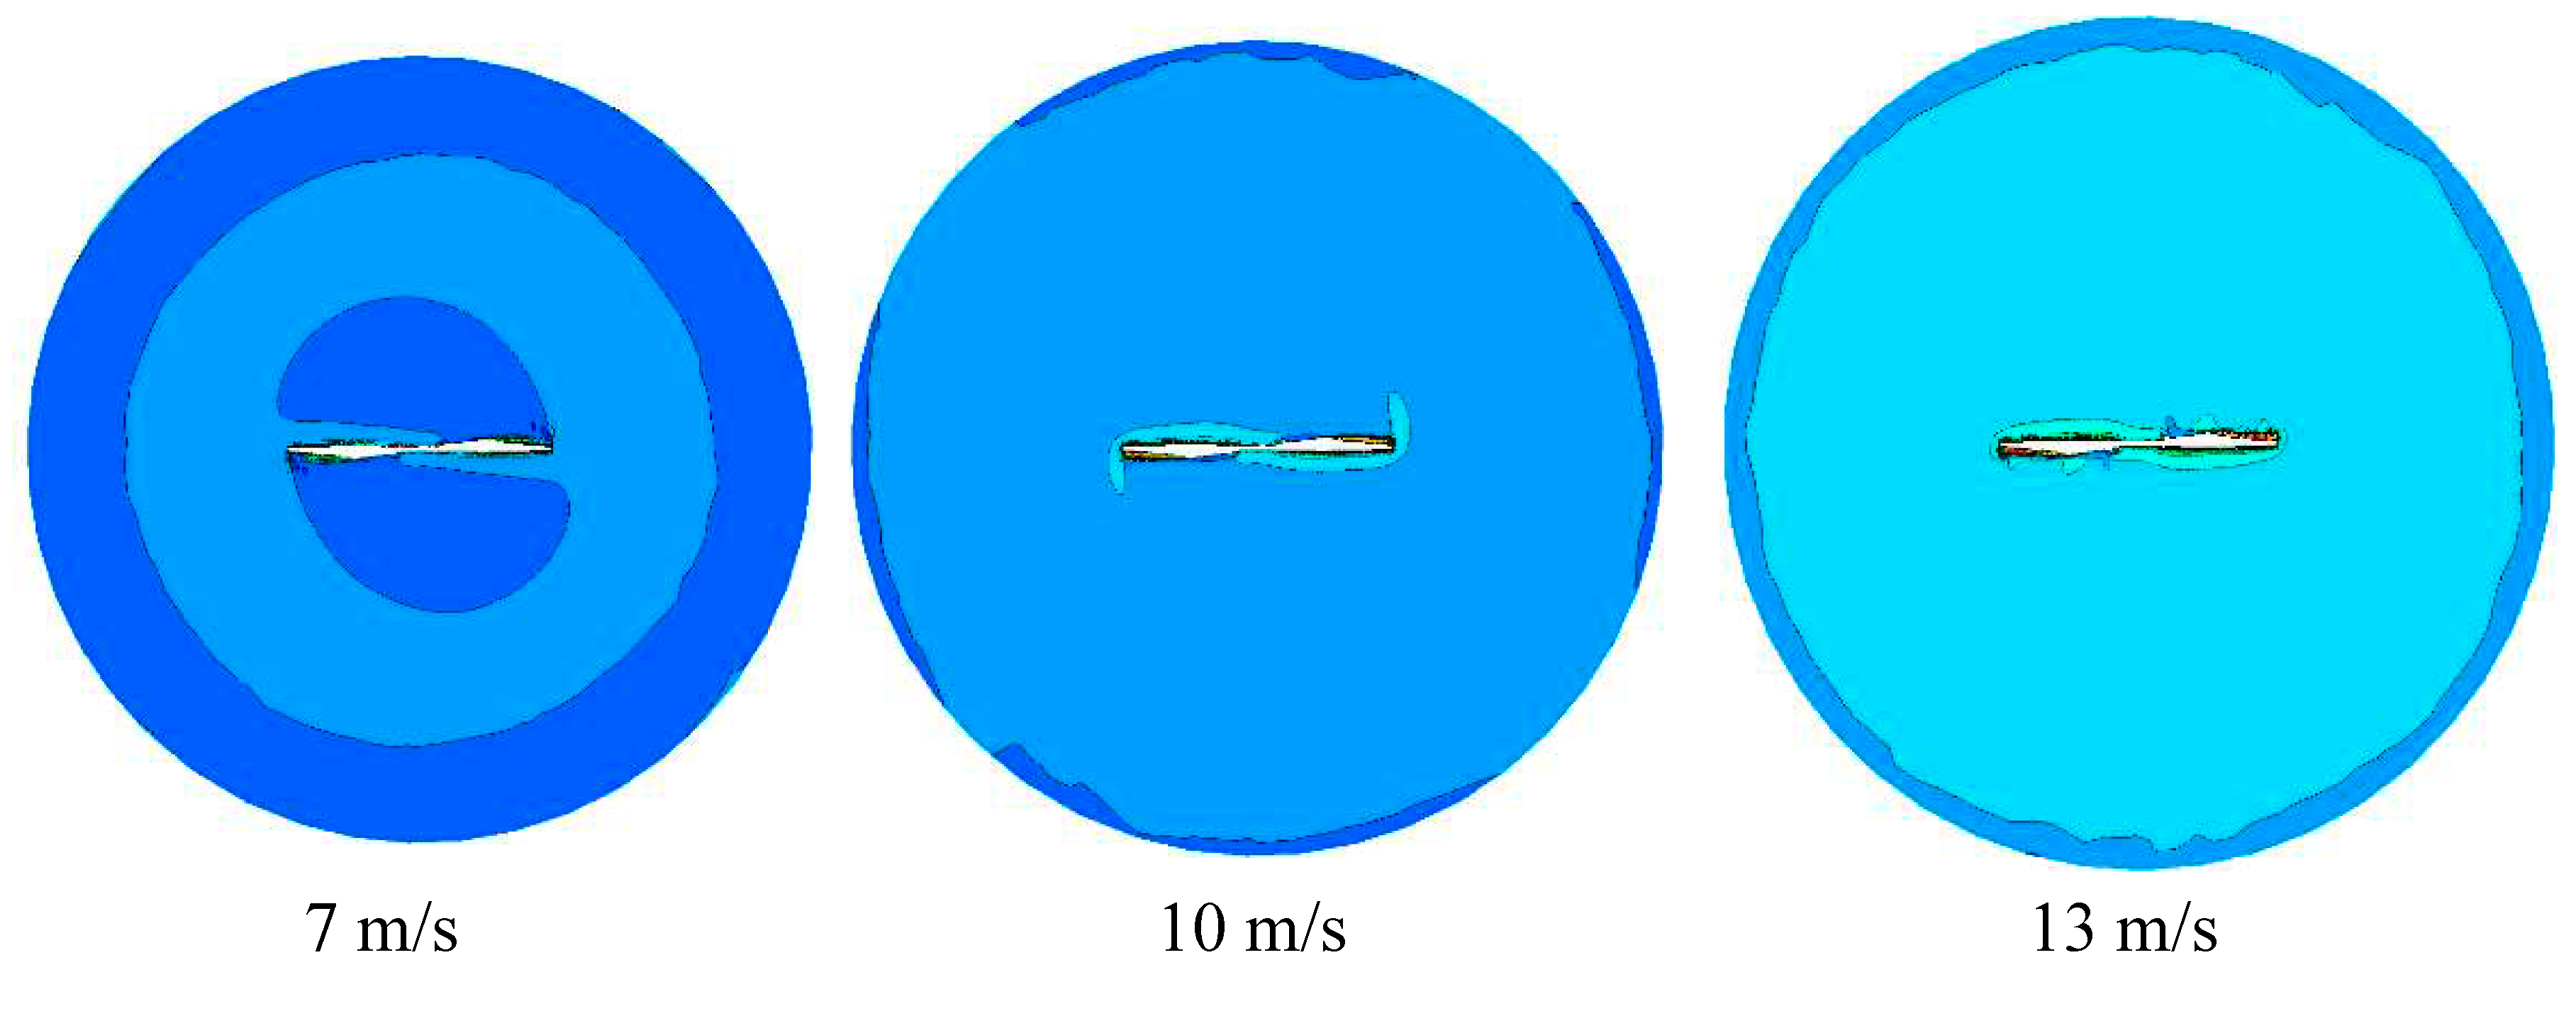
Figure 10, in addition, frontal view of the wind turbine on the plane that across the center of the wind turbine is showed in
Figure 11 that shows velocity distributions in different wind velocities 7, 10, 13 m/s. The maximum velocity is observed in tip blade and the blue region behind the turbine is related to vortexes which are produced in this region. Due to some shortcomings that exist in RANS models, the results have differences in some regions.
3.2. Numerical Simulation under Sand Particless Air Condition (Multi-Phase)
Due to the possibility of air sand particless occurrence during the axial wind performance, it is necessary to develop the numerical model to be able to consider these phenomena. As result, a multi-phase flow are applied to calculate the rate of the sand particless production. Based on the above analysis of the axial wind turbine performance under variable wind velocity the effect of sand particless size (
Dd) has been investigated. As shown in
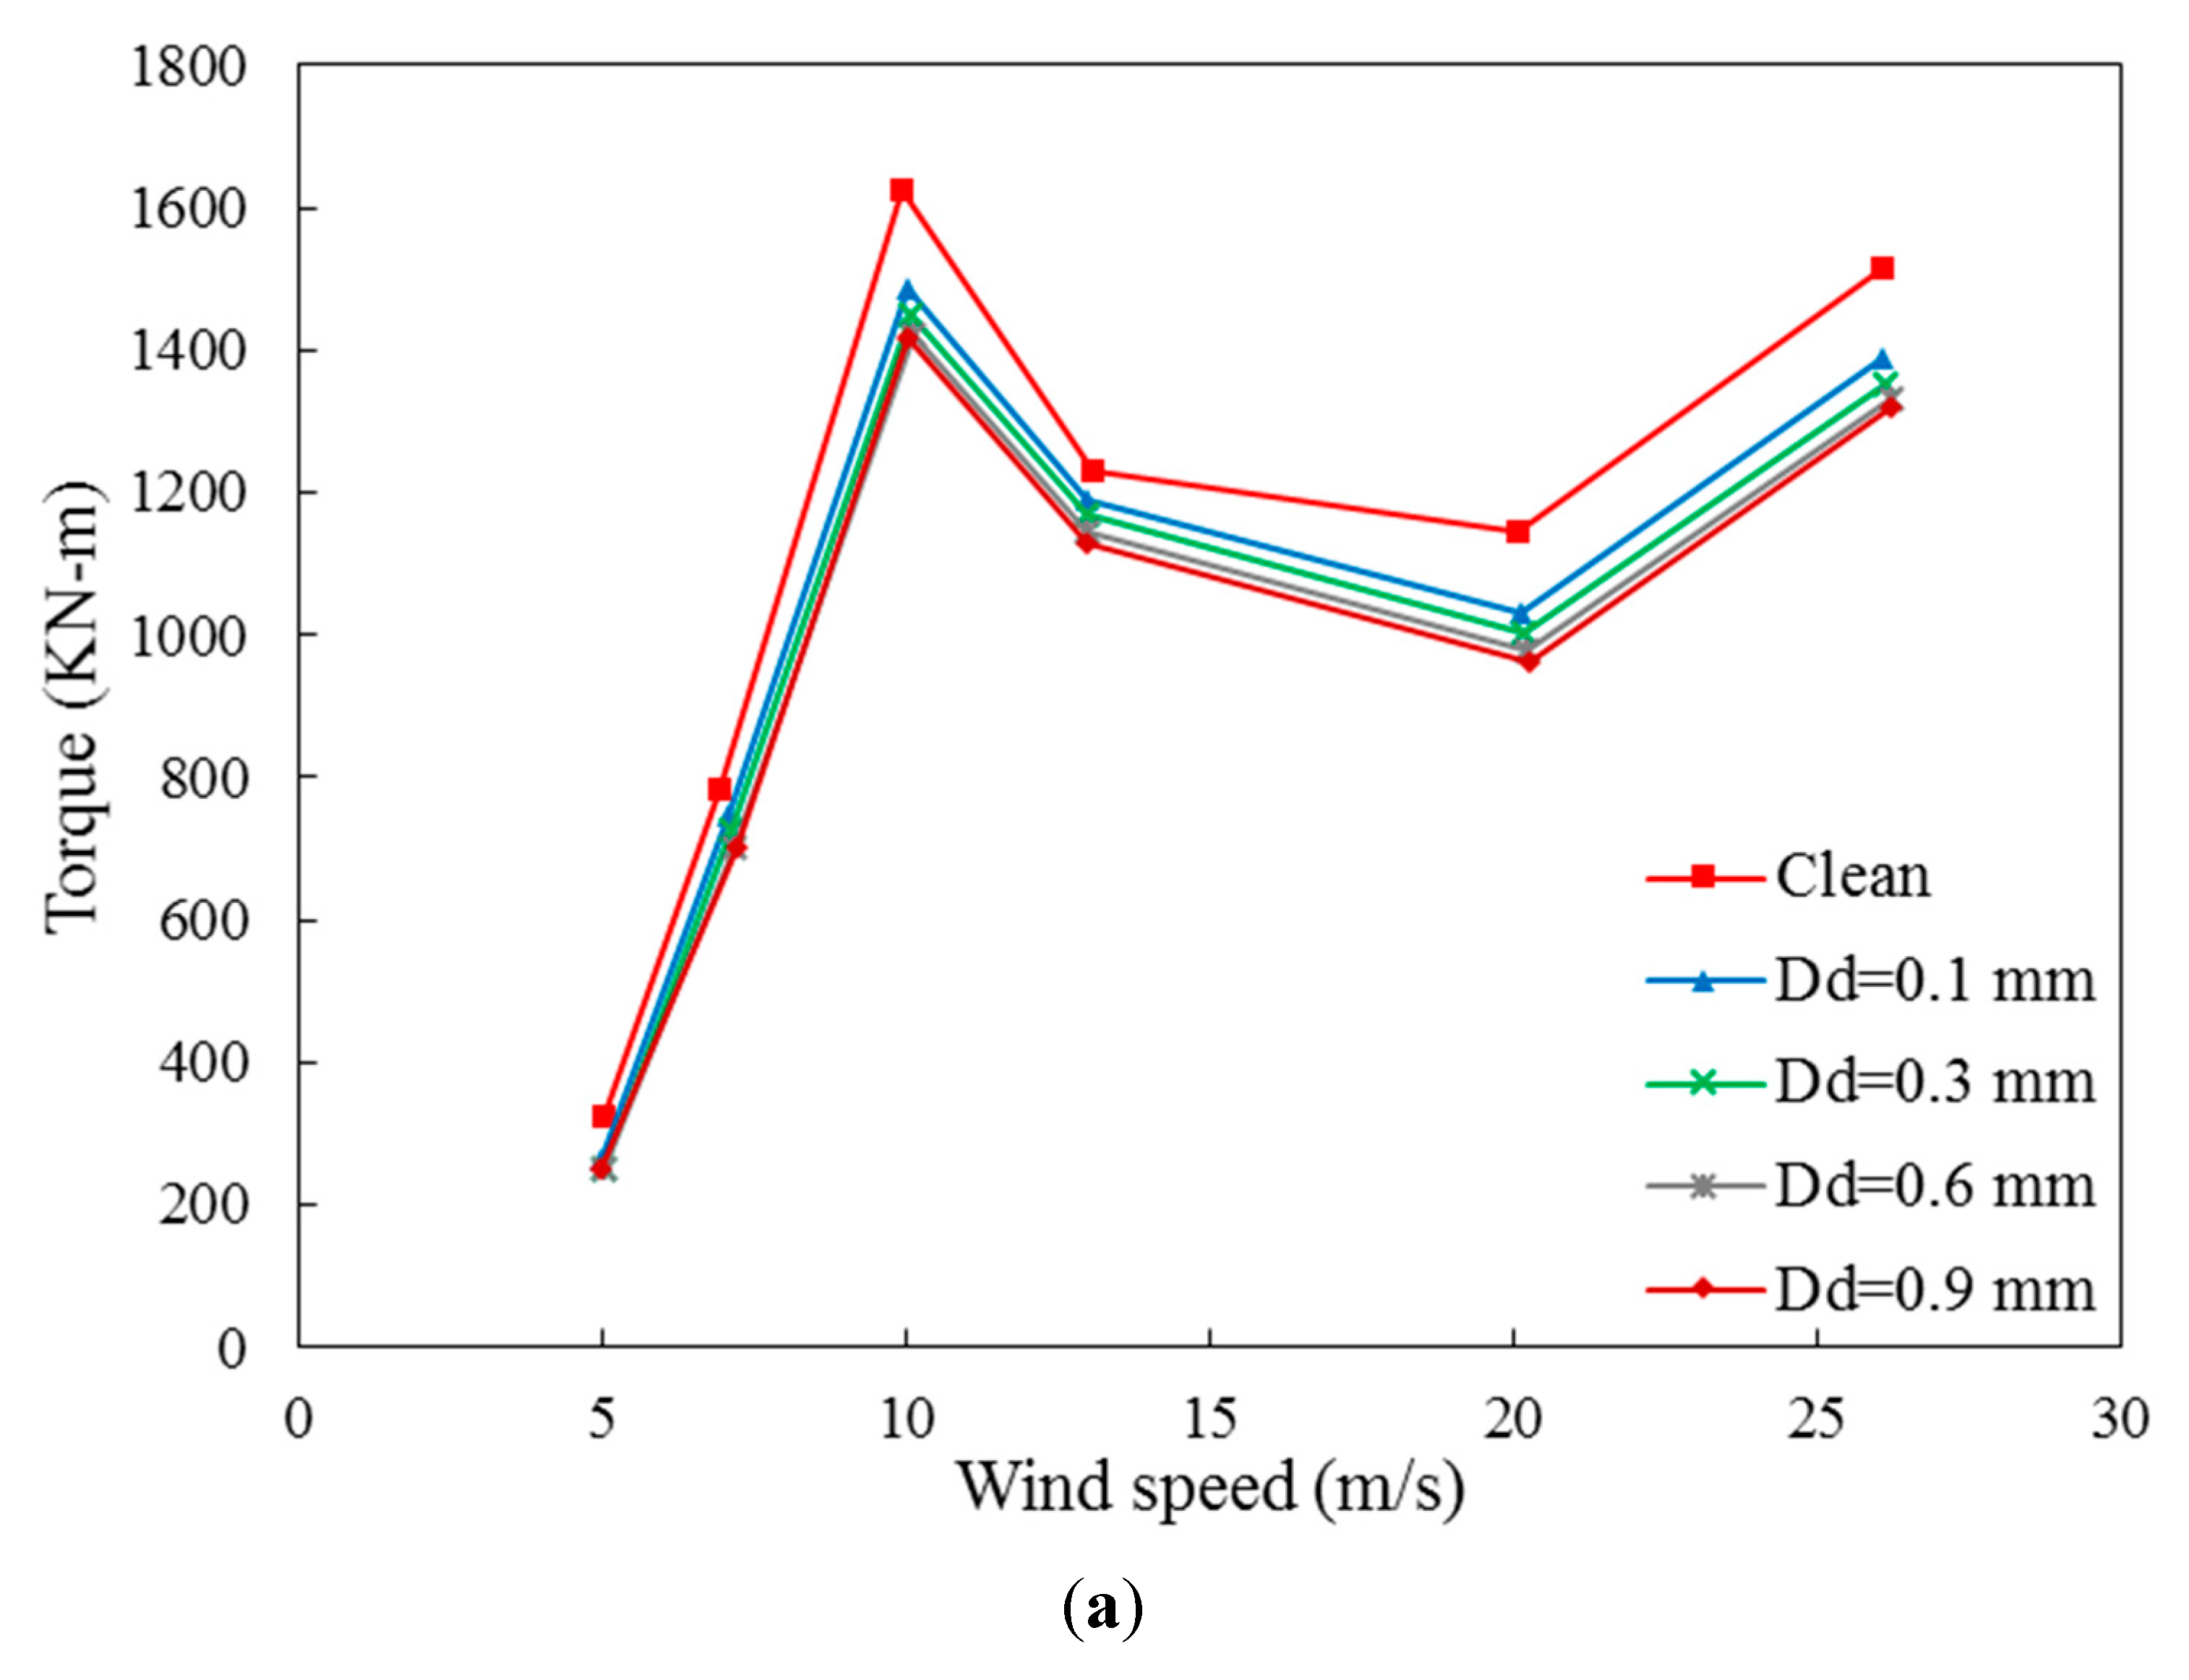
Figure 12a, there are comparisons between the effect of different sand particless sizes from 0.1 to 0.9 mm and clean air on output torque in various wind velocities. These results show that in lower wind velocity, the effect of sand particless is not noticeable but by increasing wind velocity, larger sand particless size, causes a sharp drop in output torque than clean wind. It is obvious there are fluctuations in
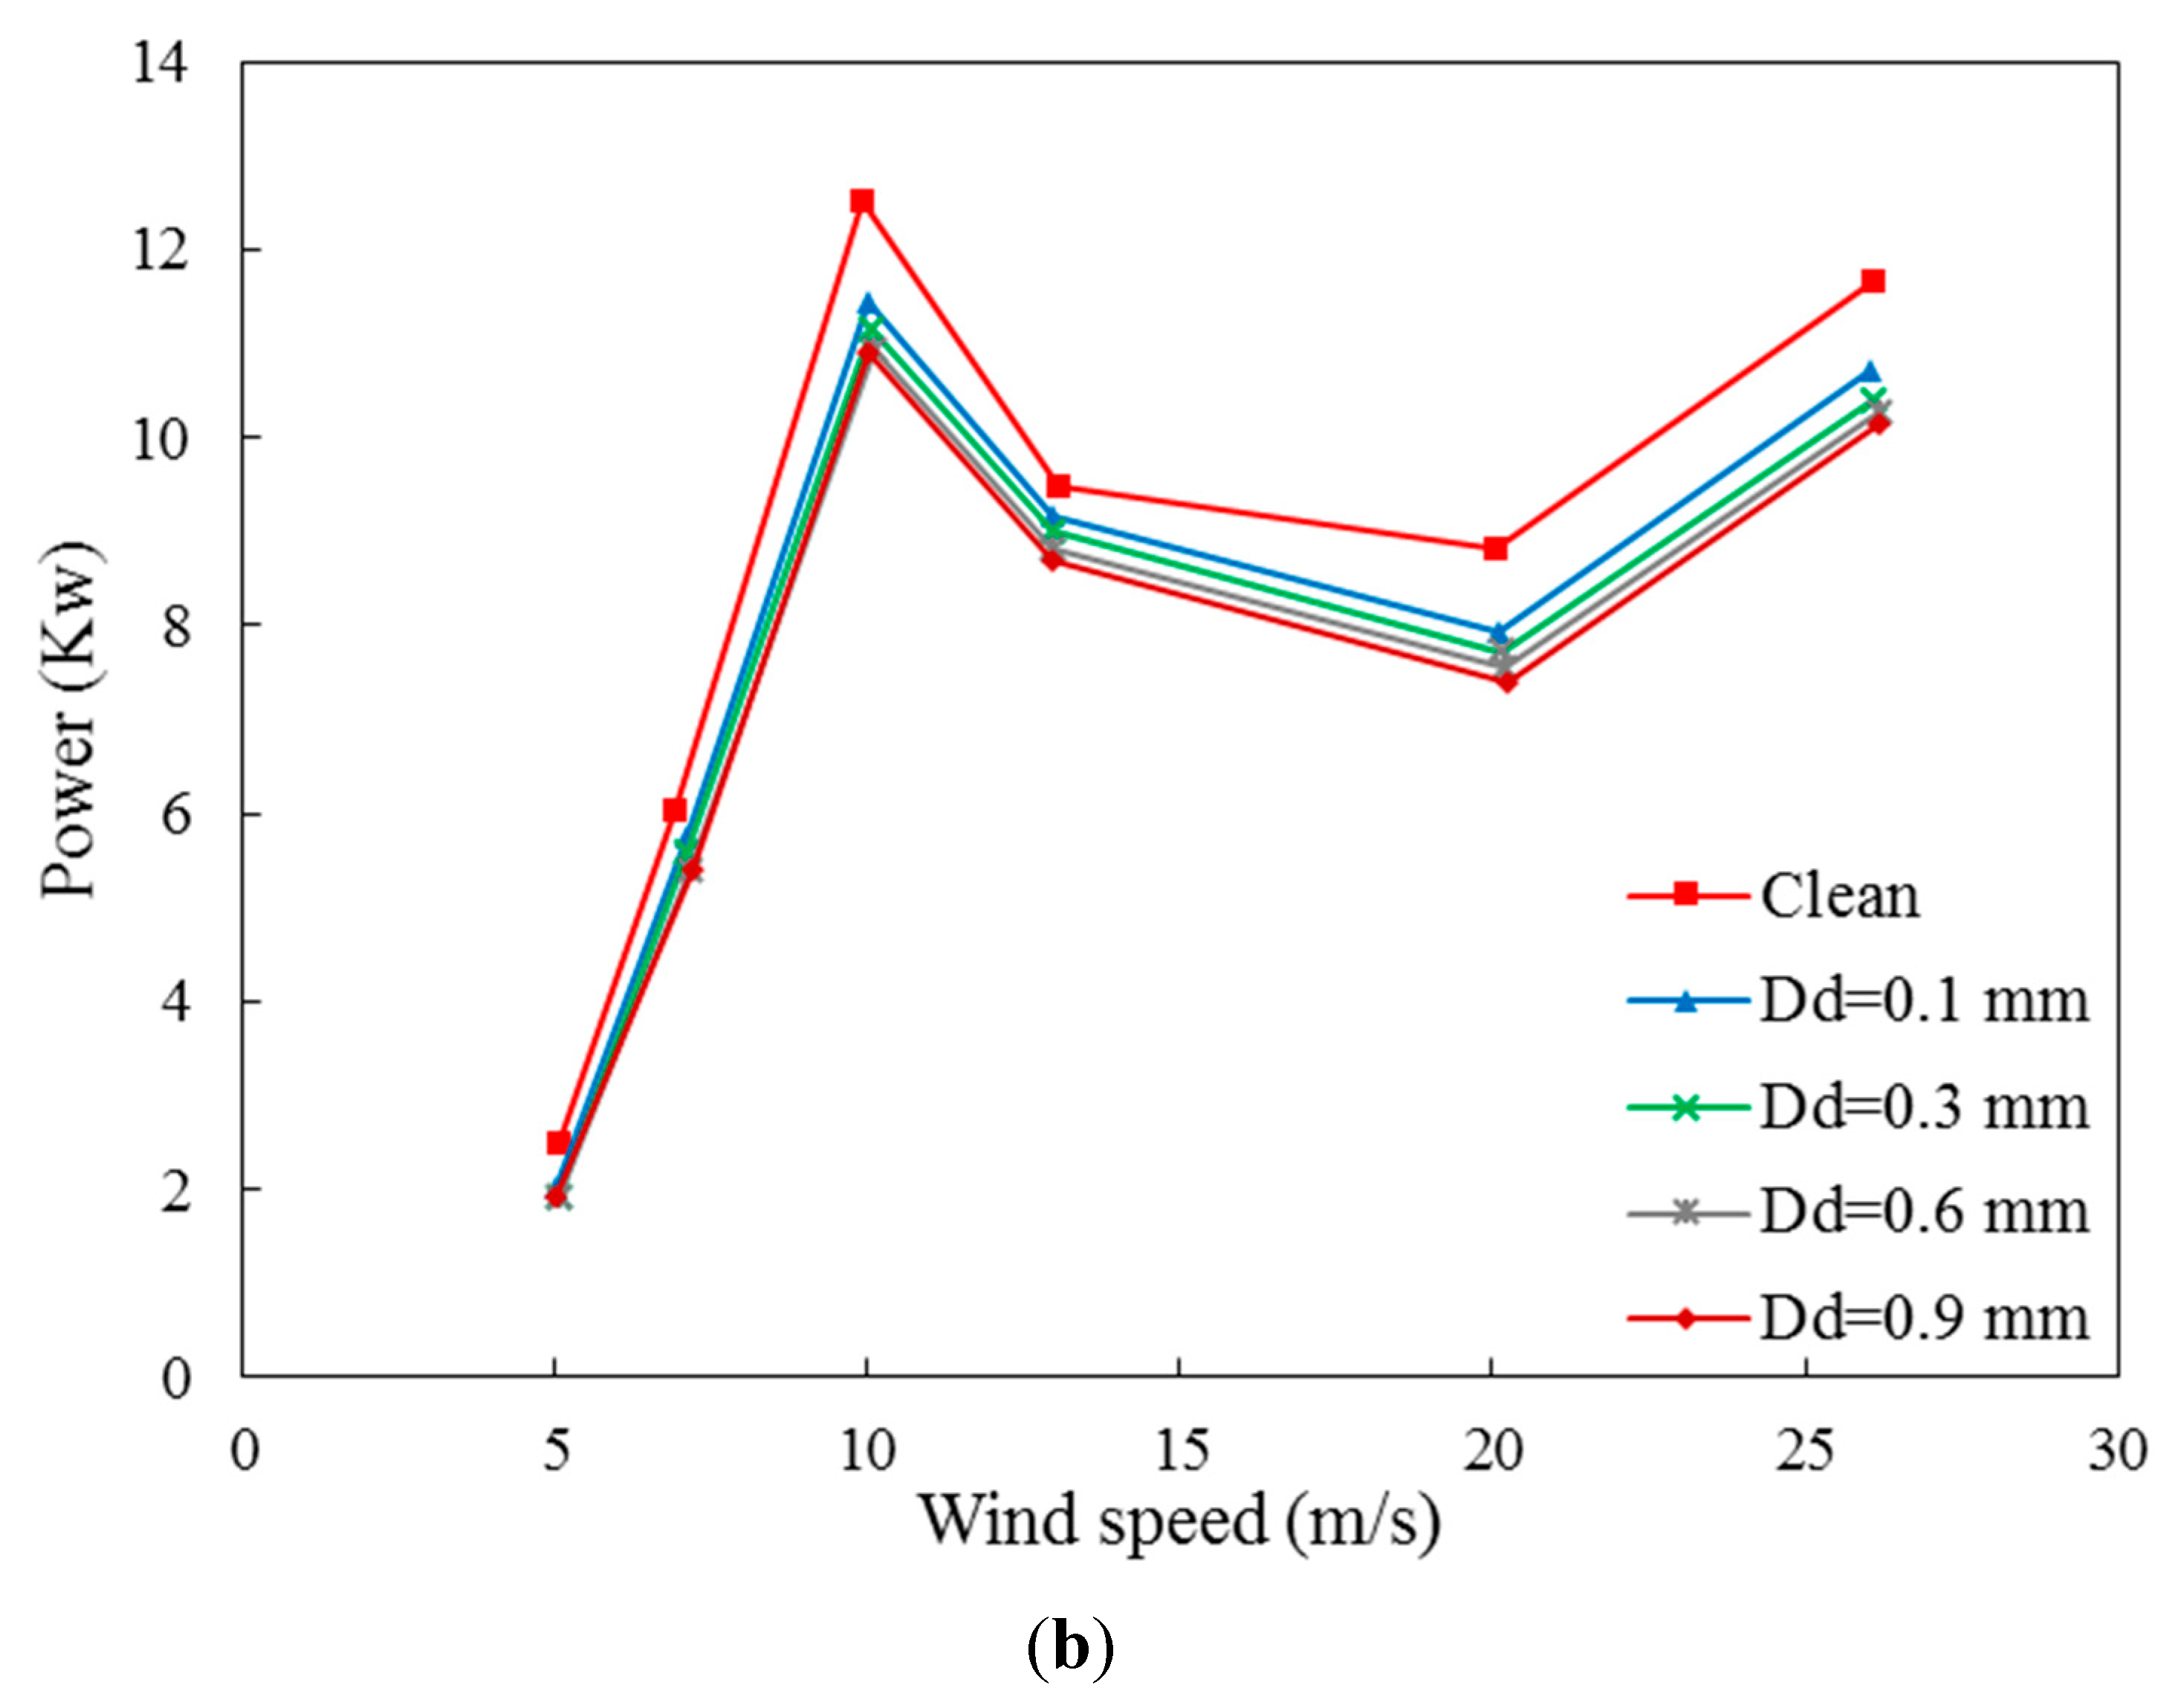
Figure 12a,b but it is clear that the wind turbine has better performance in the clear wind.
Figure 12b presents the mechanical power variation with different wind velocity in the range of sand particless sizes and it is obvious that the best operating speed of wind for the wind turbine is 10 m/s in all mentioned situations
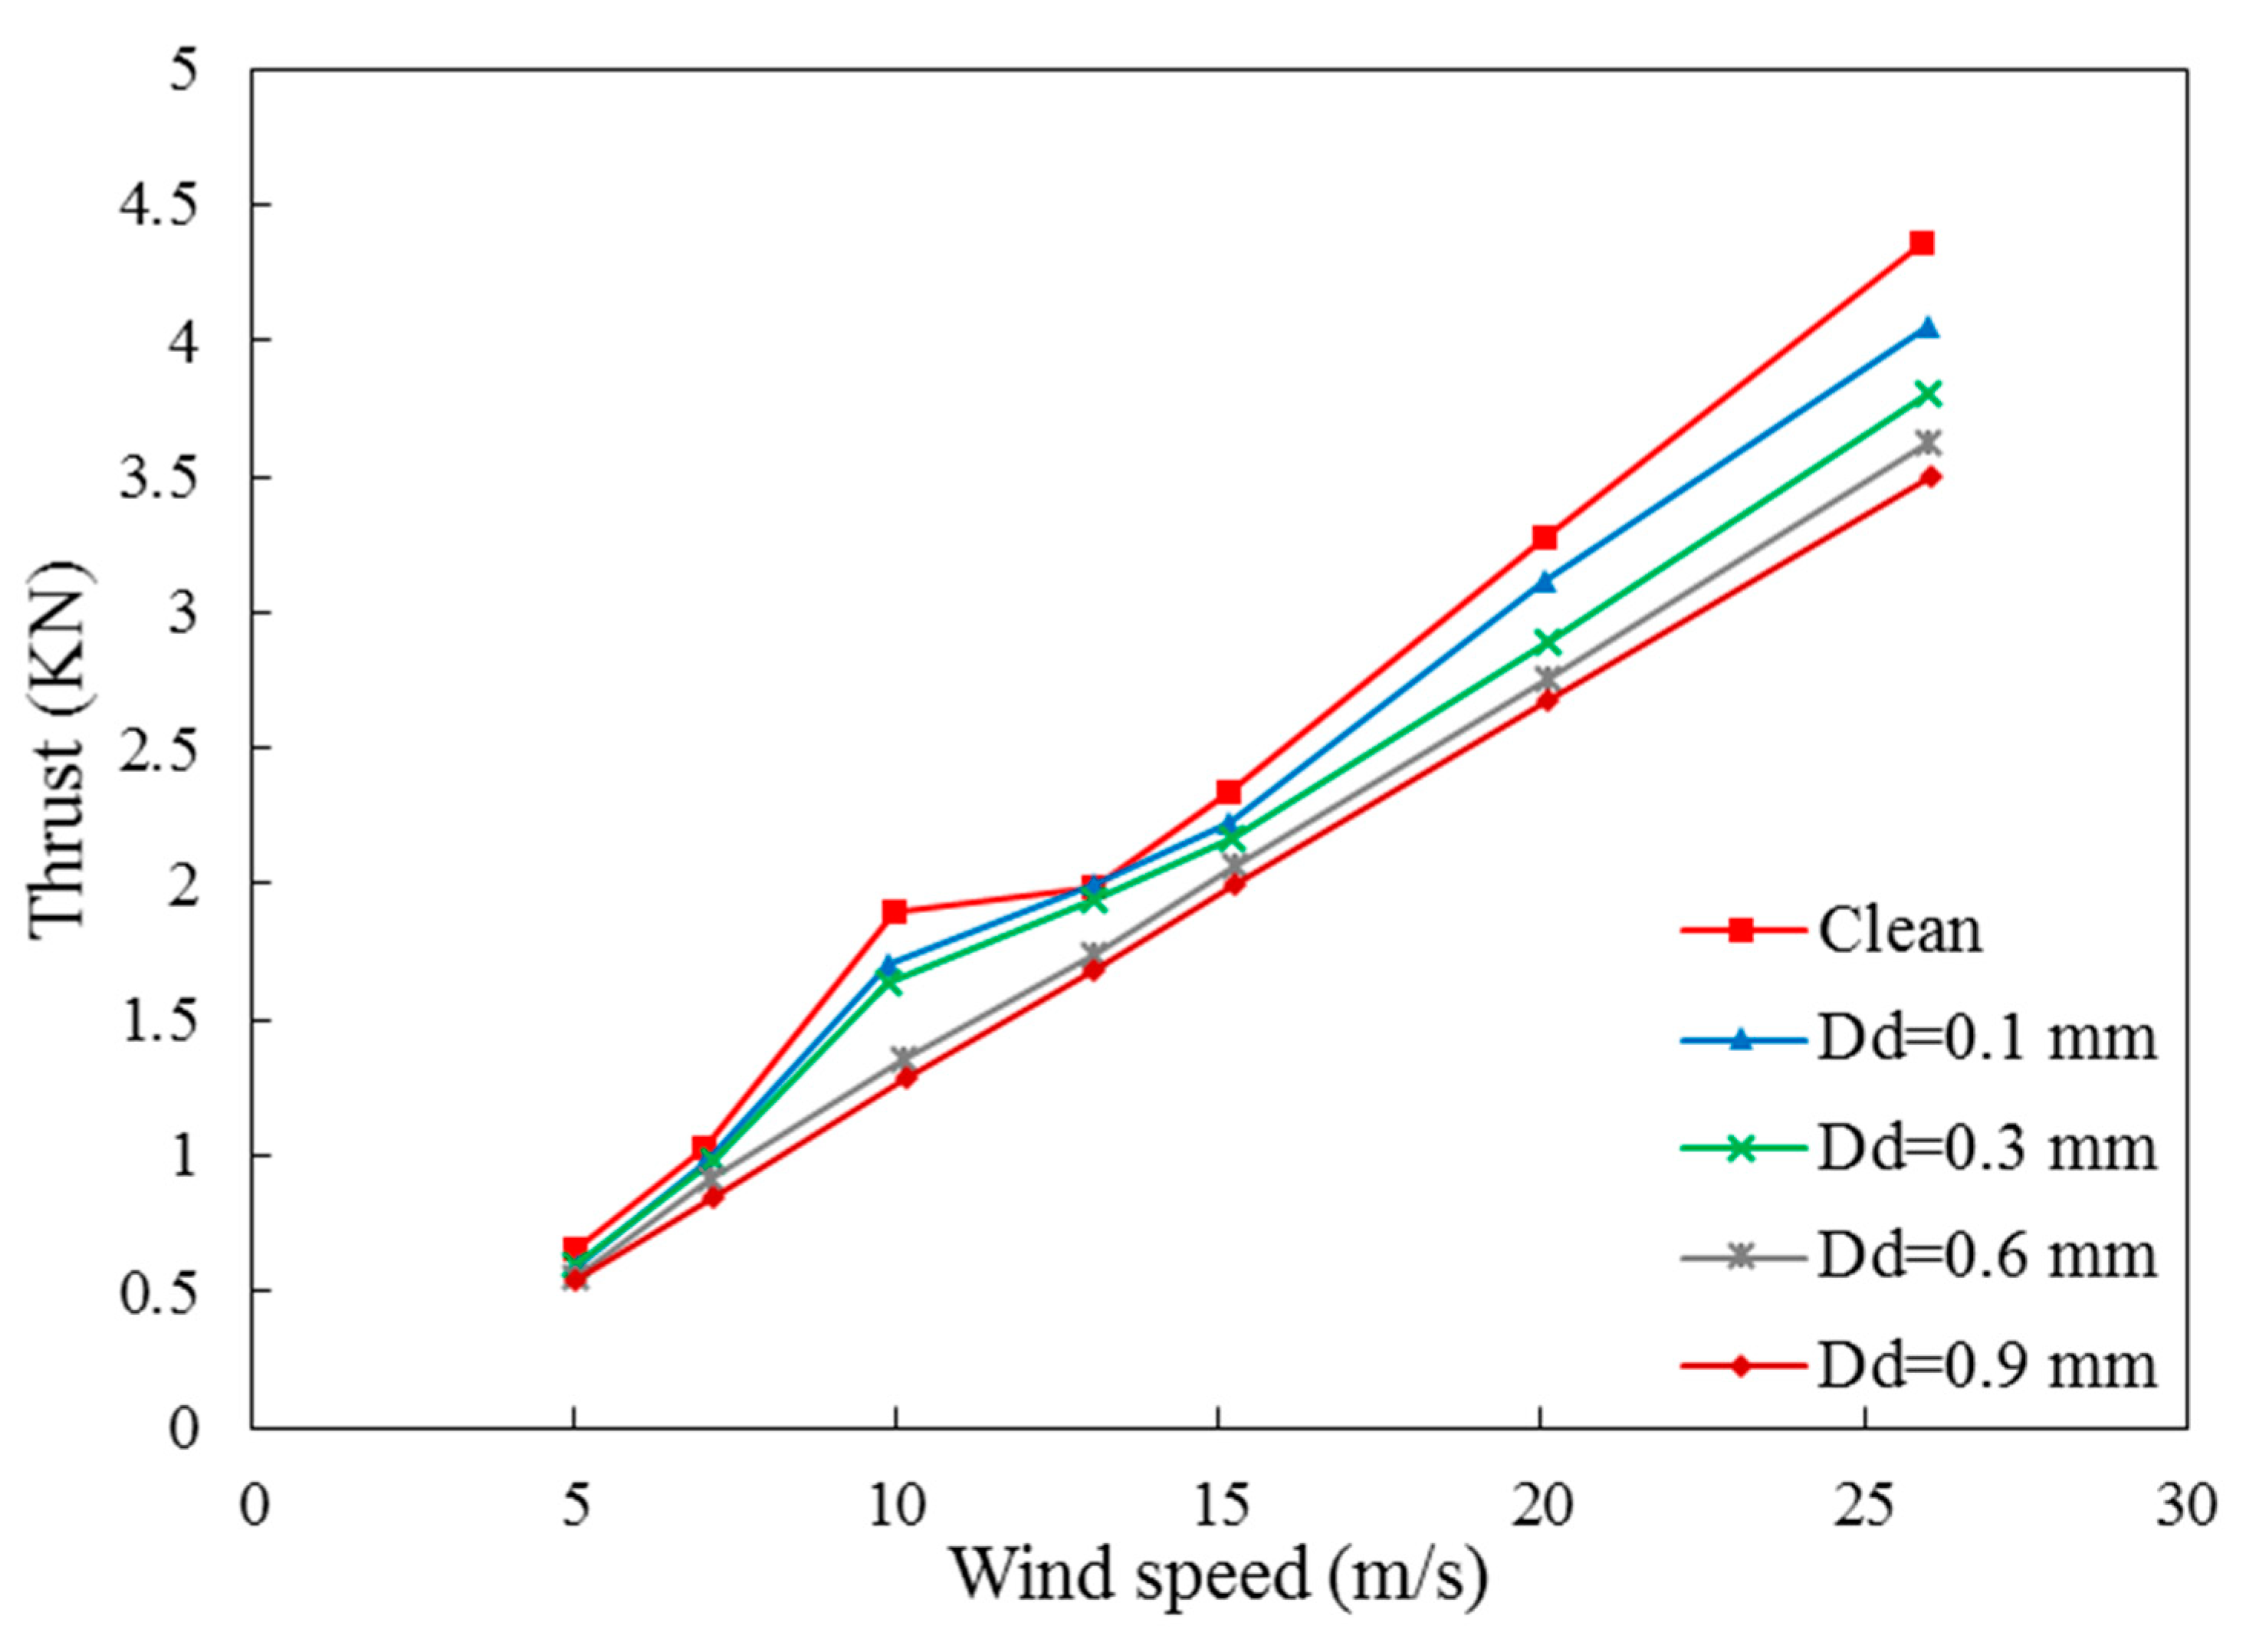
. Also, it is notable that the thrust variation in different wind velocity is shown in
Figure 13 and to compare clean wind and wind with 0.9mm sand particless size in 10m/s, it is clear that sand particless reduces the turbine power about 0.7KN because when the wind with sand particless particless blows to the turbine blades, creates a drag force and following that, lift force decreases. As already mentioned, the change in the sand particless size of the air will affect the pressure and consequently the thrust.
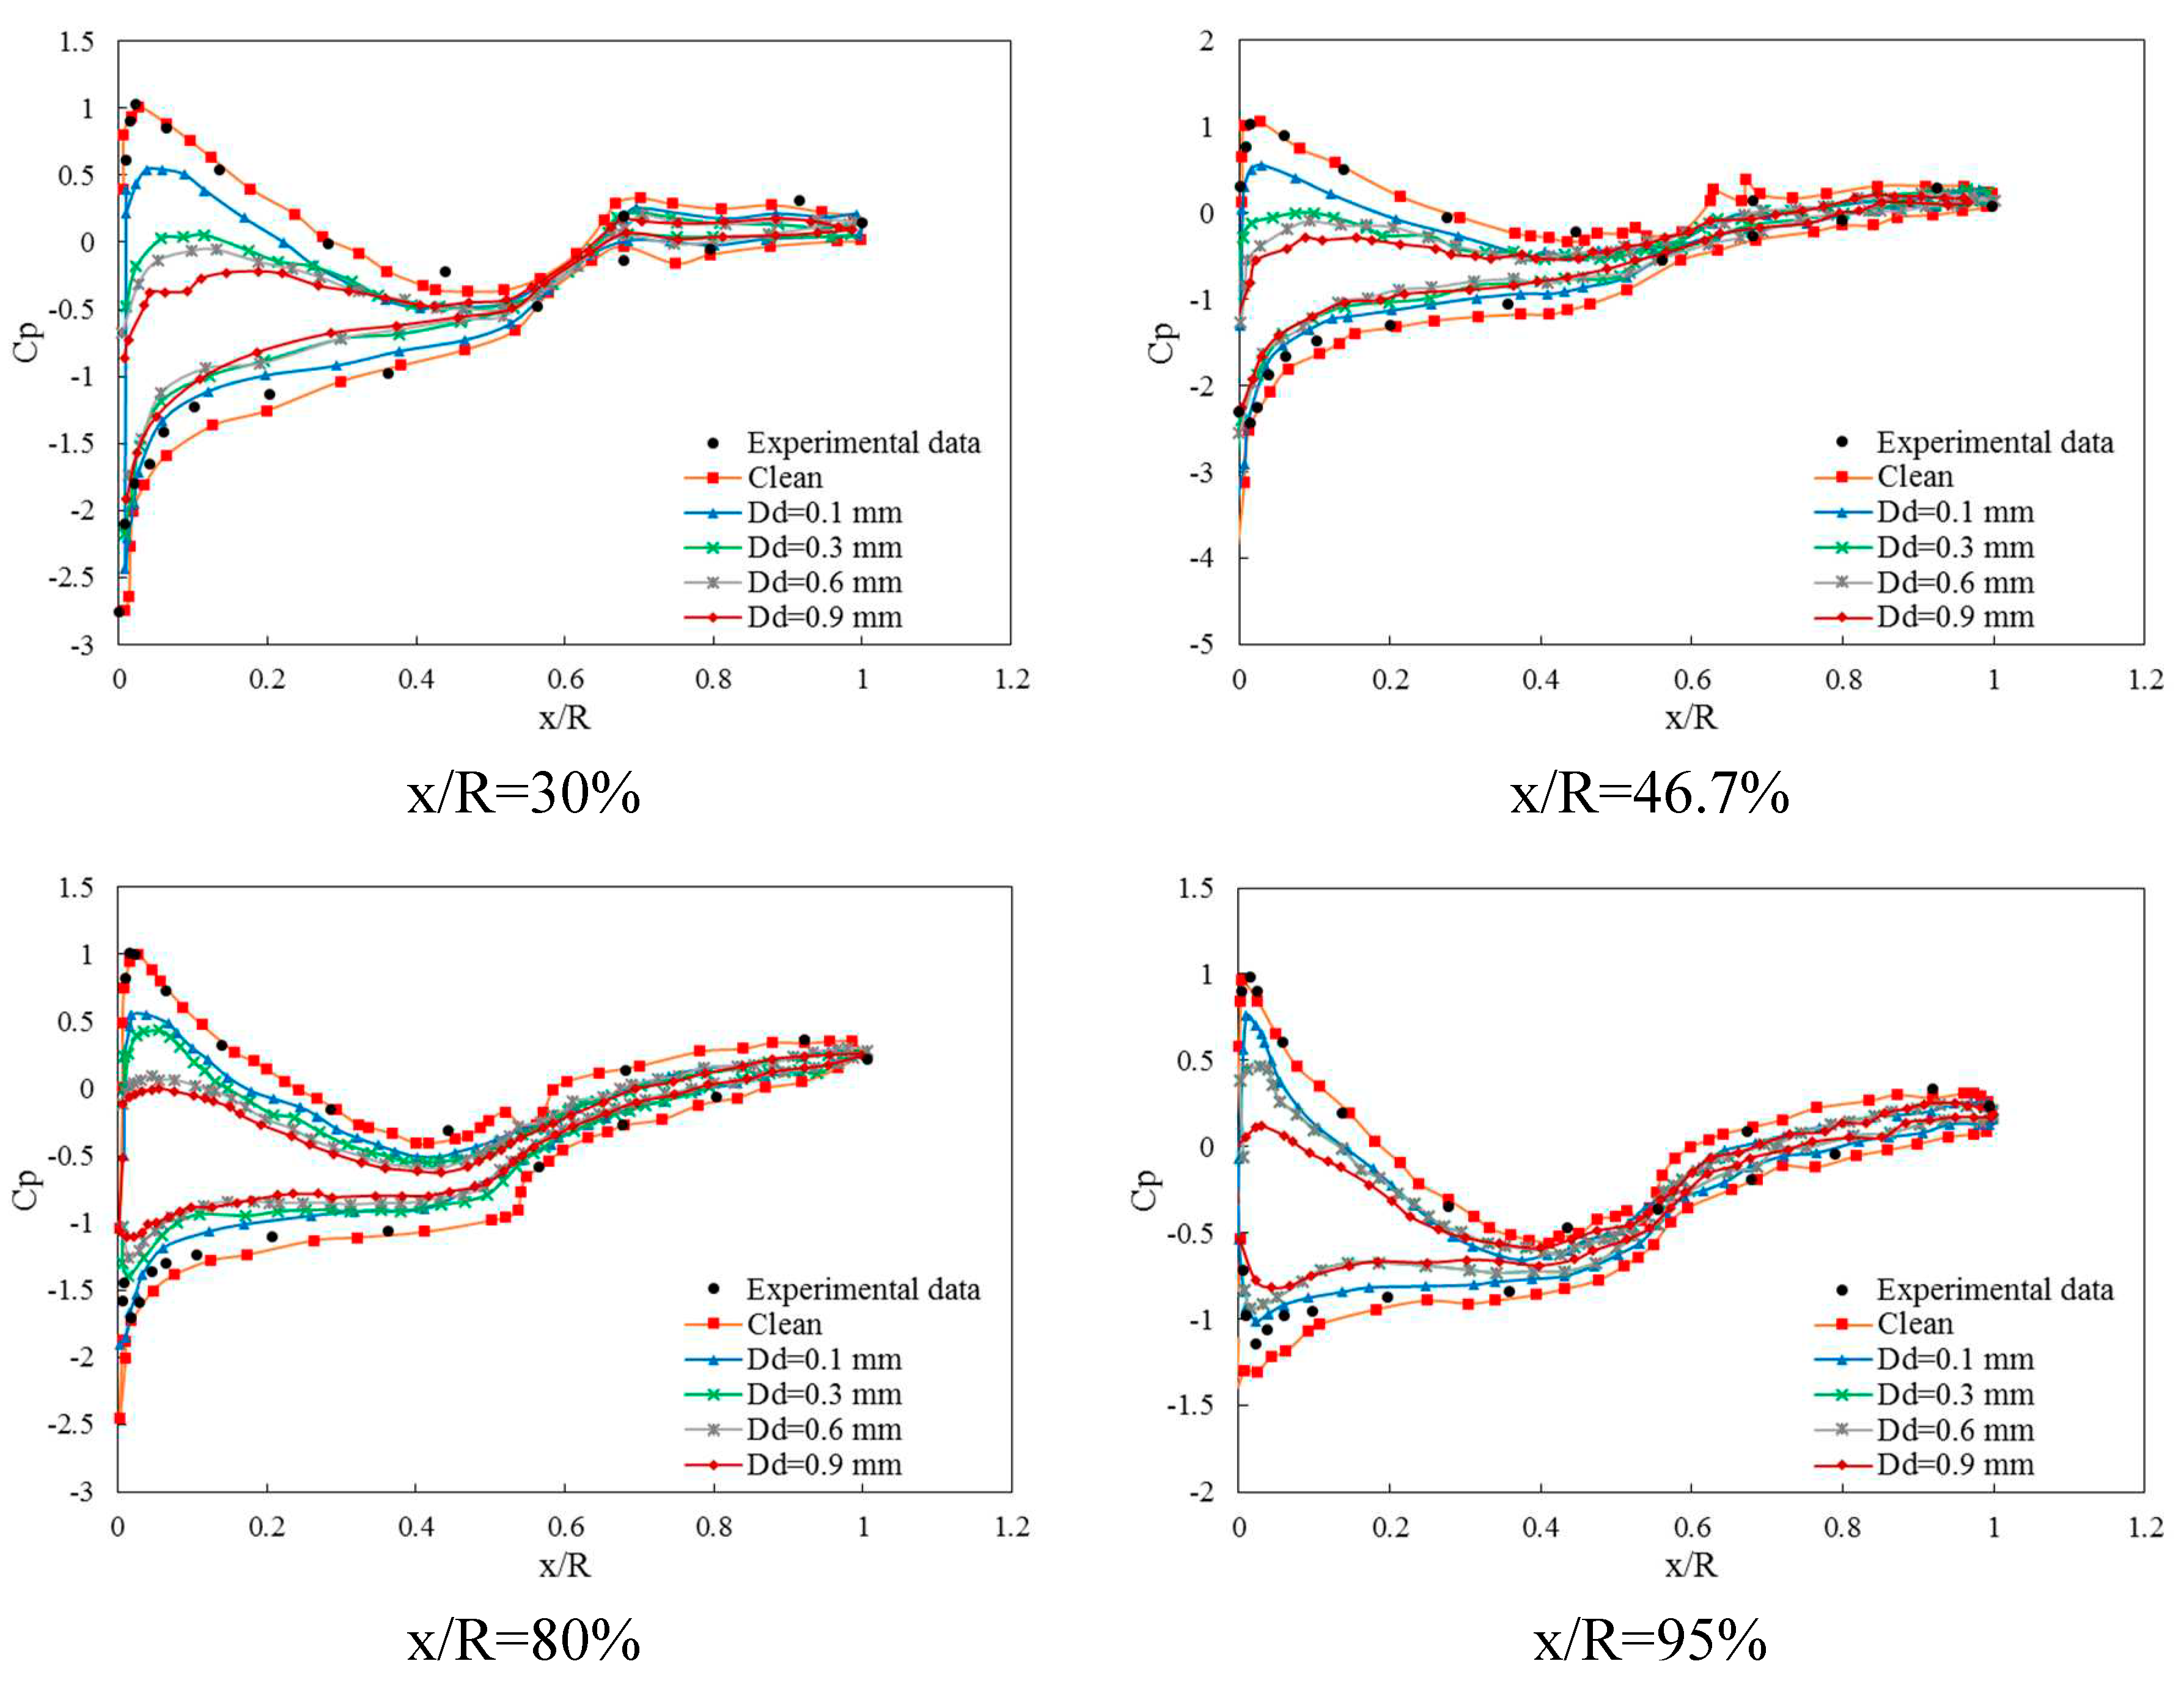
Figure 14, illustrate the variation of pressure coefficient along the chord length for 5 m/s. It is worth noting that thease results are obtained in different sand particless size and there is a comparison between numerical and experimental results. It clearly shows the present numerical simulation results in clean wind has matches very well with experimental data. Wind with different sand particless sizes 0.1, 0.3, 0.6 and 0.9 has been compared by clean wind in the pressure coefficient along the chord length of the axial wind turbine. It appears that the larger sand particless has noticeable pressure coefficient variation near the leading edge but in some positions along the length, from 0.6 to 1, there is no significant difference in pressure coefficient by changing sand particless size and by increasing wind velocity, larger sand particless size, has a more destructive effect on turbine performance.
3.2. Numerical Simulation under Unsteady Condition
In the following, the influence of the clean air on the performance of axial wind turbine, which is known to be quite relevant to the development of vortexes has also investigated on the axial wind turbine at different wind velocity. Hydraulic performances of the axial wind turbine under unsteady conditions were numerically investigated in order to understand the importance of the vortexes.
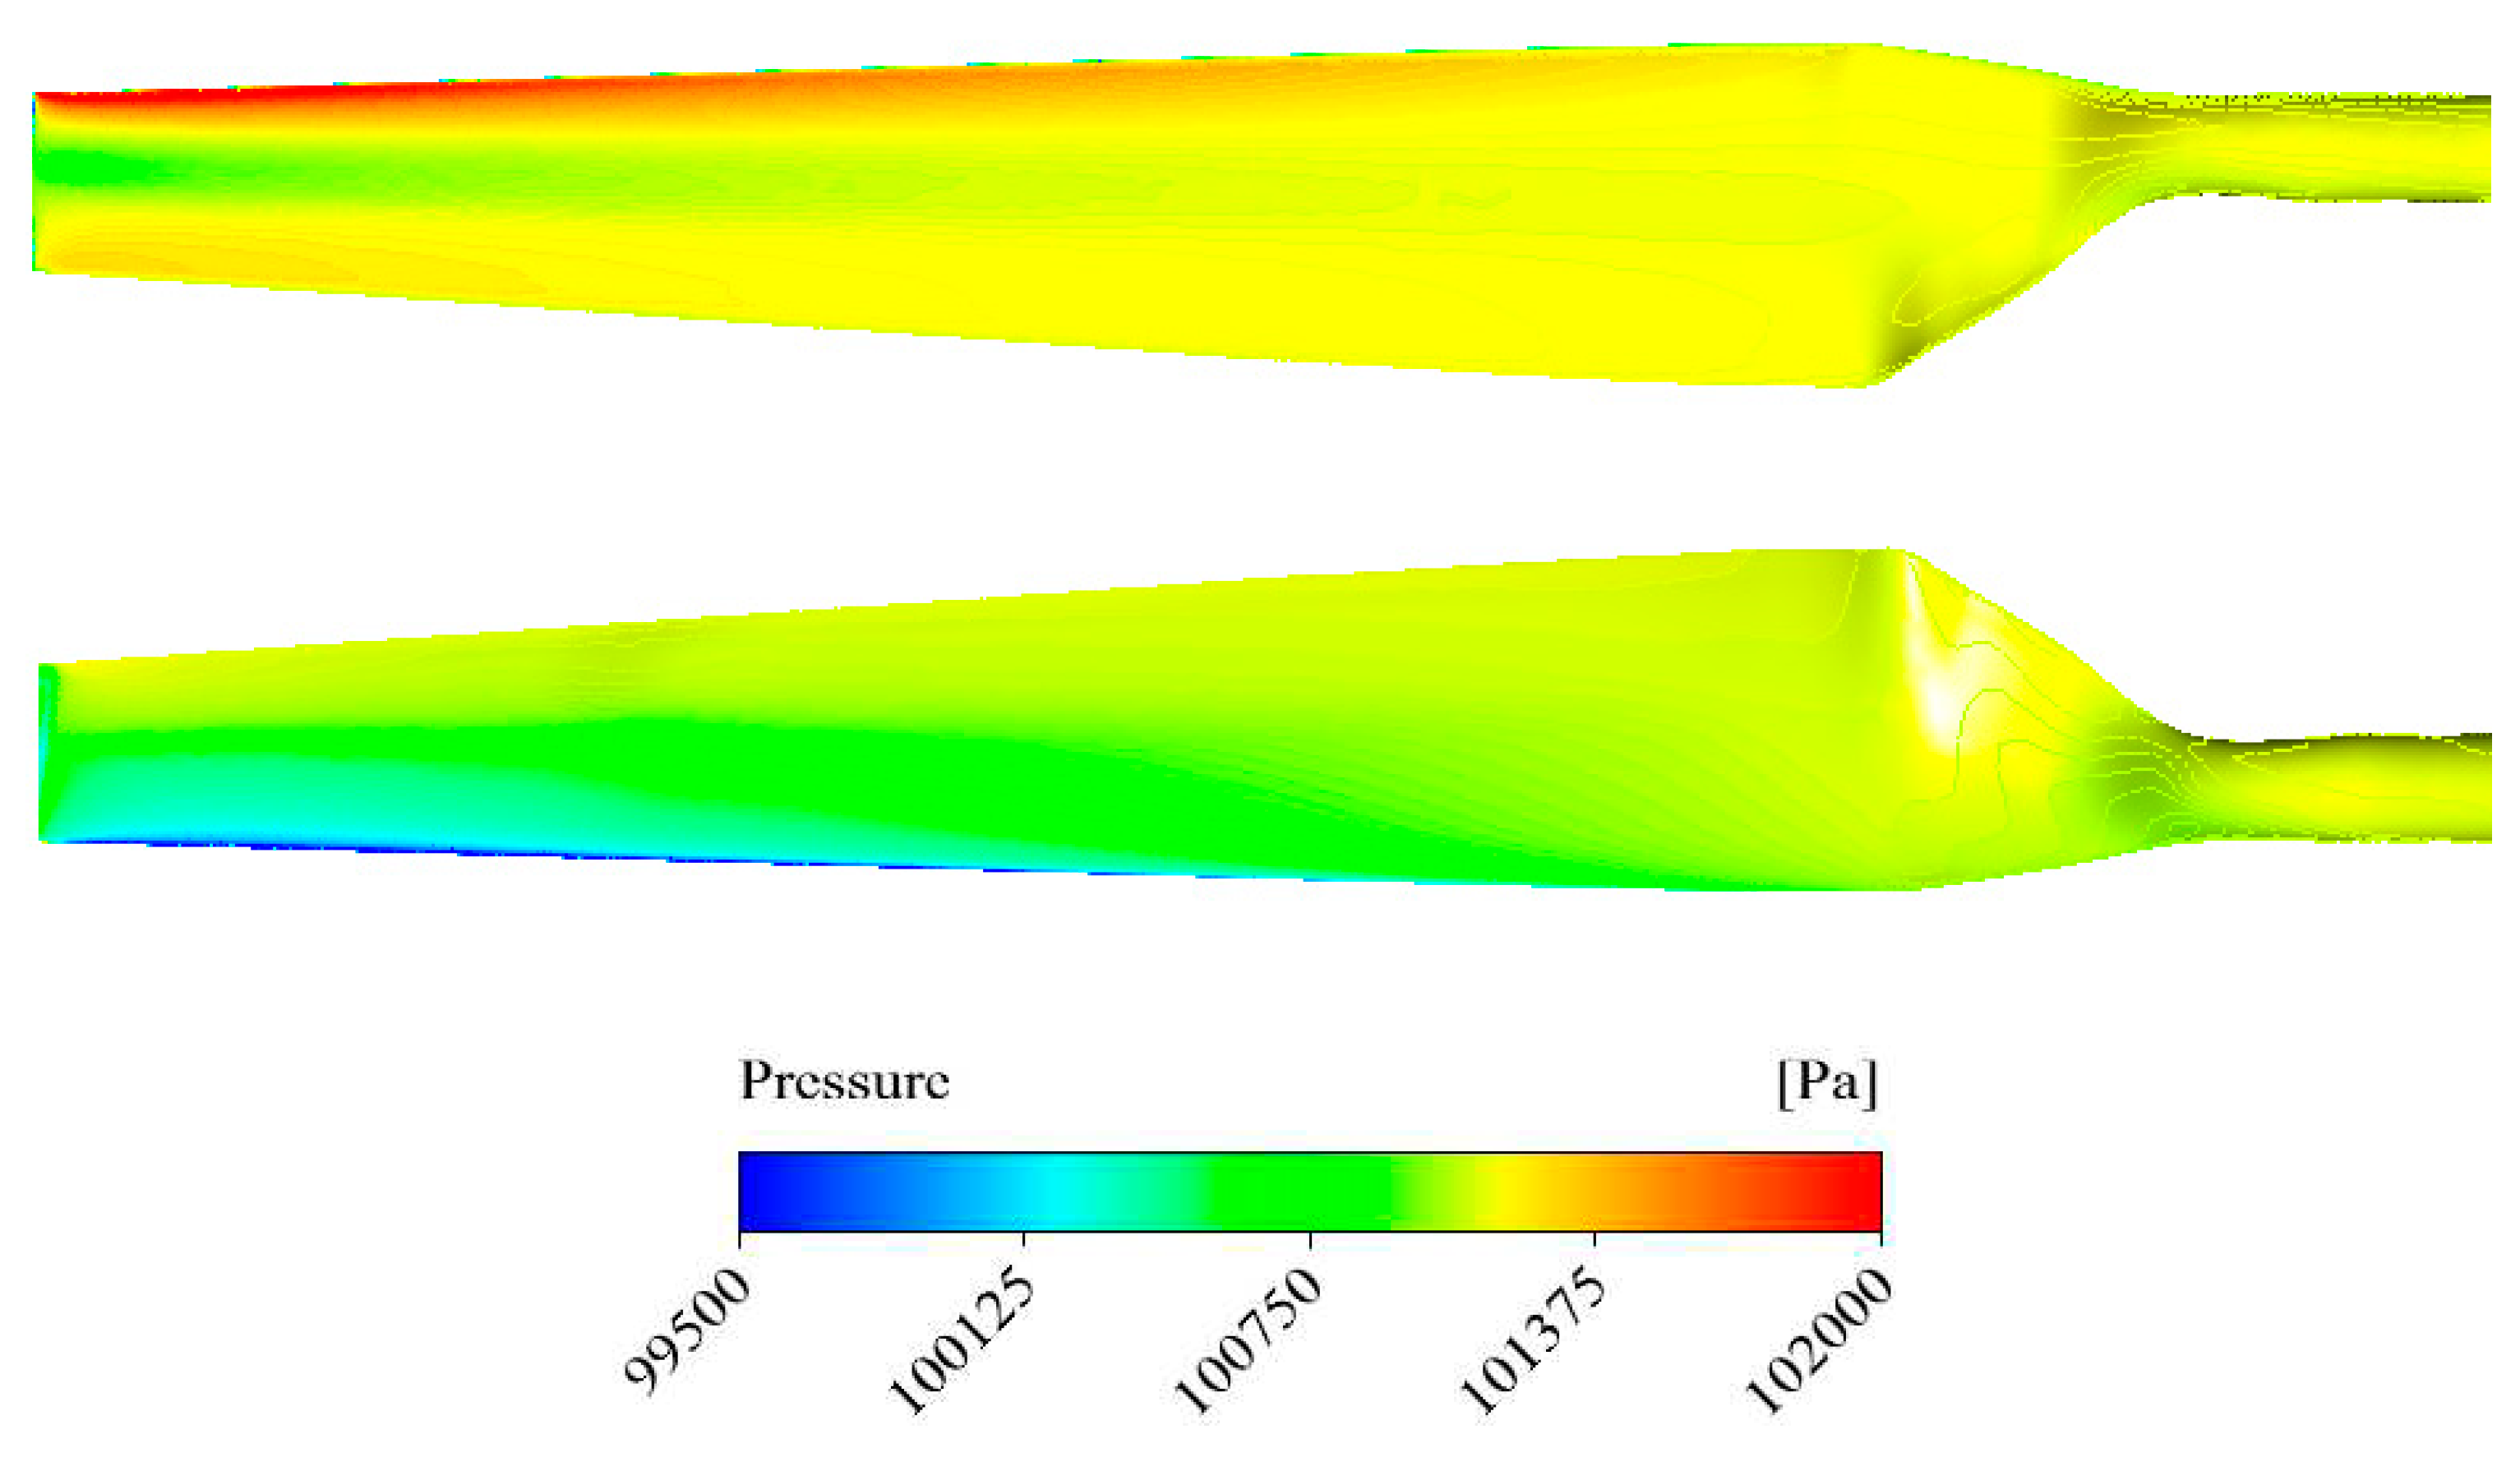
Figure 15 showed pressure distribution on the axial wind turbine blade and suction sides in 7m/s velocity of the wind. It can be obviously observed that the Pressure in a frontal line of pressure side has maximum value and on the suction side has a minimum value. All the above-mentioned analyses show that by marching from tip to root of the blade the aforementioned pressure is increased. It is found that this phenomenon is inverse for pressure side actually it means that by marching from root to tip pressure is increased.
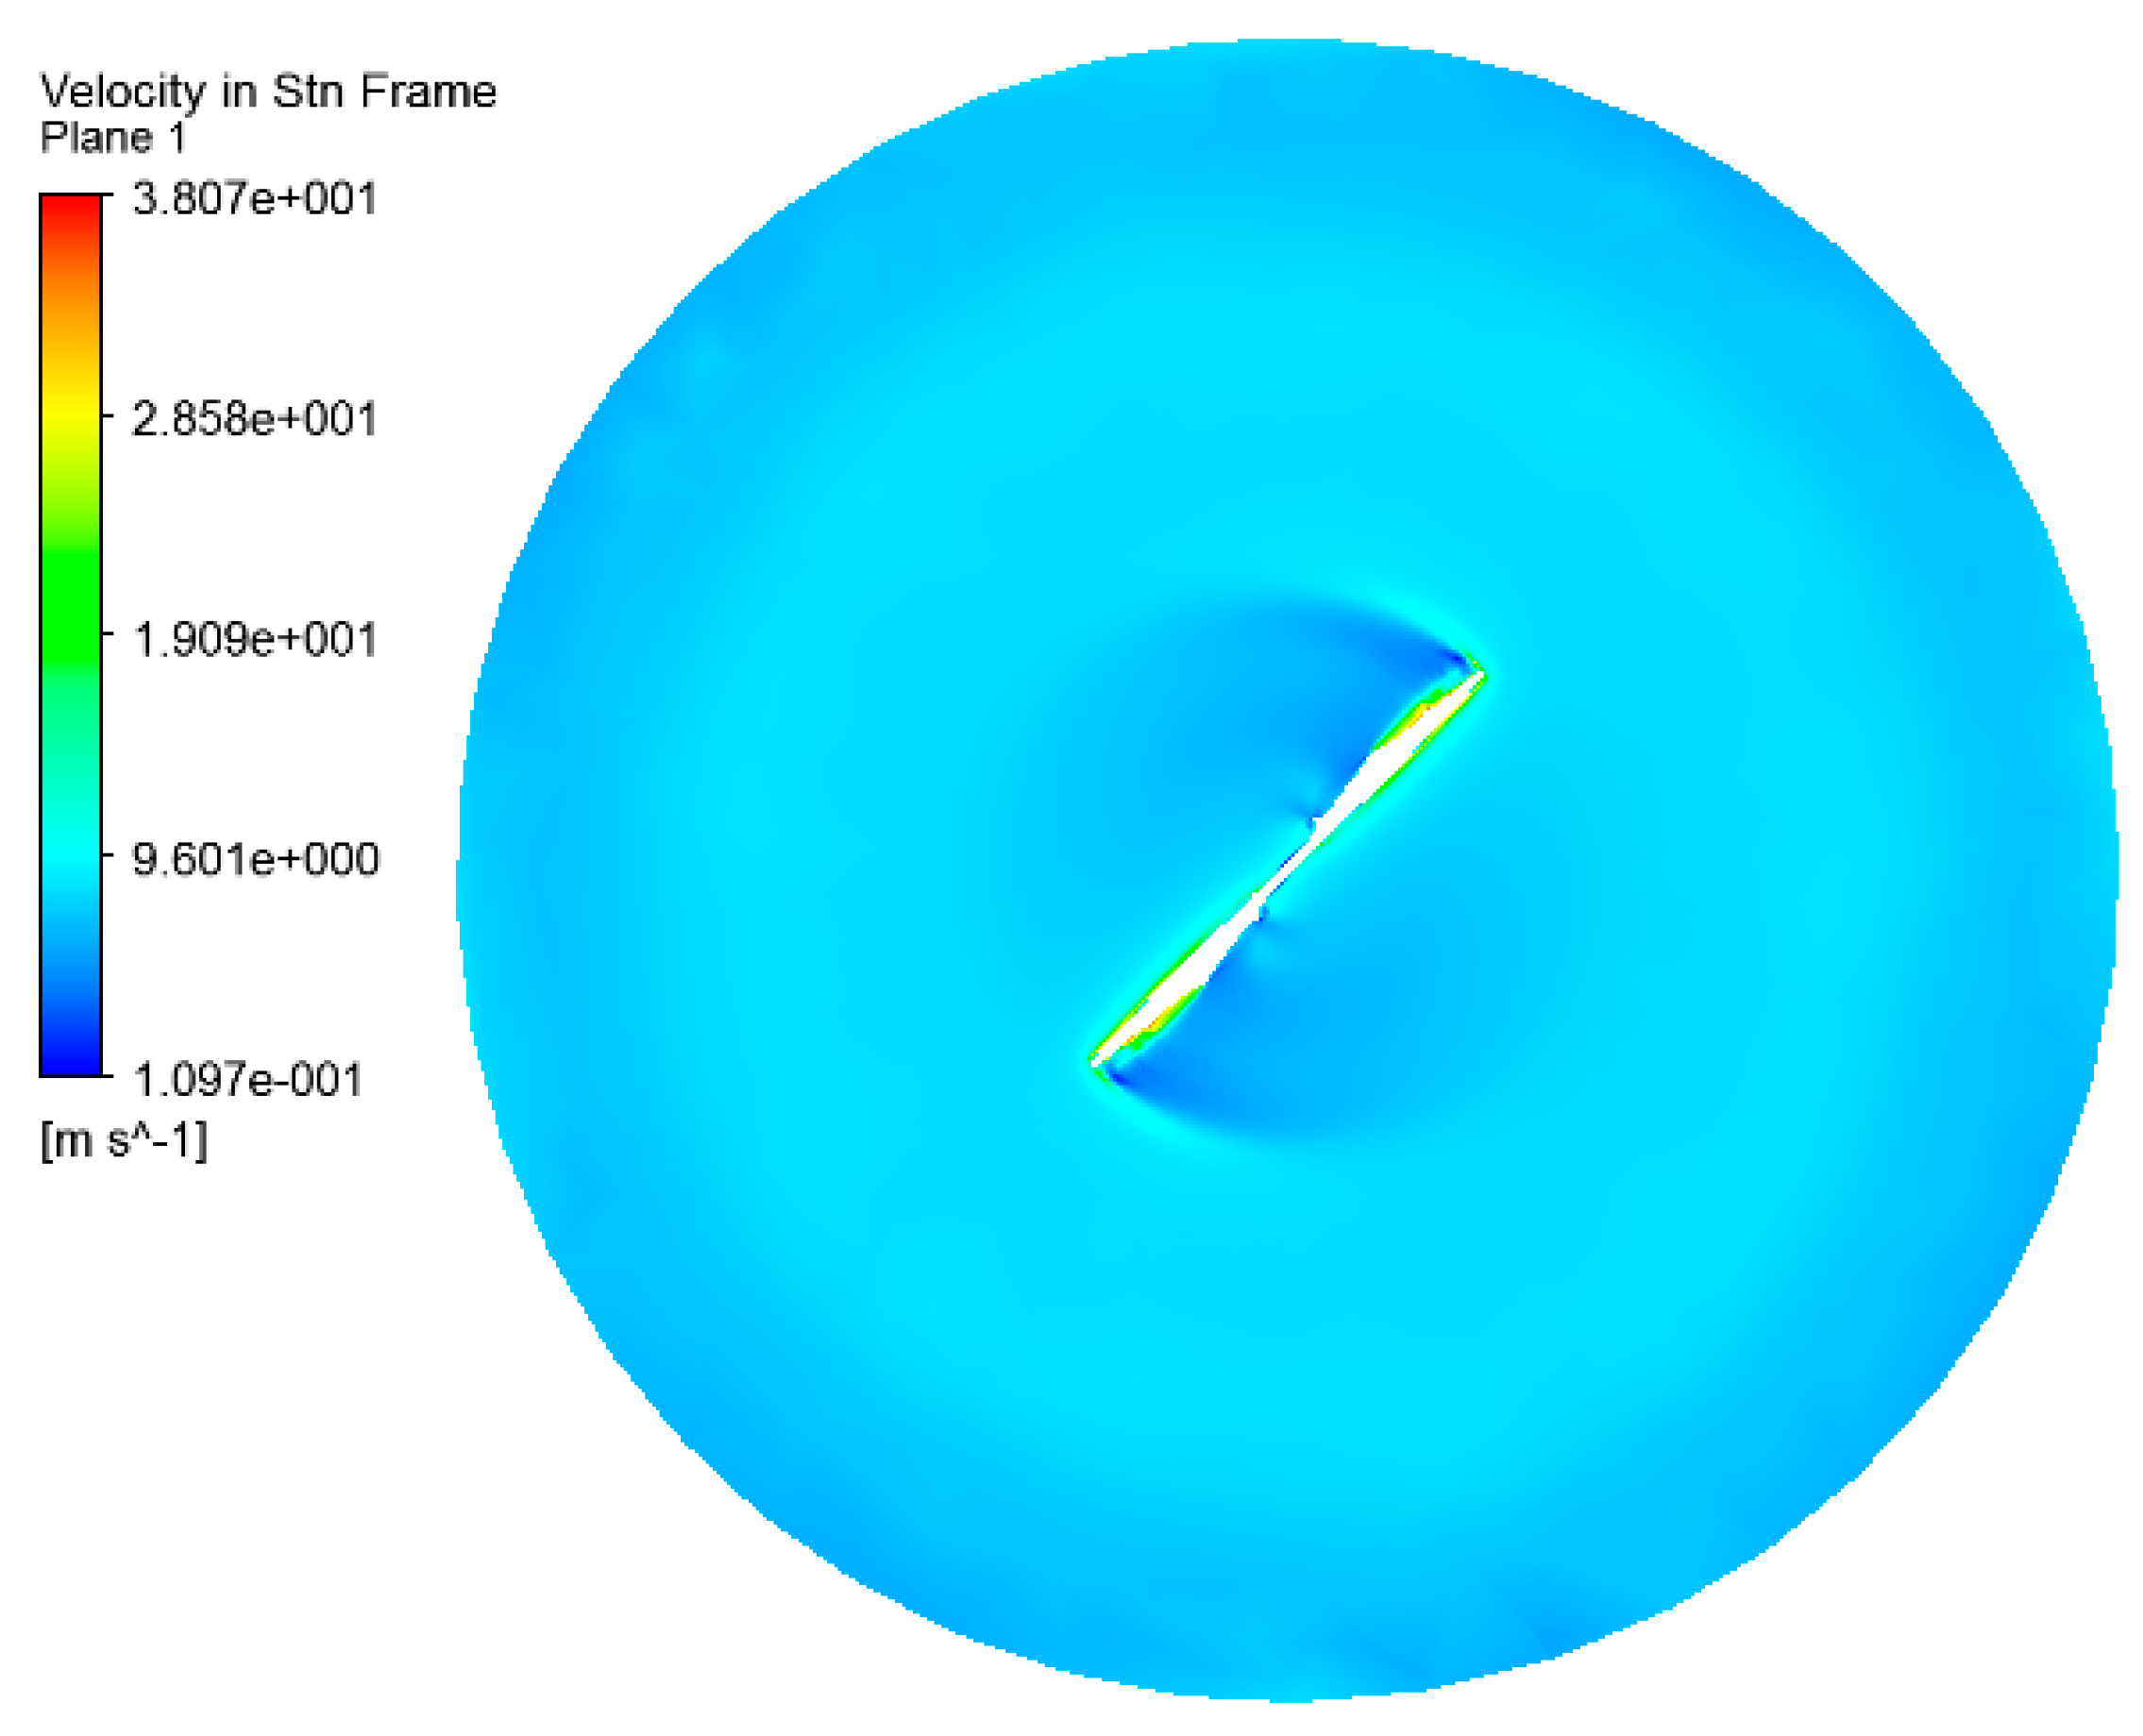
The velocity contour which is across the center of the blade is shown in
Figure 16 in t=4 second and 7m/s wind velocity condition. According to
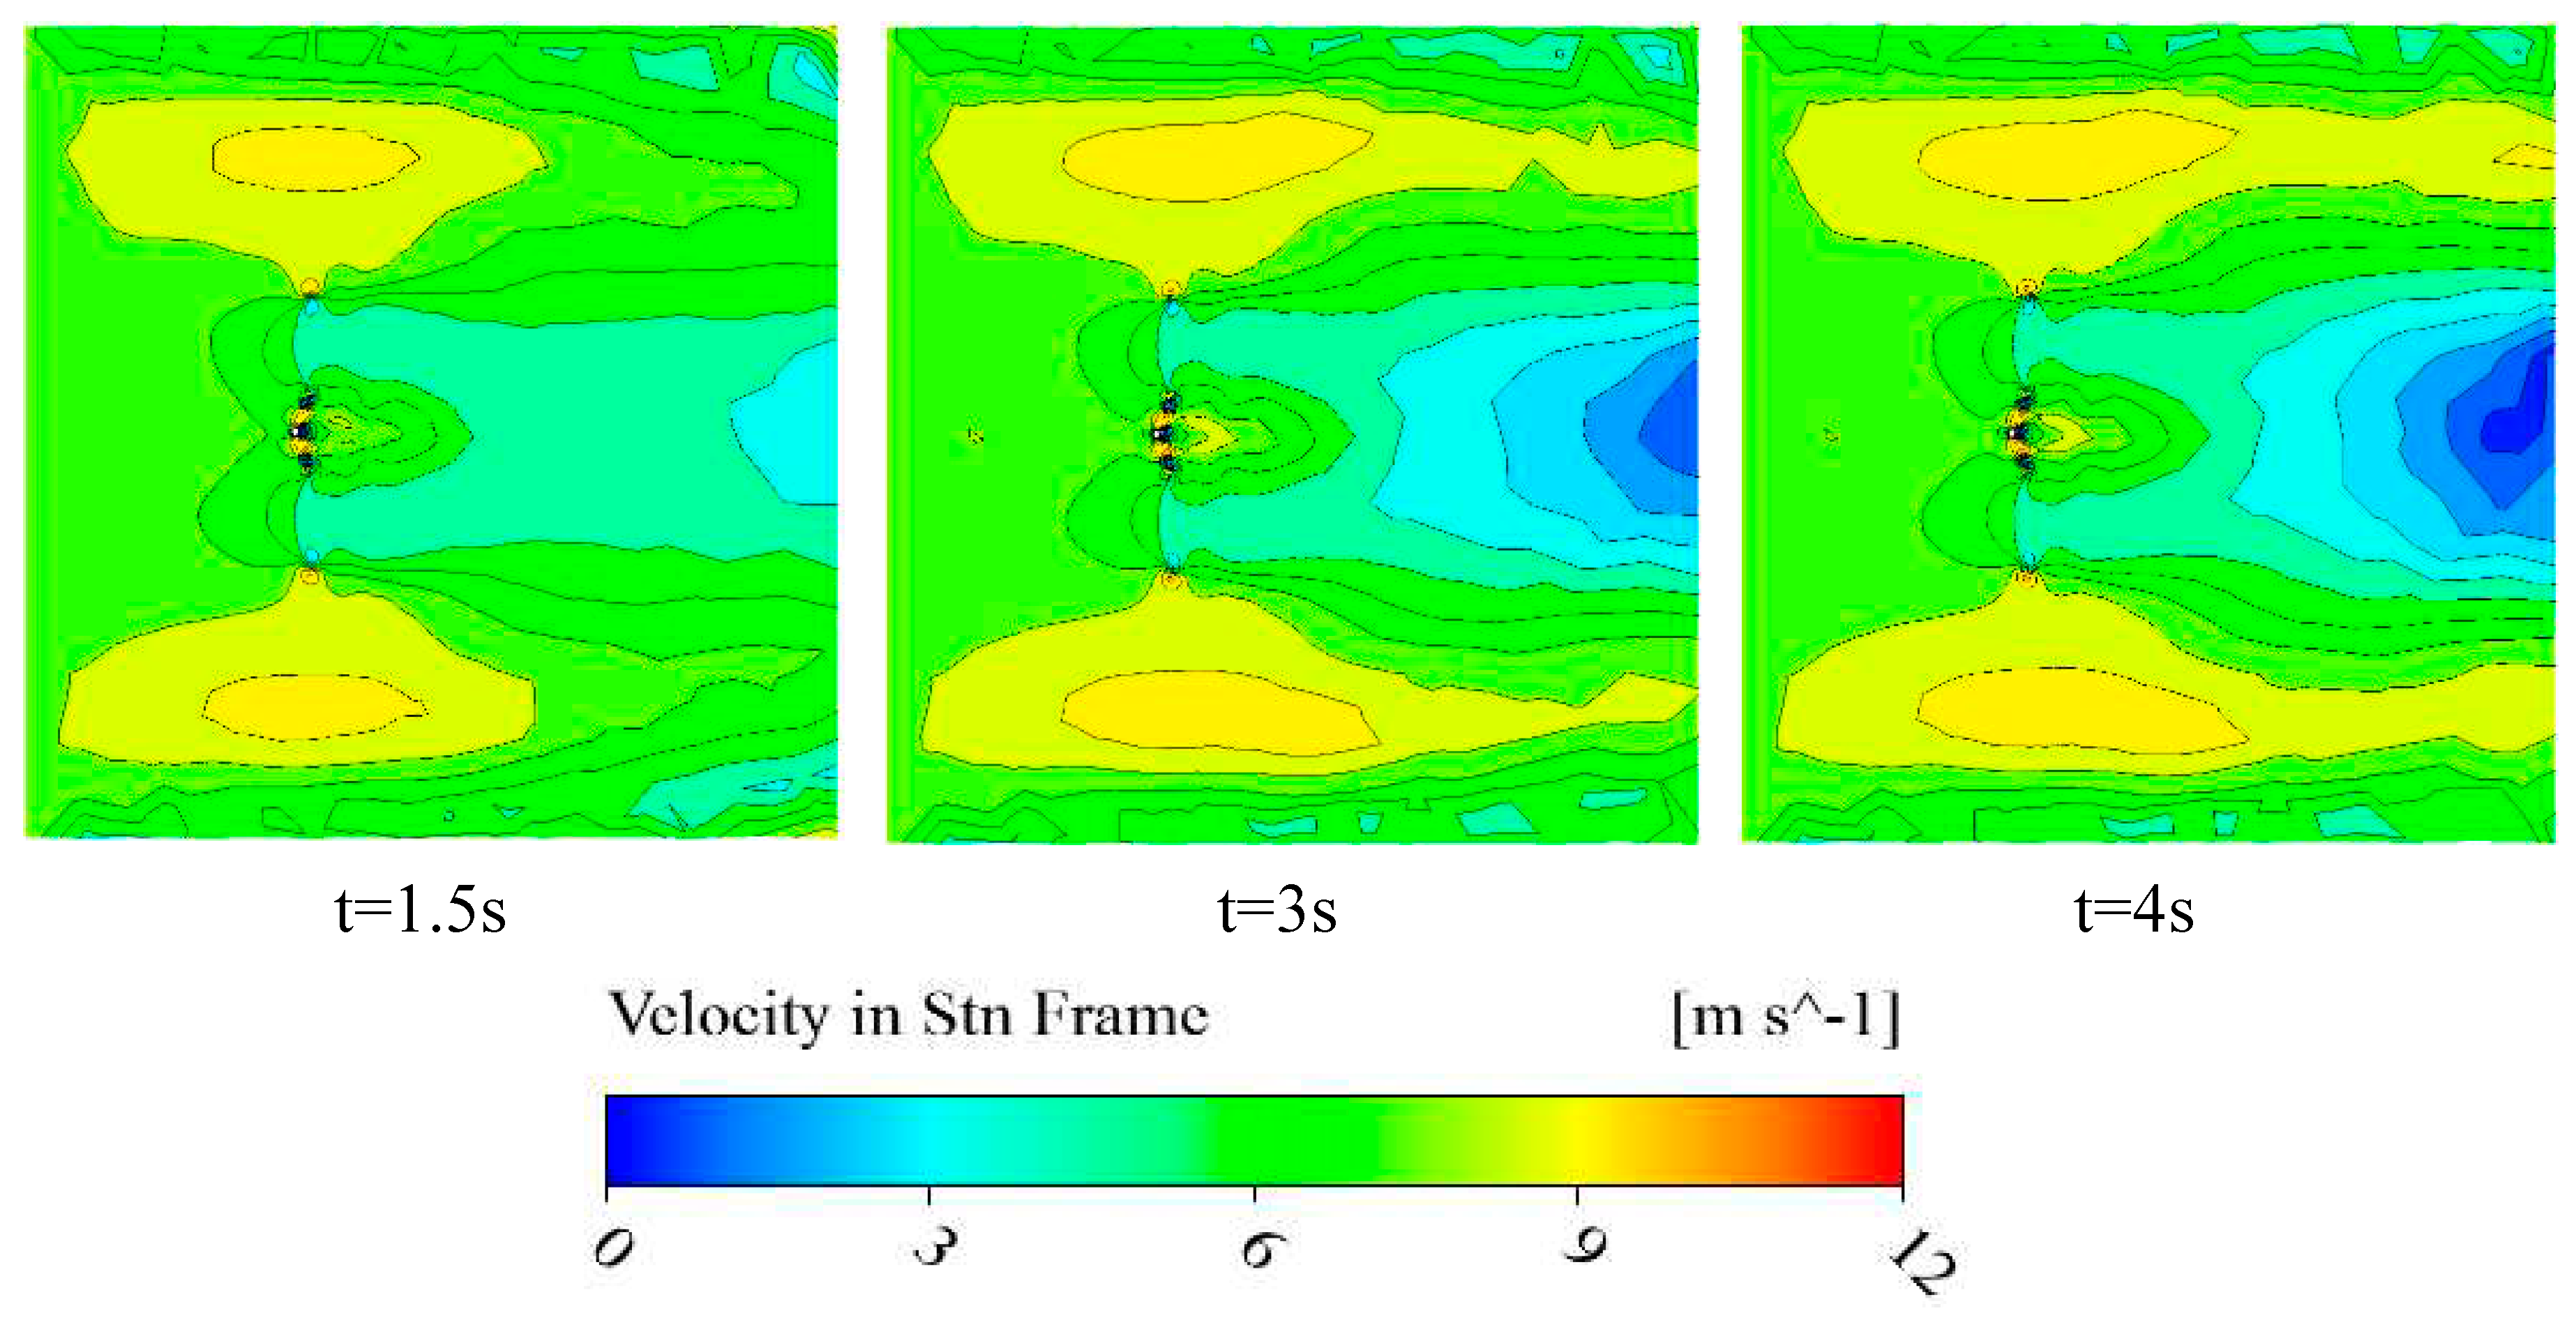
Figure 17, it is obvious that the trend of velocity-changing is visible obviously (in t=1.5, 3 and 4 seconds). It is detectable that the maximum velocity occurs in the tip blade and by clockwise circulation the vortexes behind the blade are visible. However,
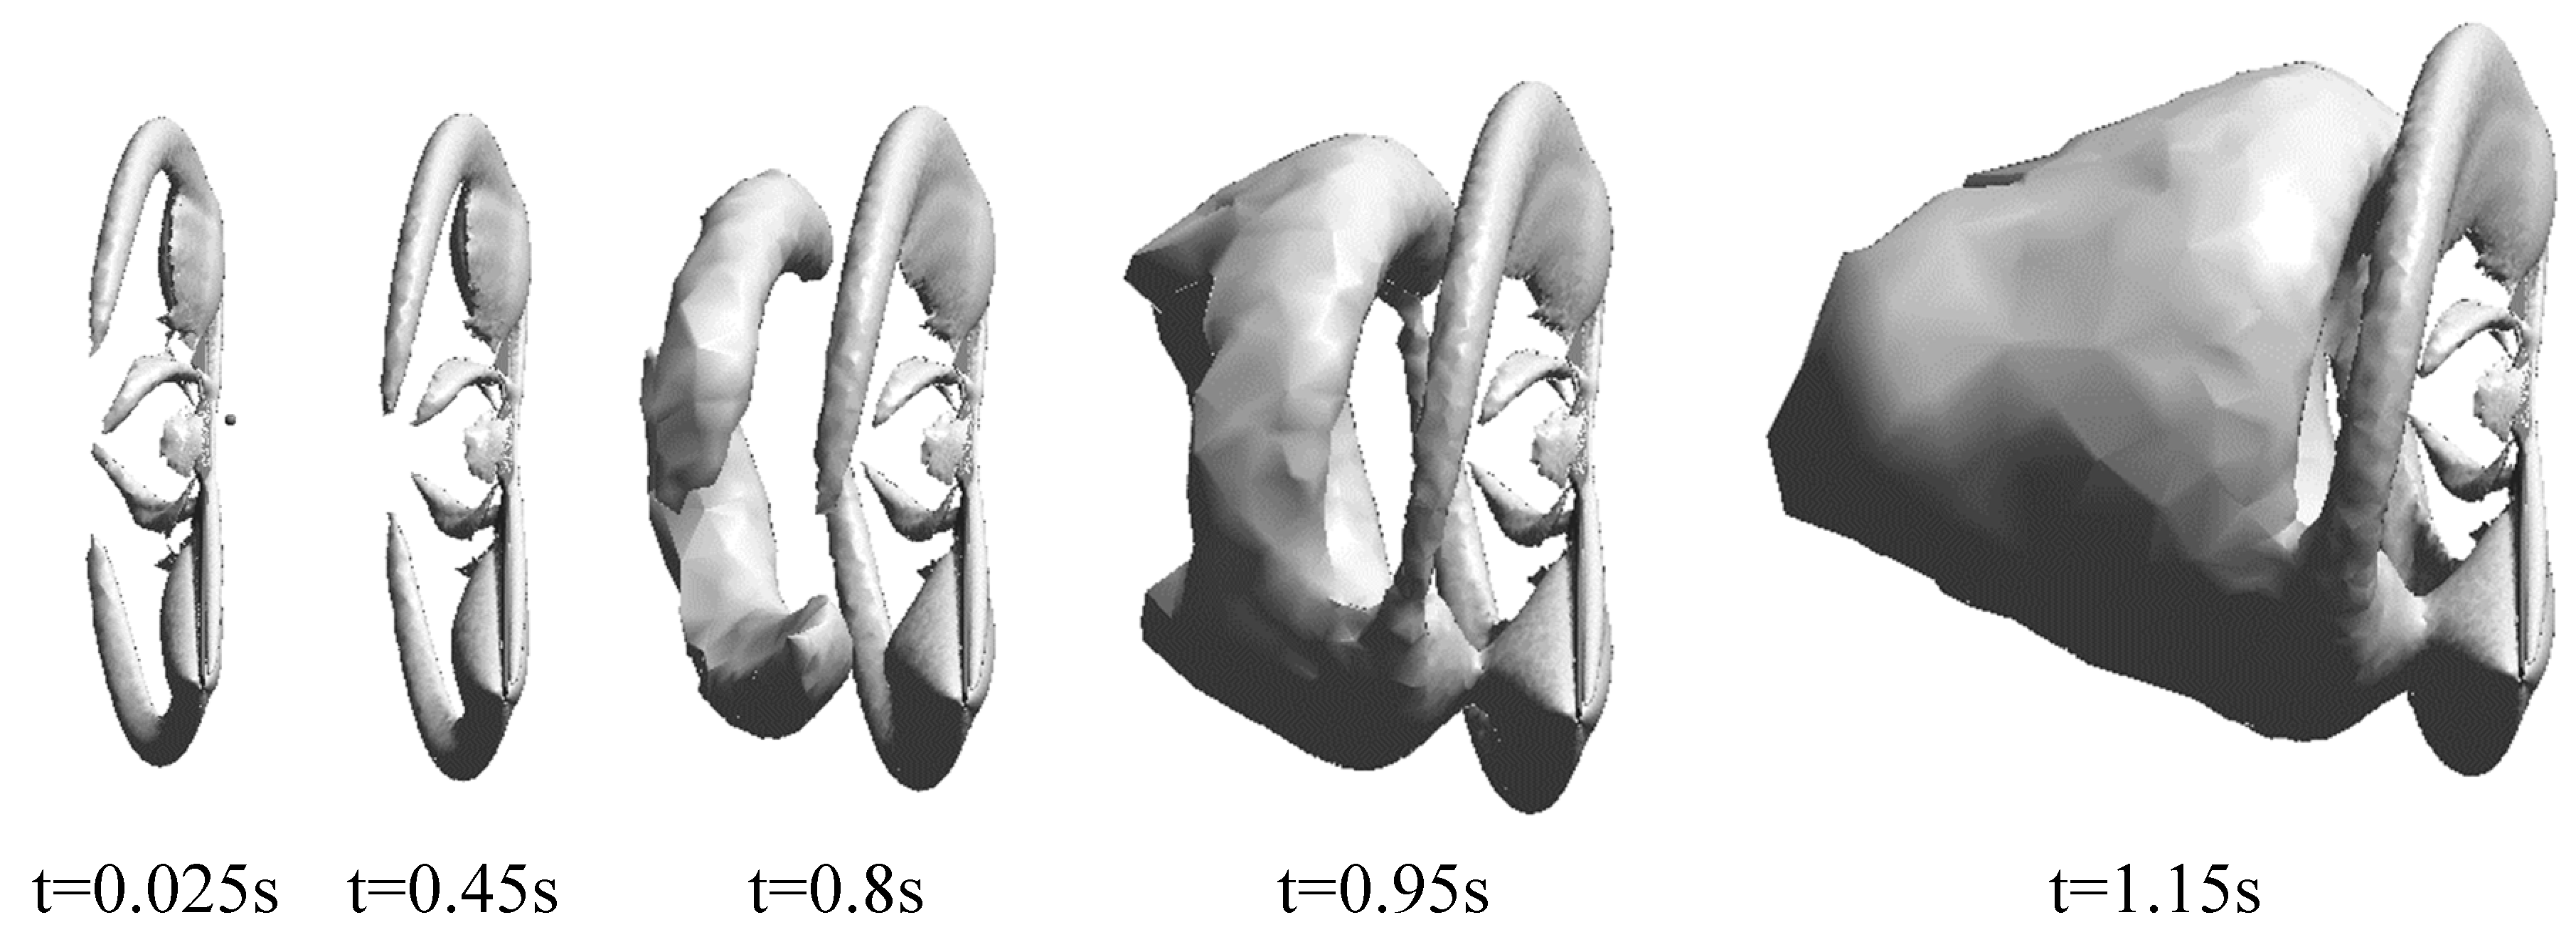
Figure 18 illustrates the volume of the vortexes which are formed behind the wind turbines in 0.25, 0.45, 0.8, 0.95, 1.15 time- steps respectively. The white volume formed on the turbine blade has presented the vortexes which are formed by the wind turbine. By increasing the time duration the volume of vortexes are increased. In the other word, by increasing time, vortexes are formed twisty or torch form. Thus, it can be seen that the region behind the hub is referenced to hub-vortex which is less than in comparison with a tip of the blade. Furthermore, by passing the time, the continuity of vortexes is extended.
4. Conclusion
According to the importance of achievement and derivation of wind turbines thanks to its financial and environmental benefits, increasing efficiency and hydraulic performance of this type of turbines is an essential issue. The importance of modeling and analyses of wind turbines in various aerodynamic condition is obviously accepted by researchers. The vortexes which are formed on the blade create difficulties for simulating turbines. The aim of this study is analyzing the effect of sand particless on the performance of the axial wind turbine in an unsteady situation. The numerical results have excellent adaption with experimental results. The average error for pressure distribution in 7m/s velocity of wind and all sections of the wind turbine is around 5%. In addition, the average error for the torque values of the turbine in 9m/s wind velocity is lower than 3%. The results of numerical study illustrates that by increasing wind velocity, mechanical power and thrust is increased gradually and pressure distribution on the surfaces is irregular due to turbulence intensity but larger sand particless sizes, have more loss in power, thrust and torque when the wind with sand particless particless blows to the turbine blades, creates a drag force and following that, lift force decreases. The reports are showing that most of the vortexes are sourced in a tip blade, however, the rotor hub is the reason of the vortexes as well.
References
- Otero AD, Ponta FL. On the structural behaviour of variable-geometry oval-trajectory Darrieus wind turbines. Renew Energy 2009;34:827–32. [CrossRef]
- Zare J, Hosseini SE, Rastan MR. NREL Phase VI wind turbine in the dusty environment. ArXiv Prepr ArXiv230406285 2023. [CrossRef]
- World Energy Assessment: Energy and the Challenge of Sustainability | UNDP n.d.
- Shojaeefard MH, Hosseini SE, Zare J. Numerical simulation and multi-objective optimization of the centrifugal pump inducer. Modares Mech Eng 2018;17:205–16.
- Shojaeefard MH, Hosseini SE, Zare J. CFD simulation and Pareto-based multi-objective shape optimization of the centrifugal pump inducer applying GMDH neural network, modified NSGA-II, and TOPSIS. Struct Multidiscip Optim 2019;60:1509–25. [CrossRef]
- Karimi O, Koopaee MK, Tavakolpour-Saleh A reza, Hosseini SE. Investigating Overlap Ratio Effect on Performance of a Modified Savonius Wind Turbine: An Experimental Study. Preprints 2023. [CrossRef]
- Malik AW, Uddin N, Hameed Ul Haq SM, Khan MFU, Hayat S. Modeling and Simulation of a Three-Dimensional Adjustable Horizontal Axis Wind Turbine Blade, Using a Commercial Computational Fluid Dynamics (CFD) Code. Vol. 7 Fluids Eng., ASME; 2017, p. V007T09A077. [CrossRef]
- Yan J, Deng X, Korobenko A, Bazilevs Y. Free-surface flow modeling and simulation of horizontal-axis tidal-stream turbines. Comput Fluids 2017;158:157–66. [CrossRef]
- Liu X, Lu C, Liang S, Godbole A, Chen Y. Vibration-induced aerodynamic loads on large horizontal axis wind turbine blades. Appl Energy 2017;185:1109–19. [CrossRef]
- Amin Allah V, Shafiei Mayam MH. Large Eddy Simulation of flow around a single and two in-line horizontal-axis wind turbines. Energy 2017;121:533–44. [CrossRef]
- Kaya MN, Kose F, Ingham D, Ma L, Pourkashanian M. Aerodynamic performance of a horizontal axis wind turbine with forward and backward swept blades. J Wind Eng Ind Aerodyn 2018;176:166–73. [CrossRef]
- Zare J, Hosseini SE, Rastan MR. Airborne dust-induced performance degradation in NREL phase VI wind turbine: a numerical study. Int J Green Energy 2023:1–20. [CrossRef]
- Song MX, Chen K, He ZY, Zhang X. Wake flow model of wind turbine using particles simulation. Renew Energy 2012;41:185–90. [CrossRef]
- Porté-Agel F, Wu Y-T, Lu H, Conzemius RJ. Large-eddy simulation of atmospheric boundary layer flow through wind turbines and wind farms. J Wind Eng Ind Aerodyn 2011;99:154–68. [CrossRef]
- Bartl J, Pierella F, Sætrana L. Wake Measurements Behind an Array of Two Model Wind Turbines. Energy Procedia 2012;24:305–12. [CrossRef]
- Gómez-Elvira R, Crespo A, Migoya E, Manuel F, Hernández J. Anisotropy of turbulence in wind turbine wakes. J Wind Eng Ind Aerodyn 2005;93:797–814. [CrossRef]
- Whale J, Anderson C., Bareiss R, Wagner S. An experimental and numerical study of the vortex structure in the wake of a wind turbine. J Wind Eng Ind Aerodyn 2000;84:1–21. [CrossRef]
- A B, A S, O G, C M. Numerical Investigation of Turbulent Flow around a Recent Horizontal Axis Wind Turbine using Low and High Reynolds Models 2017;FM.
- Cheng Y, Lien FS, Yee E, Sinclair R. A comparison of large Eddy simulations with a standard k–ε Reynolds-averaged Navier–Stokes model for the prediction of a fully developed turbulent flow over a matrix of cubes. J Wind Eng Ind Aerodyn 2003;91:1301–28. [CrossRef]
- Sanderse B, Pijl SP, Koren B. Review of computational fluid dynamics for wind turbine wake aerodynamics. Wind Energy 2011;14:799–819. [CrossRef]
- Zhang W, Markfort CD, Porté-Agel F. Wind-Turbine Wakes in a Convective Boundary Layer: A Wind-Tunnel Study. Boundary-Layer Meteorol 2013;146:161–79. [CrossRef]
- Hand MM, Simms DA, Fingersh LJ, Jager DW, Cotrell JR. Unsteady Aerodynamics Experiment Phase V: Test Configuration and Available Data Campaigns; TOPICAL 2001.
- Rocha PAC, Rocha HHB, Carneiro FOM, Vieira da Silva ME, Bueno AV. k–ω SST (shear stress transport) turbulence model calibration: A case study on a small scale horizontal axis wind turbine. Energy 2014;65:412–8. [CrossRef]
- Rocha PAC, Rocha HHB, Carneiro FOM, da Silva MEV, de Andrade CF. A case study on the calibration of the k–ω SST (shear stress transport) turbulence model for small scale wind turbines designed with cambered and symmetrical airfoils. Energy 2016;97:144–50. [CrossRef]
- Ghasemian M, Ashrafi ZN, Sedaghat A. A review on computational fluid dynamic simulation techniques for Darrieus vertical axis wind turbines. Energy Convers Manag 2017;149:87–100. [CrossRef]
- Hosseini SE, Karimi O, AsemanBakhsh MA. Experimental Investigation and Multi-objective Optimization of Savonius Wind Turbine Based on modified Non-dominated Sorting Genetic Algorithm-II. Preprints 2023. [CrossRef]
- Hosseini SE, Keshmiri A. Experimental and numerical investigation of different geometrical parameters in a centrifugal blood pump. Res Biomed Eng 2022. [CrossRef]
- Yelmule MM, VSJ EA. International journal of renewable energy research IJRER. vol. 3. Gazi Univ., Fac. of Technology, Dep. of Electrical et Electronics Eng; 2013.
Figure 1.
Shape model of the NREL Phase VI wind turbine blade.
Figure 1.
Shape model of the NREL Phase VI wind turbine blade.
Figure 2.
Computational domain of the studied wind turbine.
Figure 2.
Computational domain of the studied wind turbine.
Figure 3.
Comparison of the turbulence models at 7 m/s wind speed.
Figure 3.
Comparison of the turbulence models at 7 m/s wind speed.
Figure 4.
Computational mesh and boundaries of blade.
Figure 4.
Computational mesh and boundaries of blade.
Figure 5.
Mesh independency on axial wind turbine.
Figure 5.
Mesh independency on axial wind turbine.
Figure 6.
The value of on blade
Figure 6.
The value of on blade
Figure 7.
Comparison experimental and numerical results of torque (a) and mechanical power (b).
Figure 7.
Comparison experimental and numerical results of torque (a) and mechanical power (b).
Figure 8.
Comparison experimental and numerical results of thrust.
Figure 8.
Comparison experimental and numerical results of thrust.
Figure 9.
Pressure distribution on blade the wind turbine at variable wind speed.
Figure 9.
Pressure distribution on blade the wind turbine at variable wind speed.
Figure 10.
velocity distribution on a plane that across the center of the wind turbine blade.
Figure 10.
velocity distribution on a plane that across the center of the wind turbine blade.
Figure 11.
velocity distribution in a plane that frontal the center of the blade of axial wind turbine.
Figure 11.
velocity distribution in a plane that frontal the center of the blade of axial wind turbine.
Figure 12.
Effect of sand particless on the performance of the wind turbine.
Figure 12.
Effect of sand particless on the performance of the wind turbine.
Figure 13.
Effect of sand particless on the wind turbine thrust.
Figure 13.
Effect of sand particless on the wind turbine thrust.
Figure 14.
Comparison of experimental and numerical results for pressure distirbutions at 5m/s wind speed along the chord length.
Figure 14.
Comparison of experimental and numerical results for pressure distirbutions at 5m/s wind speed along the chord length.
Figure 15.
Pressure distribution on blade of axial wind turbine at 7m/s wind speed.
Figure 15.
Pressure distribution on blade of axial wind turbine at 7m/s wind speed.
Figure 16.
Velocity distribution in 7 m/s wind speed for axial wind turbine at frontal view.
Figure 16.
Velocity distribution in 7 m/s wind speed for axial wind turbine at frontal view.
Figure 17.
Velocity distribution in 7 m/s wind speed for the wind turbine at cross view.
Figure 17.
Velocity distribution in 7 m/s wind speed for the wind turbine at cross view.
Figure 18.
Volume of vortex for the wind turbine in t=0.25, 0.45, 0.8, 0.95, 1.15 seconds.
Figure 18.
Volume of vortex for the wind turbine in t=0.25, 0.45, 0.8, 0.95, 1.15 seconds.
Table 1.
Specification of the NREL Phase VI wind turbine [
22].
Table 1.
Specification of the NREL Phase VI wind turbine [
22].
| Number of Blade |
2 |
| Rotor Radius (m) |
5.029 |
| Rotational Speed (rpm) |
72 |
| Rated power (rpm) |
19.8 |
| Rotational Direction |
CCW |
| Global Pitch angle (deg) |
5 |
Table 2.
Sequence S Operating conditions [
28].
Table 2.
Sequence S Operating conditions [
28].
| Wind speed (m/s) |
Rotor Speed (rpm) |
Density (kg/m3) |
Pitch-B1 (deg) |
| 5 |
72 |
1.243452 |
2.98 |
| 7 |
72 |
1.245786 |
2.98 |
| 10 |
72 |
1.245896 |
2.98 |
| 13 |
72 |
1.226577 |
2.98 |
| 15 |
72 |
1.224037 |
2.98 |
| 20 |
72 |
1.223355 |
2.98 |
| 25 |
72 |
1.219684 |
2.98 |
|
Disclaimer/Publisher’s Note: The statements, opinions and data contained in all publications are solely those of the individual author(s) and contributor(s) and not of MDPI and/or the editor(s). MDPI and/or the editor(s) disclaim responsibility for any injury to people or property resulting from any ideas, methods, instructions or products referred to in the content. |
© 2023 by the authors. Licensee MDPI, Basel, Switzerland. This article is an open access article distributed under the terms and conditions of the Creative Commons Attribution (CC BY) license (http://creativecommons.org/licenses/by/4.0/).
