Preprint
Technical Note

Conceptualization and Construction of a Low-Cost and Self-Made Device for Monitoring of Particulate Matter: A Step-by-Step Guide

Altmetrics

Downloads

173

Views

172

Comments

0

Submitted:

28 August 2023

Posted:

03 September 2023

You are already at the latest version

Alerts
Abstract
This publication aims to disseminate a step-by-step process that walks through the conceptualization and building of a low-cost (~ $150 monitoring device for airborne fine particulate matter (PM2.5), based on miniaturized sensors and components. Details on the implementation of the hardware and software are provided which facilitate the data acquisition, capture and analysis. The central components and their setup discussed in what follows include: the sensor device (called “P.ALP” – Ph.D. Air quality Low-cost Project), Arduino IDE (Integrated Development Environment) and R code (open-access software). A monitoring device for PM2.5, using low-cost sensors and technologies was successfully conceptualized, designed, and implemented. The P.ALP monitoring system was designed and developed to be a basic device, which can be further customized and implemented using the wide range of low-cost sensors available on the market.
Keywords: 
Subject: Environmental and Earth Sciences  -   Pollution

1. Introduction

1.1. Background

An increasing interest in the development of small, portable, and low-cost sensors for measuring airborne particulate matter concentrations and PM2.5 specifically (i.e., airborne particles with aerodynamic diameter < 2.5 µm) occurred in the past decade [1]. Prolonged exposure to fine PM is well known to have significant impacts on health in both the general population [2,3,4] and workers exposed in occupational settings [5]. The increased use of “next-generation” sensors and devices (i.e., low-cost, miniaturized, placeable, wearable, and implantable sensor technologies) for occupational hygiene and their role in the future of workplace-exposure assessment and risk assessment has recently been widely discussed [6,7,8,9,10,11,12,13,14]. Even though commercially-available products for researchers and citizen scientists became widely available in the last decade, the push for research on NGMSs (“next generation” monitors and sensors) [13] originated mainly in the occupational hygiene domain, as interest in practical applications for personal exposure assessment has increased [15]. Environmental hygiene applications of NGMSs are also of particular interest: PM2.5 concentrations (as well as other air pollutant concentrations) exhibit significant spatial and temporal variability, that may not be well described by the existing network of fixed-site monitoring stations [16,17]. The improvement of the detail of air pollution monitoring variability (especially in areas and settings where limited to no monitoring stations exists) could improve exposure assessment studies and thus also the understanding of the determinants of the exposure, possibly helping to reduce exposure and therefore the health risk [18,19]. As such, there has been a growing interest in new, lower-cost ways of measuring PM2.5 to achieve these goals [1]. Several technologies have emerged concerning the NGMSs, but the most relevant ones are based on optical methods (i.e., light scattering) for PM monitoring [1,11,13,20,21], making these sensors sensitive to changes in particle size distribution and composition, which may affect particle density and aerosol optical properties [20,21]. Further, these technologies could be affected by variations in temperature (T) and relative humidity (RH) [22,23] which must be taken into consideration during performance evaluation studies.

1.2. Problem statement

Overall, it is expected that the application of NMGS can make the exposure and risk assessment in environmental and occupational settings increasingly more convenient and more comprehensive [7,8,11,12,24]. To date, NGMSs cannot be used as reference-grade instrumentation for regulatory purposes, but they can be easily adopted for specific applications, improving exposure assessment studies in terms of spatiotemporal resolution, wearability, and adaptability to different types of projects and needs. When paired with reference methods, NGMSs can elevate the exposure assessment studies to a higher level of detail. Nevertheless, improvements are needed to further enhance the performance of NGMSs and allow their wider use in the field of exposure assessment [1,12,13]. There are plenty of different sensors and devices available on the market for PM2.5 measurement, based on different measuring principles [13] but most of the devices are sold as “black boxes” (i.e., a system that can be viewed in terms of its inputs and outputs (or transfer characteristics), with minimal knowledge of its internal workings). For this reason, the users usually are not inclined to (or cannot) customize these devices to find out the best setting which can best accommodate their needs. Furthermore, the study’s design could be driven by the characteristics of the available instrumentation, rather than the actual needs dictated by the work, thus affecting the results of the study (i.e., the exposure assessment and the risk assessment process).

1.3. Aim of the study

Based on what is reported above, this study aims to document the process of designing and assembling a self-made complete device for monitoring PM2.5 as well as T and RH because these latter can deeply affect the PM data quality [11]. The device has been called P.ALP (PhD. Air Quality Low-cost Project), and it was conceptualized and built using miniaturized and low-cost sensors and components. The miniaturized and low-cost components (which are widely available in normal public purchase channels as e-commerce websites at an affordable cost) and the here-reported step-by-step guide about the device development, would allow anyone interested to get the components and to build their own monitoring device.

2. Materials and Methods

This paragraph describes the P.ALP monitoring system, based on an ArduinoTM board including the design specification and conceptualization (Section 2.1), the hardware components that have been acquired and assembled to create the device (Section 2.2) and the assembling of the device (Section 2.3) that reports the PIN (Personal Identification Number) connections including the wiring diagram. The following subparagraph is about the software development, which is also fundamental for the usage of the P.ALP (Section 2.4). The latter section explains the usage of the P.ALP. (Section 2.5) reporting the user manual of the monitoring device. All the sensing hardware components were selected and acquired based on the outcomes coming from previous systematic literature reviews [12,13] because of their wide usage and reliability.

2.1. Design Specification and Concept

To better introduce the readers to this section, the P.ALP will be described by splitting it into five different units: (i) the “microcontroller board unit”; (ii) the “sensing unit”, composed of a sensor for PM2.5 measurement, and a sensor for measurement of two additional parameters, namely Temperature (T) and Relative Humidity (RH); (iii) the “power supply” unit; (iv) the “data storage unit”; and (v) the “timing unit”.
The conceptualization of the monitoring system (i.e., the relationships between the units listed above) is reported in Figure 1. Details of each hardware component are presented in Table 1 and Section 2.2. The microcontroller board unit (#1 in Figure 1—i.e., “the core” of the P.ALP) conducts the mathematical operation needed to convert the analog signals received from the two sensors (#2) (the sensing unit) into PM2.5 [µg/m3], T [°C] and RH [%] value and store this information in the data storage unit (#4). The “power supply unit” (#3) supplies energy for the entire system. The “timing unit” (#5) provides the right timing to the system, to have a “timestamp”, and therefore to create a series of data in chronological order, that can be stored in the “data storage unit” and then downloaded on a computer (#6). Proper software/code is needed to make the device work and to manage the collected data. Other peripheral materials (cables, adapters, etc.) may be necessary in the packaging phase.
The description of the P.ALP implementation has been divided into three sections. Section 2.2 is focused on reporting all the hardware components that have been acquired and assembled to obtain the device. Section 2.3 reports the PIN connections and the wiring diagram of the device. Section 2.4 is about software development, which is also fundamental for the usage of the P.ALP.

2.2. Hardware

Table 1 shows a summary of each hardware component. A brief description of each component is provided below.

2.2.1. Microcontroller

Concerning the microcontroller board selection, the information collected by two recent systematic reviews of the literature [12,13] suggested that the most used microcontrollers are the ArduinoTM Uno R3 Board and the Raspberry Pi microcontroller. While both boards have pros and cons, it was decided to develop the prototype on the ArduinoTM Uno R3 Board because it is generally recognized as more user-friendly than the Raspberry Pi. The ArduinoTM Uno R3 board was used to design and develop the initial prototype of the device. In a later phase of the development, four Elegoo Uno R3 boards have been acquired, aiming to further reduce the production costs ($16.99 for the Elegoo board instead of $28.50 for the Arduino one) of the device. Elegoo Uno-R3 board (Figure S2) has the same characteristics as the Arduino one and it is also equipped with the ATmega328P microcontroller.

2.2.1.1. Arduino/Elegoo UNO-R3 Board

ArduinoTM and Elegoo Uno R3 (Figures S1 and S2) are low-cost microcontroller boards, equipped with the AT mega328P microcontroller, 6 analog input PINs (A0-A5), and 14 I/O digital PINs. The dimensions of the boards are 68.6 mm (length) and 53.4 mm (width). The boards can be powered through a 5V DC external power supply or also with the USB B port. All the specifications of the Arduino [25] and Elegoo [26] boards are summarized in Table 2.

2.2.2. PMS5003 Sensor

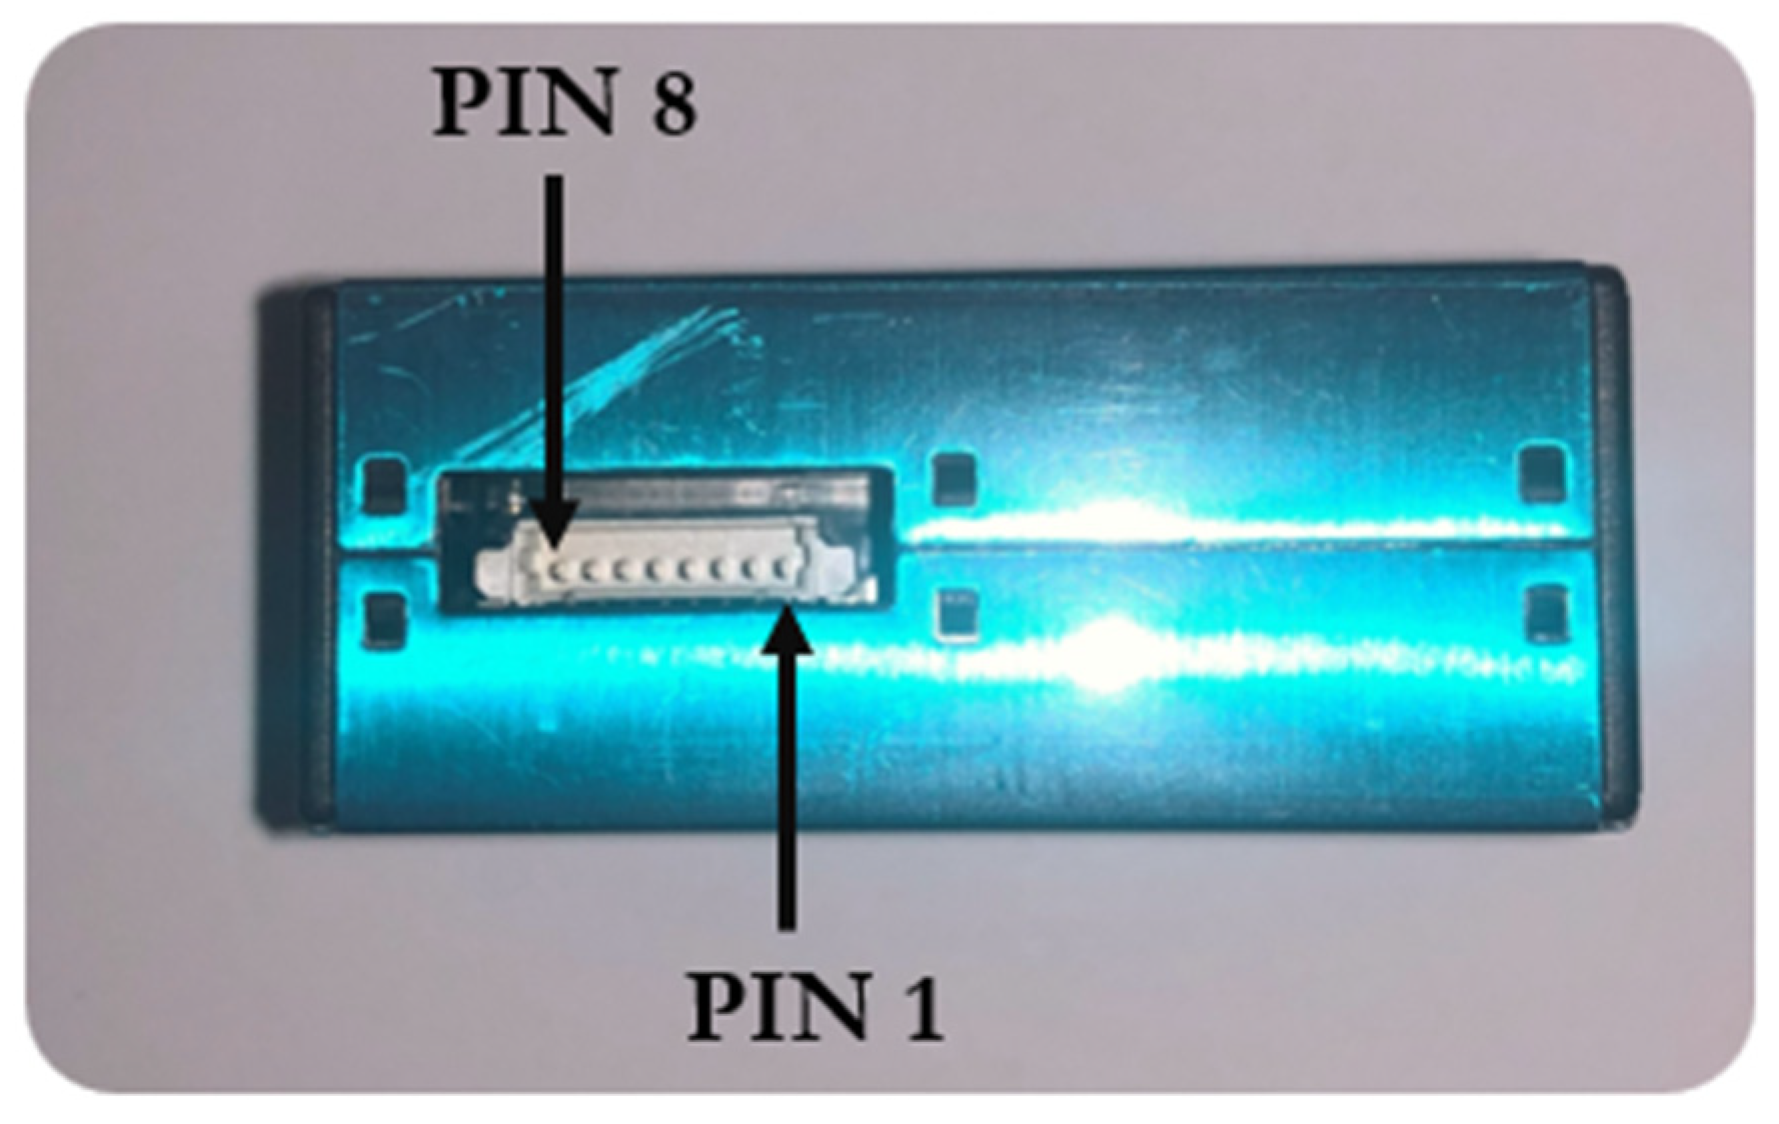
The Plantower PMS5003 sensor (Figure S3) is a particle concentration sensor, which can be used to obtain the number of suspended particles (PM2.5) in the air and to output them, in the form of a digital interface, providing concentration data over time. The working principle is based on light scattering by using a laser to radiate suspending particles in the air, then collect scattering light to a certain degree and finally obtain the curve of scattering light change with time. The equivalent particle diameter and the number of particles with different diameter per unit volume can be calculated by a microprocessor-based on Mie scattering theory. Those types of sensors are commonly tested and calibrated by the producer on a standard aerosol (e.g., Arizona Road Dust—ARD) and then should be tuned in the field based on the optical performance of the sensor for the specific aerosol present in the environment. Moreover, based on PM2.5 data, the sensor, if properly programmed, can extrapolate data for PM1 and PM10 as well. The unit volume of the obtained particle number is 0.1L and the unit of mass concentration is µg/m3. The manufacturer uses a proprietary algorithm to convert the number of pulses to PM concentration. The standard option for digital output is the active mode which means that the sensor, once it has been powered, would send serial data to the host automatically. PMS5003 technical specs (Table 3) [27] and the PIN’s function definition (Figure 2 and Table 4) are reported below.

2.2.3. DHT22 Sensor

The DHT22 (also called AM2302) (Figure S4) is a low-cost humidity and temperature sensor. It provides, through digital signals, data about ambient temperature and relative humidity. It uses a capacitive humidity sensor and a thermistor to measure the surrounding air and generates a digital signal on the data PIN. DHT22 technical specs [28] (Table 5) and the PIN Definition (Figure 3 and Table 6) are reported below.

2.2.4. Real Time Clock DS3231

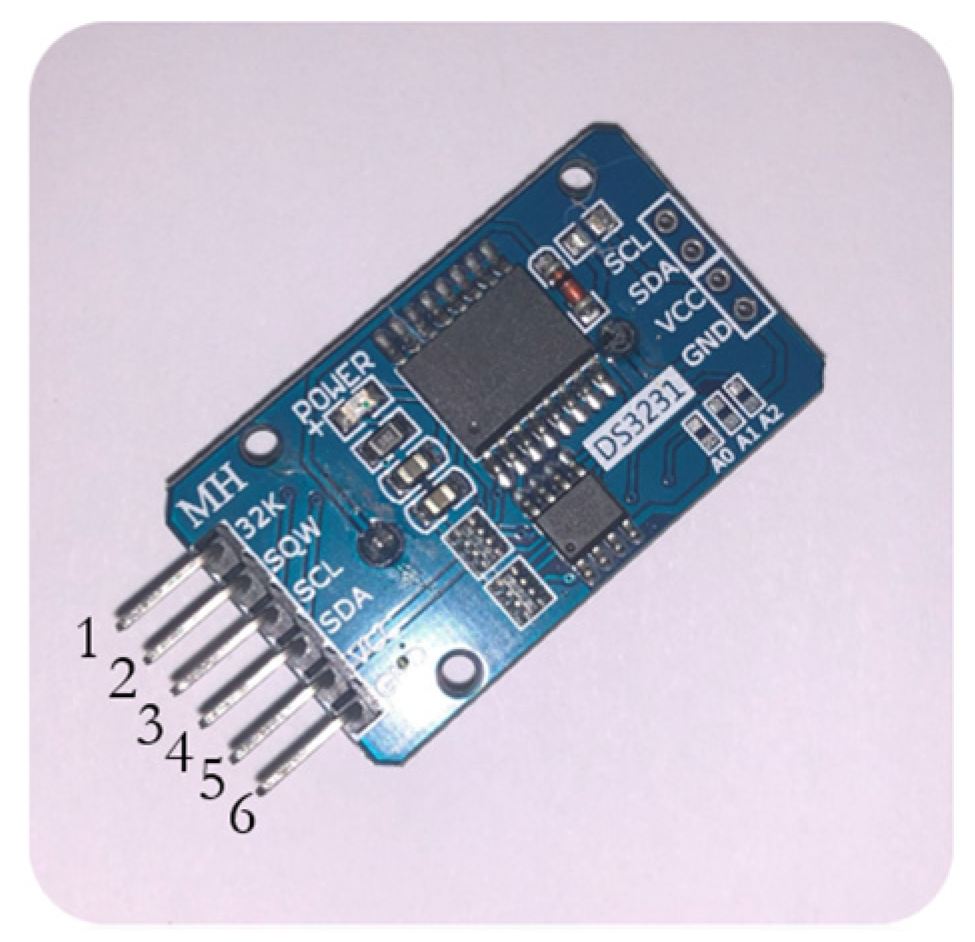
The DS3231 (Figure S5) is a low-cost I2C (Inter-Integrated Circuit) real-time clock (RTC) with an integrated temperature-compensated crystal oscillator (TCXO). The device incorporates a battery input and maintains accurate timekeeping when the main power to the device is interrupted. This RTC maintains seconds, minutes, hours, days, months, and years information. The DS3231 technical specs [29] (Table 7) and the PIN definition (Figure 4 and Table 8) are reported below.

2.2.5. Micro-SD card adapter

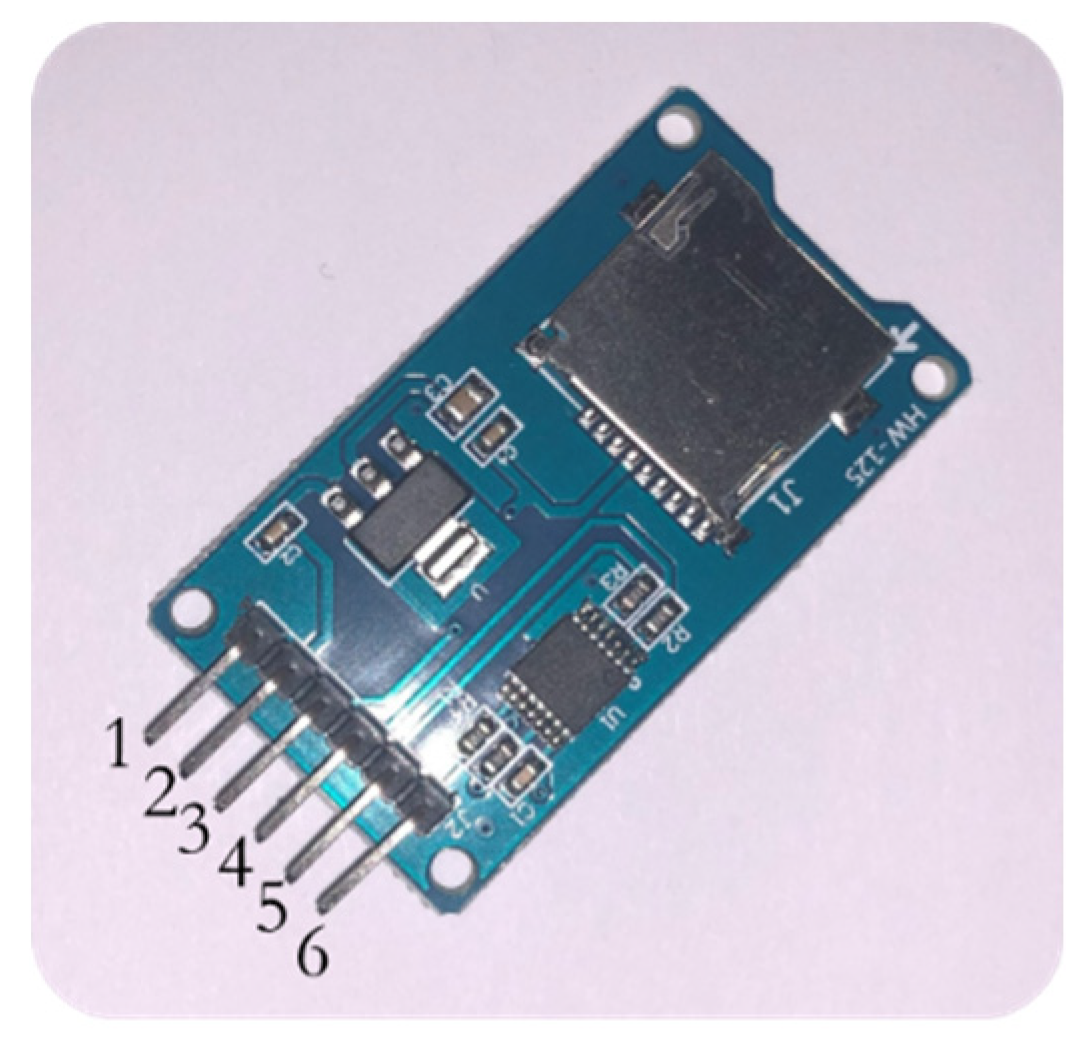
The micro-SD card adapter module (Figure S6) is the component that allows to store the data acquired from the sensors on a micro-SD card. The module includes an onboard ultra-low dropout voltage regulator capable of regulating voltage to 3.3V. The micro-SD card adapter also includes a 74LVC125A logic level shifter chip, allowing for safe and easy communication with the microcontroller without damaging the SD card. The micro-SD card adapter technical specs [30] (Table 9) and the PIN Definition (Figure 5 and Table 10) are reported below.

2.2.6. Micro-SD card

The micro-SD card is used to store the data acquired from the sensors, and processed by the microcontroller board, as an editable text file. The authors initially acquired four 1GB micro-SD cards (Figure S7) as data storage capacity was considered adequate for the project. If necessary to increase the storage capacity it is relatively inexpensive to acquire SD-Cards with higher capacity (as an example, in July 2023, a 16GB micro-SD is commercially available for $8.48).

2.2.7. Mini PCB Prototype solderable Breadboard

Initially, to build the P.ALP prototype, the authors used a prototype breadboard (Figure S8). Once the connections were defined, a tin solderable board (Figure S9) was acquired to avoid any possible voltage drop due to the unreliable contact between the wire’s PINs and the prototype breadboard.

2.2.8. USB type C to USB type B converter

This converter (Figure S10) is used to be able to plug a normal power bank with the microcontroller board to provide its power supply.

2.2.9. 4 Inch USB C cable

The 4-inch cable, USB C male to USB A male (Figure S11), links the microcontroller board directly to the power bank.

2.2.10. Power Bank

The power bank (Figure S12) is the battery of the P.ALP and it can power supply the device for (at least) 48 hours. The authors acquired 4 batteries with a capacity of 10400mAh and equipped with a display that shows the percentage remaining of the charge, the electric potential in Volt (V), and the electric current in Ampere (A) that is coming out of the battery.

2.2.11. Breadboard jumper wires

The jumper wires were used to connect the microcontroller board with the sensors, the RTC, the solderable board, and the micro-SD card reader. All the electrical connections were made using these wires which are provided in a 120-wire kit by Elegoo (Figure S13). In this latter, there are 40 F/F (Female/Female) wires, 40 M/M (Male/Male) wires, and 40 F/M (Female/Male) wires.

2.2.12. Storage lid/airtight container

A plastic box (Figure S14) was used to protect all the components of the P.ALP and to allow its usage in outdoor conditions. The plastic box was drilled and cut on one of its sides because of the need to leave the sensor’s inlets exposed to environmental conditions. The capacity of this box is 1.6L and the dimension are 165 × 231 × 68 mm. While this is a temporary solution, it allows for easy access to the components of the prototype at any time. It is possible to manufacture custom-made houses of different designs and materials.

2.2.13. Hardware acquisition

All the components needed to produce a P.ALP device are available on the market through, at least, one e-commerce website (Table 11).

2.3. PIN Connections and Assembling

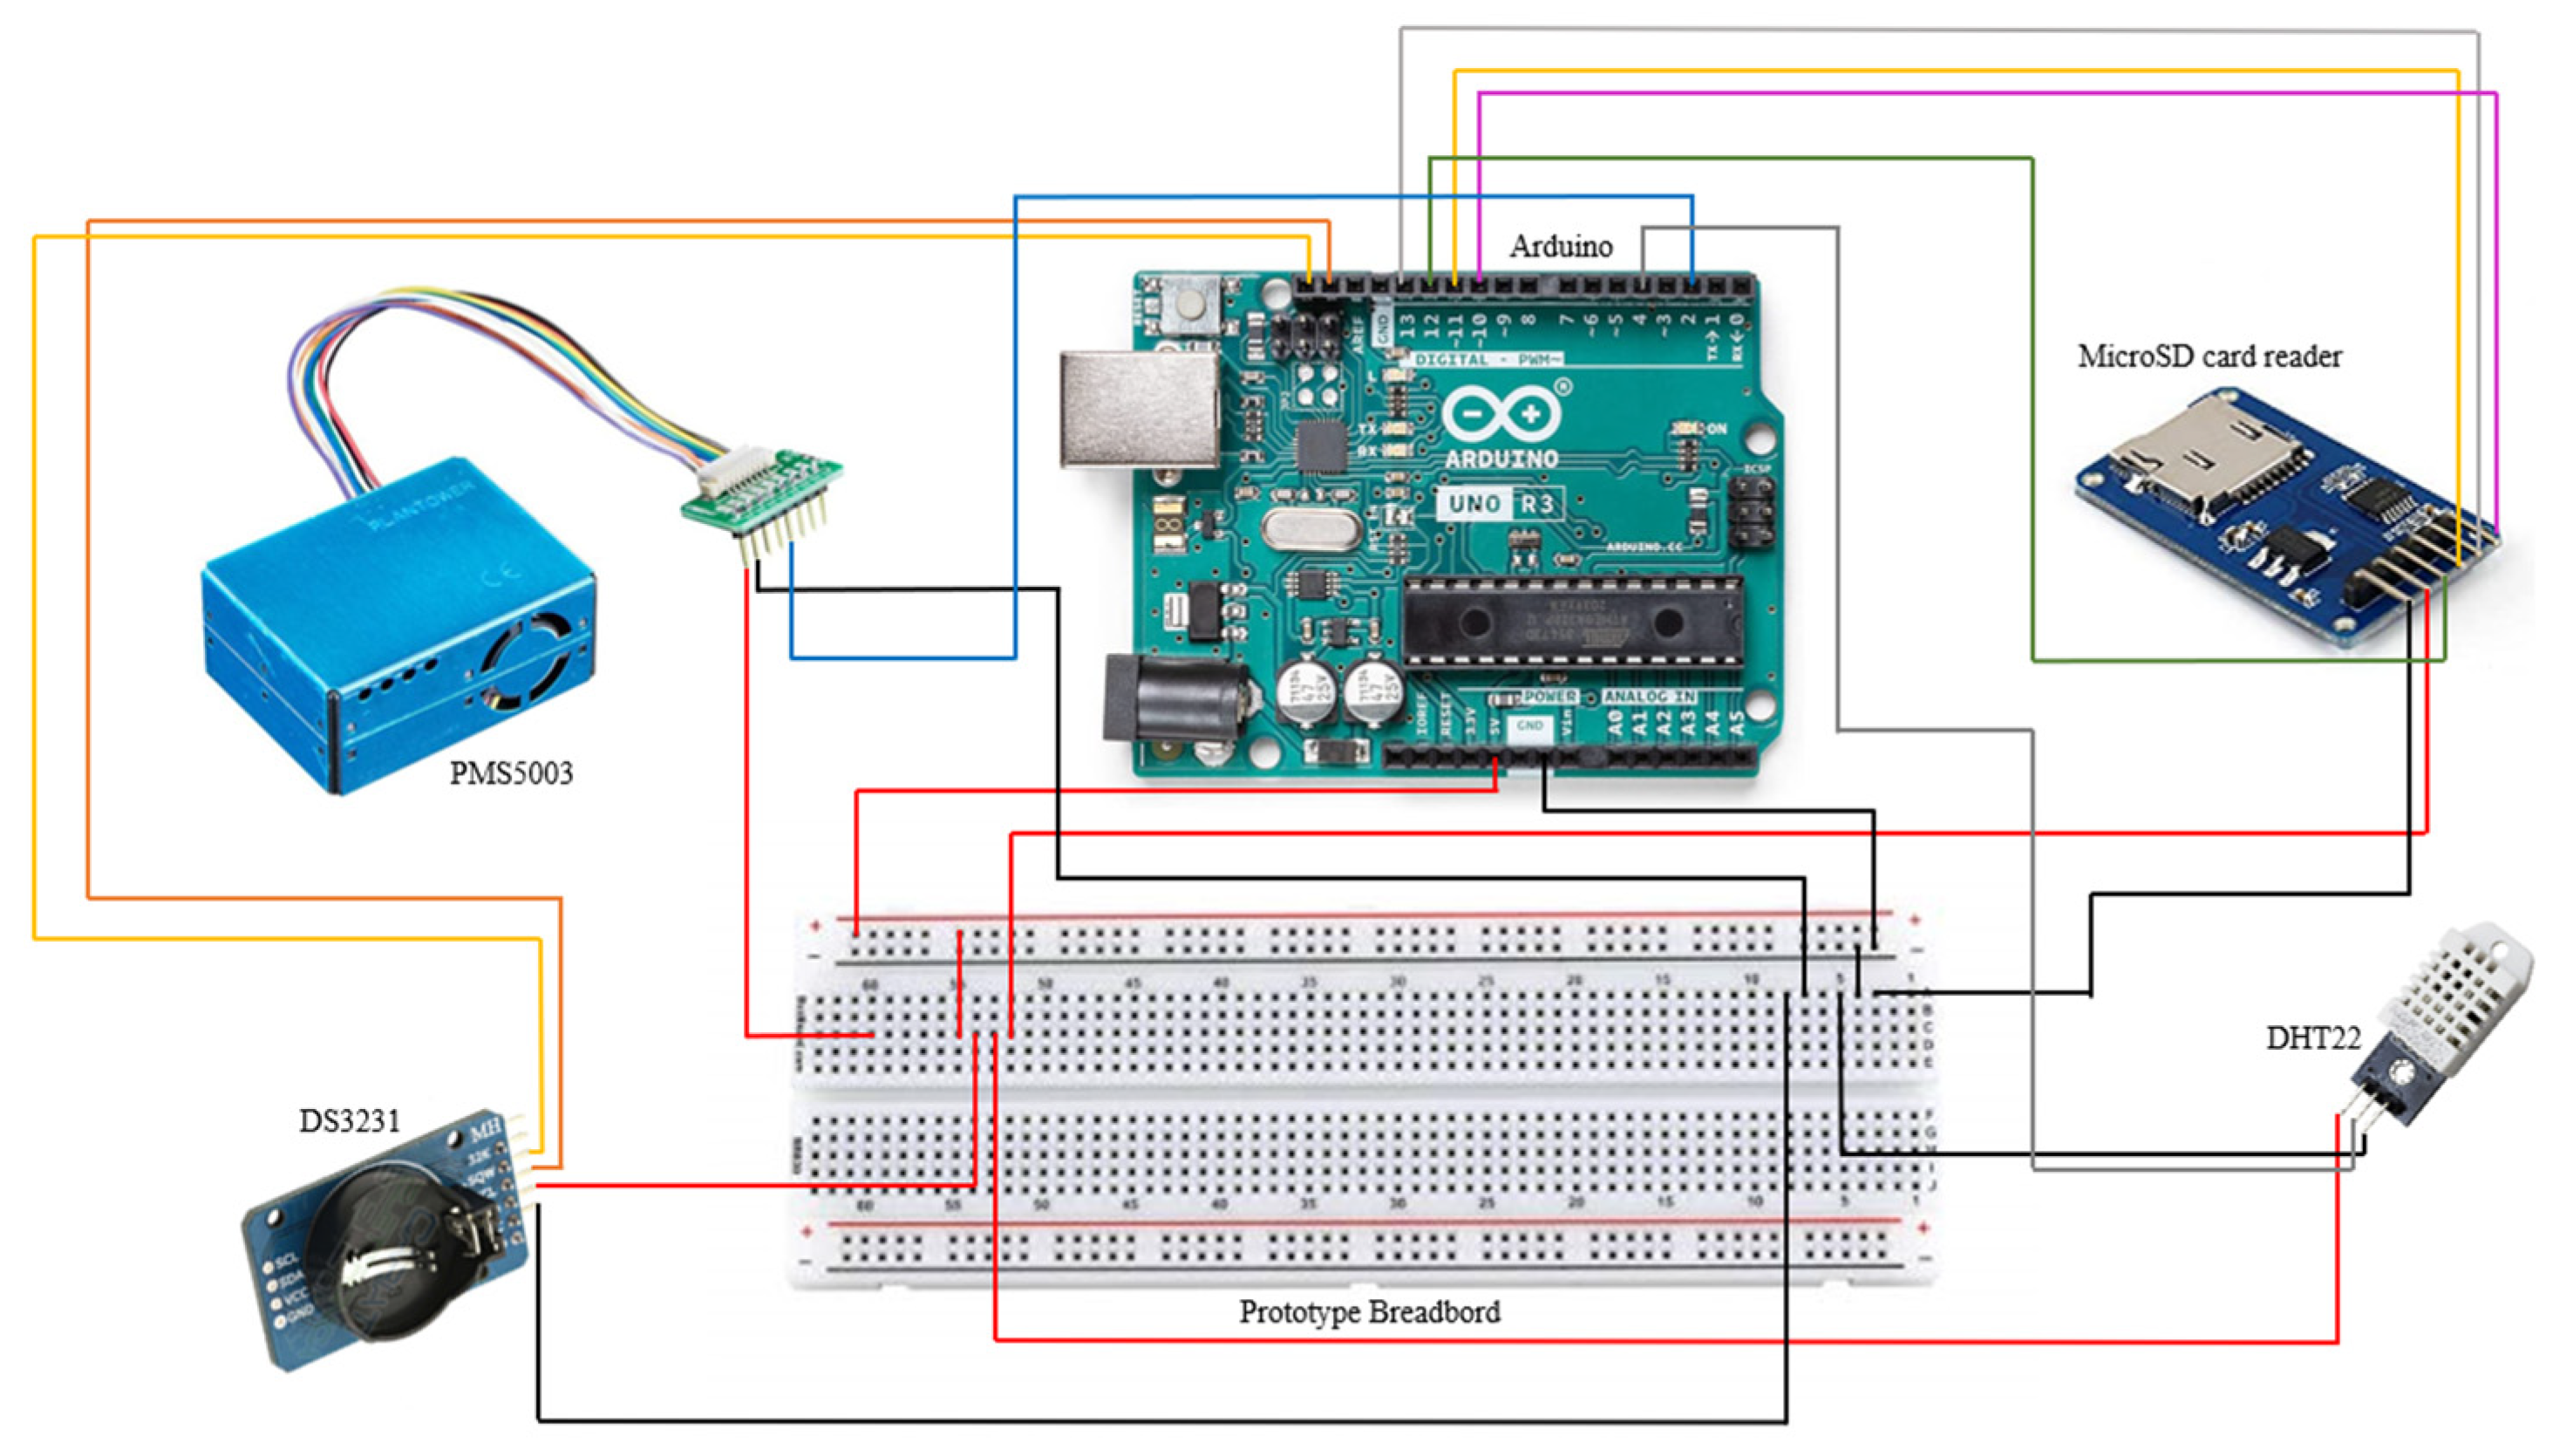
In this paragraph, an explanation of how to connect all the hardware components through the jumper wires is provided. By following this step-by-step guide, it is possible to obtain the prototype of the P.ALP device in its ready-to-use configuration. In Figure 6 all the electric connections between the microcontroller board and the other hardware components are reported. Table 12 summarizes all the PIN connections. When all the connections are completed and carefully verified, it is suggested to replace the breadboard with the solderable board to avoid any possible voltage drop. By inserting the micro-SD card in the micro-SD reader, data will be stored as a text file. The USB type C to B converter and the USB type C to A cable are the last two components to use that allow to power supply of the P.ALP with the power bank. To protect all the components from atmospheric and dirty agents, it is suggested to place the device inside a case (for example an airtight container as suggested above), while leaving the PMS5003 and DHT22 inlets exposed to real environmental conditions (so, for example, it might be necessary to cut a hole in one side of the case as shown in Figure S15).

2.4. Software Design

2.4.1. Arduino IDE

The Arduino IDE [45] is the open-source software used to write the sketch, which is the program that allows to acquire the data coming from the sensors and save it, as a text file, on the Micro-SD card. Once the code is uploaded on the microcontroller board it immediately starts to acquire data. The sketch for the P.ALP is available in the Supplemental Material (SM) as a text file that can be simply copied and pasted into another Arduino IDE, so it is ready to be implemented or uploaded on the microcontroller board. Since the sketch could not be used to efficiently handle data retrieved from the sensors, mainly due to different data acquisition rates of the different components, a dedicated R-code was written and implemented to solve these issues.

2.4.2. R Code

R software is an open-source programming language for computing and graphics, it allows the use of precompiled executables provided for various operating systems. An R code has been produced to solve the abovementioned P.ALP’s issues and it is available in the SM, ready to be used in the R environment. Running this code needs, the operator, to (i) take note of the daytime when the P.ALP is powered and, once the monitoring ends, (ii) take out the micro-SD card from the device and (iii) insert it in a PC. The R-code will read the “.txt” file saved on the micro-SD card and, after the manual insertion of the starting monitoring time, will create two different databases in “.csv” format, the first one with a one-second resolution and the second one with one-minute resolution.

2.5. Use of the P.ALP

In this paragraph, the correct usage of the P.ALP monitoring system is reported in 7 step-by-step passages:
  • Once the hardware of the P.ALP is assembled, the operator needs to upload the Arduino sketch (available in the SM) on the microcontroller board, to program it to acquire and save data. This latter operation must be conducted by connecting the board to a computer using the proper cable (provided with the board) and using the Arduino IDE software. For more detail on this operation, you could visit the official tutorial link [46].
  • Unplug the microcontroller board from the computer to shut down the P.ALP. At this stage, it is important to remove the micro-SD card from the micro-SD reader and format it.
  • Once the formatted micro-SD card is inserted back into the P.ALP the device will be ready to be used.
  • To start a monitoring session, turn on the P.ALP, by plugging in the power bank. The device will start measuring automatically. It is critical to take note of the monitoring start time (in 24-hour format—hh:mm:ss) and date (mm/dd/yyyy). This is because every time that the P.ALP is powered take as starting time the one at the last time “step 1” was performed.
  • To stop the monitoring session, it is enough to unplug the power bank.
  • Data are stored in the micro-SD. The R code (available in the SM) prepared for the use of P.ALP allows the operator to extract the collected data and organize results in two different databases, in which the data are ordered in chronological order with two different time resolutions (1 second and 1 minute). During this operation, it is fundamental to insert in the R-code the correct starting time and date, previously noted, of the monitoring session and to select the correct directory in which we want to work.
  • Once the databases have been saved on a different storage device, the operator must format the micro-SD card and put it back in the P.ALP. In this way, the device will be ready for the next session which can be performed by repeating the passages starting from Step 4.

3. Further Considerations

3.1. Practical tips for assembling the prototype

Before assembling the entire P.ALP system unit, each component should be tested separately to be sure that it works properly as a stand-alone. This phase consists of two steps: (i) Each sensor and electronic component should be tested using a multimeter to measure the power rating. Subsequently (ii) each component must be integrated separately one by one with the microcontroller board to ensure that, singularly, works as expected. Only at that time, it is suggested to integrate all the components aiming to build the first prototype. The software for the microcontroller board follows somehow the same procedure as the hardware development. Several pieces of code should be assembled in the Arduino IDE, then matched, and adapted to obtain the final code, which allows to save data from the sensors. The result of the previous phases is the P.ALP monitoring unit, able to be powered through a power bank or supplied by electrical current depending on the study design’s needs.

3.2. Future Developments

Four different P.ALP units were produced, and preliminary tests were conducted to verify their functionality, which has given a positive and satisfactory outcome. The technical functioning of the P.ALPs was assessed under several conditions to test its ability to perform in different types of study designs. As reported in the literature [12,23,47], the quality of the data generated by low-cost sensors is problematic, due to, for example, optical properties of the aerosol measured and interunit variability. The quality of the data will be evaluated and ideally managed creating correction factors (CF) which could be implemented straightly in the P.ALP code.
The P.ALP monitoring system was designed and developed to be a basic device, which can be further developed in a modular setting following specific study design’s needs (e.g., other air contaminants, data acquisition rate, battery capacity, data storage, data format, physical bulk, etc.). P.ALP could be customized using the wide range of low-cost sensors available on the market [12,13,22]. Starting from this P.ALP version it is possible to reach several goals like an IoT (Internet of Things) device or implement a WSN (Wireless Sensor Network). These approaches could be adopted as the first step to obtain useful datasets (e.g., exposure maps, high spatiotemporal resolution information, and pollutants source identification) which could allow hygienists to better manage occupational and environmental risks. It is also critical to set that those technologies must be paired with traditional instrumentation which is validated and provides high-quality data. Implementing the P.ALP could be fundamental to making it usable in both outdoor [48,49] and indoor [50] environments.
As mentioned, by following this step-by-step guide, it would be possible to obtain the prototype of the P.ALP device in its ready-to-use configuration. Shortly, a dataset collected in September and October 2022 at the Center for Direct Reading and Sensor Technologies, National Institute for Occupational Safety and Health based in Pittsburgh, PA will be analyzed and the results reported in a separate publication. Following previous publications like Borghi et al., 2018 [23], Ruiter et al., 2020 [51] and the EPA Air Sensor Guide Book [52], the performances of the P.ALP unit will be evaluated under different exposure conditions, simulated through a calm air, well mixed aerosol Chamber with low spatial variability. The preliminary analysis of the abovementioned data has already been performed and suggests that the P.ALP could be used efficiently in monitoring studies [53]. A second dataset has already been acquired in-field, concerning 4 different microenvironments ((i) office; (ii) home; (iii) outdoor; (iv) rubber molding factory) to evaluate the P.ALP prototype also under real occupational exposure conditions. This latter will be analyzed aiming to place the P.ALP in its best application field.

4. Conclusions

A monitoring device for PM2.5, using low-cost sensors and technologies was successfully conceptualized, designed, and implemented. This manuscript aims to allow the readers to build up their own monitoring devices starting from almost no knowledge about these topics. All the components needed to build a P.ALP can be purchased for about $150. Moreover, the verified and ready-to-use Arduino IDE and R codes needed to acquire and handle the monitoring data acquired by P.ALP are provided with the SM of this publication and could be used in open-access software. These codes can be freely used for data analyses. If results using this device and codes are published, the present paper should be acknowledged. Further development and implementation of the P.ALP will be performed to deeply explore and investigate the potential of these technologies.

Supplementary Materials

The following supporting information can be downloaded at the website of this paper posted on Preprints.org, Script S1: Arduino IDE sketch (text file); Script S2: R code (text file); Figure S1: Arduino Uno-R3 microcontroller board; Figure S2: Elegoo Uno-R3 microcontroller board; Figure S3: Plantower PMS5003 Sensor for Particulate Matter monitoring; Figure S4: DHT22 sensor; Figure S5: DS3231 Real Time Clock module; Figure S6: Micro-SD card adapter module; Figure S7: Micro-SD card; Figure S8: Prototype breadboard; Figure S9: Solderable board; Figure S10: USB type C (female) to USB type B (male) converter; Figure S11: USB type C (male) to USB type A (male) connection cable; Figure S12: 10400mAh power bank battery; Figure S13: Jumper wires Elegoo kit; Figure S14: Airtight container; Figure S15: Airtight box with the P.ALP’s environmental sensors.

Author Contributions

Conceptualization, G.F., F.B., C.D., A.S. and E.C.; methodology, G.F., F.B. and C.W.; formal analysis, G.F., F.B. and A.S.; investigation, G.F., F.B., C.W. and E.C.; writing—original draft preparation, G.F., F.B. and A.S.; writing—review and editing, E.C., A.C., D.M.C., J.P. and C.W.; supervision, E.C., A.C., A.S. and D.M.C.

Funding

This research received no external funding.

Acknowledgments

We gratefully thank Mario Oriani (Insubria University) for his fundamental support during the earlier stages of this project and Simone Mandaglio (Insubria University) for the first in-field testing of the P.ALP. We would also thank Jon Hummer (NIOSH) for his helpful advice regarding the implementation of the P.ALP, his incredible problem-solving skills, and last but not least his undue availability and kindness.

Conflicts of Interest

The authors declare no conflict of interest.

Disclaimers

The findings and conclusions in this report are those of the authors and do not necessarily represent the official position of the National Institute for Occupational Safety and Health, Centers for Disease Control and Prevention. Mention of any company or product does not constitute endorsement by NIOSH, CDC.

References

  1. Zimmerman, N. Tutorial: Guidelines for implementing low-cost sensor networks for aerosol monitoring. J. Aerosol Sci. 2022, 159, 105872. [Google Scholar] [CrossRef]
  2. Burnett, R.; Chen, H.; Szyszkowicz, M.; Fann, N.; Hubbell, B.; Pope, C.A.; Apte, J.S.; Brauer, M.; Cohen, A.; Weichenthal, S.; et al. Global estimates of mortality associated with longterm exposure to outdoor fine particulate matter. Proc. Natl. Acad. Sci. U. S. A. 2018, 115, 9592–9597. [Google Scholar] [CrossRef]
  3. Brauer, M.; Freedman, G.; Frostad, J.; Van Donkelaar, A.; Martin, R. V.; Dentener, F.; Dingenen, R. Van; Estep, K.; Amini, H.; Apte, J.S.; et al. Ambient Air Pollution Exposure Estimation for the Global Burden of Disease 2013. Environ. Sci. Technol. 2016, 50, 79–88. [Google Scholar] [CrossRef]
  4. Lelieveld, J.; Klingmüller, K.; Pozzer, A.; Pöschl, U.; Fnais, M.; Daiber, A.; Münzel, T. Cardiovascular disease burden from ambient air pollution in Europe reassessed using novel hazard ratio functions. Eur. Heart J. 2019, 40, 1590–1596. [Google Scholar] [CrossRef] [PubMed]
  5. Brown, D.M.; Petersen, M.; Costello, S.; Noth, E.M.; Hammond, K.; Cullen, M.; Van Der Laan, M.; Eisen, E. Occupational exposure to PM2.5 and incidence of ischemic heart disease: Longitudinal targeted minimum loss-based estimation. Epidemiology 2015, 26, 806–814. [Google Scholar] [CrossRef] [PubMed]
  6. Pearce, T.; Coffey, C. Integrating direct-reading exposure assessment methods into industrial hygiene practice. J. Occup. Environ. Hyg. 2011, 8, D31–D36. [Google Scholar] [CrossRef]
  7. Cauda, E.; Hoover, M.D. Right Sensors Used Right: A Life-cycle Approach for Real-time Monitors and Direct Reading Methodologies and Data. A Call to Action for Customers, Creators, Curators, and Analysts. | | Blogs | CDC Available online:. Available online: https://blogs.cdc.gov/niosh-science-blog/2019/05/16/right-sensors-used-right/ (accessed on Apr 12, 2021).
  8. Howard, J.; Murashov, V.; Cauda, E.; Snawder, J. Advanced sensor technologies and the future of work. Am. J. Ind. Med. 2022, 65, 3–11. [Google Scholar] [CrossRef] [PubMed]
  9. Taborri, J.; Pasinetti, S.; Cardinali, L.; Perroni, F.; Rossi, S. Preventing and monitoring work-related diseases in firefighters: A literature review on sensor-based systems and future perspectives in robotic devices. Int. J. Environ. Res. Public Health 2021, 18. [Google Scholar] [CrossRef]
  10. Cauda E, Snawder J, Spinazzè A, Cattaneo A, Howard J, C.D. The Challenge for Industrial Hygiene 4.0. A NIOSH Perspective on Direct-Reading Methodologies and Real-Time Monitoring in Occupational Environments. Synerg. 2022.
  11. Morawska, L.; Thai, P.K.; Liu, X.; Asumadu-Sakyi, A.; Ayoko, G.; Bartonova, A.; Bedini, A.; Chai, F.; Christensen, B.; Dunbabin, M.; et al. Applications of low-cost sensing technologies for air quality monitoring and exposure assessment: How far have they gone? Environ. Int. 2018, 116, 286–299. [Google Scholar] [CrossRef]
  12. Fanti, G.; Spinazzè, A.; Borghi, F.; Rovelli, S.; Campagnolo, D.; Keller, M.; Borghi, A.; Cattaneo, A.; Cauda, E.; Cavallo, D.M. Evolution and Applications of Recent Sensing Technology for Occupational Risk Assessment: A Rapid Review of the Literature. Sensors 2022, 22. [Google Scholar] [CrossRef]
  13. Fanti, G.; Borghi, F.; Spinazzè, A.; Rovelli, S.; Campagnolo, D.; Keller, M.; Cattaneo, A.; Cauda, E.; Cavallo, D.M. Features and Practicability of the Next-Generation Sensors and Monitors for Exposure Assessment to Airborne Pollutants: A Systematic Review. Sensors 2021, 21, 4513. [Google Scholar] [CrossRef] [PubMed]
  14. Howard, J. Algorithms and the future of work. Am. J. Ind. Med. 2022, 65, 943–952. [Google Scholar] [CrossRef]
  15. Koehler, K.A.; Peters, T.M. New Methods for Personal Exposure Monitoring for Airborne Particles. Curr. Environ. Heal. reports 2015, 2, 399–411. [Google Scholar] [CrossRef] [PubMed]
  16. Apte, J.S.; Messier, K.P.; Gani, S.; Brauer, M.; Kirchstetter, T.W.; Lunden, M.M.; Marshall, J.D.; Portier, C.J.; Vermeulen, R.C.H.; Hamburg, S.P. High-Resolution Air Pollution Mapping with Google Street View Cars: Exploiting Big Data. Environ. Sci. Technol. 2017, 51, 6999–7008. [Google Scholar] [CrossRef] [PubMed]
  17. Tan, Y.; Lipsky, E.M.; Saleh, R.; Robinson, A.L.; Presto, A.A. Characterizing the spatial variation of air pollutants and the contributions of high emitting vehicles in Pittsburgh, PA. Environ. Sci. Technol. 2014, 48, 14186–14194. [Google Scholar] [CrossRef]
  18. Zimmerman, N.; Li, H.Z.; Ellis, A.; Hauryliuk, A.; Robinson, E.S.; Gu, P.; Shah, R.U.; Ye, Q.; Snell, L.; Subramanian, R.; et al. Improving correlations between land use and air pollutant concentrations using wavelet analysis: Insights from a low-cost sensor network. Aerosol Air Qual. Res. 2020, 20, 314–328. [Google Scholar] [CrossRef]
  19. Jain, S.; Presto, A.A.; Zimmerman, N. Spatial Modeling of Daily PM2.5, NO2, and CO Concentrations Measured by a Low-Cost Sensor Network: Comparison of Linear, Machine Learning, and Hybrid Land Use Models. Environ. Sci. Technol. 2021, 55, 8631–8641. [Google Scholar] [CrossRef]
  20. Giordano, M.R.; Malings, C.; Pandis, S.N.; Presto, A.A.; McNeill, V.F.; Westervelt, D.M.; Beekmann, M.; Subramanian, R. From low-cost sensors to high-quality data: A summary of challenges and best practices for effectively calibrating low-cost particulate matter mass sensors. J. Aerosol Sci. 2021, 158, 105833. [Google Scholar] [CrossRef]
  21. Hagan, D.; Kroll, J. Assessing the accuracy of low-cost optical particle sensors using a physics-based approach. Atmos. Meas. Tech. Discuss. 2020, 1–36. [Google Scholar] [CrossRef]
  22. Spinazzè, A.; Fanti, G.; Borghi, F.; Del Buono, L.; Campagnolo, D.; Rovelli, S.; Cattaneo, A.; Cavallo, D.M. Field comparison of instruments for exposure assessment of airborne ultrafine particles and particulate matter. Atmos. Environ. 2017, 154, 274–284. [Google Scholar] [CrossRef]
  23. Borghi, F.; Spinazzè, A.; Campagnolo, D.; Rovelli, S.; Cattaneo, A.; Cavallo, D.M. Precision and accuracy of a direct-reading miniaturized monitor in PM2.5 exposure assessment. Sensors (Switzerland) 2018, 18, 1–21. [Google Scholar] [CrossRef]
  24. Fanti, G.; Borghi, F.; Spinazzè, A.; Rovelli, S.; Campagnolo, D.; Keller, M.; Cattaneo, A.; Cauda, E.; Cavallo, D.M.; Pleil, J.D.; et al. Laboratory evaluation of low-cost optical particle counters for environmental and occupational exposures. Sensors 2021, 21, 4513. [Google Scholar] [CrossRef]
  25. Arduino Arduino UNO R3 Datasheet. Available online: https://docs.arduino.cc/resources/datasheets/A000066-datasheet.pdf (accessed on 11 July 2023).
  26. Elegoo Elegoo Uno R3 Datasheet. Available online: https://www.elegoo.com/en-it/products/elegoo-uno-r3-board (accessed on 11 July 2023).
  27. Sayahi, T.; Butterfield, A.; Kelly, K.E. Long-term field evaluation of the Plantower PMS low-cost particulate matter sensors. Environ. Pollut. 2019, 245, 932–940. [Google Scholar] [CrossRef] [PubMed]
  28. Adafruit DHT22 Datasheet. Available online: https://cdn-shop.adafruit.com/datasheets/Digital+humidity+and+temperature+sensor+AM2302.pdf (accessed on 11 July 2023).
  29. Analog. Available online: https://www.analog.com/media/en/technical-documentation/data-sheets/DS3231.pdf (accessed on 11 July 2023).
  30. components101. Available online: https://components101.com/sites/default/files/component_datasheet/Micro-SD-Card-Module-Datasheet.pdf (accessed on 11 July 2023).
  31. Arduino Arduino Uno. Available online: https://www.amazon.com/Arduino-A000066-ARDUINO-UNO-R3/dp/B008GRTSV6/ref=sr_1_1_sspa?crid=999CU1B5V2W&keywords=arduino+uno+r3&qid=1676451837&sprefix=arduino+uno+r3%2Caps%2C162&sr=8-1-spons&psc=1&smid=AA57DDZKZUZDL&spLa=ZW5jcnlwdGVkUXVhbGlmaWVyPUFUMkwxQU1KS (accessed on 7 July 2023).
  32. Elegoo ELEGOO UNO R3. Available online: https://www.amazon.com/ELEGOO-Board-ATmega328P-ATMEGA16U2-Compliant/dp/B01EWOE0UU/ref=sr_1_2_sspa?crid=999CU1B5V2W&keywords=arduino+uno+r3&qid=1676451856&sprefix=arduino+uno+r3%2Caps%2C162&sr=8-2-spons&psc=1&spLa=ZW5jcnlwdGVkUXVhbGlmaWVyPUEyS0pFMlNBWjJUOT (accessed on 7 July 2023).
  33. Plantower PMS5003. Available online: https://www.amazon.com/whiteeeen-PMS5003-Quality-Sensor-Breakout/dp/B09BQZP2CY/ref=sr_1_4?keywords=pms5003+sensor&qid=1676451890&sprefix=pms5003%2Caps%2C158&sr=8-4 (accessed on 7 July 2023).
  34. Aosong DHT22. Available online: https://www.amazon.com/Tangyy-Digital-Temperature-Humidity-Raspberry/dp/B08QHW9TS8/ref=sr_1_14?crid=398VDVFLD7R1J&keywords=dht22+sensor&qid=1676452000&sprefix=dht22+sensor%2Caps%2C172&sr=8-14 (accessed on 7 July 2023).
  35. Dorhea RTC DS3231. Available online: https://www.amazon.com/AT24C32-Replace-Arduino-Batteries-Included/dp/B07Q7NZTQS/ref=sr_1_3?keywords=rtc+module+ds3231&qid=1676452099&sprefix=RTC%2Caps%2C178&sr=8-3 (accessed on 7 July 2023).
  36. Amazon MicroSD Card Adapter. Available online: https://www.amazon.com/Module-Storage-Adapter-Interface-Arduino/dp/B07PFDFPPC/ref=sr_1_1_sspa?crid=3J64W5XEBJW79&keywords=micro+sd+card+adapter+arduino&qid=1676452177&sprefix=micro+sd+card+adapter+arduino%2Caps%2C161&sr=8-1-spons&psc=1&spLa=ZW5jcnlwdGVkUX (accessed on 7 July 2023).
  37. Transcend MicroSD Card. Available online: https://www.amazon.com/Transcend-TS1GUSD-Micro-Secure-Digital-Card/dp/B000FVGM3I/ref=sr_1_18?keywords=microsd+card+1gb&qid=1676452219&sprefix=microsd+card+1%2Caps%2C172&sr=8-18 (accessed on 7 July 2023).
  38. Qunqi Prototype Board. Available online: https://www.amazon.com/Qunqi-point-Experiment-Breadboard-5-5×8-2×0-85cm/dp/B0135IQ0ZC/ref=sr_1_6?keywords=breadboard&qid=1676452355&sprefix=bread%2Caps%2C158&sr=8-6 (accessed on 7 July 2023).
  39. ElectroCookie Solderable BreadBoard. Available online: https://www.amazon.com/ElectroCookie-Solderable-Breadboard-Electronics-Gold-Plated/dp/B081MSKJJX/ref=sr_1_13?crid=1UJYWBPN3 × 0HS&keywords=solderable+breadboard+pcb&qid=1676452498&sprefix=solderable+breadboard+%2Caps%2C293&sr=8-13 (accessed on 7 July 2023).
  40. Qianrengyang USB type C to B converter. Available online: https://www.amazon.com/QIANRENON-Adapter-Printer-Electric-Synthesizer/dp/B09L64XZFW/ref=sr_1_32_sspa?crid=B9VXZADWILR5&keywords=usb+C+to+USB+B&qid=1676452653&sprefix=usb+c+to+usb+b%2Caps%2C194&sr=8-32-spons&psc=1&spLa=ZW5jcnlwdGVkUXVhbGlmaWVyPUEzVzEyV1E0R (accessed on 7 July 2023).
  41. CableCreation USB type C to A cable. Available online: https://www.amazon.com/CableCreation-Braided-Compatible-MacBook-Resistance/dp/B01CZVEUIE/ref=sr_1_13?keywords=1inch+usb+c+cable&qid=1676452736&sprefix=usb+C+to+USB+A+1i%2Caps%2C185&sr=8-13 (accessed on 7 July 2023).
  42. Charmast PowerBank. Available online: https://www.amazon.com/dp/B07JYYRT7T?ref=nb_sb_ss_w_as-reorder-t1_ypp_rep_k0_1_19&amp=&crid=2DX1XOP04RH2X&sprefix=power%2Bbank%2B10400mah&th=1 (accessed on 7 July 2023).
  43. Elegoo Jumper Wires. Available online: https://www.amazon.com/Elegoo-EL-CP-004-Multicolored-Breadboard-arduino/dp/B01EV70C78/ref=sr_1_1_sspa?keywords=elegoo+jumper+wires&qid=1676452915&sprefix=elegoo+jum%2Caps%2C168&sr=8-1-spons&psc=1&smid=A2WWHQ25ENKVJ1&spLa=ZW5jcnlwdGVkUXVhbGlmaWVyPUFJWFJFTU (accessed on 7 July 2023).
  44. LocknLock Airtight Box. Available online: https://www.amazon.com/dp/B0000AN4CP?ref=nb_sb_ss_w_as-reorder-t1_ypp_rep_k1_1_9&amp=&crid=2KEARWEAWN9ZM&amp=&sprefix=airtight+ (accessed on 7 July 2023).
  45. Arduino Arduino IDE. Available online: https://docs.arduino.cc/software/ide-v1/tutorials/arduino-ide-v1-basics (accessed on 7 July 2023).
  46. Arduino Arduino IDE Instructions. Available online: https://support.arduino.cc/hc/en-us/articles/4733418441116-Upload-a-sketch-in-Arduino-IDE (accessed on 7 July 2023).
  47. Karagulian, F.; Barbiere, M.; Kotsev, A.; Spinelle, L.; Gerboles, M.; Lagler, F.; Redon, N.; Crunaire, S.; Borowiak, A. Review of the Performance of Low-Cost Sensors for Air Quality Monitoring. Atmosphere (Basel). 2019, 10, 506. [Google Scholar] [CrossRef]
  48. Boniardi, L.; Borghi, F.; Straccini, S.; Fanti, G.; Campagnolo, D.; Campo, L.; Olgiati, L.; Lioi, S.; Cattaneo, A.; Spinazzè, A.; et al. Commuting by car, public transport, and bike: Exposure assessment and estimation of the inhaled dose of multiple airborne pollutants. Atmos. Environ. 2021, 262. [Google Scholar] [CrossRef]
  49. Borghi, F.; Fanti, G.; Cattaneo, A.; Campagnolo, D.; Rovelli, S.; Keller, M.; Spinazzè, A.; Cavallo, D.M. Estimation of the inhaled dose of airborne pollutants during commuting: Case study and application for the general population. Int. J. Environ. Res. Public Health 2020, 17, 1–14. [Google Scholar] [CrossRef]
  50. Ruiter, S.; Bard, D.; Ben Jeddi, H.; Saunders, J.; Snawder, J.; Warren, N.; Gorce, J.-P.; Cauda, E.; Kuijpers, E.; Pronk, A. Exposure Monitoring Strategies for Applying Low-Cost PM Sensors to Assess Flour Dust in Industrial Bakeries. Ann. Work Expo. Heal. 2023, 1–13. [Google Scholar] [CrossRef]
  51. Ruiter, S.; Kuijpers, E.; Saunders, J.; Snawder, J.; Warren, N.; Gorce, J.-P.; Blom, M.; Krone, T.; Bard, D.; Pronk, A.; et al. Exploring Evaluation Variables for Low-Cost Particulate Matter Monitors to Assess Occupational Exposure. Int. J. Environ. Res. Public Health 2020, 17, 8602. [Google Scholar] [CrossRef]
  52. Clements, A.; Duvall, R.; Greene, D.; Dye, T. The Enhanced Air Sensor Guidebook; Washington, DC, 2022.
  53. Fanti, G.; Cody, W.; Borghi, F.; Campagnolo, D.; Justin, P.; Cattaneo, A.; Spinazzè, A.; Cavallo, D.M.; Cauda, E. In-Lab Testing of a Self-Made Multiparameter Prototype based on Low-Cost Dust sensors using a Marple Camber; 39th Italian Congress of occupational and environmental hygiene: Arenzano—GE; ISBN 978-88-86293-44-0.
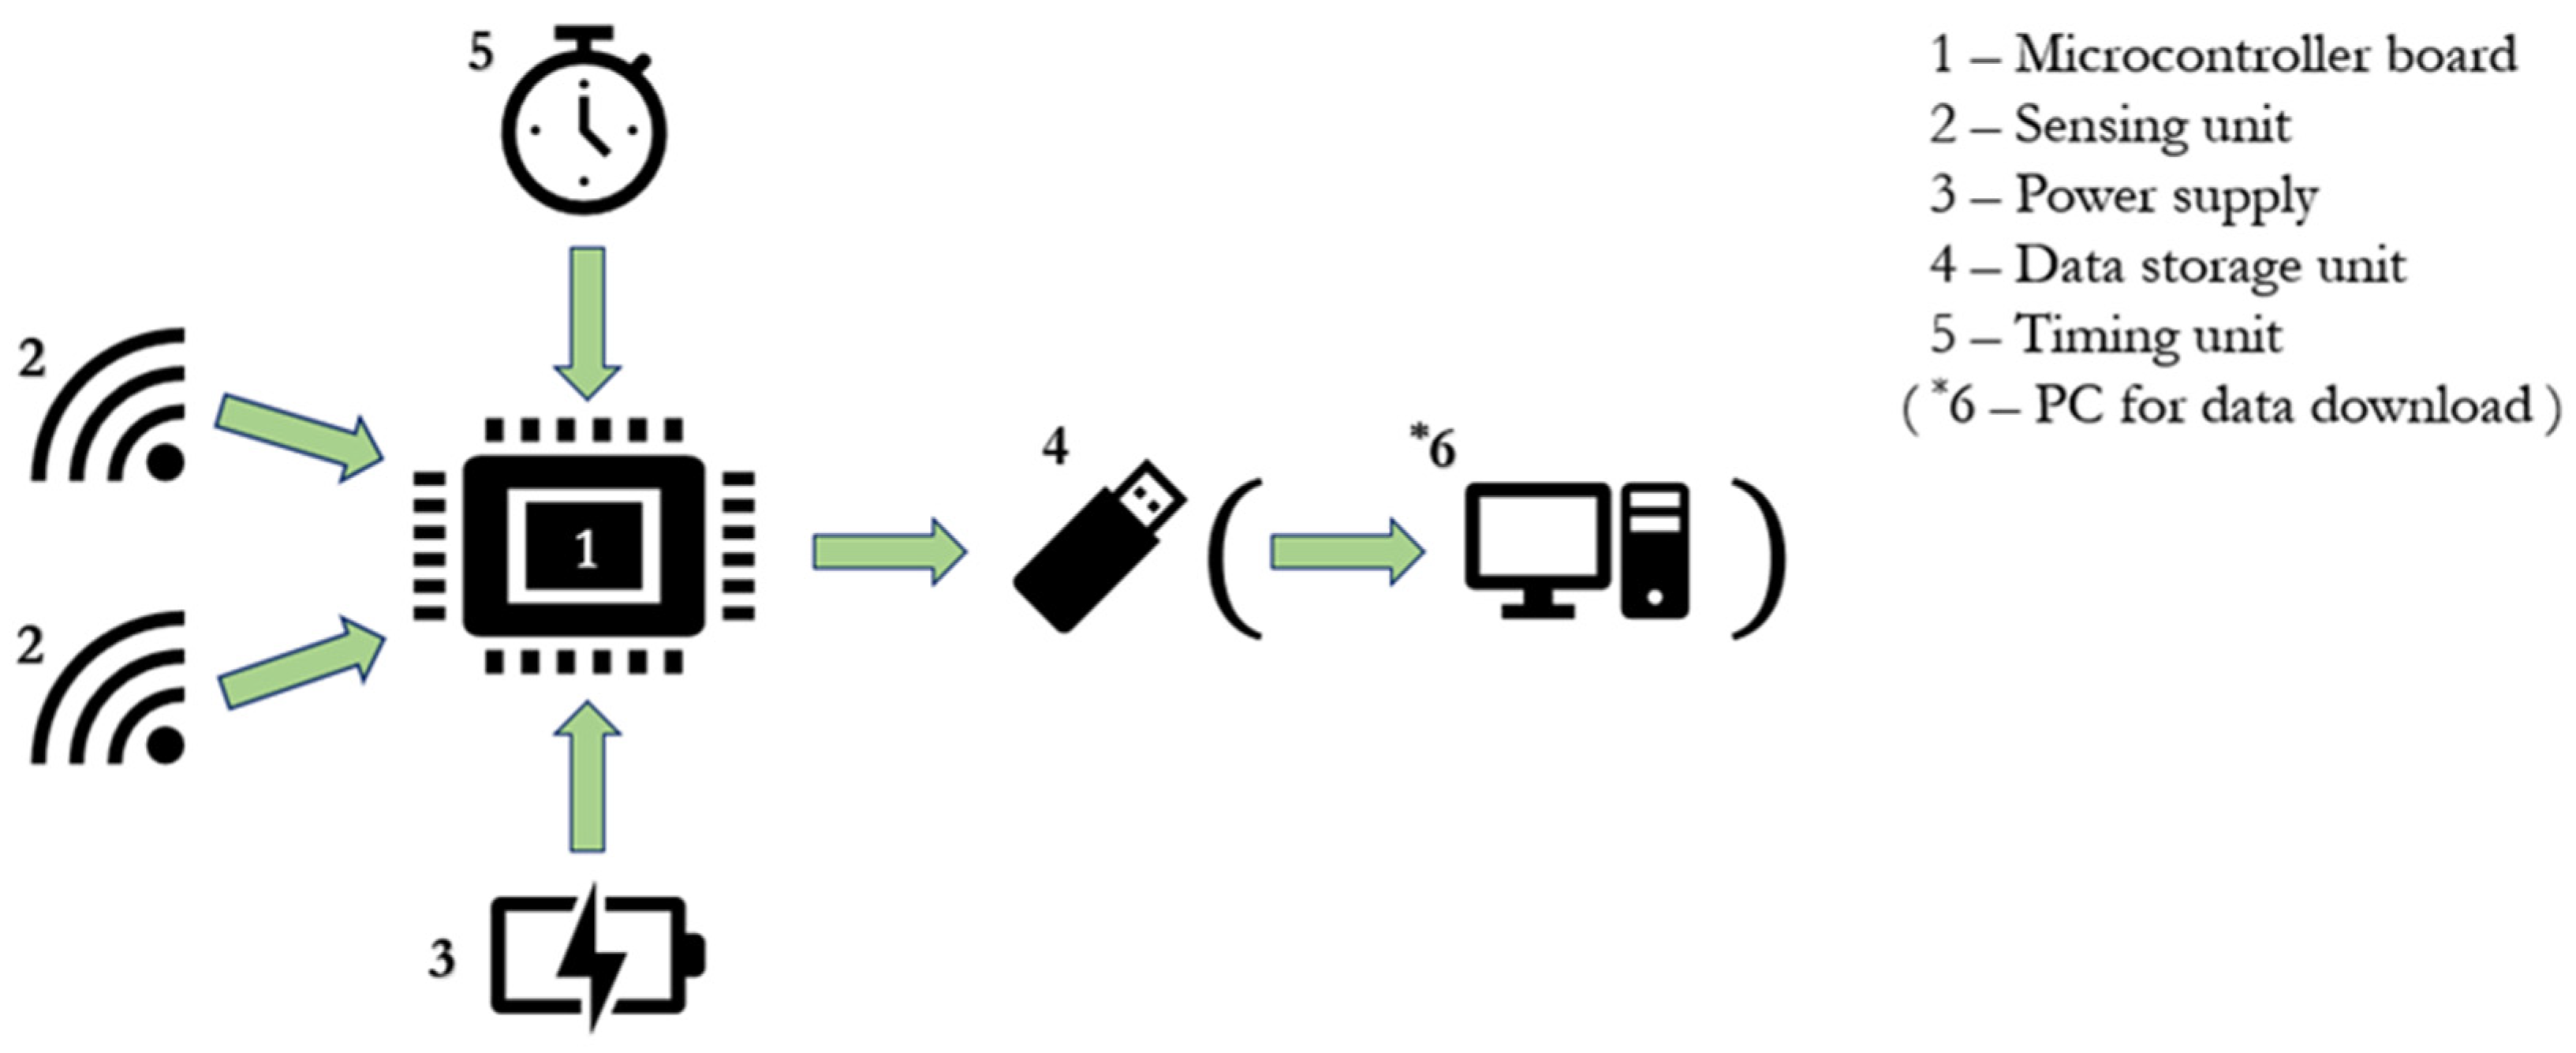
Figure 1. Conceptualization of the P.ALP unit. * A computer with proper software/coding is needed to upload the code on the microcontroller board before the first use to make the device work and to handle the collected data.
Preprints 83502 g001
Figure 2. Plantower PMS5003 PIN1 and PIN8 definition is a figure.
Preprints 83502 g002
Figure 3. DHT22 PIN definition.
Preprints 83502 g003
Figure 4. DS3231 PIN definition.
Preprints 83502 g004
Figure 5. Micro-SD card adapter PIN definition.
Preprints 83502 g005
Figure 6. Wiring diagram of the P.ALP unit. It must be noted that the breadboard, once the implementation of the P.ALP is ended, should be replaced by the solderable board.
Preprints 83502 g006
Table 1. Main units of the P.ALP monitoring system; Note: # In an early phase of the project Arduino Uno R3 ($28.50) board was used to design and develop the initial prototype of the device. Later, the Elegoo Uno R3 board was used, aiming to further reduce the costs of production of the device. * cost at the time of writing (July 2023).
Unit Number Unit Name Components
(Model, Manufacturer)
Cost ($) *
1 Microcontroller board unit # Elegoo UNO-R3 Board 16.99
2 Sensing unit PMS5003 35.99
DHT22 8.99
3 Power supply unit Power-Bank 10.99
4 Data storage unit Micro-SD card adapter; 12.99
Micro-SD card 14.79
5 Timing unit DS3231 8.99
Generic hardware
Prototype board 5.99
(Solderable board) 9.99
USB type C to B converter 8.99
USB type C to A cable 7.99
Jumper wires 6.98
Airtight container 11.50
Total Cost
The minimum cost of one prototype 151.81
Table 2. Arduino and Elegoo Uno R3 microcontroller boards’ electronic components and their specifications. DC—Direct Current; I/O—Input/Output; PMW—Pulse-Width Modulation; SRAM—Static Random Access Memory; EEPROM—Electrically Erasable Programmable Read Only Memory; LED—Light Emitting Diode. Source of the data [25,26].
Arduino Uno R3 Components Specification
Microcontroller ATmega328P
Operating Voltage 5V
Input Voltage recommended 7-12V
Input Voltage limit 6-20V
Digital I/O PINs 14 (6 of those provide also PWM output)
Analog Input PINs 6
DC Current for I/O PINs 20 mA
DC Current for 3.3V PINs 50 mA
Flash Memory (Microcontroller) 32 KB
SRAM (Microcontroller) 2 KB
EEPROM (Microcontroller) 1 KB
Clock Speed 16 MHz
Built-in LEDs 13
Table 3. Plantower PMS5003 Technical index. DC—Direct Current. Source of the data [27].
Parameter Index Unit
Range of measurement 0.3-1.0; 1.0-2.5; 2.5-10 µm
Effective Range (PM2.5) 0-500 µg/m3
Maximum Range (PM2.5) 1000 µg/m3
Resolution 1 µg/m3
Standard Volume 0.1 L
Single Response Time <1 s
DC Power Supply 5.0 (from 4.5 to 5.5) V
Active Current ≤100 mA
Standby Current ≤200 µA
Working Temperature From -10 to +60 °C
Working Humidity From 0 to 99 %
Dimensions 50 × 38 × 21 mm
Table 4. Plantower PMS5003 connector definition. VCC—Voltage Common Collector; GND—Ground; SET—set PIN; TTL—Transistor to Transistor logic; RX—receiver; TX—Transmitter; RESET—reset PIN; NC—Not Classified; n.d.—not defined. Note: * Starting from the right one to the left one as indicated in Figure 2.
PIN * Code Specification
1 VCC Positive power 5V
2 GND Negative power
3 SET Set PIN/TTL level at 3.3V
4 RX Serial port receiving PIN TTL level at 3.3V
5 TX Serial port sending PIN TTL level at 3.3V
6 RESET Module reset signal/TTL level at 3.3V
7 NC n.d.
8 NC n.d.
Table 5. DHT22 technical specifications. DC—Direct Current; RH: relative humidity. Source of the data [28].
Parameter Specification
Power supply 3.3-6V DC
Output signal Digital via a single bus
Sensing element Polymer capacitor
Operating range humidity From 0 to 100 RH%
Operating range temperature From -40 to 80 °C
Accuracy humidity ±2%RH
Accuracy temperature ±0.5 °C
Resolution humidity 0.1%RH
Resolution temperature 0.1 °C
Sensing period 2s
Dimensions 22 x 28 x 5mm
Table 6. DHT22 connector definition. VCC—Voltage Common Collector; GND—ground. Note: * Starting from the left one to the right one as indicated in Figure 3.
PIN * Description
1 VCC (+5V)
2 Signal
3 GND
Table 7. DS3231 technical specifications. DC—Direct Current; VCC—Voltage Common Collector; SDA—Serial Data; SCL—Serial Clock; I2C—Inter-Integrated Circuit. Source of the data [29].
Parameter Specification
Power Supply 2.3-5.5V DC
Pullup voltage 5.5V
Max voltage at SDA 0.3V
Max voltage at SCL 0.3V
Max voltage at VCC 0.3V
Operating temperature From -45 to 80 °C
Current consumption <300 µA
Accuracy (0-40 °C) ±2 ppm
Battery CR2032 (3V coin)
Communication interface I2C
Table 8. DS3231 connector definition. SQW—Square Wave Output; VCC—Voltage Common Collector; SDA—Serial Data; SCL—Serial Clock; GND—Ground. Note: * Starting from the left one to the right one as indicated in Figure 4.
PIN * Description
1 32K—oscillator output
2 SQW—interrupt signal or square-wave output
3 SCL—serial clock PIN for I2C interface
4 SDA—serial data PIN for I2C interface
5 VCC—power supply
6 GND—ground
Table 9. Micro-SD card adapter technical specifications. DC—Direct Current; FAT—File Allocation Table; SPI—Serial Peripheral Interface. Source of the data [30].
Parameter Specification
Power Supply 4.5-5.5V DC
Current requirement 0.2–200 mA
File system supported FAT
Card supported Micro-SD and micro-SDHC
Communication interface SPI
Table 10. Micro-SD card adapter connector definition. GND—Ground; VCC—Voltage Common Collector; MISO—master input slave output; MOSI—master output slave input; SCK—serial clock; CS—chip select. Note: * Starting from the left one to the right one as indicated in Figure 5.
PIN * Description
1 GND—ground
2 VCC—power supply
3 MISO—master input slave output
4 MOSI—master output slave input
5 SCK—serial clock
6 CS—chip select
Table 11. Suggested e-commerce links where is possible to buy all the hardware components.
Hardware Components Where to buy it
Arduino UNO-R3 Board [31]
Elegoo UNO-R3 Board [32]
Plantower PMS5003 Sensor [33]
DHT22 Sensor [34]
RTC DS3231 [35]
Micro-SD card adapter [36]
Micro-SD card [37]
Prototype breadboard [38]
Solderable board [39]
USB type C to B converter [40]
USB type C to A cable [41]
Power bank [42]
Elegoo jumper wires [43]
Airtight container [44]
Table 12. Hardware PIN linkage. TX—transmitter; GND—Ground; “-“—Negative pole; VCC—Voltage Common Collector; “+”—Negative pole; SDA—Serial Data; SCL—Serial Clock; MISO—master input slave output; MOSI—master output slave input; SCK—serial clock; CS—chip select.
Sensors/Components PIN linkage
Plantower PMS5003 TX à Digital PIN2 Microcontroller
GND à Breadboard –
VCC à Breadboard +
DHT22 Sensor GND à Breadboard –
DHT22 Out (signal) à Digital PIN4 Microcontroller
VCC à Breadboard +
RTC DS3231 GND à Breadboard –
VCC à Breadboard +
SDA à SDA Microcontroller
SCL à SCL Microcontroller
Micro-SD card adapter GND à Breadboard –
VCC à Breadboard +
MISO à Digital PIN12 Microcontroller
MOSI à Digital PIN11 Microcontroller
SCK à Digital PIN13 Microcontroller
CS à Digital PIN10 Microcontroller
Disclaimer/Publisher’s Note: The statements, opinions and data contained in all publications are solely those of the individual author(s) and contributor(s) and not of MDPI and/or the editor(s). MDPI and/or the editor(s) disclaim responsibility for any injury to people or property resulting from any ideas, methods, instructions or products referred to in the content.
Copyright: This open access article is published under a Creative Commons CC BY 4.0 license, which permit the free download, distribution, and reuse, provided that the author and preprint are cited in any reuse.
Prerpints.org logo

Preprints.org is a free preprint server supported by MDPI in Basel, Switzerland.

Subscribe

© 2024 MDPI (Basel, Switzerland) unless otherwise stated