Introduction
Understanding the distribution of tropical forest and savanna remains a core concern of global biogeography. Tropical forests constitute one of the largest carbon pools in the biosphere (Post et al. 1982; Berenguer et al. 2014), whereas tropical savannas, the most fire prone ecosystems on Earth, drive seasonal flux of carbon between vegetation and the atmosphere (Van Der Werf et al. 2003; Grace et al. 2006; Duvert et al. 2020). Both biomes are rich in biodiversity (Pennington et al. 2018), which is being diminished by human land uses, particularly tree clearance for agriculture and pastoralism (Almeida de Souza et al. 2020; Lopez-Carr 2021). Furthermore, climate change is likely to transform tropical forest through increased occurrence of drought and associated fires (Corlett 2016). Without effective economic incentives combined with sustainable management programs it is likely that the extent and ecological integrity of these systems will continue to decline (Andersson et al. 2018; Cuenca et al. 2018). Accurate determinations of forest and savanna distributions provide essential baselines to understand the rate, geographical foci and scale of forest and savanna loss (Aleman and Staver 2018; Zimbres et al. 2020). Such baselines are also important in validating Earth system models that chart the likely fate of carbon fluxes and climate change (Tang et al. 2019).
Historically, climate has been considered the primary factor determining the distributions of tropical forest and savanna (Whittaker 1974, Bowman 2000, Woodward et al. 2004, Langan 2017). It is no coincidence that tropical forests are often called “rainforests” and that savannas and associated fires are associated with monsoonal climates. However, global empirical analysis and modelling show that the predictability of these biomes from environmental drivers is imperfect, with tracts of savanna occurring in environments seemingly suited for forest and vice versa (Swaine et al. 1992, Moreira 2000, Russell-Smith et al. 2003, Bond 2008; Murphy and Bowman 2012). For example, Pausas & Bond (2020) describe stable non-forested (open) vegetation in climates that are warm and wet enough to support forests. Conversely, forest vegetation can occur in dry or highly seasonal climates (<1000mm annual precipitation) (Bastin et al. 2017; Schepaschenko et al. 2017; Maestre et al. 2021). These climatically anomalous patterns have been explained according to the alternative stable states (ASS) or bistability model where bottom-up processes, particularly fire and herbivory, cause biome switching (Warman and Moles 2009; Rutherford et al. 2012). Staver et al. (2011) for instance show that in areas with mild seasonality and intermediate levels of precipitation (1000 to 2500 mm y−1), alternative states of forest and savanna tree cover predominate depending on fire activity.
Although a precise mathematical model of bistability has been formulated (eg. Staal et al. 2016), it is notable that a range of definitions and means of detecting bistability have been proposed in landscape ecological analyses. Varied understandings of vegetation bistability range from those requiring experimental evidence of both multi-generational stability and state-switching of species suites at a given location (eg. Connell & Sousa 1983, Pausas & Bond 2020), through to broader definitions that encompass bimodal forest cover distribution within climate bounds (e.g., Staver et al. 2011). Similarly, a range of mechanisms, feedback components and climate constraints have been posited as driving bistability. We summarise some key definitions and drivers in
Table 1. In our analysis of predictors of tropical savanna and forest cover, we use a broad definition, following Staver et al. 2011, identifying broad-scale existence of both high- and low-vegetation cover communities within a climatic envelope.
There remains debate and uncertainty around the environmental controls of these tropical biomes. Existing maps of the extent of tropical forest and savanna, such as the widely used WWF biome map, rely on compilation and subjective synthesis of various geographic thematic data streams (Olson et al. 2001), placing uncertainty over their reliability (Ocón et al. 2021). Remote sensing products provide globally consistent and contemporary maps of tree cover that have been used to delineate tropical forest and savanna. For example, the Moderate Resolution Imaging Spectroradiometer (MODIS) tree cover product has been interpreted as distinguishing forest from savanna (Staver et al. 2011; Hirota et al. 2011). Such use of remote sensing to delineate forest and savanna has been subject to criticism because the algorithms that produce these global coverages can artificially reinforce discontinuities in canopy cover or overestimate actual tree cover (Hanan et al. 2014; Staver et al. 2015).
Fire is often implicated as a key factor limiting forest distribution in the tropics (Bowman 2000; Staver et al. 2011; Beckett and Bond 2019). This is not a simple relationship, however, because pyrogeographic analyses have shown that fire activity is controlled with both climate and vegetation productivity. This creates a unimodal relationship, with maximum fire activity in savanna environments that have seasonal aridity (dry season) and productivity (wet season). Fire activity is constrained in both arid, low productivity environments where fuel biomass is limiting, and humid, high productivity environments biomass where fuel is typically too wet to burn (Bowman et al. 2014).
Geospatial models of the environmental controls of forest and savanna routinely mask out anthropogenically modified landscapes. Nonetheless this approach cannot exclude the influence of humans in shaping forest and savanna distribution (Wuyts et al. 2017). For instance, various studies have demonstrated that human activities are drivers of shifts in vegetation states (Rietkerk et al. 2004), and also of land area burnt (Archibald et al. 2009). In more mesic areas, fire can only maintain open savanna grasslands under deliberate human-mediated, high-frequency, late season fire regimes (Veenendaal et al. 2018). It must be acknowledged that vegetation and fire patterns are also shaped by terrain that can alter the spread of fire (Bowman 2000; Ondei et al. 2017), as well as creating environmental gradients that affect the distribution of forests such as rain shadows, although global analyses fire and forest and savanna distributions typically do not consider terrain variables (Hirota et al. 2011; Staver et al. 2011).
Here we undertake an analysis to evaluate the degree to which climate, fire, topographical and anthropogenic factors predict the extent of tropical forest and savanna in the early 21st century. Rather than using a remote sensing tree cover product, we manually sample and classify publicly available global true-colour satellite imagery. Recent studies using a similar approach have highlighted anomalous areas of forest cover in arid landscapes (Bastin et al. 2017). We analysed the distribution of tropical forest and savanna with relation to climate and topography from global datasets. Like prior studies, we also include fire as a predictor variable (Bowman 2000; Staver et al. 2011; Beckett and Bond 2019), however we modelled climate-fire and climate-biome relationships individually to separate the highly correlated relationships between fire and vegetation (Murphy et al. 2010). Finally, we use our models to validate the widely used WWF biome map (Olson et al. 2001), and satellite-derived classification of tropical broadleaf forest (Hansen 2000).
Methods
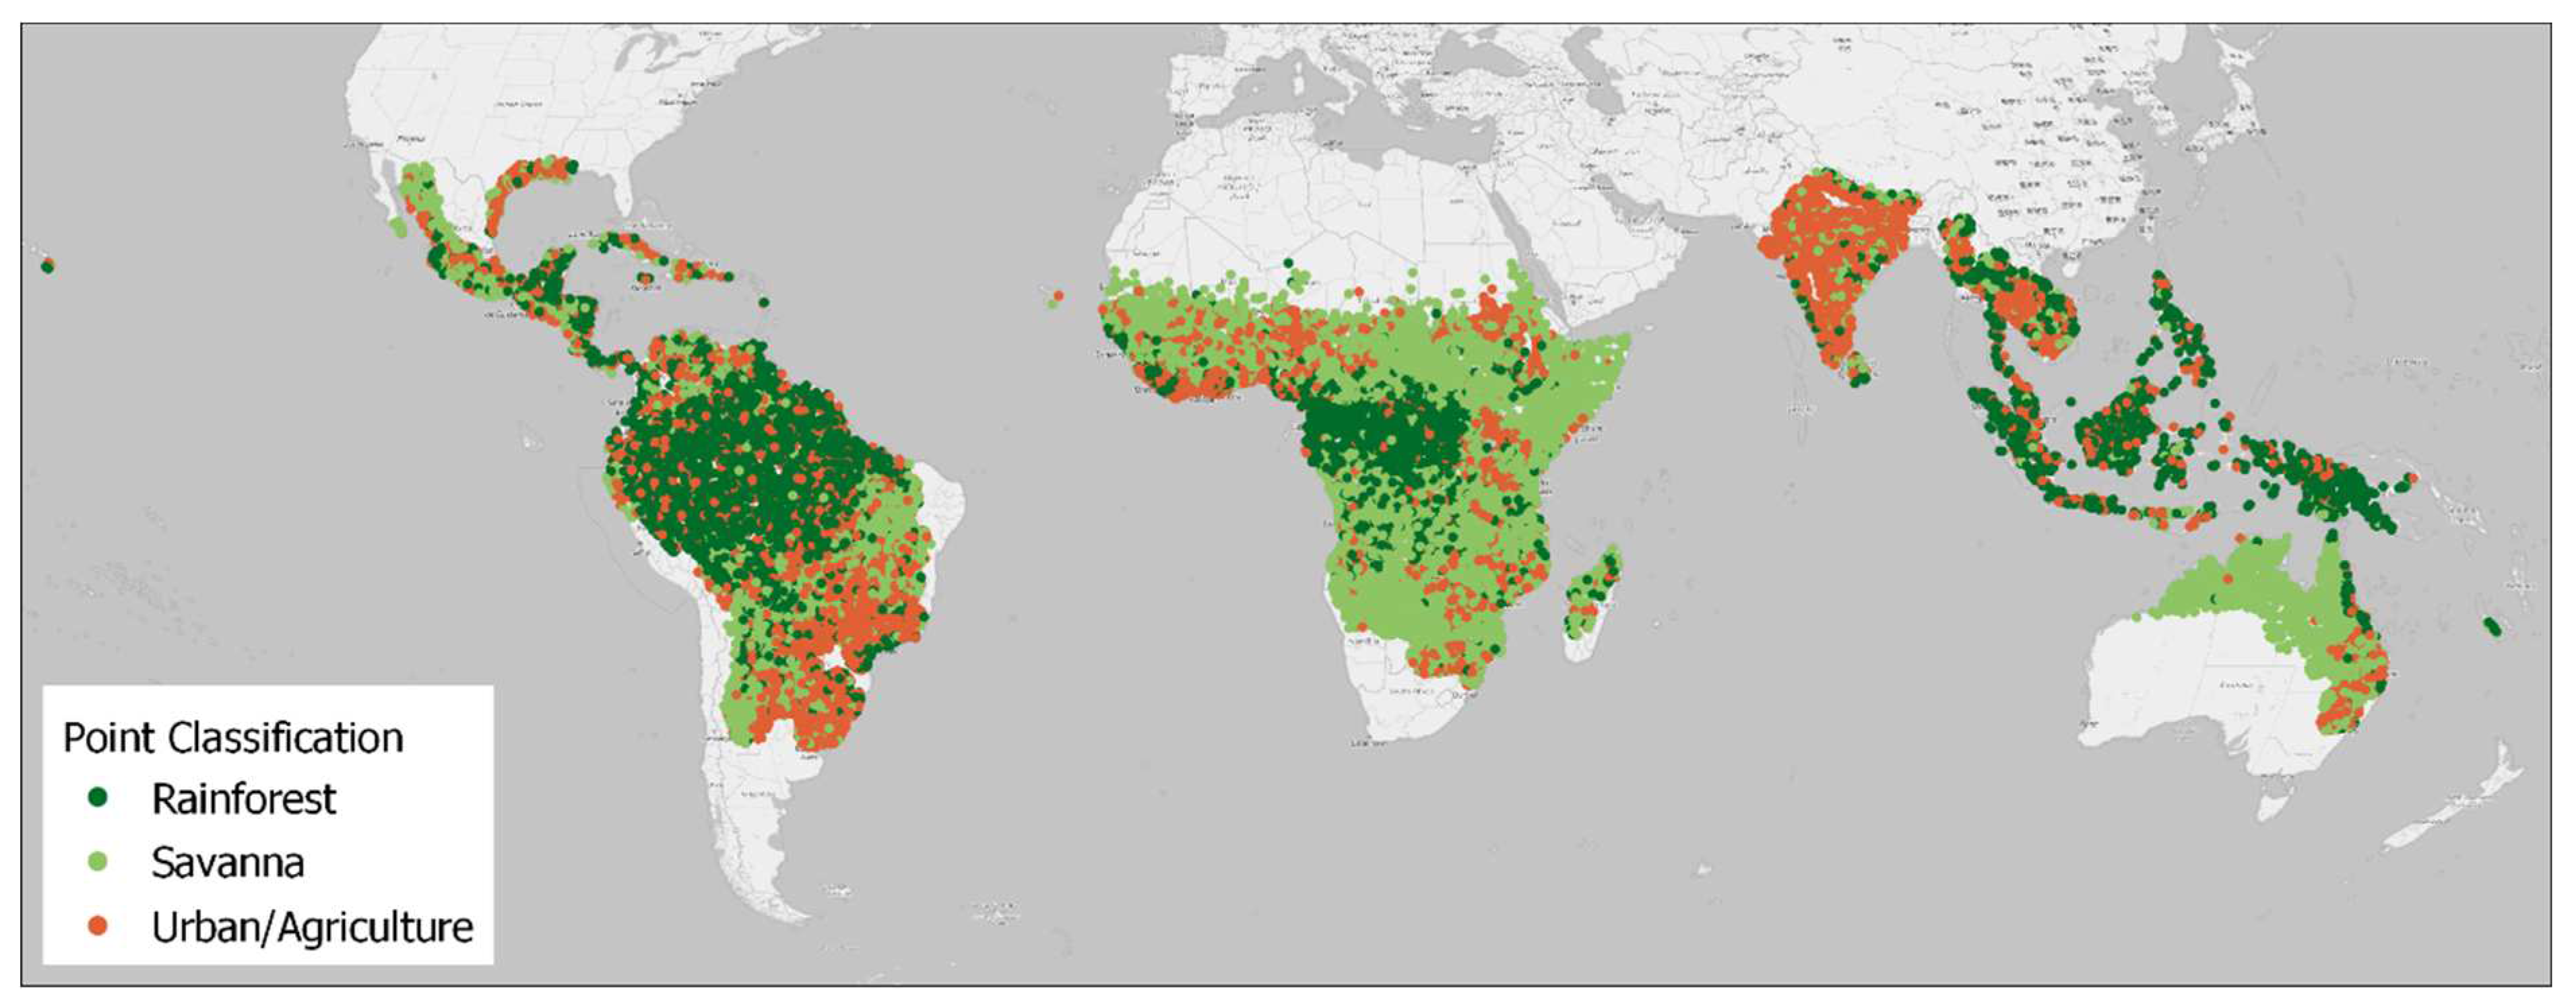
We manually classified 24,239 randomly selected points within the tropics in areas expected to comprise forest-savanna gradients, defined as a 100km buffer around the Tropical (A) and Hot Arid Steppe (BSh) Köppen climate regions (
Figure 1). We excluded sampling from any area with elevation greater than 2,500m which corresponds to the expected altitude of treelines in the tropics (Rehm & Feeley, 2015) using the EarthEnv global topographic dataset at a 5km resolution (Amatulli et al., 2018).
Land cover type was determined using a web-based vegetation mapping tool developed for this study based on publicly available satellite imagery utilizing Google Maps. We took advantage of developments in geospatial tools within the last decade (Belward & Skøien 2015; Johansen et al. 2015), with Google providing access to aerial images with very high spatial resolution (pixel size ~1m), which are sufficiently resolved to allow visual identification of individual tree crowns (Karlson et al. 2014). Random points to be classified within the selected climate zones were generated and presented sequentially to a member of our team with expertise in vegetation classification, who manually labelled the area at the selected point as belonging to as either forest, savanna or urban landscapes on the basis of visual interpretation of the imagery. Archetypal images were supplied to the classifier as a visual guide, with these comparison images selected from confirmed examples of savanna and forest vegetation from across their global range. The classifier did not gauge an estimated tree cover percentage, but rather selected from the available fixed classification types. We took particular care to examine if the tree cover comprised plantations—areas where tree canopies were arranged in regular rows were excluded from the analysis. We also checked for any human influence (e.g., roads, houses, intensive agriculture, or industry) associated with point. Points were classified as urban landscapes when the predominant cover constituted roads, buildings, or gardens. In total, we classified 11,493 savanna, 7,045 forest and 5,701 urban points. We conducted an independent test of our classification by comparing our classified points with tree cover data from the 500m MOD44B Collection 5 product (DiMiceli et al. 2011). This MODIS product has been shown to provide percent canopy cover at a scale and resolution appropriate for discriminating regional (Bartholomé and Belward 2005) and even global patterns (Van Nees et al. 2018). Our validation against the MODIS data shows that our vegetation classes correspond broadly to MODIS tree cover values (
Figure S1).
The precipitation seasonality (SI) and mean annual precipitation (MAP) for each cell were derived from the WorldClim2 climate data set (Fick et al. 2017). For each cell, the human influence index (HI) was estimated from the Last of the Wild v2 dataset (Wildlife Conservation Society et al. 2005) at a 1km resolution and resampled to the 5km grid consistent with the other datasets. Topographic position index (TPI) for each cell was extracted from the EarthEnv global topographic dataset at 5km resolution (Amatulli et al., 2018). For fire modelling, we extracted the mean hotspot count per 5km cell from the MODIS Aqua and Terra (product MCD14DL; Giglio et al., 2016) active fire hotspot archive from 2002 to 2019, excluding fixed and low-certainty hotspots.
Data analysis
Occurrence of tropical forest
We constructed predictive models of tropical forest occurrence using binomial generalized additive models (GAMs). These are particularly well suited for modelling presence–absence data (Hastie & Tibshirani, 1990; Guisan et al., 2002). Additionally, our use of GAMs, as opposed to generalized linear models, is more appropriate as the assumption of a linear relationship between the response and explanatory variables are void, and because GAMs allow for nonparametric smoothing splines to be fitted to the covariates which more accurately represents the response curve (Elith & Burgman, 2003). GAM models were built in R with the ‘mgcv’ package (Wood, 2001), using a binomial probability distribution and logit link function. Detailed summaries of model structure and model fit diagnostics are available in supplementary methods.
To identify the drivers of vegetation type, we fitted binomial generalized additive models with vegetation class (tropical forest vs. savanna) as the response variable against independent thin-plate smoothing splines, with four knots to constrain spline complexity, of mean annual precipitation, precipitation seasonality, human influence, and topographic position. A total of 18,538 data points were used in the final analysis (17,045 forest and 1,493 savanna) with urban points excluded. The suite of models included a global model with all four predictor variables, climate plus topography, climate plus human influence, a model excluding the two climate variables, and a model including and climate only. We also ran separate models with the same response and explanatory variables for classified samples from each of the four biogeographical realms (5,202 data points for the Neotropics, 9,258 for the Afrotropics, 2,106 for Australasia, and 1,335 for Indomalaya). The most supported set of predictors was inferred using model selection in an Akaike’s information-theoretic approach (Burnham and Anderson 2002) corrected for sample size, and the most parsimonious models were selected as those with the lowest AICc score, and greater than 2 AICc difference from other models. To obtain a measure of relative support of each model combination, we also computed their Akaike weight w, which refers to the probability of a model combination being the best supported one among a given model set. Inferences were drawn based on all plausible models.
Predictions from the best model were used to plot a seasonality vs. mean annual precipitation surface chart showing forest occurrence probability for climate areas where sample points were present. To visualize patterns on each of the four main biogeographic realms of focus, we used models trained on data subset for each realm to further graph individual seasonality vs. mean annual precipitation forest probability surfaces, based on the best performing model in each case. To visualize the probabilities of savanna and forest on these charts, predicted forest probabilities across a gradient of MAP and SI, with HI and TPI held at their median values, were generated for points in the climate space. These predicted forest probabilities were also mapped globally within the tropical domain and transformed to quartiles for construction of bi- choropleth map overlaying forest probability with fire activity and human influence.
Occurrence of fire
Hotspot count density was modelled with GAMs using the same variable suite and model structure as the best performing forest cover model but with a quasipoisson distribution to account for the continuous but skewed fire distribution. Predicted hotspot density was then mapped globally within the domain and transformed to quartiles for construction of a bi-choropleth map overlaying fire activity and forest probability.
We then developed separate generalised linear models (Gaussian distribution) of fire occurrence (log-transformed MODIS hotspot count) for points classified as forest, and points classified as savanna, using the global suite of variables (MAP, SI, TPI and HI). This analysis follows the method of Murphy et al. (2010) and was intended to disentangle the influence of fire on vegetation community (forest vs. savanna) or vice versa. Given that forest presence is expected to suppress fire, the effects of these climate variables on fire activity are modelled in the two vegetation communities separately. If the same variables are important in both models, but with opposite relationships with fire, it can be concluded that the distribution of forest is driven by the inherent distribution of fire, and areas of low fire frequency. Alternatively, if the relationship between fire and the climate variables is in the same direction, we could conclude that vegetation patterns are controlled by both fire and climate, which introduces some indeterminacy more consistent with bistability. Marginal effect plots of fire occurrence against MAP and SI were plotted for each vegetation type.
Results
Nearly a quarter of our random sample points (23.5%) were classified as belonging to anthropogenic landscapes. These points were discarded from our analysis of forest cover. We classified 7,045 points as forest, which had an interquartile range of 1,569 mm–2,368 mm mean annual precipitation and a precipitation seasonality interquartile range of 33-70. Savanna vegetation (11,493 points) had an interquartile range of 419 mm–1188 mm precipitation and a precipitation seasonality coefficient of variation of 75-118. Among the points classified as forest, 8% occurred in sheltered topographic positions at the 5 km scale (topographic position index <-0.5) while only 4% of non-forest points occurred in topographic depressions.
The most supported model in terms of predictions of forest probability was the global model which included mean annual precipitation, seasonality, human influence index and topographic position (
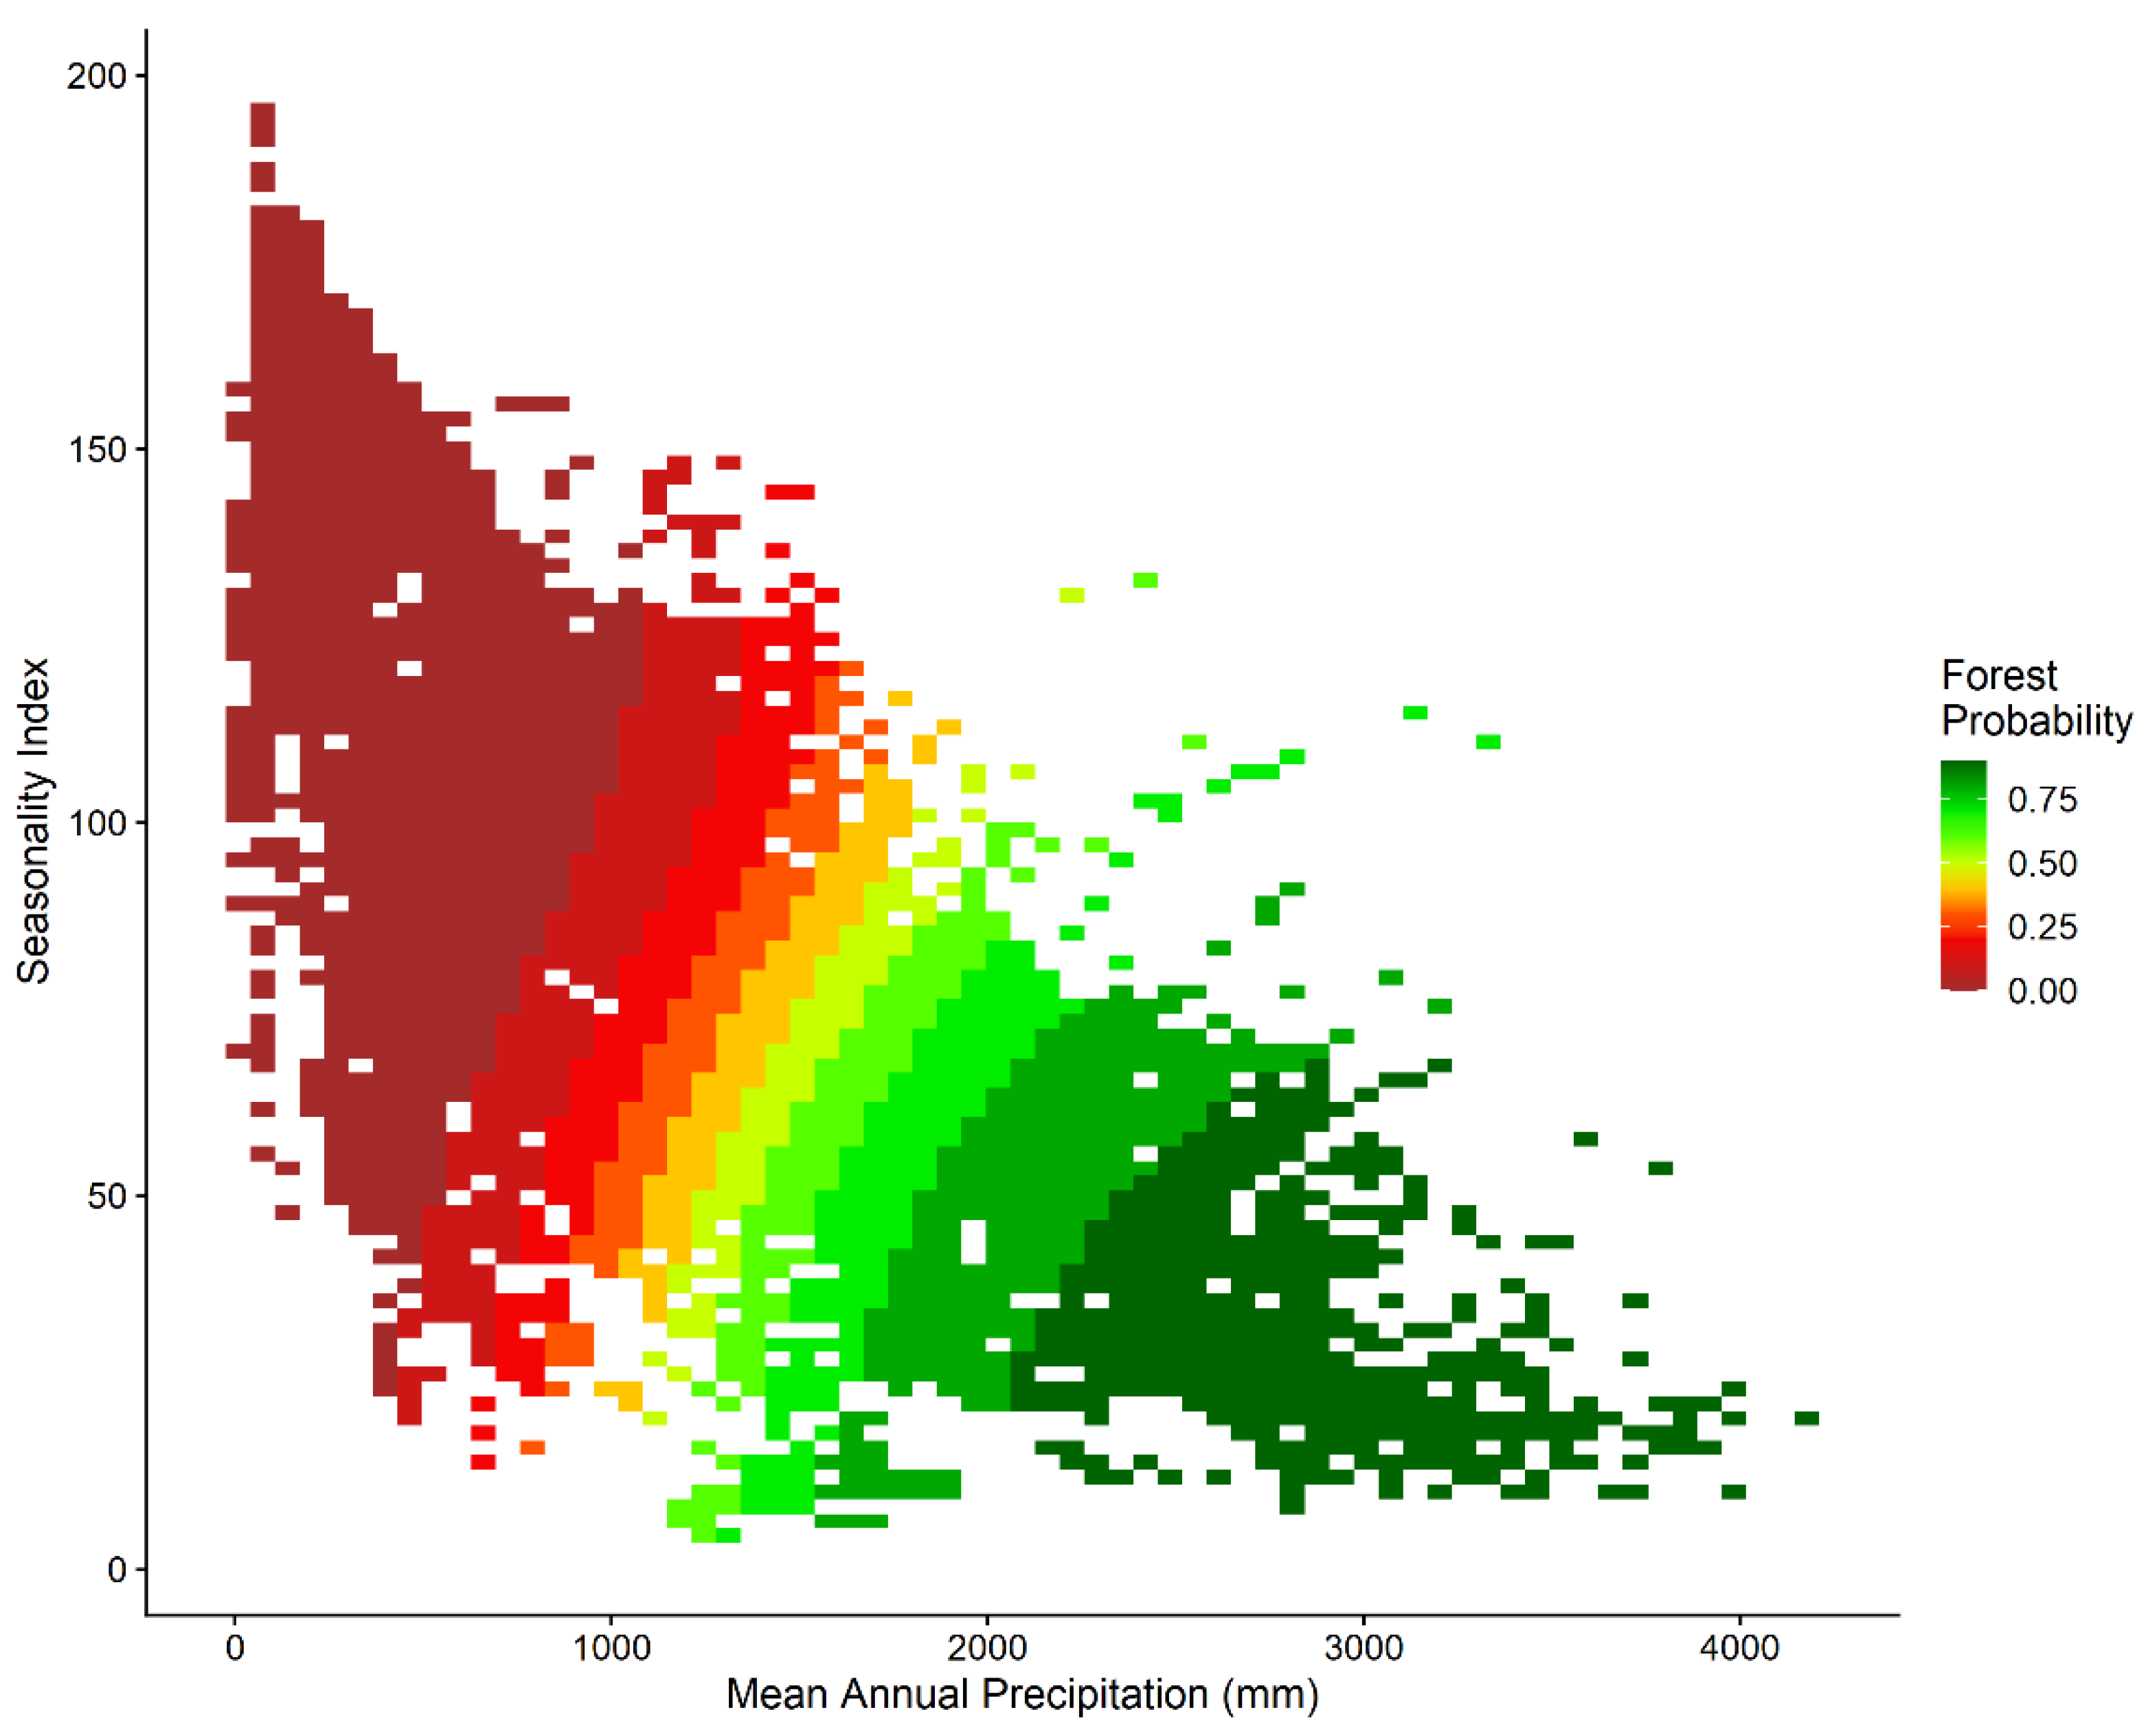
Table 1). The model that excluded the climate variables performed poorly, while excluding human influence and topography had negligible impact on model performance. Globally, forest was predicted to occur in areas of low seasonality (and precipitation >1000 mm) (
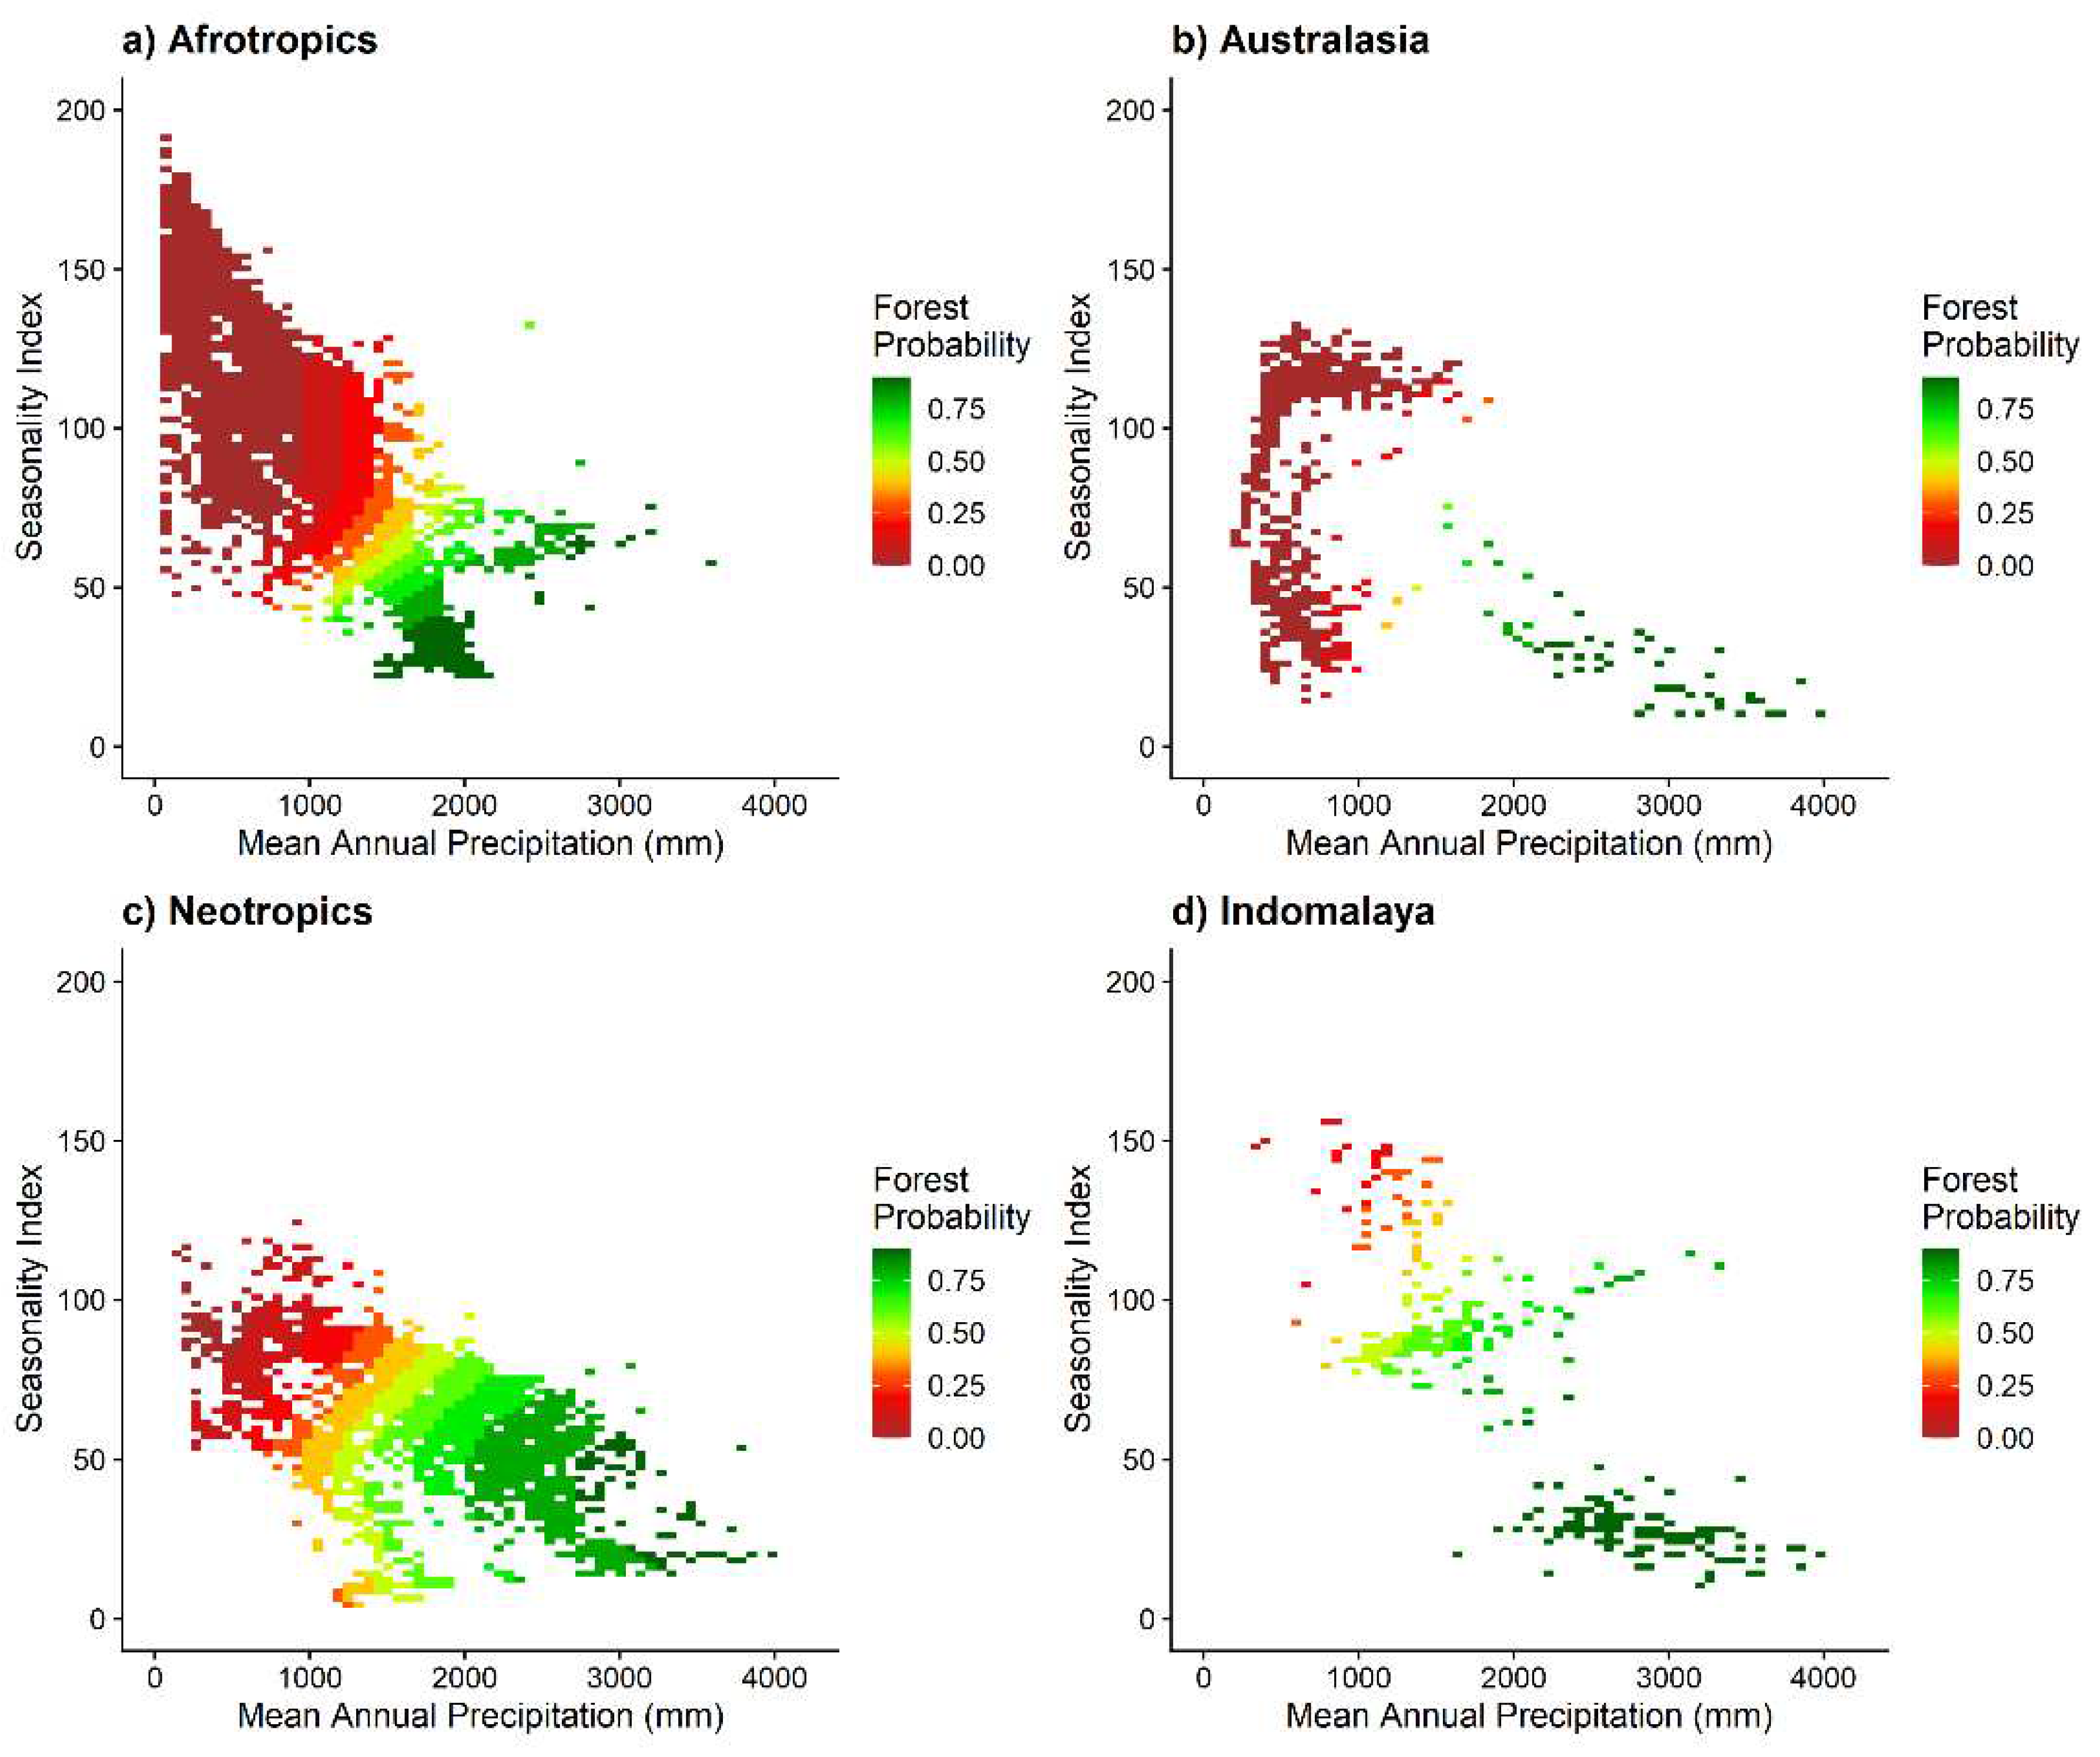
Figure 2), which suggests that annual precipitation lower than 1000 mm and long dry seasons are likely to limit forest establishment. Areas which were indeterminant (40%-60% probability) of being either forest or non-forest occurred in locations with an interquartile range of 1,311 mm-1,702 mm mean annual precipitation and a precipitation seasonality index interquartile range of 48-83. Such ‘bi-stable’ areas were common in the Afrotropics (
Figure 3a), the Neotropics (
Figure 3c) and in Indomalaya (
Figure 3d), but less so in Australasia (
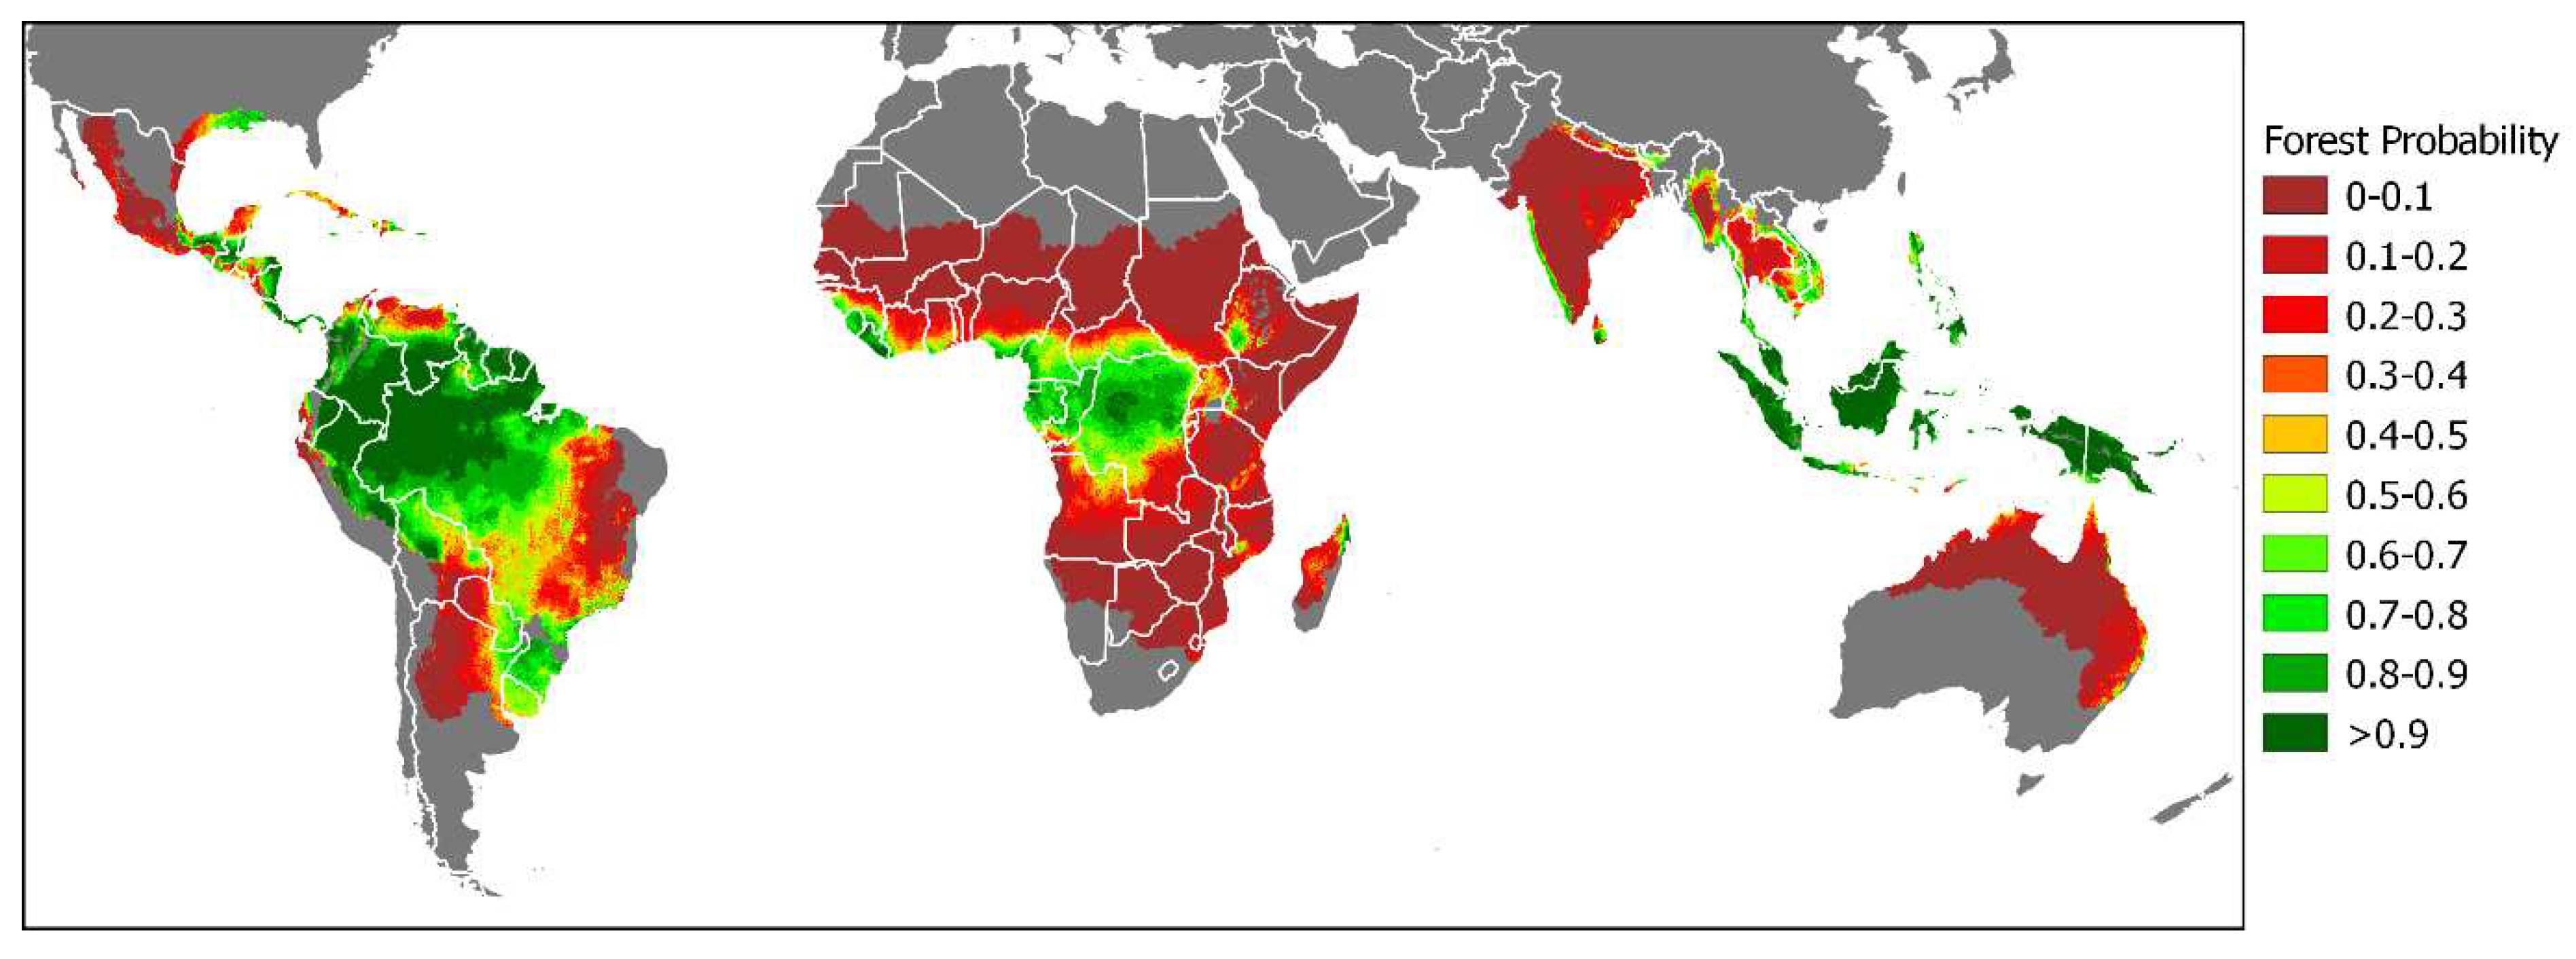
Figure 3b). When the GAM model outputs were projected unto the global map, areas with high probability of forests (>60% probability) covered 1,501 Mha (32.7% of the projected area); areas with low probability of forest (<40% probability) comprised 2,674 Mha (58.2% of the projected area) and intermediate areas (40%-60% forest probability) or potentially bistable areas covered 418 Mha (9.1% of the projected area) (
Figure 4). These projections are also associated with a map of model variance (
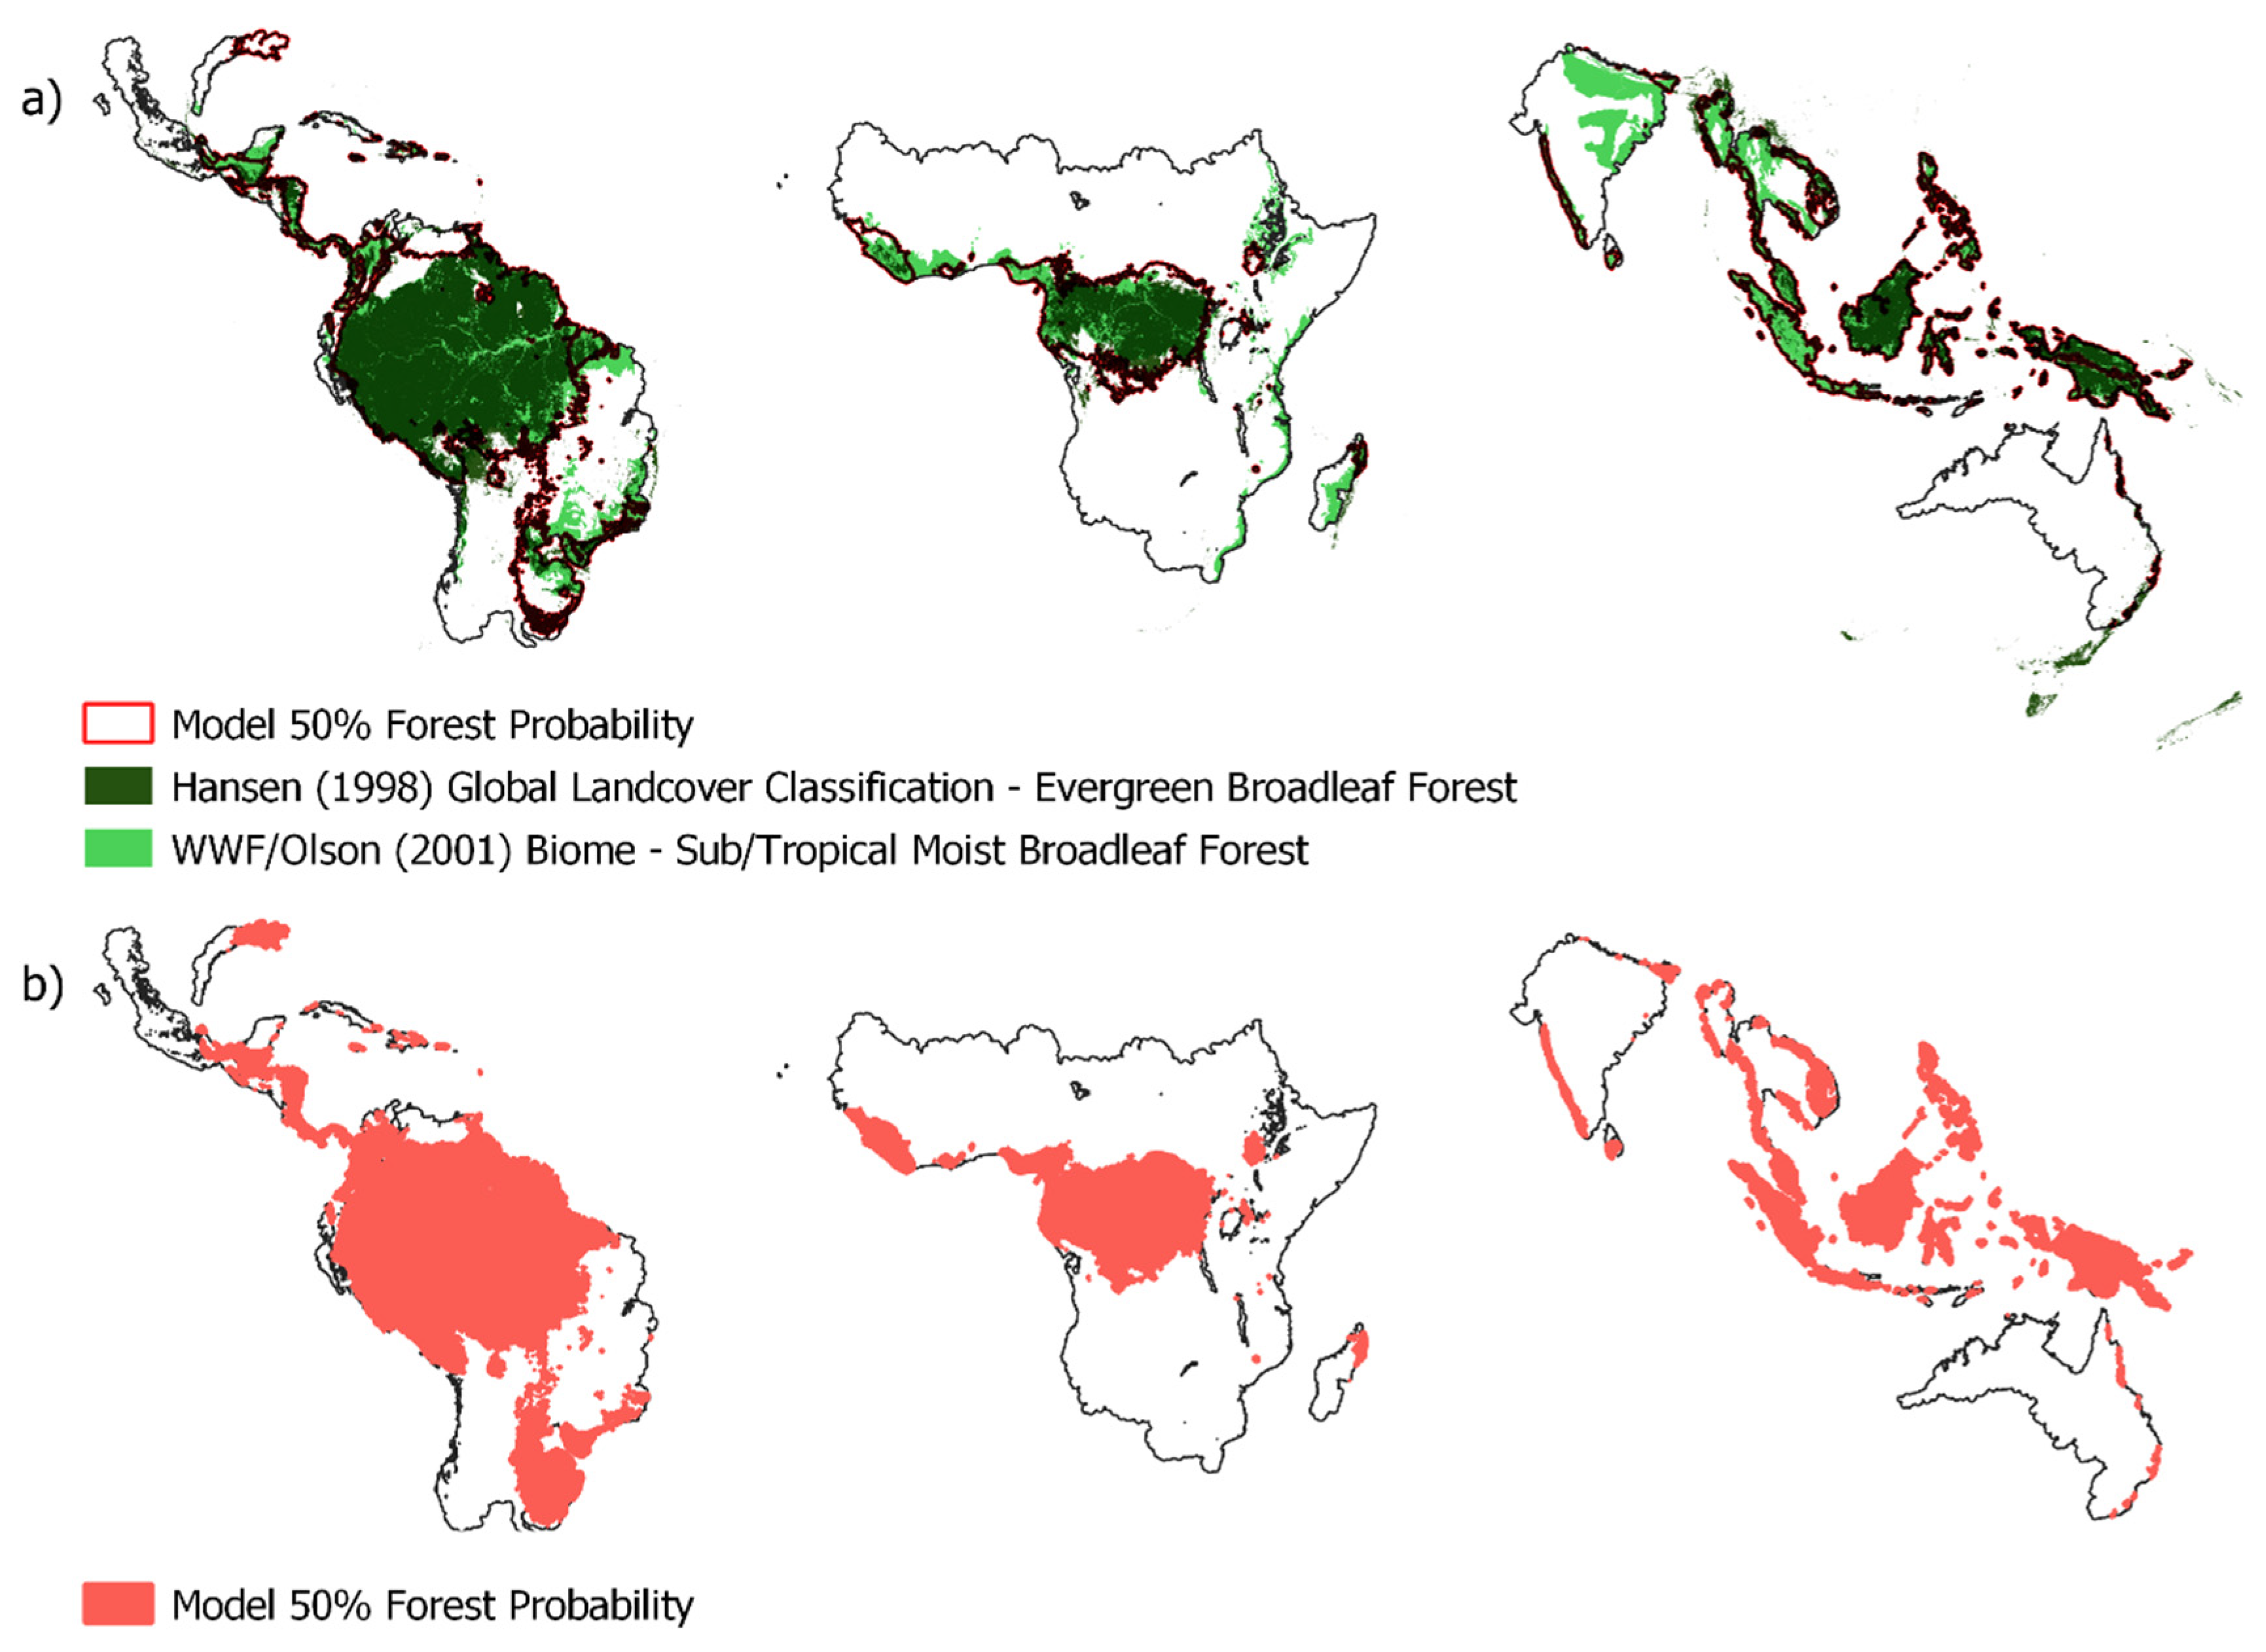
Figure S2) which show that variance was low in most areas except in south Brazil, India, and some areas in southeast Asia. These areas correspond well to areas where predicted forest extent based on climate are disconnected from satellite-based mapped extent of forest (Hansen et al. 2000) or theoretical tropical forest biome (Olson et al. 2001) (
Figure 5).
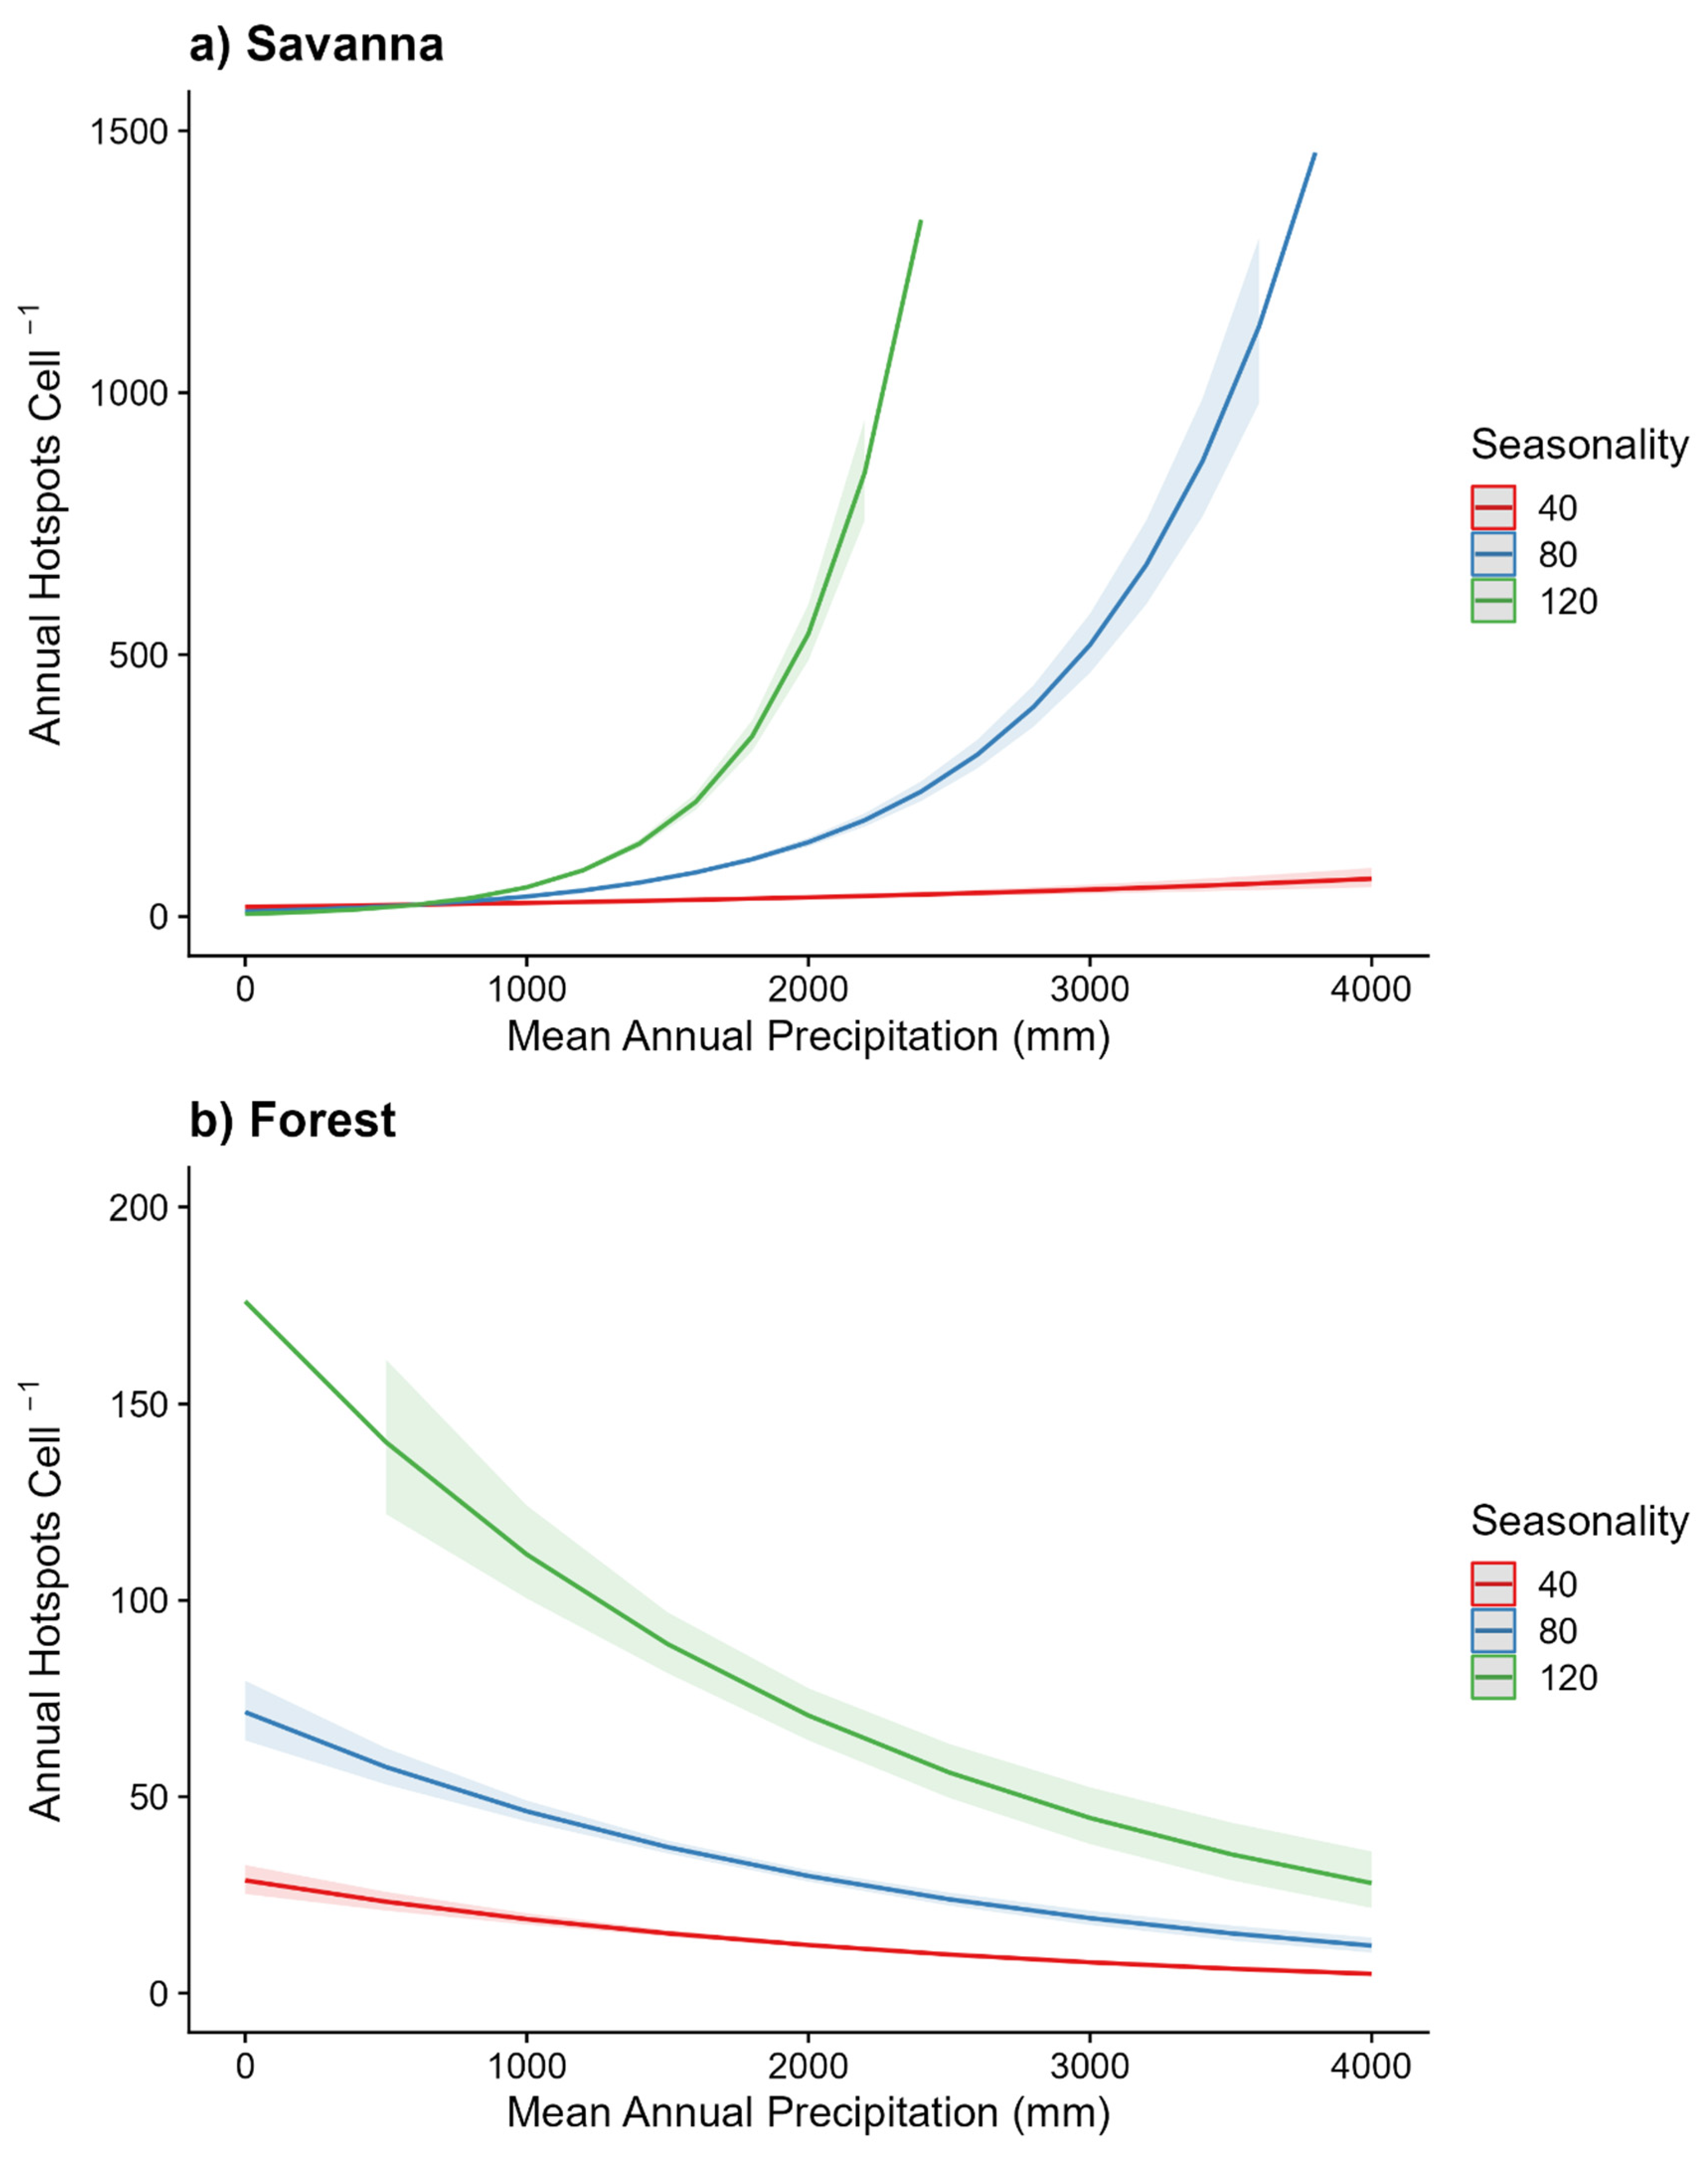
In savanna locations, fire frequency was positively associated with precipitation and seasonality (
Figure 6a). By contrast, forest showed the opposite trend where, high precipitation and low seasonality resulted in low fire incidence (
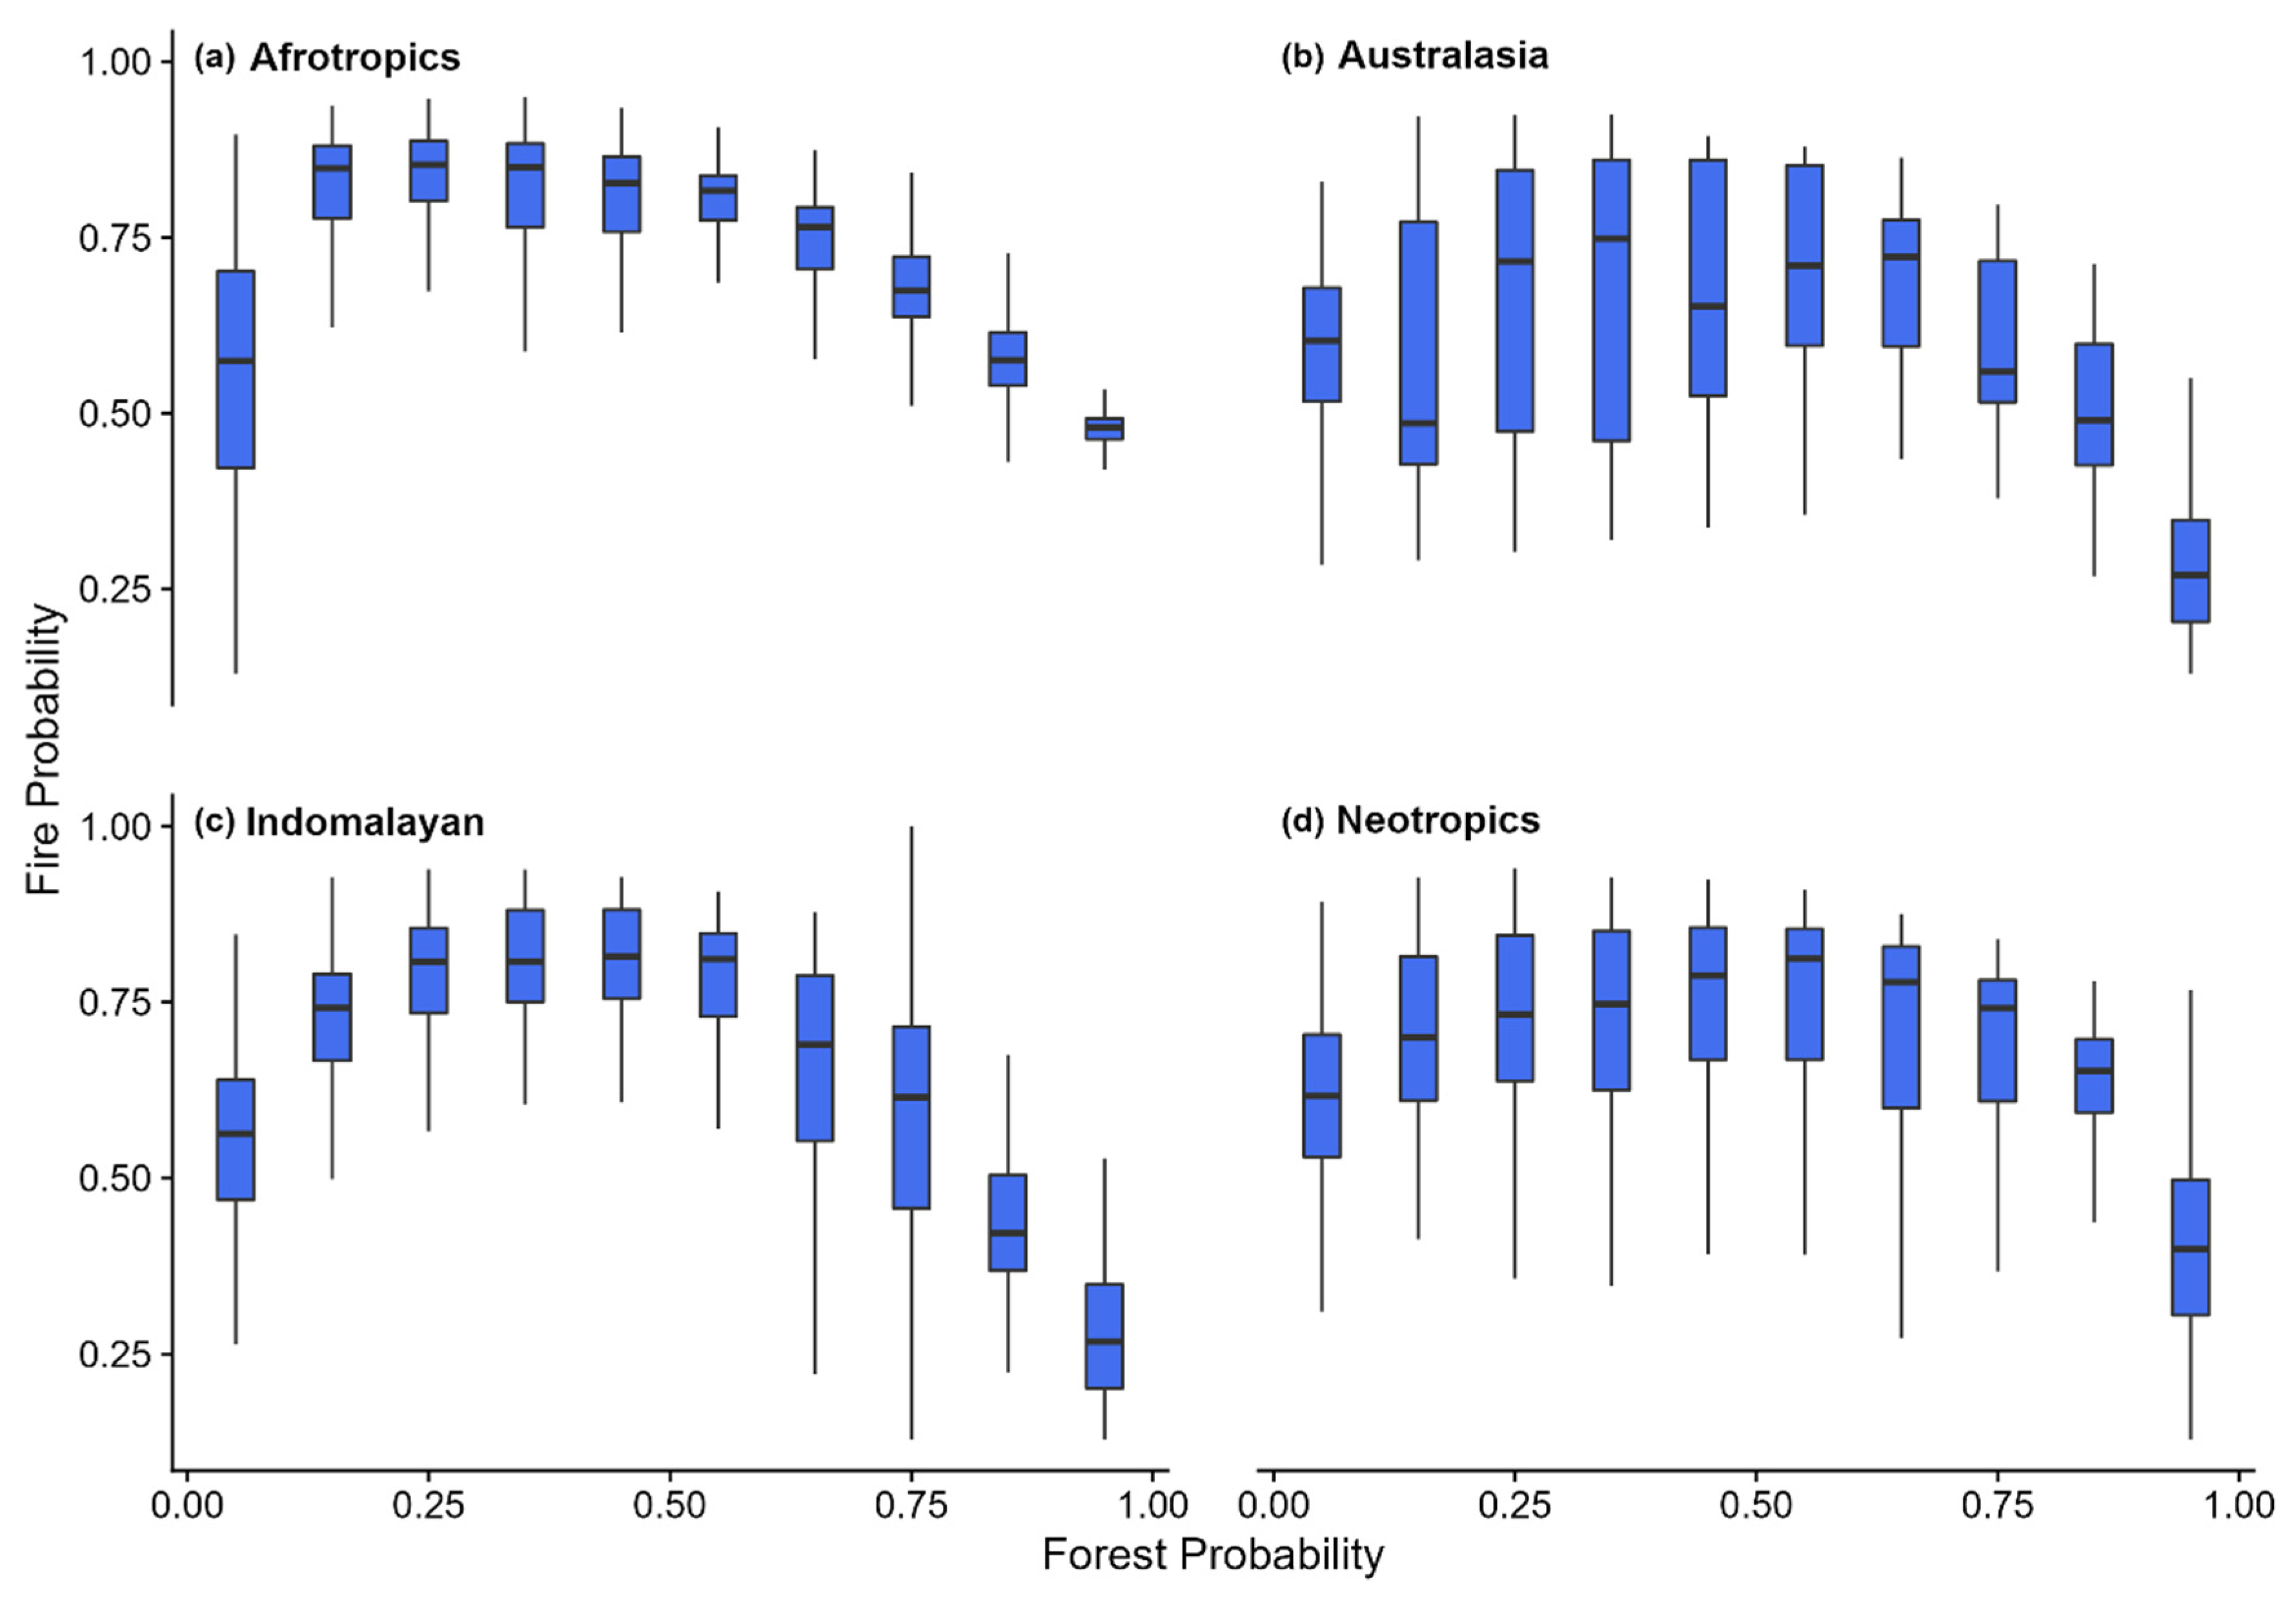
Figure 6b). Collectively, the inverse relationship of driving variables in these two fire models in contrasting vegetation types indicates a negative relationship between tree cover and fire. Reinforcing these global results, we also found that across all biogeographic realms fire probability decreases as forest probability increases (
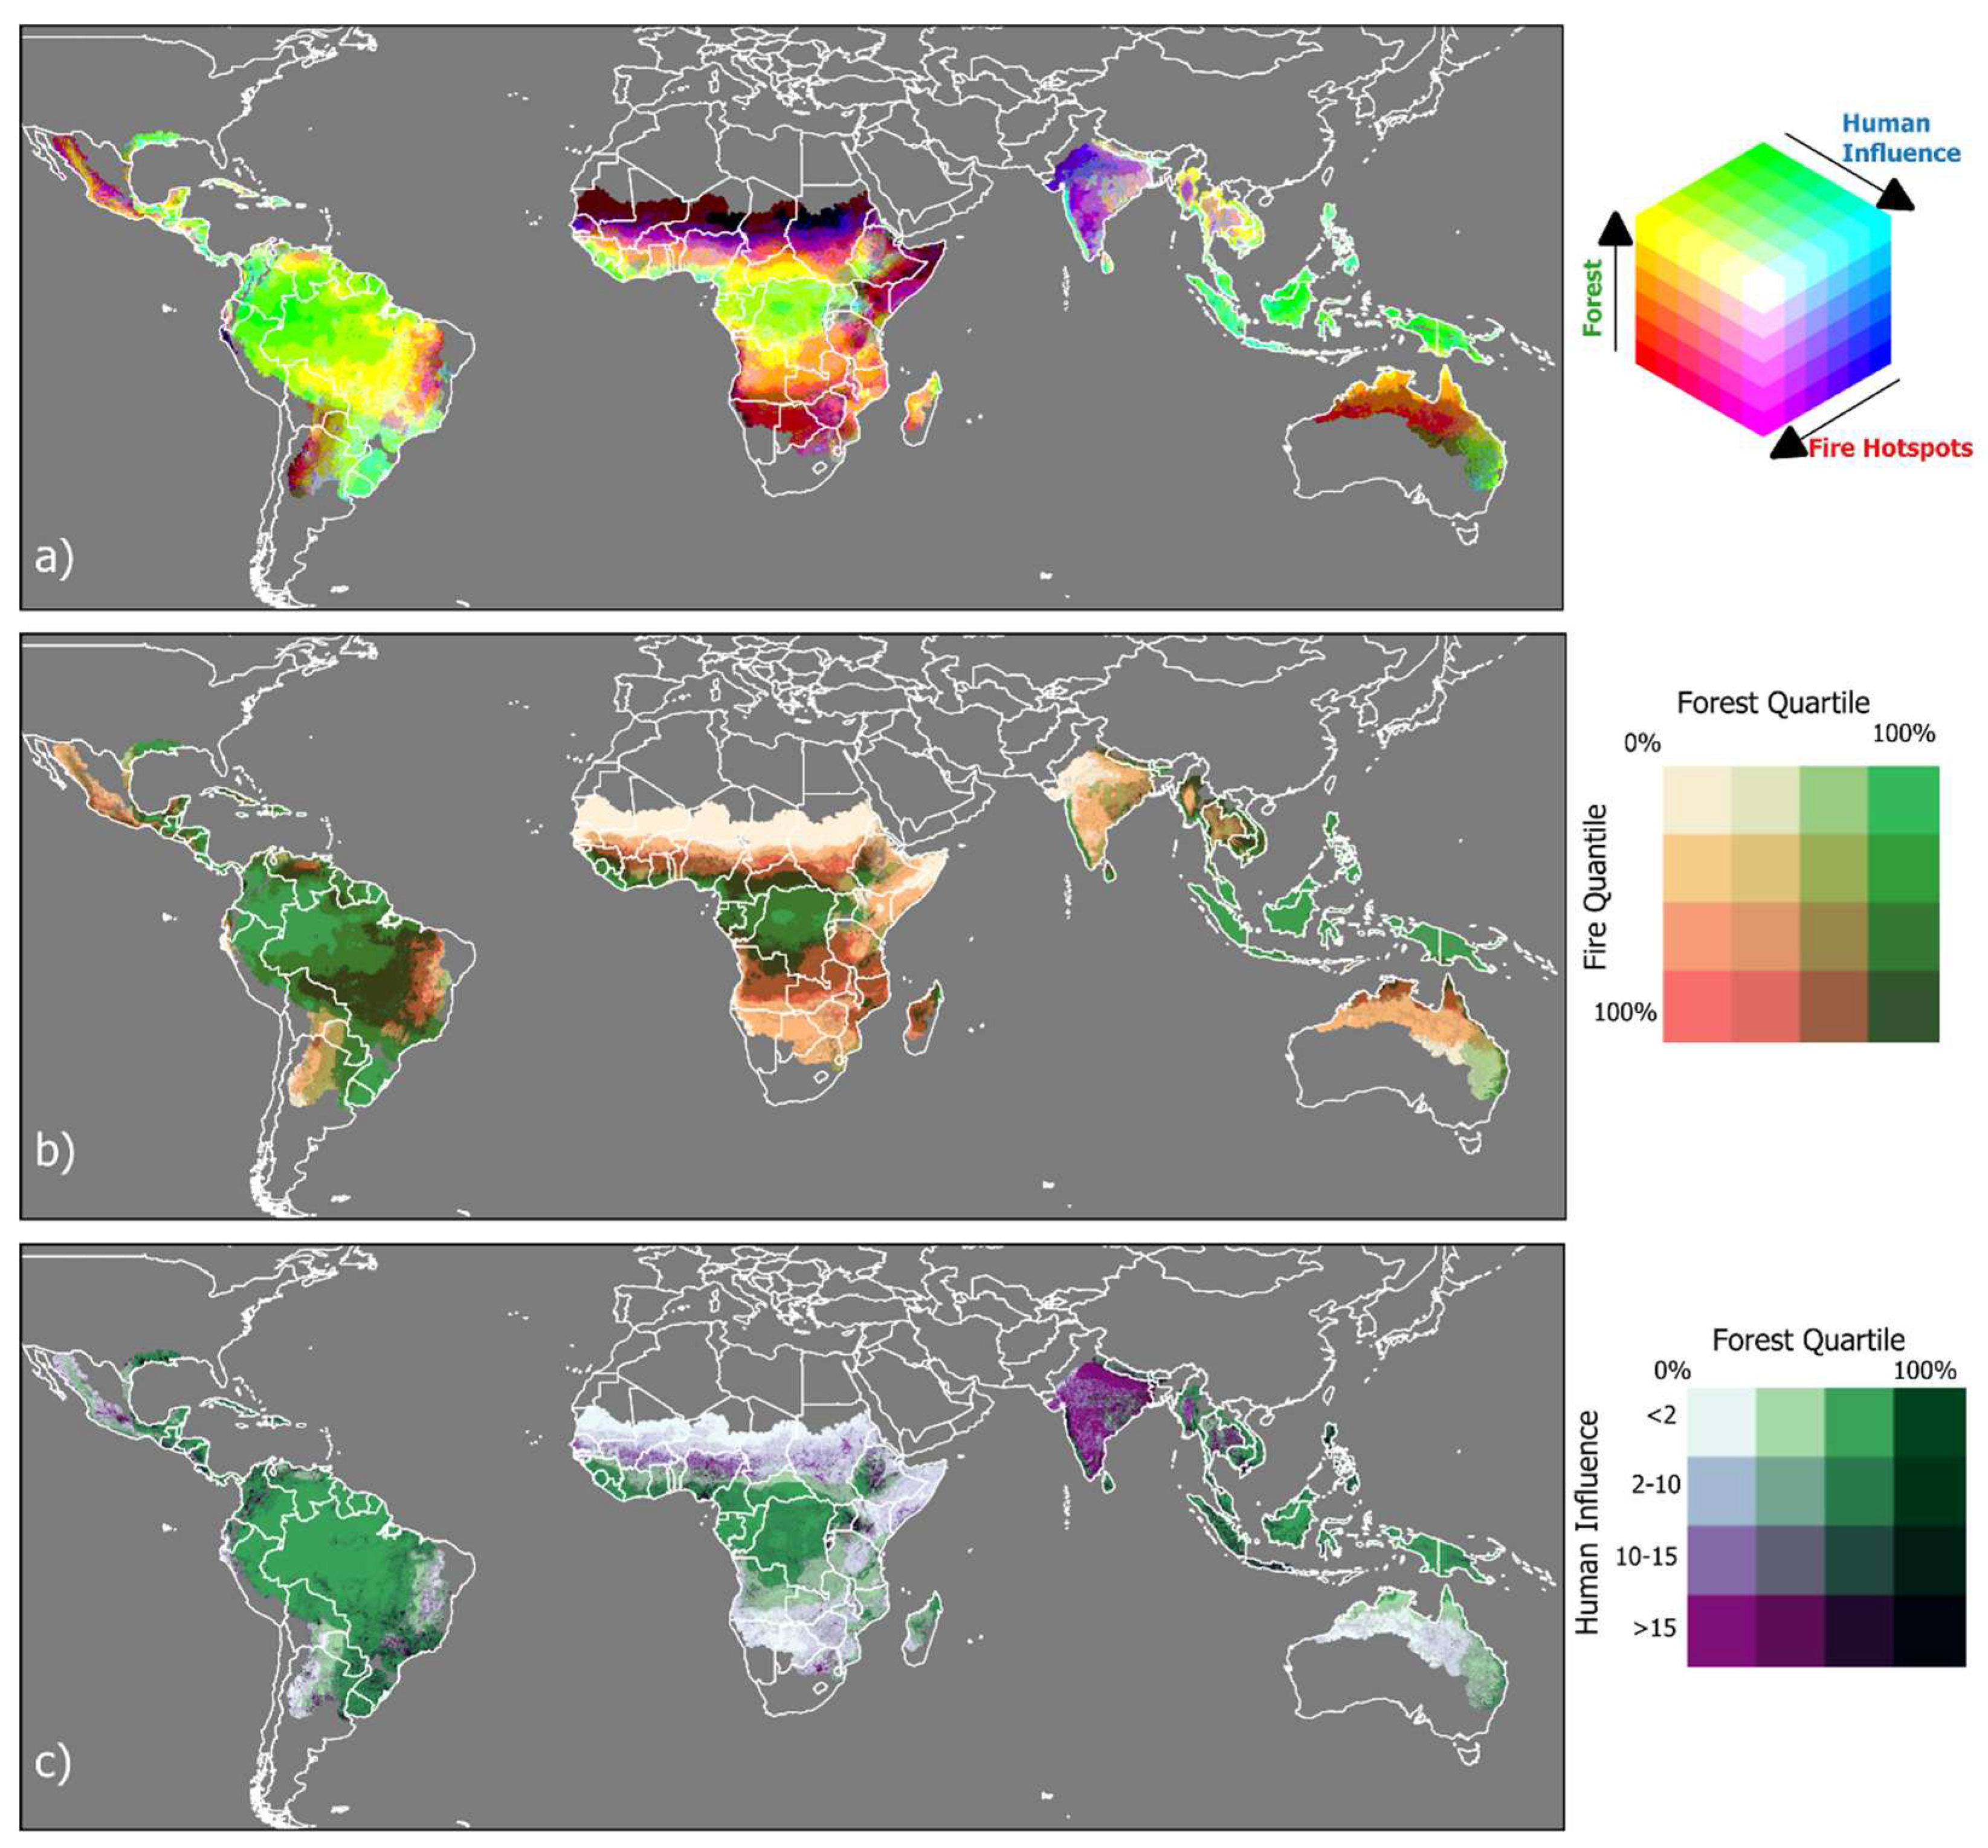
Figure 7). In our graphic model represented as choropleth maps (
Figure 8), we show the trivariate maps of forest probability, human influence, and fire activity (
Figure 8a). Forest probability is lowest where fire activity is high (
Figure 8b), and where human activity is high (
Figure 8c).
Discussion
Our analyses confirm the universality of MAP and dry season length as key factors driving the distribution of tropical forest. Areas with high probability of forest (>60%) occur in the Neotropics, Afrotropics and Indomalayan tropics, closely matching current core areas of tropical forest distribution. Our analyses identified areas where the probability of forest and savanna were approximately the same (regarded as the zone of 40%-60% probability). Separate analyses demonstrated that these climate factors also control the frequency of fire. Our analysis found a minor effect of coarse-scale topography and human influence in shaping forest distribution.
Climate, fire, and anthropogenic disturbance
Tropical forest species are renowned for luxuriant plant growth and high productivity where drought stress is rare. Droughts in tropical forests have been known to substantially impact primary productivity and can cause die-back with substantial loss of carbon (Phillips et al. 2009; Corlett 2016). Rainforest drought is often associated with fire in an ecosystem that otherwise does not support landscape fires. Contrastingly, savanna trees are typically more tolerant of drought stress, often associated with seasonal largely rain-free dry seasons. The oscillation of wet and dry seasons favours frequent landscape fires to which savanna trees are adapted to and recover readily from fire disturbance.
Fire is an important control of the macroecological distribution of forest and savanna (Murphy and Bowman 2012; Lasslop et al. 2016). The effect of fire on shaping forest and savanna distributions is difficult to separate from climate given their correlation with each other (e.g., Murphy et al. 2010). By modelling fire separately from the probability of forest we demonstrate that areas of high forest probability occur in corresponding areas with low fire probability. Our analysis also found that a broad index of topographic variation played a significant, albeit small, additional role in predicting forest probability and fire activity. Regional topographic settings such as plateaus, gorges and mountain ranges are known to provide fire refugia (e.g., Ash 1988; Bowman et al. 2010) but at a global scale these terrain effects are subsumed by climate. We also found that our index of human influence shapes the occurrence of forest distribution. For example, our modelling shows areas, such as the Indian subcontinent and southern Brazil, are suitable for forest but have high human footprint. Such anthropogenic landscapes have contrasting patterns of fire activity compared to natural areas. For example, rainforest conversion to pasture is associated with increased burning, but by contrast savanna area converted to agriculture has substantially reduced fire activity.
Bistability of rainforest and savanna
Several satellite-based studies have suggested that there are large areas of the tropics than can support either tropical forest or savanna (Hirota et al. 2011; Staver et al. 2011). It has been argued the breakdown of the predictability of forest and savanna biomes from environmental drivers is the product of a fire-driven ‘alternative stable state’ dynamic, where forest is fire-excluding and savanna is fire-promoting (Staver et al. 2011). We identified a much smaller geographic extend of such areas where alternative stable state model is likely to explain equal probabilities of forest and savanna occurrence, particularly identifying areas in central Brazil and around the Congo in Africa. It is possible such areas lacking predictability from environmental drivers may be capturing tropical dry forests (Sunderland et al. 2015), which can have closed canopies during the wet season or vary considerably in tree cover and occur in areas with high seasonality (Sunderland et al. 2015; Dryflor et al. 2016). Indeed, much of the area where we have >40% forest probability lies where others have mapped dry forest (David et al. 2022). In interpreting model output of forest probability, a probability range of 40-60% was interpreted as indicative of a zone where forest presence was indeterminant, and it should be noted that this interpretation is somewhat arbitrary, and wider bounds would result in a conclusion of greater area of indeterminant vegetation. Our results lead us to suspect that truly bistable states may exist only in narrow ecotonal vegetation between wet forest types and other arid forest types. The existence of savanna vegetation in climatic zones that are more likely to support forest can be attributed in part to interactions between fire and humans, which can drive plant communities to a large-scale dieback of forests through a savannization process (Flores et al. 2016; Staal et al. 2018). Conversely, changing burning practices and land uses such as pastoralism, as well as increased atmospheric CO2 due to anthropogenic activities have resulted in widespread encroachment of forest into savannas (Aráoz & Grau, 2010; Hecht & Saatchi, 2007; Tng et al. 2012; Nanni et al. 2019).
Global rainforest and savanna mapping
Reliable vegetation mapping is essential for meaningful earth system research; hence an important practical finding of this study is the support for the WWF biome mapping of rainforests (Olson et al. 2001). Remarkably, despite having been cited over 8,000 times in Google Scholar (as from February 2022), this product has not been previously validated using independent data. We found that our predictive models closely match the boundaries of broadleaf tropical forest biomes, as well matching automated satellite-derived forest mapping and MODIS tree cover measurements. A key exception, however, is that large areas mapped as rainforest in Olson et al. 2001 (around one quarter of the land area suitable climate for rainforests) have been transformed into anthropogenic landscapes (e.g., Indian subcontinent, Brazil, and Madagascar). This discrepancy between the potential (in Olson et al. 2001) and actual extent of rainforest does not affect most global analyses of biomes because large areas transformed by humans are routinely masked out using products such as human influence score (Wildlife Conservation Society et al. 2005) or general land-cover mapping (eg. Di Gregorio & Jansen 1998). Indeed, the mismatch between the potential and actual distribution of rainforest highlights the extraordinary impact humans have had on the biosphere. Our approach can be used as a baseline to track further erosion of rainforest cover in response to deforestation, fire, and climate change.
Conclusions
Using a random sampling of manually classified global satellite imagery, we mapped the distribution of tropical forest and savanna in the global tropics and subtropics and used statistical models to identify the environmental drivers of forest distribution. Our results confirm that rainfall is the overarching predictor of forest and savanna distribution where fire activity is low in the former and high in the latter. In contrast to previous studies, we suggest that there are only small areas where climate does not reliably predict forest and savanna. Random sampling suggests anthropogenic disturbance has affected around a quarter of the tropics, particularly in the forest zone. Anthropogenic climate change combined with land cover clearance is likely to further reduce the cover of forest in coming decades. Our maps provide a useful baseline to gauge the rate and geographic location of the major Earth system transformation.
Supplementary Materials
The following supporting information can be downloaded at the website of this paper posted on Preprints.org.
References
- Aráoz, E.; Grau, H.R. Fire-Mediated Forest Encroachment in Response to Climatic and Land-Use Change in Subtropical Andean Treelines. Ecosystems 2010, 13, 992–1005,. [CrossRef]
- Archibald, S.; Roy, D.P.; van Wilgen, B.W.; Scholes, R.J. What limits fire? An examination of drivers of burnt area in Southern Africa. Glob. Chang. Biol. 2009, 15, 613–630,. [CrossRef]
- Aleman, J.C.; Staver, A.C.; Gillespie, T. Spatial patterns in the global distributions of savanna and forest. Glob. Ecol. Biogeogr. 2018, 27, 792–803,. [CrossRef]
- de Souza, A.A.; Galvão, L.S.; Korting, T.S.; Prieto, J.D. Dynamics of savanna clearing and land degradation in the newest agricultural frontier in Brazil. GIScience Remote. Sens. 2020, 57, 965–984,. [CrossRef]
- Amatulli, G.; Domisch, S.; Tuanmu, M.-N.; Parmentier, B.; Ranipeta, A.; Malczyk, J.; Jetz, W. A suite of global, cross-scale topographic variables for environmental and biodiversity modeling. Sci. Data 2018, 5, 180040,. [CrossRef]
- Andersson, K.P.; Cook, N.J.; Grillos, T.; Lopez, M.C.; Salk, C.F.; Wright, G.D.; Mwangi, E. Experimental evidence on payments for forest commons conservation. Nat. Sustain. 2018, 1, 128–135,. [CrossRef]
- Ash, J. The Location and Stability of Rainforest Boundaries in North-Eastern Queensland, Australia. J. Biogeogr. 1988, 15, 619,. [CrossRef]
- Bartholomé E, Belward A (2005) GLC2000: A new approach to global land cover mapping from Earth observation data. Int. J. Remote Sens. 26, 195.
- Bastin, J.-F.; Berrahmouni, N.; Grainger, A.; Maniatis, D.; Mollicone, D.; Moore, R.; Patriarca, C.; Picard, N.; Sparrow, B.; Abraham, E.M.; et al. The extent of forest in dryland biomes. Science 2017, 356, 635–638,. [CrossRef]
- Beckett, H.; Bond, W.J. Fire refugia facilitate forest and savanna co-existence as alternative stable states. J. Biogeogr. 2019, 46, 2800–2810,. [CrossRef]
- Belward, A.S.; Skøien, J.O. Who launched what, when and why; trends in global land-cover observation capacity from civilian earth observation satellites. ISPRS J. Photogramm. Remote. Sens. 2015, 103, 115–128,. [CrossRef]
- Berenguer, E.; Ferreira, J.; Gardner, T.A.; Aragão, L.E.O.C.; De Camargo, P.B.; Cerri, C.E.; Durigan, M.; De Oliveira, R.C.; Vieira, I.C.G.; Barlow, J. A large-scale field assessment of carbon stocks in human-modified tropical forests. Glob. Chang. Biol. 2014, 20, 3713–3726,. [CrossRef]
- Bond, W.J. Bond, W.J. (2008) What limits trees in C4 grasslands and savannas? Annual Review of Ecology, Evolution, and Systematics 39, 641–659.
-
Bowman, D.M.J.S. (2000) Australian Rainforests: Islands of Green in a Land of Fire, Cambridge University Press.
- Bowman, D.M.J.S.; Brown, G.K.; Braby, M.F.; Brown, J.R.; Cook, L.G.; Crisp, M.D.; Ford, F.; Haberle, S.; Hughes, J.; Isagi, Y.; et al. Biogeography of the Australian monsoon tropics. J. Biogeogr. 2010, 37, 201–216,. [CrossRef]
- Bowman, D.M.J.S.; Murphy, B.P.; Williamson, G.J.; Cochrane, M.A. Pyrogeographic models, feedbacks and the future of global fire regimes. Glob. Ecol. Biogeogr. 2014, 23, 821–824,. [CrossRef]
-
Burnham KP, Anderson DR. 2002. Model selection and multimodel inference: A practical information-theoretic approach. Berlin, Germany: Springer.
- Connell, J.H.; Sousa, W.P. On the Evidence Needed to Judge Ecological Stability or Persistence. Am. Nat. 1983, 121, 789–824,. [CrossRef]
- Corlett, R.T. The Impacts of Droughts in Tropical Forests. Trends Plant Sci. 2016, 21, 584–593,. [CrossRef]
- Cuenca, P. Cuenca, P., Robalino, J., Arriagada, R., & Echeverría, C. (2018). Are government incentives effective for avoided deforestation in the tropical Andean forest? PLoS One, 13(9), e0203545.
- David, R.M.; Rosser, N.J.; Donoghue, D.N.M. Remote sensing for monitoring tropical dryland forests: a review of current research, knowledge gaps and future directions for Southern Africa. Environ. Res. Commun. 2022, 4, 042001,. [CrossRef]
- Di Gregorio, A. Di Gregorio, A., & Jansen, L. J. (1998). A new concept for a land cover classification system. The Land, 2(1), 55-65.
-
DiMiceli CM, Carroll ML, Sohlberg RA, Huang C, Hansen MC, Townshend JRG; (2011) Annual Global Automated MODIS Vegetation Continuous Fields (MOD44B) at 250 m Spatial Resolution for Data Years Beginning Day 65, 2000‒2010, Collection 5 Percent Tree Cover. College Park, MD, USA.; University of Maryland.
- Dryflor, Banda-R, K., Delgado-Salinas, A., Dexter, K. G., Linares-Palomino, R., Oliveira-Filho, A.,... & Pennington, R. T. (2016). Plant diversity patterns in neotropical dry forests and their conservation implications. Science, 353(6306), 1383-1387.
- Duvert, C.; Hutley, L.B.; Beringer, J.; Bird, M.I.; Birkel, C.; Maher, D.T.; Northwood, M.; Rudge, M.; Setterfield, S.A.; Wynn, J.G. Net landscape carbon balance of a tropical savanna: Relative importance of fire and aquatic export in offsetting terrestrial production. Glob. Chang. Biol. 2020, 26, 5899–5913,. [CrossRef]
- Elith, J., Burgman, M. (2003). Habitat models for population viability analysis. Population viability in plants (pp. 203–235). Berlin, Germany: Springer. [CrossRef]
- Fick, S.E.; Hijmans, R.J. WorldClim 2: New 1-km spatial resolution climate surfaces for global land areas. Int. J. Climatol. 2017, 37, 4302–4315,. [CrossRef]
- Flores, B.M.; Fagoaga, R.; Nelson, B.W.; Holmgren, M. Repeated fires trap Amazonian blackwater floodplains in an open vegetation state. J. Appl. Ecol. 2016, 53, 1597–1603,. [CrossRef]
- Giglio, L.; Schroeder, W.; Justice, C.O. The collection 6 MODIS active fire detection algorithm and fire products. Remote. Sens. Environ. 2016, 178, 31–41,. [CrossRef]
- Grace, J.; Jose, J.S.; Meir, P.; Miranda, H.S.; Montes, R.A. Productivity and carbon fluxes of tropical savannas. J. Biogeogr. 2006, 33, 387–400,. [CrossRef]
-
Guisan, A., Edwards, T. C. Jr, , Hastie, T. (2002). Generalized linear and generalized additive models in studies of species distributions: Setting the scene. Ecological Modelling, 157, 89–100.
-
Hanan, N. P., Tredennick, A. T., Prihodko, L., Bucini, G., , Dohn, J. (2014). Analysis of stable states in global savannas: Is the CART pulling the horse? Global Ecology and Biogeography, 23(3), 259– 263.
- Hansen, M. Hansen, M., DeFries, R., Townshend, J. R., & Sohlberg, R. (2000). Global land cover classification at 1km resolution using a decision tree classifier. International Journal of Remote Sensing, 21(6-7), 1331-1365.
- Hastie, T., & Tibshirani, R. (1990). In D; R. Cox, D. V. Hinkley, D. Rubin, & B. W. Silverman (Eds.), Generalized additive models. Monographs on statistics and applied probability. London, UK; Chapman & Hall.
- Hecht, S.B.; Saatchi, S.S. Globalization and Forest Resurgence: Changes in Forest Cover in El Salvador. BioScience 2007, 57, 663–672,. [CrossRef]
- Hirota, M.; Holmgren, M.; Van Nes, E.H.; Scheffer, M. Global Resilience of Tropical Forest and Savanna to Critical Transitions. Science 2011, 334, 232–235,. [CrossRef]
- Johansen, K.; Phinn, S.; Taylor, M. Mapping woody vegetation clearing in Queensland, Australia from Landsat imagery using the Google Earth Engine. Remote. Sens. Appl. Soc. Environ. 2015, 1, 36–49,. [CrossRef]
- Karlson, M.; Reese, H.; Ostwald, M. Tree Crown Mapping in Managed Woodlands (Parklands) of Semi-Arid West Africa Using WorldView-2 Imagery and Geographic Object Based Image Analysis. Sensors 2014, 14, 22643–22669,. [CrossRef]
- Langan, L.; Higgins, S.I.; Scheiter, S. Climate-biomes, pedo-biomes or pyro-biomes: which world view explains the tropical forest-savanna boundary in South America? J. Biogeogr. 2017, 44, 2319–2330,. [CrossRef]
- Lasslop, G.; Brovkin, V.; Reick, C.H.; Bathiany, S.; Kloster, S. Multiple stable states of tree cover in a global land surface model due to a fire-vegetation feedback. Geophys. Res. Lett. 2016, 43, 6324–6331,. [CrossRef]
- López-Carr, D. A Review of Small Farmer Land Use and Deforestation in Tropical Forest Frontiers: Implications for Conservation and Sustainable Livelihoods. Land 2021, 10, 1113,. [CrossRef]
- Maestre, F.T.; Benito, B.M.; Berdugo, M.; Concostrina-Zubiri, L.; Delgado-Baquerizo, M.; Eldridge, D.J.; Guirado, E.; Gross, N.; Kéfi, S.; Le Bagousse-Pinguet, Y.; et al. Biogeography of global drylands. New Phytol. 2021, 231, 540–558,. [CrossRef]
- Moreira, A.G. Effects of fire protection on savanna structure in Central Brazil. J. Biogeogr. 2000, 27, 1021–1029,. [CrossRef]
- Murphy, B. P. Murphy, B. P., & Bowman, D. M. (2012). What controls the distribution of tropical forest and savanna? Ecology letters, 15(7), 748-758.
- Murphy, B.P.; Paron, P.; Prior, L.D.; Boggs, G.S.; Franklin, D.C.; Bowman, D.M.J.S. Using generalized autoregressive error models to understand fire-vegetation-soil feedbacks in a mulga-spinifex landscape mosaic. J. Biogeogr. 2010, 37, 2169–2182,. [CrossRef]
- Nanni, A.S.; Sloan, S.; Aide, T.M.; Graesser, J.; Edwards, D.; Grau, H.R. The neotropical reforestation hotspots: A biophysical and socioeconomic typology of contemporary forest expansion. Glob. Environ. Chang. 2018, 54, 148–159,. [CrossRef]
- Ocón, J.P.; Ibanez, T.; Franklin, J.; Pau, S.; Keppel, G.; Rivas-Torres, G.; Shin, M.E.; Gillespie, T.W. Global tropical dry forest extent and cover: A comparative study of bioclimatic definitions using two climatic data sets. PLOS ONE 2021, 16, e0252063,. [CrossRef]
-
Olson, D. M., Dinerstein, E., Wikramanayake, E. D., Burgess, N. D., Powell, G. V., Underwood, E. C., ... Kassem, K. R. (2001). Terrestrial Ecoregions of the World: A New Map of Life on Earth. BioScience, 51(11), 933-938.
-
Ondei, S; Multi--scale determinants of rainforests in the Australian monsoon tropics: , Prior, L. D., Williamson, G. J., Vigilante, T., & Bowman, D. M. (2017). Water, land, fire, and forest.
- Pausas, J.G.; Bond, W.J. Alternative Biome States in Terrestrial Ecosystems. Trends Plant Sci. 2020, 25, 250–263,. [CrossRef]
- Pennington, R.T.; Lehmann, C.E.; Rowland, L.M. Tropical savannas and dry forests. Curr. Biol. 2018, 28, R541–R545,. [CrossRef]
- Phillips, O.L.; Aragão, L.E.O.C.; Lewis, S.L.; Fisher, J.B.; Lloyd, J.; López-González, G.; Malhi, Y.; Monteagudo, A.; Peacock, J.; Quesada, C.A.; et al. Drought Sensitivity of the Amazon Rainforest. Science 2009, 323, 1344–1347,. [CrossRef]
- Post, W.M.; Emanuel, W.R.; Zinke, P.J.; Stangenberger, A.G. Soil carbon pools and world life zones. Nature 1982, 298, 156–159,. [CrossRef]
- Rehm, E.M.; Feeley, K.J. The inability of tropical cloud forest species to invade grasslands above treeline during climate change: potential explanations and consequences. Ecography 2015, 38, 1167–1175,. [CrossRef]
- Rietkerk, M.; Dekker, S.C.; de Ruiter, P.C.; van de Koppel, J. Self-Organized Patchiness and Catastrophic Shifts in Ecosystems. Science 2004, 305, 1926–1929,. [CrossRef]
- Russell-Smith, J. Whitehead, P. J., Cook, G. D., Hoare, J. L. (2003). Response of Eucalyptus--dominated savanna to frequent fires: lessons from Munmarlary, 1973–1996. Ecological Monographs, 73(3), 349-375. [CrossRef]
- Rutherford, M.C.; Powrie, L.W.; Husted, L.B. Plant diversity consequences of a herbivore-driven biome switch from Grassland to Nama-Karoo shrub steppe in South Africa. Appl. Veg. Sci. 2011, 15, 14–25,. [CrossRef]
- Schepaschenko, D., Fritz, S., See, L., Bayas, J. C. L., Lesiv, M., Kraxner, F., & Obersteiner, M. (2017). Comment on “The extent of forest in dryland biomes”. Science, 358(6362).
- Staal, A., & Flores, B. M. (2015). Sharp ecotones spark sharp ideas: comment on” Structural, physiognomic and above-ground biomass variation in savanna–forest transition zones on three continents–how different are co-occurring savanna and forest formations?” by Veenendaal et al. (2015). Biogeosciences, 12(18), 5563-5566.
- Staal, A.; Dekker, S.C.; Xu, C.; van Nes, E.H. Bistability, Spatial Interaction, and the Distribution of Tropical Forests and Savannas. Ecosystems 2016, 19, 1080–1091,. [CrossRef]
- Staal, A.; van Nes, E.H.; Hantson, S.; Holmgren, M.; Dekker, S.C.; Pueyo, S.; Xu, C.; Scheffer, M. Resilience of tropical tree cover: The roles of climate, fire, and herbivory. Glob. Chang. Biol. 2018, 24, 5096–5109,. [CrossRef]
- Staver, A.C.; Archibald, S.; Levin, S.A. The Global Extent and Determinants of Savanna and Forest as Alternative Biome States. Science 2011, 334, 230–232,. [CrossRef]
- Staver, A.C.; Hansen, M.C. Analysis of stable states in global savannas: is the CART pulling the horse? - a comment. Glob. Ecol. Biogeogr. 2015, 24, 985–987,. [CrossRef]
- Sunderland, T.; Apgaua, D.; Baldauf, C.; Blackie, R.; Colfer, C.; Cunningham, A.; Dexter, K.; Djoudi, H.; Gautier, D.; Gumbo, D.; et al. Global dry forests: a prologue. Int. For. Rev. 2015, 17, 1–9,. [CrossRef]
- Swaine, M.D.; Hawthorne, W.D.; Orgle, T.K. The Effects of Fire Exclusion on Savanna Vegetation at Kpong, Ghana. Biotropica 1992, 24, 166,. [CrossRef]
- Tang, H.; Armston, J.; Hancock, S.; Marselis, S.; Goetz, S.; Dubayah, R. Characterizing global forest canopy cover distribution using spaceborne lidar. Remote. Sens. Environ. 2019, 231, 111262,. [CrossRef]
- Tng, D.Y.P.; Murphy, B.P.; Weber, E.; Sanders, G.; Williamson, G.J.; Kemp, J.; Bowman, D.M.J.S. Humid tropical rain forest has expanded into eucalypt forest and savanna over the last 50 years. Ecol. Evol. 2011, 2, 34–45,. [CrossRef]
- VAN DER Werf, G.R.; Randerson, J.T.; Collatz, G.J.; Giglio, L. Carbon emissions from fires in tropical and subtropical ecosystems. Glob. Chang. Biol. 2003, 9, 547–562,. [CrossRef]
- van Nes, E.H.; Staal, A.; Hantson, S.; Holmgren, M.; Pueyo, S.; Bernardi, R.E.; Flores, B.M.; Xu, C.; Scheffer, M. Fire forbids fifty-fifty forest. PLOS ONE 2018, 13, e0191027,. [CrossRef]
- Veenendaal, E.M.; Torello-Raventos, M.; Miranda, H.S.; Sato, N.M.; Oliveras, I.; van Langevelde, F.; Asner, G.P.; Lloyd, J. On the relationship between fire regime and vegetation structure in the tropics. New Phytol. 2018, 218, 153–166,. [CrossRef]
- Warman, L.; Moles, A.T. Alternative stable states in Australia’s Wet Tropics: a theoretical framework for the field data and a field-case for the theory. Landsc. Ecol. 2008, 24, 1–13,. [CrossRef]
- Whittaker, R.H., 1974. Climax concepts and recognition. In Vegetation dynamics (pp. 137-154). Springer, Dordrecht. [CrossRef]
- Wildlife Conservation Society—WCS, and Center for International Earth Science Information Network—CIESIN—Columbia University. 2005. Last of the Wild Project, Version 2, 2005 (LWP-2): Global Human Influence Index (HII) Dataset (Geographic). Palisades, New York: NASA Socioeconomic Data and Applications Center (SEDAC). https://doi.org/10.7927/H4BP00QC. [CrossRef]
-
Wood, S. N. (2001). mgcv: GAMs and generalized ridge regression for R. R News, 1, 20–25.
- Wood, S. W., Bowman, D. M. (2012). Alternative stable states and the role of fire–vegetation–soil feedbacks in the temperate wilderness of southwest Tasmania. Landscape Ecology, 27(1), 13-28. [CrossRef]
- Woodward, F.I.; Lomas, M.R.; Kelly, C.K. Global climate and the distribution of plant biomes. Philos. Trans. R. Soc. B: Biol. Sci. 2004, 359, 1465–1476,. [CrossRef]
- Wuyts, B.; Champneys, A.R.; House, J.I. Amazonian forest-savanna bistability and human impact. Nat. Commun. 2017, 8, 15519,. [CrossRef]
- Zimbres, B.; Shimbo, J.; Bustamante, M.; Levick, S.; Miranda, S.; Roitman, I.; Silvério, D.; Gomes, L.; Fagg, C.; Alencar, A. Savanna vegetation structure in the Brazilian Cerrado allows for the accurate estimation of aboveground biomass using terrestrial laser scanning. For. Ecol. Manag. 2019, 458, 117798,. [CrossRef]
Figure 1.
Distribution of classified points within Tropical (A) and Hot Arid Steppe (BSh) Köppen climate zones, coloured by class. Map lines delineate study areas and do not necessarily depict accepted national boundaries.
Figure 1.
Distribution of classified points within Tropical (A) and Hot Arid Steppe (BSh) Köppen climate zones, coloured by class. Map lines delineate study areas and do not necessarily depict accepted national boundaries.
Figure 2.
Predicted forest probability within the global sampled climate space of Mean Annual Precipitation and Precipitation Seasonality Index based on the best performing generalized additive model, with human influence index and topographic position index held at their median values. Colours denote the predicted probability of forest in 10% intervals.
Figure 3.
Predicted forest probability within (a) Afrotropics (AT); (b) Australasia (AA); (c) Neotropics (NT), and (d) Indomalaya (IM) climate space of Mean Annual Precipitation and Precipitation Seasonality Index based on the best performing generalized additive model, with human influence index and topographic position index held at their median values. Colours denote the predicted probability of forest in 10% intervals.
Figure 4.
Predicted distributions of forest and non-forest vegetation types across the tropics based on best performing generalized additive model fitting forest occurrence to climate, topographical and human influence. Map lines delineate study areas and do not necessarily depict accepted national boundaries.
Figure 5.
(a) Within the analysed climate zones, boundary of the modelled contour representing 50% forest occurrence probability (red line) overlaid on the Hansen (2000) global satellite-based classification of extant evergreen broadleaf forest (dark green), and the Olson et al. (2001) biome boundary of tropical and sub-tropical moist broadleaf forest (light green). (b) 50% forest probability area shown in red.
Figure 6.
Effect plots for generalized linear models fitting the fire frequencies to environmental variables. Effect plots using the (a) Non-forest savanna grid cells (n = 9904; 29.3.7% deviance explained) and (b) forest grid cells (n = 6,208; 25.5% deviance explained). Fuzzy points indicate density of training data.
Figure 7.
Boxplots of predicted fire probabilities versus predicted forest probabilities broken down by biogeographic realm, (a) Afrotropics, (b) Australasia, (c) Indomalayan and (d) Neotropics.
Figure 7.
Boxplots of predicted fire probabilities versus predicted forest probabilities broken down by biogeographic realm, (a) Afrotropics, (b) Australasia, (c) Indomalayan and (d) Neotropics.
Figure 8.
(a) Trivariate choropleth map of forest probability, human influence, and fire activity. (b) Bivariate choropleth map of forest probability quartile and fire activity quartile, and (c) forest probability quartile and human influence index. Map lines delineate study areas and do not necessarily depict accepted national boundaries.
Table 1.
Review of definitions and of bistability and alternative stable states as they relate to forest and savanna systems.
Table 1.
Review of definitions and of bistability and alternative stable states as they relate to forest and savanna systems.
| Definition/causes of bistability |
Reference |
| Forest and savanna bistability based on interactions between fire and vegetation. However, areas exist where both forest and savanna can co-exist under the same climate regime. Use a definition of forest as greater than ~60% cover, and savanna as less than 50% cover. |
Staver et al. 2011 |
| Experimental evidence, following individuals or community over a complete cycle of state switching, required to confirm multiple stable states. |
Connell & Sousa 1983 |
| Forest, savanna, and grasslands represent multimodal states based on rainfall. Use a cut-off of 60% cover to define forest versus savanna. |
Hirota et al. 2011 |
| Different ecotonal vegetation communities can exist in between stable forest and savanna states based on fire frequency and moisture availability. |
Warman & Moles 2009 |
| Vegetation mosaics can exist in ecotonal areas between alternative stable states. |
Staal & Flores 2015 |
| Local coexistence of forest and savanna states only possible very near critical climate threshold points, although with hysteresis driven by fine-scale edaphic/topographic variability. Use a value of 50% tree cover to separate basins of attraction. |
Staal et al. 2016 |
| States defined by stability over generational timescales, co-occurrence in the same environment, with demonstration of evidence for potential dynamic occupation of one site by both states. |
Pausas & Bond 2020 |
| Fire-vegetation-soil feedbacks determine forest and non-forest states in western Tasmania. |
Wood & Bowman 2012 |
|
Disclaimer/Publisher’s Note: The statements, opinions and data contained in all publications are solely those of the individual author(s) and contributor(s) and not of MDPI and/or the editor(s). MDPI and/or the editor(s) disclaim responsibility for any injury to people or property resulting from any ideas, methods, instructions or products referred to in the content. |
© 2023 by the authors. Licensee MDPI, Basel, Switzerland. This article is an open access article distributed under the terms and conditions of the Creative Commons Attribution (CC BY) license (https://creativecommons.org/licenses/by/4.0/).
