
Submitted:
01 September 2023
Posted:
04 September 2023
You are already at the latest version
Abstract
In this research, a novel collector cetyl trimethyl ammonium chloride (CTAC) was used to separate hematite from quartz via reverse flotation for the first time. Micro-flotation tests showed that CTAC had a strong ability to selectively collect quartz and a separation of hematite from quartz could be accomplished with a concentration of 0.00263 mmol/L CTAC. Zeta-potential measurements indicated that the positive CTAC+ species could selectively increase the surface potential of quartz, but it had rather a weak effect on the hematite surface. X-ray photoelectron spectroscopy (XPS) detection indicated that CTAC had a stronger binding affinity to oxygen sites on the surface of quartz than that of hematite, resulting in a large amount of CTAC predominantly adsorbed on quartz rather than hematite.
Keywords:
Hematite
; Quartz
; Cetyl trimethyl ammonium chloride
; Selective adsorption
; Flotation separation
1. Introduction
Metallic iron is the basic supporting metal for human life and social development. It is widely used in steel production, military industry, machinery, construction, and transportation [1,2]. Therefore, efficient utilization of iron ore resources was crucial to the development of economy and people’s livelihood. With high iron content, hematite (Fe2O3) is an important source of iron metal extraction. In natural deposits, the main gangue minerals associated with hematite are quartz, chlorite, kaolinite, etc [3]. According to the difference in mineralization conditions and ore properties, various techniques such as magnetic separation, gravity concentration and static separation have been used for the separation and purification of hematite [4]. However, with the depletion of high-grade resources, the above methods can become inefficient in processing low-grade and complex fine-grained hematite ores. In such a circumstance, froth flotation has been viewed as the most effective solution, both technologically and economically, to enrich hematite concentrates.
At present, many studies and industrial practices have confirmed that reverse cationic flotation route, namely using a cationic collector to float and reject silicate gangue minerals, is the most effective and widely used method for hematite purification [1,5]. In iron ore beneficiation, the commonly used collector for removing quartz from hematite was dodecylamine (DDA) [6,7]. However, due to the strong foaming and electrostatic attraction function of DDA, a large amount of hematite can be collected by DDA along with quartz, causing inefficient separation. Additionally, DDA has the disadvantage of limited solubility in aqueous solutions. Therefore, a large number of new collectors have been studied such as bis(2-hydroxy-3-chloropropyl) dodecylamine (N23) [1], tertiary amines [8], amides [9], and polyamines [10] to improve the separation of hematite and quartz. Despite their effectiveness, the complex synthesis process and high production costs of theses reagents limit their commercial application. Thus, it is necessary to develop high-selectivity and low-costs collectors for the efficient separation of hematite from quartz.
Quaternary ammonium salt cation (QAS) is commonly used as surfactants due to its excellent water solubility and adaptability in wide pH [11,12]. In terms of mineral purification, QAS have been studied in the flotation of oxidized ore as a cation collector. As a QAS-type reagent, cetyl trimethyl ammonium chloride (CTAC) has much better water solubility than DDA, and it is easily obtained commercially with economic feasibility. It has been studied as a collector in the flotation of magnesite and quartz and exhibited good collection ability for quartz [13]. However, there is no report regarding the effectiveness of CTAC in iron ore flotation system. Therefore, it would be valuable to investigate the potential use of CTAC in reverse flotation separation of hematite and quartz.
In this study, CTAC, as a novel collector, was employed to efficiently separate hematite from quartz via reverse flotation. The effects of CTAC on the flotation behaviors of the two minerals were studied through micro-flotation experiments. Furthermore, the selective adsorption mechanism of CTAC were uncovered via zeta potential and XPS measurements.
2. Materials and Methods
2.1. Materials and reagents
High purity hematite and quartz samples were obtained from an iron ore mine in eastern Canada and US SILICA company, respectively. The results of X-ray powder diffraction patterns (Figure 1) and X-ray fluorescence chemical analysis (Table 1) displayed in the supplementary data were determined by Ultima IV and S8 TIGER devices, respectively. The purities of the hematite and quartz samples were 97.12% and 98.51%, respectively.
For the micro-flotation tests, the mineral samples were ground and sieved to obtain the size fraction of 45-90 μm, whereas the samples were further ground in an agate mortar to obtain the -5 μm particle fraction for zeta-potential and XPS measurements. The cetyl trimethyl ammonium chloride (CTAC) of analytical grade was purchased from Thermo Fisher Scientific and used as the collector.
2.2. Microflotation tests
Micro-flotation flotation tests for the single or synthetic mixed minerals (the mass ratio of hematite and quartz was 1:1) were carried out in a custom-made glass flotation tube modified after Siwek, schematically shown in Figure 2 [14]. For each test, 2 g of sample was added to the sintered glass container with a diameter of 1.6 µm installed at the bottom of the tube. Subsequently, 180 mL of deionized water was added and agitated at 2000 rpm for 2 min to ensure that the mineral particles were evenly mixed. After stirring this pulp, the collector CTAC was added to the flotation tube, followed by 5 min of stirring and a subsequent 5 min of flotation. Finally, the concentrate was scraped, dried, weighed, and the chemical compositions (Fe and SiO2) were determined via S8 TIGER device.
For the individual-mineral flotation and artificially mixed-mineral flotation, the mineral recoveries were determined by equations (1) and (2), respectively.
where ε and mc express the mineral recovery (%) and the mass of the concentrate (g), respectively.
where ε expresses the mineral recovery (%), β refers to the Fe2O3 or SiO2 grade (%) of this mineral in the concentrate.
2.3. Zeta-potential measurements
The zeta potential of the hematite and quartz under different CTAC concentrations was measured using the Zeta Finder analyzer (USA). To prepare sample, 90 mg of mineral particles was suspended in 180 mL of 1 × 10⁻³ mol/L KCl solution and conditioned at 2000 rpm for 5 min. Afterwards, CTAC was added, and the pulp was stirred for another 5 min. Finally, the suspension was allowed to stand for 5 min, and the supernatant was aspirated for measurements. Five tests were conducted for each condition, and average and standard deviation values were calculated and reported as final results.
2.4. XPS measurement
Kratos AXIS 165 spectrometer were used to detect the XPS spectra of the hematite and quartz before and after treated with CTAC. In this research, C1s peak at 280.4 was taken as the standard under the XPS spectra was corrected [15,16]. 2 g of sample mixed with 180 mL distilled water was added to the flotation equipment, centrifuged at 2000 rpm for 5 min, and vacuum filtration was carried out. The solid minerals on filter paper was washed three times with distilled water, dried at room temperature for 24h, and analyzed..
3. Results
3.1. Microflotation tests
Micro-flotation was carried out under the natural suspension pH which was set to approximately 5.0. To observe the floatability of both minerals by CTAC, flotation recovery was examined as a function of CTAC concentration as shown in Figure 3.
As seen in Figure 3, a similar increasing floatability trend was observed for quartz and hematite with the increase of CTAC concentration. With increasing CTAC dosages from 0.00 to 43.75 ×10⁻⁴ mmol/L, the hematite and quartz recovery increased from 0.21 to 37.29% and 0.13 to 90.04%, respectively. Moreover, the recoveries of the two minerals indicated that CTAC exhibited much better collection ability towards quartz than hematite, and a significant recovery difference (about 60.47%) between them was obtained when the concentration of CTAC was 26.25×10⁻⁴ mmol/L. This observation may be attributed to two main reasons. First, CTAC as a quaternary ammonium salt could completely dissolve in water and generated positively charged C19H42N+ and negatively charged Cl— with the following equation [13].
C19H42NCl = C19H42N+ + Cl—
Second, isoelectric points of hematite and quartz were approximately pH 4.8 and pH 2.5, respectively [17,18], and the surface potential of quartz was more negative than that of hematite at pH 5.0. Therefore, C19H42N+ with cationic functional groups exhibited stronger affinity towards quartz than hematite due to the same charge will repel, different charges will attract.
To further verify the selectivity of CTAC between hematite and quartz, the mixed minerals separation tests were conducted at a mass ratio of 1:1, and the corresponding assay results in the froth products are shown in Table 2.
From Table 2, the yield and hematite recovery of froth product increased from 51.27 to 71.12% and from 26.43 to 52.82%, respectively, with CTAC concentration increasing from 17.50 to 35.00 ×10⁻⁴ mmol/L. In addition, the recovery of quartz increased from 76.11 to 92.72% with CTAC dosages from 17.50 to 26.25 ×10⁻⁴ mmol/L, and a stable trend was observed as the concentration increased further. Compared with single mineral flotation results, the recovery of quartz was rarely changed. However, the recovery of hematite in artificial mixed minerals was about 1.8 times higher than that in the single hematite flotation under the same concentration of CTAC. The reason for the increase of hematite recovery was likely due to the partial hetero-aggregation and entrapment between positively charged hematite and quartz that had negative surface charge in suspension, and they floated together into the froth phase especially in the presence of higher dosages of CTAC. Overall, hematite and quartz still had a recovery difference of 45.46% with a CTAC concentration of 26.25 ×10⁻⁴ mmol/L, indicating that the CTAC remained a high selective collection capacity for quartz in mixed minerals.
3.2. Zeta-potential measurements
CTAC dissociates in water and exists in the form of positively charged C19H42N+, the adsorption of which on mineral surface can change the electrical property of mineral/liquid interface. Here, the adsorption capacity of CTAC on the surface of hematite and quartz was analyzed by measuring surface potential changes of minerals before and after the interaction with CTAC. The zeta-potential measurements were conducted under different CTAC concentrations at pH 5.0, and the results are presented in Figure 4.
As shown in Figure 4, the zeta potentials of hematite and quartz were -16.37 and -41.87 mV, respectively, without any reagents. It can be observed that as the CTAC concentration increased from 0 to 26.25 ×10⁻⁴ mmol/L, the zeta potential of hematite and quartz positively increased by 15.58 and 55.97 mV, respectively. These results indicated that the positively charged C19H42N+ cation was adsorbed on the surface of hematite and quartz, increasing the zeta potential value of the two mineral surfaces. In addition, the increase of surface zeta potential of quartz was significantly higher (about 3.59 times) than that of hematite, indicating that the adsorption amount of C19H42N+ on quartz surface was far greater compared with hematite, which was in agreement with the micro-flotation results.
3.3. XPS measurements
In order to further reveal the adsorption difference and mechanism of CTAC on the mineral surface, the XPS analysis was detected with a CTAC concentration of 26.25 ×10⁻⁴ mmol/L at pH 5. The XPS spectra of hematite and quartz before and after treatment with CTAC are shown in Figure 5 and Figure 6, respectively.
From Figure 5, the Fe2p1, Fe2p2 and O1s peaks were detected at approximately 724, 711 and 531eV, which was attributable to the iron and oxygen elements on the surface of hematite [19]. Figure 6 shows that O1s and Si2p peaks were detected at binding energy 102 and 531 eV, respectively, which indicated SiO2 as the main component of quartz and no significant contaminant was detected [12,13]. The C1s peaks in spectra were positioned at around 284.8 eV, mainly attributable to carbon dioxide in the air and the CTAC molecules [20,21,22]. The peak intensities of C1s in Figure 5a,b were 16516.7 and 18096.7, respectively, and the offset value was 1580 after treatment with CTAC. In contrast, the peak intensities of C1s in Figure 6a,b were 14933.3 and 20283.3, respectively, with a much higher offset value of 5350 by CTAC. Above results indicated that the adsorption of CTAC could enhance peak intensities of C1s for both hematite, however, the increment of quartz was 3.39 times higher than that of hematite, suggesting a stronger affinity of CTAC with quartz surface. In addition, N1s peaks were detected in 400.23 eV (Figure 6b) of quartz after CTAC treatment, and there was no obvious change in the spectrum of hematite before and after treatment with CTAC. These results indicate that in addition to carbon dioxide in the air, CTAC was also adsorbed on the surface of minerals, and the adsorption density of CTAC on the quartz surface was far greater than that of hematite.
Table 3 quantifies the effect of CTAC on the content of mineral surface elements, showing the content of surface elements of hematite and quartz before and after treatment with CTAC.
As can be seen, there was a slight change in the atomic concentration of the main element on hematite surface after interaction with CTAC, indicating weak adsorption, which was supported by the low offsets of C1s (2.40%) N1s (0.43%). However, after treating quartz with CTAC, the atomic concentrations of C1s and N1s were 23.74% and 1.22%, respectively. In contrast with hematite sample, the atomic concentration offsets of C1s and N1s of quartz after CTAC treatment were 4.25 and 2.84 times higher, respectively. This proved that CTAC strongly adsorbed onto quartz rather than hematite. In comparison with hematite, the stronger adsorption of CTAC onto quartz enhances its good flotation performance, thereby achieving efficient removal of quartz from hematite via reverse flotation.
As an amine cationic collector, CTAC was mainly adsorbed on the mineral surface by electrostatic adsorption and hydrogen bonding [12,13]. Therefore, in order to obtain the difference in the adsorption strength of CTAC on the surface of hematite and quartz, the anions (i.e., O1s) on the surface of the two minerals before and after treatment with CTAC were fitted and analyzed, and the results are shown in Figure 7 and Figure 8.
Figure 7 shows that the O1s XPS spectra of hematite before and after treatment with CTAC shifted from 529.50 (Figure 7a) to 529.58 eV (Figure 7b), which was an offset of 0.08 eV, indicate that the interaction between CTAC and oxygen sites on the surface of hematite was weak. However, after treating quartz with CTAC, the binding energy of O1s shifted from 530.11 (Figure 8a) to 529.79 eV (Figure 8b), which was an offset of 0.32 eV. After treatment with CTAC, the deviation of the binding energy of O1s on the surface of quartz was four times of that of hematite, which indicated that the adsorption capacity of CTAC on the surface of quartz was much greater than that of hematite. In summary, the XPS analysis results was consistent with those of the flotation tests and zeta-potential measurements, thus providing further support for the efficient separation of hematite from quartz using CTAC as a collector via reverse flotation.
4. Conclusions
As a quaternary ammonium salt cationic surfactant, CTAC was used for the first time in the research of flotation separation of hematite and quartz. The main conclusions are as follows.
- Micro-flotation experiments found that the hematite and quartz could achieve better separation as the concentration of CTAC was 26.25 ×10⁻⁴ mmol/L under natural pH conditions.
- More quantities of CTAC were adsorbed on quartz than hematite owing to the stronger binding ability between CTAC and oxygen element of quartz surface.
Author Contributions
Validation and data curation, H.S.; methodology and conceptualization, Y.W. and W.Y.; writing—original draft preparation, J.Y. All authors have read and agreed to the published version of the manuscript.
Funding
This research was funded by the National Natural Science Foundation of China [52374271, 52174239 and 51974064], Key Development Plan for Applied Basic Research Project of Liaoning Province [2022JH2/101300111], General Project of the Educational Department of Liaoning Province [LJKMZ20220588], and Project of Shenyang Bureau of Science and Technology [22-322-3-03].
Acknowledgments
The authors would like to express their sincere gratitude to the editors and the anonymous reviewers for their helpful remarks and constructive comments, which have improved the quality of the paper.
Conflicts of Interest
The authors declare no conflict of interest.
References
- Liu, W.G.; Liu, W.B.; Dai, S.J.; Wang, B.Y. Adsorption of bis(2-hydroxy-3-chloropropyl) dodecylamine on quartz surface and its implication on flotation. Results Phys. 2018, 9, 1096–1101. [Google Scholar] [CrossRef]
- F. LO, S.; VV, F. IV. An overview of the beneficiation of iron ores via reverse cationic flotation. Int. J. Miner. Process. 2014, 127, 62–9. [CrossRef]
- Wu, H.; Qiu, T.; Zhao, G.; Zhu, D.; Li, X.; Feng, B. Investigations on the reverse cationic flotation separation of quartz from hematite using polyaspartic acid as depressant. Appl. Surf. Sci. 2023, 614, 156143. [Google Scholar] [CrossRef]
- Han, W.; Zhu, Y.; Liu, J.; Li, Y. A novel depressant HPAM of the hematite in reverse cationic flotation of iron ore. Colloids Surf. A. 2022, 641, 128547. [Google Scholar] [CrossRef]
- Li, D.; Yin, W.; Xue, J.; Yao, J.; Fu, Y.; Liu, Q. Solution chemistry of carbonate minerals and its effects on the flotation of hematite with sodium oleate. Int. J. Min. Met. Mater. 2017, 24, 736–44. [Google Scholar] [CrossRef]
- Sun, H.; Yang, B.; Zhu, Z.; Yin, W.; Sheng, Q.; Hou, Y.; Yao, J. New insights into selective-depression mechanism of novel depressant EDTMPS on magnesite and quartz surfaces: adsorption mechanism, DFT calculations, and adsorption model. Miner. Eng. 2021, 160, 106660. [Google Scholar] [CrossRef]
- Han, C.; Zhang, H.; Tan, R.; Shen, Y.; Wei, D.; Liu,W. Effects of monohydric alcohols of varying chain lengths and isomeric structures on magnesite and dolomite flotation by dodecylamine. Powder Technolo. 2020, 374, 233–240. [Google Scholar] [CrossRef]
- Weng, X.; Mei, G.; Zhao, T.; Zhu, Y. Utilization of novel ester-containing quaternary ammonium surfactant as cationic collector for iron ore flotation, Sep. Purif. Technol. 2013, 103, 187–194. [Google Scholar] [CrossRef]
- Liu, W.; Wei, D.; Wang, B.; Ping, F.; Wang, X.; Cui, B. A new collector used for flotation of oxide minerals. T. Nonfer. Metal. Soc. 2009, 19, 1326–1330. [Google Scholar] [CrossRef]
- Sahoo, H.; Sinha, N.; Rath, S.S.; Das, B. Ionic liquids as novel quartz collectors: Insights from experiments and theory. Chem. Eng. J. 2015, 273, 46–54. [Google Scholar] [CrossRef]
- Tahani, A.; Karroua, M.; Van, H.; Damme, P.; Levitz, F. Adsorption of a cationic surfactant on Na–montmorillonite: inspection of adsorption layer by X-Ray and fluorescence spectroscopies. J. Colloid Interface Sci. 1999, 216, 242–249. [Google Scholar] [CrossRef] [PubMed]
- Sun, H.; Yin, W.; Yang, B.; Chen, K.; Sheng, Q. Efficiently separating magnesite from quartz using N-hexadecyltrimethylammonium chloride as a collector via reverse flotation. Miner. Eng. 2021, 166, 106899. [Google Scholar] [CrossRef]
- Sun, H.; Yin, W. Selective flotation separation of magnesite from quartz by palmitoyl trimethylammonium chloride. Sep. Purif. Technol. 2022, 295, 121201. [Google Scholar] [CrossRef]
- Wang, D.; Liu, Q. Influence of aggregation/dispersion state of hydrophilic particles on their entrainment in fine mineral particle flotation. Miner. Eng. 2021, 166, 106835. [Google Scholar] [CrossRef]
- Sheng, Q.; Yin, W.; Yang, B.; Chen, K.; Sun, H. Promotion of oxidation pretreatment on sulfidation of cuprite surface and its contribution to flotation. Miner. Eng. 2021, 174, 107256. [Google Scholar] [CrossRef]
- Yang, B.; Zhu, Z.; Yin, W.; Sun, Q.; Sun, H.; Han, H.; Sheng, Q.; Yao, J. Selective adsorption of an eco-friendly and efficient depressant PBTCA onto dolomite for effective flotation of fluorapatite from dolomite. Chem. Eng. J. 2020, 400, 125780. [Google Scholar] [CrossRef]
- Yang, Z.; Han, Y.; Teng, Q.; Zhang, G.; Liu, S. Aggregation process of fine hematite particles suspension using xanthan gum in the presence of Fe(III). Arab. J. Chem. 2023, 16, 104539. [Google Scholar] [CrossRef]
- Liu, W.; Peng, X.; Liu, W.; Tong, K.; Shen, Y.; Zhao, Q.; Zhao, S.; Sun, W. Novel polyhydroxy cationic collector N-(2,3-propanediol)-N-dodecylamine: Synthesis and flotation performance to hematite and quartz. Int. J. Min. Sci. Techno. 2023, 33, 115–122. [Google Scholar] [CrossRef]
- Neitzke, P.; Dantas, T.; Peres, M.; Neto, A. Depressants in nanoemulsion systems applied to quartz and hematite microflotation. J. Mater. Res. Technol. 2019, 8, 5529–5535. [Google Scholar] [CrossRef]
- Mičušík, M.; Šlouf, M.; Stepura, A.; Soyka, Y.; Ovodok, E.; Procházka, M.; Omastová, M. Aging of 2D MXene nanoparticles in air: An XPS and TEM study. Appl. Surf. Sci. 2023, 610, 155351. [Google Scholar] [CrossRef]
- Zhidkov, I.; Maksimov, R.; Kukharenko, A.; Finkelstein, L.; Cholakh, S.; Osipov, E. V. Effect of post-annealing in air on optical and XPS spectra of Y2O3 ceramics doped with CeO2. Mendeleev Commun. 2019, 29, 102–104. [Google Scholar] [CrossRef]
- Dobrovolsky, V.D.; Khyzhun, O.Y.; Sinelnichenko, A.K.; Ershova, O.G.; Solonin, Y.M. XPS study of influence of exposure to air on thermal stability and kinetics of hydrogen decomposition of MgH2 films obtained by direct hydrogenation from gaseous phase of metallic Mg. J. Electron Spectrosc. 2017, 215, 28–35. [Google Scholar] [CrossRef]
Figure 1.
X-ray powder diffraction patterns of (a) hematite and (b) quartz.
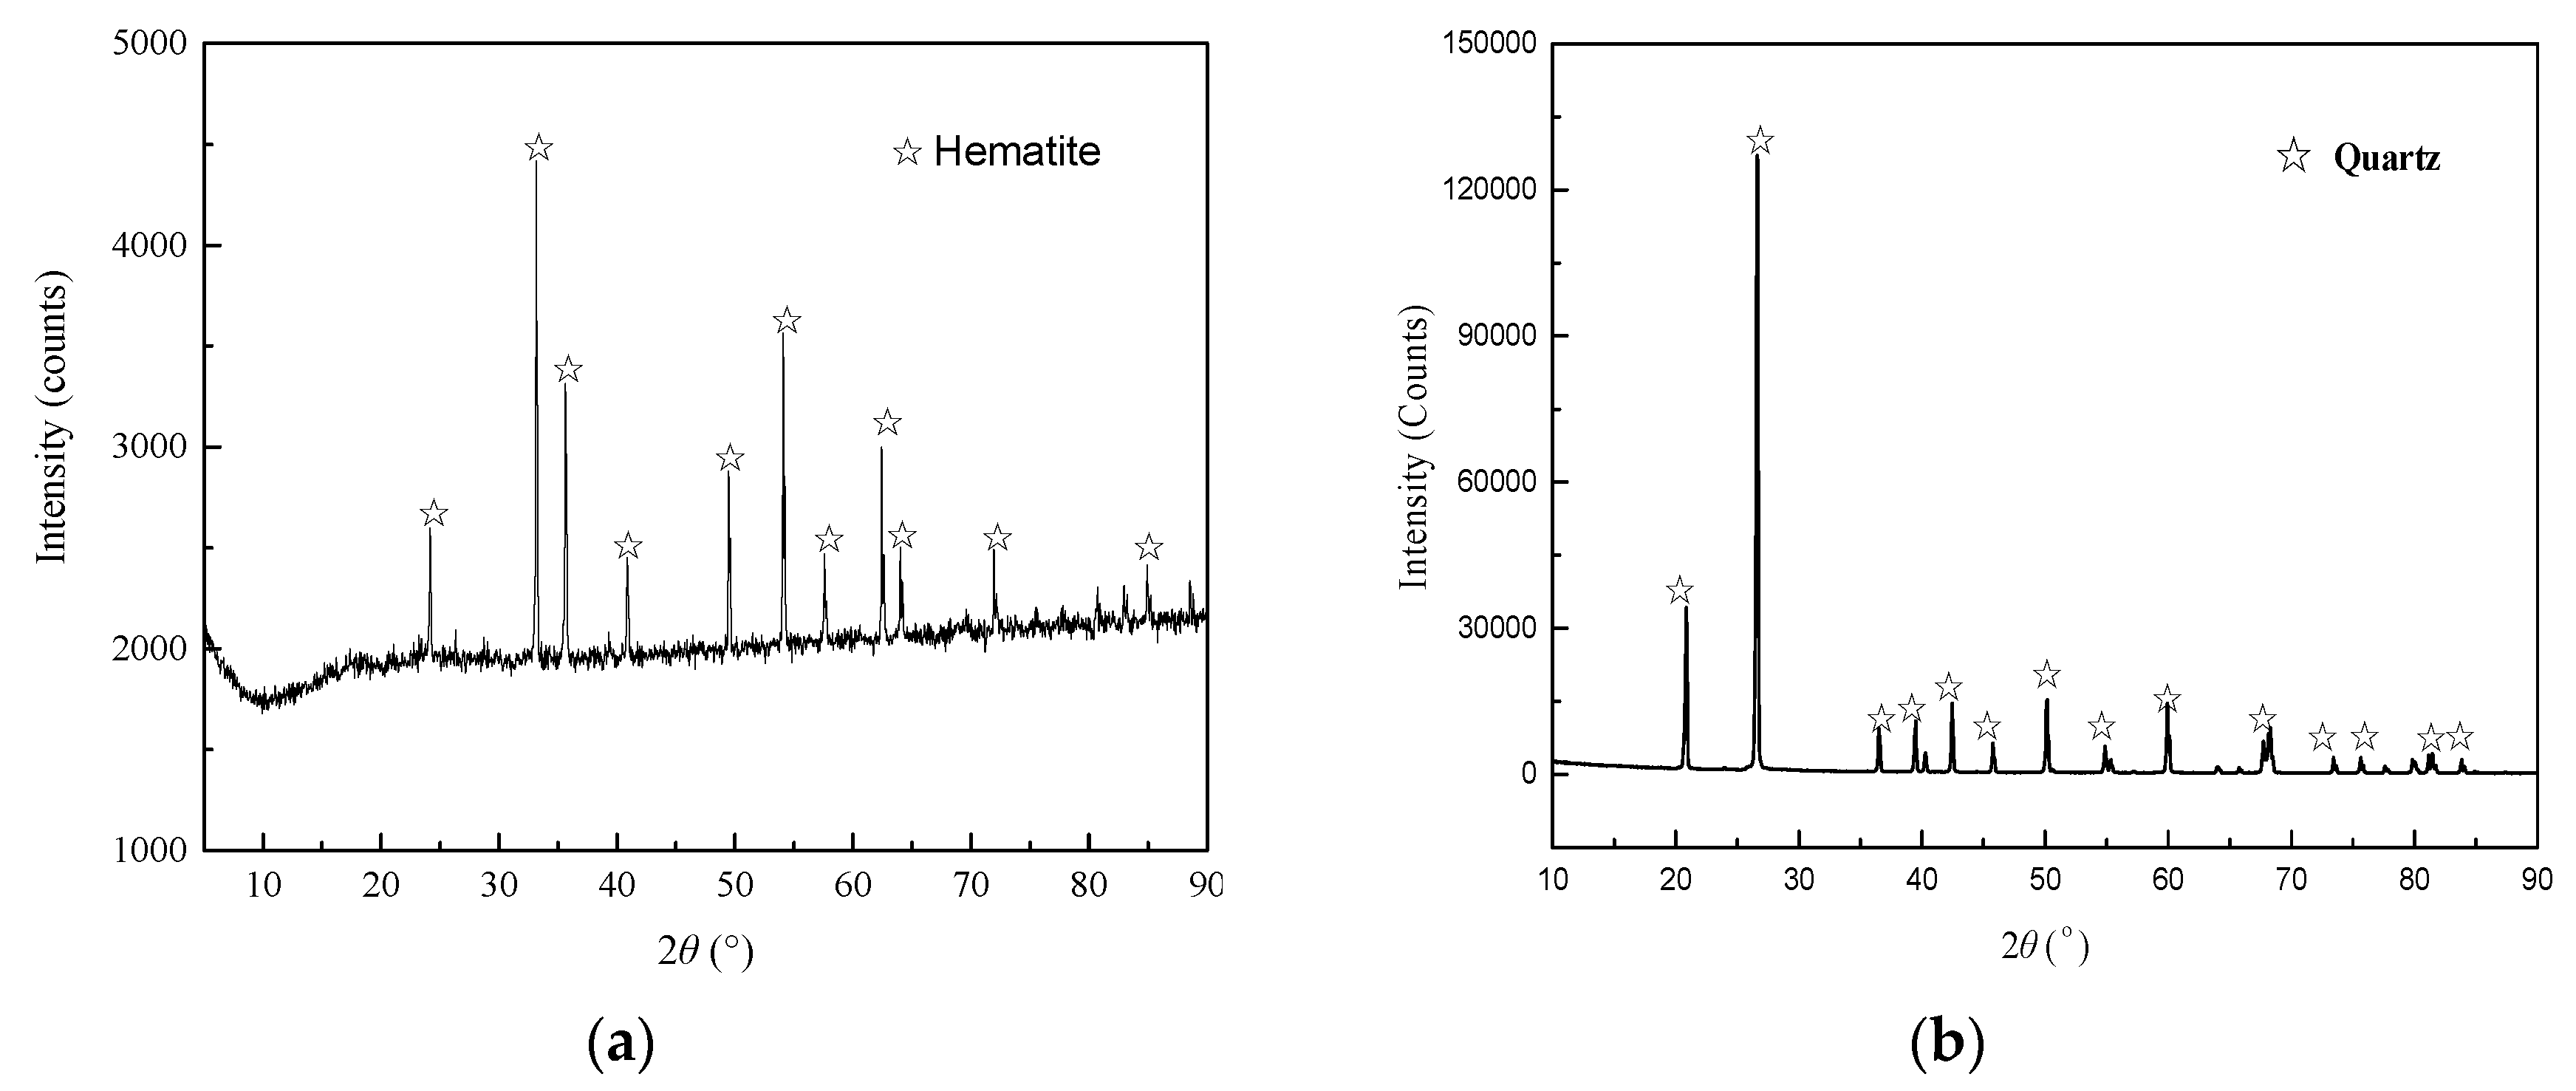
Figure 2.
Schematic illustration of the glass tube for micro-flotation test.
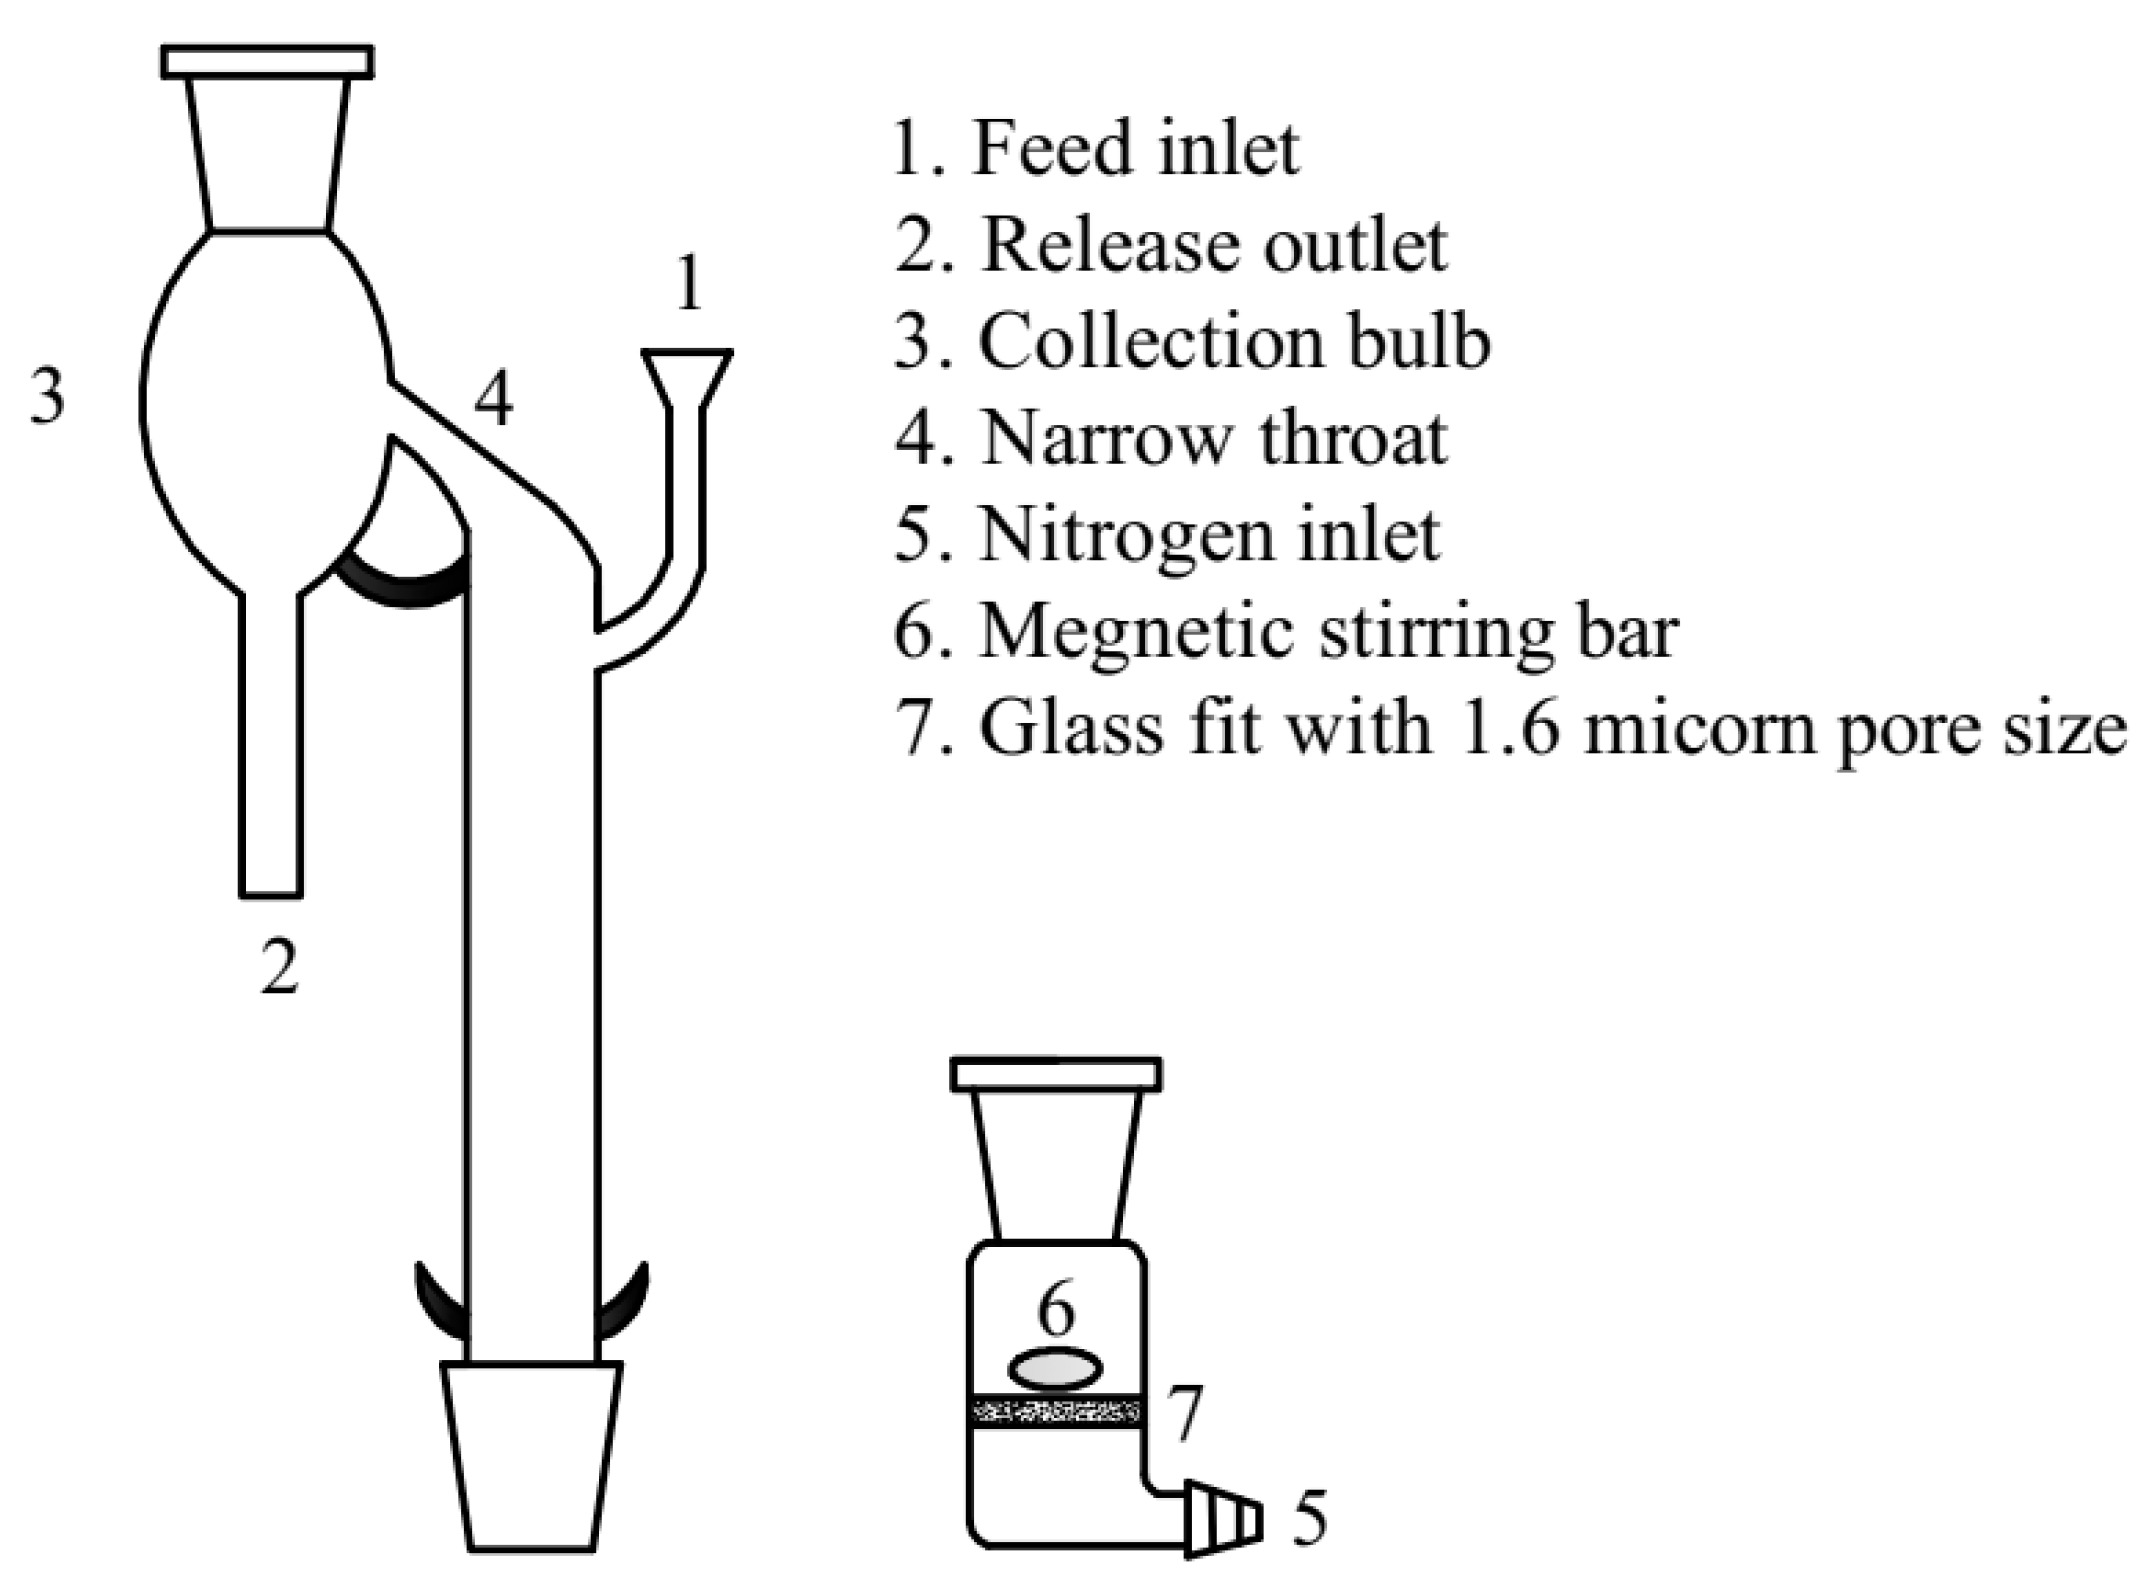
Figure 3.
Effect of CTAC concentration on mineral recovery.
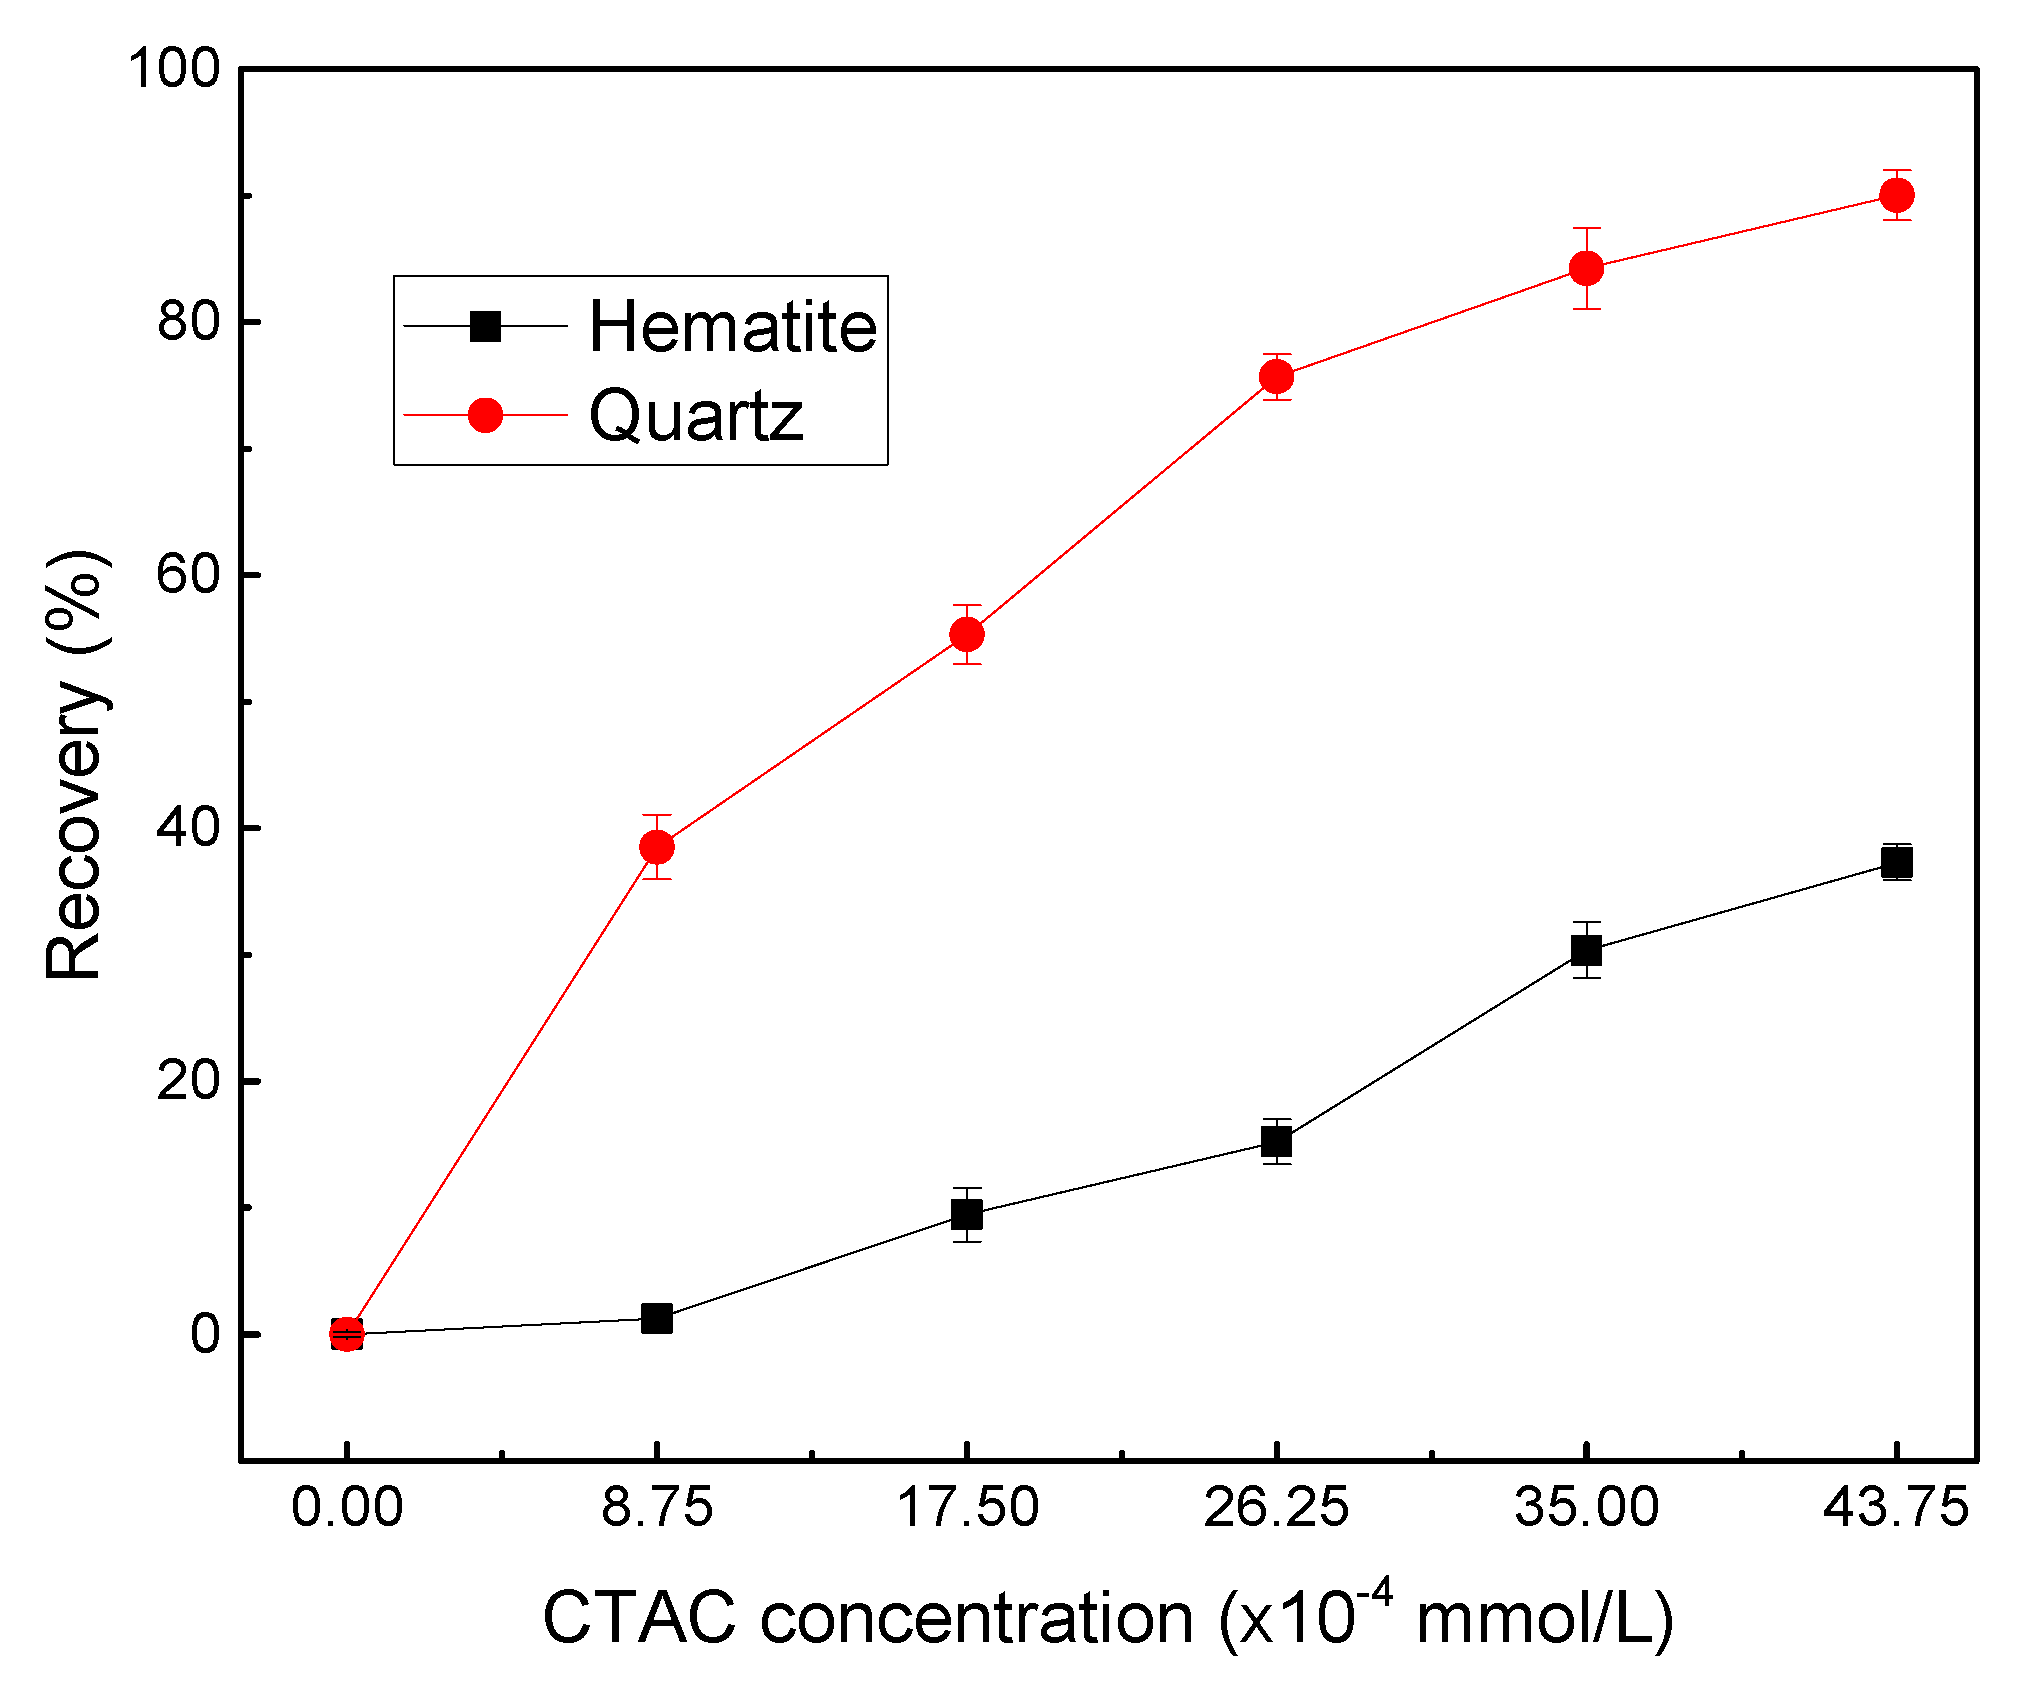
Figure 4.
Zeta potentials of hematite and quartz as functions of CTAC concentration.
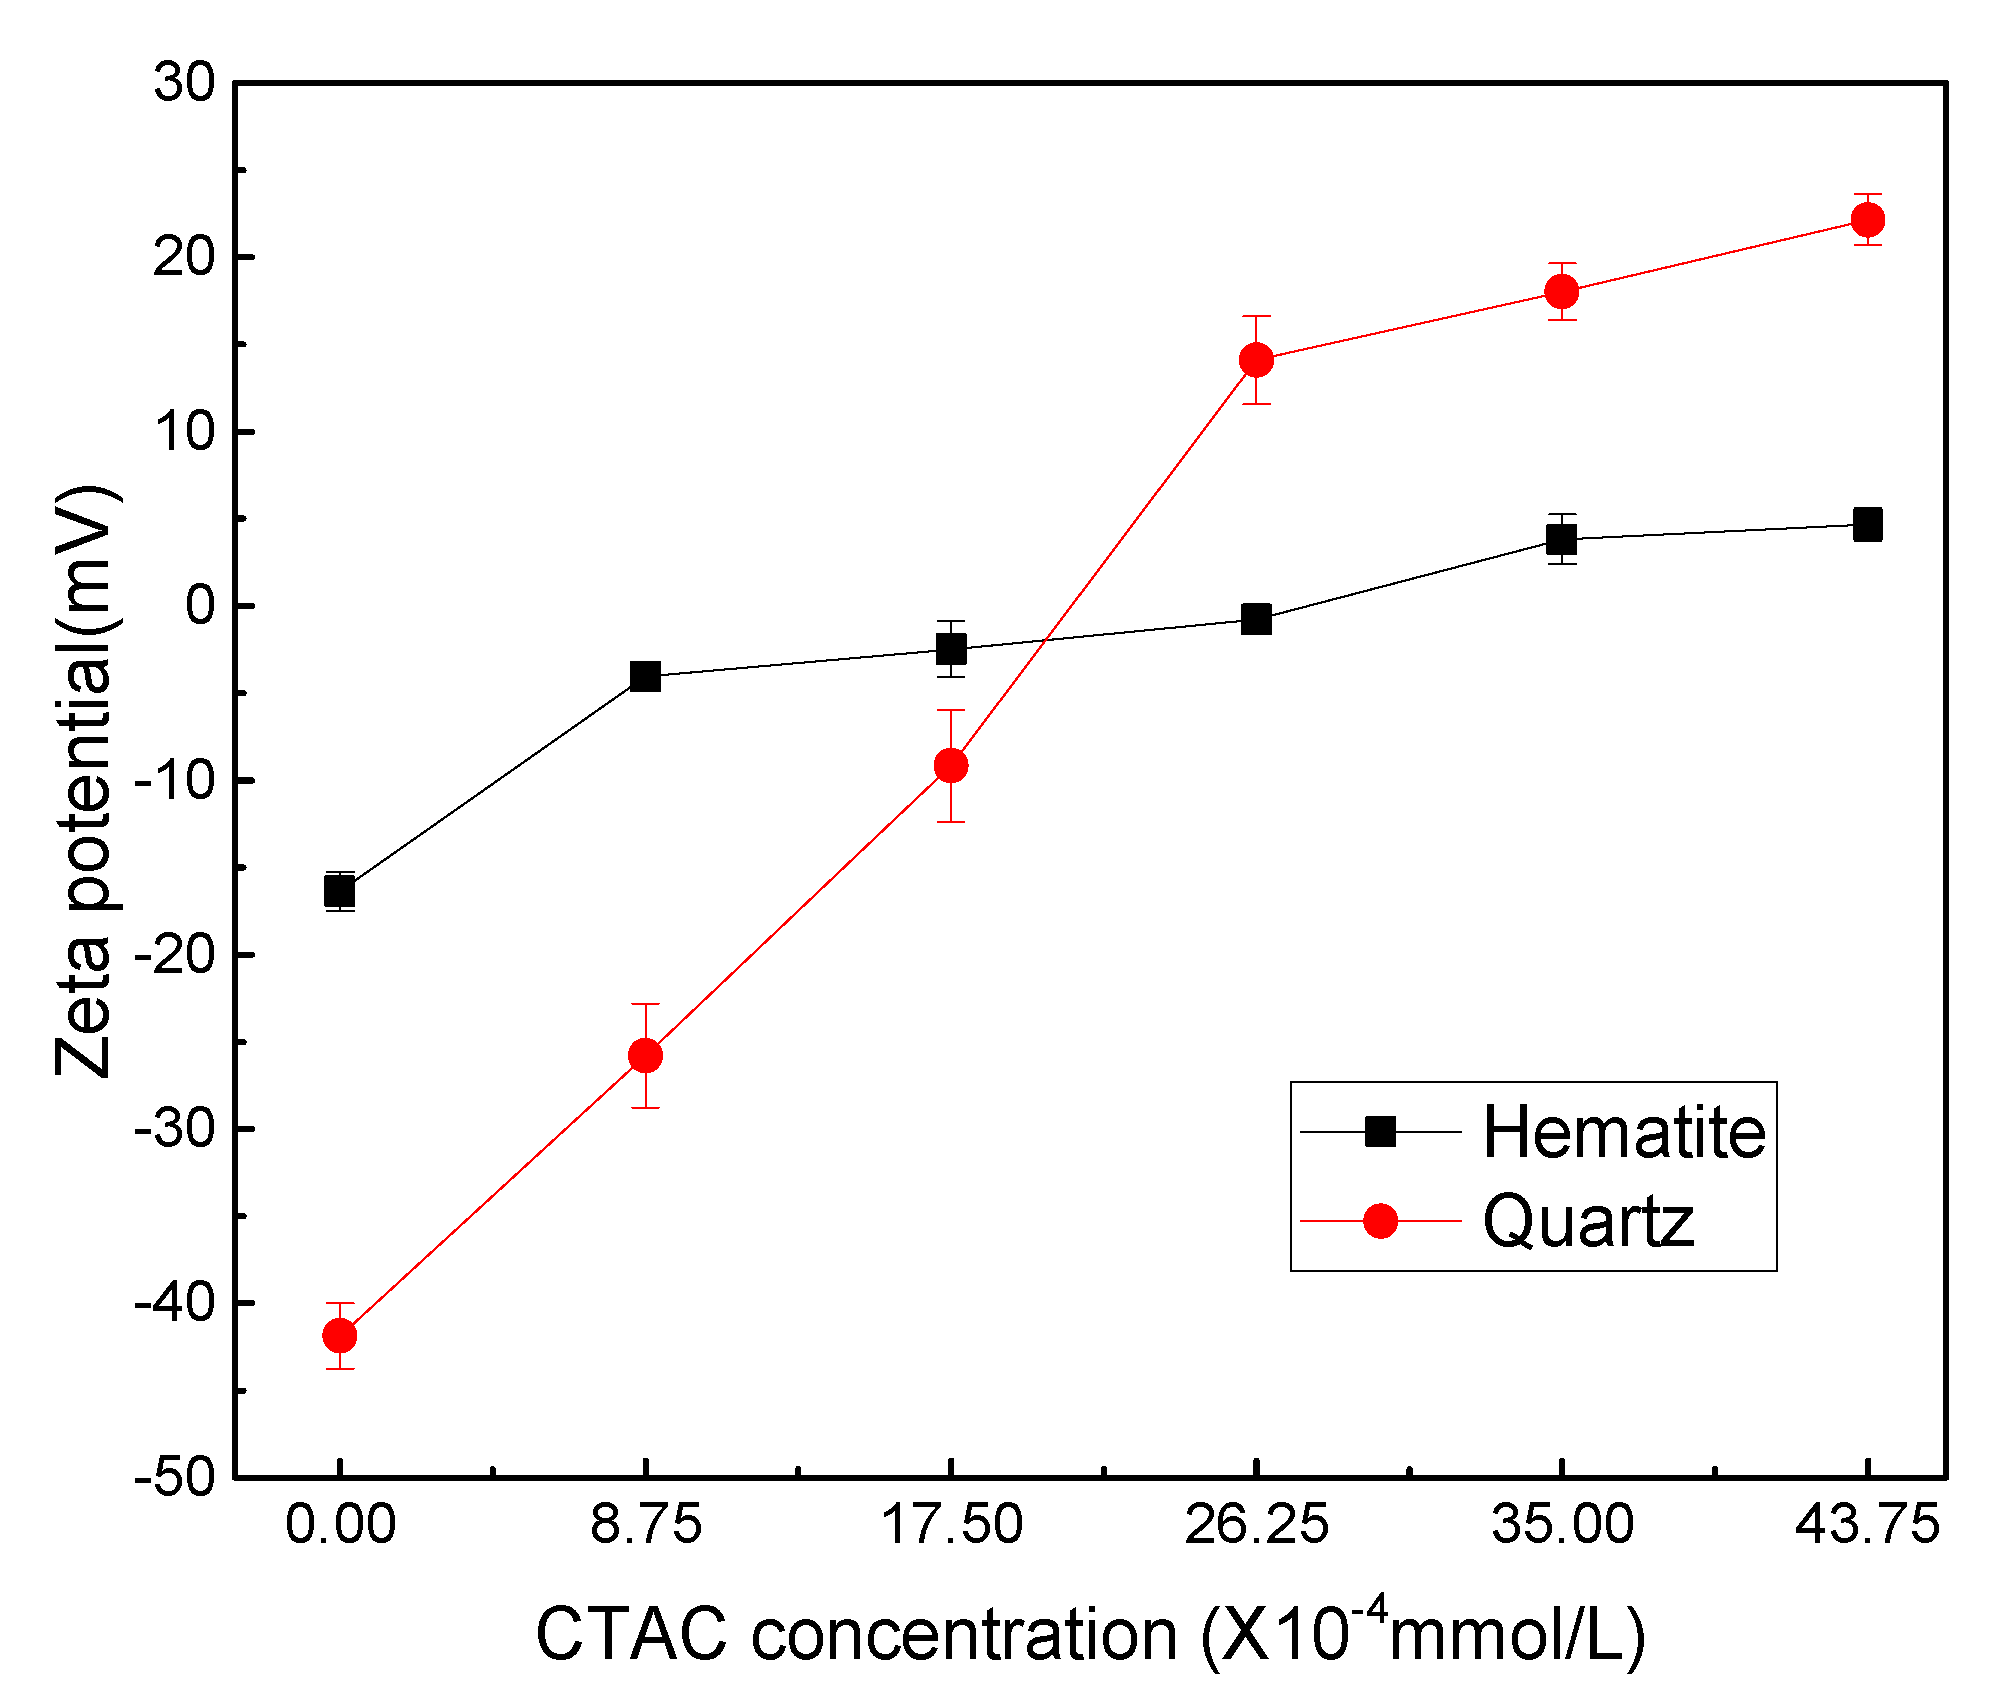
Figure 5.
XPS spectra of hematite (a) before and (b) after treatment with CTAC.
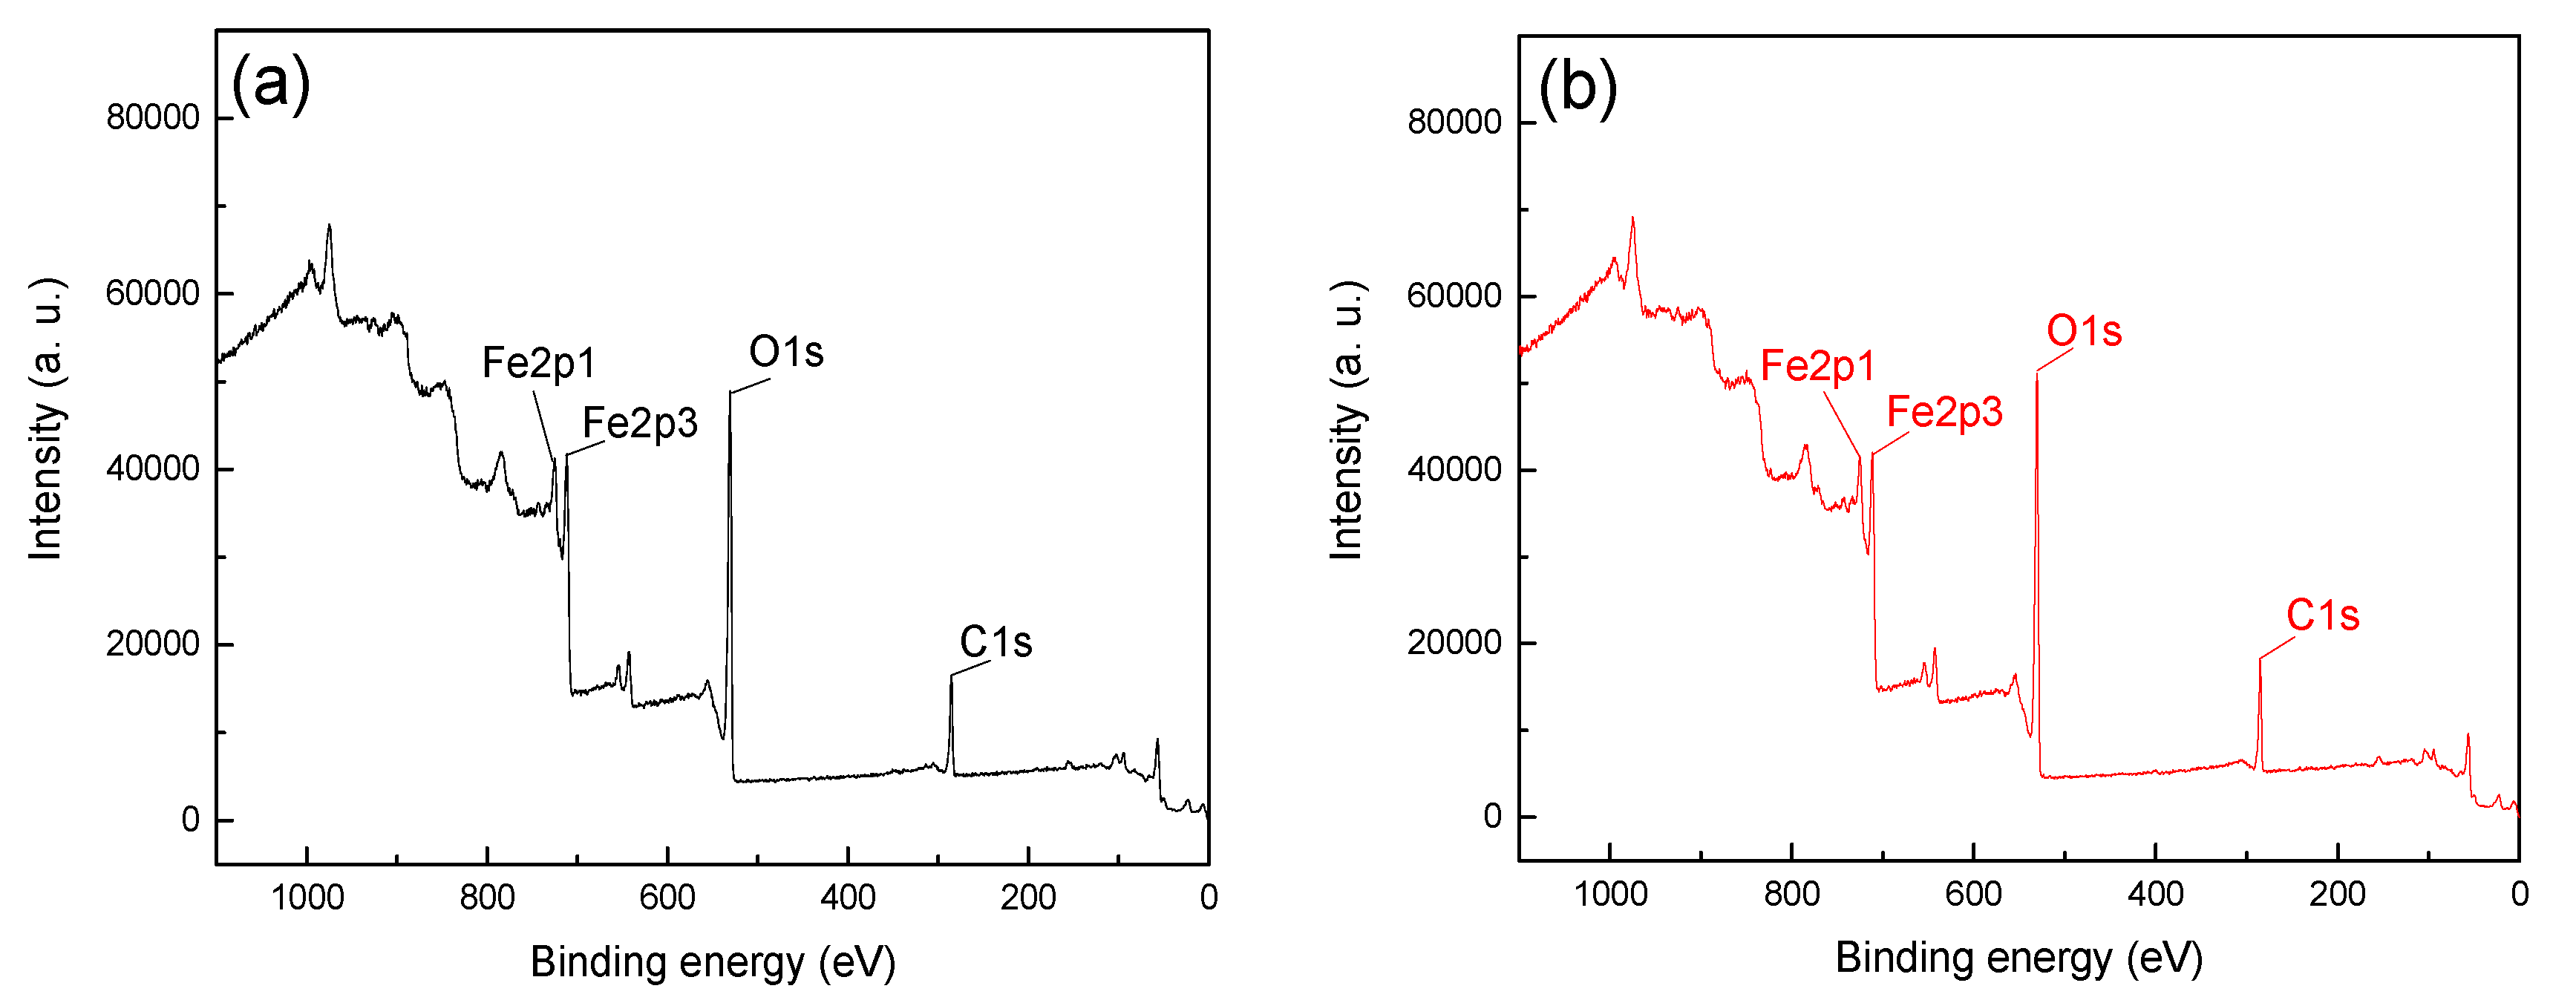
Figure 6.
XPS spectra of quartz (a) before and (b) after treatment with CTAC.
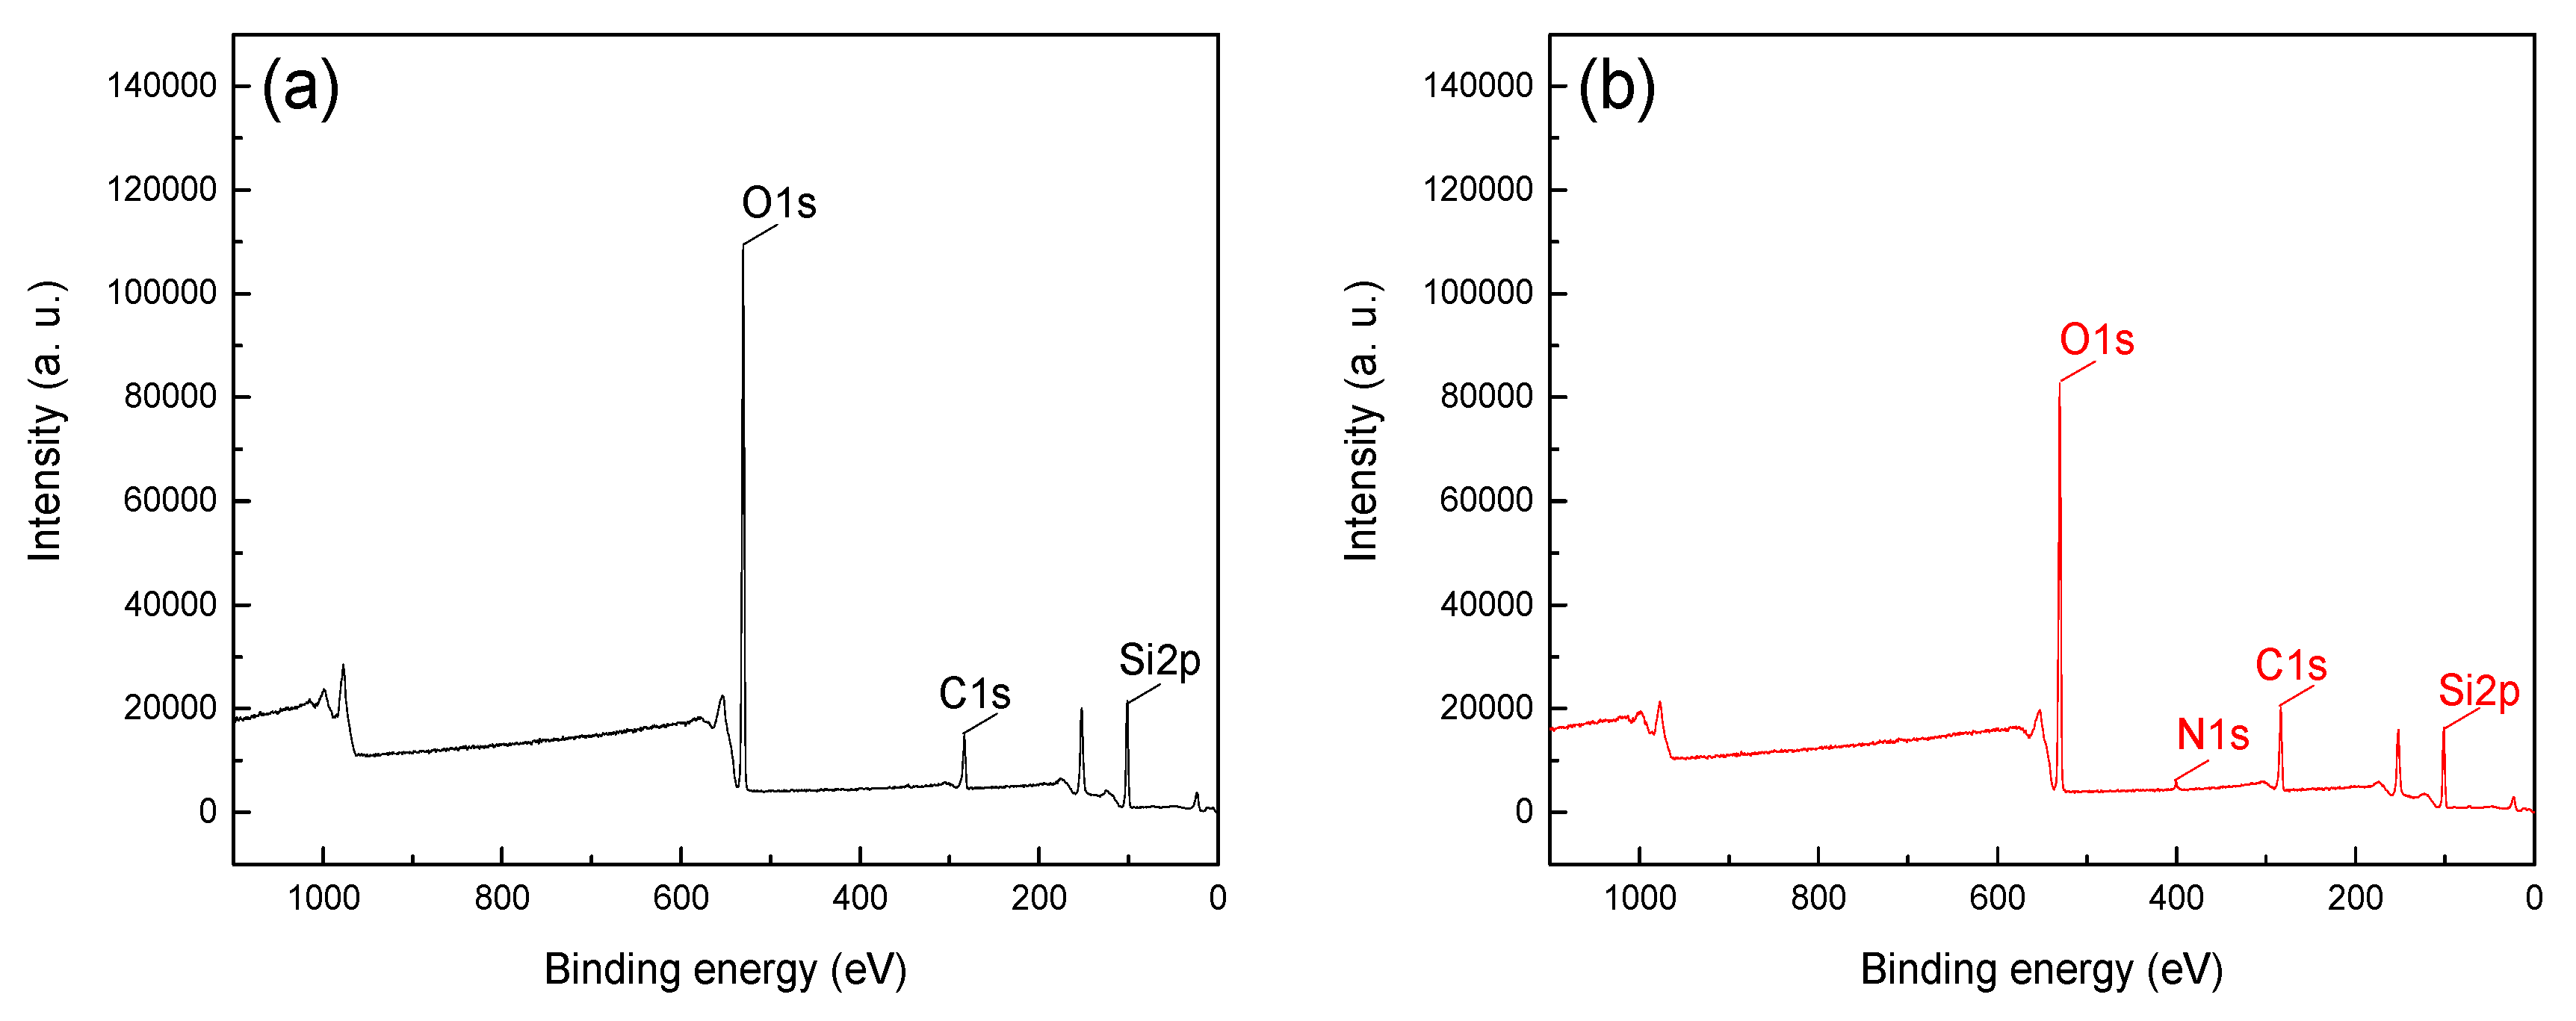
Figure 7.
The O1s XPS spectra of hematite (a) before and (b) after CTAC treatment.
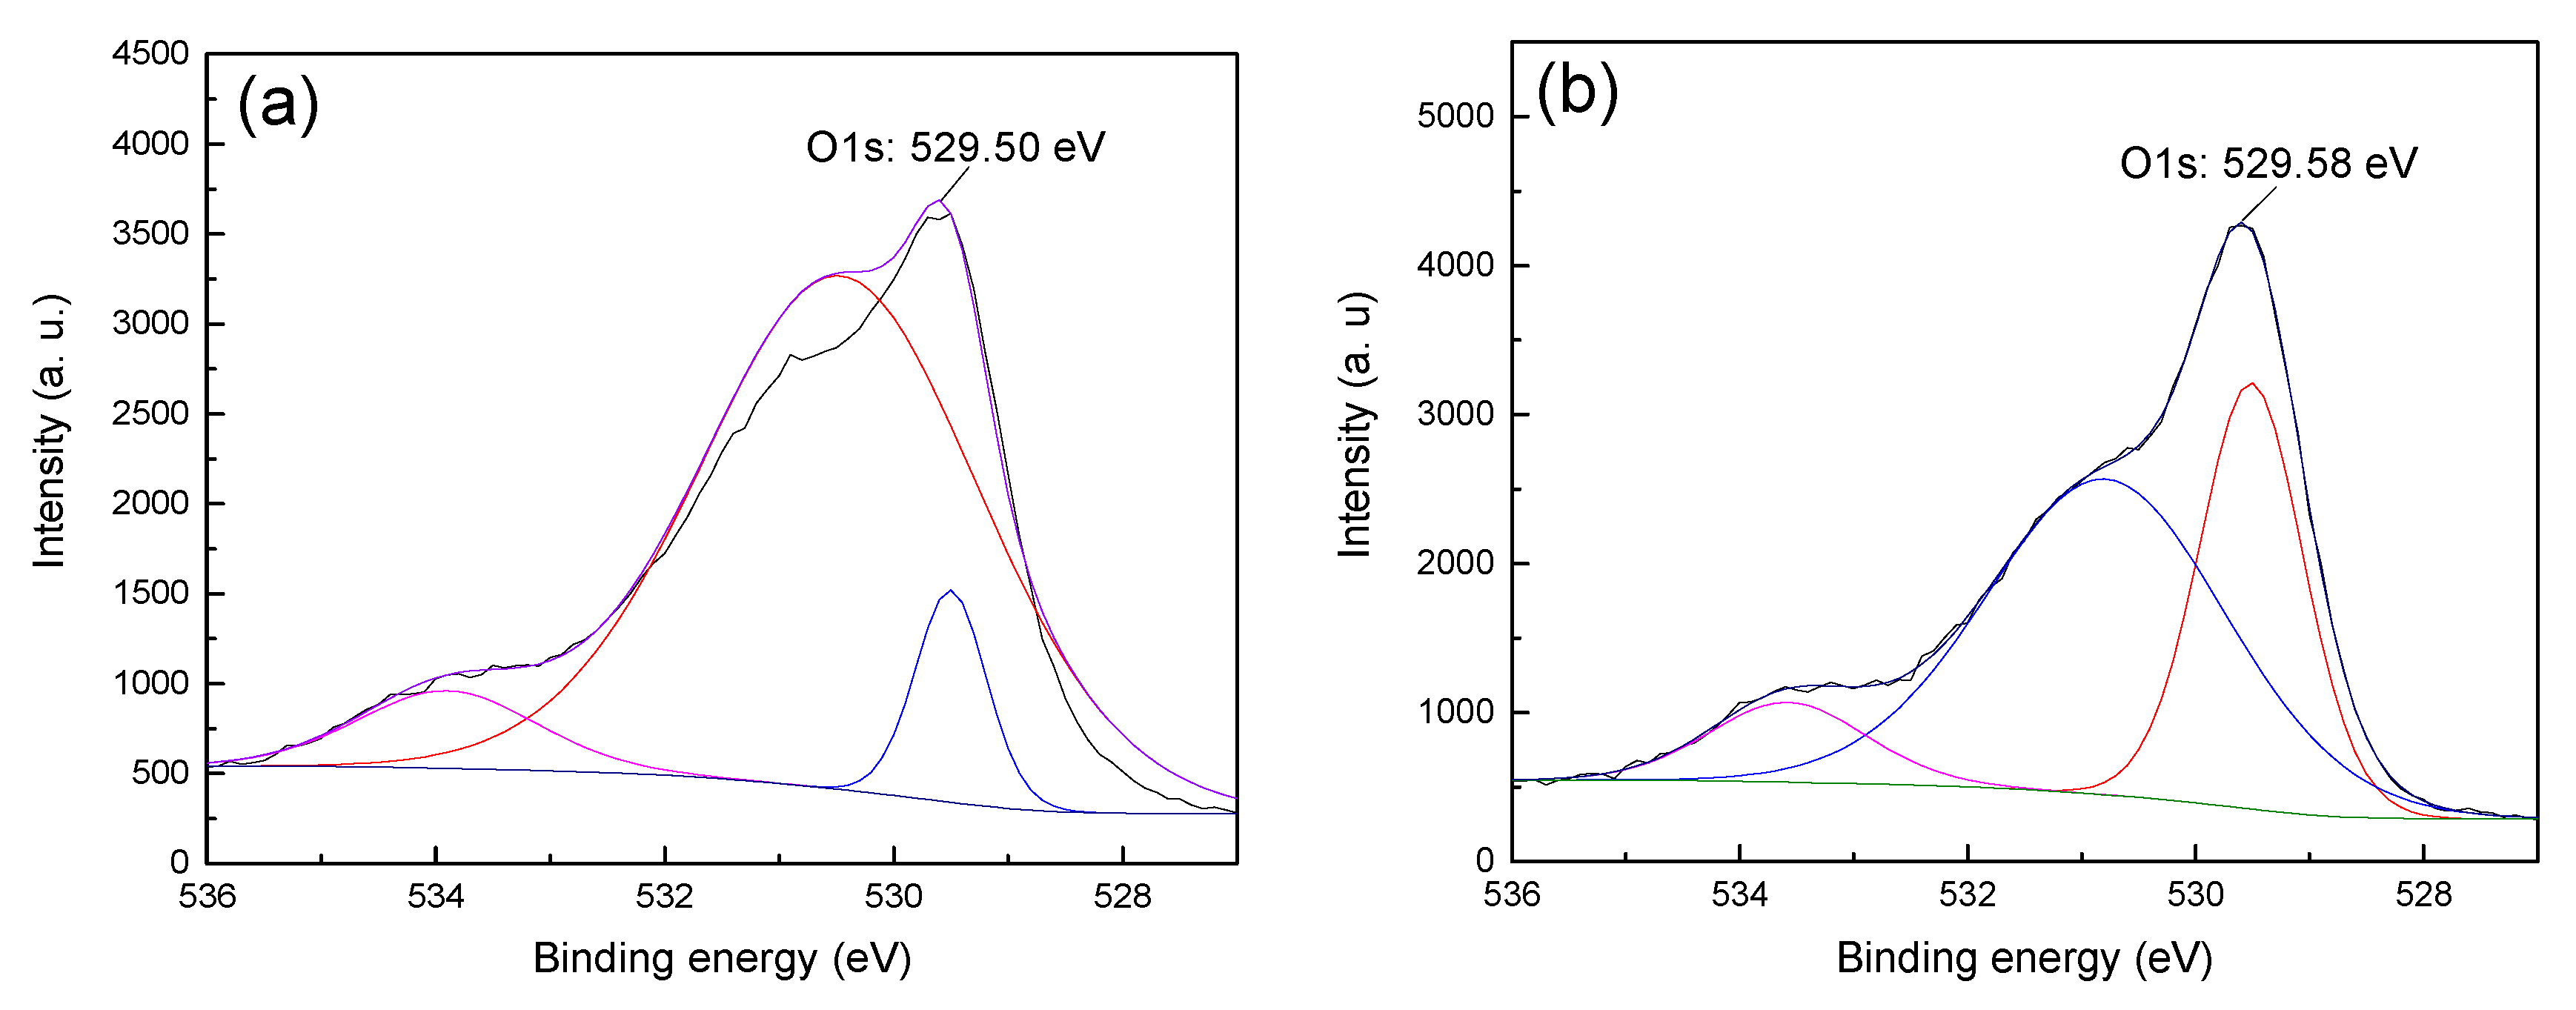
Figure 8.
The O1s XPS spectra of quartz (a) before and (b) after CTAC treatment.
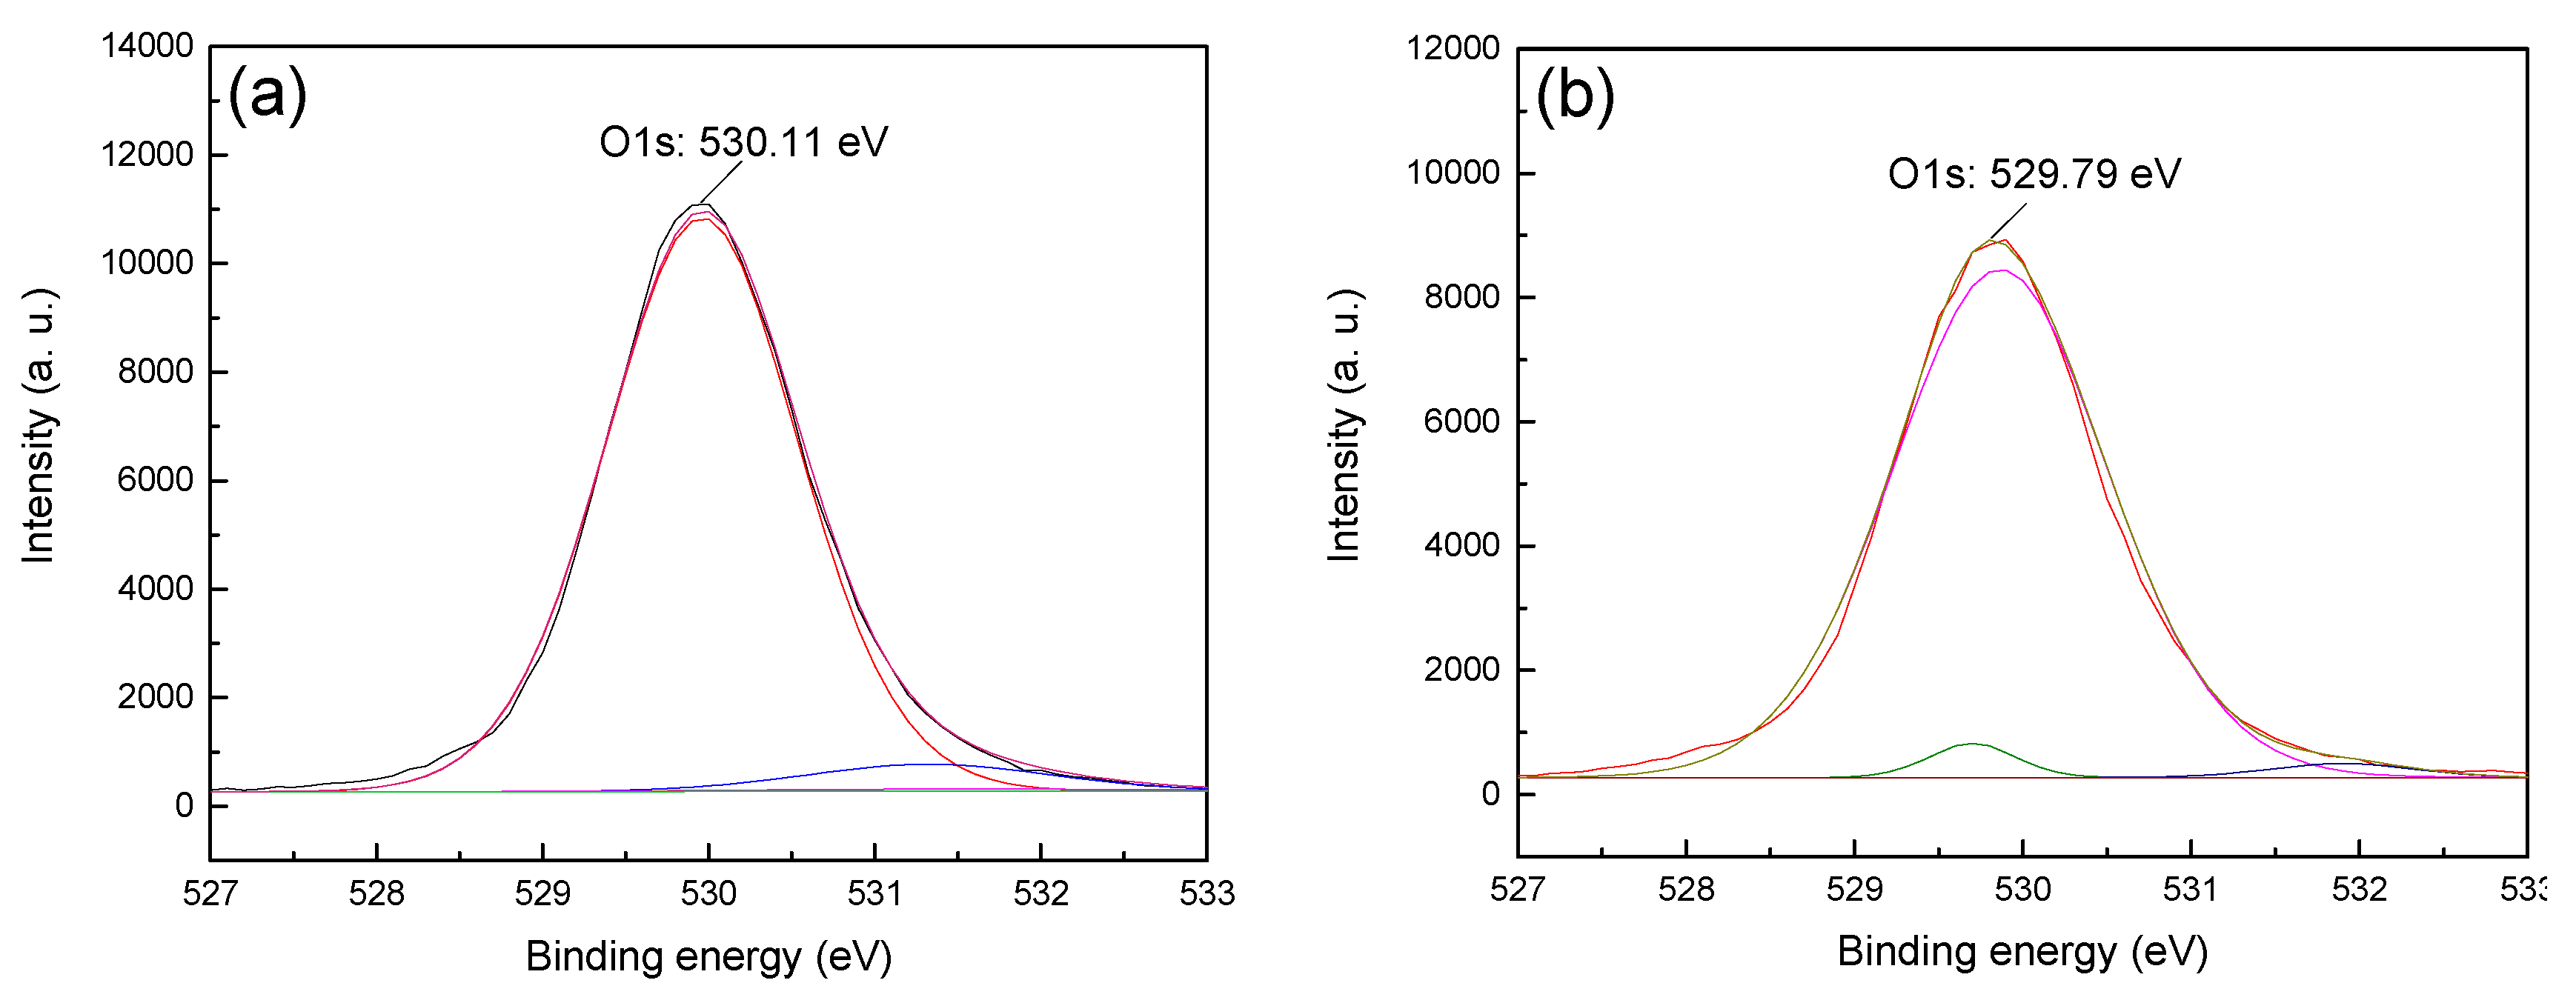

Table 1.
Chemical composition analysis of mineral samples (wt%).
| Sample | Fe2O3 | SiO2 | Al2O3 | MnO | MgO | CaO | P2O3 |
|---|---|---|---|---|---|---|---|
| Hematite | 97.12 | 0.84 | 0.11 | 1.65 | 0.01 | — | — |
| Quartz | 0.03 | 98.51 | 1.00 | — | 0.01 | 0.03 | — |
Table 2.
Mixed-mineral flotation test results.
| CTAC concentration (×10-4 mmol/L) |
Yield (%) | Grade (%) | Recovery (wt%) | ||
|---|---|---|---|---|---|
| Fe | SiO2 | Hematite | Quartz | ||
| 17.50 | 51.27 | 18.05 | 74.22 | 26.43 | 76.11 |
| 26.25 | 69.99 | 23.63 | 66.24 | 47.26 | 92.72 |
| 35.00 | 71.12 | 25.99 | 62.86 | 52.82 | 89.41 |
| Feed sample | 100.00 | 35.00 | 50.00 | 100.00 | 100.00 |
Table 3.
XPS characterization of samples with and without CTAC treatment.
| Sample | Element at% | ||||
|---|---|---|---|---|---|
| C1s | N1s | O1s | Si2p | Fe2p | |
| Hematite | 32.73 | — | 59.47 | — | 7.80 |
| Hematite + CTAC | 35.13 | 0.43 | 57.34 | — | 7.10 |
| offset | 2.40 | 0.43 | -2.13 | — | -0.70 |
| Quartz | 13.54 | — | 58.87 | 27.59 | — |
| Quartz + CTAC | 23.74 | 1.22 | 51.06 | 23.98 | — |
| offset | 10.20 | 1.22 | -7.81 | -3.61 | — |
Disclaimer/Publisher’s Note: The statements, opinions and data contained in all publications are solely those of the individual author(s) and contributor(s) and not of MDPI and/or the editor(s). MDPI and/or the editor(s) disclaim responsibility for any injury to people or property resulting from any ideas, methods, instructions or products referred to in the content. |
© 2023 by the authors. Licensee MDPI, Basel, Switzerland. This article is an open access article distributed under the terms and conditions of the Creative Commons Attribution (CC BY) license (http://creativecommons.org/licenses/by/4.0/).
Copyright: This open access article is published under a Creative Commons CC BY 4.0 license, which permit the free download, distribution, and reuse, provided that the author and preprint are cited in any reuse.


