1. Introduction
In the context of a plethora of studies on the association between physical environments and brain activity [
1,
2,
3,
4,
5,
6], we are compelled to answer the following questions: Even though brainwaves (which reflect the activity of the cranial nerves) on the scalp are effective in reflecting variations in physical environments, can they always do so accurately when our surroundings are filled with ever-changing information? Do current observation tools better or more precisely capture our psychological responses? Under Weber’s Threshold Law, which considers our psychological judgement and accounts for the most relevant characteristics of the decision-making-related neural activity as confirmed by Deco et al. [
7], will the brainwaves on the scalp reflect a fluctuation-driven auditory phenomena in a sound field? The objectives of this study are to examine these questions.
1.1. Brainwaves
In view of early studies on continuous brainwaves (CBW) [
8,
9], we shall begin our discussion from the fundamental concept of the initial time delay gap (ITDG) in a sound field, which is the time difference between the arrival of the first reflection and the direct sound [
6]. We regard ITDG as the most sensitive psychological factor for listening to music. In other words, when a faint reverberation is present in a sound field, the brain is able to distinguish whether a target of listening is interrupted by excessively delayed reflected energies. This creates a noticeable change in the CBW frequency within the interrupted and uninterrupted regions. We propose that this is entirely caused by changes in the firing frequency of signals transmitted between the relative neurons of the cranial nerves located in different regions of the cortex. For instance, Moriyama and Miyagaya [
10] categorized external stimuli as rational or sensible and used each type of stimuli to explore how the left and right hemispheres of the brain responded to a specific characteristic of sound. Soeta and Nakagawa [
11] found that the peak amplitude of N1 increases alongside pitch strength. When we investigated through CWB recordings how the ITDG in a sound field affects the vestibulocochlear nerve and then compared the differences, we suggested that this is a result of psychological reactions manifested in our preference for or dislike of something [
12]. This study investigated the threshold effect of psychological judgment, and therefore the most obvious responses to ITDG on the cerebral cortex should be classified as a CBW and an auditory-evoked potential (AEP), which is a response that occurs within 500 ms after the arrival of an auditory stimulus [
8,
9]. Most of these responses are manifested in the transmission potential responses of nerves along the auditory pathway, that is, a sound enters from the ear canal, passes through the eardrum and ossicles, and is then converted into electronic signals (nerve impulses) at the cochlea and transmitted to the two cerebral hemispheres where a response occurs. Ando, Kang, and Nagamatsu [
13] studied the AEP in terms of the slow vertex response (SVR) and revealed that the latency of the N2 peak of a SVR increases in response to changes in the magnitude of the interaural cross-correlation (IACC); they deduced that changes to the IACC caused by auditory nerve signals through the lateral lemniscus on the auditory pathway will produce a latency in the N2 peak. The N2 peak is the most distinguishable peak produced around 200 ms after a signal enters the ear canal. In addition, Ando, Kang, and Morita [
14] also found that within an ideal first reflection of a sound in a sound field, the N2-latencies of SVR are prolonged in both hemispheres, while the P1-N1 amplitude in the left hemisphere is also increased. However, in this study, the continuous cueing method is used for auditory stimuli, and hence we believe that by using the reflected energy and reflection time difference, “reaction” and “non-reaction” threshold responses can be observed for exceeding 500 ms after a stimulus through CBW recordings.
1.2. The just noticeable difference (JND) of the ITDG of a sound field
Weber’s Law is regarded as an exemplar in research pertaining to physical environments and psychological responses [
15]. Laming [
16] regarded it as the most fundamental brain activity examination tool for studying the association between physical stimuli and perceptions. In his discourse on the association between music hall designs and the auditory pathway of the vestibulocochlear nerve, Ando [
17] stated that ITDG is the most fundamental physical component in a sound field. Indeed, it is closely associated with the clarity in a sound field. The effective delay time (τe) of the autocorrelation function (ACF) of CBW, a parameter that represents the association between the responses before and after the arrival of a signal, is found to be highly correlated with ITDG [
6]. However, subsequent studies did not expound the linear relationship of CBW responses, which explains the lack of a square law-based correlation formula between physical components. To explore this correlation, this study employed ITDG as a preliminary exploratory medium for exploring this uncharted territory. Romo et al. [
18] showed that the activity of neurons in the ventral premotor cortex covaries with a monkeys’ decisions in a perceptual comparison task regarding the frequency of vibrotactile events. The sign of that difference was the determinant of a correct task performance. Deco et al. [
7] confirmed this prediction in behavioural tests of vibrotactile discrimination in humans and proposed a computational explanation of perceptual discrimination that naturally accounts for the emergence of Weber’s law. These results support our experiences of the judgements of word intelligibility by changing the ITDG between the direct and the first reflection in a room. In a previous study, the features of the reactions on the ACF of cortical continuous brainwaves were analyzed [
2]. The results revealed that the neurodynamical mechanisms and computational principles responded well with the decision-making process in such a perceptual discrimination task in the brain’s metastability.
JND values are available for most acoustical parameters currently used in practice [
19]. However, they were determined by referring to conditions that are typically encountered in concert halls and in rooms for speech, covering a reverberation time (T60) range spanning from 0.5 s - 2 s. Martellotta [
20] proved that JND values are independent of music motifs and showed that the JND in the clarity index is almost independent of T60 varying from 2 s - 6 s. Ando [
17] also reported that the ITDG is an orthogonal factor with T60, in which is subjective preference for sound field measures. The proposed research investigates the relationship between the JND of ITDG and the ACF of CBW on the scalp when the subjects are paying attention to two music instruments with ITDG values varying from 22 ms - 220 ms in a constantly low reverberant room, in which the JND values will acts under the sound clarity sensation owing to the ITDG effects and the timbre of stimuli sources.
2. Materials and Methods
Based on the information above, this study was implemented in two stages. According to Weber’s Threshold Law, we continuously increased the spatial ITDG (the time difference between the arrival of the initial reflection and the direct sound) of two different instrumental solos. Next, we measured the continuous just-noticeable difference (JND) perceived by the subjects, so as to compute the threshold of the human ear in relation to continuous changes cause by ITDG. In other words, we measured the point at which a stimulus change can be perceived at the time of detection under different ITDG perceptions. The next stage involved the same instrumental solos, as well as the same cueing method used in the first stage. The subjects had to listen attentively to the performances while having their CBWs recorded. We analyzed the alpha-wave range (8 – 13 Hz) of brainwaves as well as ACF to investigate brainwave changes that occur in response to changes in the ITDG when the human ear is listening to a piece of music. In past studies regarding the statistical attributes of time-varying traffic noise, potential eigenvalues of temporal variations resulting from such factors as earthquake waves were frequently determined using correlation models [
21,
22,
23]. To evaluate the disturbances caused by the various environmental noises using the normalized ACF (NACF) analysis was applied by Chen [
24], too. Lastly, comparative analyses were performed.
2.1. Continuous JND experiments
2.1.1. Settings of ITDG
The test system used was an artificial simulation of a sound field created within an anechoic chamber. Two anechoic music sources were fed to a digital audio editing software (Nuendo V10) to split the dry source of two instrumental solos into two audio tracks. These were fed through various delay units, reverberation units, mixers and attenuators before being reproduced by a loudspeaker located in front of subjects inside an anechoic chamber. Afterwards, both tracks were synthesized into a single track at an ITDG interval of 22 ms – 220 ms. Altogether this arrangement generated the following: a direct sound, an early reflection whose level were set to 0 dB (referred as the direct sound with the energy coming from the lateral direction), and an additional short burst with a constant 16 ms lag to the early reflection from an effects unit that smoothens the transition from the early reflection to the reverberation with a decay time set at 0.5s and level of -3 dB referred to the direct sound (
Figure 1). The subjects were placed in the front of a loudspeaker at a 1.5 m distance and the listening sound pressure level was 78 dB all over the stimuli. This method has been used before and is well established [
25,
26,
27,
28,
29]. It allows complete control over the sound field, and the user is able to directly compare different impulse responses.
Continuous cueing of ITDG variation was achieved through a single loudspeaker, and preliminary experiments were conducted before investigating the changes to the ITDG, so as to understand the JND of the human ear in such stage. This was followed by the production of the final audio cues. According to the preliminary experiments, the dry source of an instrumental solo is not sensitive to changes after being separated into two audio track times. Therefore, the baseline delay time was multiplied by 0.5 increments, that is, 1.25 times (from 22 ms to 27.5 ms), followed by 1.50 times (33 ms), and so on, until an ITDG of 220 ms was achieved. Each gap had to be smaller than the normal JND perceived by the human ear. In total, 91 audio signals were used to bring about the continuous changes as each sample has a length of 3 s duration, with a 1 s interval between each gap sample. Consequently, one subject had to keep attention to the sound field with around 365 s and response their continuous JND cues by touching a key on the chair with an outside lamp, simultaneously.
2.1.2. Simulation and Material
Based on the information from other studies [
30,
31], the JND may depend on the characteristics of the motif used to present different sound fields. In addition, Okano [
31] reported that the apparent source width (ASW) and loudness in a room are more sensitive to changes in the levels of early reflections among four subjective parameters since the variation in the physical parameter [1—IACC
E3] and G values was 7 motifs, respectively. In this study, there were two dry sources which simulated an instrumental solo—a trumpet piece (Prince of Denmark’s March, by Frank Fezishin) and a cello piece (Girolamo Frescobaldi, Toccata, by Arr. Gaspar Cassadó), whereas motifs were set at equal [1—IACC
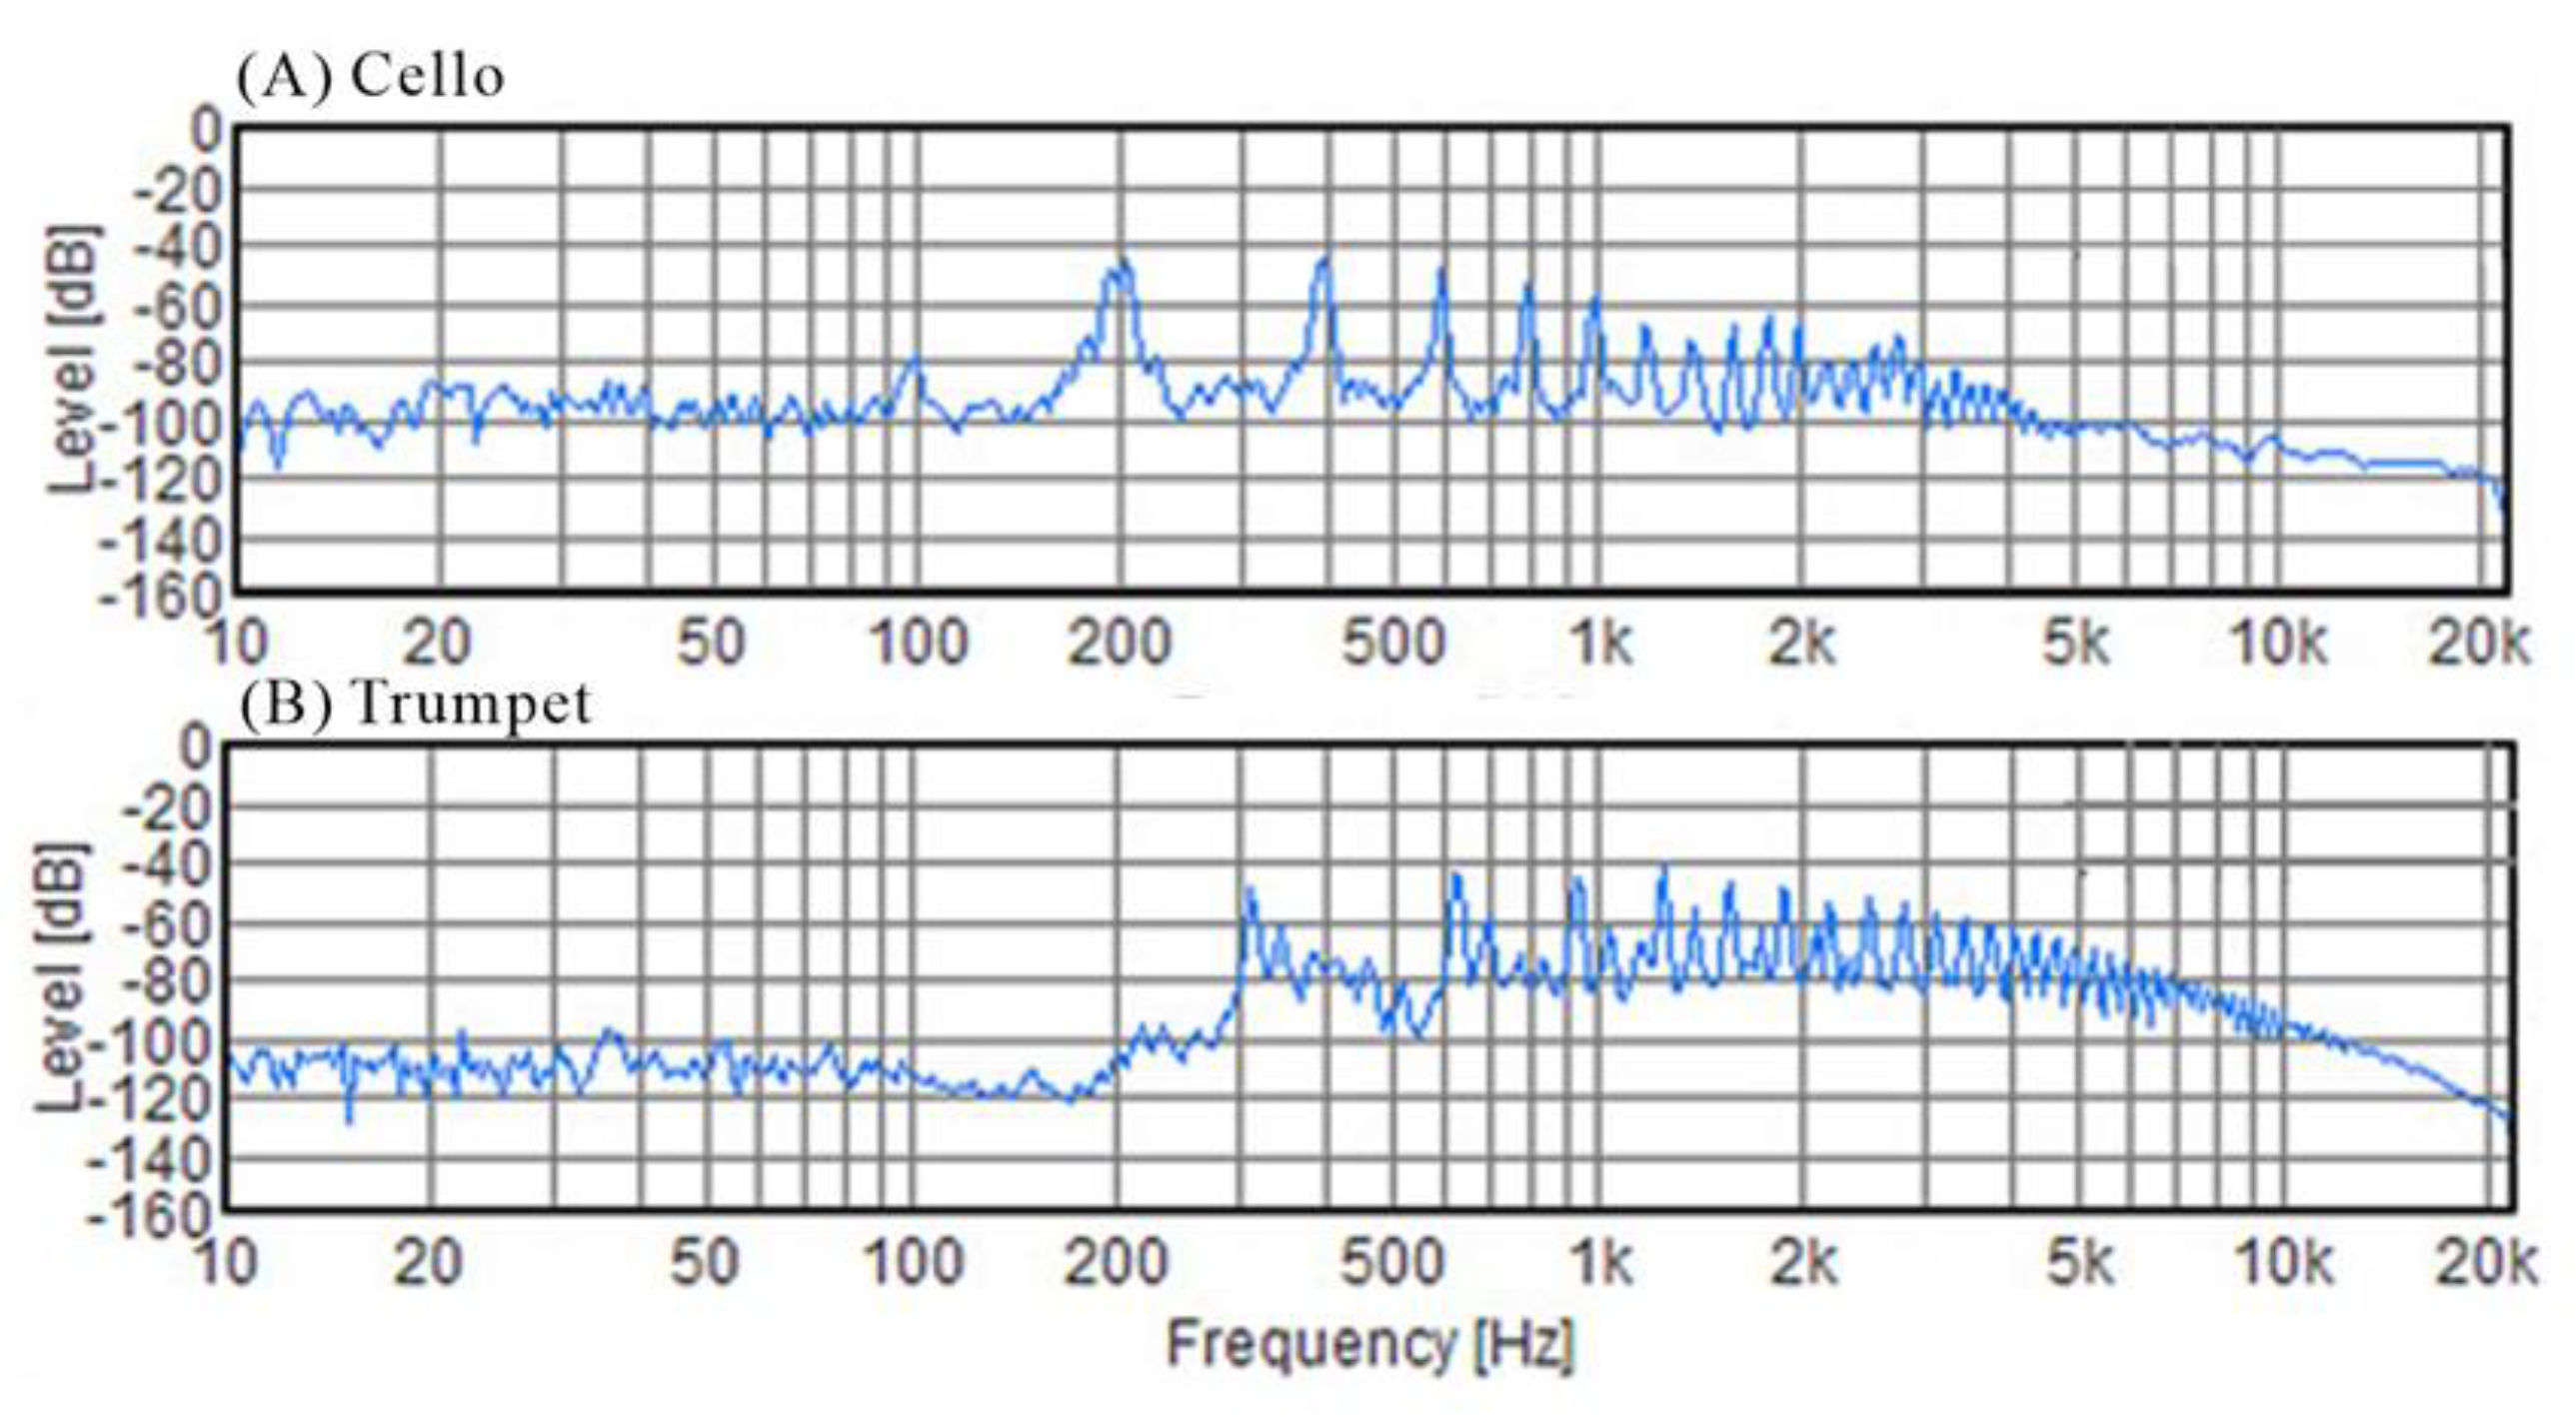
E3] and G values along the way. However, the frequency responses were higher above 300 Hz for the trumpet piece, and fluttered at 200 Hz, 400 Hz, …, and so on for the cello piece (
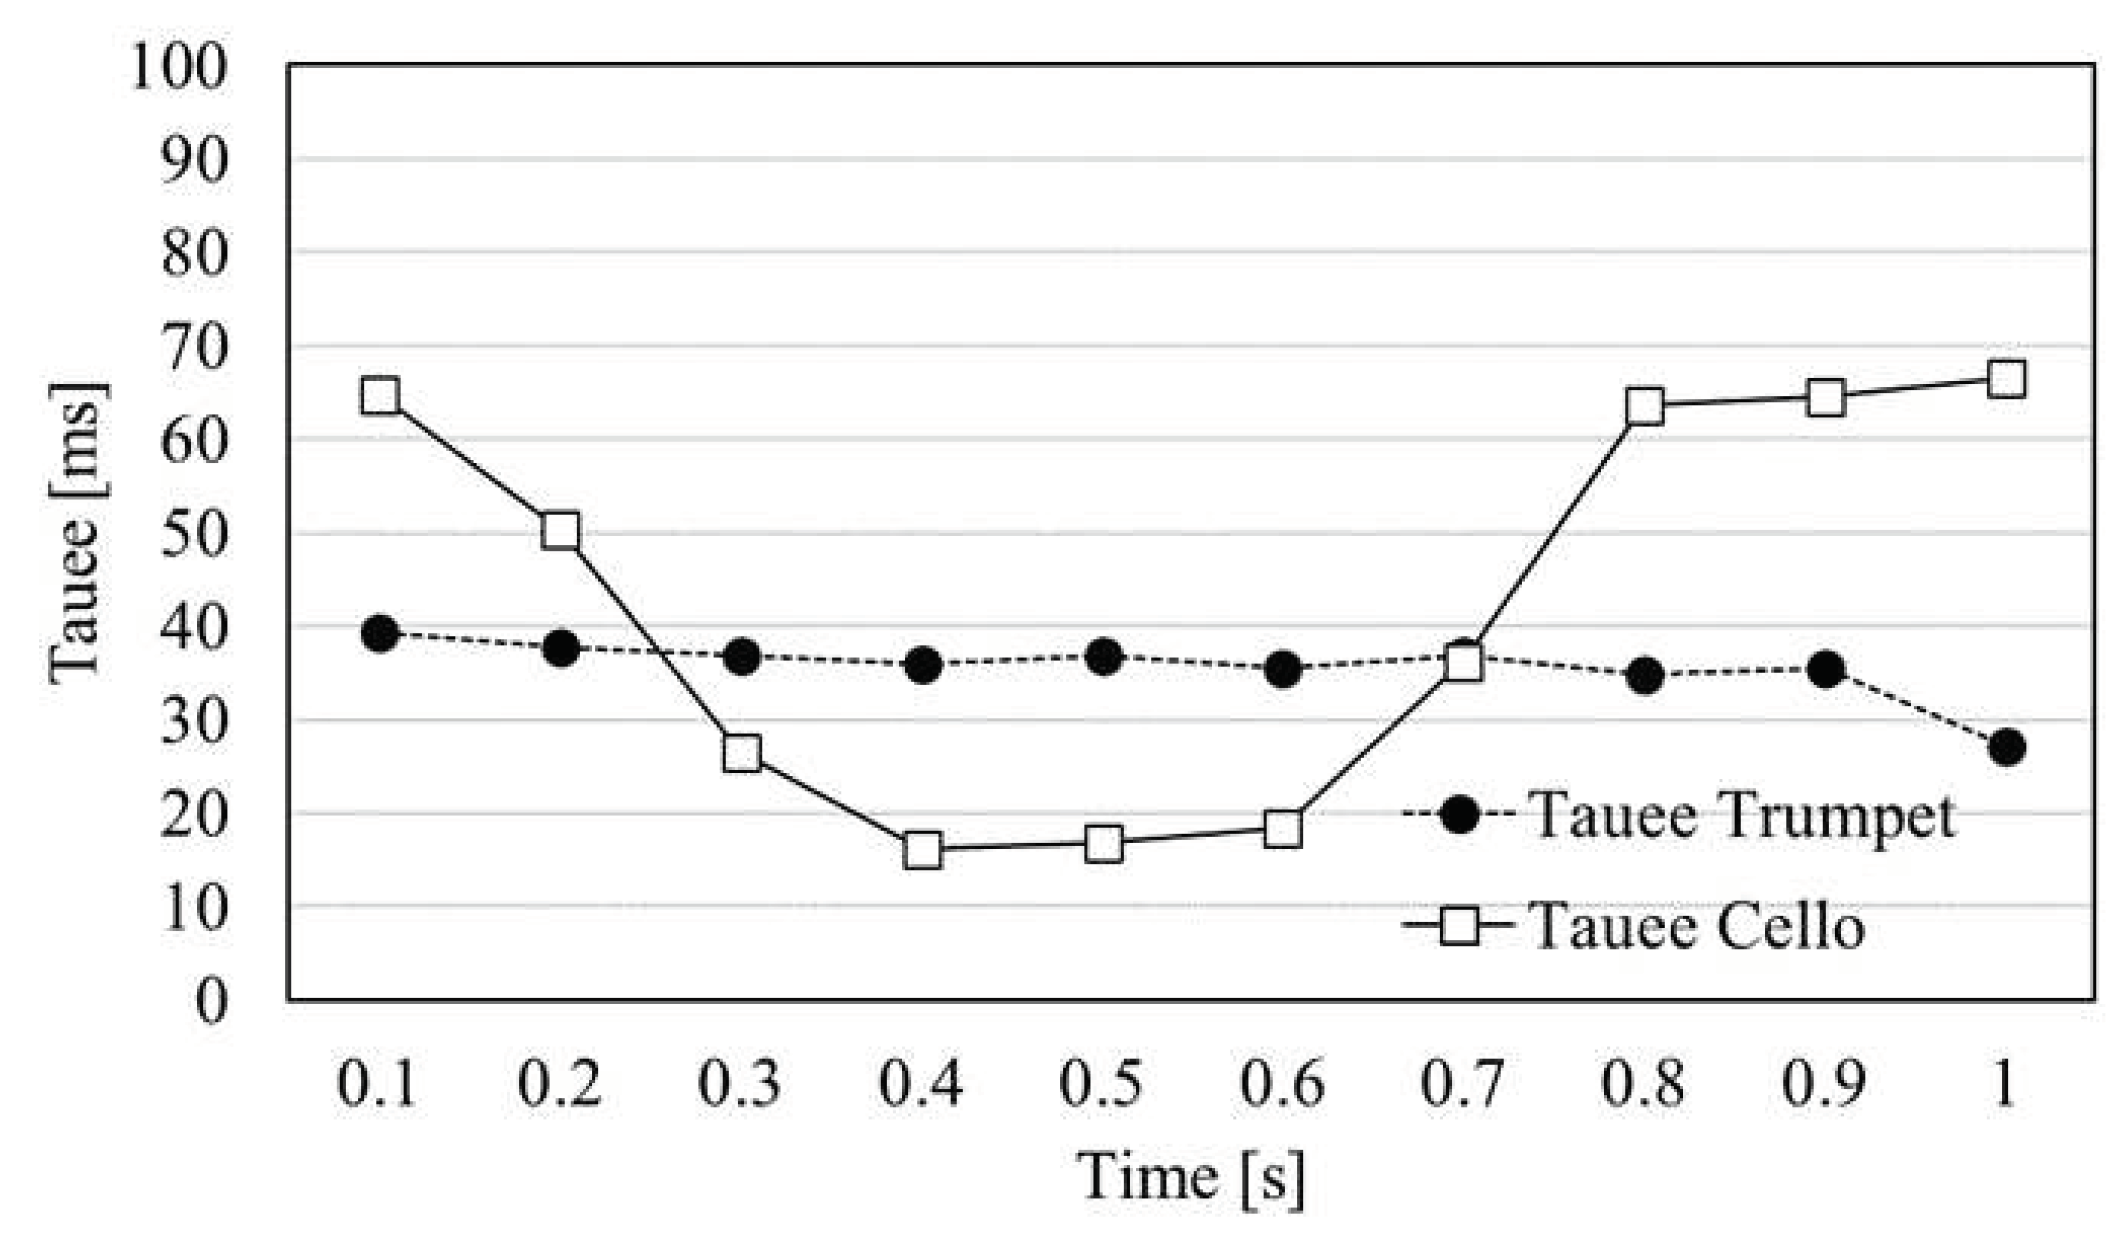
Figure 2). In addition, the running autocorrelation function (ACF) of two pieces proposed by Ando [16, Chapter 3] were calculated as shown in
Figure 3. The average τe values (ms) of two music pieces were 35.90 ms for trumpet and 46.92 ms for cello. However, the minimum τe values of two pieces were 31.25 ms and 16.24 ms, which were calculated as a function of preferred initial delay time of the music signal in a sound field reported by Ando [
32]. According to the settings of amplitude of the first reflection (A1) and reverberation part (AR), total amplitude of reflections (A1+AR) is equal to 1.5 (as the amplitude of direct sound A0 = 1), so the preferred IDTG of two instrumental pieces were estimated as 42.2 ms for cello, and 32.3 ms for trumpet, respectively.
Table 1 lists the total index of the autocorrelation function (ACF) calculated using both two music signals.
A 3 s segment was cut from each piece of music after it began, so as to produce an audio sample for simulation purposes. Therefore, each subject had to listen through 91 continuous audio gap and record their JND on cue. It took 6 min and 5 s (365 s) for each subject to finish listening an audio piece. They then rested for at least 10 min before listening to the second piece.
2.1.3. Calculation of continuous JND
After recording the JND points of 17 subjects, JND was calculated as the ratio of the gap between the sensory points before and after the arrival of a stimulus (Δgap = Gap
2-Gap
1) at the second sensory point (Gap
2):
in which
JNDC represents the subjects’ continuous results obtained after 91 gaps (c = 1, 2, …). Afterwards, all the
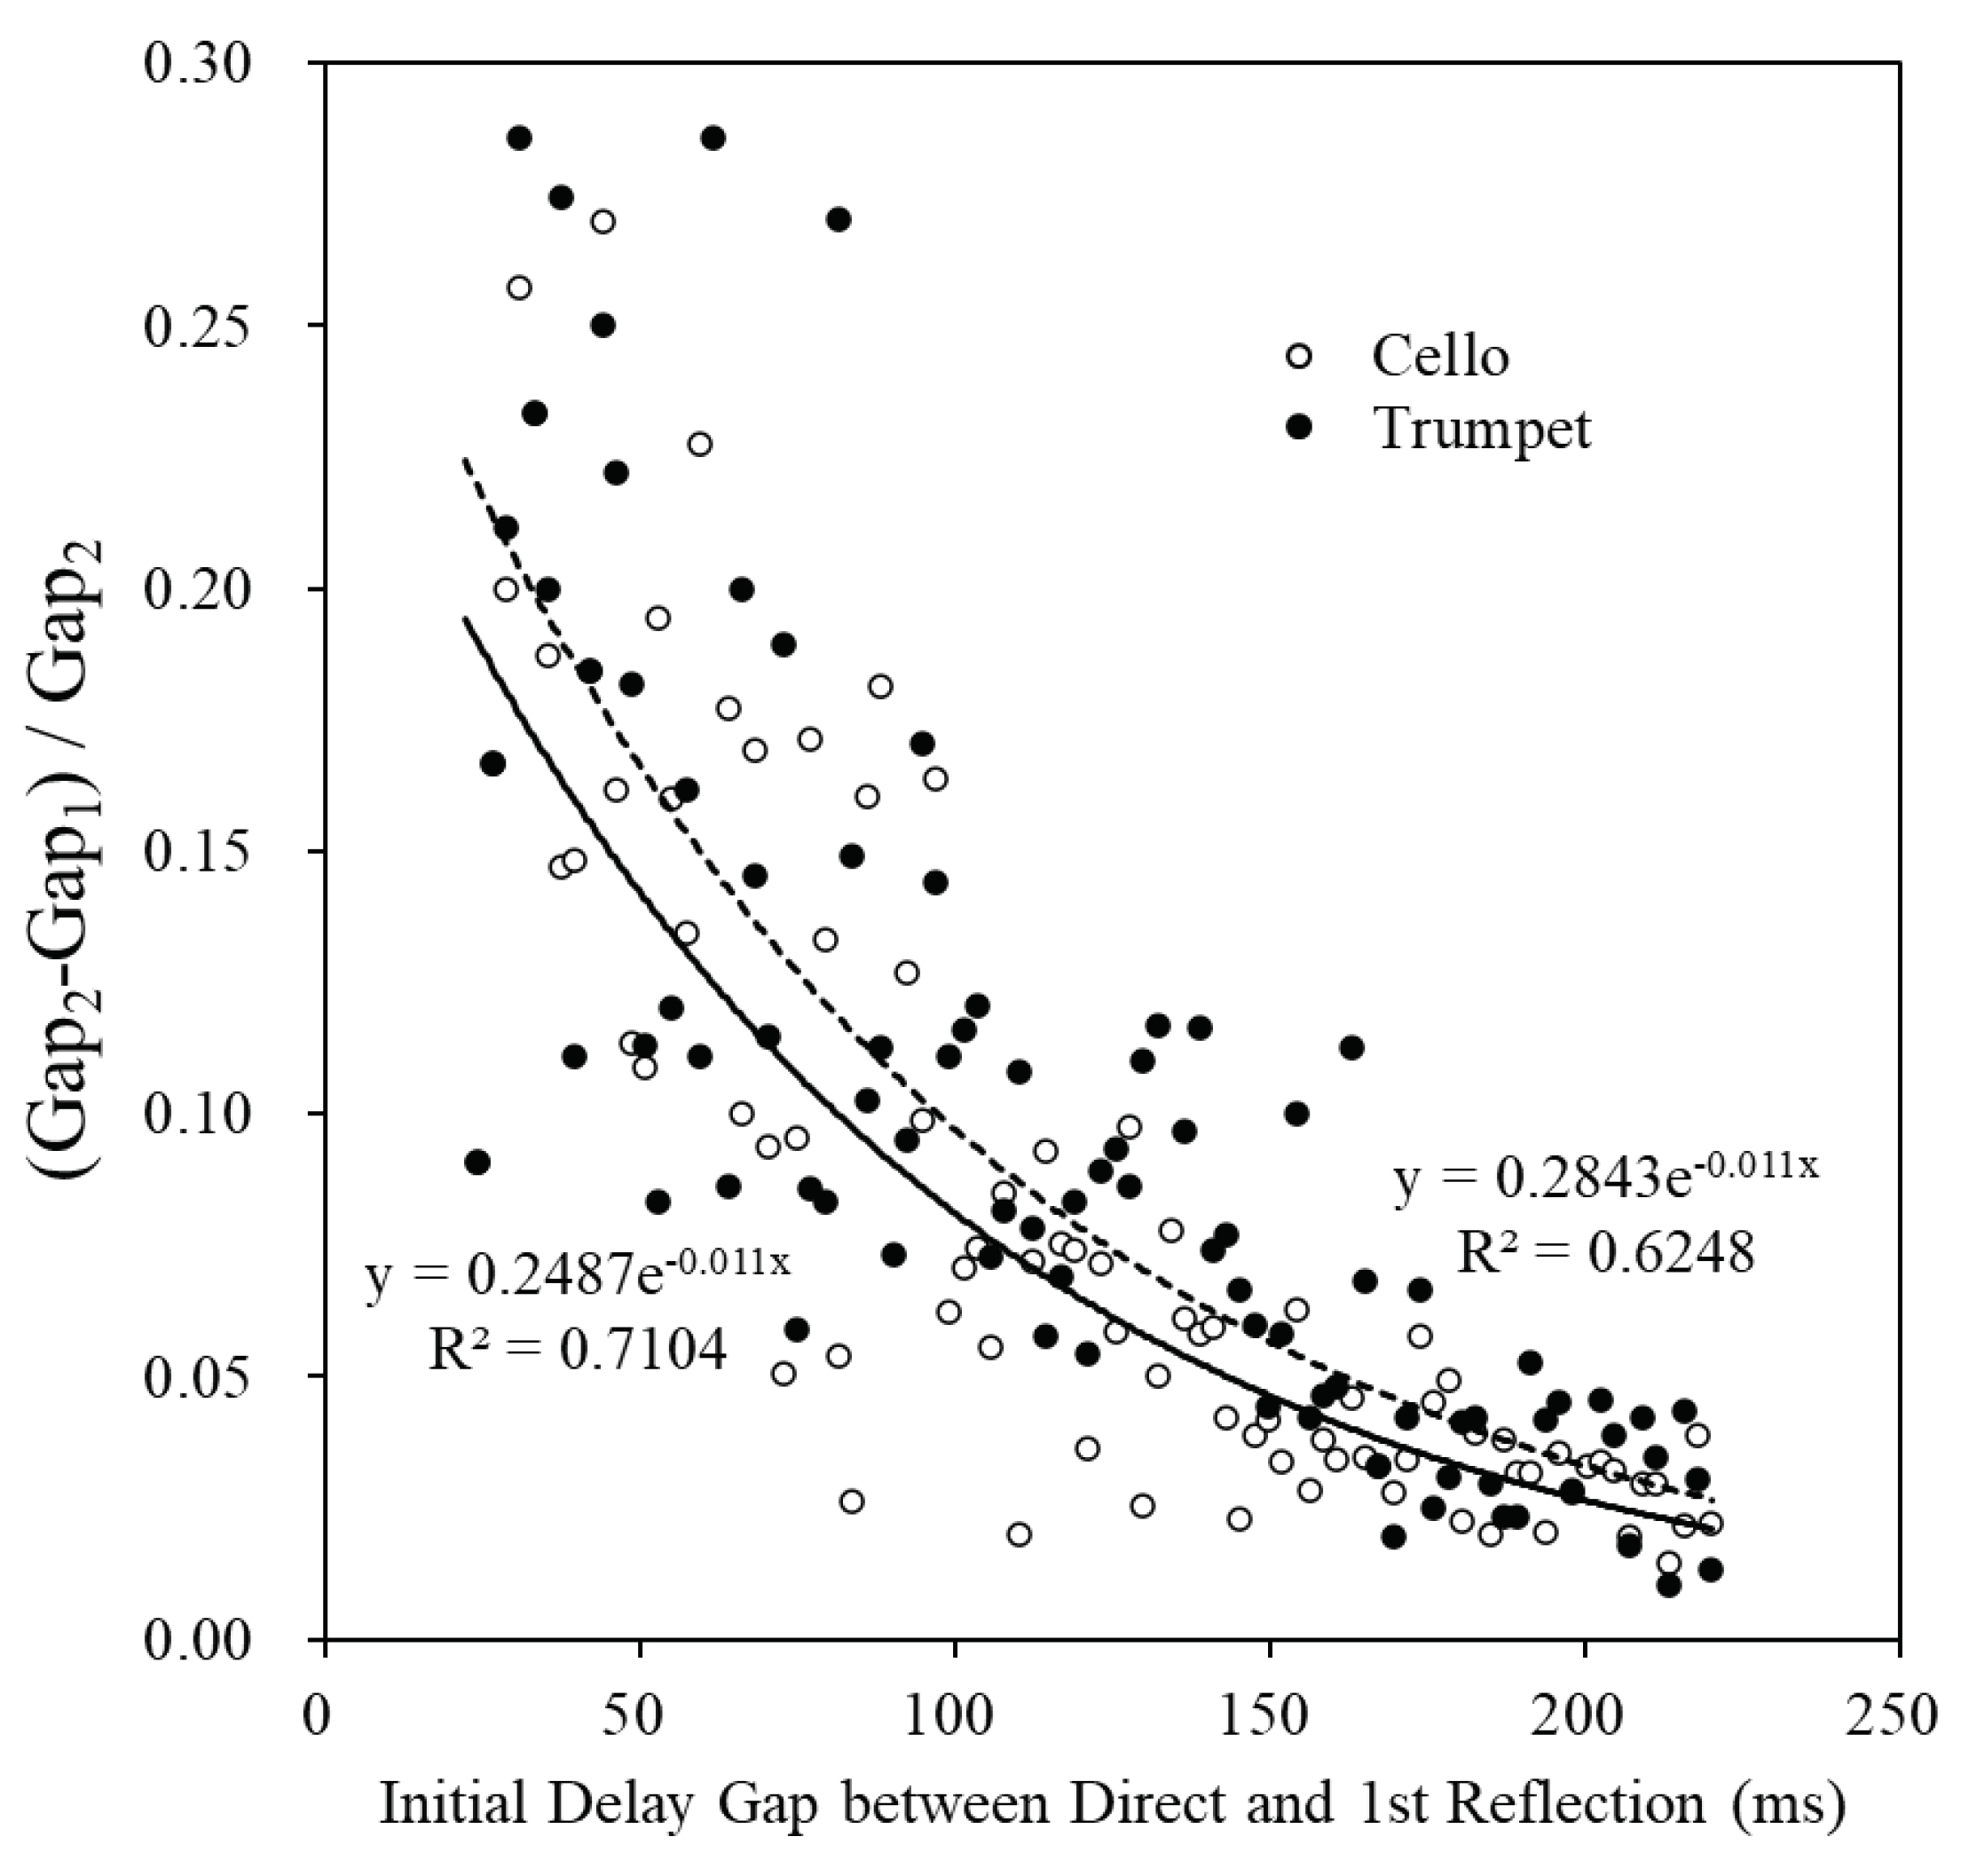
JNDC and perceived ITDG changes of the 17 subjects were plotted (as shown in
Figure 4). The JND of a musical piece is defined as the median of all the
JNDC results of the 17 subjects. According to
Figure 4, the perceived ITDG changes of the 17 subjects were lower for the trumpet piece, as indicated by the lower number of
JNDC points compared to the cello piece. This shows that the ΔGap is often greater for the trumpet piece, and there is a greater difference between the subjects’ responses. This can be explained by the fact that the stimulus is a musical piece; if white noise was used as a stimulus instead, the difference could be significantly reduced. The results revealed that the
JNDc of the cello piece and the trumpet piece was rated approximately 0.059 and 0.081 at a 50% “different” judgement range in most cases, respectively. Additionally, the JND of ITDG of the cello piece was measured as 7.4 ± 2.75 ms, while that of the trumpet was 10.18 ± 3.52 ms in the continuous variations of sound field structures.
2.2. Recording of continuous brainwaves (CBW)
Based on the results of the aforementioned psychological JND experiments in relation to the spatial ITDG, we expect that brainwaves provide the most efficient and direct approach for addressing psychological complexities and simplifying observations of auditory stimuli. The reason behind adopting this approach has been elucidated in our previous studies [
1,
2,
3,
4,
5,
6] on the effectiveness of electroencephalography (EEG) in sound field design. Individual differences are the greatest hindrance for sound field components responding to brainwaves. Therefore, it is necessary to adopt an experimental design that involves continuous and repetitive methods for statistical analyses. To date, salient components in a sound field, such as T60 and the ITDG of a first reflection and a direct sound, can yield decent correlations through statistical analyses of individual preferences [
5,
6]. Michelini, et al. [
8] and Ichikawa [
9] consolidated the psychological states and responses manifested through AEPs (auditory evoked potentials) across different frequency ranges. CBWs were recorded at prolonged analysis times and can demonstrate electrophysiological events from the inner ear to the central auditory pathway, which makes it possible to record slow components of AEP over 500 ms, such as the response of T60 in an environment. The 8 to 13 Hz range which corresponds to alpha waves produced when humans are relaxed is the most suitable state for thought and creation, and the mass generation of these alpha waves can be collected. These auditory impulses of the brain are recorded as CBWs. Meanwhile, the method of brainwave recording is based on the International 10/20 system for placing scalp electrodes to identify the region where a specific psychological response is emitted from [
33,
34,
35]. When consolidating and reporting on brainwave signals from a statistical perspective, Praetorius, Bodenstein, and Creutzfeldt [
36] revealed that the application of spectral analysis would obliterate the characteristics of omnipresent brainwave changes because a spectrum on average is merely a single event. In this regard, we used Ando’s [16, 5.4.2] auditory pathway model to describe our approach for analysing the omnipresent temporal characteristics of CBWs.
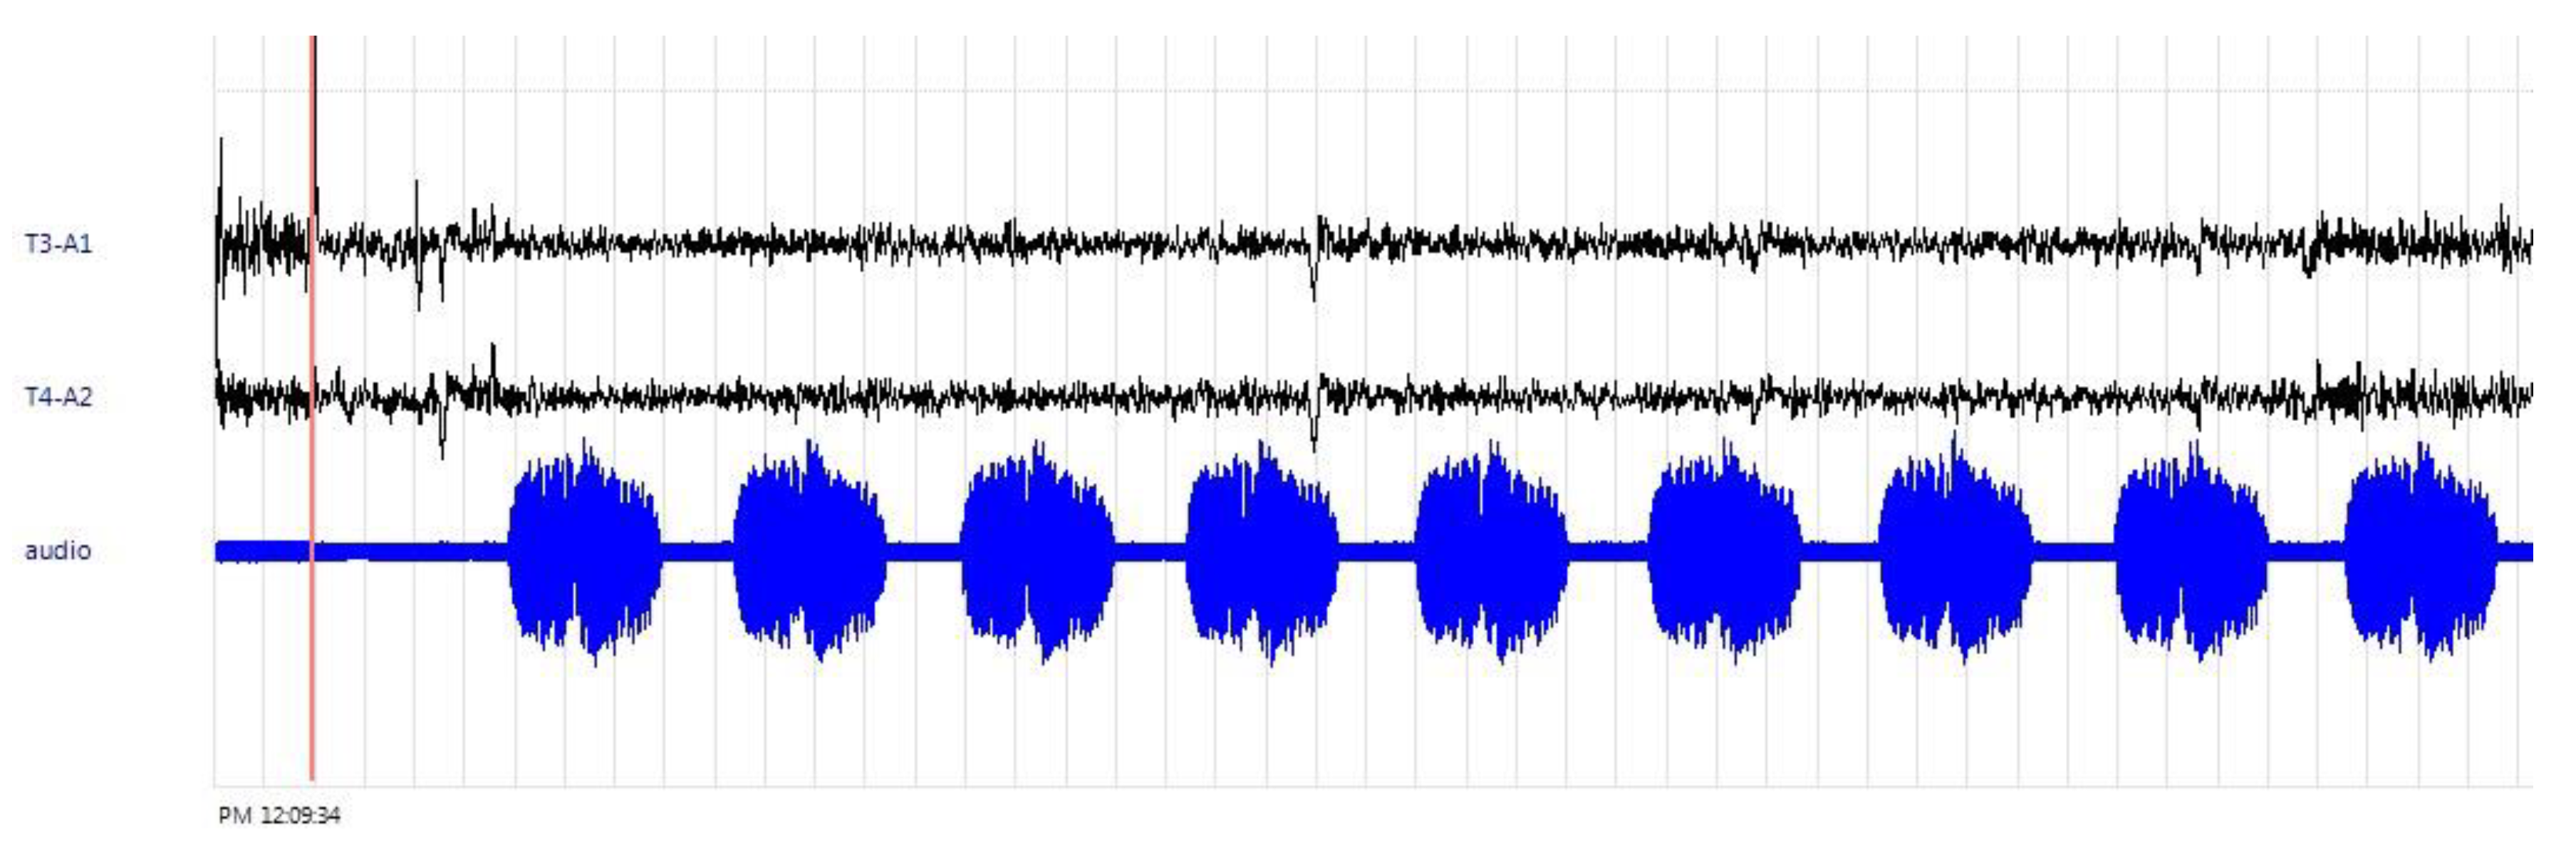
Similar to experiments on the perceived JND of a spatial ITDG, it is necessary to simultaneously record CBWs through continuous cueing and the auditory stimuli, so as to make preparations for post-production (as shown in
Figure 5). Brainwaves from the cranial nerves are led through the primary electrodes (T3-left, T4-right, 10/20 system) that are correspondingly placed on the scalp. Meanwhile, the reference potential was recorded through the electrodes that were placed on both ear lobes (A1, A2), enabling the recording of cue sound signals via an EEG that uses unipolar leads. The reference electrodes were positioned on both the left and right earlobes. The ground electrode was placed on the forehead. The CBW signals were analysed after passing through a digital-bandpass filter with cut-off frequencies (140dB / octaves lops) of 8 - 13Hz: alpha-wave ranges. 12 subjects, all of whom self-reported as being right-handed and having normal hearing, participated in this experiment. The number of participants demanded for the CBW recordings was referred to as the conventional studies [
1,
2,
3,
4,
5,
6], which met the requirements for analysing the sound field characteristics.
2.3. Method of CBW analysis
In line with the aforementioned method of recording brainwaves, the CBW signals were exported as an Excel file using an analog-to-digital (A/D) converter for subsequent analysis. The observation target was alpha waves at an 8 to 13 Hz range, and sampled frequencies were converted from analog to digital at a sampling rate of 100 Hz. Musical signals recorded during the same period were utilized to identify the initial positions of the signals emitted from the T3 and T4 electrodes during a specific period. The integral length (2T) of ACF of CBW was calculated using an initial position and the succeeding initial position. Afterwards, analyses were performed to calculate the running ACF of a signal. The targets of analysis of this study were calculated based on the experience of previous studies [
1,
2,
3,
4,
5,
6]. The running ACF was then used to compute the effective delay time (τe, unit in s) of the ACF of each piece of initial data. Thus, the parameters used for calculating the running ACF are as follows: 2T = 2 sec, running step = 3.89 sec, τe is defined as the time required for a NACF that has decayed to -5 dB after taking its logarithm to obtain a value from the delay time axis [
6].
3. Results
3.1. Analysis of minimum value of the effective delay time (τe_min) of the brainwaves’ ACF
Figure 6 illustrates that the averaged τe values of ACF of CBWs on the alpha-wave frequency range correlates well with W_
IACC on the T4 (right) electrodes for 12 participates during continuous ITDG cues (91 steps) of the trumpet and cello pieces were played (Sigh Test, Z = 6.92, p < 0.01). In the other hand, as shown in
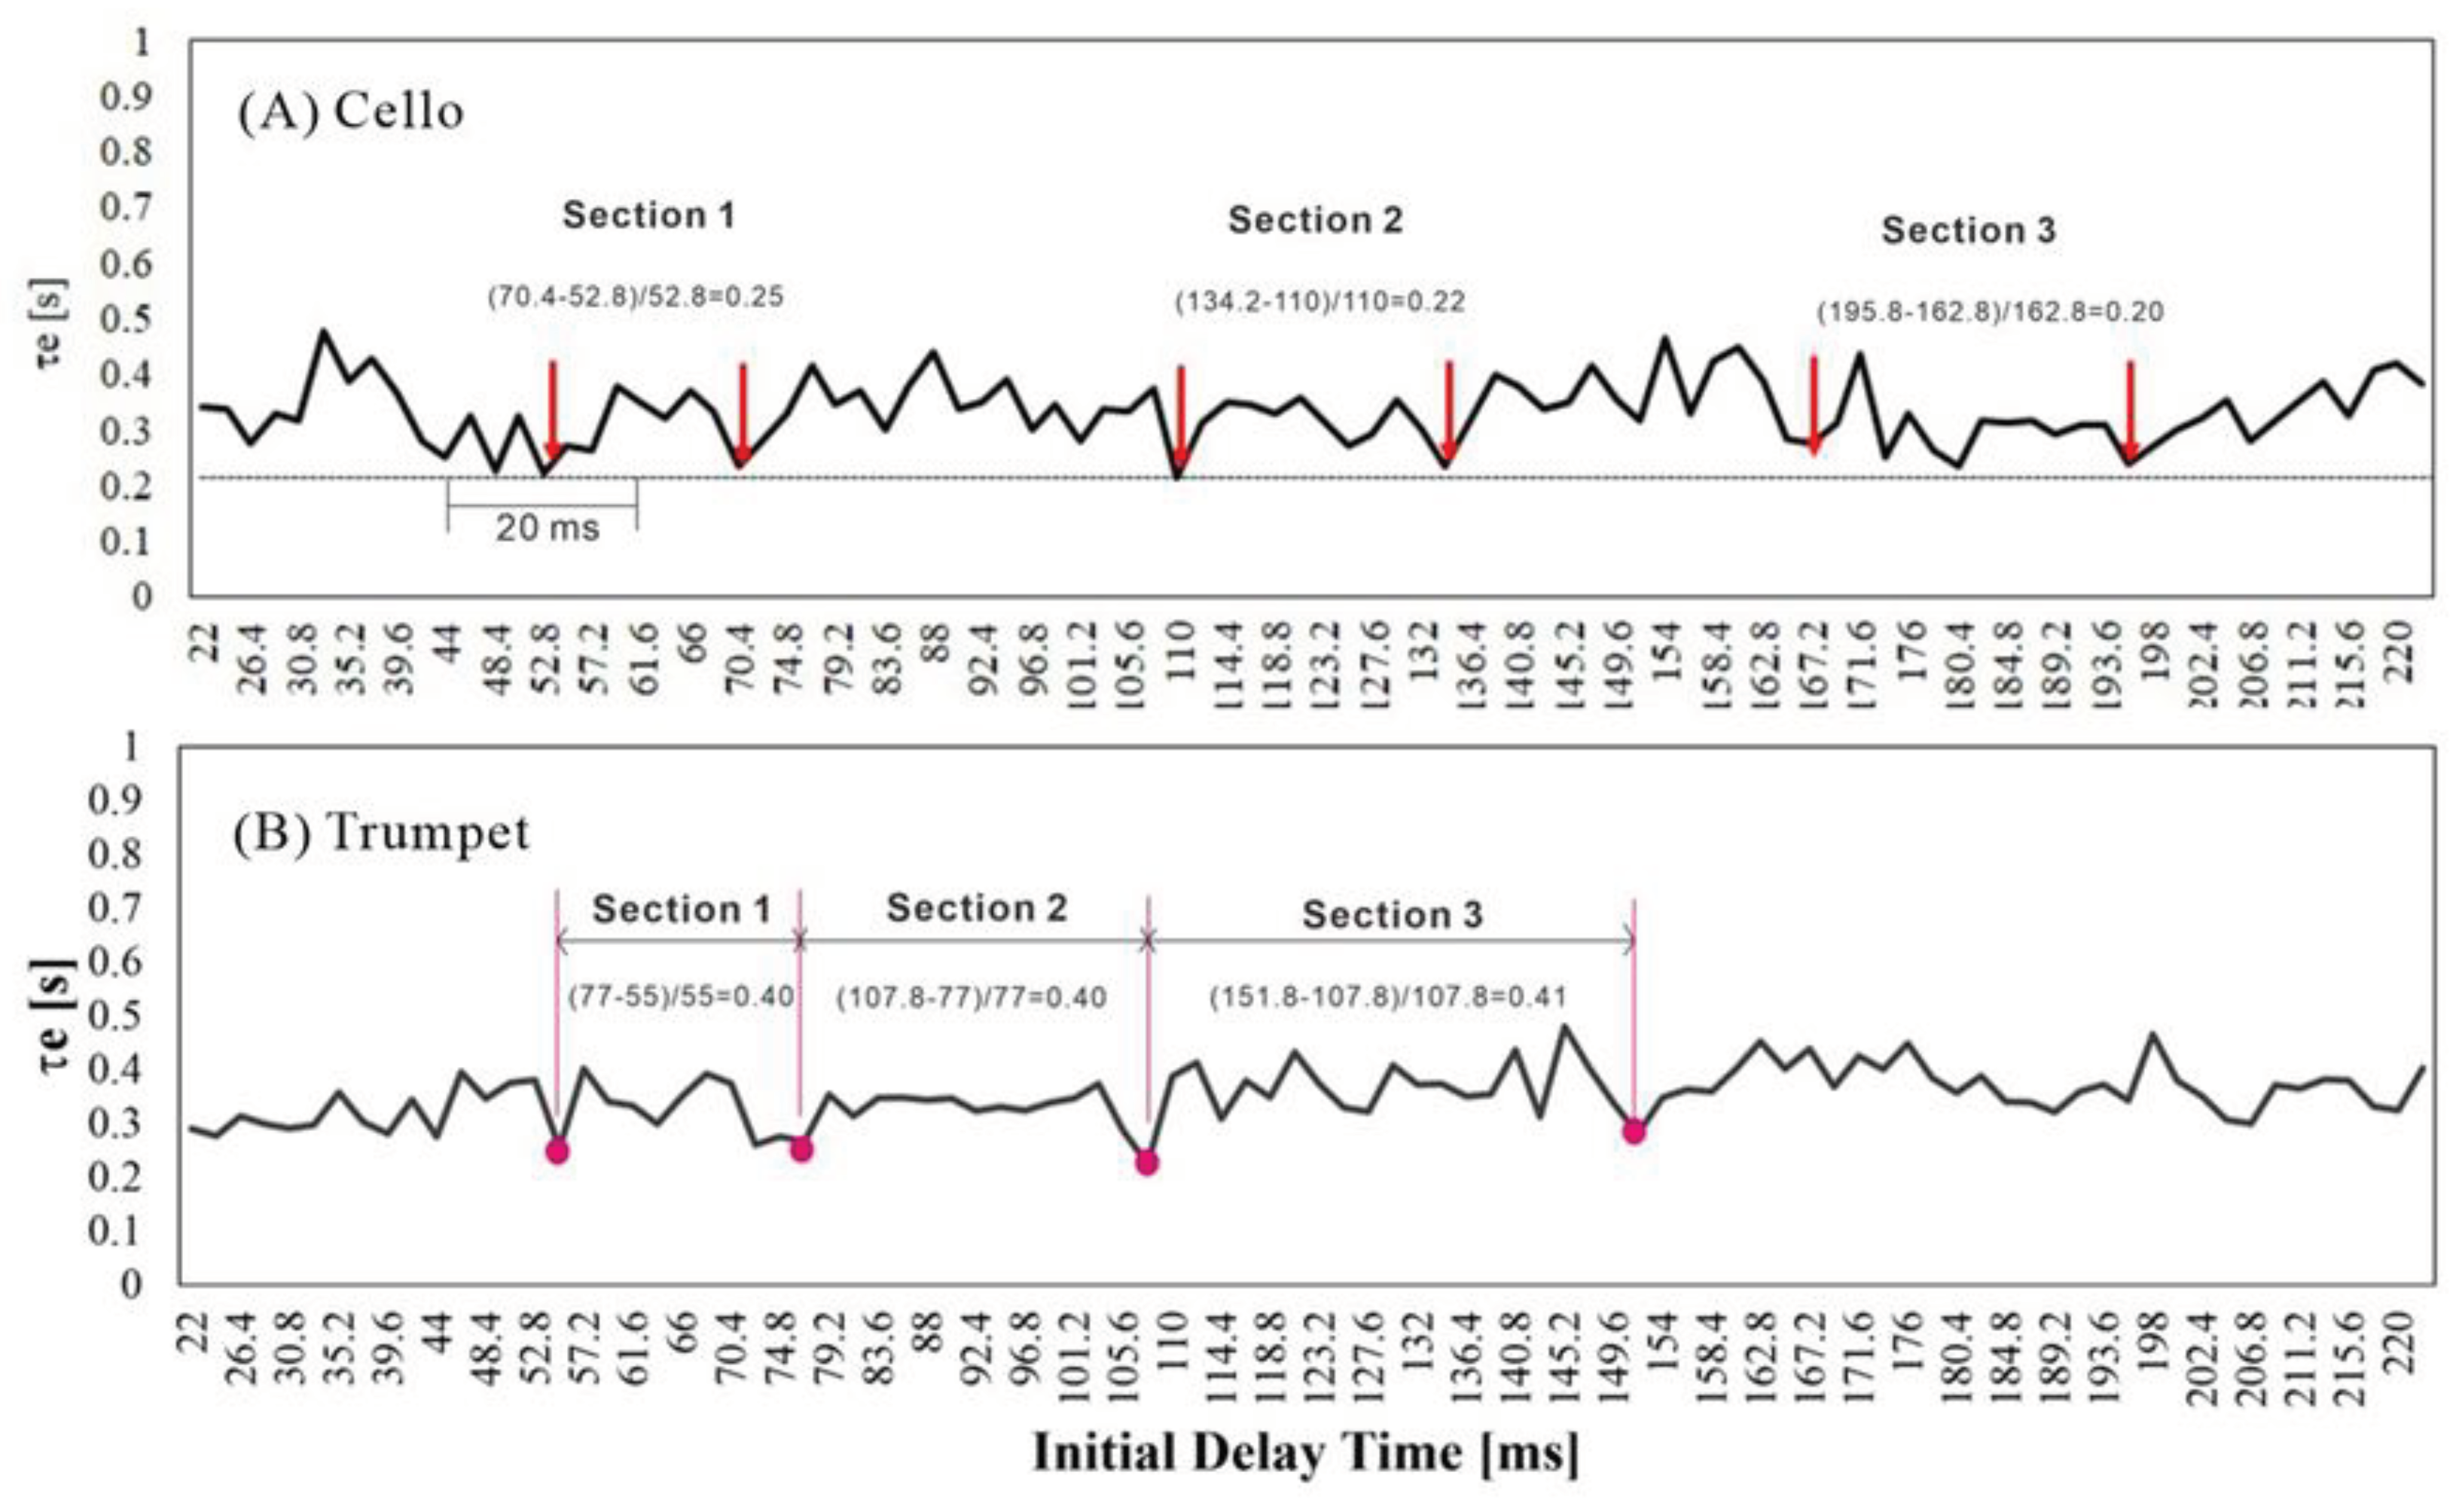
Figure 7, the average continuous minimum value of the effective delay time (τe_min) of the ACF of CBWs detected on the left hemispheres (T3) of the 12 subjects in response to the trumpet piece was 0.28 s. This also resulted in a fixed and continuous phase ratio ((τe_min
R - τe_min
F)/ τe_min
F) equal to 0.4, whereas the minimum values of τe was defined as the running minimum value between the two music pieces with respect to the value of
JNDc at a minimum distance of 20 ms, longer than the duration of JND of two instrumental stimuli. The minimum value of the cello piece occurred at the 0.23 s; and the average stage ratio formed on the left hemisphere (T3) was 0.23, which was neither consistent nor continuous and subsequently diminished. This finding indicates that the continuous minimum value of the effective delay time of the ACF of CBWs results in a fixed continuous phase ratio ((τe_min
R - τe_min
F)/ τe_min
F) equal to 0.11, which to a certain extent, is associated with the JND obtained through psychological tests. However, the existing data comparisons are unable to explain the reason behind this observation.
3.2. The just noticeable difference of initial reflection in a sound field
According to
Figure 4, which shows the relationship between all the
JNDC values and the ITDG change intervals of the cello and trumpet pieces (in which the former has a significantly lower audio than to the latter), it can be known that high-frequency sounds have larger
JNDC values. Furthermore, the subjects’ perceptions of the spatial ITDG changes of both instrumental solos were significantly different. This finding is reflected in ISO 3382-1 which standardizes the JND of various physical parameters (such as T60 and C80) but lacks a definition for ITDG, mainly because it is difficult to test the range of changes experienced in music halls. This study simulated the changes within the 22 ms to 220 ms range, to provide useful references regarding listener perceived ITDG for architectural acousticians.
4. Discussions
The following discusses the comparisons between the subjective responses on the JND decision-making process and the results of calculating the ACF of CBW with respective to the ITDG of a sound field ranging from 22 ms to 220 ms.
4.1. Coordination in brainwaves and the subjective JND of ITDG
A design theory proposed by Ando [
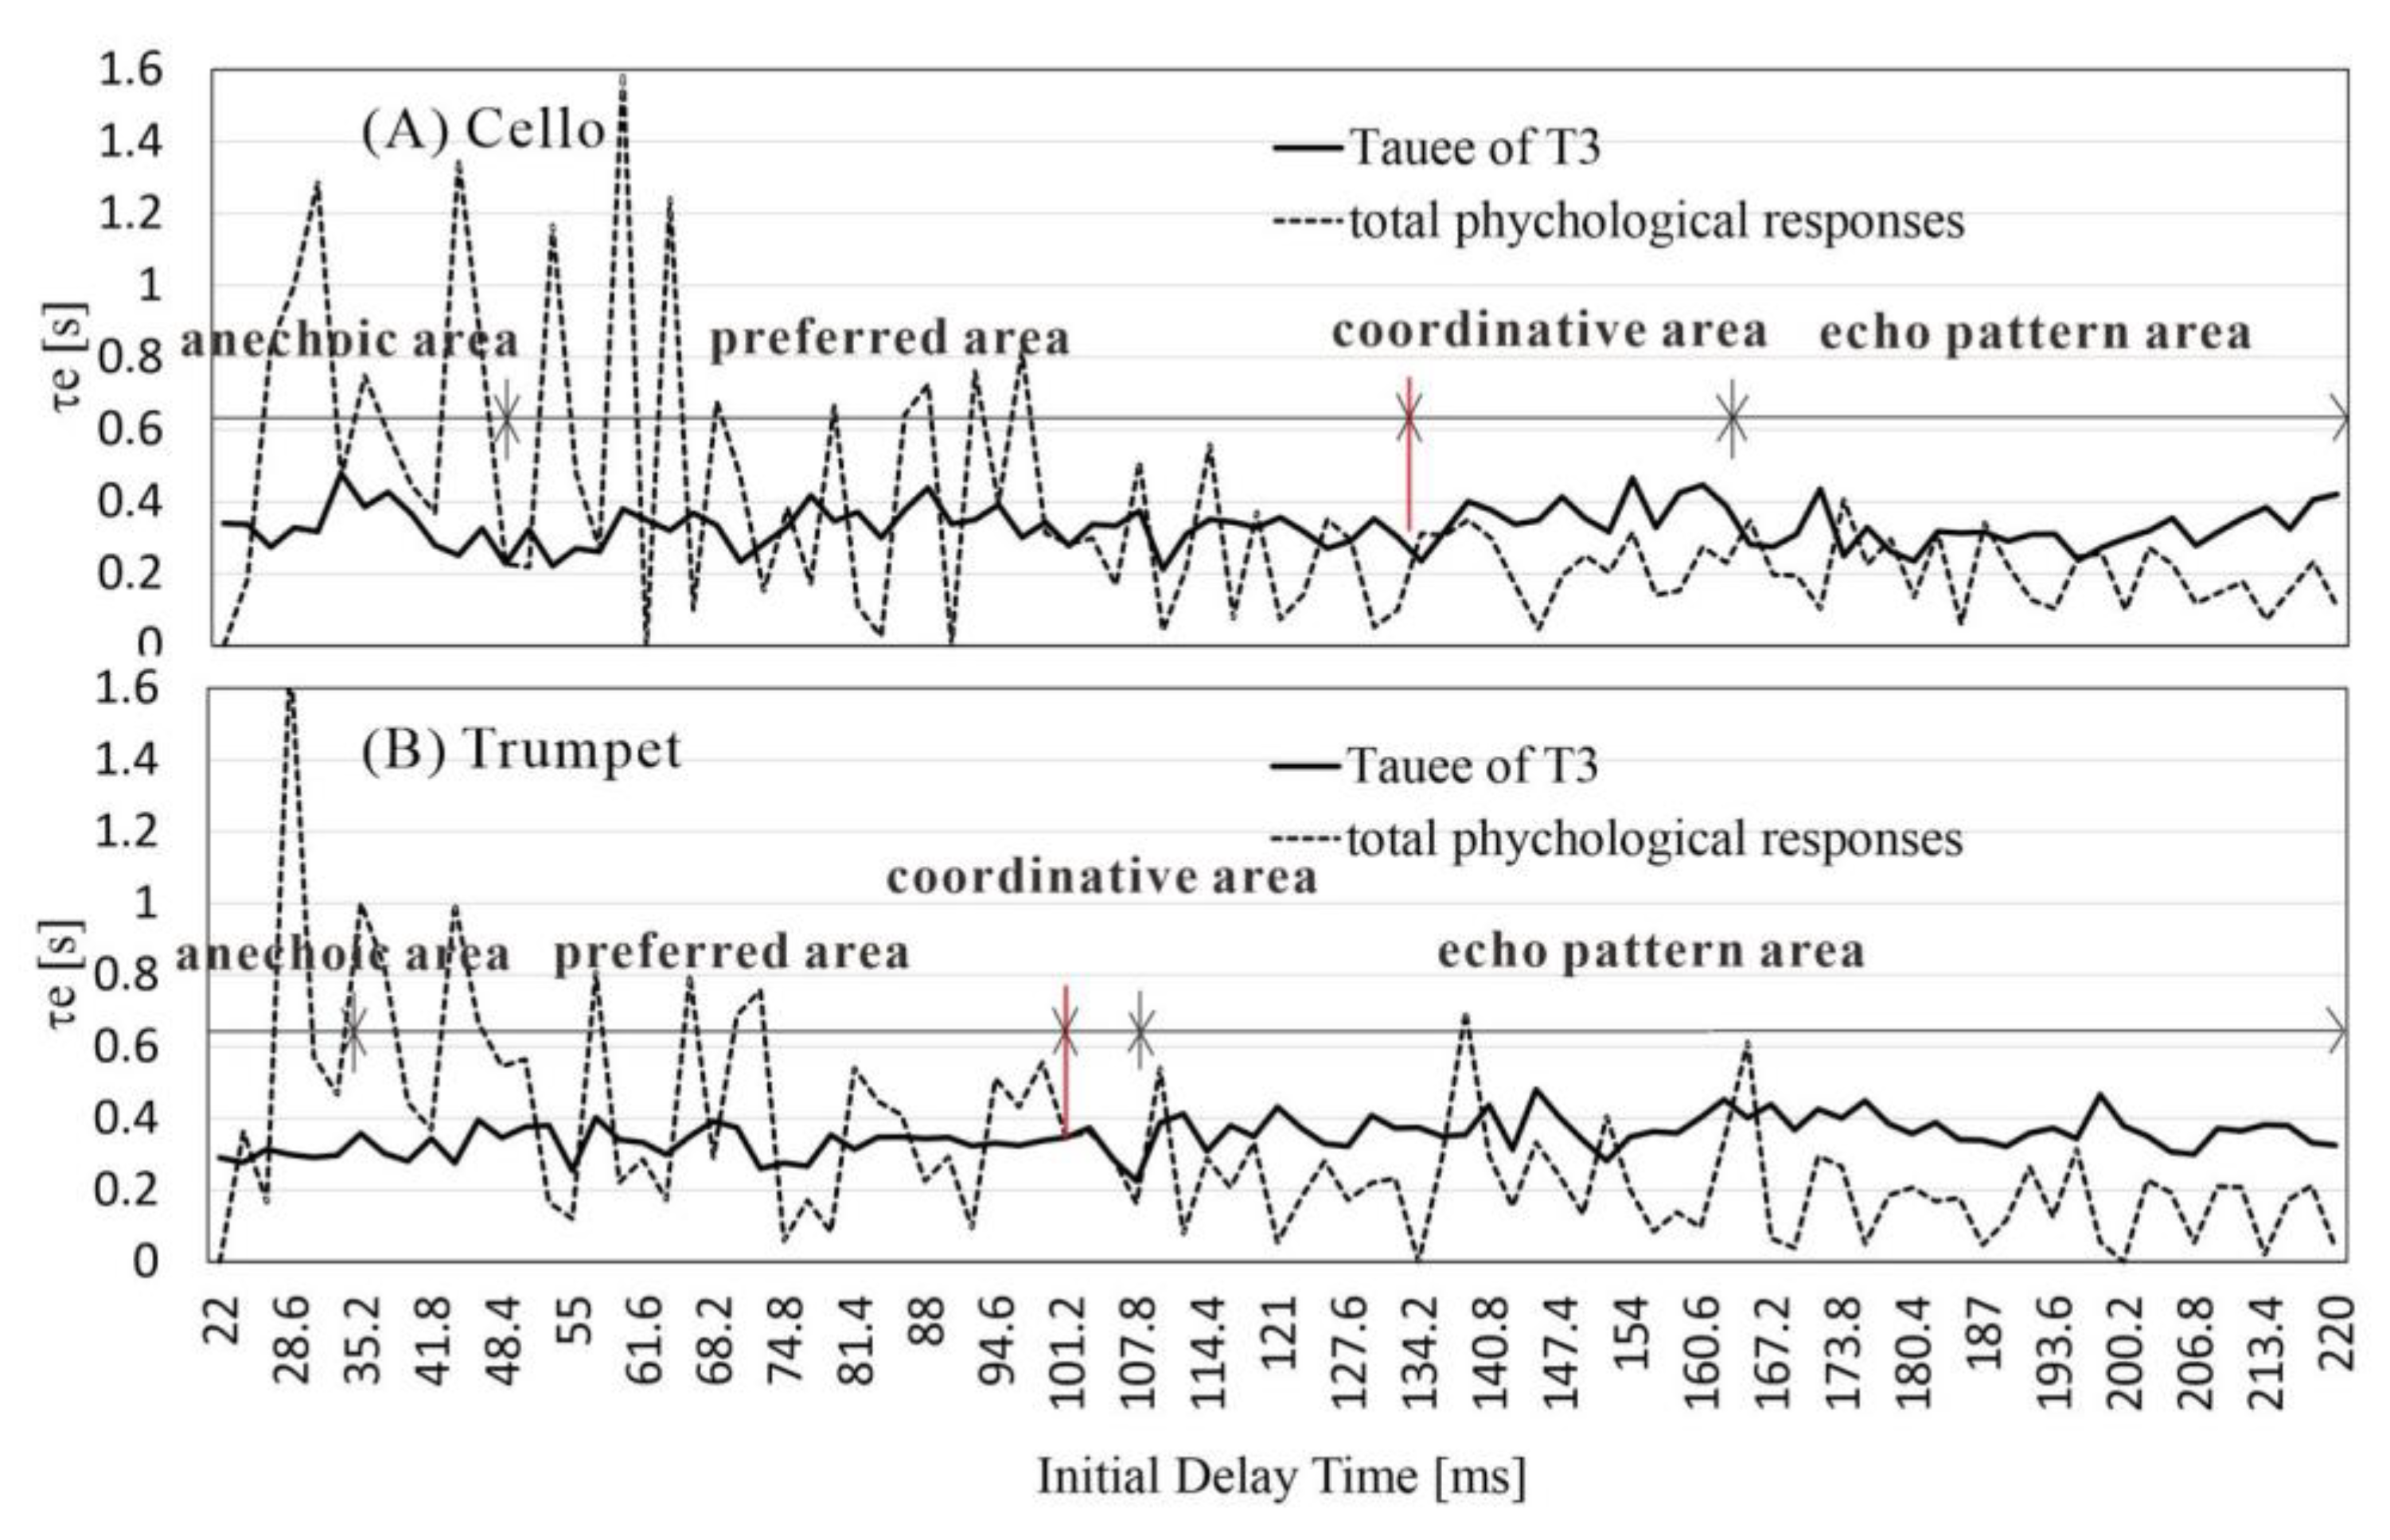
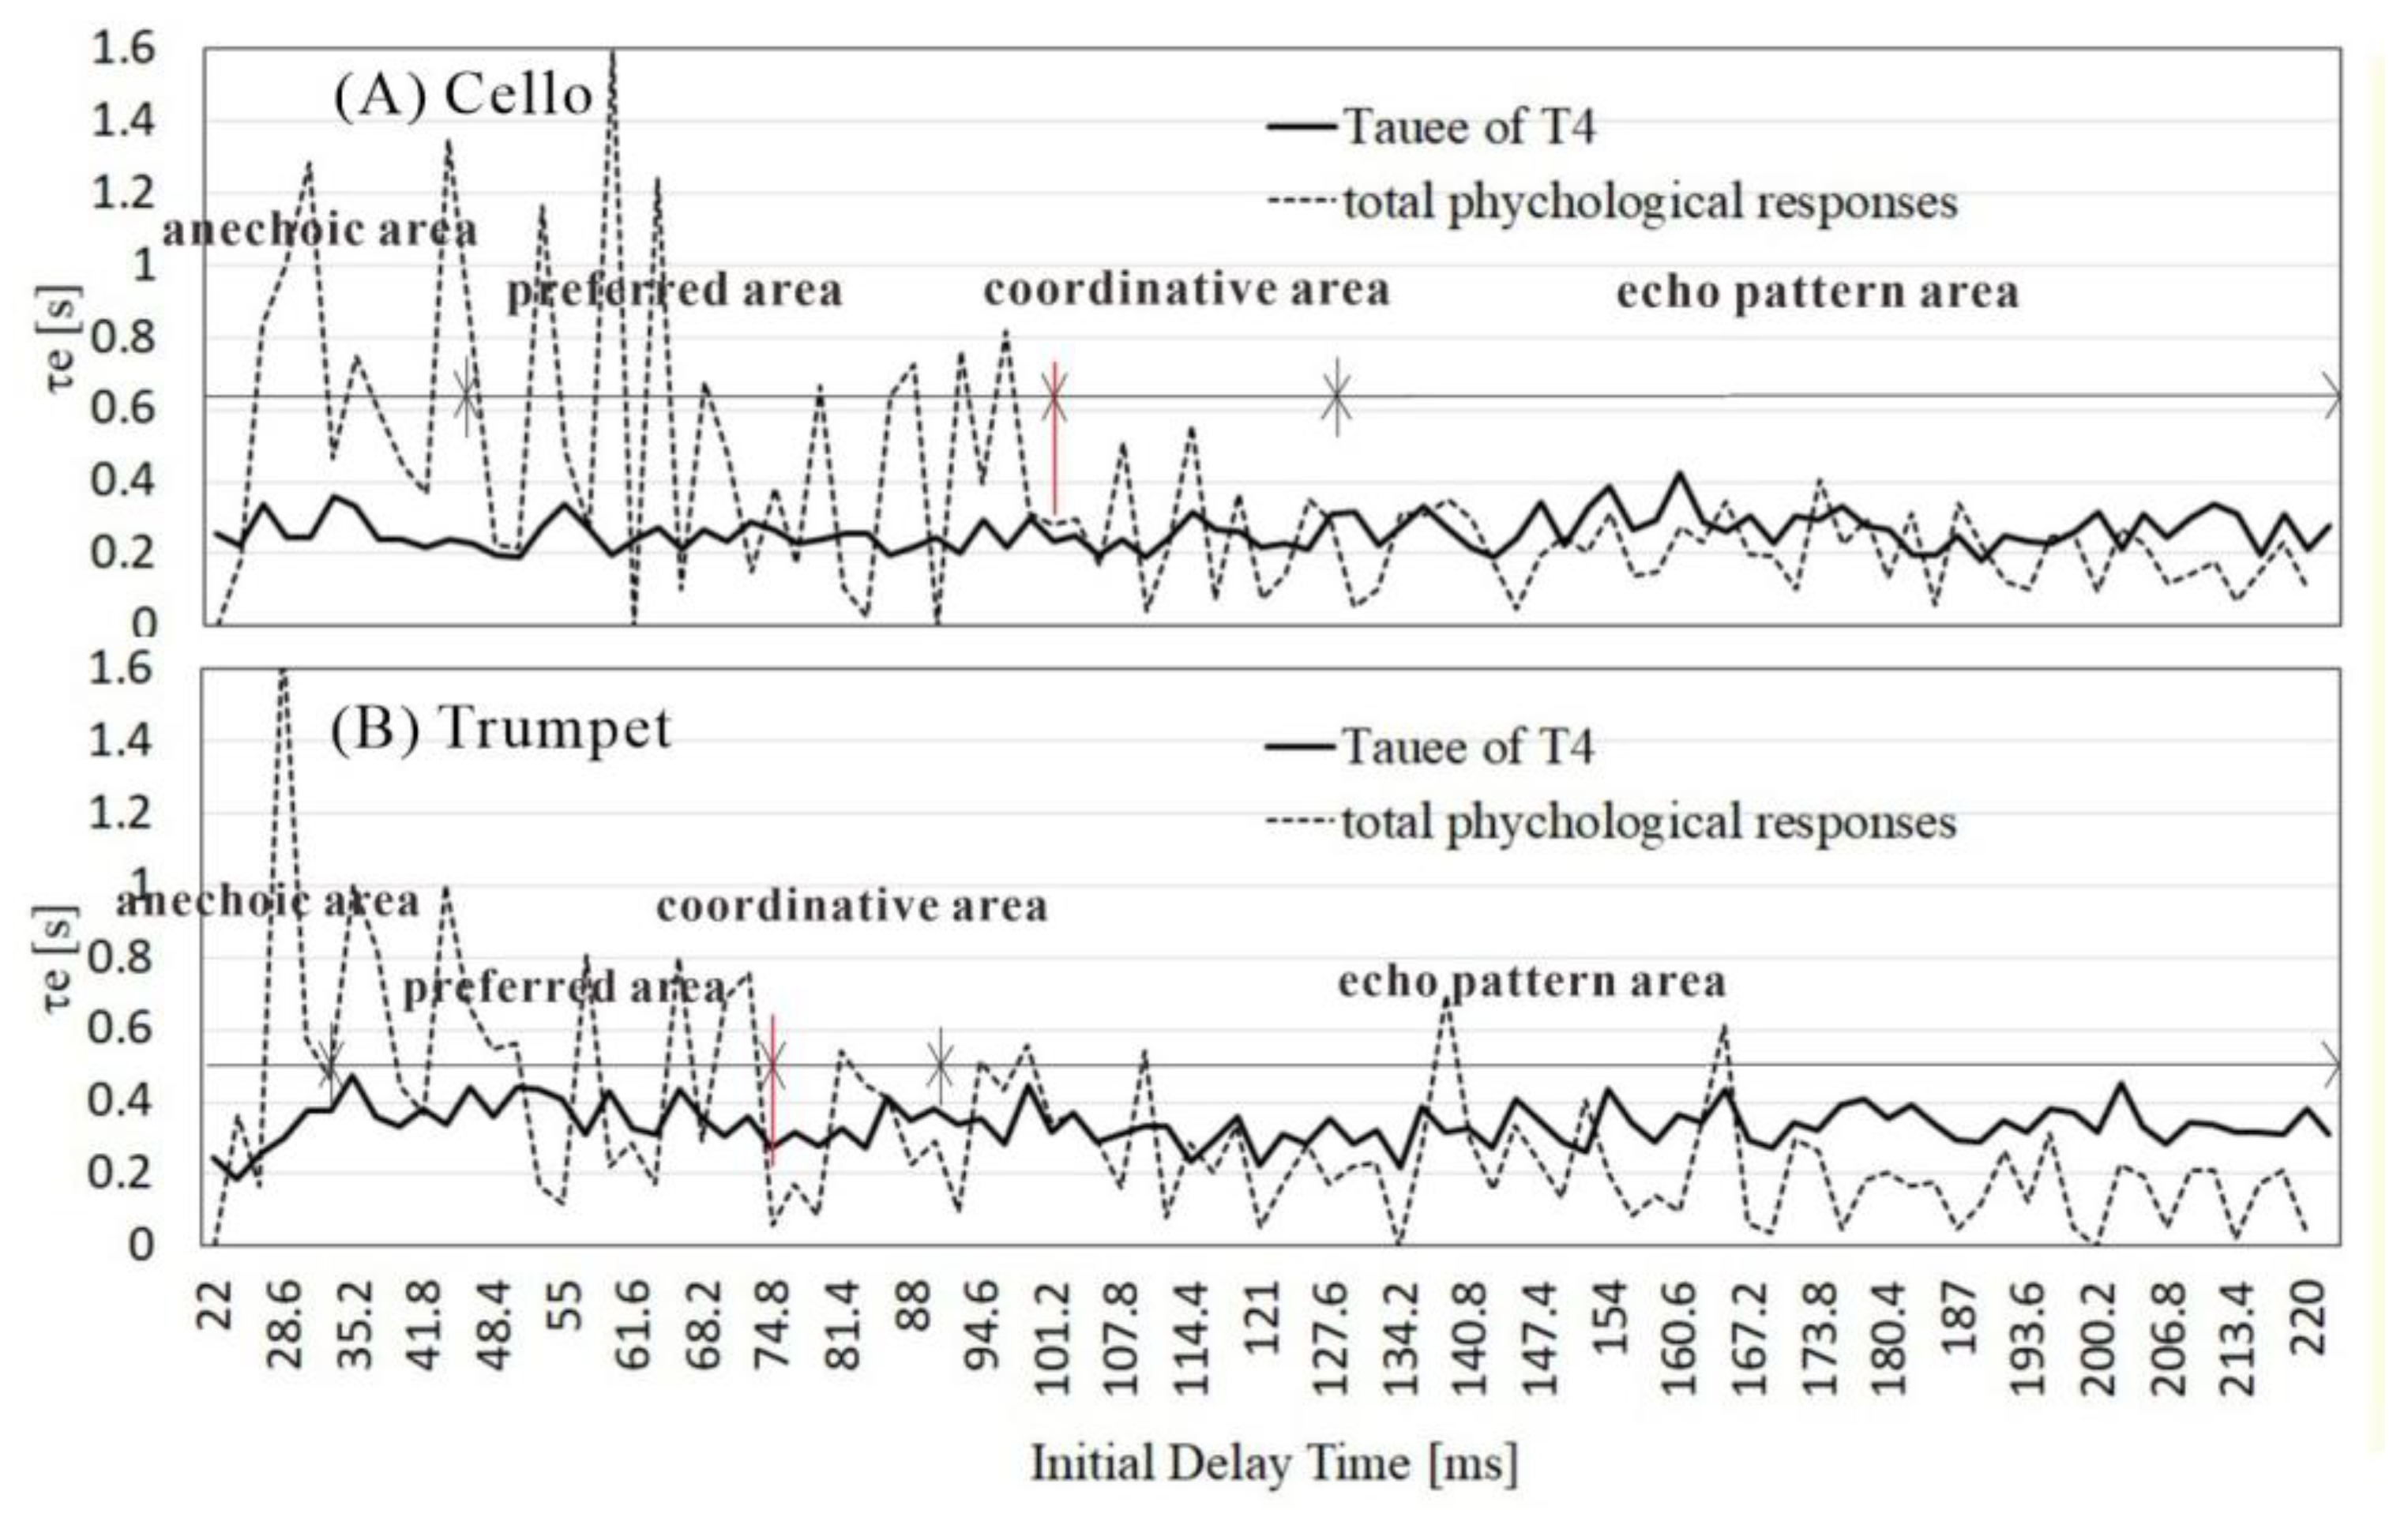
32] stated that the short-term value of the effective delay time (τe) of the ACF of a stimulus signal is related to the preferred ITDG value in a sound field. The observed relationship between the subjective responses in the JND process and the τe [s] of ACF of CBW in alpha rhythm range is illustrated in
Figure 8. As shown in
Figure 9, we found that the subjective responses of the ITDG decision-making process,
JNDC = Gap
2-Gap
1/ Gap
2, and the τe [s] of ACF of CBW in alpha rhythm range are in coordination with the various delay simulated orders starting approximately at 132 ms for the cello piece and 101 ms in the left (T3) hemisphere, as well as 97 ms and 74 ms in the right hemisphere (T4) for both instrumental tracks. This suggests that the first coordinator on delay order is related to the averaged τe [ms] listed in
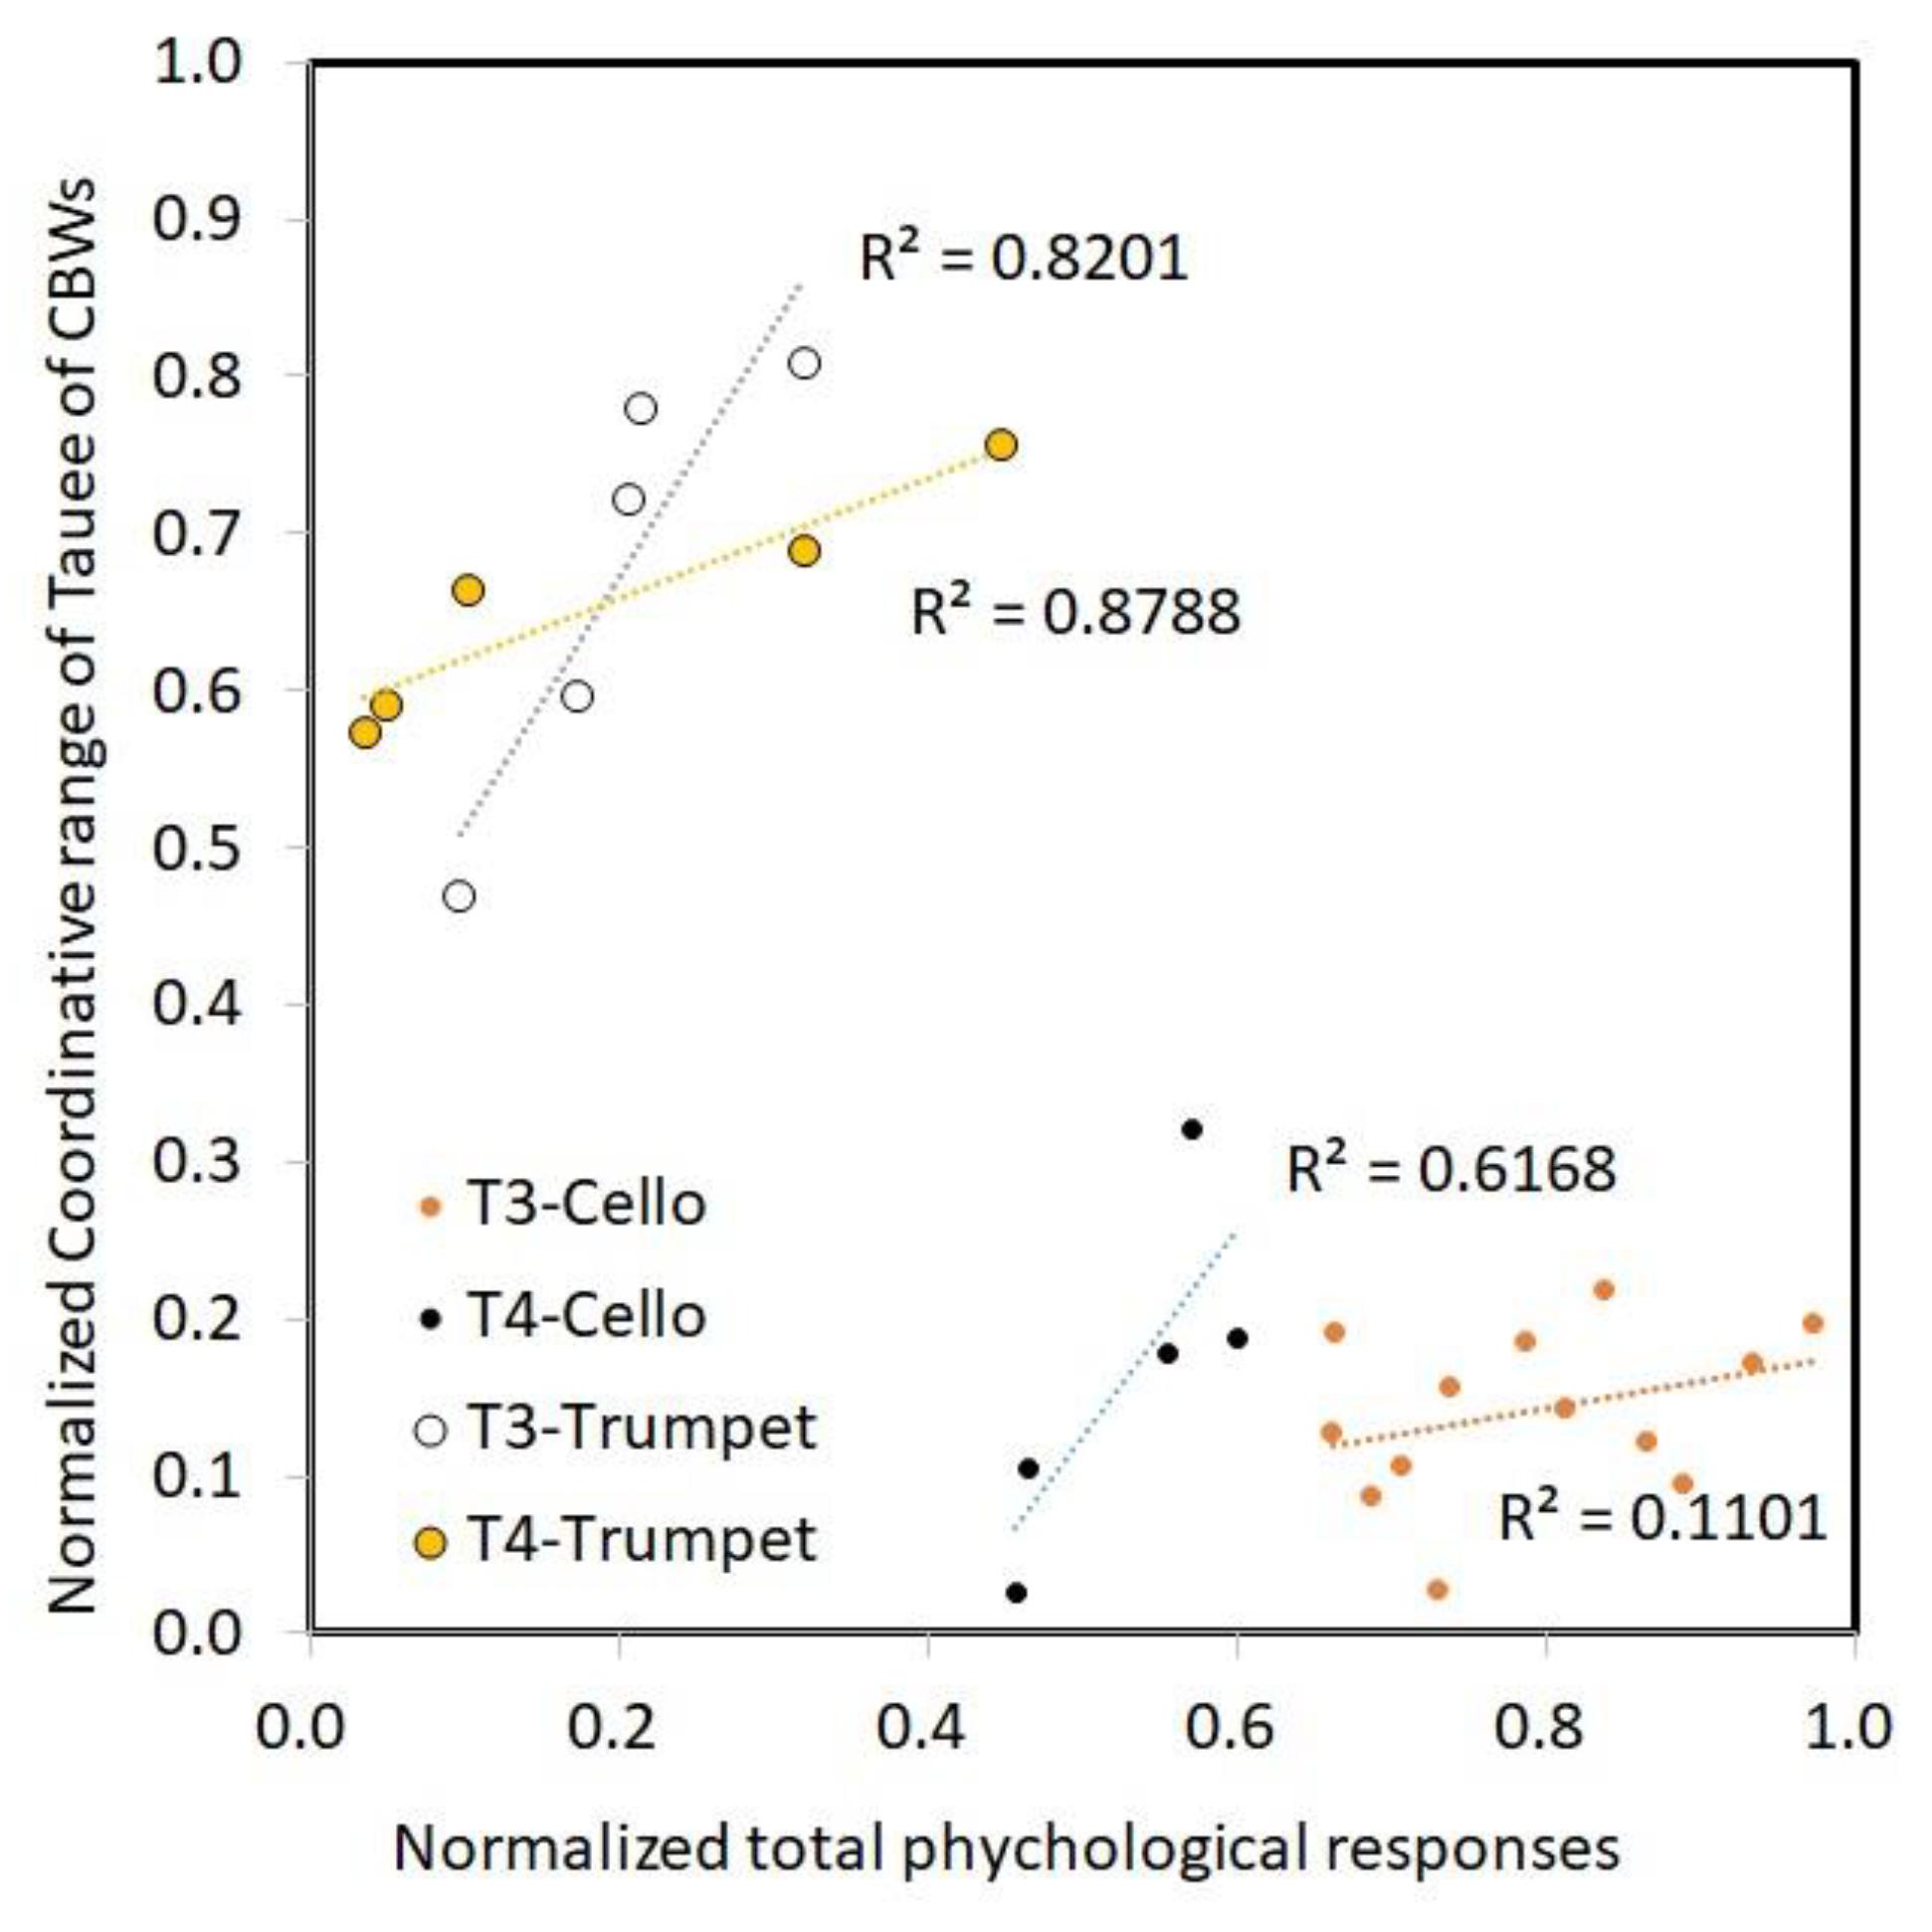
Table 1 for the respective cello and the trumpet pieces as well. They were all approximately 2.8 and 2.0 times higher than the values of the average τe [ms] in the left (T3) and right (T4) hemispheres. At that moment, with subjective ITDG judgements, the time gap would be experienced as an echo of a sound field, and perhaps, the ITDG image of a sound would be changed. In other words, in the subjective responses of ITDG decision-making, the subjective judgements of ITDG in a room consist of four models within a range of 22 ms – 220 ms. The subjective responses should have two different models that change noticeably with respect to ITDG judgements, but the τe [s] of ACF of CBW in alpha rhythm range were linear and unchangeable.
4.2. Subjective JND of ITDG and auditory path in the brain
As shown in
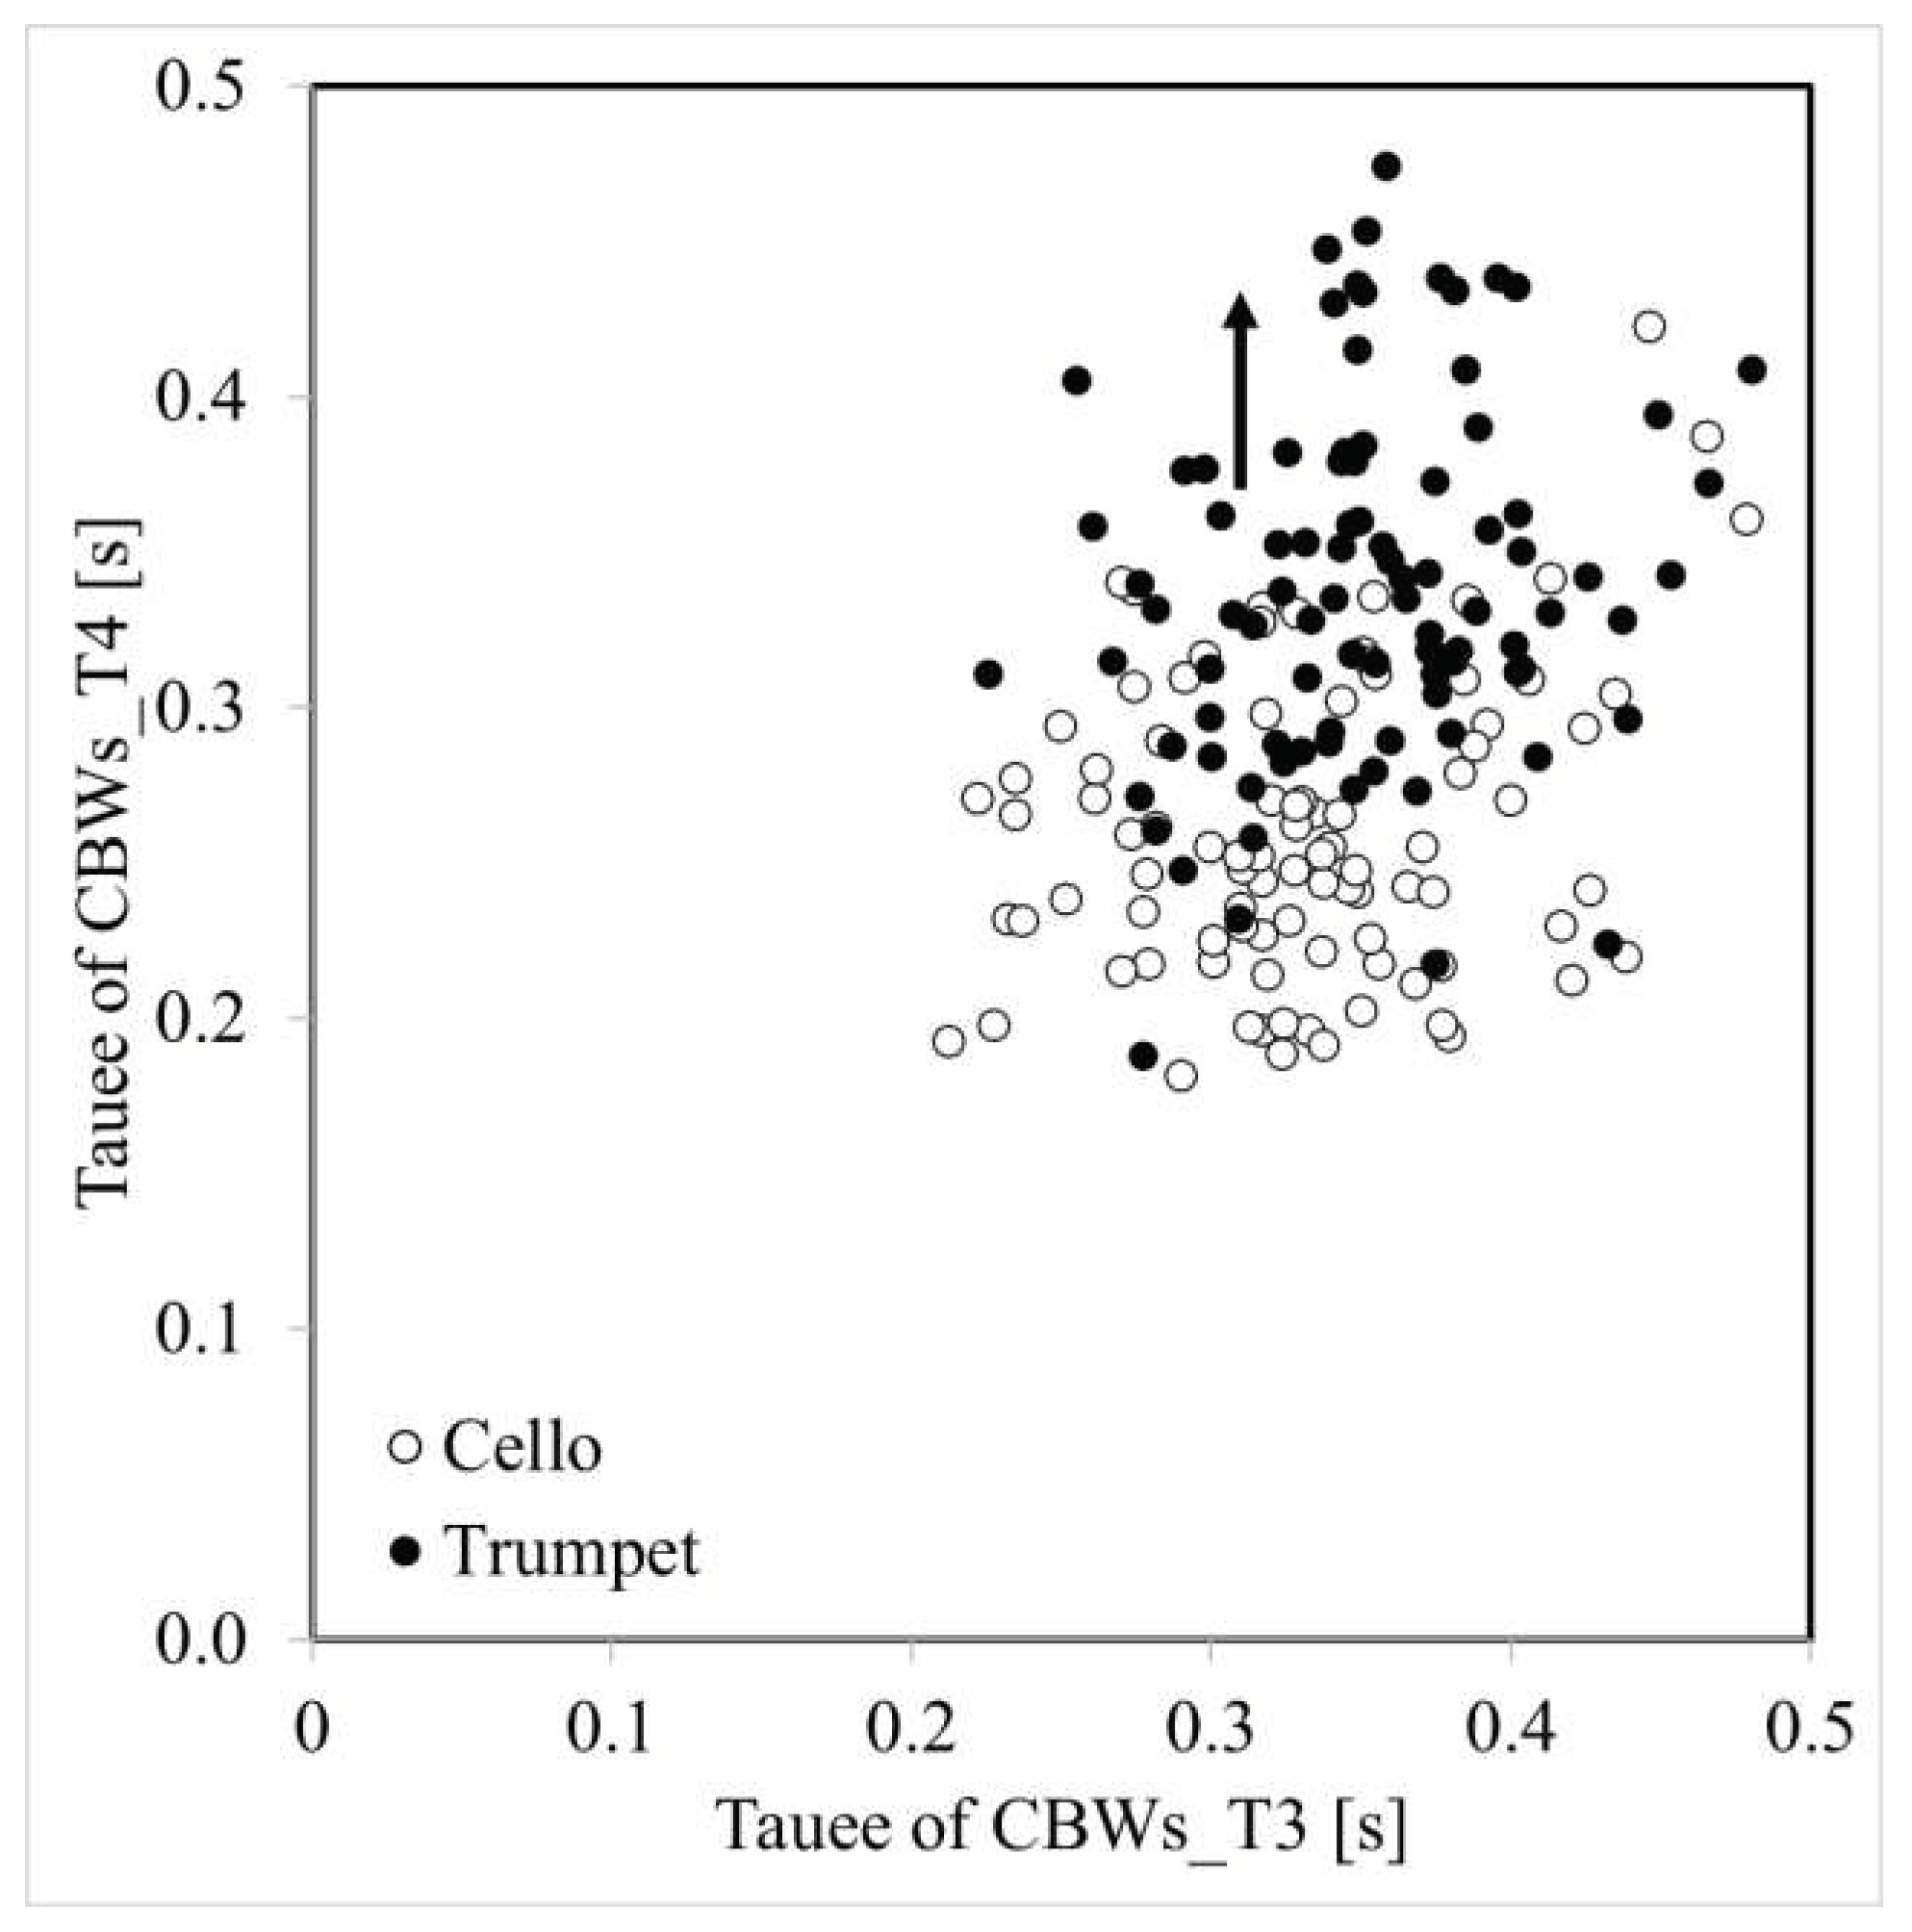
Figure 10, the τe_min of the ACF of two instrumental source pieces are evidently functioning with the coordinative beginning point between the subjective ITDG’s “different” decision-making process, and the τe of the ACF of brainwaves in the alpha range under varying sound field ITDGs in the left and right hemispheres. The coordination period here are indicated by the phenomena shown in
Figure 8 and are related to the short-term τe values of the ACF of music signals in a room [
28] for a duration at least 10 ms. These coordinative characteristics were confirmed at both hemispheres with a constant delay of 31 ms for the cello piece and 23 ms for the trumpet piece. Therefore, the slope (0.76) in
Figure 10 denotes the difference between two instrumental timbres for continuous variation of ITDG sensation in a room, and the function between the τe of the ACF of brainwaves in the alpha range with respect to two instruments (cross axle) shows linear correlation with τe_min of the two musical dry sources.
As stated above, the coordinative characteristics between a subjective decision-making process and brainwave activities are obviously functioning with the τe of ACF of the instrumental source pieces in both hemispheres (
Figure 10). The T4 (right hemisphere) responses in brain began coordinating in front of the T3 (left hemisphere) under the varying ITDG for both instrumental pieces along the way. This was not associated with hemispheric specialization in the brain, and this effect is believed to be due to the temporal effect of ITDG sensation in a room that dominates over the left hemisphere. The present findings reconfirm a conventional study, which found the temporal effect of word intelligibility over the left hemisphere dominated over phonic signals, and ASW affects both left and right spatial consciousness as subjects focus on the variation of ASWs using pure tone (2 kHz) [
2]. Based on functional Doppler ultrasonography on MRI as a method to detect brain activity patterns, Floel, Jansen, Deppe, et al. [
39] confirmed an atypical hemispheric dominance for visuospatial attention and language. In addition, they found that subjects with an inverted lateralization of language and spatial attention (language right, attention left) recruited left-hemispheric areas during the attention task, homotopic to the areas recruited by control subjects (right-handed subjects) in the right hemisphere. In subjects with lateralization of both language and attention to the right hemisphere, an attentional network was activated in the right hemisphere that was comparable to that of control subjects. Based on their findings, hemispheric dominance of neural processes underlying language and attention is determined not by hemispheric side, but by the intra-hemispheric pattern of activation. Decision-making in the ITDG room is a perceptual discrimination exercise. Responses in the brain are longer than one minute, and the signal information is recruited to the corpus callosum by the auditory nerve and feed backed.
Figure 10.
Illustration of the coordination points between the subjective ITDG’s “different” decision-making process, with the τe of the ACF of brainwaves in the alpha range for cello and trumpet were presented under continuous varying ITDG between the left and right hemispheres. These coordinative characteristics are obviously functioning with the τe(min) of ACF of the instrumental source pieces.
4.3. JND of ITDG in concert hall
Even though ISO3382-1 [
20] has announced the JNDs of the physical factors of a concert hall, and Okano [
31] has reported that the JNDs in sound fields of concert halls is caused by intensity variations in early reflections, ITDG cognition remains sensitive on account of the sound field structure. Even though Ando [
16] reported that the ITDG factor is independent of reverberation time, sound strength (G) and IACC, Bech [
38] reported that the JND of ITDG varies with the instrumental timbre for the temporal structure of a source signal. We carefully carried out the initial estimation on JND of ITDG through two simulated source signals. Nevertheless, the IDTG model (
Figure 4) fluttered as an exponential function in a transfer response function of the neurodynamical mechanisms. The computational principles underlying the decision-making processes did resemble the conclusions in the vibrotactile discrimination task argued by Deco et al. [
7]. The function of
JNDC on ITDG in a model that varies by the characteristics of source signal is shown below:
where A denotes the characteristics of simulated source signals. Here, A is 0.284 for a trumpet and 0.249 for a cello. In addition, the value of W_
IACC listed in
Table 1 for two instrumental pieces is inversely proportional to A as well. Hence, Equation 2 can be transformed to:
where
k is a constant in the relationship of W_
IACC in concert hall, and k ≈ 3.55 for the experimental conditions of trumpet and cello in this study.
If the W_
IACC value of the source in a concert hall is an effective variable of the ITDG, then this explains why the T4 (right hemisphere) responses in brain had coordinated at the beginning in front of the T3 (left hemisphere) responses on the varying ITDGs for both instrumental pieces along the way (
Figure 8). Fujii et al. [
40] proposed that the W_
IACC value of the source in a concert hall is dominated in the right hemisphere, which is specialized as a spatial factor in a concert hall.
Finally, an initial measure of the subjective JND of ITDG in a room is related to the value of W_
IACC of IACF, the characteristics of source signal themselves. Okano [
31] reported that the ASW and loudness in a room are more sensitive to changes in the levels of early reflections. The ASW is dominated by the W_
IACC of IACF, as reported by Nakajima et al. [
37]. The fluctuation of the CBWs in the alpha range derived from the scalp using the T3 and T4 electrodes was analyzed by autocorrelation technology for detecting the activities of potential in auditory neurological mechanism that correspond to repeatedly varying ITDGs in a sound field. Although the results of minimum value of the effective delay time (τe_min) of the ACF of CBWs are unspecified to the concept of “difference” in the JND process, they resulted in a fixed and continuous phase ratio ((τe_minR - τe_minF)/ τe_minF) that is equal to 0.4 at T3 as music simulated by trumpet recital (
Figure 7).
5. Conclusions
As observing the step varying ITDG for the subjective JNDc and τe values of ACF of CBWs in the alpha range, a homologous period of resonance (duration longer than 10 ms) was found between both simulated instrumental tracks. The resonance correlated well with the short-term τe_min value of the ACF of the signal sources. In addition, the JND of ITDG of a concert hall corresponding to the brain is rarely studied and discussed. Weber’s law enables us to detect the decision-making processes that take place in a simple single reflection in a room or an echo cognition on a temporal and spatial specification. Two room models are clearly discriminated in both the subjective and neurological correspondences owing to the coordinative point in the judging processes. An unexpected finding is the effective variable of the spatial auditory advanced in responses along the way, since the coordinative point was superior on the left hemisphere.
A long-term ITDG decision-making process activated significant neuron activity in both hemispheres, according to hemispheric dominance. The running minimum τe value for the trumpet music piece resulted in a fixed and continuous phase ratio on the left hemisphere and was prolonged (p < 0.01) on the right hemisphere simultaneously. Hemispheric specificities are synchronic, but the pattern is different between the two hemispheres.
Author Contributions
Chen, C. Y.; conceptualization, methodology, coding, validation, formal analysis, investigation, data curation, writing—original draft preparation, visualization, conceptualization, resources, writing—review and editing, supervision, funding acquisition, project administration. Author has read and agreed to the published version of the manuscript.
Funding
This research was funded by National Science and Technology Council, Taiwan, for their one-year period of financial support to complete this research, grant number NSC 107-2221-E-324-006 in 2018.
Data Availability Statement
The data presented in this study are available on request from the corresponding author. The data are not publicly available due to their source being from commercial product design.
Acknowledgments
It is with great gratitude that I thank the many people who have provided me with assistance in preparing this study in various ways. I would like to express my deepest gratitude to Mr. Wu, M. S., who assisted me in conducting subjective JND experiments as well as recording CBWs on my research, along with the participants present in JND judgements. The participants are grade two students from the architecture department at Chaoyang University of Technology.
Conflicts of Interest
The author declares no conflict of interest. The funder had no role in the design of the study; in the collection, analyses, or interpretation of data; in the writing of the manuscript; or in the decision to publish the results.
Abbreviations
The following abbreviations are used in this manuscript:
| ITDG |
initial time delay gap |
| JND |
just noticeable difference |
| ACF |
autocorrelation function |
| NACF |
normalized ACF |
| IACF |
interaural cross-correlation function |
| CBW |
continuous brainwaves |
| AEP |
auditory evoked potential |
| SVR |
slow vertex response |
| EEG |
electroencephalography |
| ASW |
apparent source width |
| IACC |
gratitude of interaural cross-correlation function |
References
- Chen, C. Y., “Study of relationship between spatial word difficulty and phonic autocorrelation,” Journal of Taiwan Acoustic Society, Vol.20, 2017; pp. 1-12. (ISSN 1027-7722) (in Chinese).
- Hatzopoulos, S., “The Human Auditory System - Basic Features and Updates on Audiological Diagnosis and Therapy,” InTech, 32 London Bridge Street, London, United Kingdom, SE1 9SG. Chapter 2, 2020; pp. 35-50. [CrossRef]
- Chen, C. Y. and Chen, U. S., “Study of relationship between speech intelligibility and cortical continuous brainwaves in room,” Proceeding, of Taiwan Acoustic Society, G106, 2009. (ISBN 978-986-7980-17-5) (in Chinese).
- Chen, C. Y. and Ando, Y., “Relationship between subjective preference and the autocorrelation function of left and right cortical α-waves responding to the noise-burst tempo,” J. Archi. Plann. Environ. Engng., AIJ., Vol. 62, No.497, 1997; pp. 67-74. [CrossRef]
- Chen, C. Y. and Ando, Y., “On the relationship between the autocorrelation function of the α-waves on the left and right hemispheres and subjective preference for the reverberation time of music sound field,” J.Archi. Plann. Environ. Engng., AIJ,, Vol. 61, No. 489, 1996; pp. 73-80. [CrossRef]
- Ando, Y. and Chen, C. Y., “On the analysis of autocorrelation function of α-waves on the left and right cerebral hemispheres in relation to the delay time of single sound reflection, “ J. Archi. Plann. Environ. Engng. AIJ., Vol. 61, No.488, 1996; pp. 67-73. [CrossRef]
- Deco, G., Scarano, L., and Soto-Faraco, S., “Weber’s law in decision making: integrating behavioral data in humans with a neurophysiological model,” The Journal of Neuroscience, 27(42), 2007; pp. 11192–11200. [CrossRef]
- Michelini, S., Arslan, E., Prosser and S., Pedrielli, F., “Logarithmic display of auditory evoked potentials,” Journal of Biomedical Engineering, Vol. 4 (1), 1982; pp. 62-64. [CrossRef]
- Ichikawa, G., “Continuity of Auditory Evoked Responses,” International Journal of Practical Otolaryngology: Vol. 8, 1993; pp. 1077-1085. (in Japanese). [CrossRef]
- Moriyama, T. and Miyagaya, T., “Transient Response of Human Brain,” The Institute of Electronics, Info. and Comm. Engi., Technical Report of IEICE, MBE-38, 2003. [CrossRef]
- Soeta, Y., Nakagawa, S., Tonoike, M. and Ando, Y., “Magnetoencephalographic responses correspond to individual annoyance of bandpass noise”, Journal of Sound and Vibration, Vol. 277 (3), 2004; pp. 479-489. [CrossRef]
- Ando. Y., “Evoked Potentials Relating to the Subjective Preference of Sound Fields,” Acoutica, Vol. 76 (6), 1992; pp. 292 - 296. (https://www.ingentaconnect.com/contentone/dav/aaua/1992/00000076/00000006/art00006#).
- Ando, Y., Kang, S. H., & Nagamatsu, H., “On the Auditory-Evoked Potential in Relation to the IACC of Sound Field,” J. Acoust. Soc. Jpn. (E), Vol. 8 (5), 1987; pp. 183-190. [CrossRef]
- Ando, Y., Kang, S. H., & Morita, K., “On the Relationship between Auditory-Evoked Potential and Subjective Preference for Sound Field,” J. Acoust. Soc. Jpn. (E), Vol. 8 (5), 1987; pp. 197-204. [CrossRef]
- Fechner, G., Elements of psychophysics, New York: Rinehart and Winston (1966).
- Laming, D., “Precise of Sensory Analysis,” Behavioral and Brain Sciences, Vol. 11 (2), 1998; pp. 275-296. [CrossRef]
- Ando, Y., Architectural Acoustics, Blending Sound Sources, Sound Fields, and Listeners, Springer- Verlag, 1996.
- Romo R, Hernandez A, Zainos A., “Neuronal correlates of a perceptual decision in ventral premotor cortex,” Neuron 41 (1), 2004; pp. 165–173. [CrossRef]
- ISO 3382-1 :2009 Acoustics — Measurement of room acoustic parameters — Part 1: Performance spaces.
- Martellotta, F., “The just noticeable difference of center time and clarity index in large reverberant spaces, “J Acoust Soc Am 128 (2), 2010; pp. 654–663. [CrossRef]
- Schenk V., Schenková Z., “Model of earthquake occurrences and its autocorrelation function in the prediction of seismic activity,” Proceedings of Symposium on the analysis of seismicity and on seismic risk, Liblice, 17-22 Oct., 1977; pp. 359-372. (ResearchGate).
- Rajabi N., Rajabi O., “Real time earthquake prediction using cross-correlation analysis & transfer function model,” 2nd International Conference on Knowledge-Based Engineering and Innovation (KBEI), Tehran, Iran, 5-6 Nov., 2015; pp. 238 – 242. (IEEE Xplore).
- Sokolov V., Wenzel F., Jean W. Y., and Wen K. L., Uncertainty and Spatial Correlation of Earthquake Ground Motion in Taiwan, Terr. Atmos. Ocean. Sci., Vol. 21, No. 6, 2010; pp. 905-921. [CrossRef]
- Chen, C. Y., “Characterizing Subjective Noisiness in Hospital Lobbies,” Archives of Acoustics, 40 (2), 2015; pp. 235-246. [CrossRef]
- Reichardt, W., Schmidt, W., “The audible steps of spatial impression in music performances.” Acustica Vol. 17 (3), 1966; pp. 175 - 179. (https://www.ingentaconnect.com/content/dav/aaua/1966/00000017/00000003/art00009).
- Reichardt, W., Schmidt, W., “The detectability of changes in sound field parameters for music. “Acustica Vol. 18 (5), 1967; pp. 275-282. (https://www.ingentaconnect.com/content/dav/aaua/1967/00000018/00000005/art00005).
- Ando, Y, “Subjective preference in relation to objective parameters of music sounds fields with a single echo.” J. Acoust. Soc. Amer. 62, 1977; pp. 1436-1441. [CrossRef]
- Ando, Y, Gottlob, D., “Effects of early multiple reflections on subjective preference judgements on music sound fields.” Letters to the editor. J. Acoust. Soc. Amer. 65, 1979; pp. 524-527. [CrossRef]
- Blauert, X, Lindemann, W., “Auditory spaciousness: some further psychoacoustical analyses. “ J. Acoust. Soc. Amer. 80 (2), 1986; pp. 533-542. [CrossRef]
- Niaounakis, T. I. and Davies, W. J., “Perception of reverberation time in small listening rooms,” J. Audio Eng. Soc. 50 (5), 2002; pp. 343–350. (https://www.aes.org/journal/online/JAES_V50/5/).
- Okano, T., “Judgments of noticeable differences in sound fields of concert halls caused by intensity variations in early reflections,” J. Acoust. Soc. Am. 111 (1), 2002; pp. 217–229. [CrossRef]
- Ando, Y, “Subjective preference in relation to objective parameters of music sound field with a single echo, “J. Acoust. Soc. Am. 62, 1977; pp. 1436–1441. [CrossRef]
- Lindsley, D. B., “Psychological Phenomena and the Electroencephalogram,” Electroenceph. Clin. Neurophysiol., Vol. 4 (4), 1952; pp. 443 - 456. [CrossRef]
- Klem, G., Lüders, H. Jasper, H. and Elger, C., “The ten-twenty electrode system of the International Federation. The International Federation of Clinical Neurophysiology,” Electroenceph. Clin. Neurophysiol. Suppl., 52, 1999; pp. 3 - 6.
- Munday, J., “ Instrumentation and electrode placement,” Respir Care Clin N Am. Dec;11(4), 2005; pp. 605-15, viii. [CrossRef]
- Praetorius, H. M., Bodenstein, G., & Creutzfeldt, O. D., “Adaptive Segmentation of EEG Records: A New Approach to Automatic EEG Analysis,” Electro. & Clin. Neuro., 42, 1977; pp. 84-94. [CrossRef]
- Nakajima, T., Yoshida, J., and Ando, Y., “A simple method of calculating the interaural cross-correlation function for a sound field, “J. Acoust. Soc. Am. 93, 1993; pp. 885–891. [CrossRef]
- Bech, S., “Timbral aspects of reproduced sound in small rooms. II,” J. Acoust. Soc. Am. 99 (6), June, 1996; pp. 3539-3549. [CrossRef]
- Floel, A., Jansen, A., Deppe M, et al., “Atypical hemispheric dominance for attention: functional MRI topography[J].” J. Cerebral Blood Flow & Metabolism, 25, 2005; pp. 1197-1208. [CrossRef]
- Fujii, K., Hotehama, T., Kato, K., Shimokura, R., Okamoto, Y., Suzumura, Y. and Ando, Y., “Spatial Distribution of Acoustical Parameters in Concert Halls: Comparison of Different Scattered Reflections,” Journal of Temporal Design in Architecture and the Environment, Vol. 4; No.1, 2004; pp. 59-68. (http://jtdweb.org/).
|
Disclaimer/Publisher’s Note: The statements, opinions and data contained in all publications are solely those of the individual author(s) and contributor(s) and not of MDPI and/or the editor(s). MDPI and/or the editor(s) disclaim responsibility for any injury to people or property resulting from any ideas, methods, instructions or products referred to in the content. |
© 2023 by the authors. Licensee MDPI, Basel, Switzerland. This article is an open access article distributed under the terms and conditions of the Creative Commons Attribution (CC BY) license (http://creativecommons.org/licenses/by/4.0/).


