1. Introduction
Boron carbide is one of the technically most important boron-rich solids. Outstanding properties like low density (2.52 g/cm³), high melting point (T
m ~ 2700 K) and extreme hardness (~40000 MPa) predestine boron carbide for application under conditions which are inaccessible for most other materials. Therefore, it is one of the best-investigated boron-rich solids, whose structures are based on B
12 or related icosahedra. Complexity of structure and extraordinary electronic properties related have attracted attention. Regarding technical application, boron carbide is the most important boron-rich material at all. Since the sixties of last century hardness and chemical stability have been utilized in powders for grinding and polishing, in nozzles for sand blasting and in mortars (see A. Lipp [
1]). Meanwhile, high-temperature ceramics and lightweight armoring of objects and persons have become important. High neutron absorption of the
10B isotope allows application for neutron shielding and control rods in nuclear devices. Domnich et al. [
2] reviewed such application. In general, due to its extraordinary properties, boron carbide is highly promising for application under extreme conditions, like high temperatures, mechanical or chemical burdens. Mostly in such applications, details of the complex crystalline structure of boron carbide like the distribution of C atoms are of subordinate significance.
This does not apply in the case of the electronic properties. Optical appearance and electronic transport properties characterize boron carbide clearly as a p-type semiconductor (see [
3,
4]). However, untypical behavior indicates strong impact of structural defects. The high Seebeck coefficient (S ~ 300 mVK
-1 up to at least 2000 K) is a promising potential for direct thermoelectric energy conversion (see [
5]).
At least concerning details, the crystalline structure of boron carbide has not yet been finally determined. The formerly frequently and even currently occasionally assumed representative compound B
4C (structure formula (B
11C) CBC) does not exist in reality. B
4.3C is the real compound achieved in commercially produced boron carbide [
6,
7] and in single crystals as well [
8]. If B
4C is obtained, excess carbon is precipitated in the structure, typically in the form of graphitic layers [
9,
10]. Unlike B
4.3C at the carbon-rich limit, the boron-rich limit of the homogeneity range is less well defined. Few samples, whose C content was clearly below B
11C, were unambiguously characterized as boron carbide, albeit with large error margin of lattice parameters (see [
14] and references cited therein). Otherwise β-rhombohedral boron with clearly higher C content has been obtained (see [
11] and references cited therein). Therefore, coexistence of both structures in a certain range cannot be excluded. Theoretical studies claim the structure model (B
12) CBC to be the energetically most favorable, while various experiments have proved this compound to be the most distorted one in the whole homogeneity range (see ref. [
3]).
Phase transitions, structural changes related and their effect on some other solid-state properties are object of this paper.
2. Structure
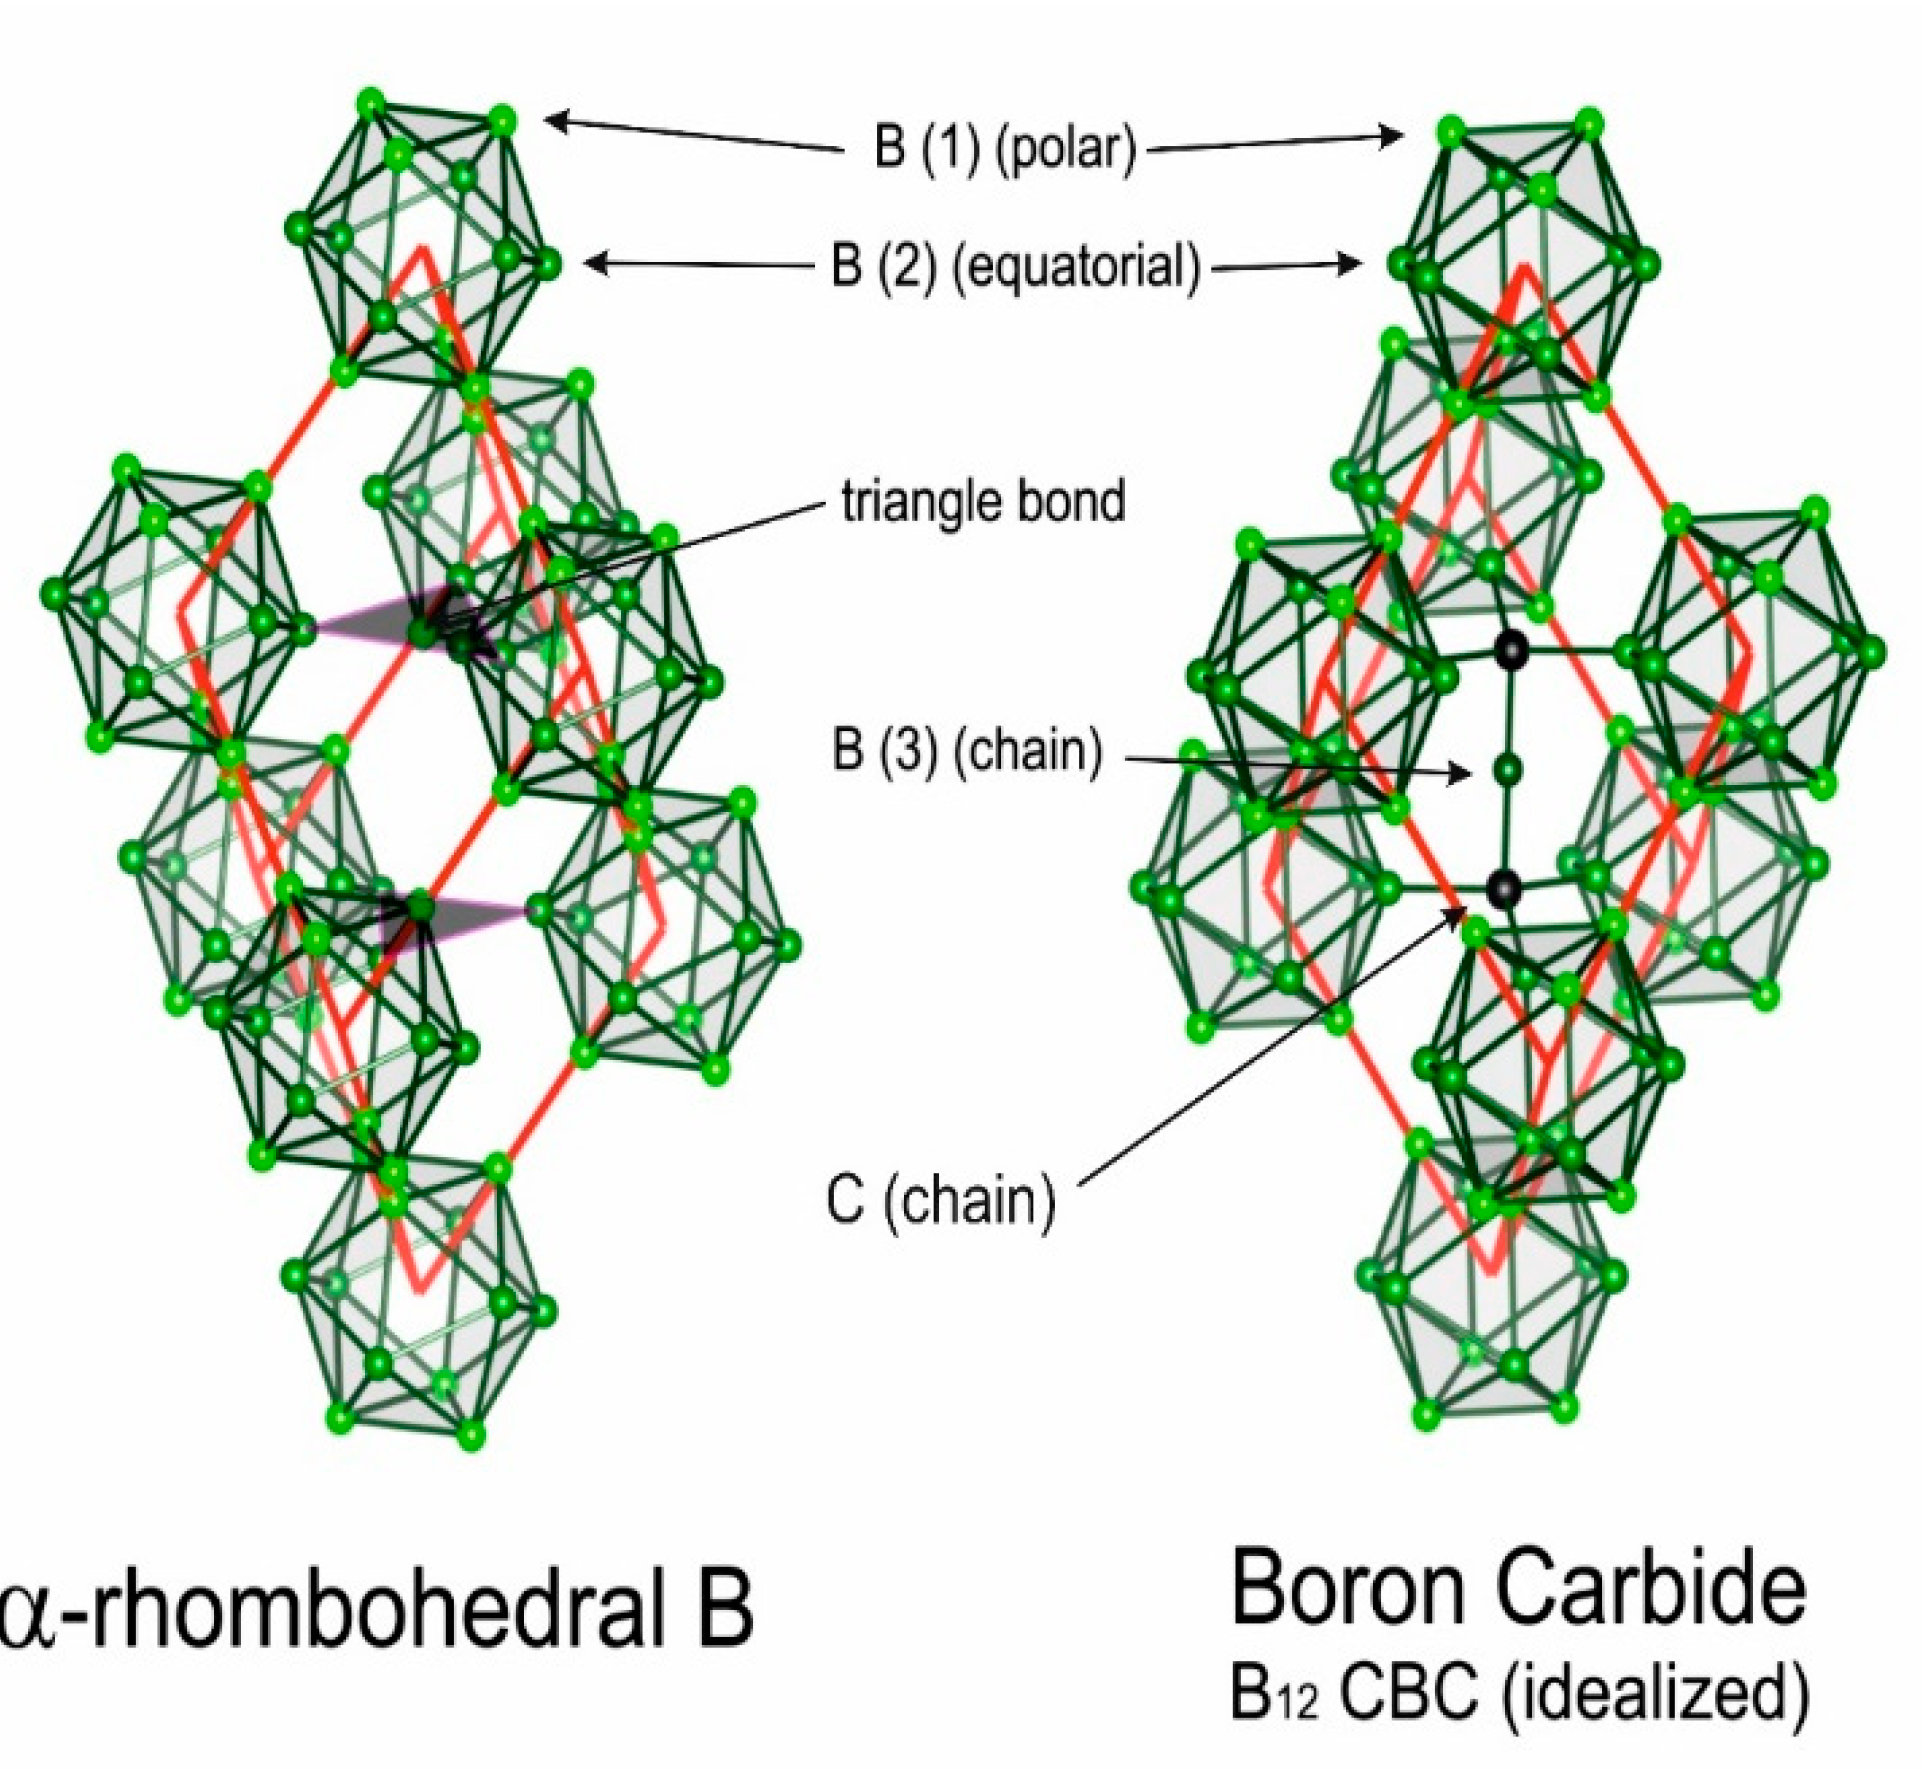
Figure 1 [
12] shows the rhombohedral unit cells of α-rhombohedral (α-rh. B; idealized structure formula B
12) boron and boron carbide (idealized structure formula (B
12) CBC and (B
11C) CBC) respectively. The actual structures differ more or less decisively. In α-rh. Boron, IR phonon spectra suggest the existence of additional single B atoms [
13]. In boron carbide, whose homogeneity range extends from B
4.3C at the carbon-rich to about B
11C at the boron-rich limit, high-density structural defects have been identified and impact the electronic properties decisively [
14,
15].
The defects in boron carbide are mainly formed by the exchange of B and C atoms on regular sites or of minor concentrations of unoccupied sites. X-ray diffraction averaging larger volumes yields the basic parameters of boron carbide reliably, but it is largely unsuitable to analyze individual compositions of the components. Due to the similar X-ray scattering cross sections of 10B, 11B and 12C isotopes, the capability of X-ray fine structure investigation is significantly restricted. Phonon spectroscopy helps closing this gap.
Helpful in this respect is the comparison of the spectra of IR- and Raman-active phonons with those of α-rhombohedral boron having the same icosahedral structure, however without C atoms on polar sites of the icosahedron and without CBC or these replacing other structure elements.
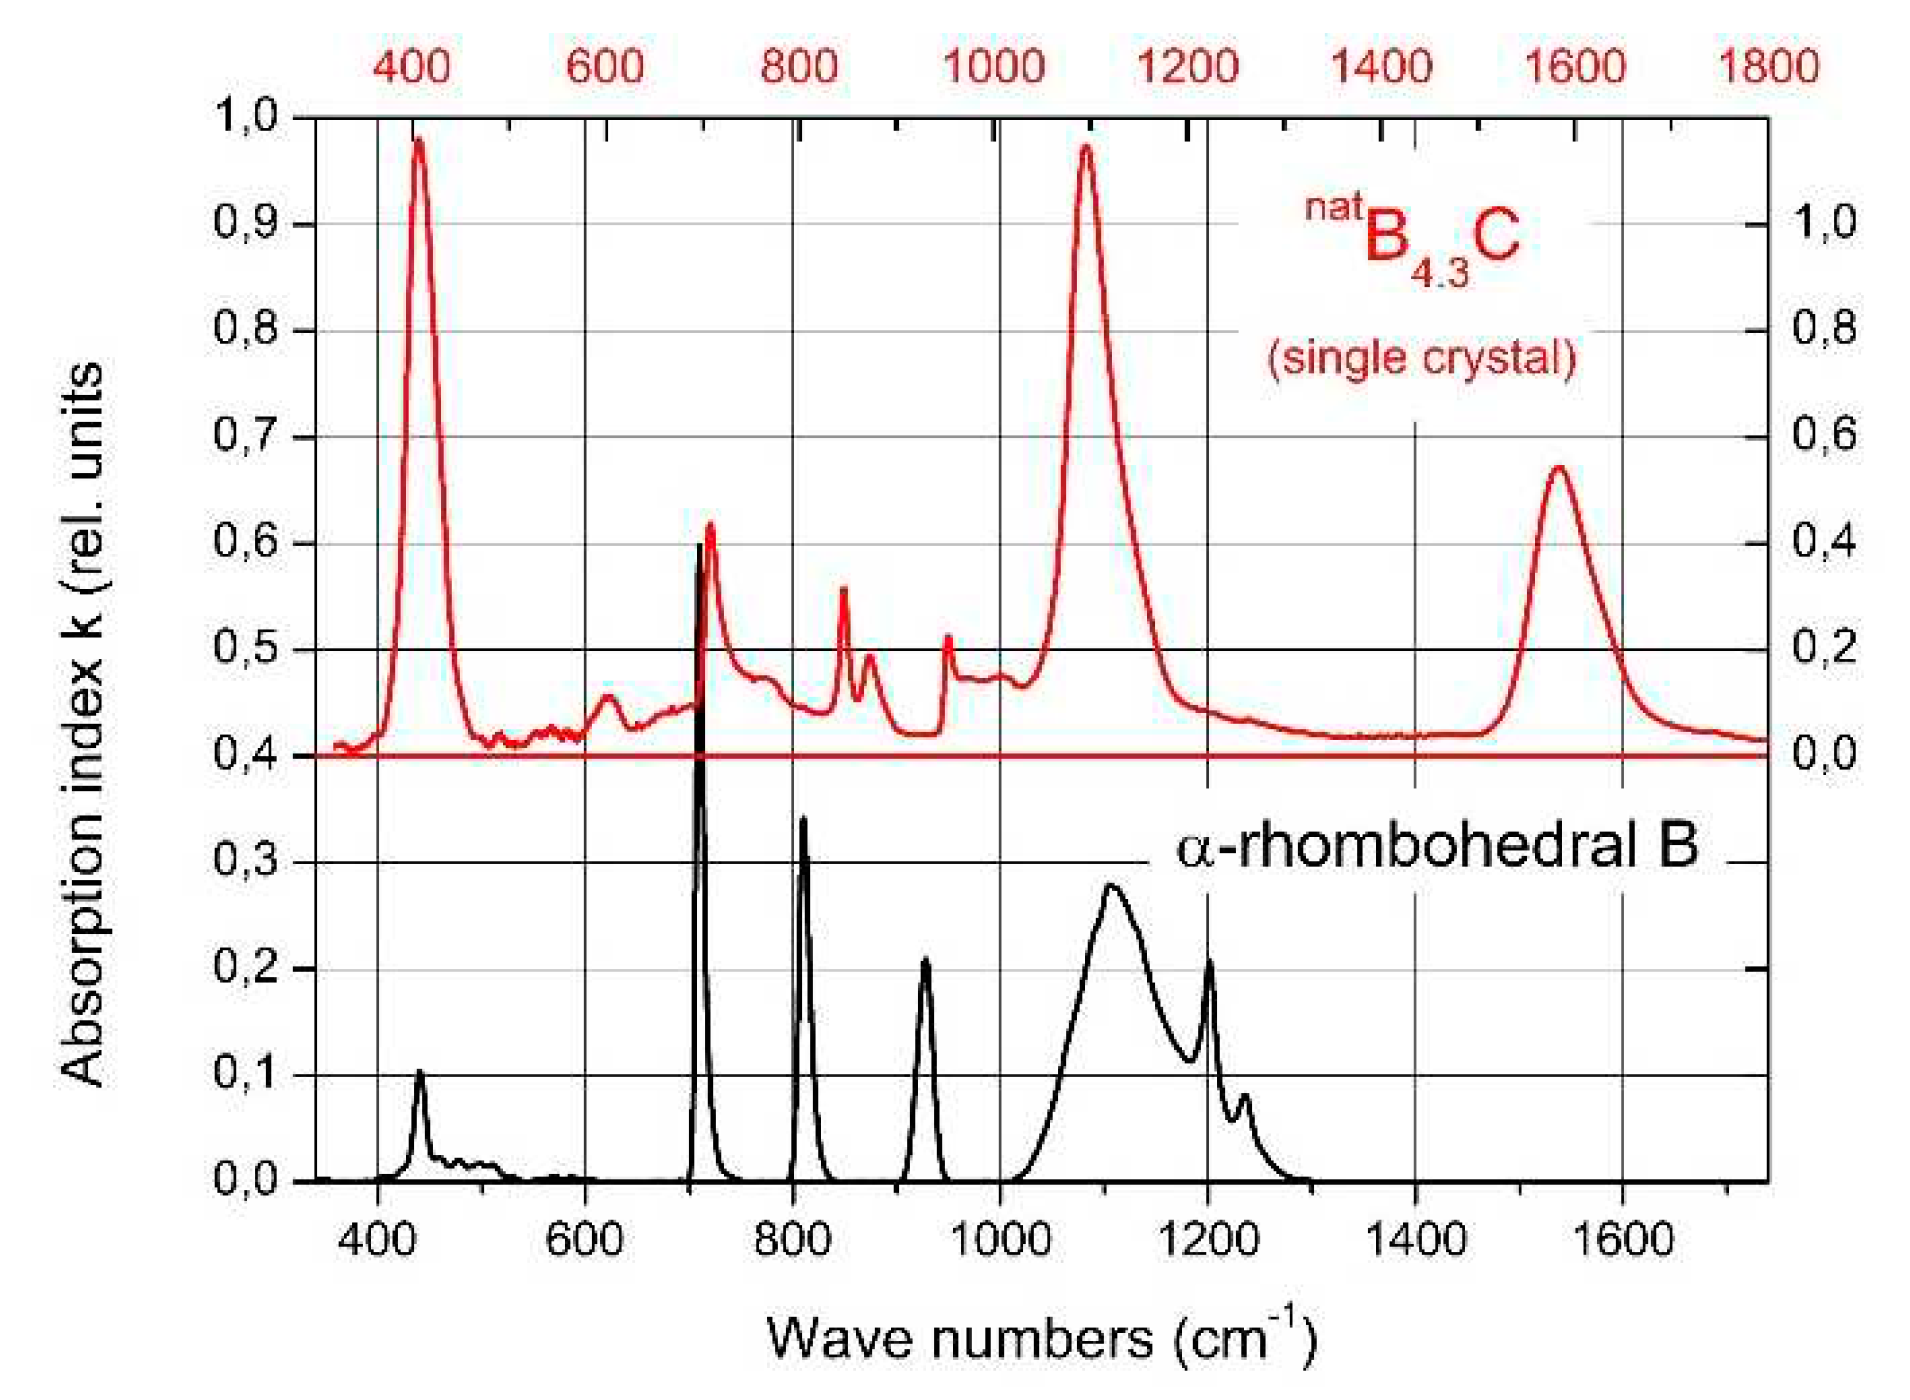
Figure 2 compares the IR-phonon spectra of single crystal
natB
4.3C boron carbide and α-rhombohedral boron (for according comparison of Raman spectra see Refs. [
16,
17,
18]). The spectrum of α-rhombohedral B was discussed in ref. [
19]. A detailed theoretical description was performed by Beckel et al. [
20]. The spectra of boron carbide were analyzed by Werheit et al. (see Refs. [
13,
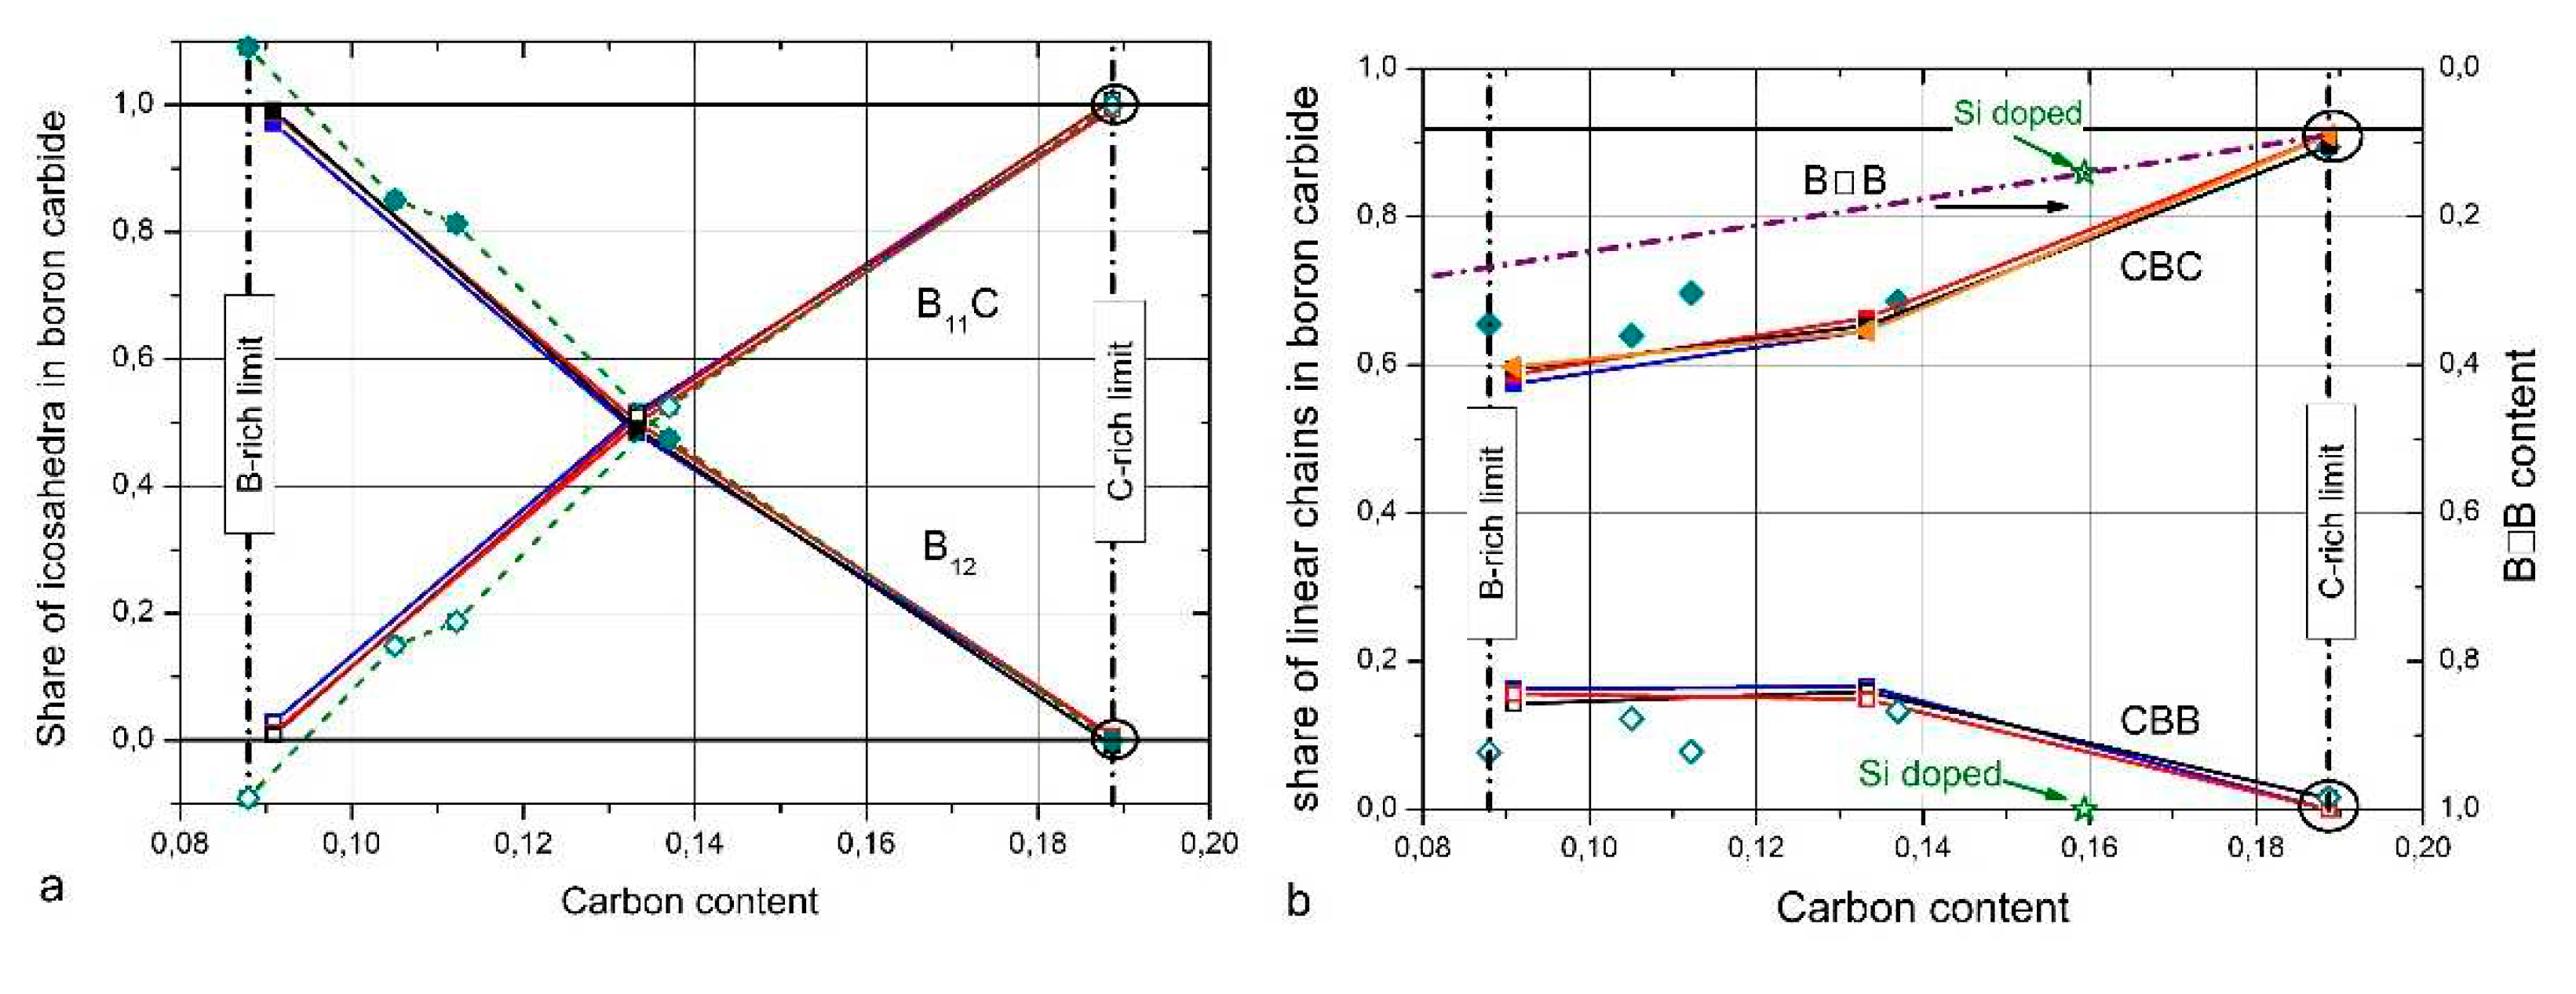
21] and references cited therein). The concentration of structure elements depending on the C content is shown in
Figure 3. Changes of some icosahedral vibrations in boron carbide in connection with phase transitions are discussed below.
The existence of following defects in the structure in the form of deviations from the idealized structure formulas are generally confirmed:
C atom replacing B(1) in (B11C) CBC; that means one of the six B atoms on polar sites of the icosahedra is replaced by a C atom. The distribution of these C atoms is object of current investigation).
Carbon-rich limit of the homogeneity range: B
4.3C (instead of B
4C, formerly assumed to be the actual compound of boron carbide) [
6,
7,
14]. Hence the real structure contains 5.7 at. % structural defects compared with the idealized (B
11C) CBC structure. This applies also for high-quality single crystals, whose preparation is only possible in the chemical composition B
4.3C [
8] and for single crystals growing accidentally in industrial production.
Vacancies of the B(3) site (9 – 28 %, depending on composition) (see [
14] and references cited therein).
CBB chains replacing CBC towards boron-rich boron carbides (
Figure 3b, see [
14] and references cited therein)
B
4.3C is the least distorted compound at all [
14,
21]. It does not contain any free carbon, as for example systematically checked by Schwetz et al. [
7,
22] using a wet-chemical analysis for determining free and bound carbon in boron carbide separately. B
4.3C is the only compound allowing to prepare high-quality single crystals [
8].
Theoretical model calculations determined the idealized structure formula (B
12) CBC of the compound B
13C
2 as the energetically most favorable [
23,
24]. In fact, B
13C
2 is the most distorted boron carbide at all. Its highly complex structure (B
12)
0.5(B
11C)
0.5 • (CBC)
0.65(CBB)
0.16(BB)
0.19 shows that about 80% of the unit cells contain any kind of structural defect [
4,
25,
26]. High concentrations of structural defects (with regard to idealized structures) are a generic property of boron carbide. structure.
The shares of structure elements in the unit cell depending on carbon content in
Figure 3 [
14] results preferably from the investigation of IR- and Raman-active phonons. The comparably low share of B☐B chains (☐, vacancy) has not been measured but is used to close the gap between the sum of atoms in the other structure elements determined and the chemical composition. TEM studies by Rasim et al. [
27] suggest that a variety of further kinds of structural elements can replace the CBC chain. However, apart from this TEM study, there is no further experimental evidence. Therefore, it cannot be excluded, that such structural elements are provoked by the preparation process of the sample.
Many theoretical studies on structural details in boron carbide are based on Raman studies, which are affected by a severe systematic experimental error [
16]. In cases of high Raman excitation energy, the spectra do not reflect bulk properties. Hence the results of accordingly performed calculations merely end in itself and do not yield scientific progress (see for example the controversial discussions in [
28] and [
29], [
30] and [
31], [
32] and [
33]).
3. Electronic structure of B4.3C at ambient conditions
Due to the availability of material, previous experimental studies of electronic properties are mainly restricted to polycrystalline boron carbide and especially to the compound B
4.3C. This also applies when the compound is nominally designed as B
4C, as this is in reality B
4.3C with excess carbon typically distributed in the form of graphitic layers [
10,
22]. High quality B
4.3C single crystals were used in references [
8,
34,
56].
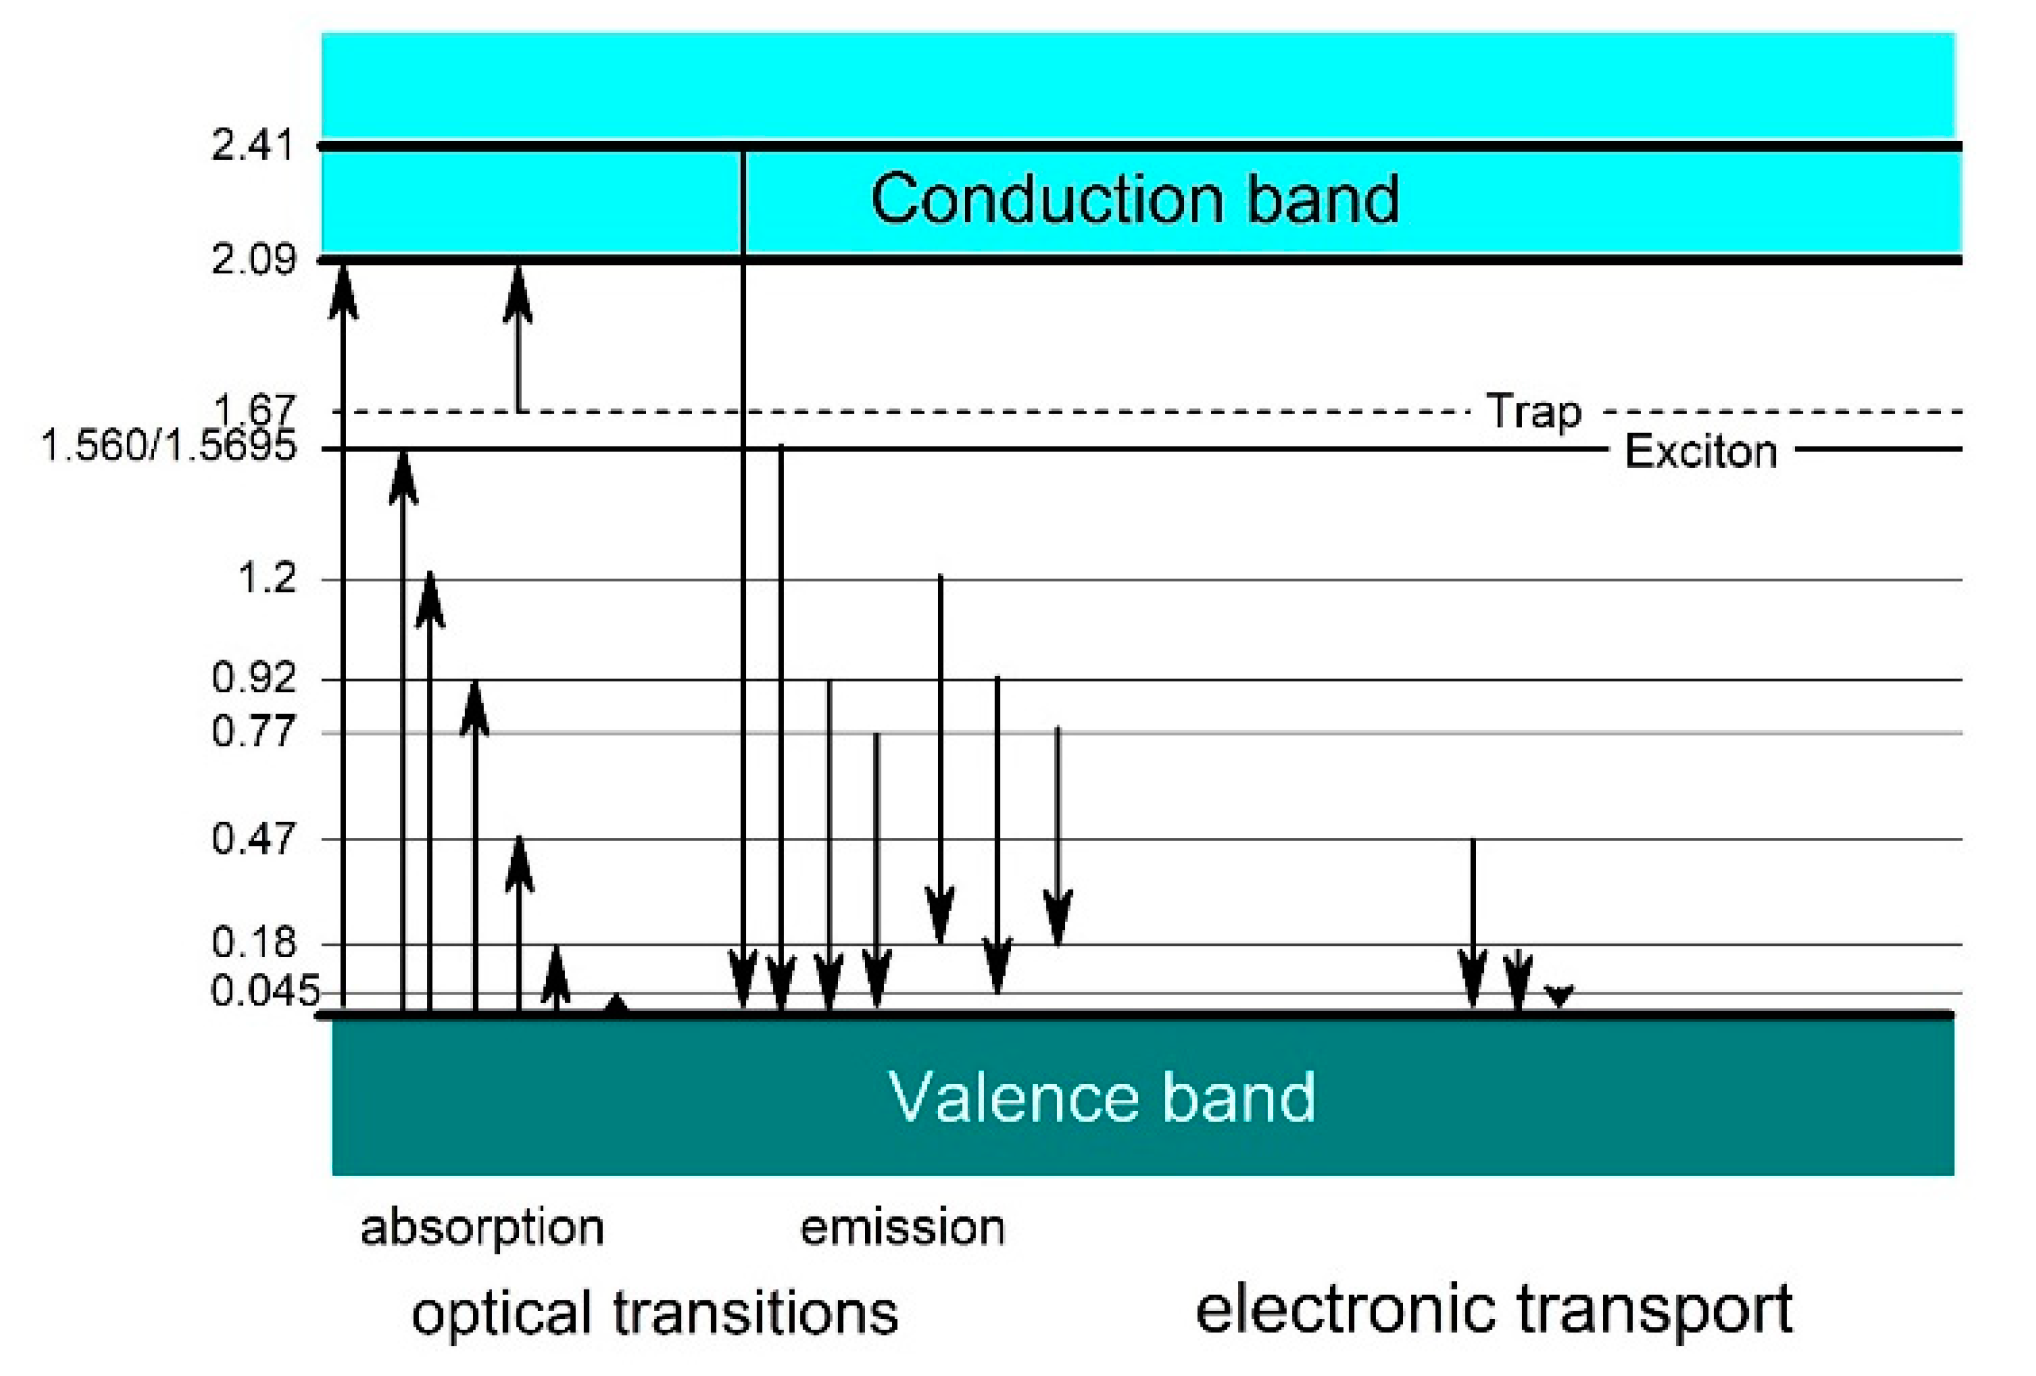
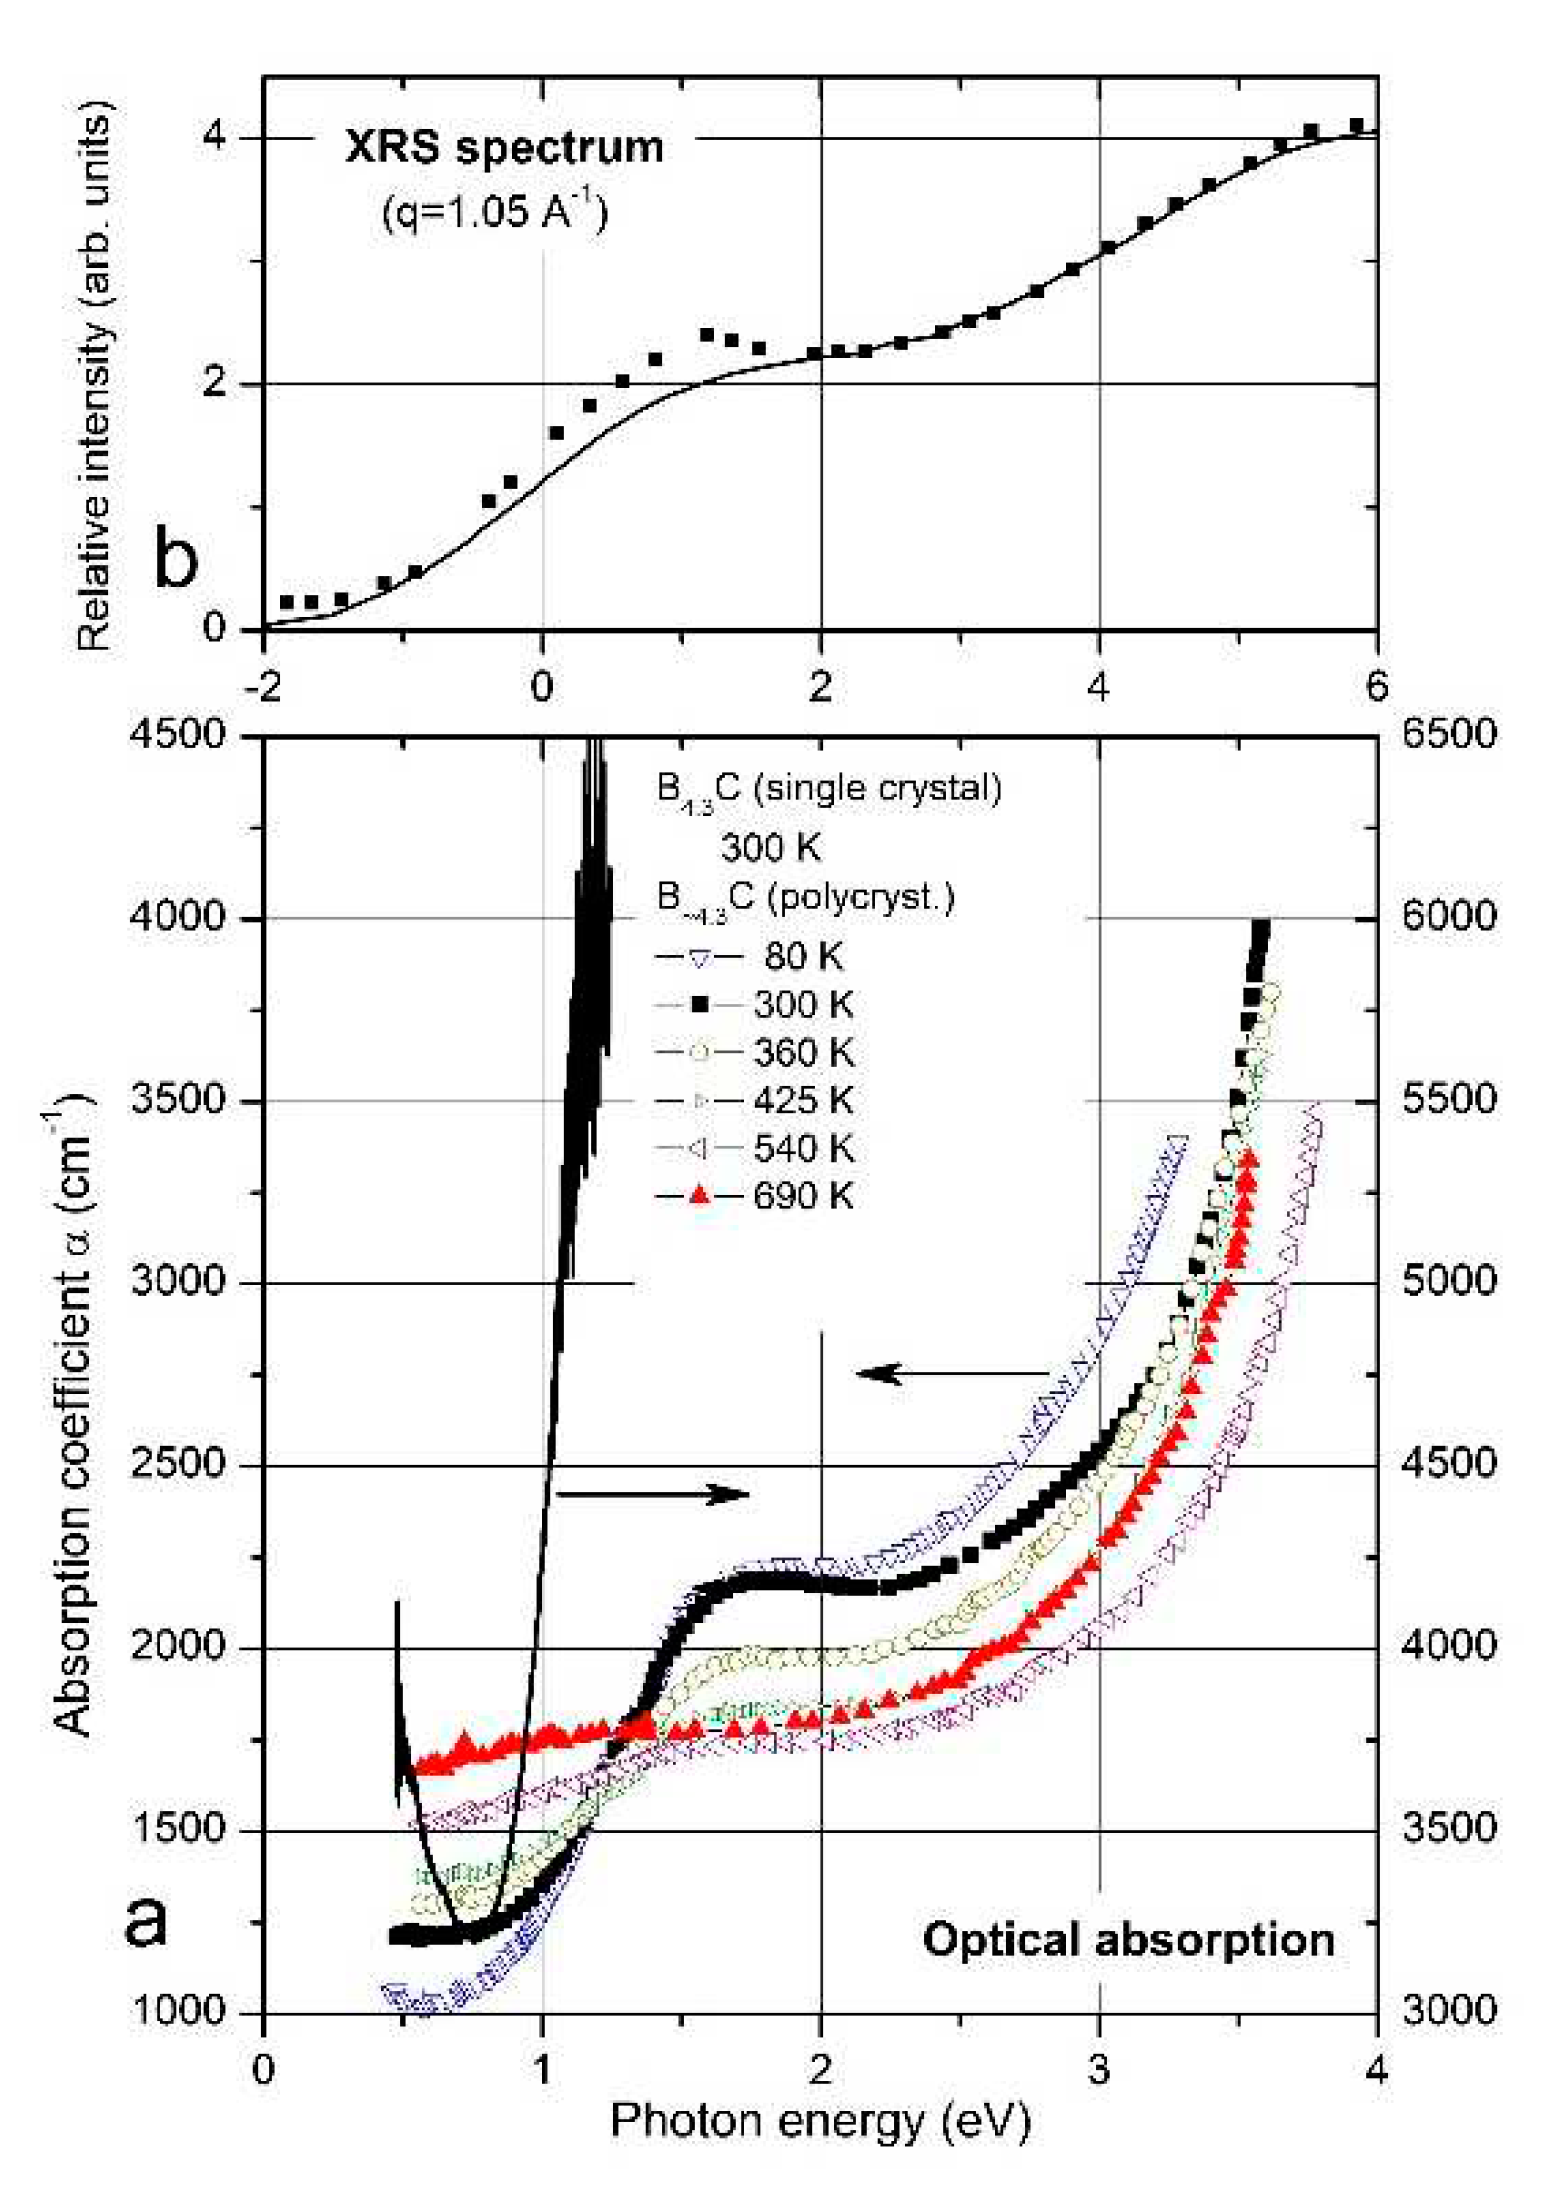
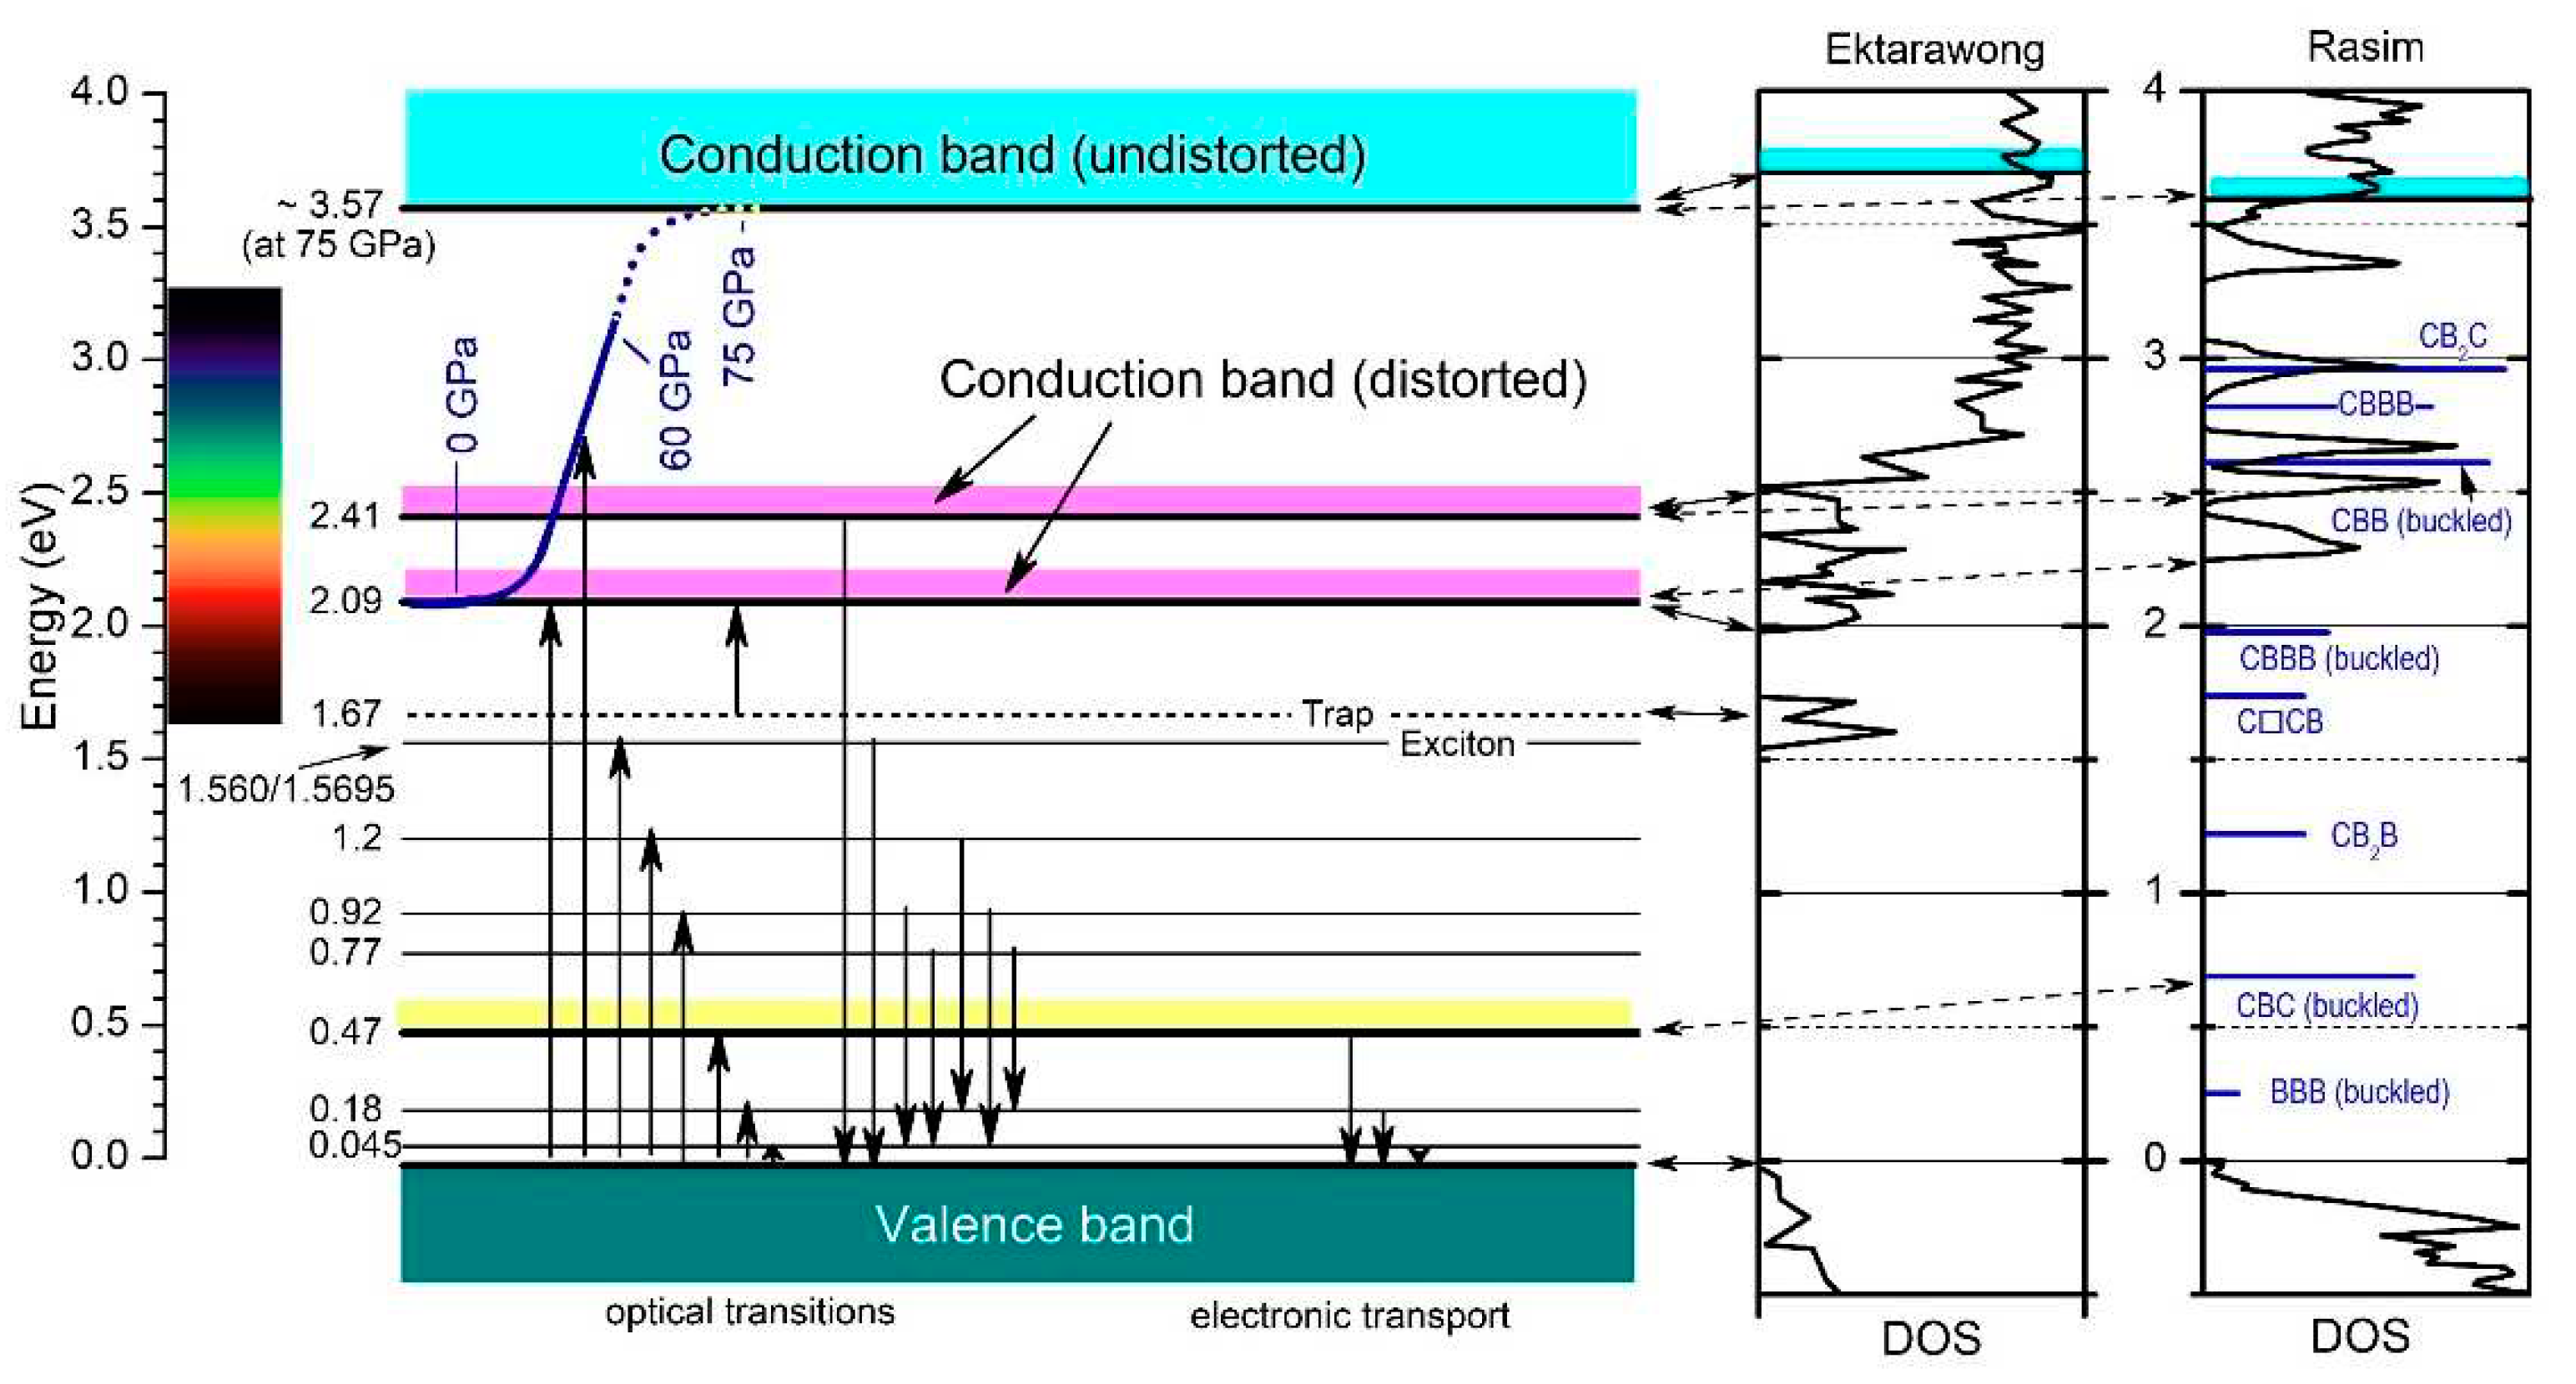
Figure 4 shows a collection of transition energies, consistently obtained from optical absorption like those shown in
Figure 5, indicating interband transitions at 2.09 and 2.41 eV and from electrical transport measurements (see [
3,
4,
35] and references cited therein).
Off the absorption edge in
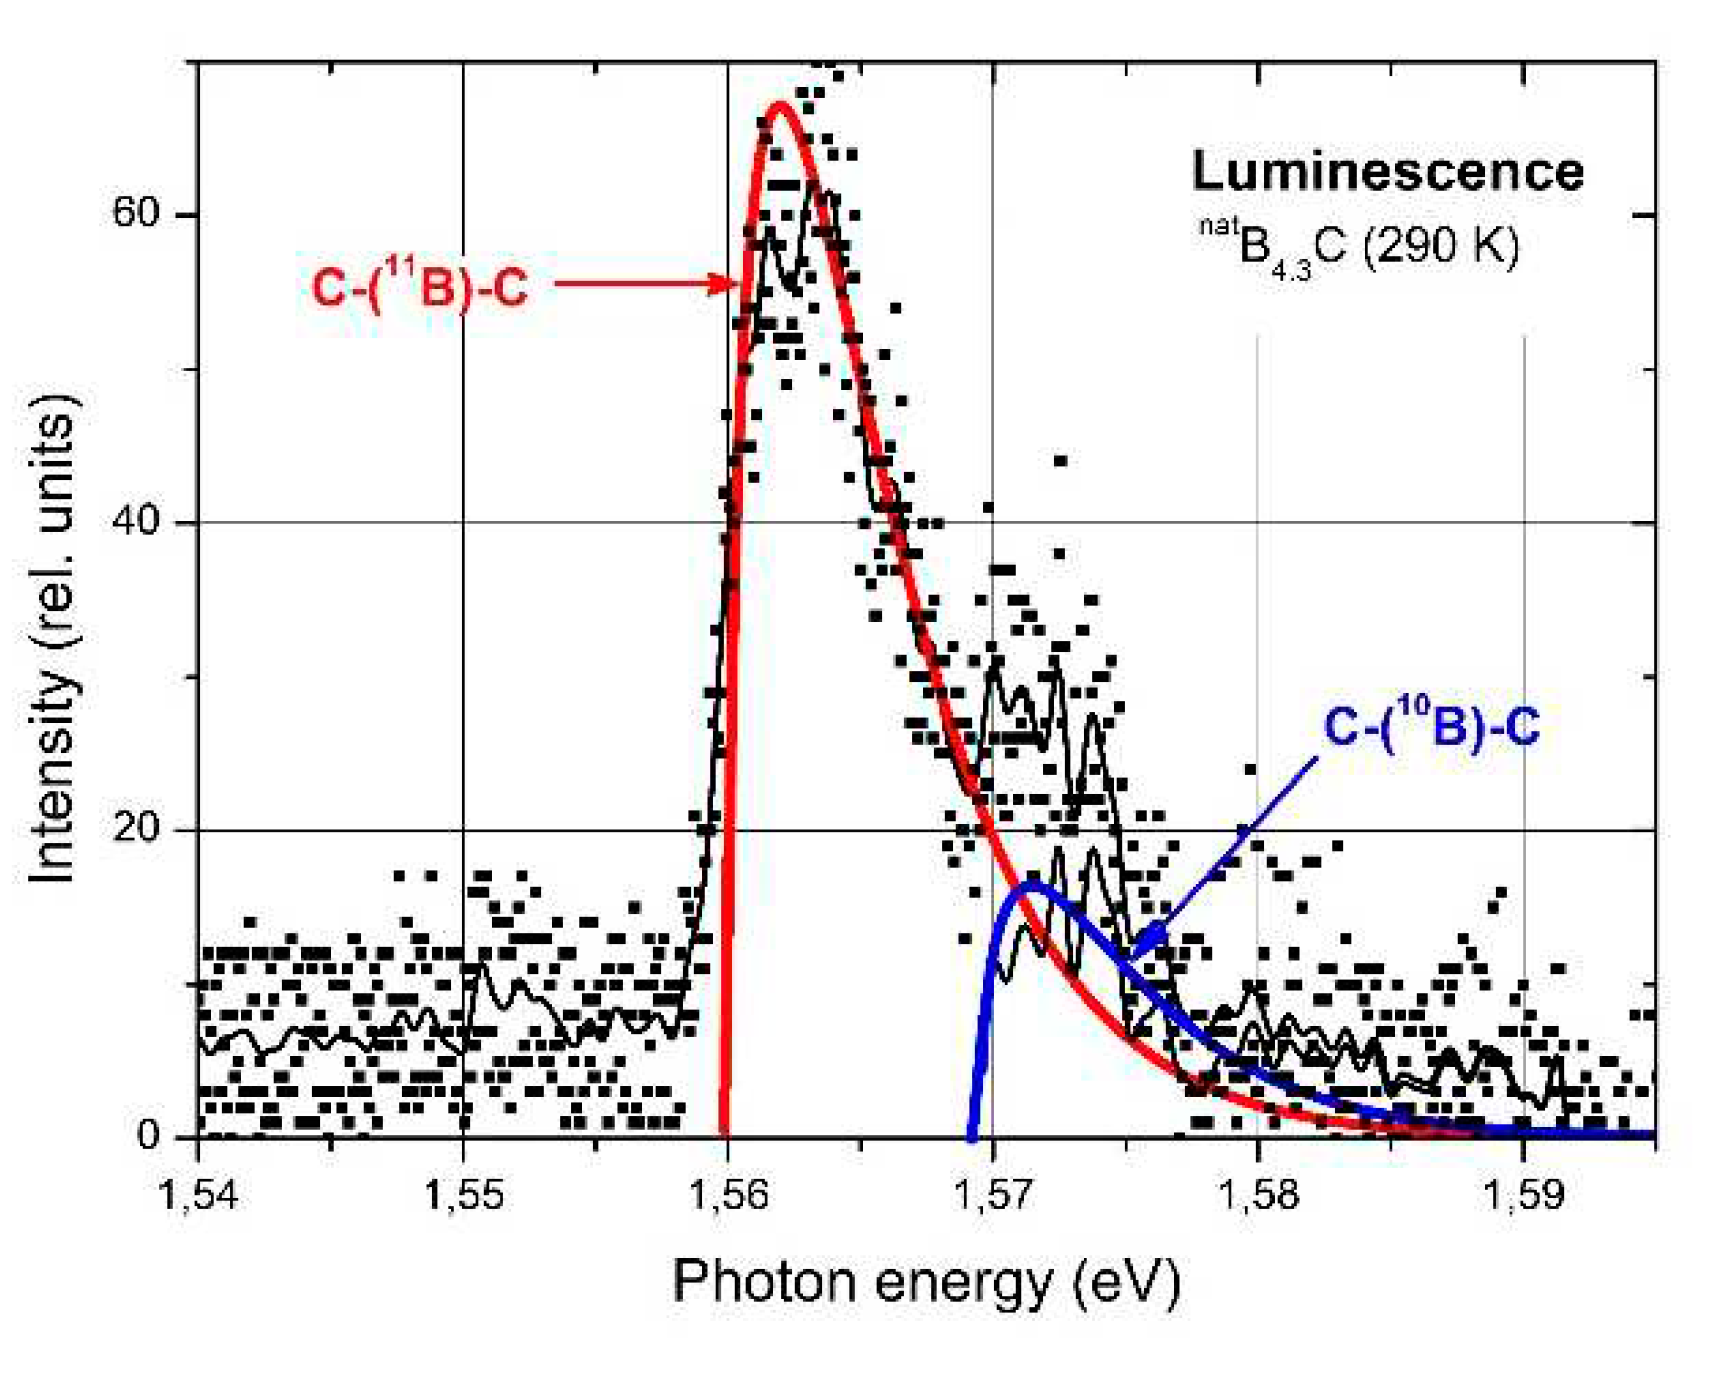
Figure 5 there is a peak absorption in polycrystalline boron carbide at 1.56 eV. On the first view surprising, the absorption of high-quality single crystal boron carbide in this range is considerably higher. XRS emission (
Figure 5, Feng et al. [
36]) and luminescence [
35,
37] (
Figure 6) suggest a p-type exciton associated with the central B atom of the CBC chain. The luminescence peak consists of two components, whose intensity relation is 4:1. This corresponds quite well with the relation in
natB
4.3C
11B /
10B = 4.03, if random isotope distribution is assumed. The formation of excitons requires largely undistorted structures. In B
4.3C single crystals this condition is better fulfilled than in polycrystals, and at low T better than at high T. This explains the peculiarities in
Figure 5. Hence, the gap state “Exciton” in
Figure 4 is not evoked by structural defects. However, effects of structural defects on the optical absorption cannot be excluded. For example, at high pressure (see below), structural distortion occurs by buckling-out of the central B atom in the CBC chain [
15,
38,
39,
56].
Former theoretical studies on boron carbide were not very helpful to understand the complex interactions between structural details and electronic properties [
40,
41,
42,
43,
44,
45,
46], as they were based on idealized structure models deviating more or less considerably from the real structures. Thus, related conclusions were often in significant contrast to experimental results: For example, the theoretically claimed metallic character or even superconductivity [
45] was opposite to the semiconducting behavior experimentally proved from the very beginning. Surprisingly, even in recent studies the real structure of boron carbide is frequently ignored.
4. Phase transition near the compound B8C
Reliable information on the electronic structure of more boron-rich boron carbide is obtained from electrical conductivity, measured between 5 and 2100 K by Werheit et al. [
47], by Wood [
48,
49] and by Aselage et al. [
50]. Results obtained by Amulele et al. [
51] up to 9 GPa pressure are compatible.
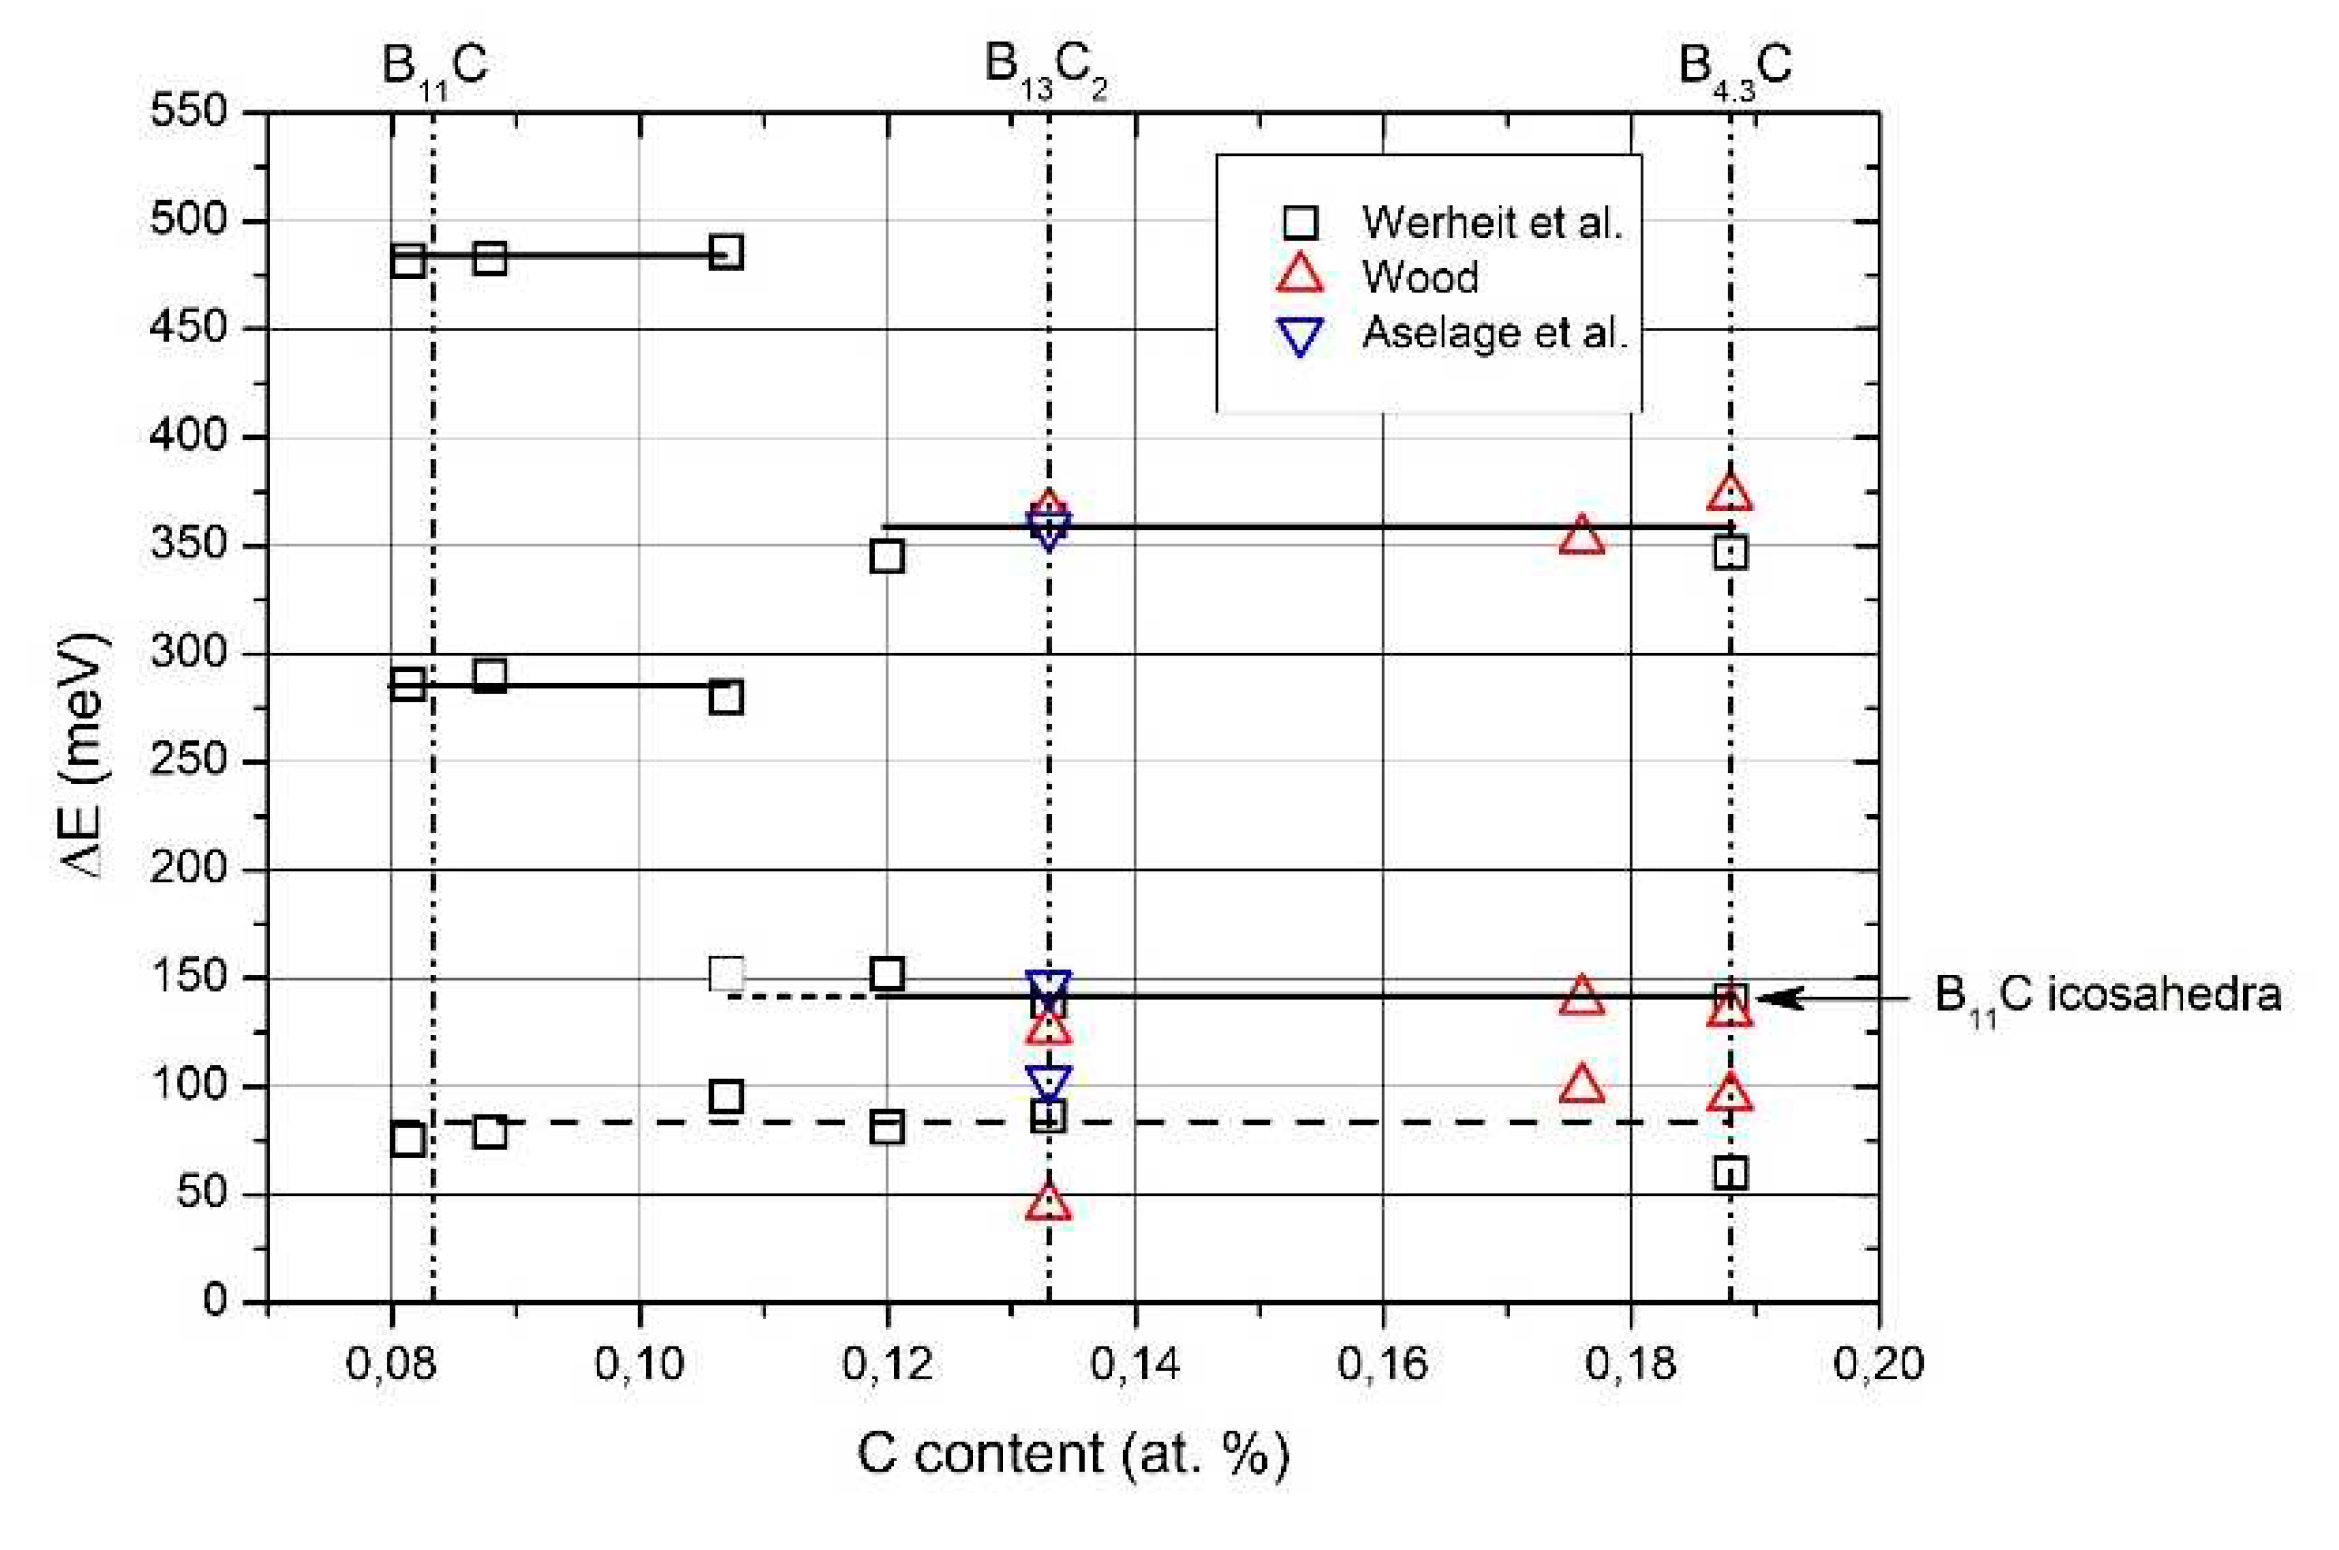
The activation energies obtained from the electrical conductivity are displayed in
Figure 7 showing that at ~B
8C the homogeneity range is divided into two parts with significantly different electronic characteristics. The activation energy at about 80 meV found in both regions is uncertain as obtained in that range of temperature, where a continuous transition from thermal excitation to variable-range hopping takes place (see [
47]).
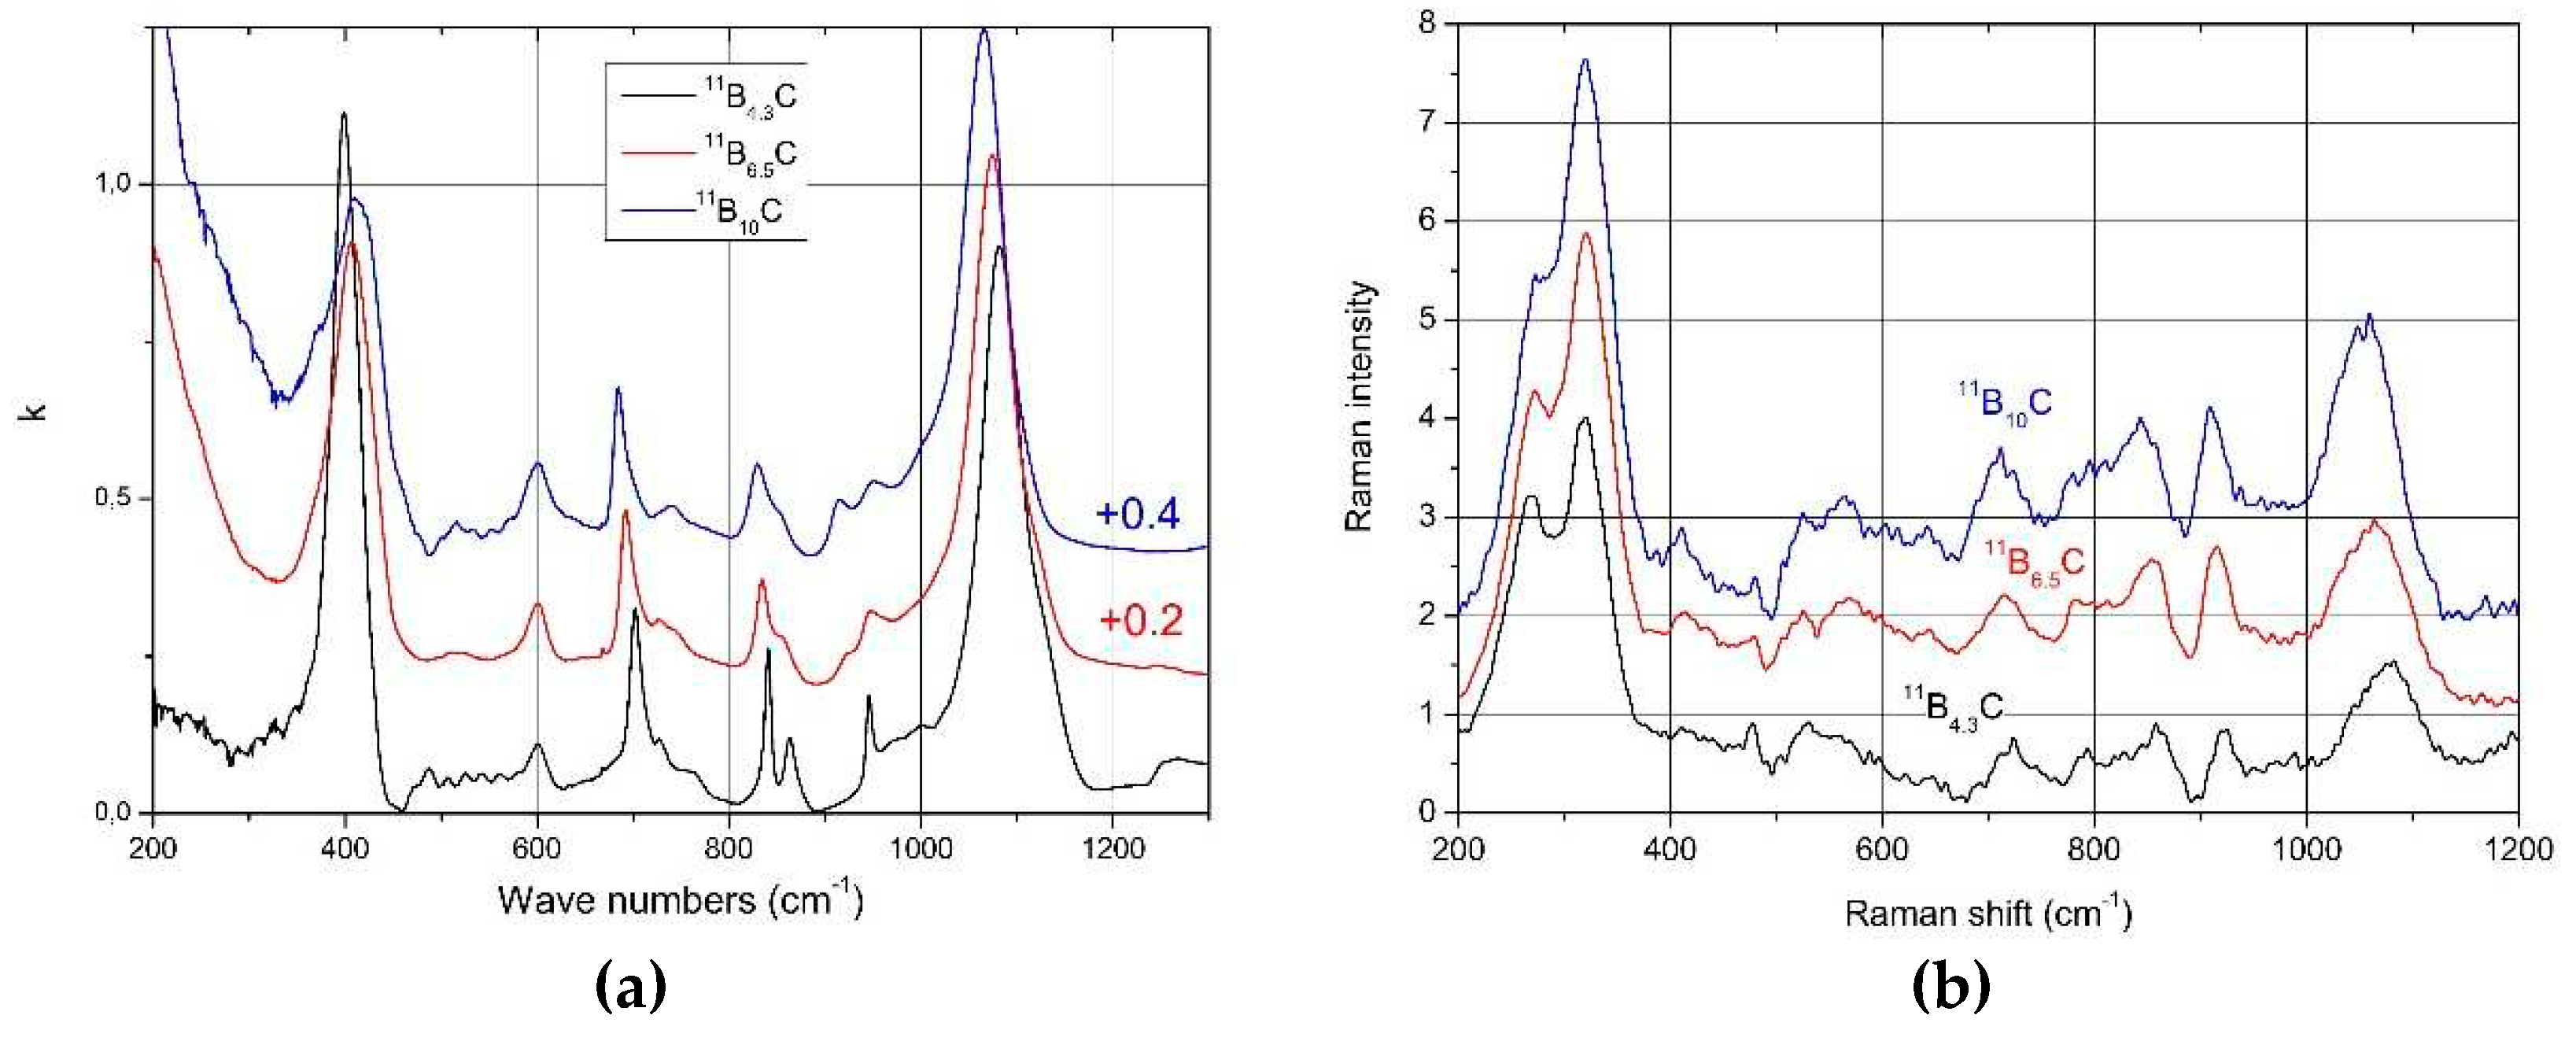
It is expected that this phase transition is correlated with a structural change. This should be reflected in the phonon spectra.
Figure 8 shows the IR- and Raman-active phonons of
11B
xC boron carbide [
34,
52]. We analyze some phonons showing changes depending on the chemical composition.
The activation energy at about 80 meV found in both regions is uncertain as obtained in the range of temperature, where a continuous transition into the range of variable-range hopping takes place (see [
47]).
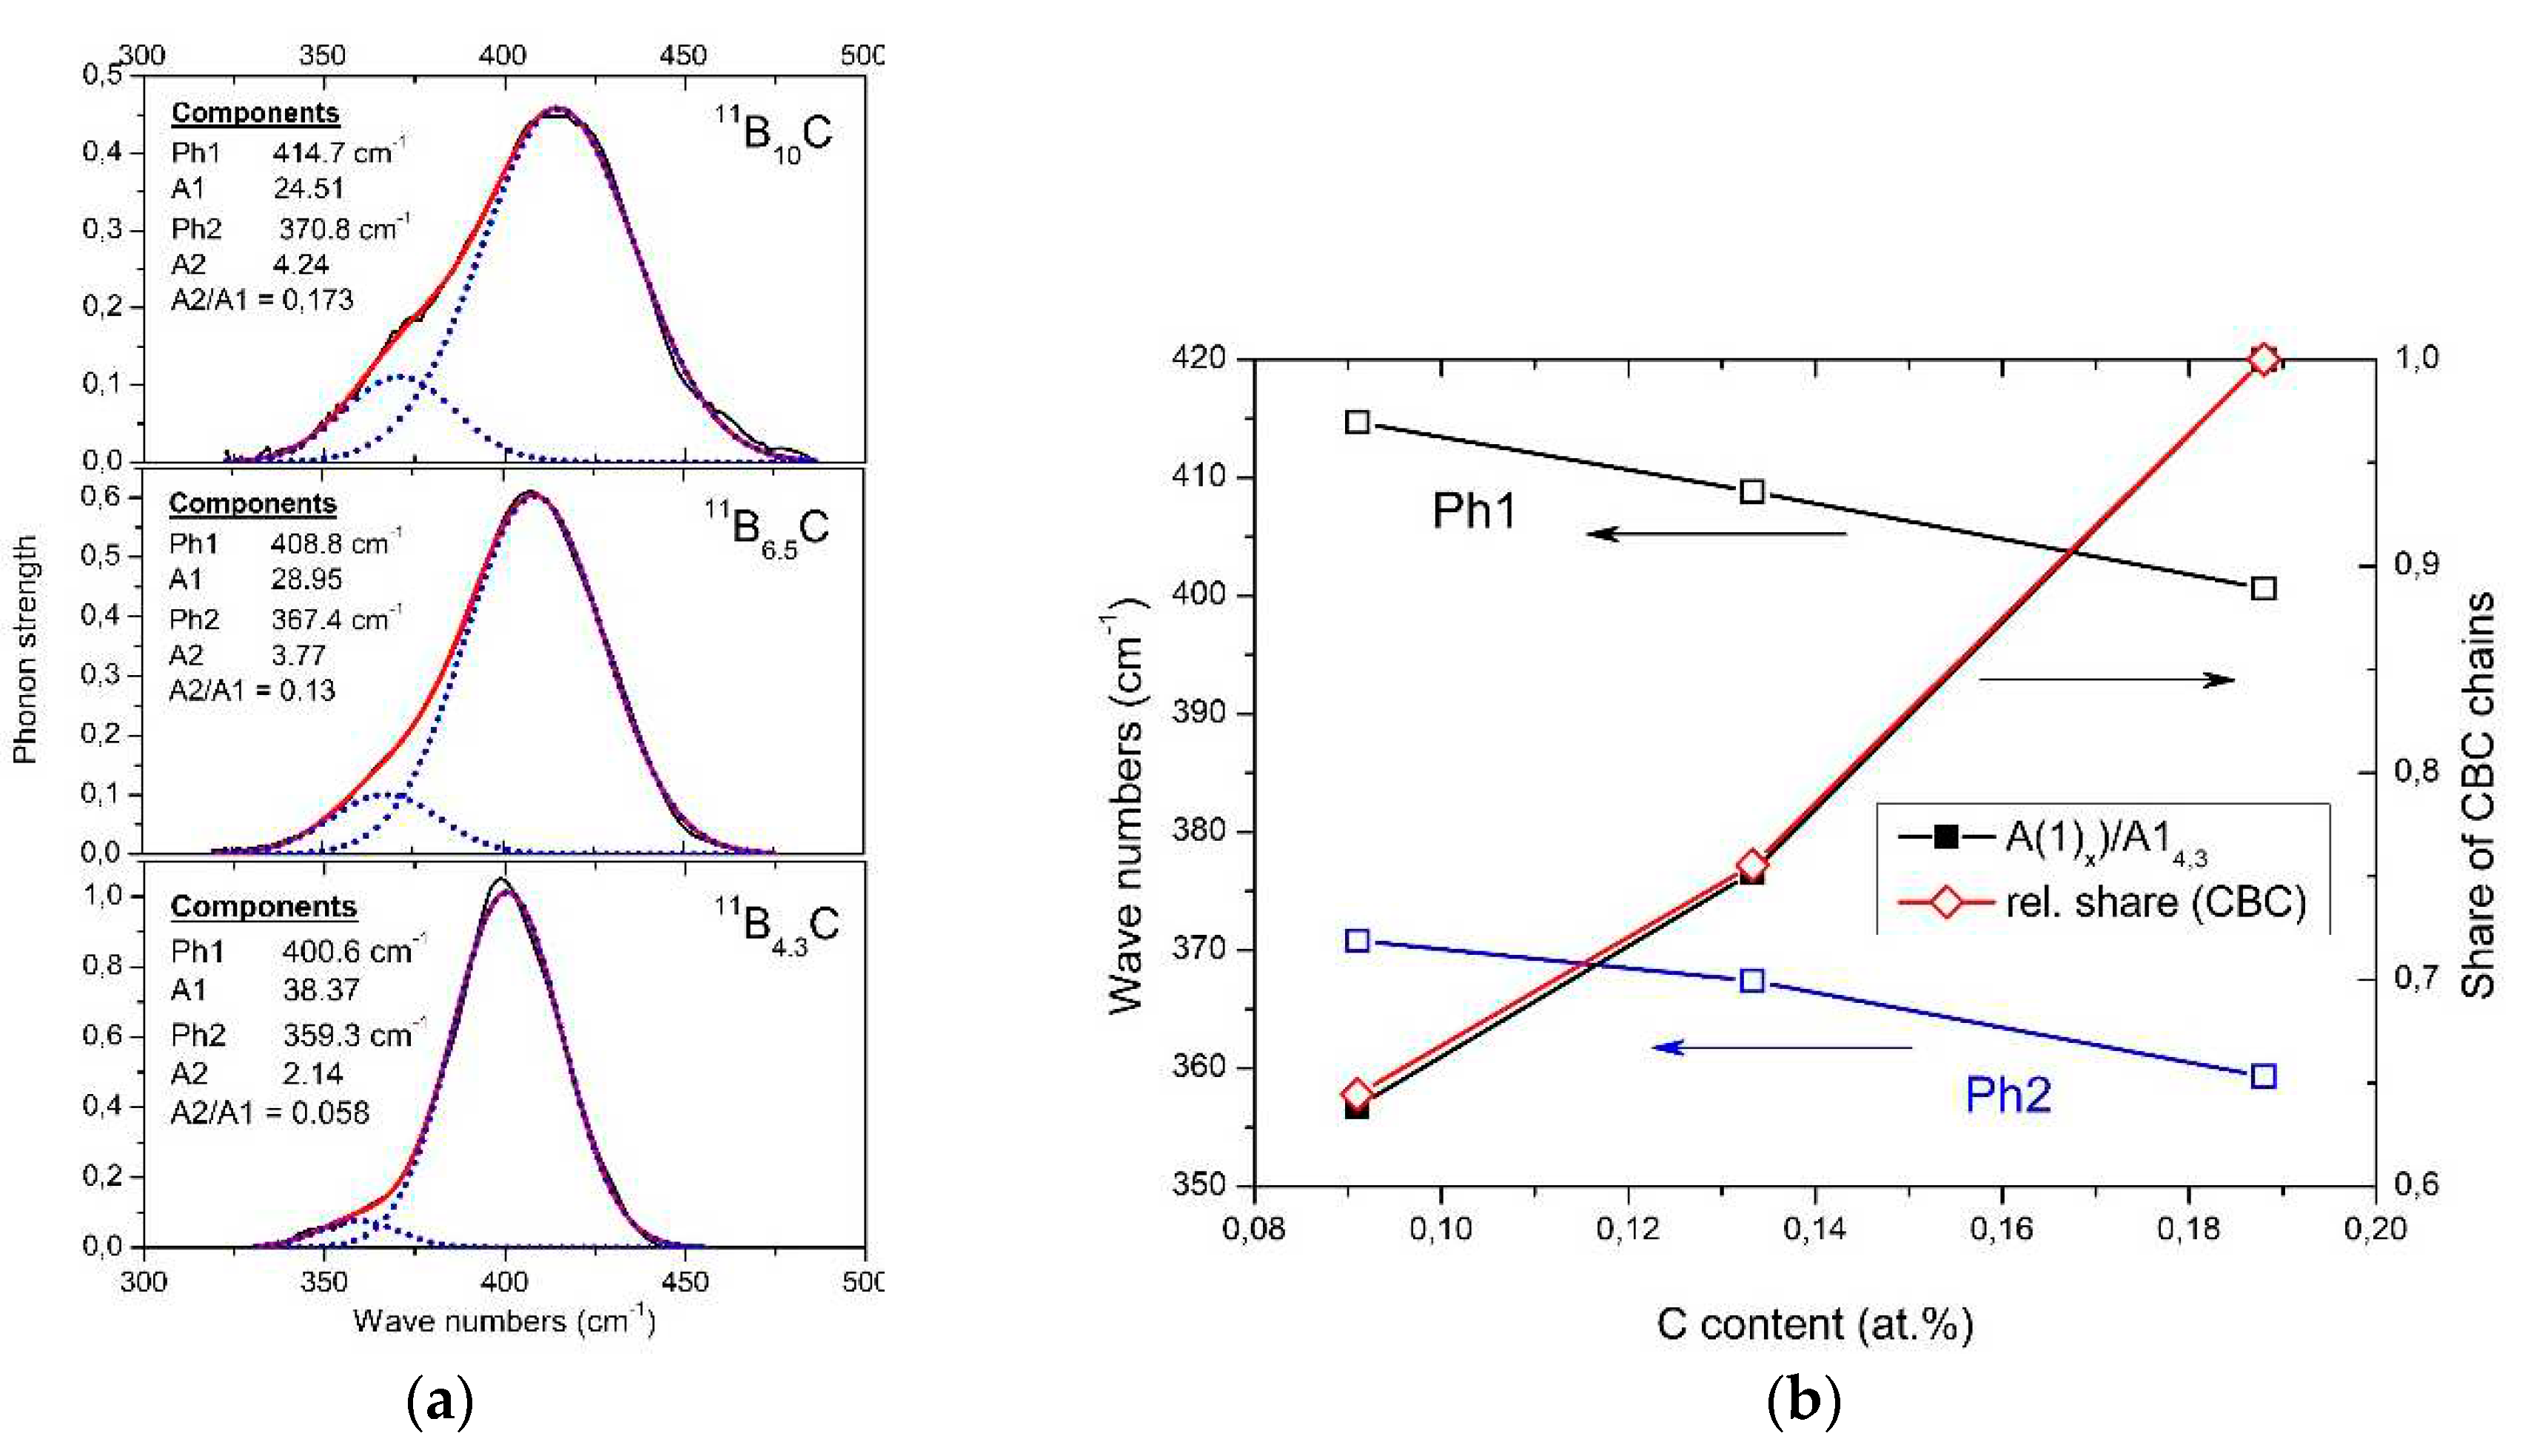
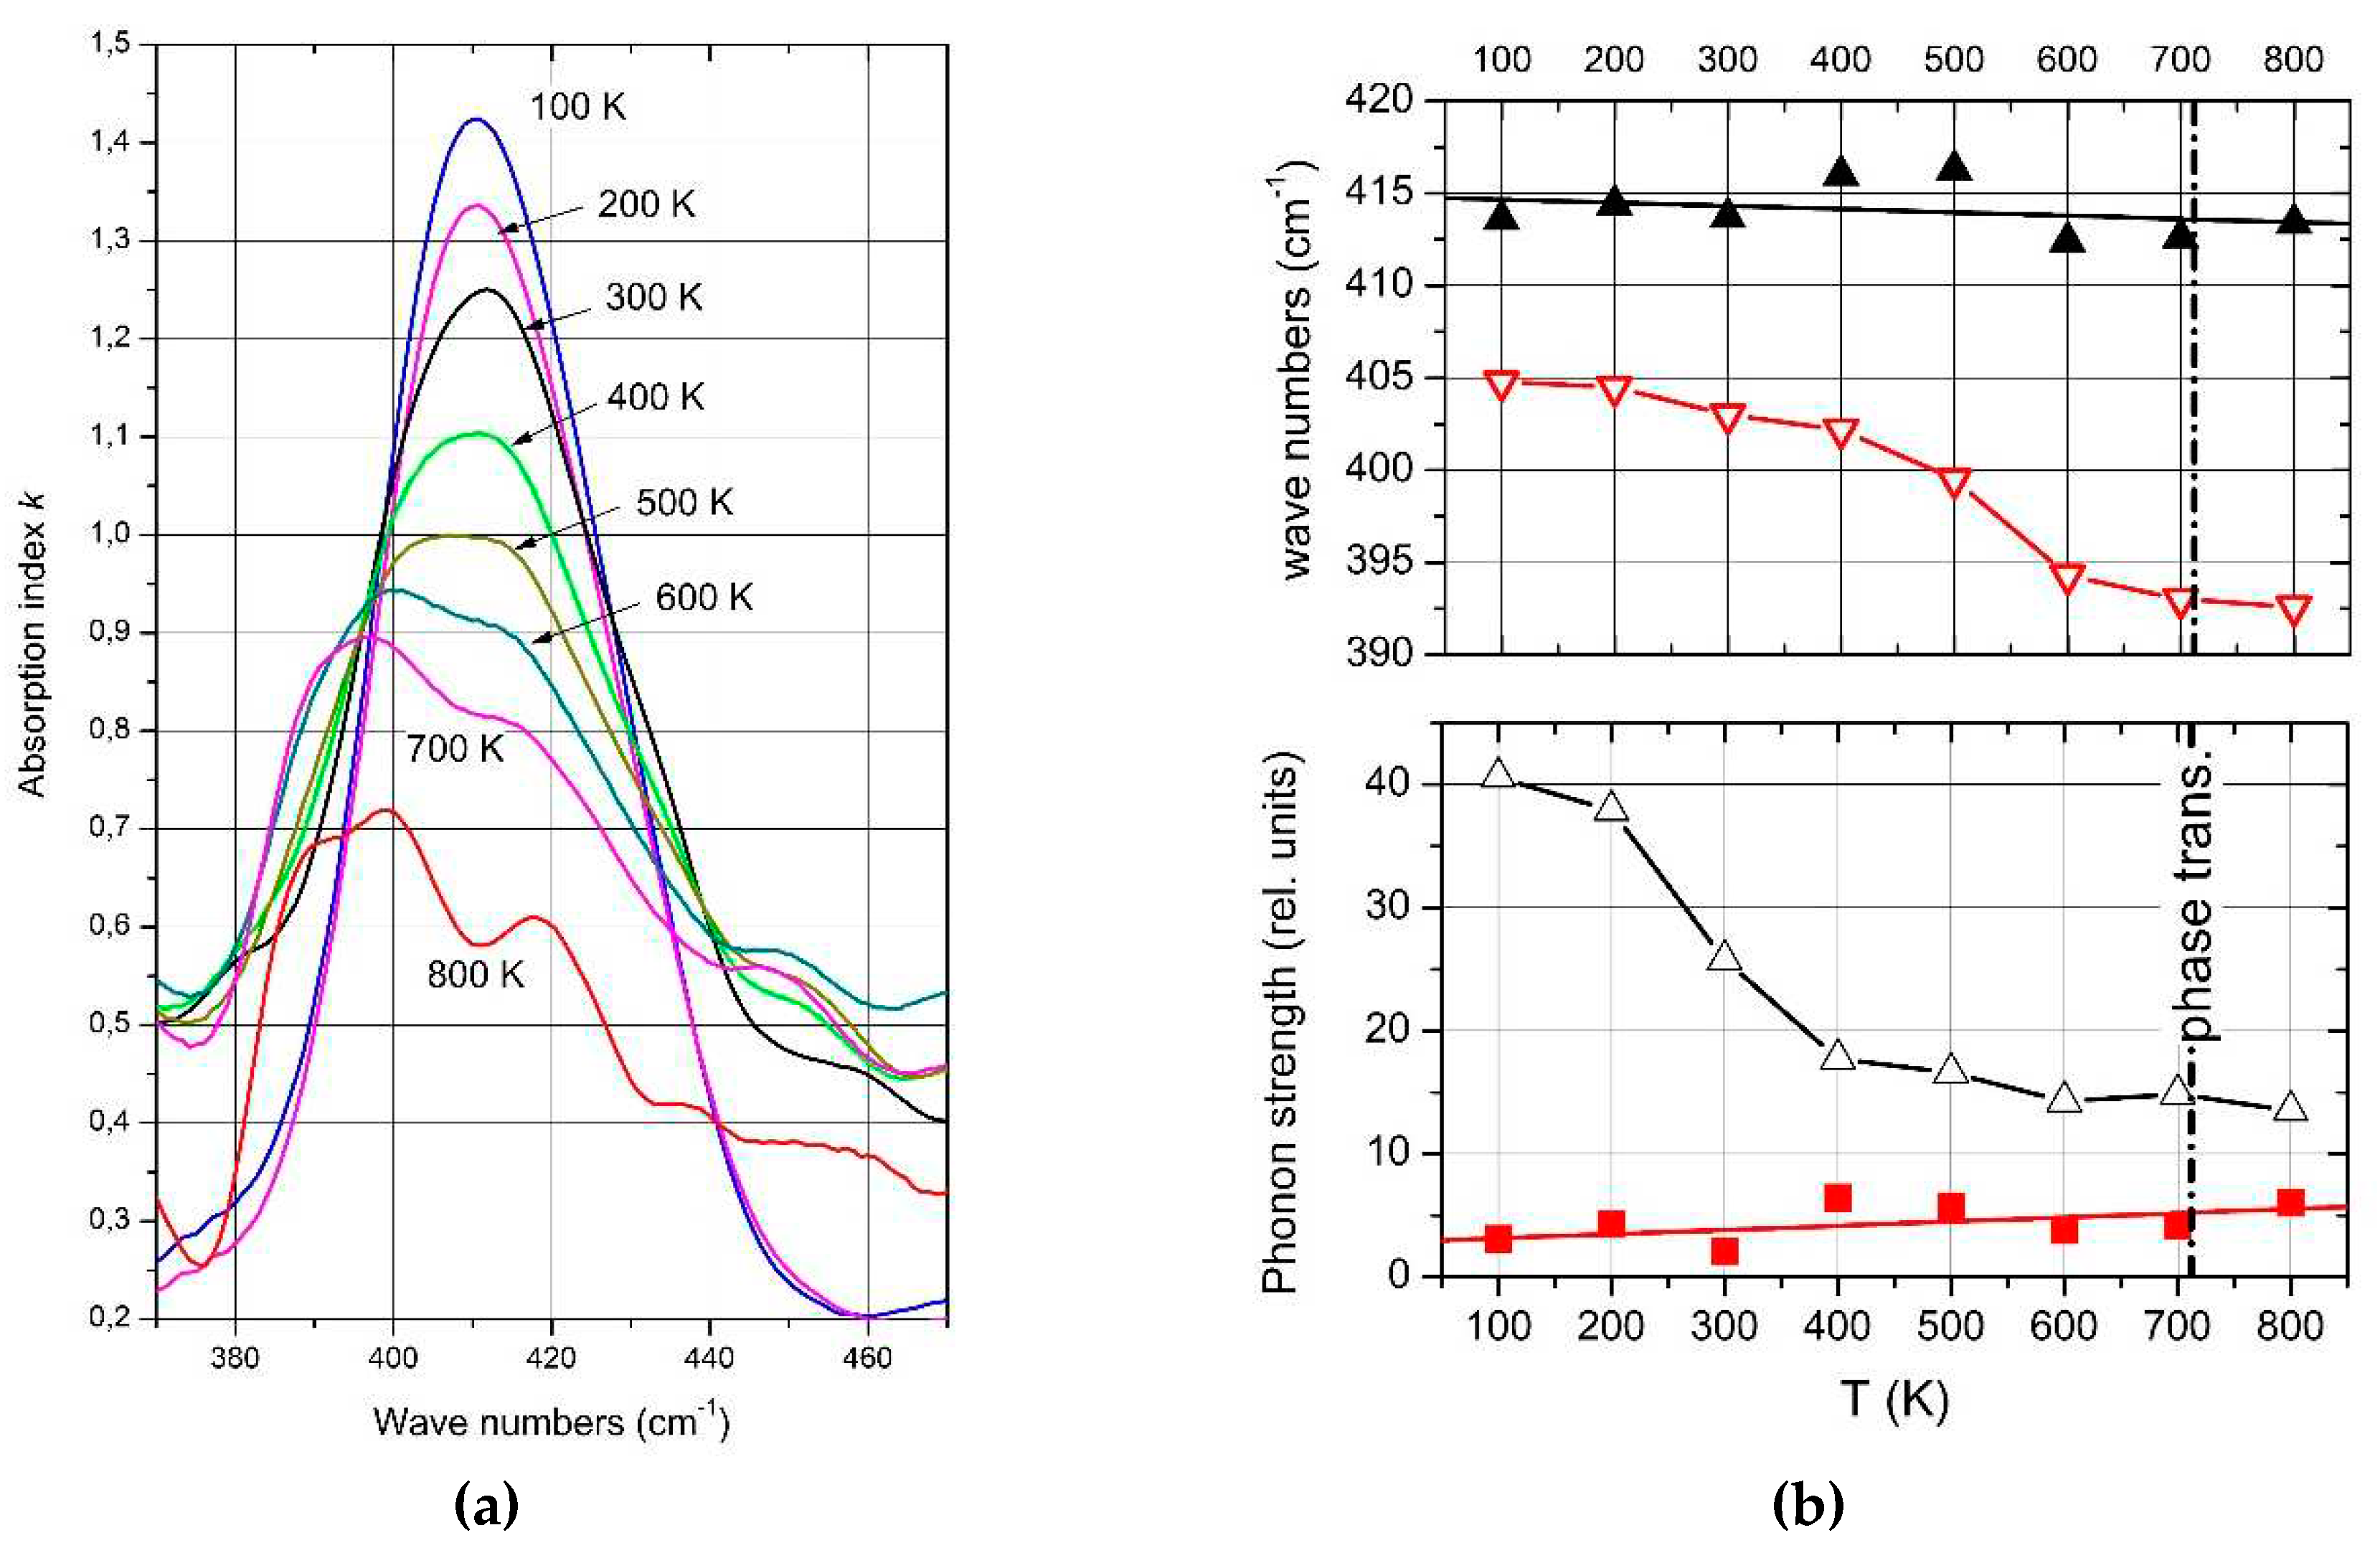
4.1. IR-active phonon near 400 cm-1
The phonon near 400 cm
-1 is composed of two components (see
Figure 9a), whose frequencies (
Figure 9b) and phonon strengths vary depending on the C content. Shirai et al. [
53,
54] and Vast et al. [
46,
55] attribute the IR phonon mode near 400 cm
−1 to the central B atom in the chain vibrating perpendicularly to the chain axis [
26]. Experimentally, this is confirmed for the component Ph 1 whose strength depending on the C content precisely matches with the share of CBC chains (
Figure 9b). The considerably weaker component Ph 2 of this phonon belongs to the icosahedral structure, accordingly with counterpart in the spectrum of α-rhombohedral boron (see
Figure 2). This phonon was already mentioned by Beckel et al. [
20] but not described in detail (see [
16]). Below, we perform an analysis of the temperature-dependence of this phonon.
In
Figure 9, there is no change apparent suggesting a relation of this phonon to the phase transition at B
8.1C. However, the mode Grüneisen parameter γ of the IR-phonon (-3.21 at low and +6.5 at high temperatures) deviating strikingly from all other phonons [
56] suggest a peculiarity. The previously assumed involvement of this phonon in the T-dependent transition at 712 K [
59] is checked below.
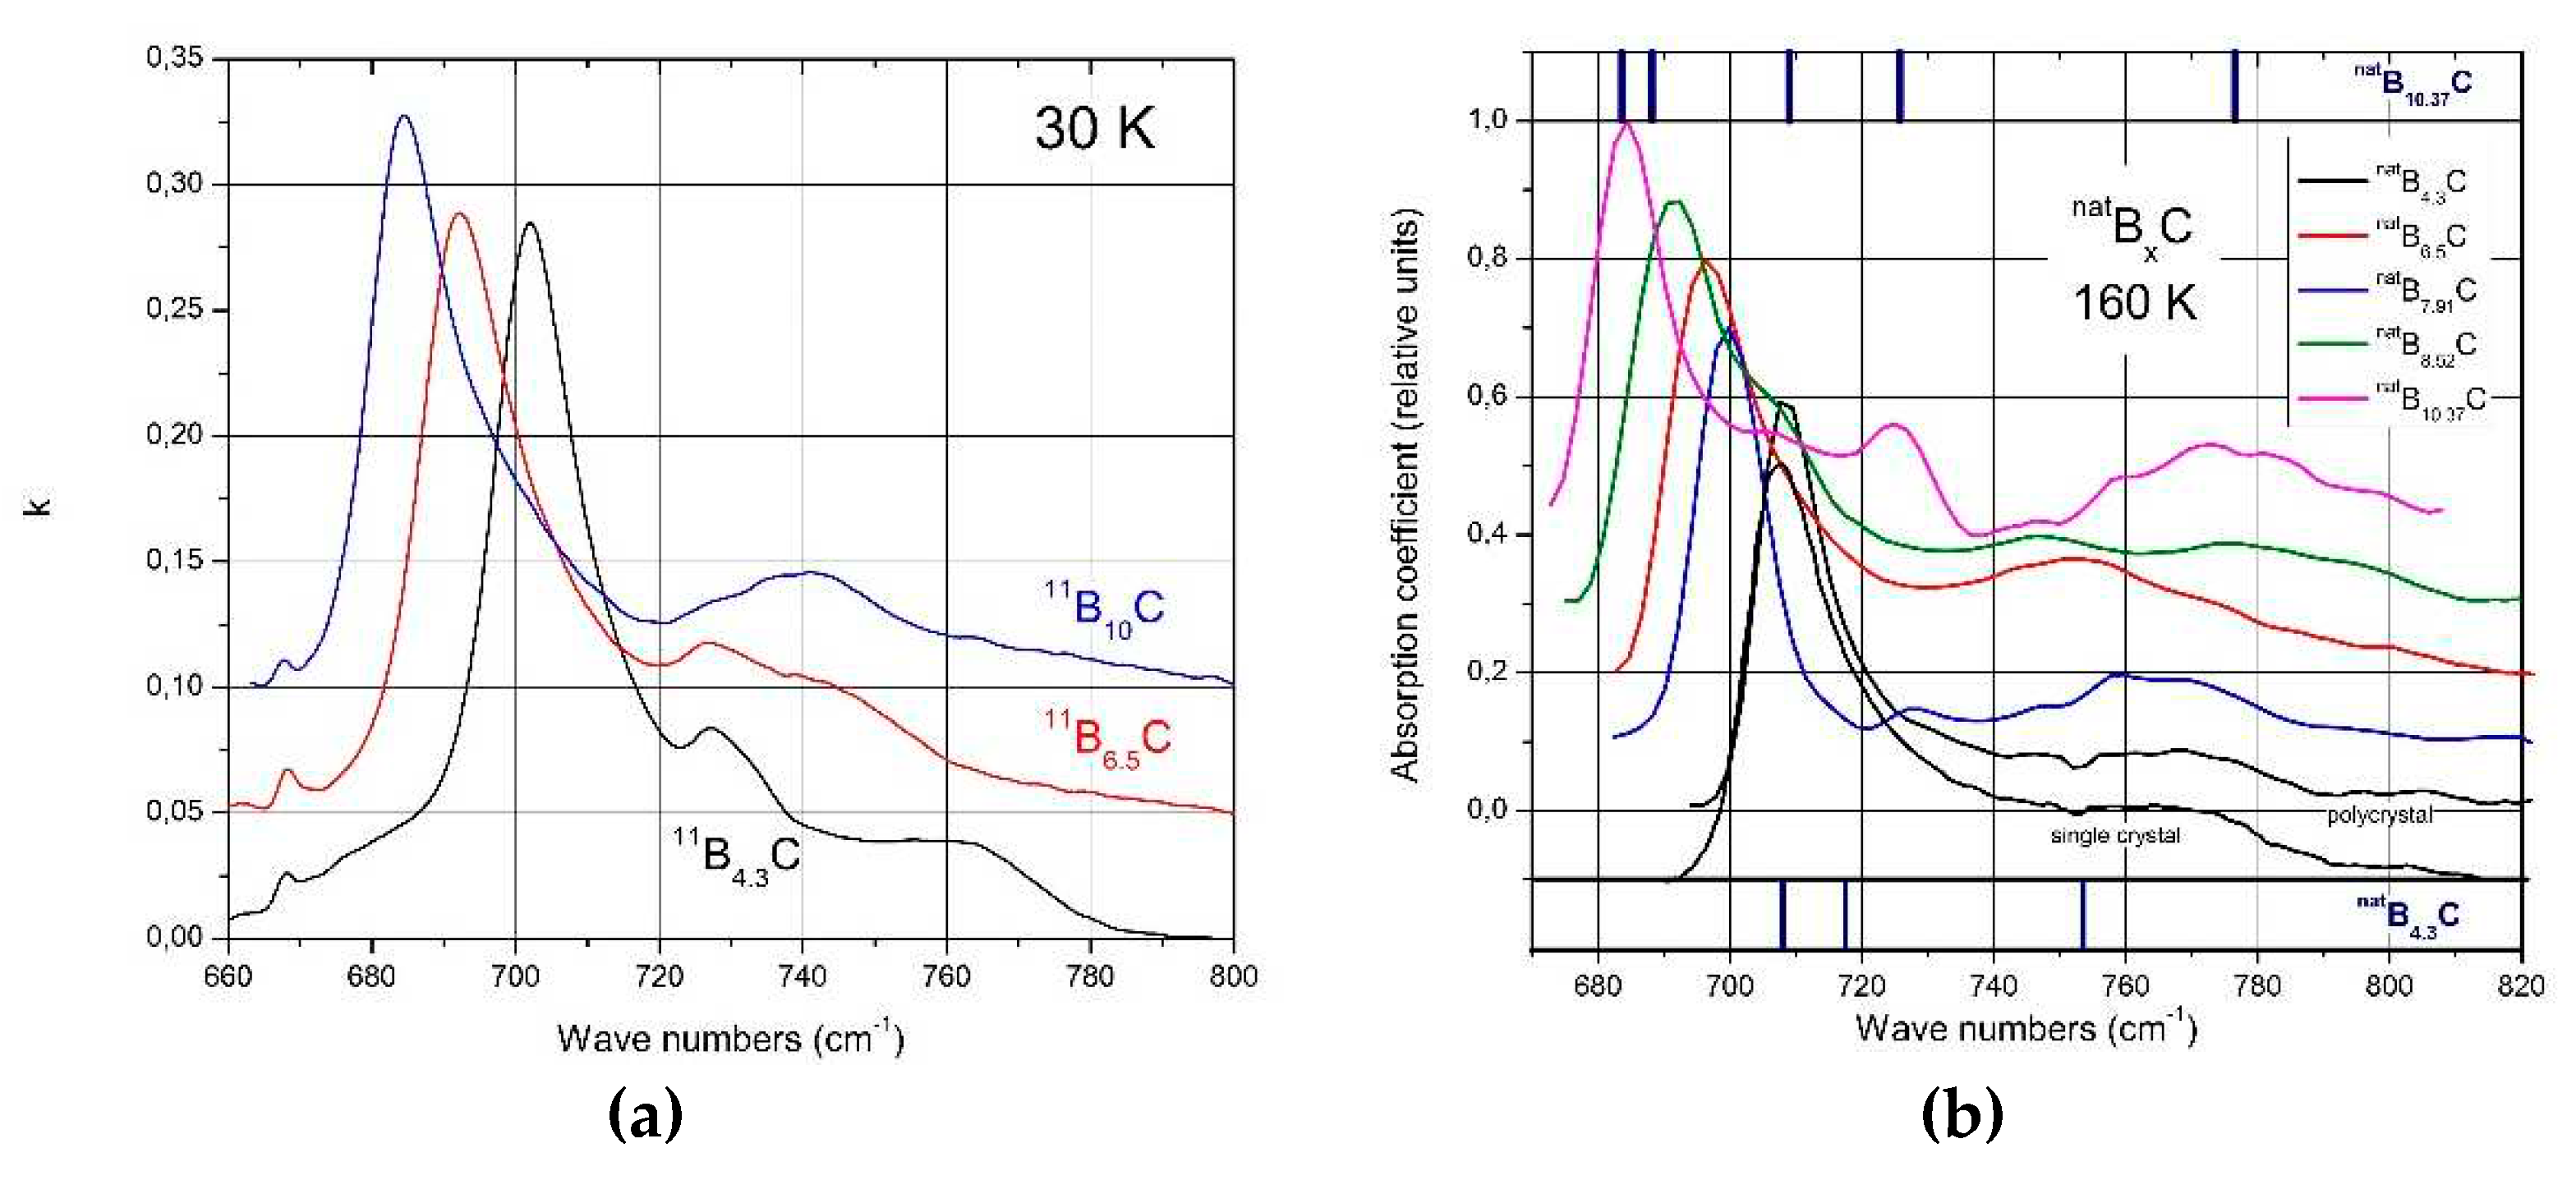
4.2. IR-active phonons near 700 cm-1
The spectra of isotope-enriched samples (
Figure 10a) exhibit clear changes depending on C content. For interpretation, a denser sequence of spectra is required. Data on
natB
xC are at disposal ([
57]
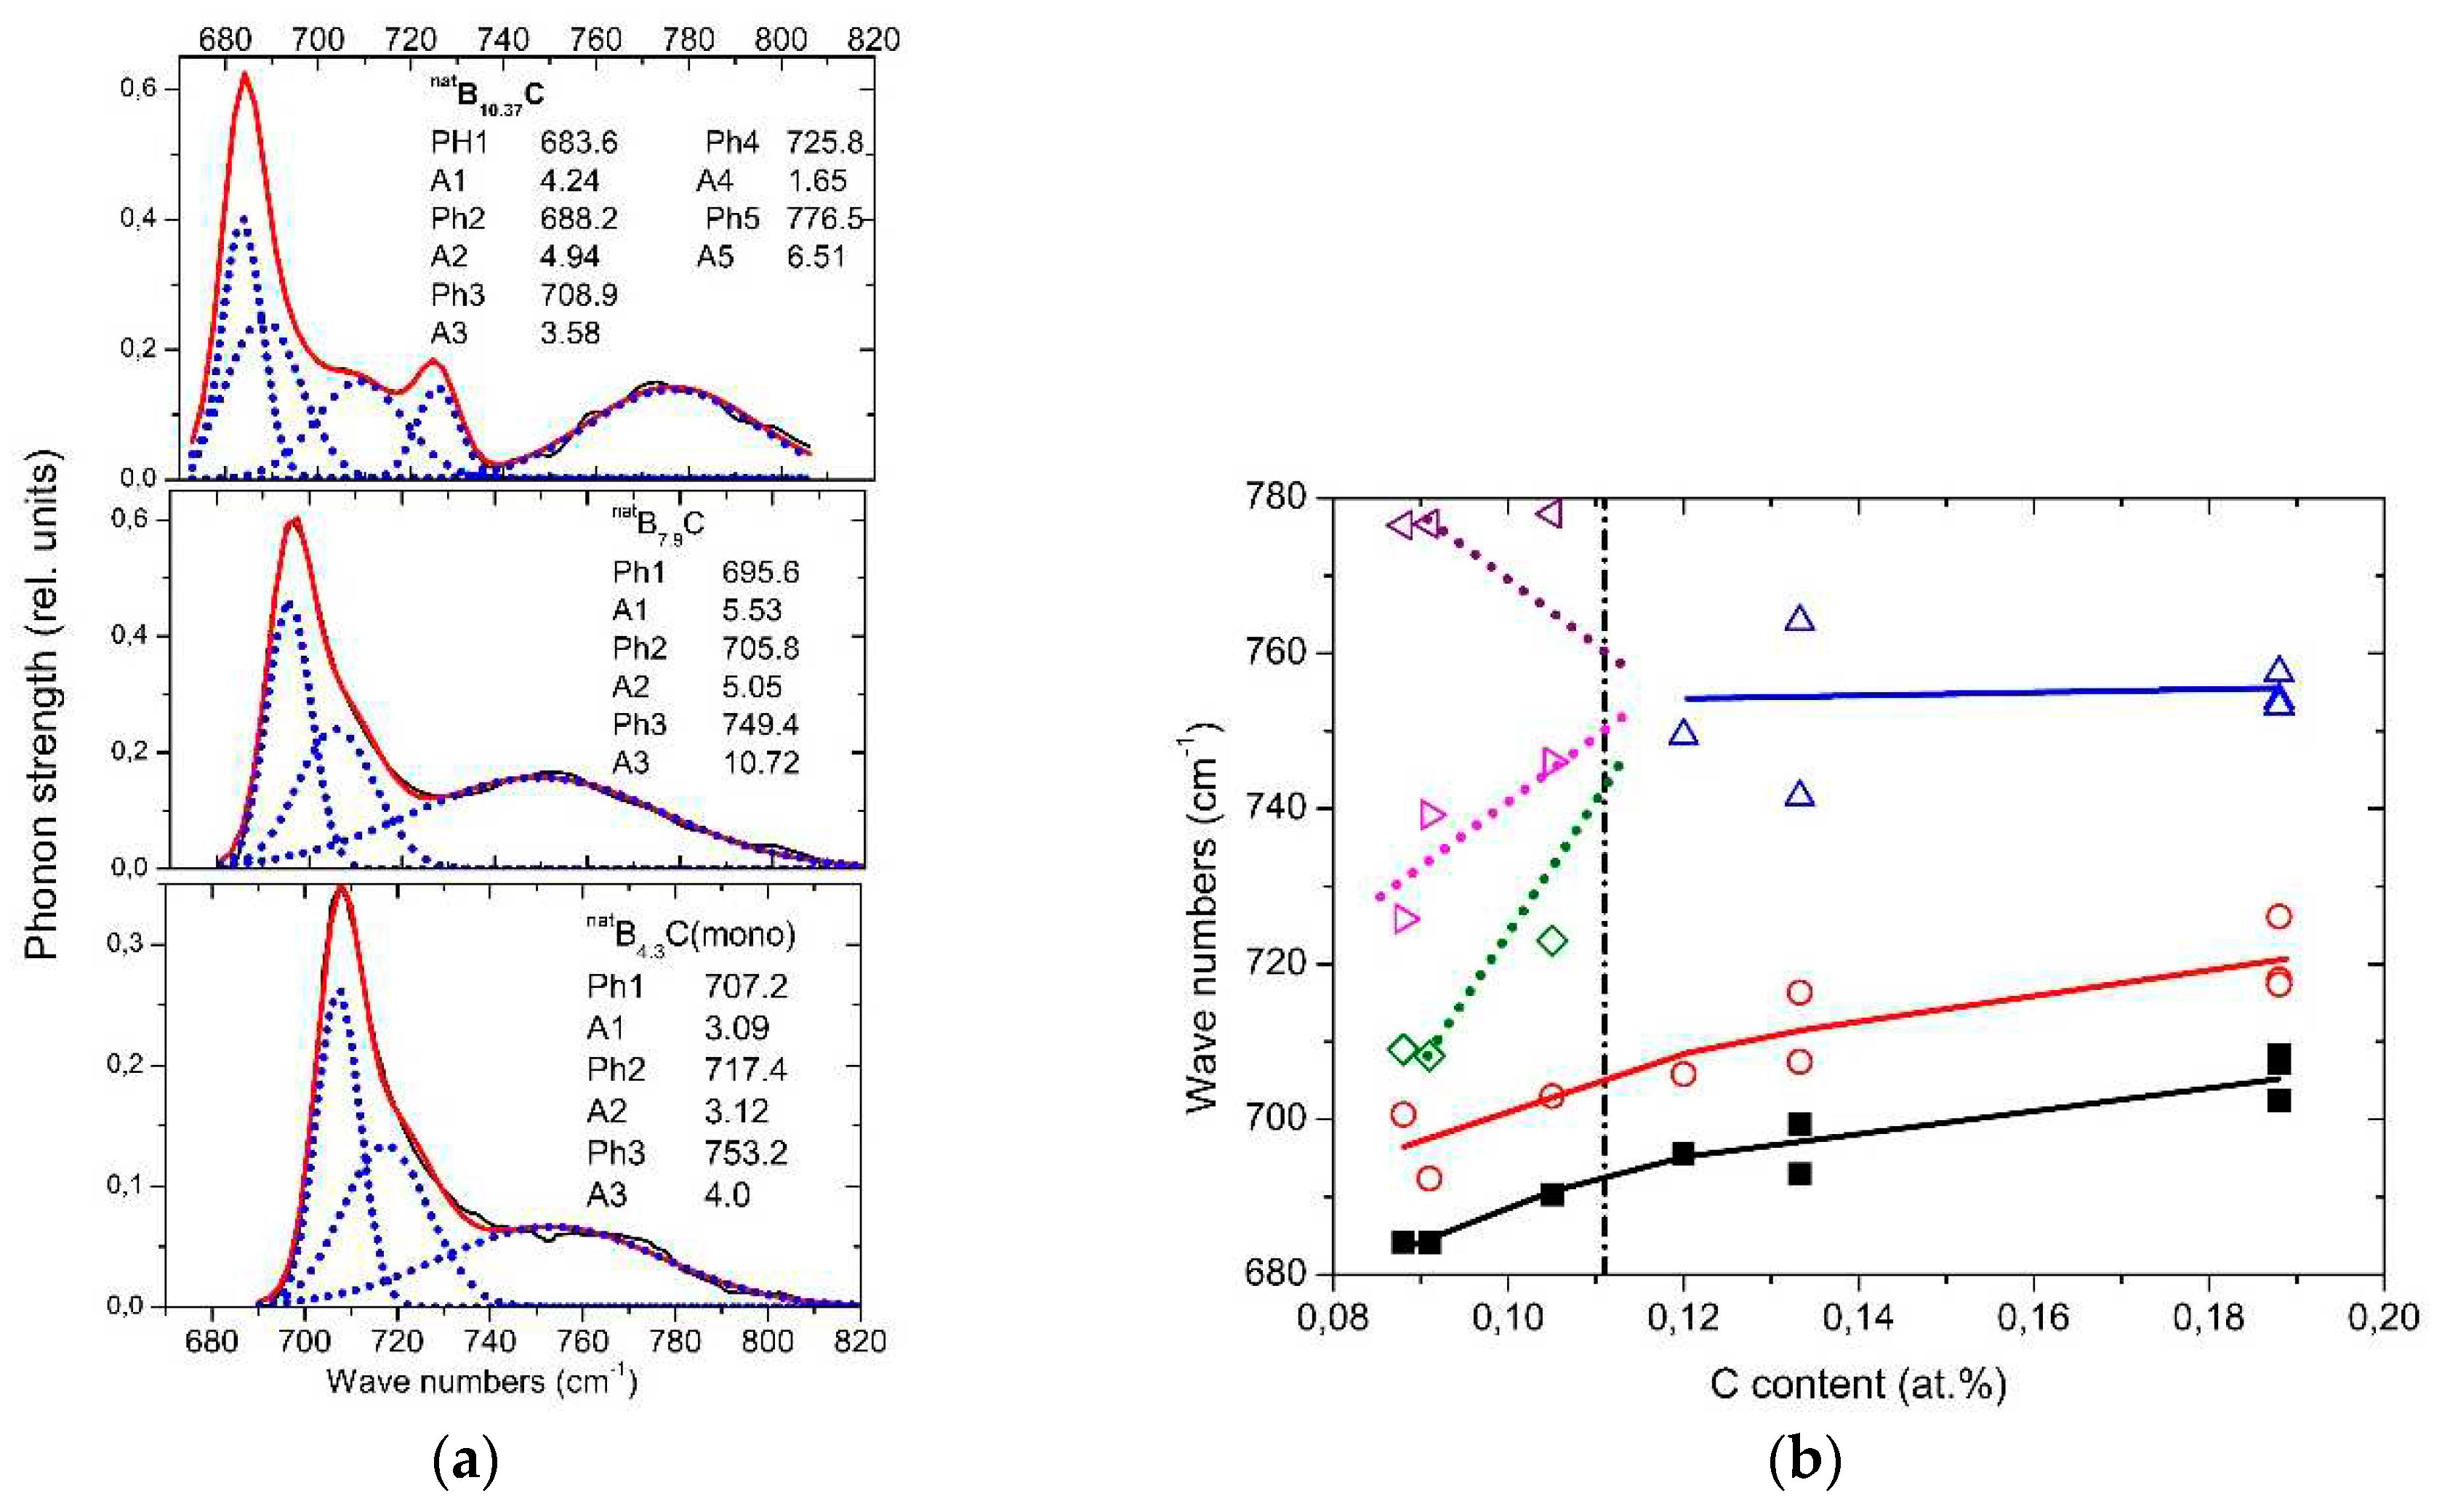
Figure 10b). The results of the analysis (examples in (
Figure 11a) are displayed in
Figure 11b. Splitting of the component of this phonon near 760 cm
-1 into three branches indicates a structural change at the phase transition. This phonon is correlated with the strong 705 cm
-1 intra-icosahedral single-line A
2u mode in α-rhombohedral boron, described by Beckel et al. [
20], split in the boron carbide structure (see [
16,
31]).
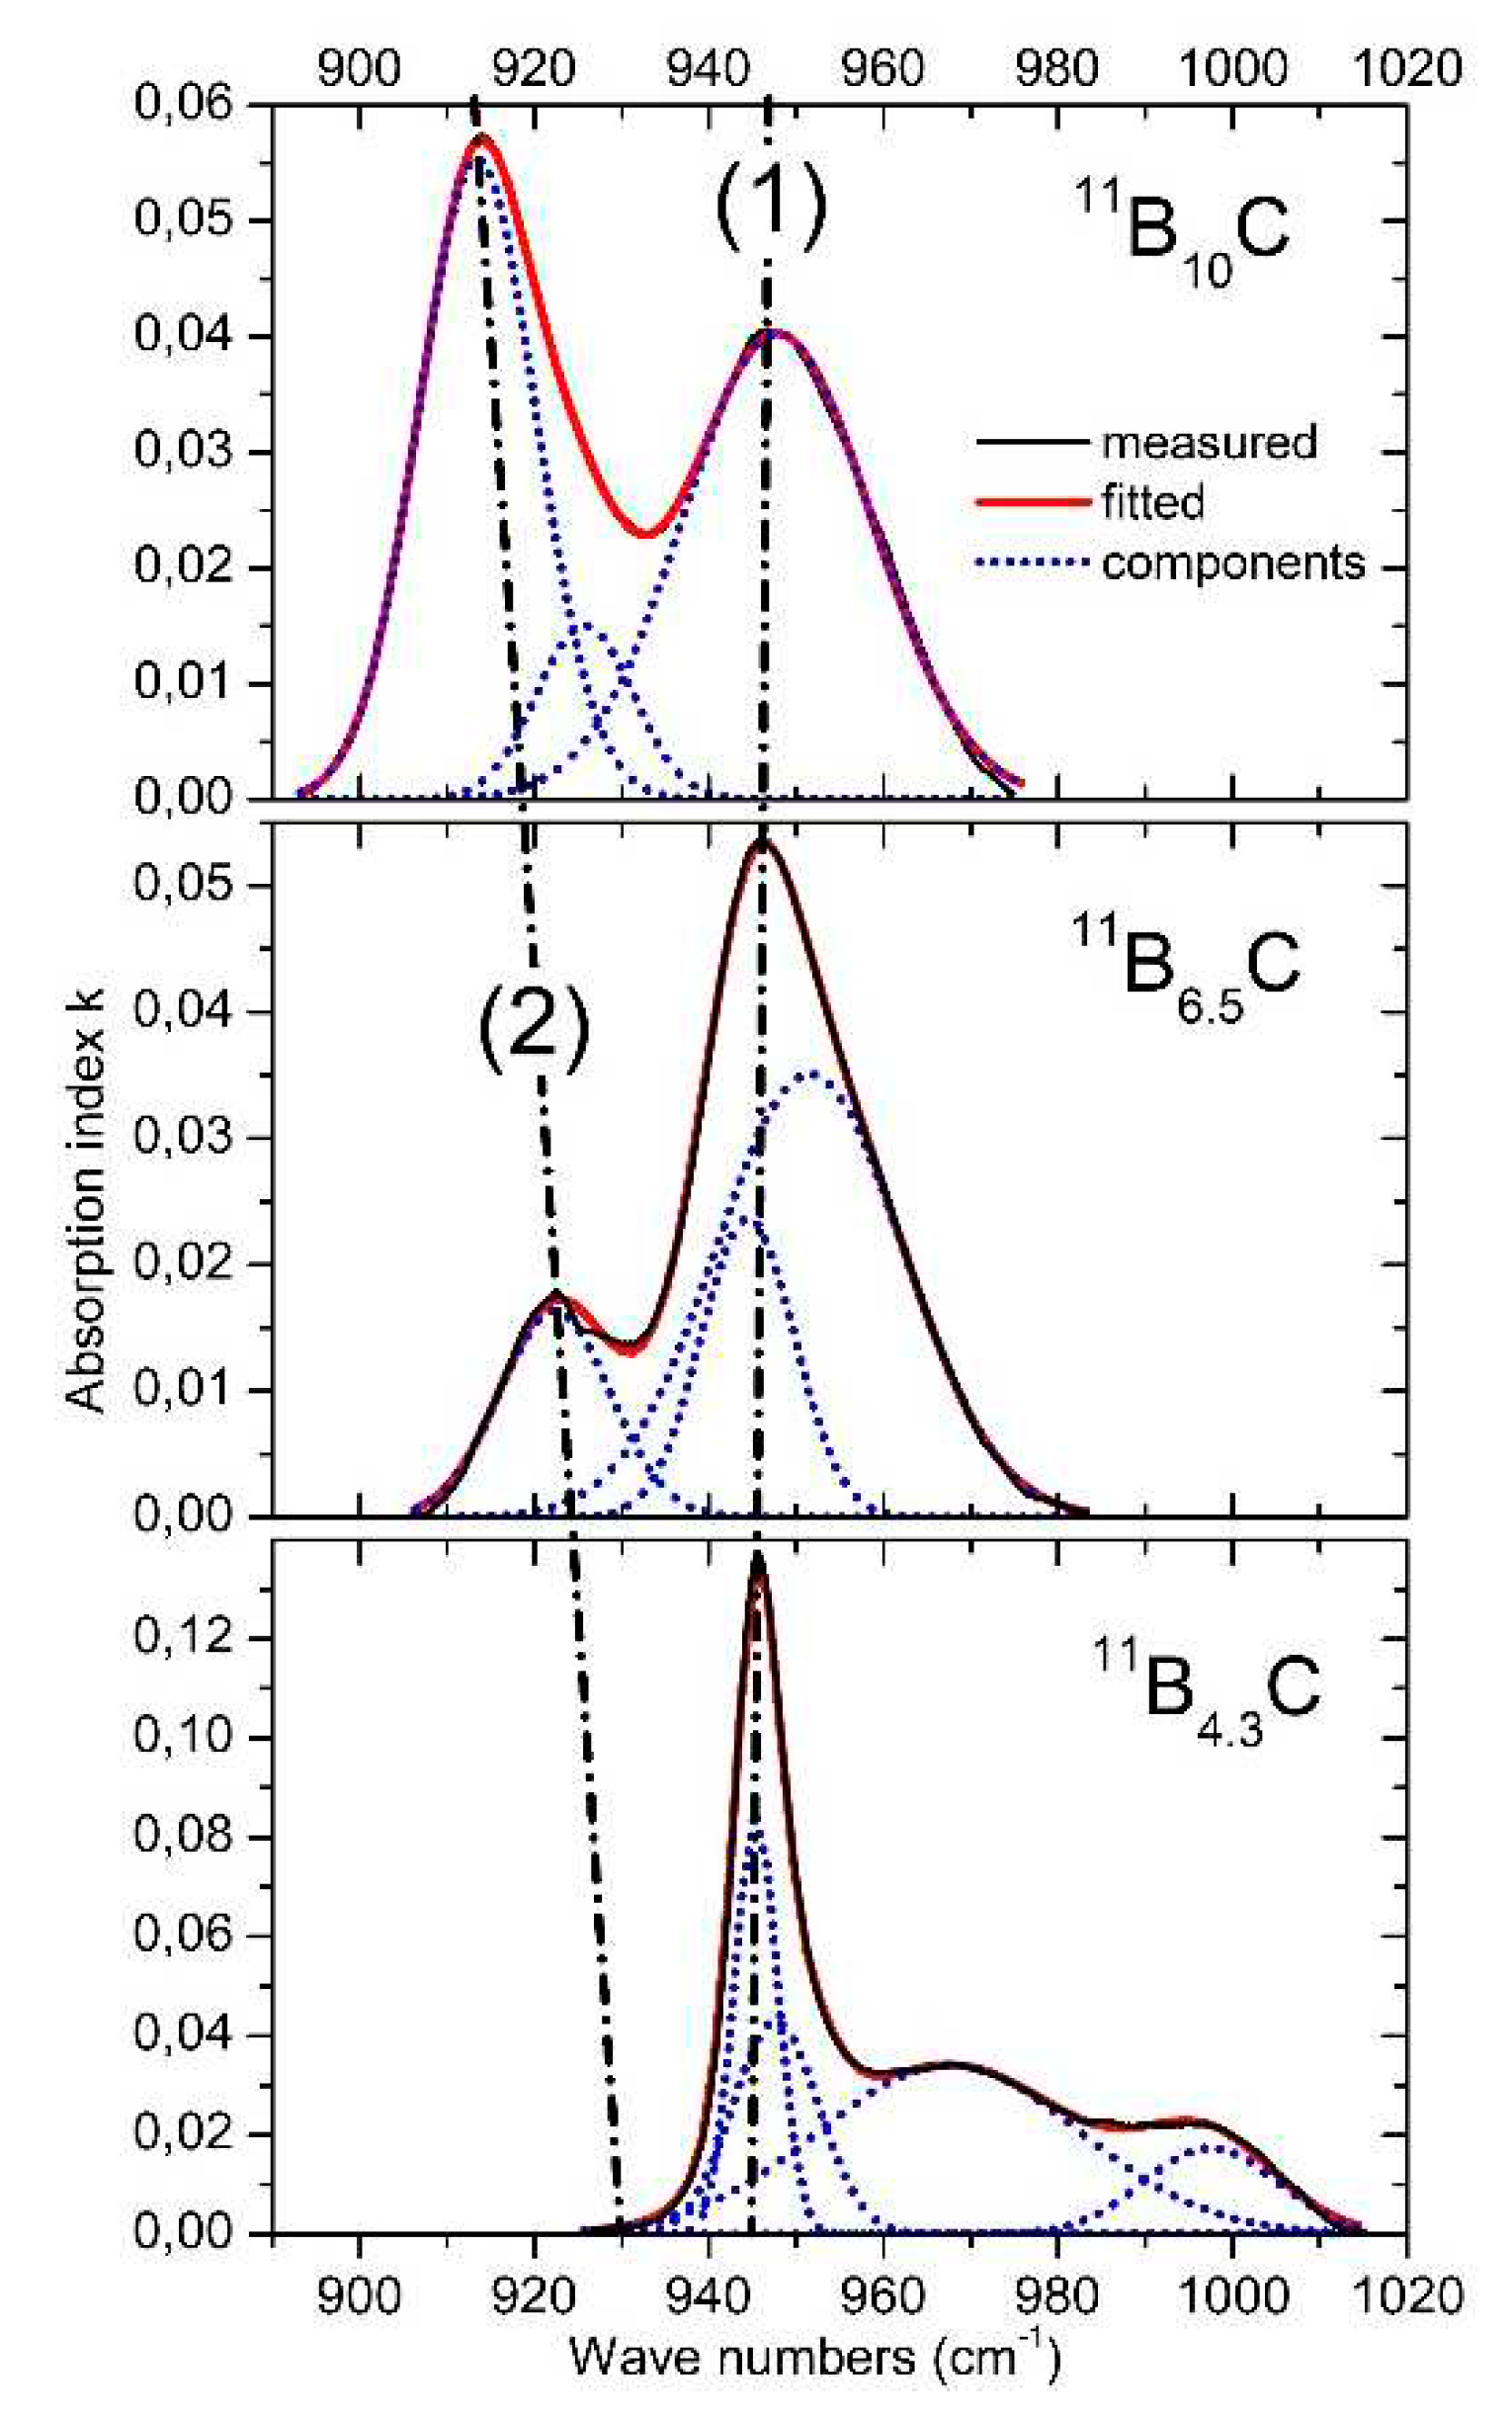
4.3. IR-active phonons near 940 cm-1
The phonon near 940 cm
-1 (
Figure 12) represents an icosahedral vibration proved by the counterpart in the spectrum of α-rhombohedral boron (see
Figure 2). According to Beckel et al. [
20], this phonon consists of superimposing E
u and A
2u modes. In boron carbide, the additional affect by polar C atoms in the icosahedra must be taken into account. This explains in principle the complexity of the phonon and of its change depending on C content.
The share of B11C icosahedra decreases from ~1 in B4.3C to ~0.1 in B10C. The main components (1) and (2) seem to vary continuously depending on the C content. There is no indication of a sudden change near B8C. Therefore, no involvement of this phonon in the phase transition at B~8C is discernible.
However, there is a significant change between B4.3C and B6.5C: two components of the phonon vanish completely. Unfortunately, there are no spectra in the intermediate range available, which could help explaining this behavior.
4.4. FIR-absorption
As indicated in the low-frequency region of
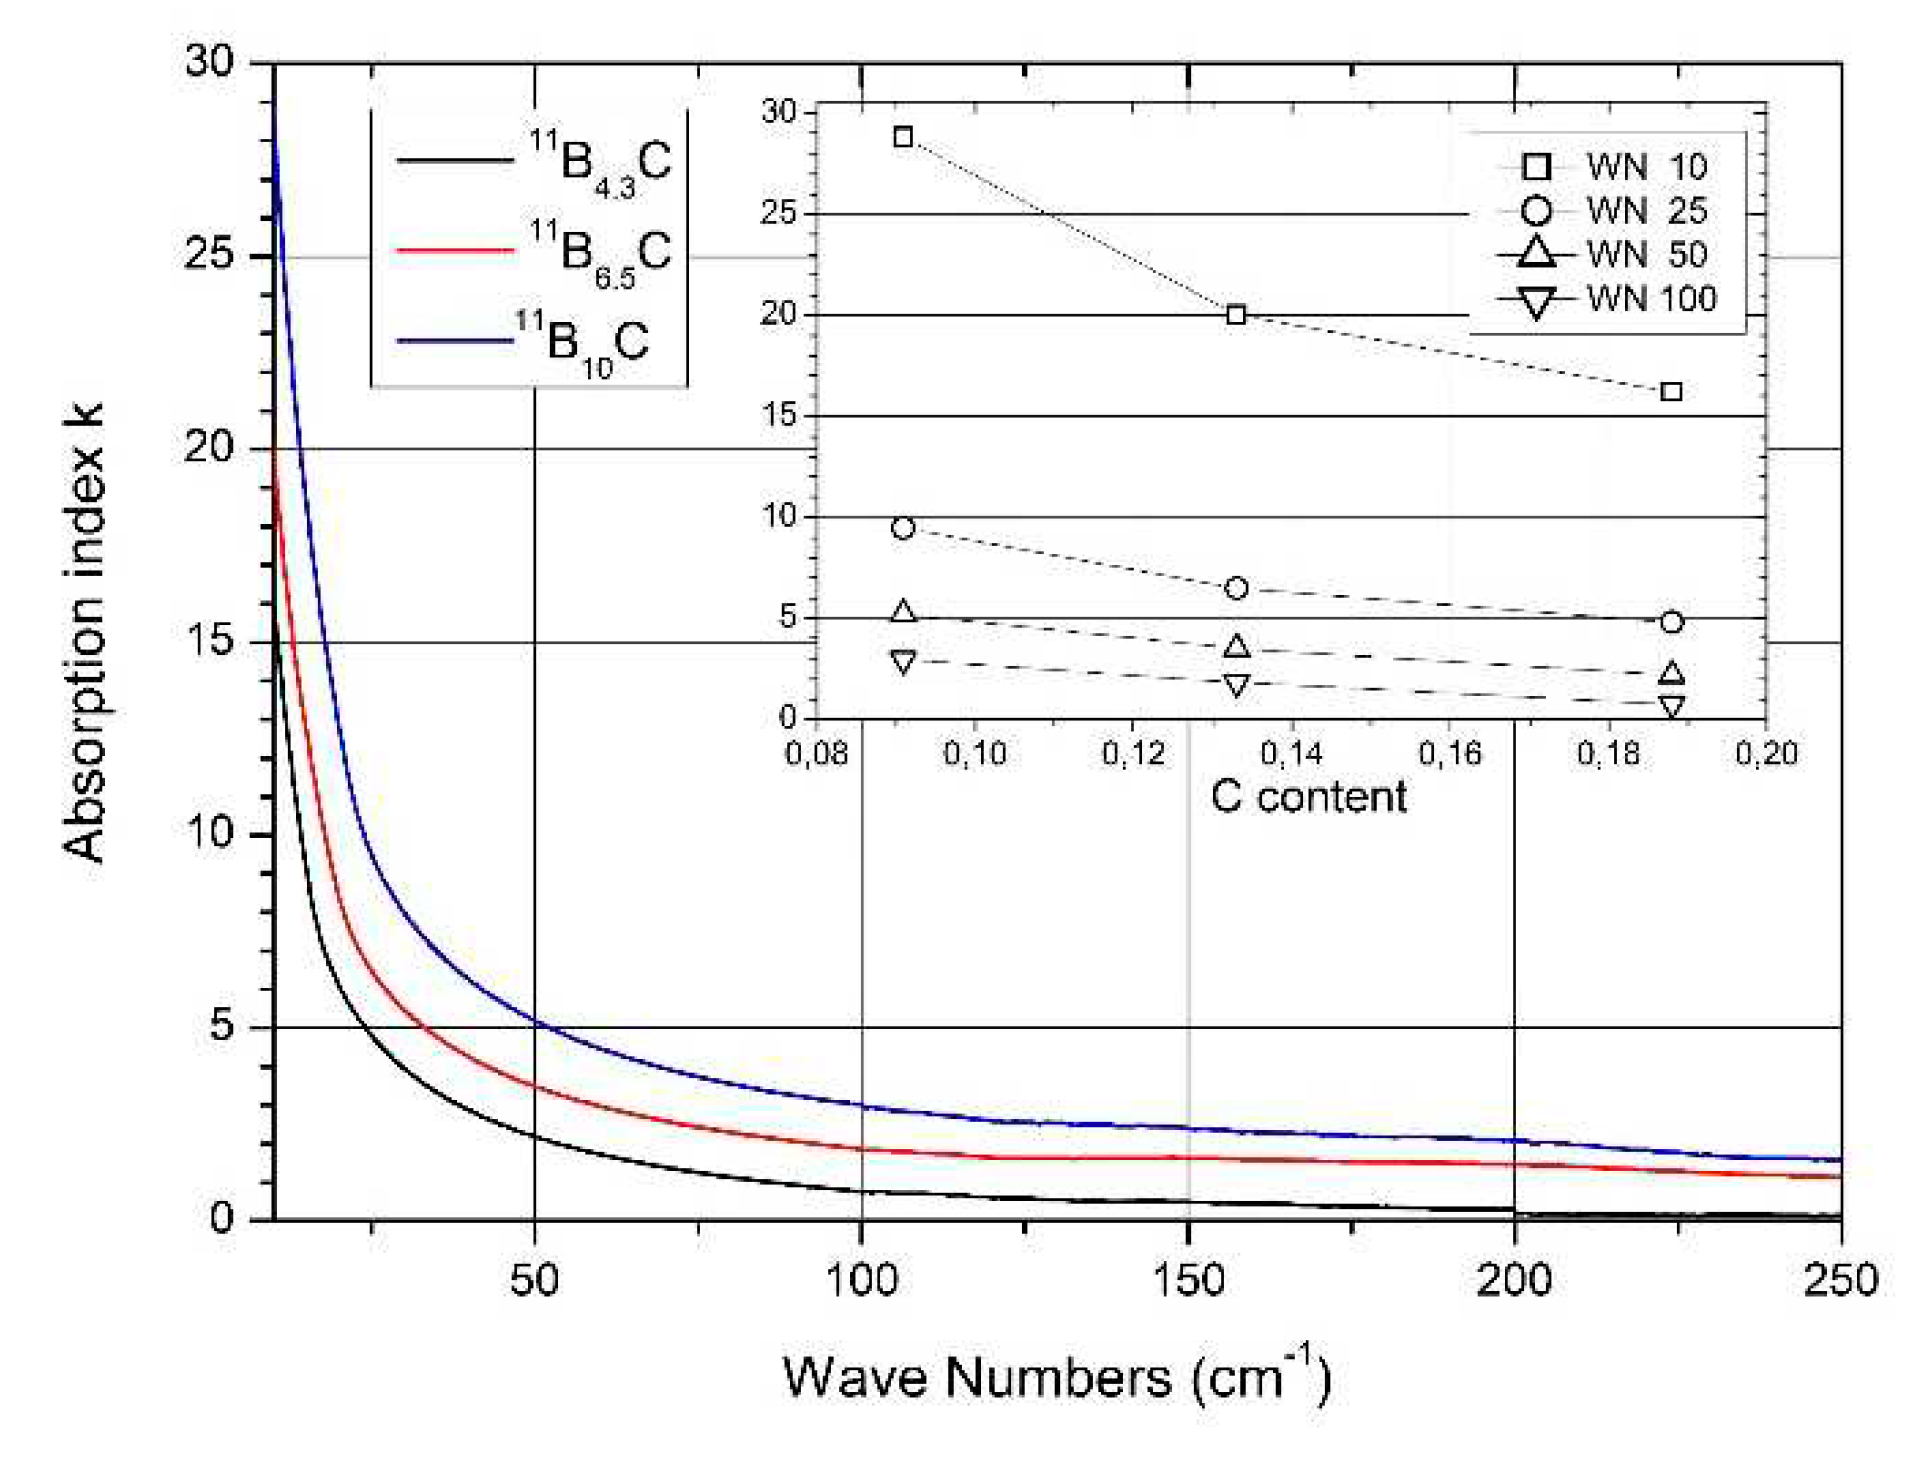
Figure 8a, the FIR optical absorption increases towards very low wave numbers.
Figure 13 shows this range extended down to 10 cm
-1. This absorption is caused by the plasma-like absorption of free charge carriers, which is heavily damped in boron carbide (for details see [
58]). With respect to the electric structure,
Figure 13 shows that the concentration of free carriers increases with the C content decreasing. However, there is no effect of the phase transition at B
~8C on the concentration of free holes discernable.
4.5. Raman-active phonons
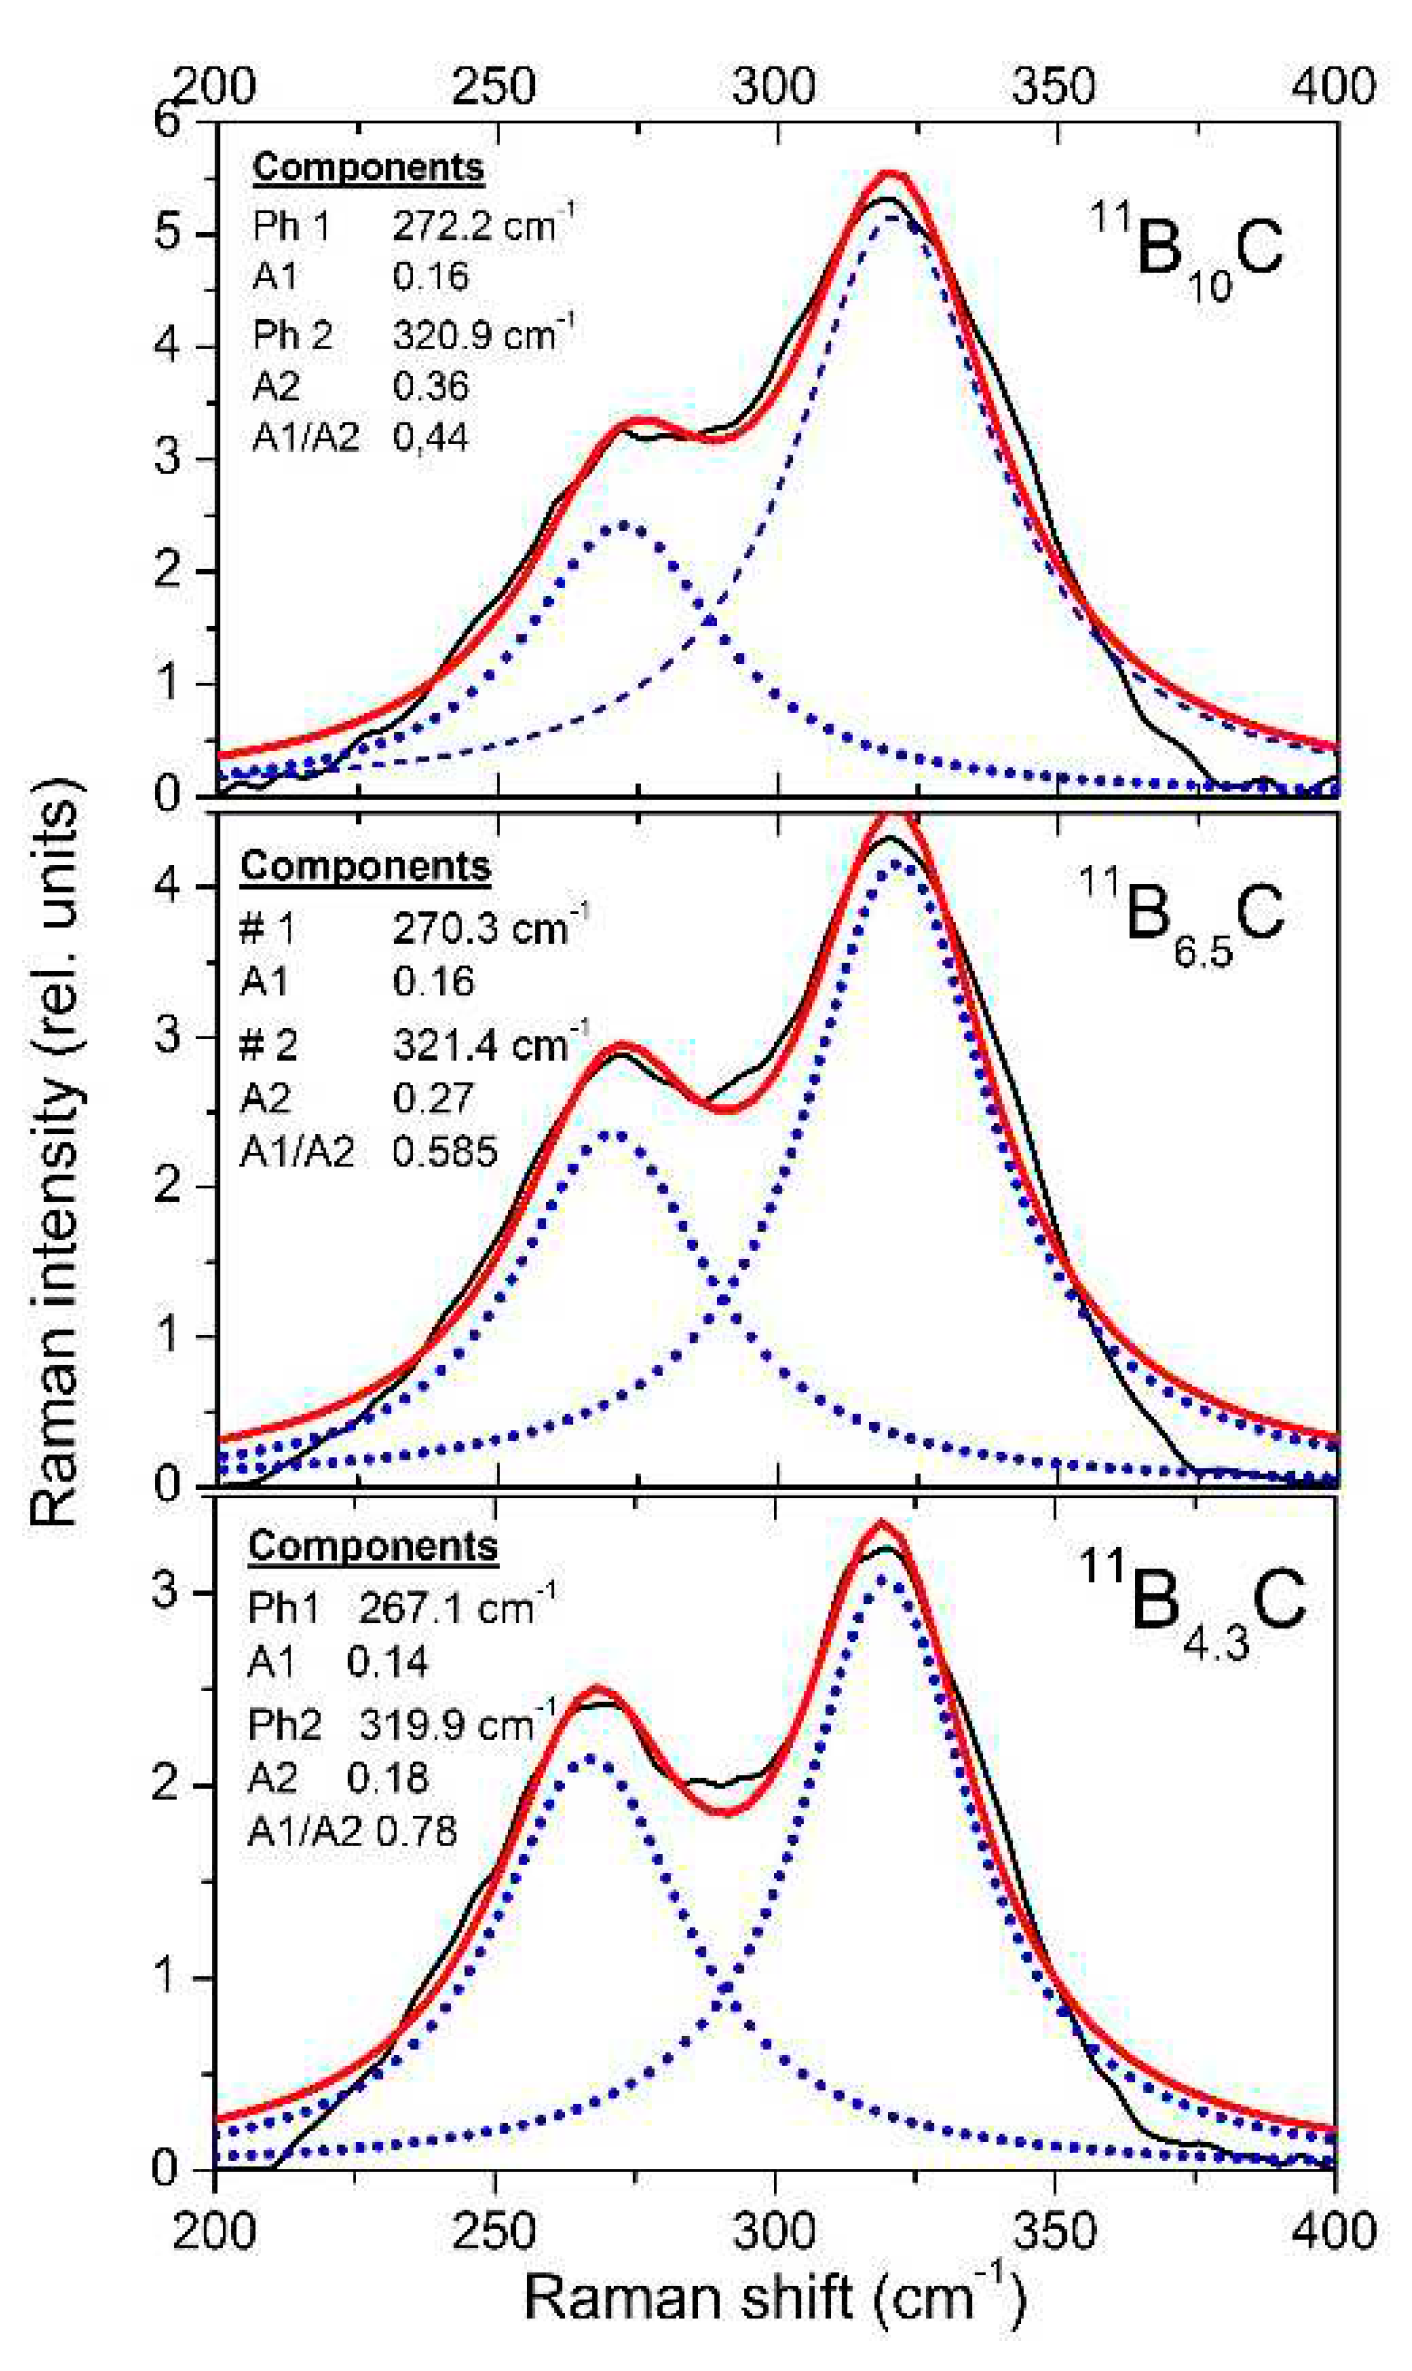
The resolution of the Raman spectra in
Figure 8b is restricted. Therefore, variations dependence on the C content cannot be doubtlessly identified, apart from the strong phonon doublet at 270/320 cm
-1. This has no counterpart in the spectrum of α-rhombohedral boron. Therefore, it is to be attributed to the structural changes in boron carbide by C atoms: B
11C icosahedra, CBC or CBB chains.
We attribute this doublet to the E
g phonon at 335 cm
−1 described in the theoretical study of Shirai and Emura [
54] as a rotation of the CBC chain associated with a wagging icosahedron, and assume that the splitting could result from the occupation of the atomic sites involved partially occupied by C or B atoms (see [
12]).
The strengths of both components change monotonically depending on the carbon content. There is no indication that this phonon is involved in the phase transition at. B~8C.
5. Phase transition at 712 K
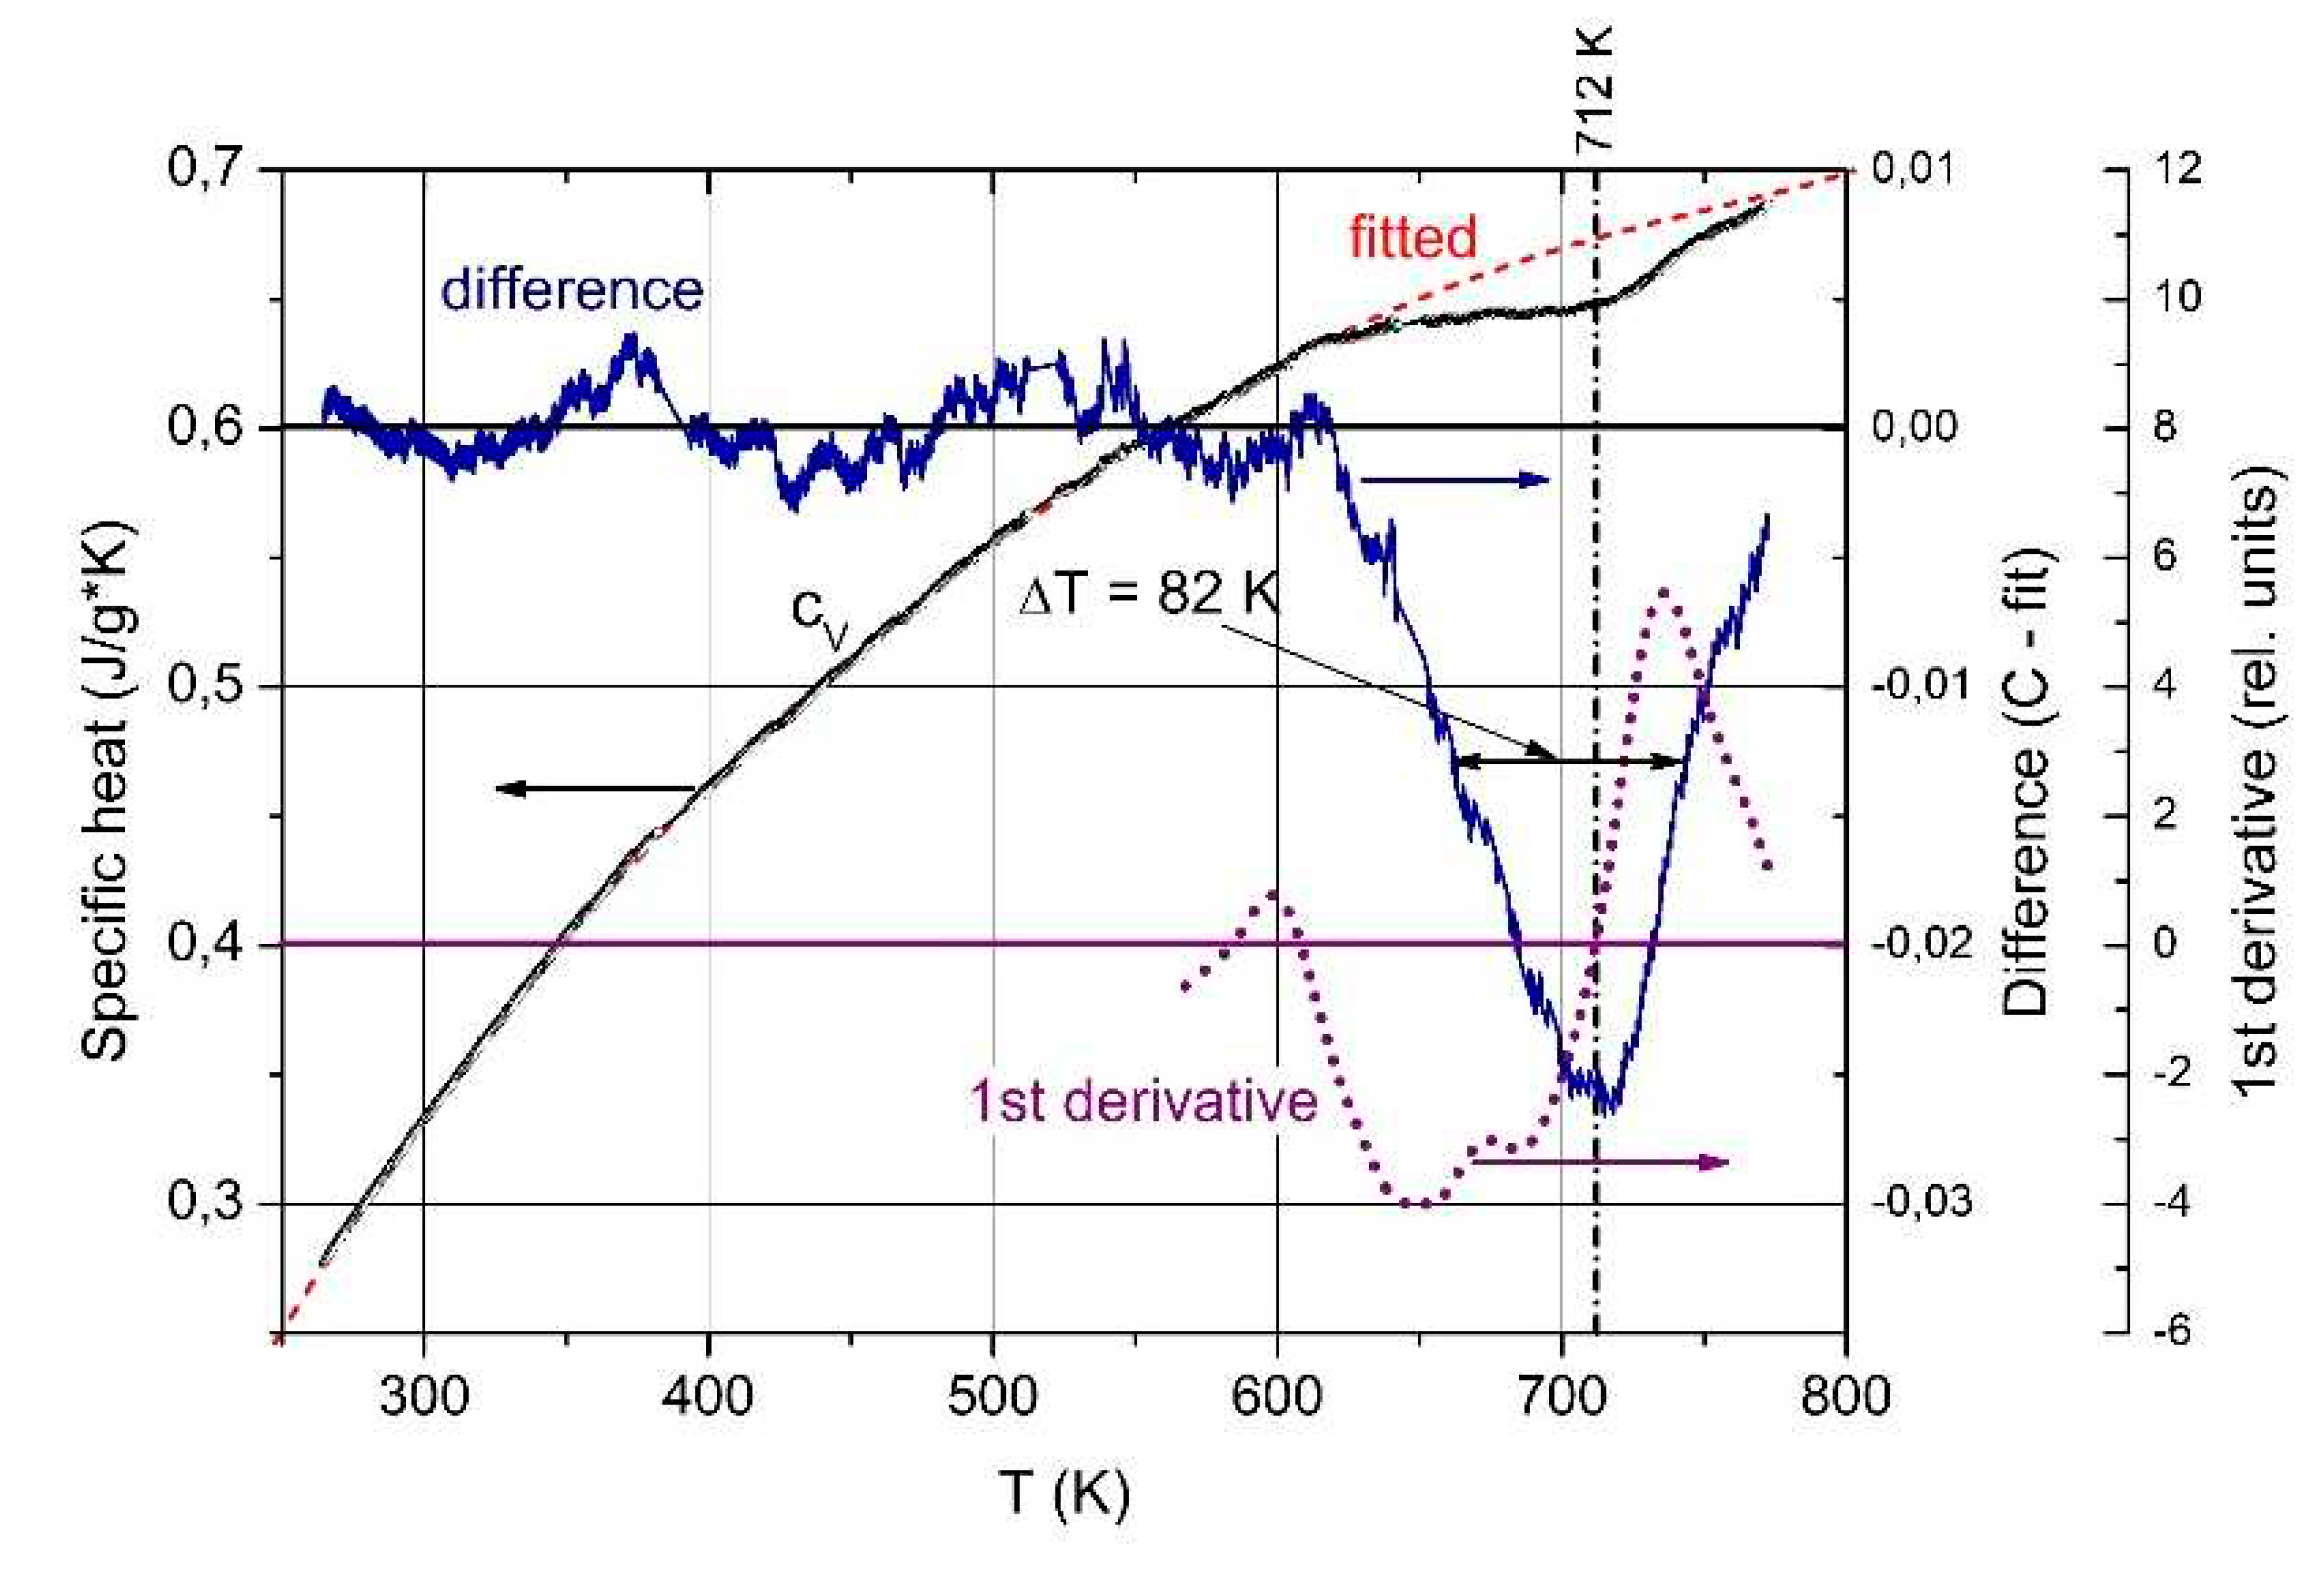
The T-dependent specific heat (
Figure 15) shows an exothermic phase transition at 712 K, halfwidth 82 K [
59]. The correlation of this phase transition with a structural change is proved by the electrical conductivity, whose activation energy 140 meV is correlated with content of B
11C icosahedra and polar C atoms respectively (see above). At carbon contents below the phase transition B
~8C it is no more detectable [
47].
Yao et al. [
60] described theoretically in this range a however endothermic phase transition that is related to the site exchange of carbon atoms within the icosahedra. Obviously, this process is not compatible.
Complete temperature-dependent phonon spectra of boron carbide are available below 450K only. Exception is the IR-active phonon mode near 400 cm
-1 available between 100 and 800 K (
Figure 15a) [
59]. The spectra suggested a structural change by mode splitting near the phase transition. However, this splitting is feigned.
As shown above, the IR-active phonon mode near 400 cm
-1 consists of two components. One of them is an icosahedral vibration identified by the equivalent vibration in α-rhombohedral boron (see
Figure 2). As such it is mentioned by Beckel et al. [
20] but not described in detail. Shirai et al. [
54,
61] and Vast et al. [
46,
55] attribute the second component to the central B atom in the CBC chain vibrating perpendicularly to the chain axis. We analyzed the IR absorption of this phonon accordingly. The parameters of both components are displayed in
Figure 12b, showing that the before assumed split was feigned by the considerably different temperature dependence of the components.
Passing the phase transition, the frequency of the component representing the icosahedral vibration decreases clearly from 405 cm
-1 at low T to 395 cm
-1. Simultaneously, the phonon strength concerned increases marginally showing that the number of vibrating elements remains nearly unchanged. The atomic bonding force concerned falls slightly in the range of phase transition, but is nevertheless clearly measurable. It is surprising that the range of decrease is wider that the half width of the phase transition (
Figure 14). Anyway. a certain effect of the phase transition on the electronic properties is clearly established.
The vibration of the central B atom in the chain behaves different. The frequency remains nearly constant showing that the bonds within the CBC chain are hardly affected by T. In contrast, the phonon strength representing the number of vibrating elements decreases considerably.
A certain difference of the structures below and above the phase transition is indicated by the frequency of the icosahedral phonon near 400 cm
-1 (
Figure 15b), which decreases from 405 cm
-1 at low T to 392 cm
-1 at high T. In contrast, the frequency of the bending mode of the central B atom in the CBC chain decreases at most marginally from ~414 to ~407 cm
-1. The redistribution of polar C atoms in the phase transition affects the bonding force within the icosahedron and in consequence the electronic structure as well.
An important further characteristic of this phase transition can be obtained from the electrical conductivity at pressures up to 9 GPa [
51]. The phase transition is reversible, however with considerable relaxation time.
6. Phase transition at 32 GPa
The drastic change from opacity to glasslike transparency is the visual appearance of the phase transition in boron carbide at 32 GPa. Hushur et al. [
38] used the photos shown in
Figure 17 for roughly estimating the band gap increasing at increasing pressure. This implies that the electronic structure of boron carbide known from ambient conditions [
15] (see
Figure 3) changes fundamentally at high pressure.
In
Figure 17 [
38], the estimated shift of the band gap is compared with theoretical model calculations on undistorted and distorted boron carbides [
42,
43,
62,
63,
64,
65] and experimental results [
38,
66,
67]. Obviously, this phase transition converts boron carbide, as it is commercially available or prepared in laboratory scale and apparently basically highly distorted, into a largely undistorted state, which is at least close to the idealized models used in theoretical calculations.
At rising pressure, the band gap increases from values near 2 eV, experimentally determined [
66] and theoretically attributed to a strongly distorted boron carbide [
64] to gap widths between 3 and 4 eV, theoretically predicted for idealized meaning defect-free boron carbide.
Ektarawong et al. [
64] studied how the distribution of icosahedral C atoms affects the electronic DOS. They used the idealized (B
11C) CBC) structure and ignored changes in the CBC chain. In the icosahedra, 6 polar B(1) and 6 equatorial B(2) sites are occupied by B atoms, apart from one upper polar site p1 substituted by C. This C atom is slightly shifted towards the center of the icosahedron (see Ref. [
25] and references cited therein). The energetically most favorable defect structures are generated by the transfer of the C atom to both neighboring p2 and p3 sites respectively, followed by transfers from p1 to the lower polar sites p4, p5 and p6 respectively. Ektarawong's RNG model is based on the assumption that the polar C atoms are randomly distributed over all six polar sites.
Rasim et al. [
27] take the idealized (B
12) CBC structure model for reference. As mentioned above, this model is not compatible with real boron carbide. Nevertheless, in this study it excludes interfering effects in icosahedra when calculating the effects on the DOS by exchanging the CBC chain by other structure elements of various chain structures.
Both approaches mark significant achievements compared with the previous theoretical studies based on idealized and therefore unrealistic structure models. In
Figure 19 [
15], we check to what extend the DOS of both model calculations are compatible with the electronic transitions in the empirical band scheme (
Figure 4) based on experimental results. These fit excellently to Ektarawong’s RNG model, assuming random distribution of icosahedral C atoms over all polar sites [
64].
Taking these results into account, the strong optically excited transitions between ~2 and ~3.5 eV, which are responsible for the opacity of boron carbide at ambient pressure, are evoked in any way by the polar C atoms in boron carbide. The strong optical absorption concerned fulfills the requirements of electronic interband transitions and has been interpreted accordingly. Compared with classical semiconductors, the polar C atoms in boron carbide differ decisively from dopants with one excess electron forming low density states in the gap. In boron carbide, the distribution of polar C atoms at room temperature induces high density electronic states. But a “simple” redistribution of the polar C atoms at high pressure apparently to a higher degree of order makes these high-density states completely disappear. This redistribution is reversible. That means, the largely defect-free structure at high pressure [
38] is metastable only, while the distorted structure is the thermodynamically stable one, at least at ambient conditions.
The reversibility of the structural distortion induced by the C atoms randomly distributed over all six polar sites requires revising a sometimes-used model based on the assumption that the actual distorted structure of boron carbide is a non-equilibrium state only [
60].
The DOS of boron carbide affected by structural elements replacing the CBC chain, calculated by Rasim et al. [
27], is obviously not compatible with the high-pressure phase transition. Indeed, there are some experimentally determined narrow levels in the band scheme, which may be correlated with specific structural elements assumed to replace the CBC chain. However, the optical absorption related is obviously far too small for explaining the strong absorption in this range at ambient conditions.
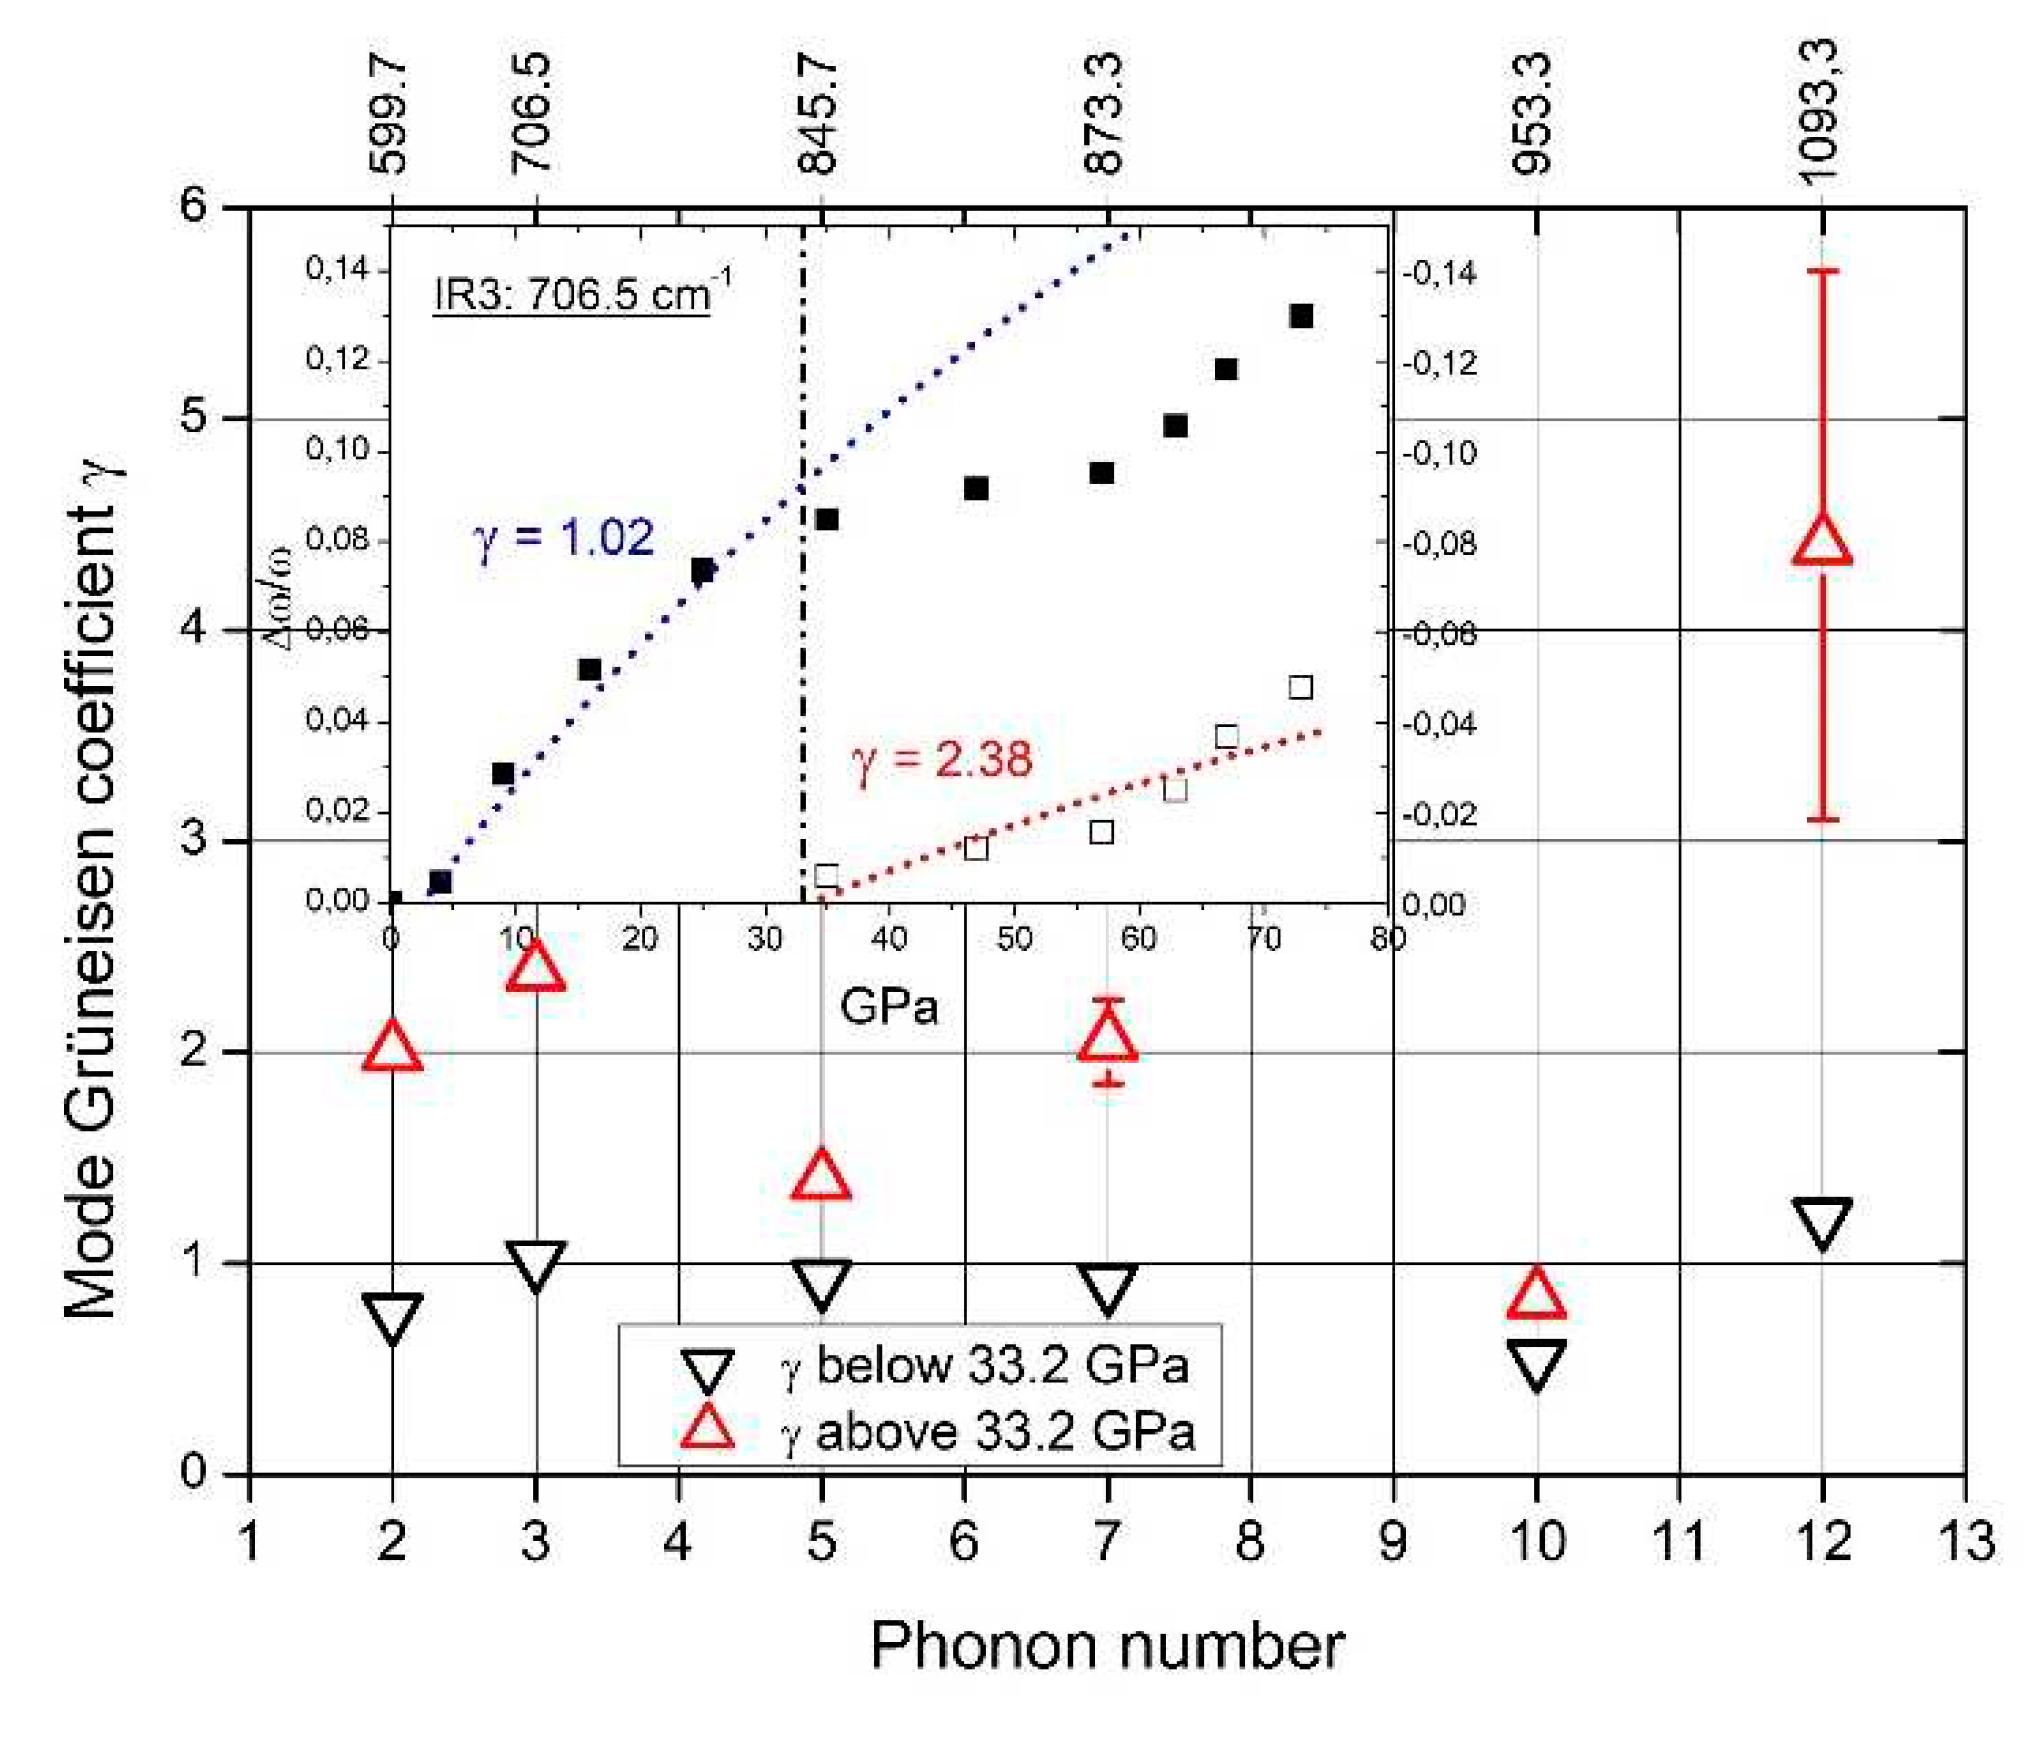
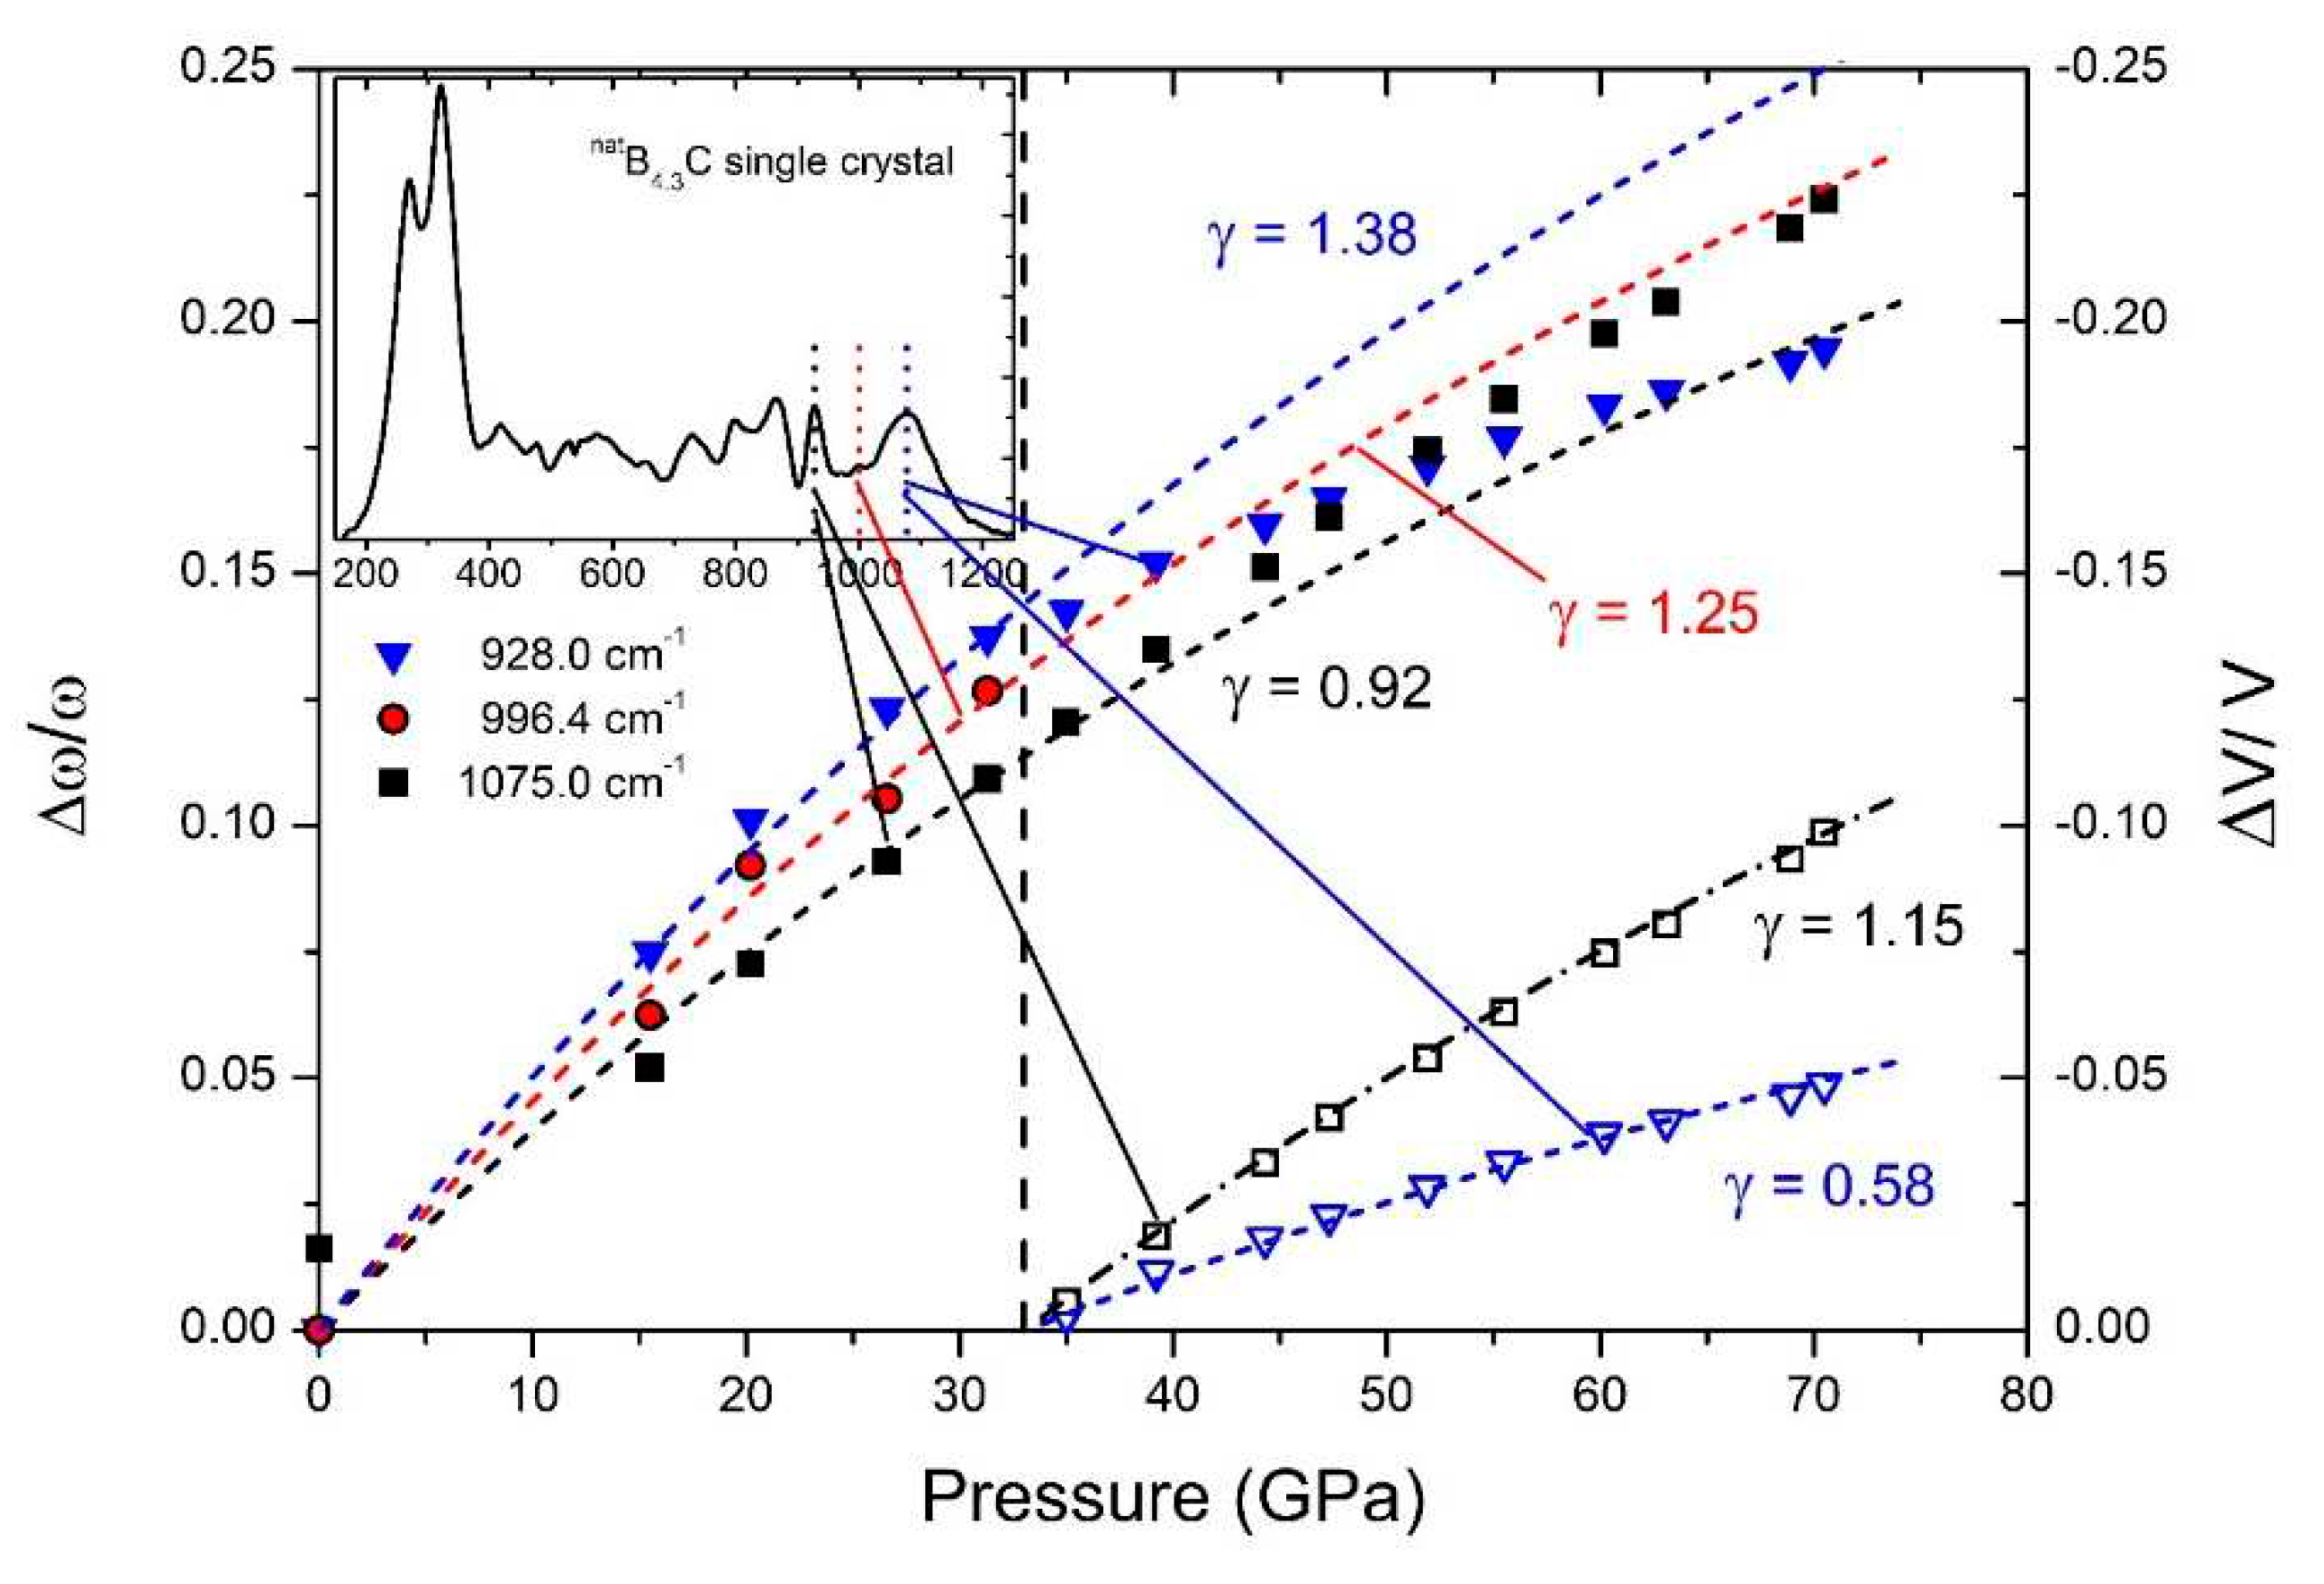
The rearrangement of polar C atoms means a structural change and should therefore be verifiable in the phonon spectra. Actually, the whole structure is affected by the phase transition at 33 GPa. This is proved by the phonon mode Grüneisen parameters γ. In case of all IR- and Raman-active phonons, γ differs more or less considerably at pressure below and above the phase transition [
12,
29,
56]. Unfortunately, in the pressure-dependent IR-phonon spectra of Chuvashova et al. [
28], accordingly commented in [
29] (some results are shown in
Figure 19), the IR-active phonon near 400 cm
-1 has been neglected. As shown above, a component of this phonon is sensitive regarding polar C atoms in B
11C icosahedra.
The spectra of IR- and Raman-active phonons (
Figure 8) exhibit strong, probably partially split peaks near 1100 cm
-1. These are at least partially attributed to intra- and inter-icosahedral vibrations of polar atoms in the icosahedra. Hence, they should be affected by the rearrangement of polar C atoms.
In
Figure 21, the Grüneisen coefficient of the 1093.3 cm
-1 IR phonon above the phase transition exceeds that of the other phonons considerably. Moreover, the difference to the value below the phase transition is especially large. This suggests that the redistribution of polar C atoms increases the bonding force considerably.
The Grüneisen coefficients of concerning Raman-active phonons, determined in
Figure 21, change significantly at the phase transition, obviously due to rearranging polar C atoms.
In the Raman spectra of boron carbide, the phonon doublet at 270/320 cm-1 is the most striking feature.
Werheit et al. [
12] assigned this doublet to the 335 cm
-1 Eg phonon that Shirai and Emura [
54] attributed to a rotation of the 3-atom chain combined with a wagging icosahedron. Firstly, it is surprising, that this phonon splits, though there are only B
11C icosahedra in B
4.3C. This could be explained as follows: The translation vectors of atoms involved in this phonon (see
Figure 1 in Ref. [
54]) show that 8 of 12 atoms in the icosahedra and 4 of 6 polar sites respectively are involved. Assuming that the C atom is randomly distributed over all polar sites of the icosahedra, there are B
11C icosahedra with C atom on sites, which are involved in this vibration, while others contain exclusively B atoms on such sites. Due to different m
red, the phonon mode splits and the components Ra 1 (~ 270 cm
-1; C on one of the relevant sites) and Ra 2 (~320 cm
-1; B atoms only) could be attributed accordingly.
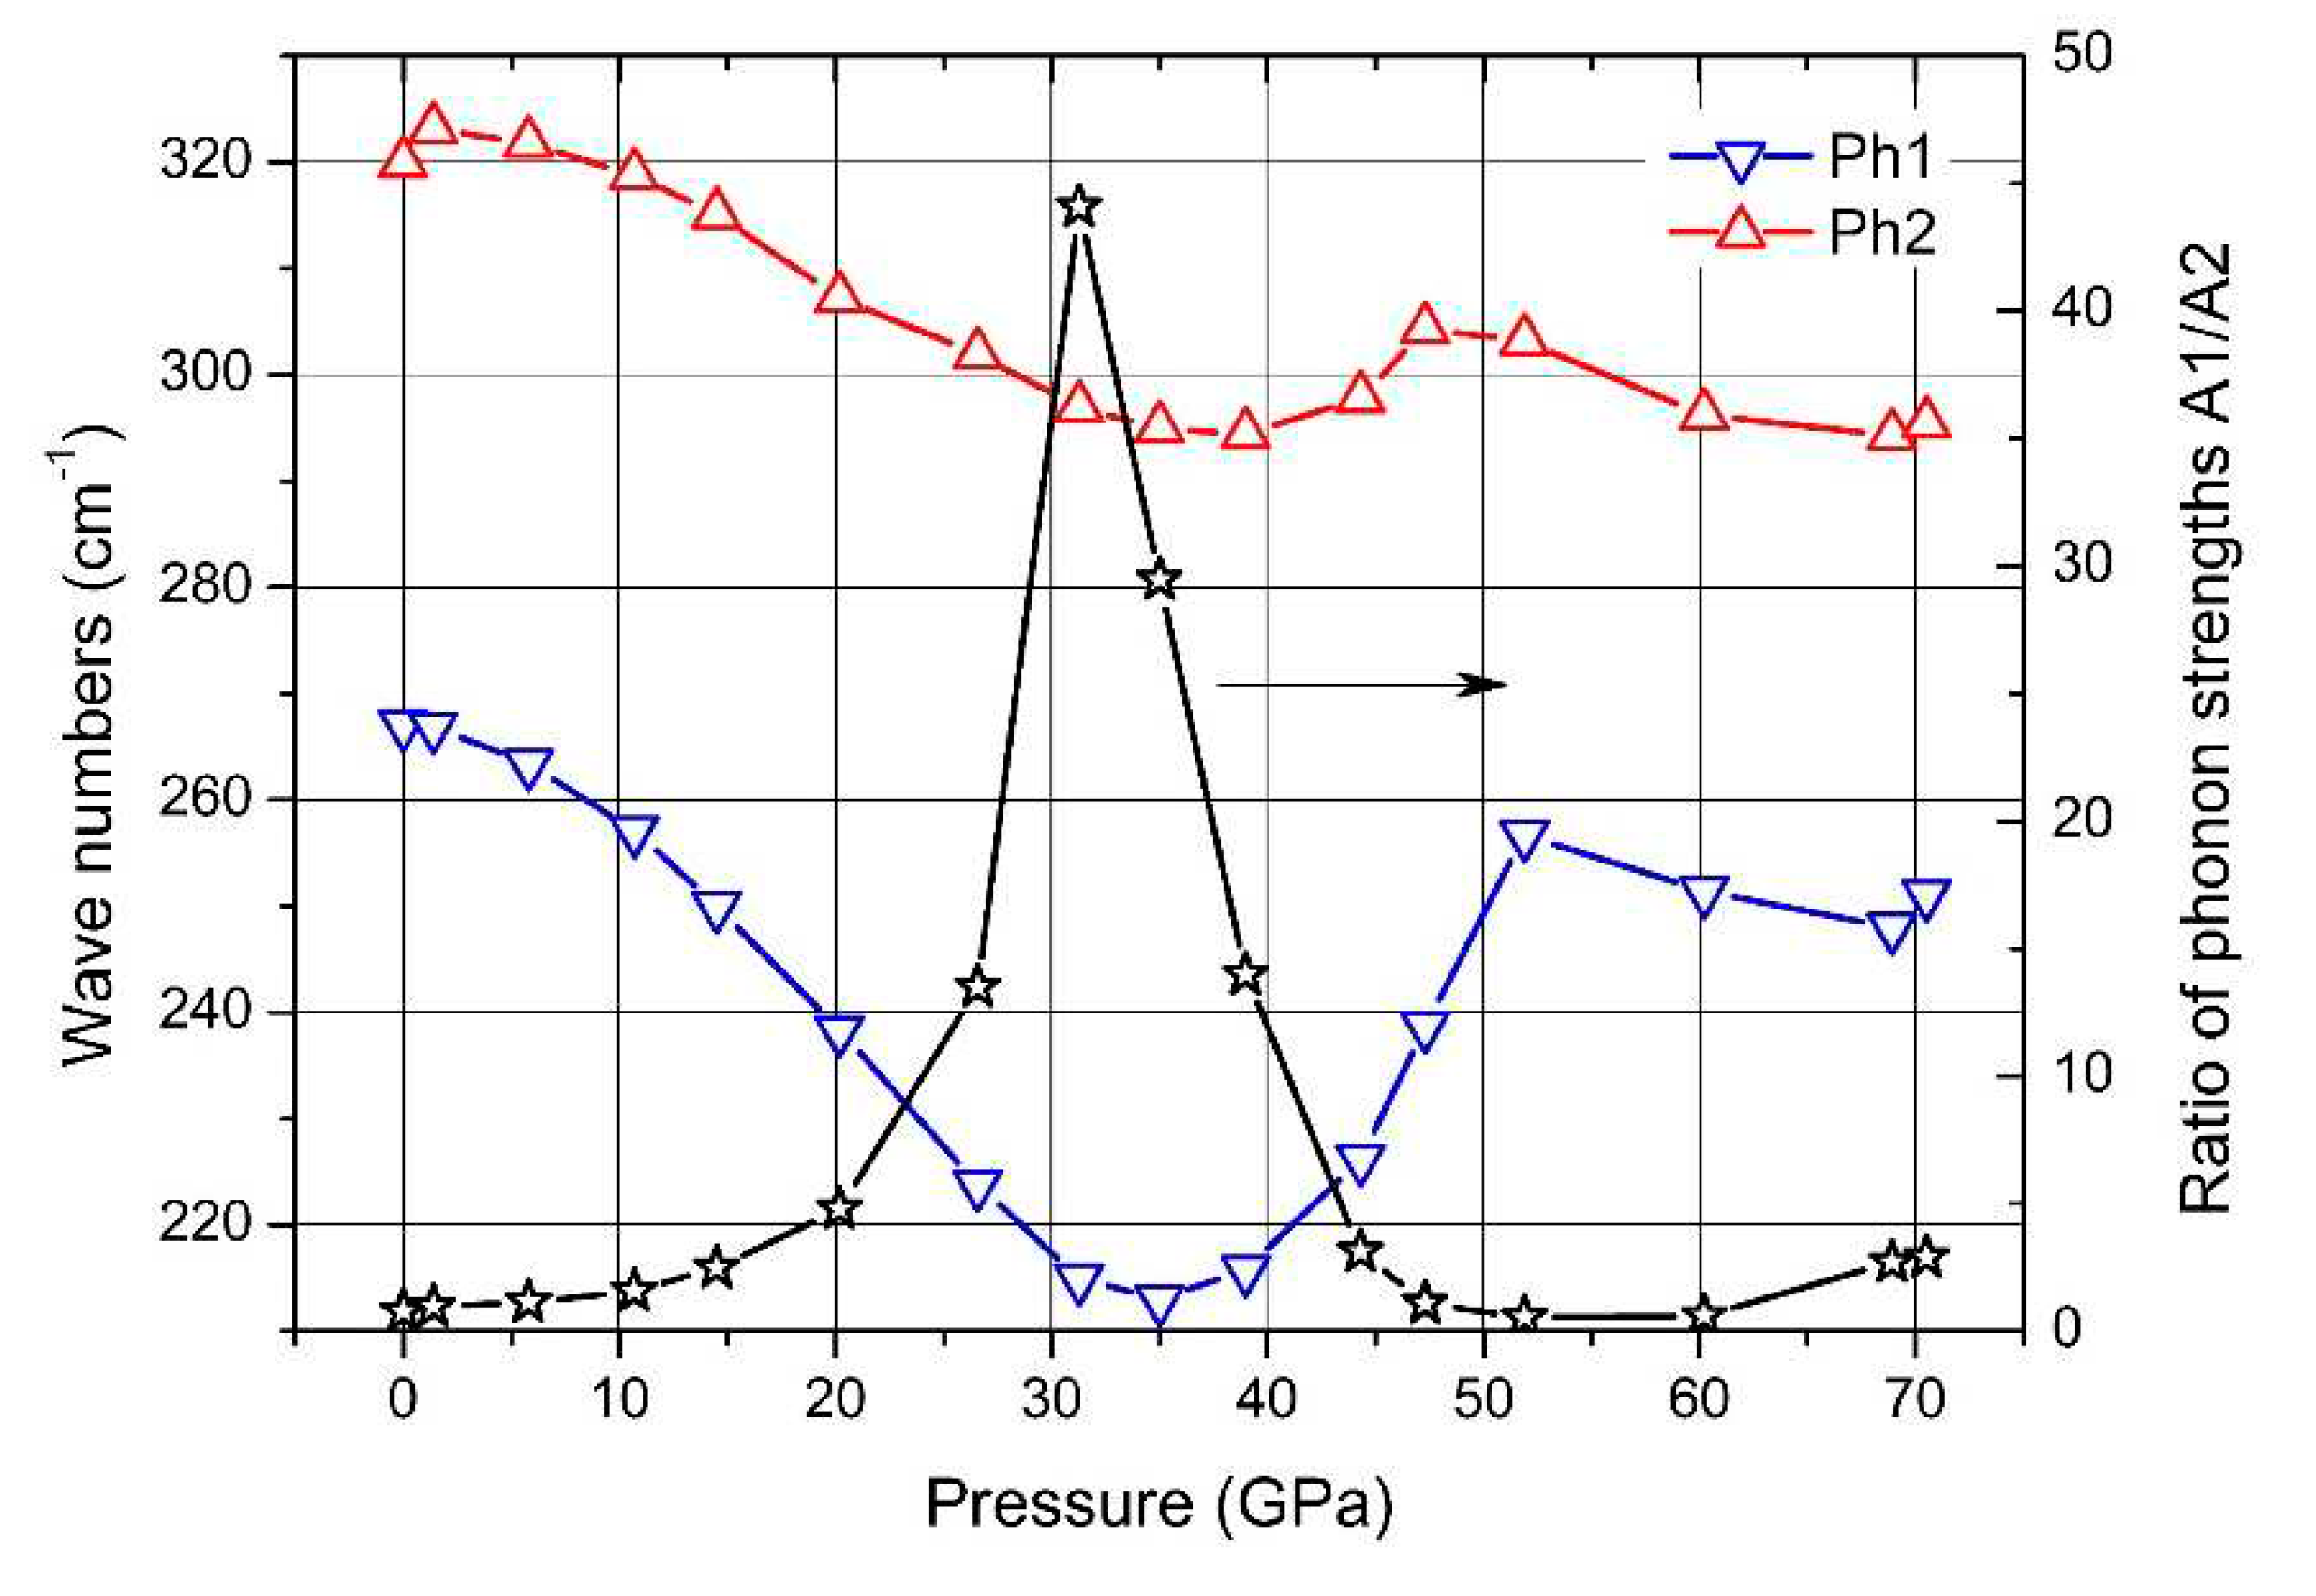
The negative Grüneisen coefficients of both components differ fundamentally from all other phonons. Normally, compression reduces the lattice parameters, leading to a positive Grüneisen parameter, at least in cases, when the force constant is not affected. However, exactly that seems to be the case in boron carbide in connection with the rearrangement of polar C atoms at the high-pressure phase transition.
In
Figure 22, some parameters of both components of this doublet are displayed. For the evaluation had to be considered, that the spectra were obtained using a laser with problematic excitation energy (for details, see [
17]). While the phonon frequencies are not affected this way, the phonon strengths A1 and A2 derived from the measured spectra depend uncontrollably on pressure. This influence is eliminated by determining the ratio A1/A2 of both components shown in
Figure 20.
7. Discussion
The electronic structure of boron carbide is dominated by B11C icosahedra. In comparison, the influence of the 3-atom chain is of minor importance. This is obvious in the phase transition near the chemical composition B~8C, which is clearly related to the concentration of B11C icosahedra. The fact that this transition occurs at about 25% B11C instead of 50% shows the particular influence of polar C atom that is missing in the frequently used hypothetical structure model B12CBC. Whether the distribution of one C atom on 6 possible polar sites has any effect within this composition-dependent phase transition remains open.
However, the distribution of polar C atoms is doubtlessly important in B
4.3C with ~100% B
11C icosahedra. The phase transitions at 712 K and 33.2 GPa are directly related to the distribution of the polar C atoms. At ambient conditions, boron carbide is opaque. Its optical absorption in the visible range of the optical spectrum is high, due to optical transitions related to gap states shown in
Figure 4. Hushur et al. [
38,
56] showed that high pressure changes the opacity drastically to transparency indicating a highly ordered structure. However, this is metastable only, as it retransforms into the disordered state reverting to normal conditions, albeit with considerable relaxation time. Accordingly, the distorted structure is energetically favored at ambient conditions. Applying this knowledge to the hypothetical structure B
12CBC possibly explains, why this highly ordered structure is unstable compared with the distorted structure of natural boron carbide.
This leads to the conclusion that Ektarawong’s RNG model, assuming random distribution of polar C atoms over all polar sites at ambient conditions, is close to reality. The phase transitions at 712 K and 33.2 GPa both transform this distorted structure of boron carbide at ambient conditions (statistical distribution of 1 C atom per icosahedron to 6 polar sites) into a structure of higher order. This means occupation of anyway preferred polar sites; however, the actual distribution remains open. More detailed characterization of the phonon spectra might help.
In this study, the phonon spectra of boron carbides with natural isotope distribution and those highly enriched with
11B isotopes have been analyzed. Thus, isotopes could have a certain effect (for details, see [
68]). The force constants of different isotopes are the same. Hence, the shift of the icosahedral phonon frequencies in B
4.3C boron carbides, which are enriched with
12C and
13C respectively (see spectra in [
52,
69]), yields the relation of reduced masses involved.
