Preprint
Review

Sustainable Solutions: Examining the Influence of Energy Subsidy Strategies on Urban Heat Islands in the Persian Gulf Region

Altmetrics

Downloads

134

Views

67

Comments

0

This version is not peer-reviewed

Submitted:

01 September 2023

Posted:

04 September 2023

You are already at the latest version

Alerts
Abstract
Ever since oil was discovered in the Persian Gulf Region in the 1920s, the oil and gas industries have been dominant in the area. These countries are responsible for generating approximately 35 percent of the world's natural gas and 25 percent of its crude oil, making them the largest crude oil producers globally. The release of carbon dioxide (CO2) into the atmosphere is directly linked to the use of fossil fuels. CO2 accounts for 58.8 percent of all greenhouse gas emissions caused by human activities and has a detrimental impact on urban residents through the urban heat island effect. A significant portion of these emissions can be attributed to residential buildings. Some nations exacerbate the problem by relying excessively on fossil fuels. Oil-rich countries provide energy subsidies to the public in order to lower energy costs for their citizens. However, this policy can have negative consequences, including wasteful energy usage in countries like Iran.
Keywords: 
Subject: Engineering  -   Energy and Fuel Technology

1. Introduction

With the rapid development of industry in recent decades, people in the Persian Gulf Region have been migrating to cities, causing urban ecological and environmental problems [1]. New research by the World Bank projects that millions more could be on the move in the next few decades due to challenges related to thermal conditions in urban environment [2]. These challenges impact the comfort of people's living standards, the climate, the atmospheric environment, and the natural habitats, resulting in higher energy usage and the release of greenhouse gases [3]. The thermal conditions in urban areas have notable effects on the local climate and micrometeorology. The changes in these conditions over time and space are closely linked to societal and economic activities. [4,5].
Abdolmajid Naderi Beni and colleagues [6] have provided evidence, using temperature data from the Global Historical Climatology, that indicates a minimum temperature rise of Co2 in the Persian Gulf Region since 1950. This temperature increase is linked to the impact of greenhouse gases emitted into the atmosphere, leading to radiative forcing. Several studies have consistently shown a warming trend in the region during recent decades, as there has been a substantial increase in the occurrence of warm days [7,8,9,10]. This data has led some researchers to predict that heat waves in the Persian Gulf Region will surpass the critical threshold for human adaptability in the next few decades [11]. Over the last decade, these extreme temperature (ET) events have become more intense and occur more frequently [12,13] resulting in substantial social and environmental consequences [14,15].
Regional warming has a stronger seasonal response [16]. Extreme temperatures (ETs) have detrimental consequences on both the economy and public health in the countries of the Middle East and North Africa (MENA) region [17,18]. Heatwaves in the MENA environment are expected to have negative impacts on human health [19,20] agriculture [21], water supply, available energy [22,23] and other socioeconomic sectors. Urbanization is already high and increasing, resulting in greater thermal stress due to the urban heat island effect (UHIE) [24].
The urban heat island (UHI) is the prominent climatic effect of urbanization, leading to negative impacts on the thermal comfort and overall well-being of urban residents. Previous research has indicated temperature variations, with a range of 1 to 2 °C between non-residential and urban areas, 1 to 7 °C between non-residential and green areas, and 1 to 5 °C between urban areas and green areas. [25] .The increasing residential construction in the urban areas of Persian Gulf Region contributes to some of the highest energy consumption rates globally. With increased energy consumption, greenhouse gas emissions also escalate, and these emissions are widely acknowledged as the main driver of climate change and its associated impacts [26].
The main cause of increased temperature in the Persian Gulf Region is Carbon Dioxide Emission (CO2e). Energy-related CO2e differs from country to country due to domestic energy configurations, however, researchers have been able to link economic growth to energy consumption [27]. The increase in economic growth has negatively impacted environmental sustainability and led to environmental degradation at both the national and global levels [28].
Carbon dioxide emissions of across many nations of the world have been studied. In the Middle East and North Africa [29] energy consumption and emission of CO2 analyzed by using data Estimates based on envelope analysis. Data Envelopment Analysis (DEA) is a quantitative technique used to evaluate the relative efficiency of multiple decision-making units (DMUs). Mohammed Qader [30] in his research established a connection between the electricity consumption of Persian Gulf Cooperation Countries (GCC) and their corresponding CO2 emissions, utilizing data on electricity consumption in the region.
Hdom (2019) [31] conducted a study on the influence of electricity production on CO2e (carbon dioxide equivalent) in South America. The findings revealed a positive relationship between electricity production and Economic Growth (EGT), while Renewable Energy Consumption (REC) was found to be helpful in reducing pollution. The author recommended the utilization of REC to mitigate CO2e in South America. Ridhosari and Rahman (2020) [32] demonstrated that Electricity Consumption (ELEC) is a key factor positively impacting CO2e. Liddle and Sadorsky (2017) [33] investigated the effects of electricity production on CO2e, finding that an 11% increase in electricity production leads to a 0.82% decrease in CO2e. The rapid socioeconomic development, advancements in desalination technologies, materials, and design solutions have fueled unprecedented growth in desert cities [34]. Consequently, these newly developed cities have become focal points for local climate modification and environmental changes [35].
Policymakers and energy analysts are concerned about the side effects of energy use and related social welfare on the environment, and the regulations designed to reduce energy use may not be effective. The qualitative aspect of energy use is becoming increasingly important in environmental improvement and sustainable development. The United Nations has taken steps to address the adverse effects of greenhouse gases by signing the UNFCC's Kyoto Protocol (United Nations Framework Convention on Climate Change), which is an intergovernmental agreement. During the first commitment period (2008-2012), developed nations have an obligation to decrease their overall greenhouse gas (GHG) emissions by at least 5% below the levels observed in 1990 [36,37].
The energy subsidy provided to consumers in oil-rich countries in the Persian Gulf Region is a significant factor that impacts energy consumption. It aims to lower energy costs but has inadvertently led to excessive use of fossil fuels. Consequently, the subsidies have reduced the motivation for investing in renewable energy sources [38,39] while reducing the incentives for further investments in renewable energies [40,41]. According to the IEA [42], certain countries provide energy subsidies to lower expenses for energy consumers. Regrettably, these subsidies primarily benefit fossil fuels s [43,44] a with a significant portion allocated to non-OECD countries [45]. Consequently, oil-rich nations with inexpensive energy prices should reassess their energy subsidy policies [46].
n a comparative analysis conducted by Dorsa Fatourehchi et al., countries with and without energy subsidies were examined to analyze trends in domestic electricity usage. The findings revealed a correlation between higher domestic electricity consumption and the presence of generous subsidies provided to the public. Additionally, climatic and non-climatic factors also influenced the rise in domestic electricity usage, particularly in Iran. [47]. Al-Marri [48] investigated the current energy use of residents in Qatar to understand consumer behavior. The energy subsidy has a negative impact on energy efficiency, as it does not encourage occupants to reduce their energy consumption [49,50].
Previous studies have underscored the negative effects of energy subsidies on achieving sustainable development goals and the difficulty of managing rising energy demand in countries that implement such subsidies. In response to these concerns, multiple scholars have advocated for revising subsidy policies to tackle the associated challenges. As evidenced by studies conducted in China [22,36] t has been suggested that energy subsidy reform can serve as a potential solution for reducing energy consumption. However, it is recognized that this measure alone is insufficient.
Additional research [51,52] has emphasized the necessity of finding alternative solutions to replace fossil fuel subsidies. These alternatives could include promoting the development of renewable energies or implementing robust social security systems. Such measures have the potential to prevent substantial inefficiencies in energy consumption patterns within the Middle East regions. The aim of this paper is to investigate how changes in national energy subsidy policies, through investments in sustainable energy, can serve as a catalyst for reducing CO2 emissions and mitigating the urban heat island effect (UHIE) in the Persian Gulf Region.
Ahmad et al. [53] analyzed the relationship between sustainable investment, environmental degradation, and sustainable development in the Chinese economy at the provincial level. They employed the generalized method of moments (GMM) approach for result estimation. The findings indicated that sustainable investment and development play a positive role in addressing environmental issues and promoting improvement in this regard.
The Persian Gulf Region, heavily affected by the urban heat island effect, provides a significant case study for comprehending the environmental repercussions of ongoing global changes [54,55,56]. This study specifically examines the energy consumption levels in the region, which contribute to CO2 emissions. Furthermore, by exploring the transformation of energy subsidy strategies, Persian Gulf countries can address the challenges posed by localized urban heat. Ultimately, we investigate the extent to which national climate-focused policies and adaptation plans can serve as catalysts for resolving conflicts in the Persian Gulf Region.

2. Population

In 2022, the Middle East had a population of 477 million individuals, representing a growth rate of 1.22% of the world's population. Among the countries in the region, the Islamic Republic of Iran stood as the most populous with around 84 million people. As per the World Bank's World Development Indicators of 2020, approximately 76% of Iran's total population lived in urban areas, indicating that roughly 24% resided in rural areas [57].

2. Data source and analysis

The paper is structured into three sections. The first section delves into the rise in carbon dioxide emissions as the primary factor contributing to the urban heat island effect (UHIE). The second section compares oil-rich countries, particularly focusing on their fossil fuel subsidy status, to examine the impact of energy prices on household electricity demand. Iran is specifically examined as a case study in this analysis. Lastly, the third section highlights solutions suggested by previous research to decrease energy consumption and underscores the significance of investing in and allocating subsidies towards sustainable energy sources as an effective solution to be integrated into the policymaking process.
The study focused on Iran, United Arab Emirates, Saudi Arabia, Oman, Kuwait, and Qatar as the selected countries. Iraq was not included due to insufficient information. The research gathered data on energy-related CO2 emissions from 2010 to 2020, obtained from the International Energy Statistics of the United States Energy Information Administration (US EIA). Trend analysis was utilized to model and predict CO2 emissions related to energy consumption. Initially, this method was used to identify trends in the CO2 emissions of each country within the group.This study proposes to examine the impacts of energy consumption following fossil fuels subsidies on UHIE in the PGR for research analysis between 2000 to 2020. We have utilized diverse data from various global, regional, and national sources spanning multiple disciplines.
Climate data for the study areas were acquired from multiple sources, including the Meteomanz website [58] and the Climate Change Knowledge Portal (CCKL) for the period of 2006-2020 [59]. Additionally, insights into precipitation and temperature trends were obtained from Community Climate System Model 4 (CCSM4) data provided by Beni et al. (2021) [6].
This study builds upon recently published research for multiple purposes. It investigates and evaluates the influence of CO2e by utilizing the works of Teng et al. (2020) [60], Liddle and Sadorsky (2017) [33], and Rid- hosari and Rahman (2020)[32]], where ELEC is employed as the primary measure for CO2e.

3. Environmental Framework

3.1. Climate of the Region

The Persian Gulf Region is situated between 24° to 30° 30’ N latitude and 48° to 56° 25’ E longitude, between the Arabian Peninsula to the Southwest and Iran to the Northeast (Figure 1). It is part of the Indian Ocean, with a shallow water body, low currents, and a high level of salinity. It has many islands, with Bahrain being the largest. It is bordered by Oman, the United Arab Emirates, Qatar, Saudi Arabia, Kuwait, Iraq, and Iran [60]. The PGR is a shallow, semi-enclosed marginal sea connected to the Gulf of Oman through the Strait of HorMuz in the east. It has asymmetric bathymetric features along its main axis and is hypersaline due to its arid climate [61].
During the summer months (June to August), the lowland areas of the Persian Gulf Region can encounter extremely high air temperatures surpassing 50°C. The average monthly temperature in summer exceeds 32°C [62]. Conversely, winters in these lowland areas bring moderate temperatures, and the period from November to March receives the highest amount of precipitation. The Shamal wind, known as the north wind in Arabic, is the prevailing and forceful wind in the region, carrying approximately 90 million tons of dust annually [63,64].
During July 2021, several captivating nations in the Middle East experienced highly volatile conditions. The region was plagued by scorching temperatures and severe droughts, resulting in devastating forest fires and cities transforming into unbearable heat pockets. In June, Oman, the United Arab Emirates, and Saudi Arabia all recorded temperatures surpassing 50 degrees Celsius (122 degrees Fahrenheit). Approximately a month later, Iran came close to reaching 51 degrees Celsius (123.8 degrees Fahrenheit). Alarmingly, this is just the beginning of a worrisome trend, as the Middle East is warming at a rate twice as fast as the global average. By 2050, it is projected to be 4 degrees Celsius warmer, a stark contrast to the 1.5-degree threshold suggested by scientists to safeguard humanity. According to the World Bank, the region will likely face routine extreme climatic conditions, with four months of scorching sun each year.
By comparing annual max average temperature in the Persian Gulf Region from 2006 to 2022 it can be realized that temperature increase around 2 ºC in most of the countries (Table 1).
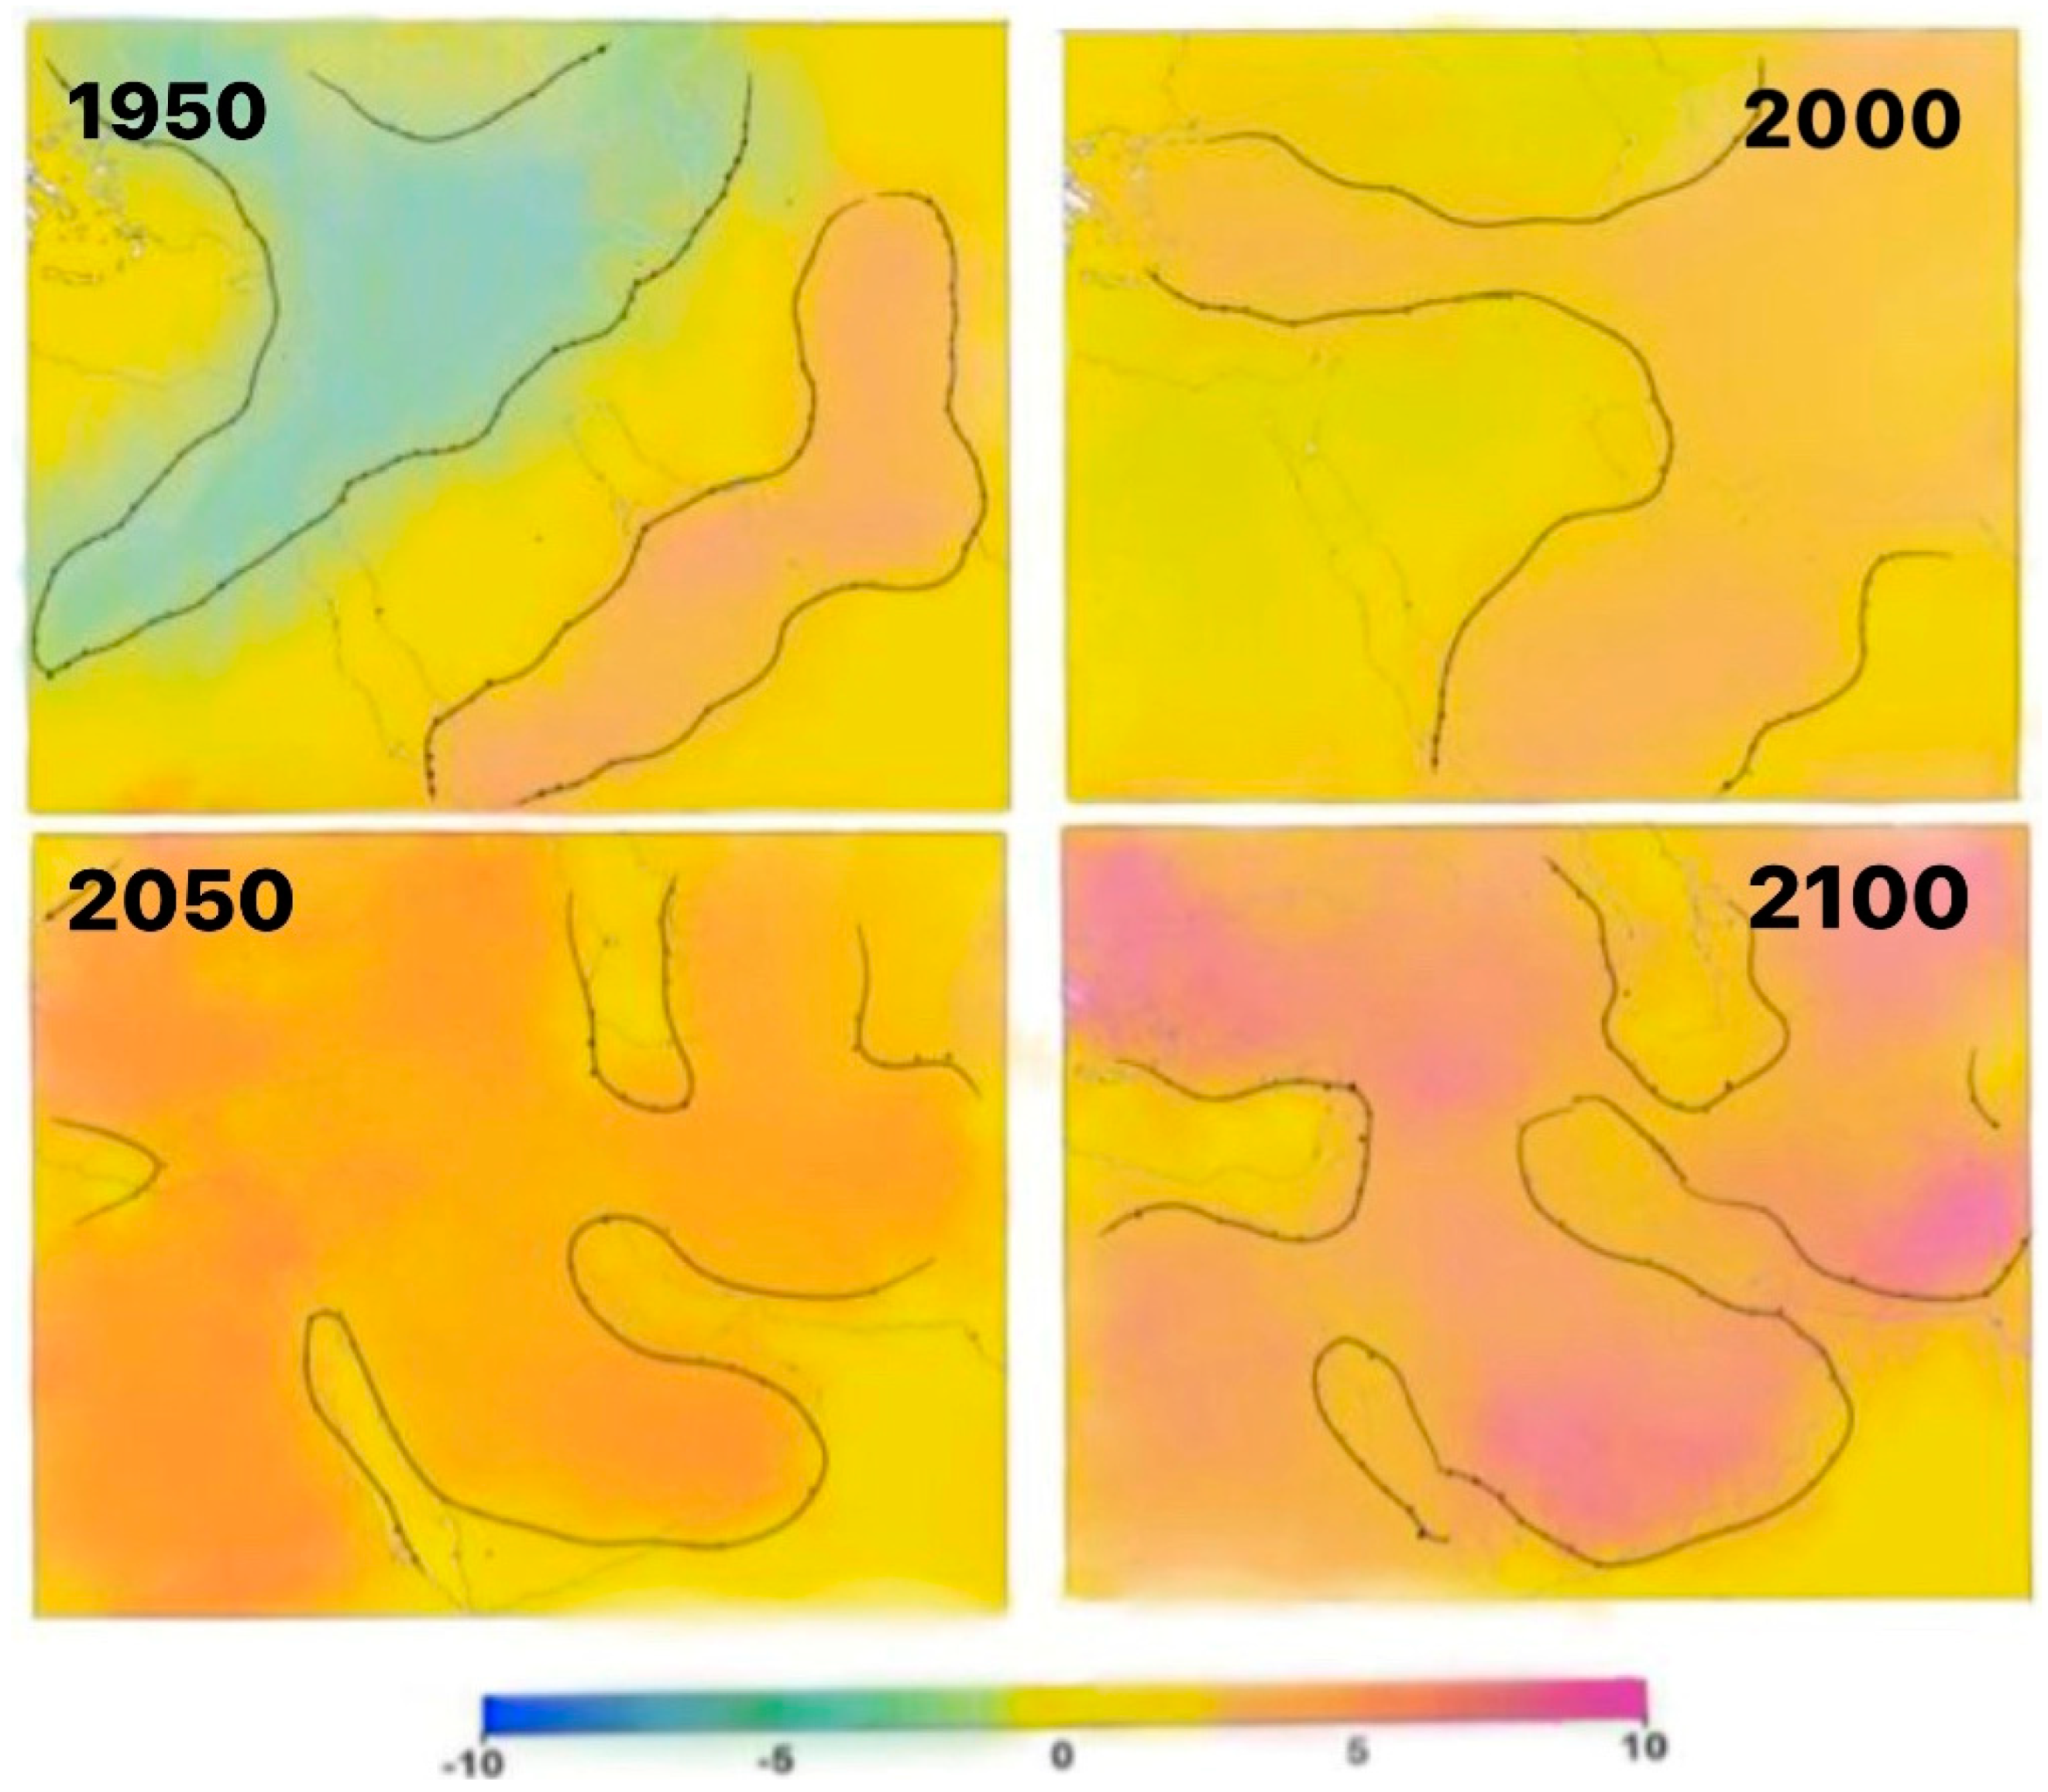
The outputs data of the Community Climate System Model 4 (CCSM4) [6] for the anomalies of land surface temperature from 1900 in West Asia suggest that an increase of 5 o C in temperature by 2100 in some regions. Some regions will experience more than 5 o C increase in by 2100 (Figure 2).

3.2. Annual Percipitation

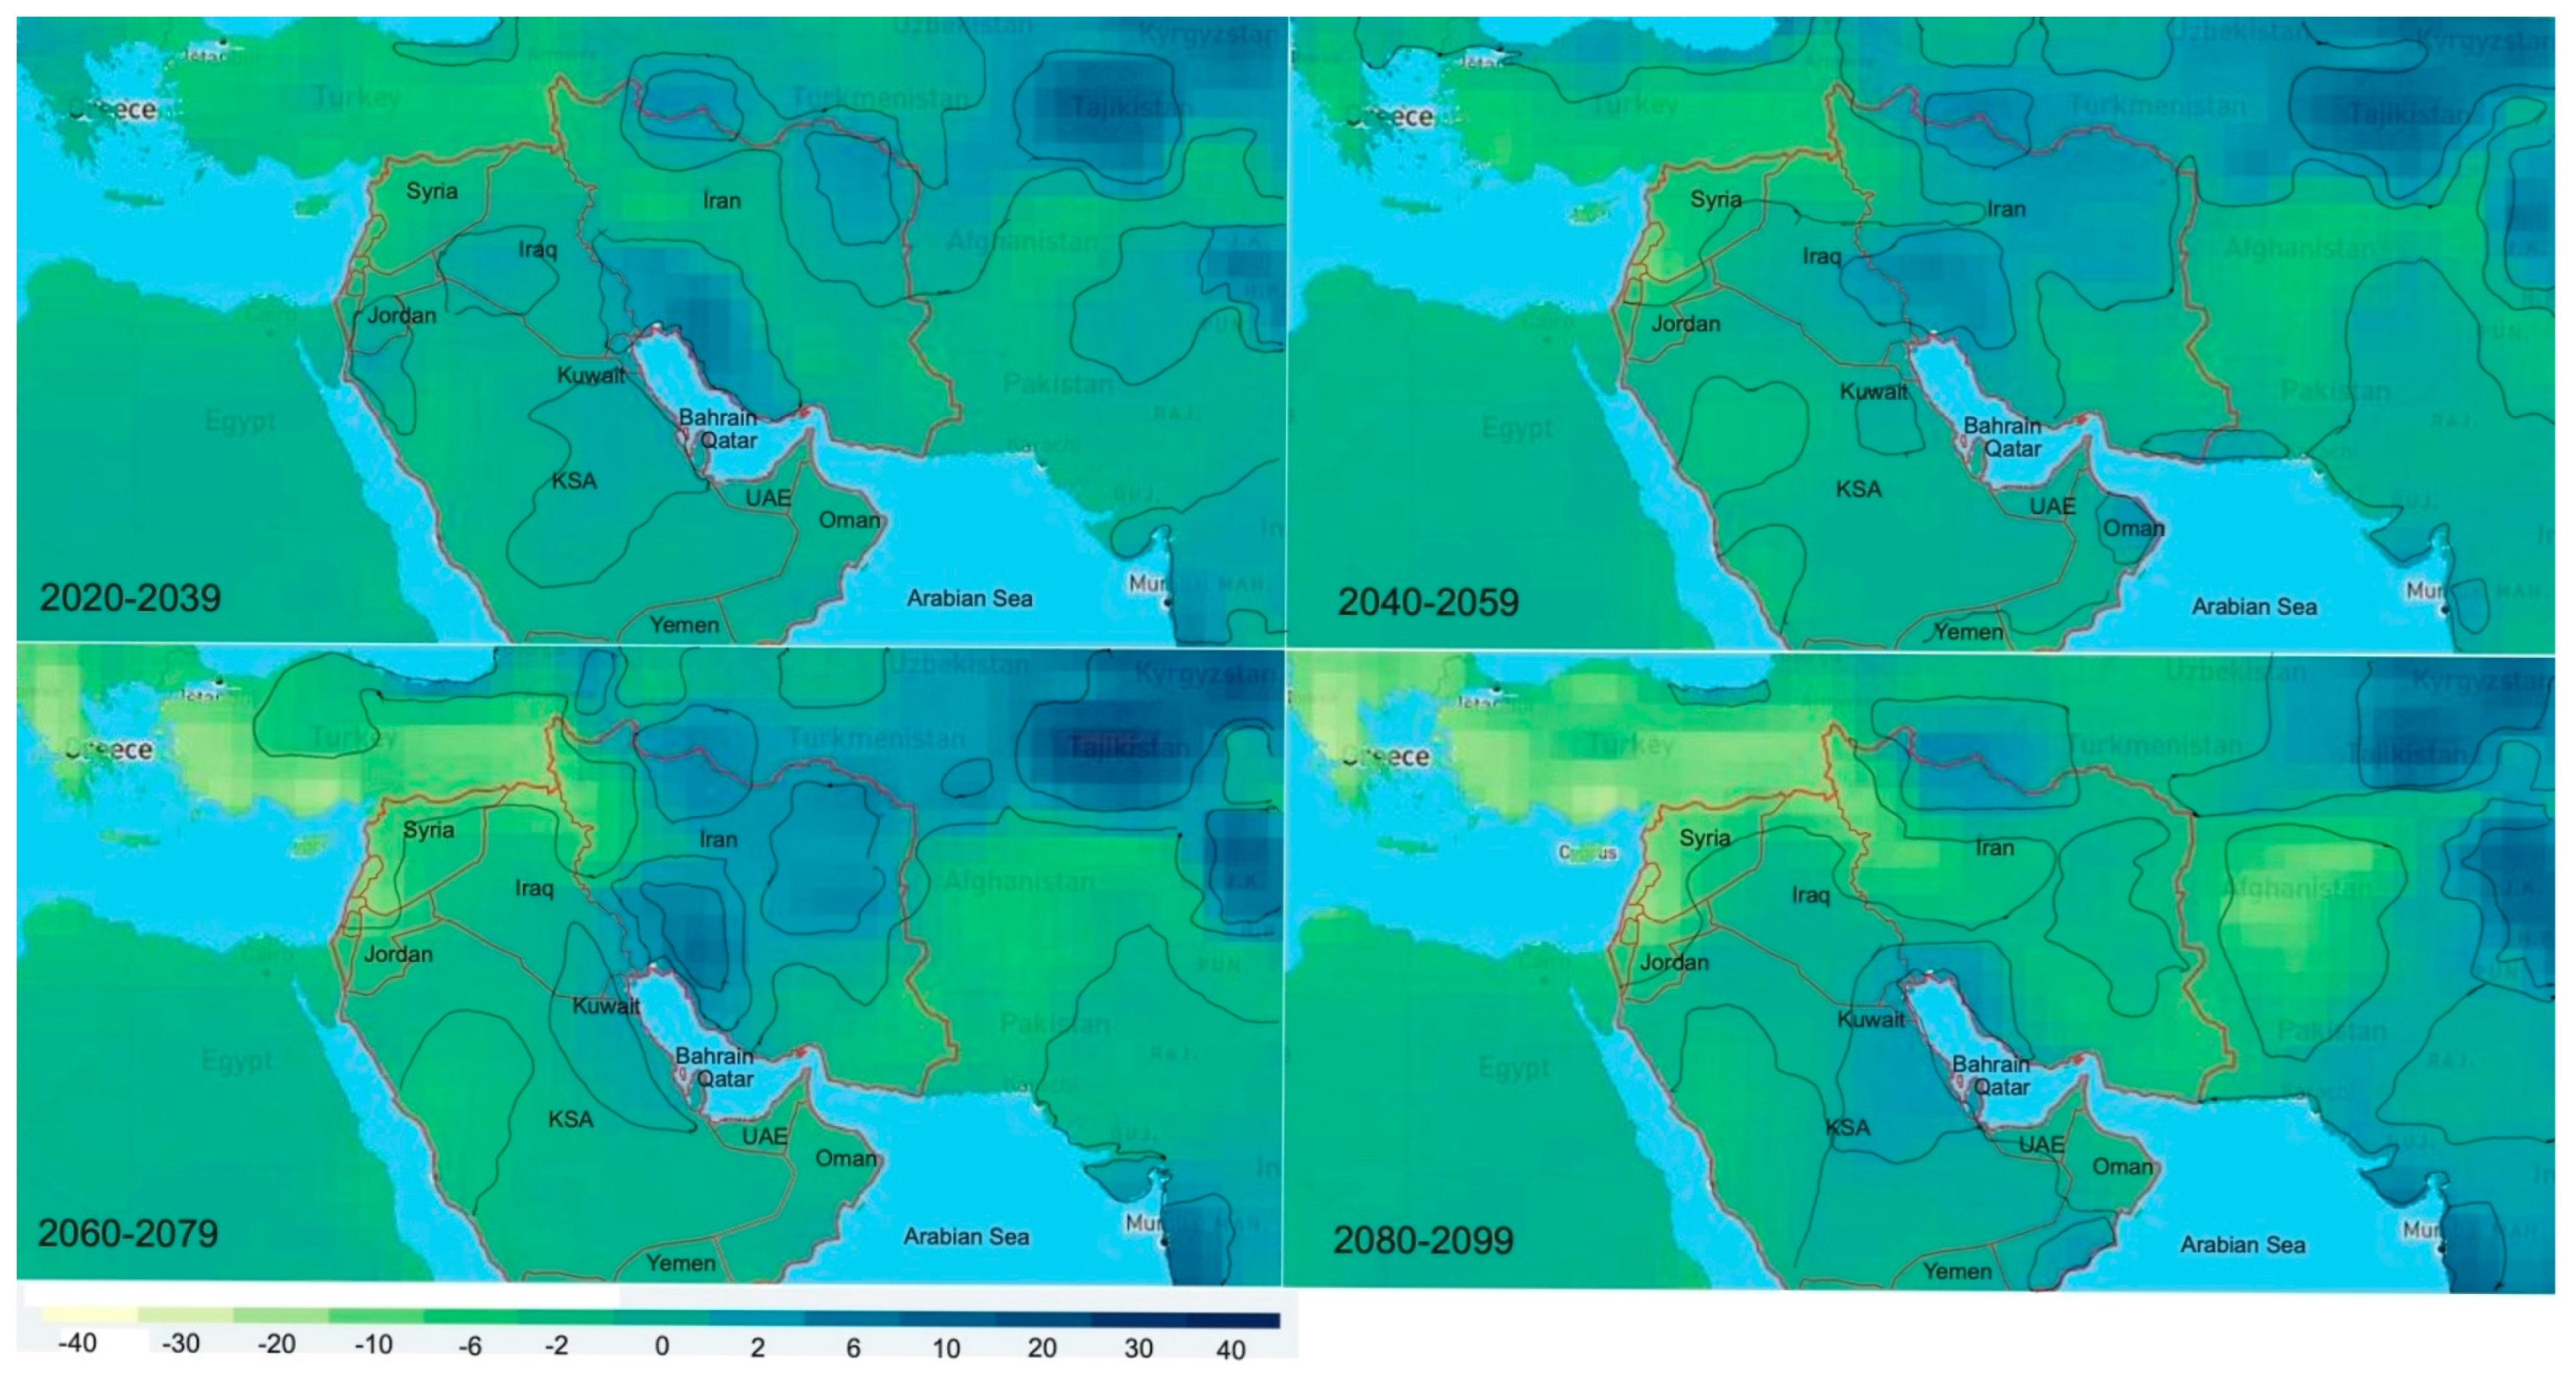
The average annual rainfall in the Persian Gulf Region varies significantly and is largely dependent on geography and orography. The average annual rainfall on the southern coasts and over the Gulf is less than 100 mm while the northern watershed areas (Iran and Iraq) receive, on average, 355 mm of precipitation annually [56], The Persian Gulf Region (PGR) experiences higher latitudes and distinctive orography, which contribute to its water resource challenges (as shown in Table 2). In order to compensate for the scarcity of fresh water, the PGR heavily relies on desalination plants (as depicted in Figure 3). Out of the 15,900 operational desalination plants worldwide, half of them are located in this region [65].
The water resource difficulties in the Persian Gulf Region (PGR) stem from its elevated latitudes and unique terrain characteristics (as indicated in Table 2). To overcome the scarcity of freshwater, the PGR extensively depends on desalination plants (as illustrated in Figure 3). Remarkably, out of the 15,900 operational desalination plants globally, half of them are situated within this region [57].

4. Energy

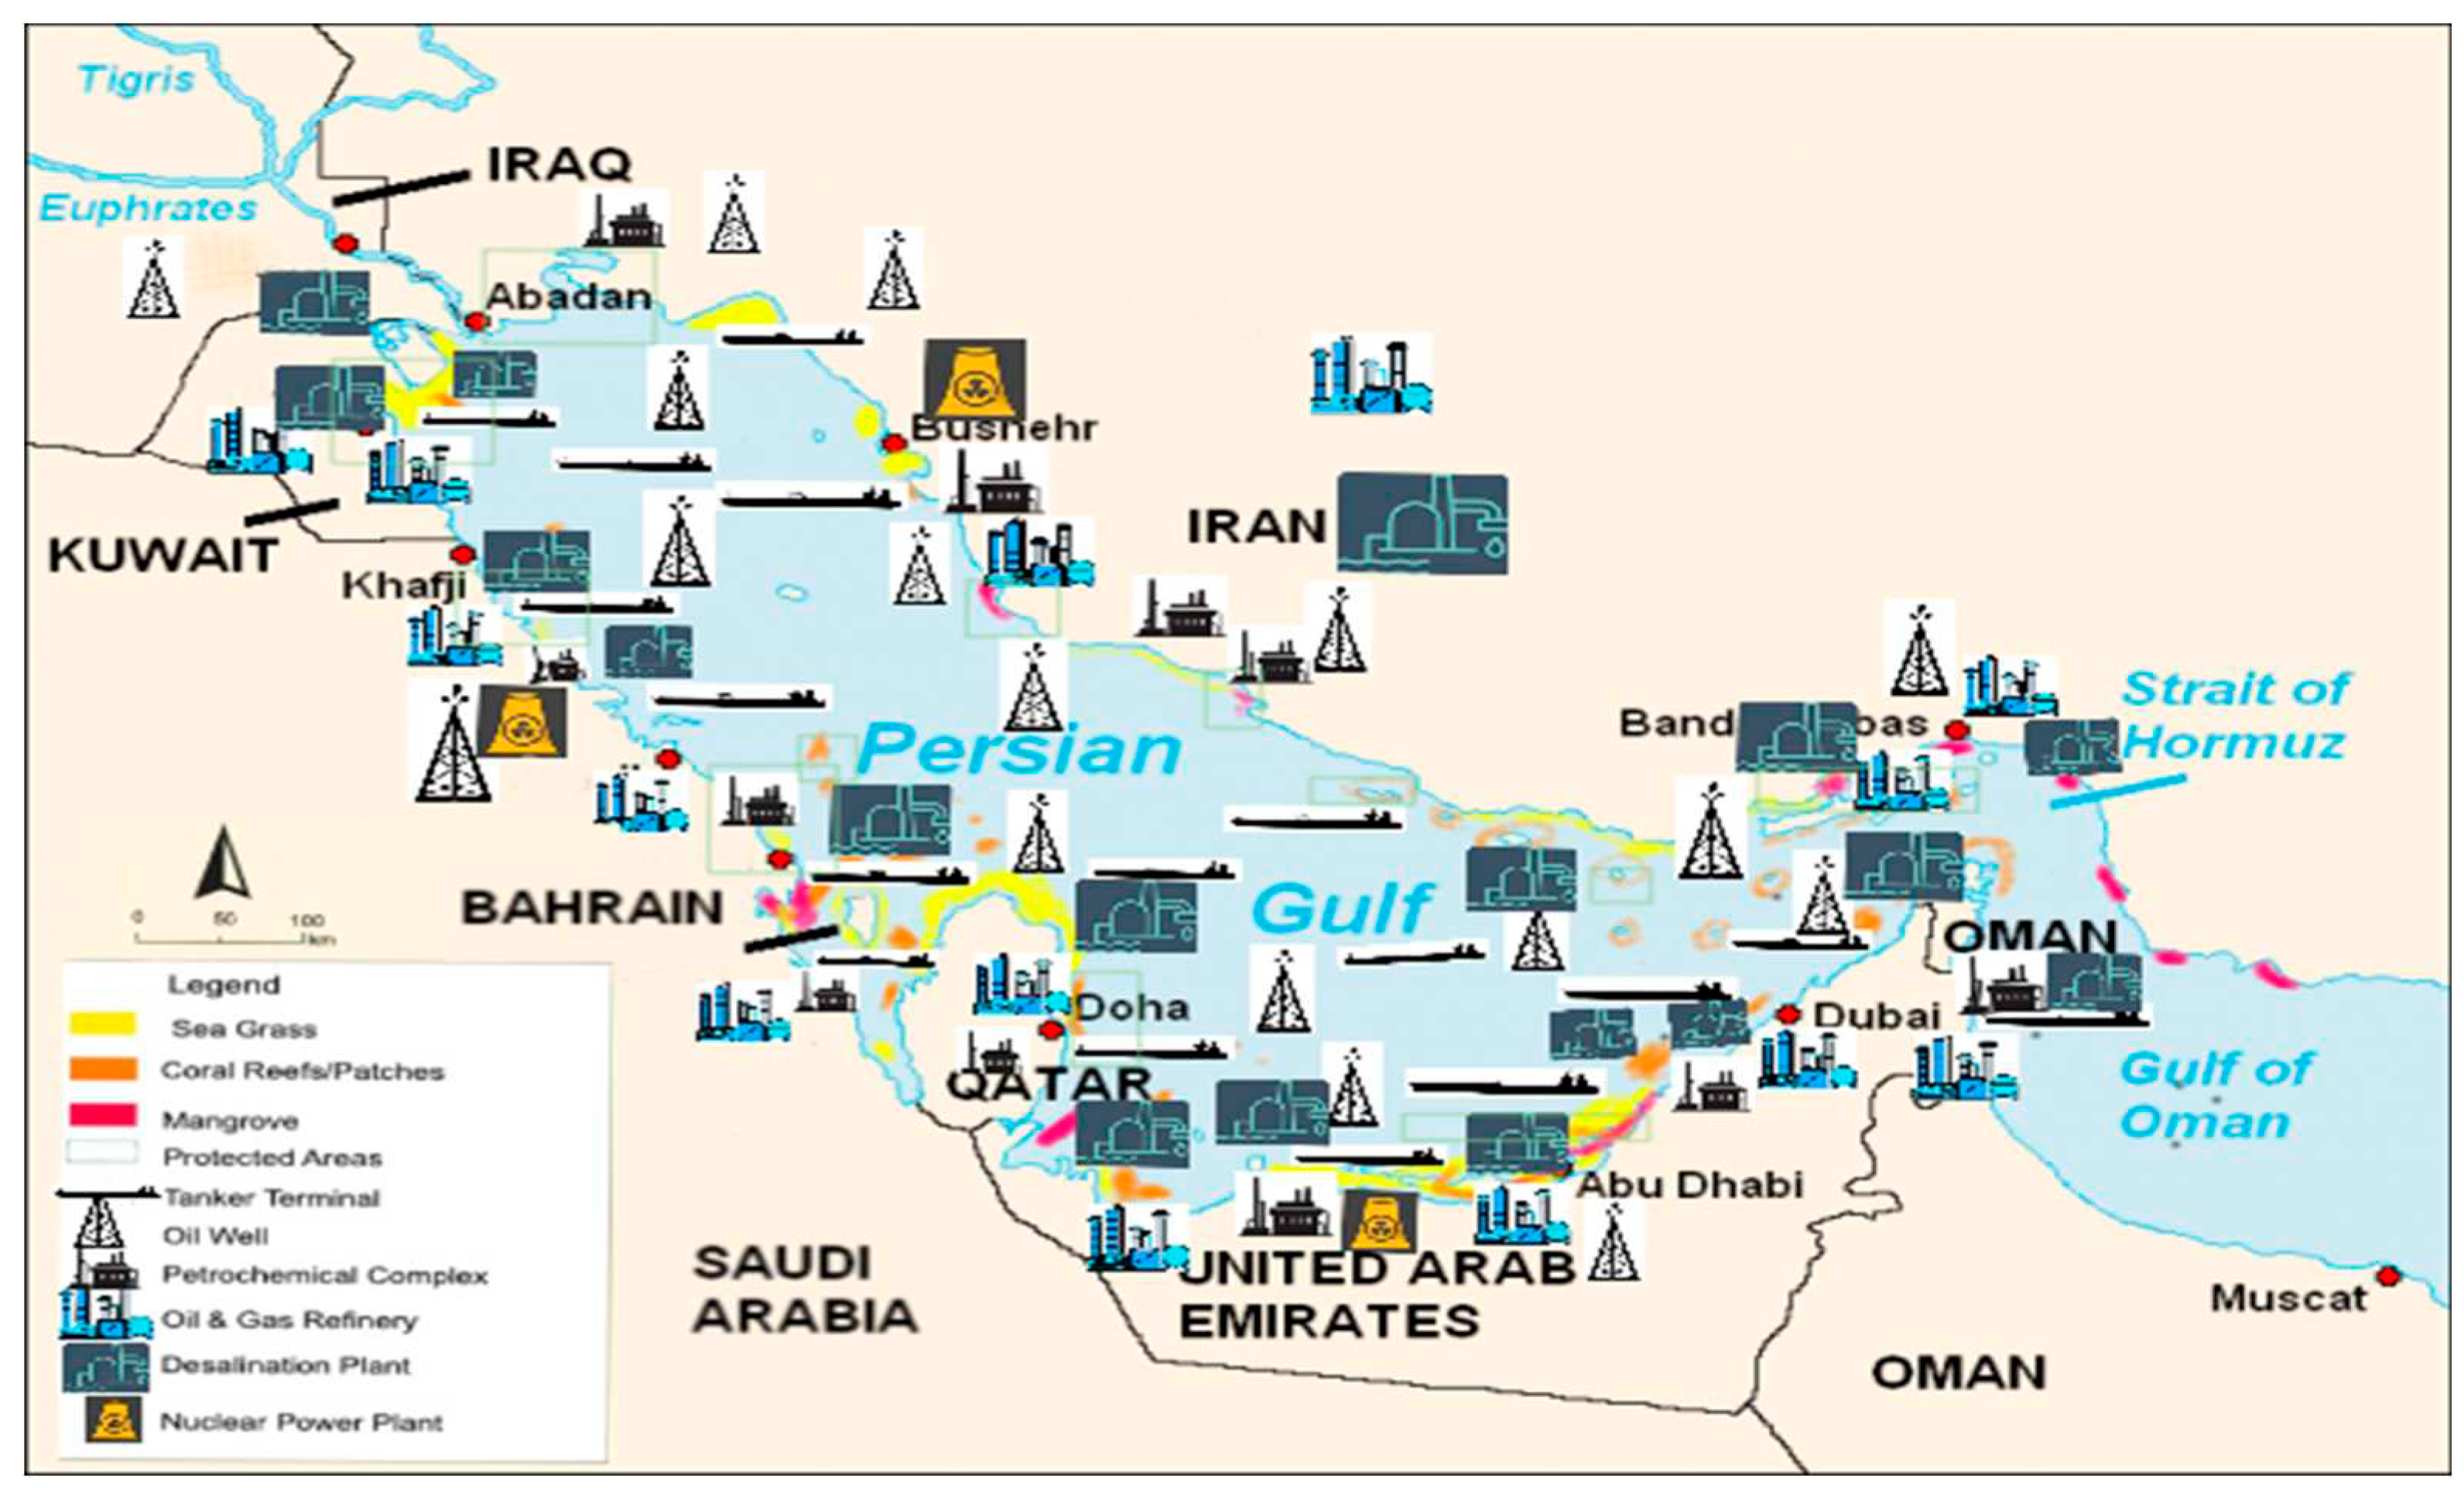
The Persian Gulf Region possesses abundant oil and gas reserves, leading to rapid economic growth. This growth is evident through the significant coastal urbanization and the development of offshore oil and gas extraction in the region [66,67,68] (Figure 4). Additionally, the Gulf countries heavily rely on oil and gas revenues for other major economic sectors, such as petrochemical industries, transportation, storage, and efficient communication networks (Figure 4).
Therefore, the Persian Gulf Region's energy consumption has risen significantly since the second half of the twentieth century, and regional energy demand will be increasing at a rapid pace (Table 1). In recent years, the proportion of fossil fuels has grown [69]., and the Persian Gulf Region has become increasingly reliant on fossil fuels as a source of energy (Figure 4). However, countries such as the UAE, Saudi Arabia and Iran, have recently made significant investments in nuclear energy (Figure 4), while, the use of such energy in the Persian Gulf Region is debatable in terms of nuclear arms race, especially between Iran and Saudi Arabia.
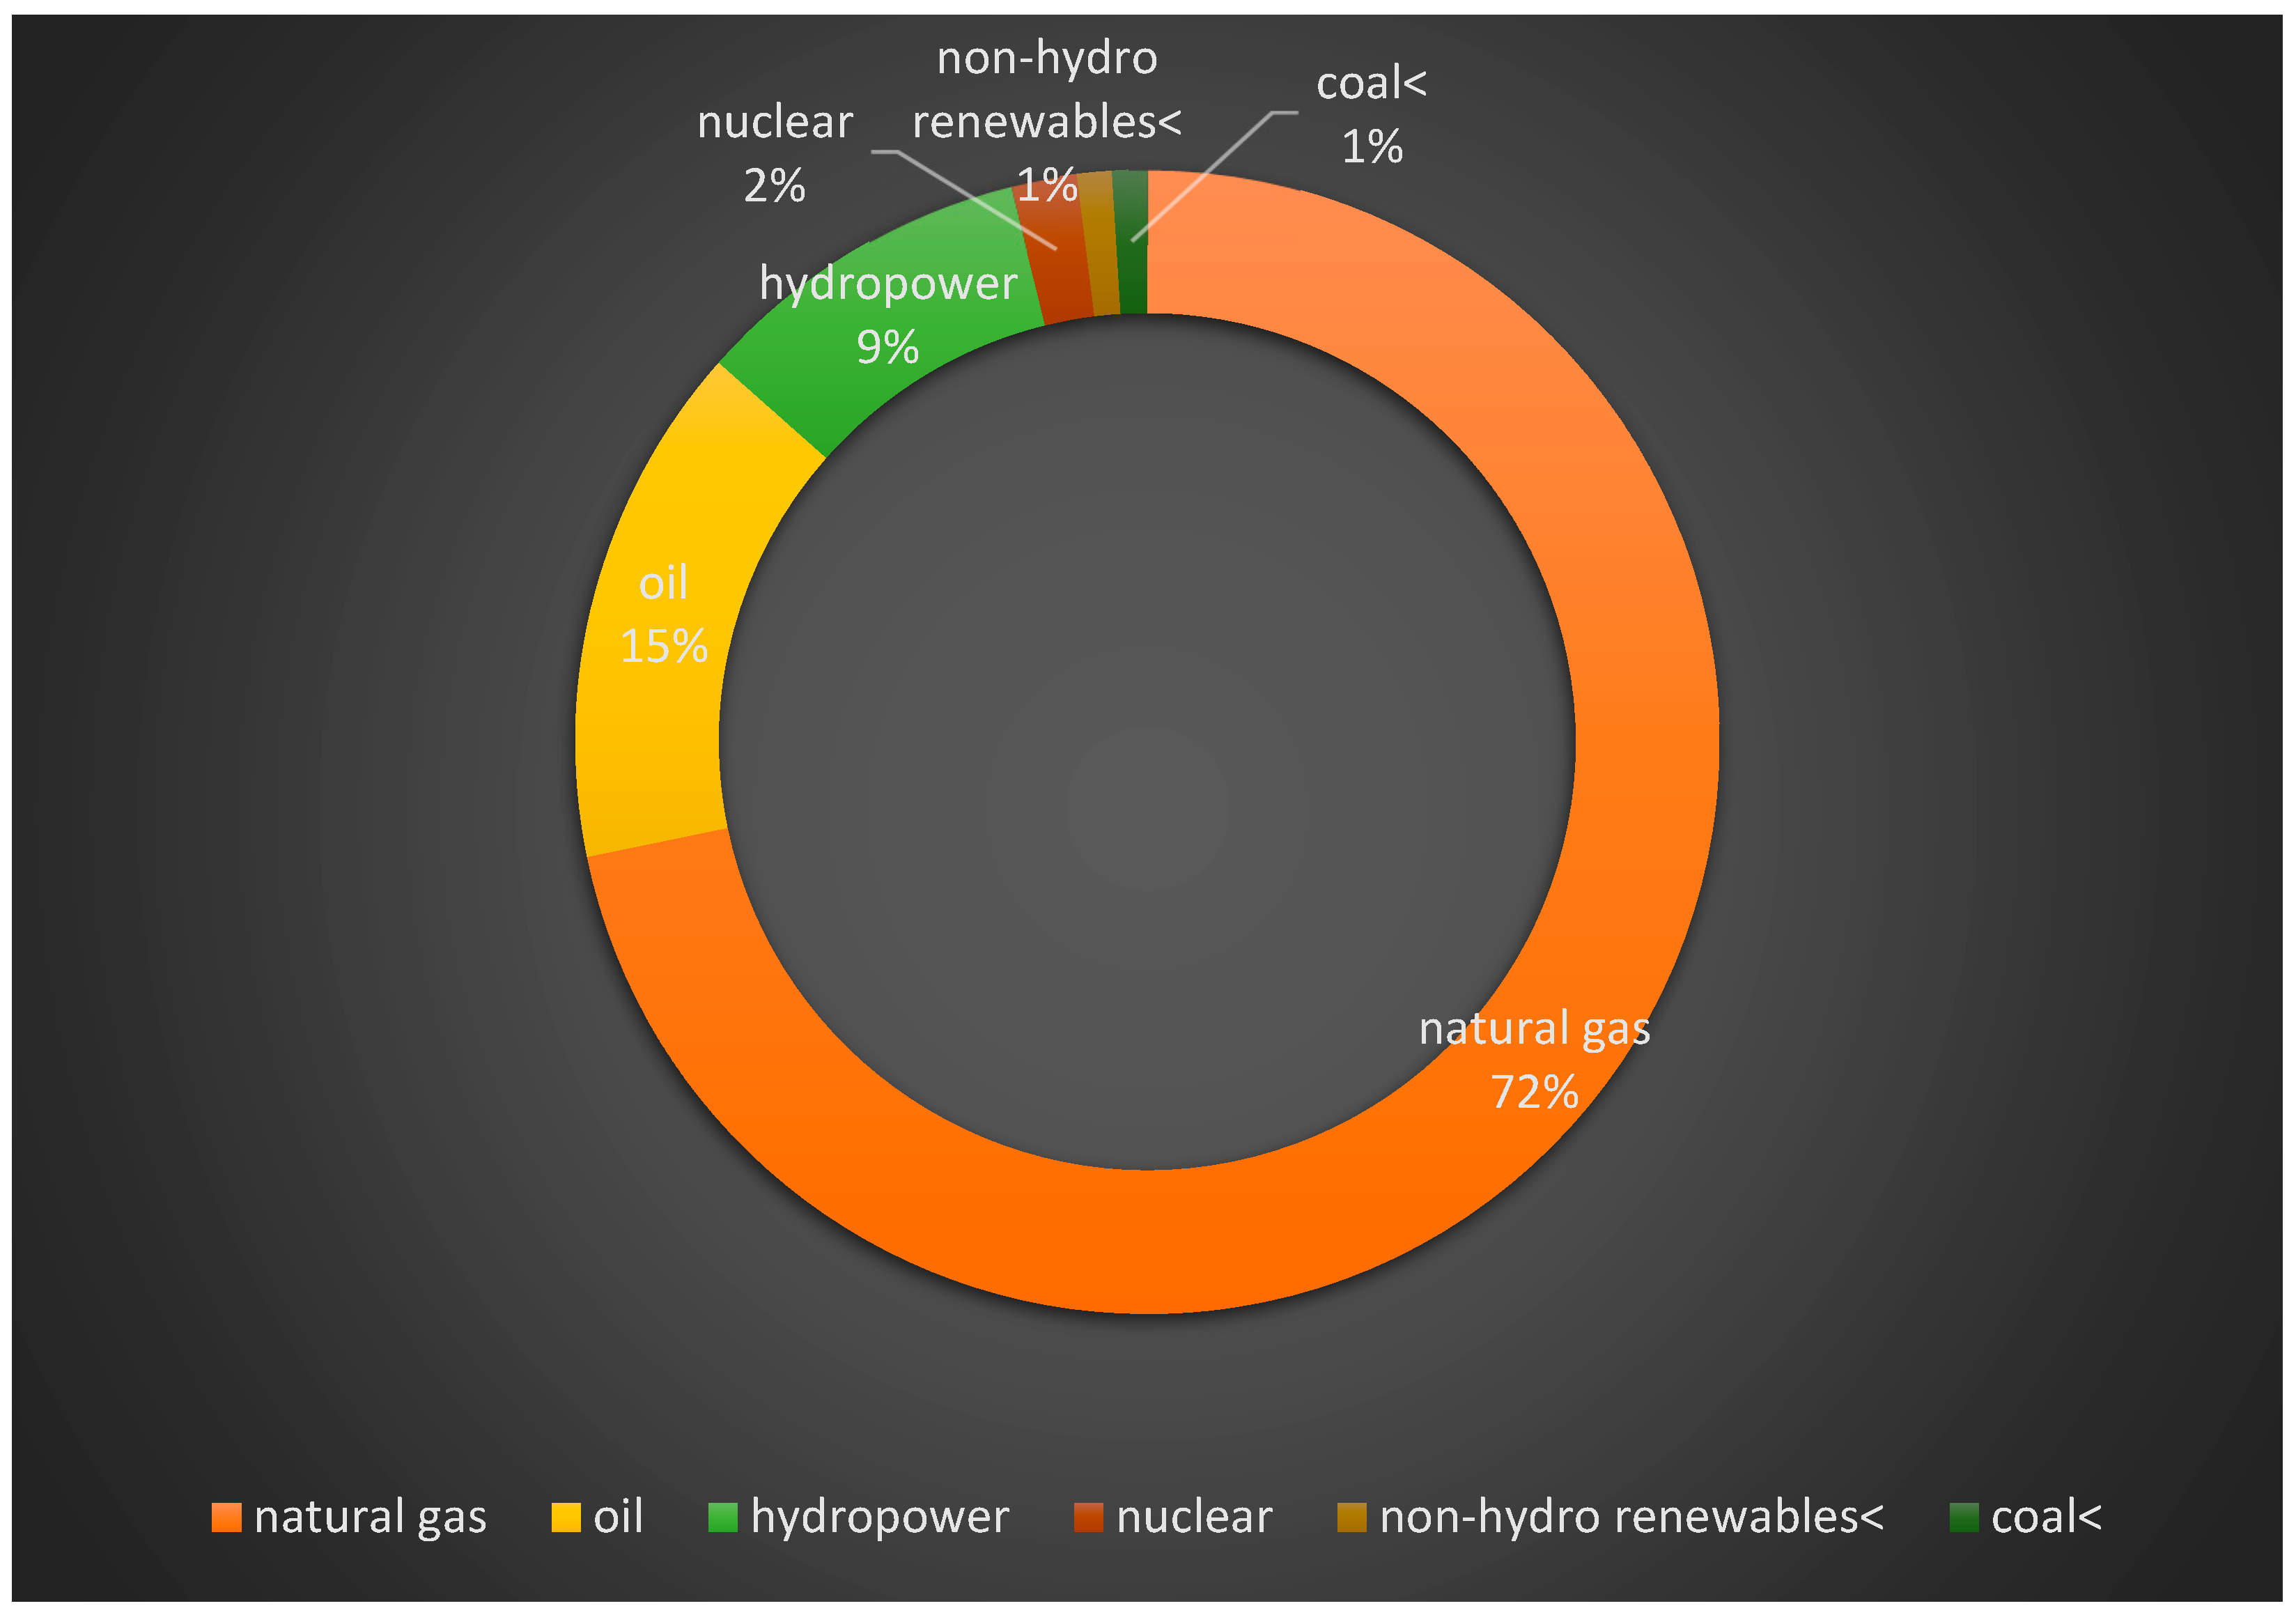
Iran relies on various primary energy sources such as crude oil, natural gas, coal, nuclear, and renewable energy(Figure 4). Among these, natural gas plays a crucial role as the primary source of energy for power plants in Iran. However, this reliance on natural gas leads to higher CO2 emissions compared to other energy sources. Additionally, natural gas is also used extensively in buildings for heating, cooking, lighting, and cooling (Figure 5) highlighting its significant contribution to the energy consumption in the Persian Gulf Region, including Iran.
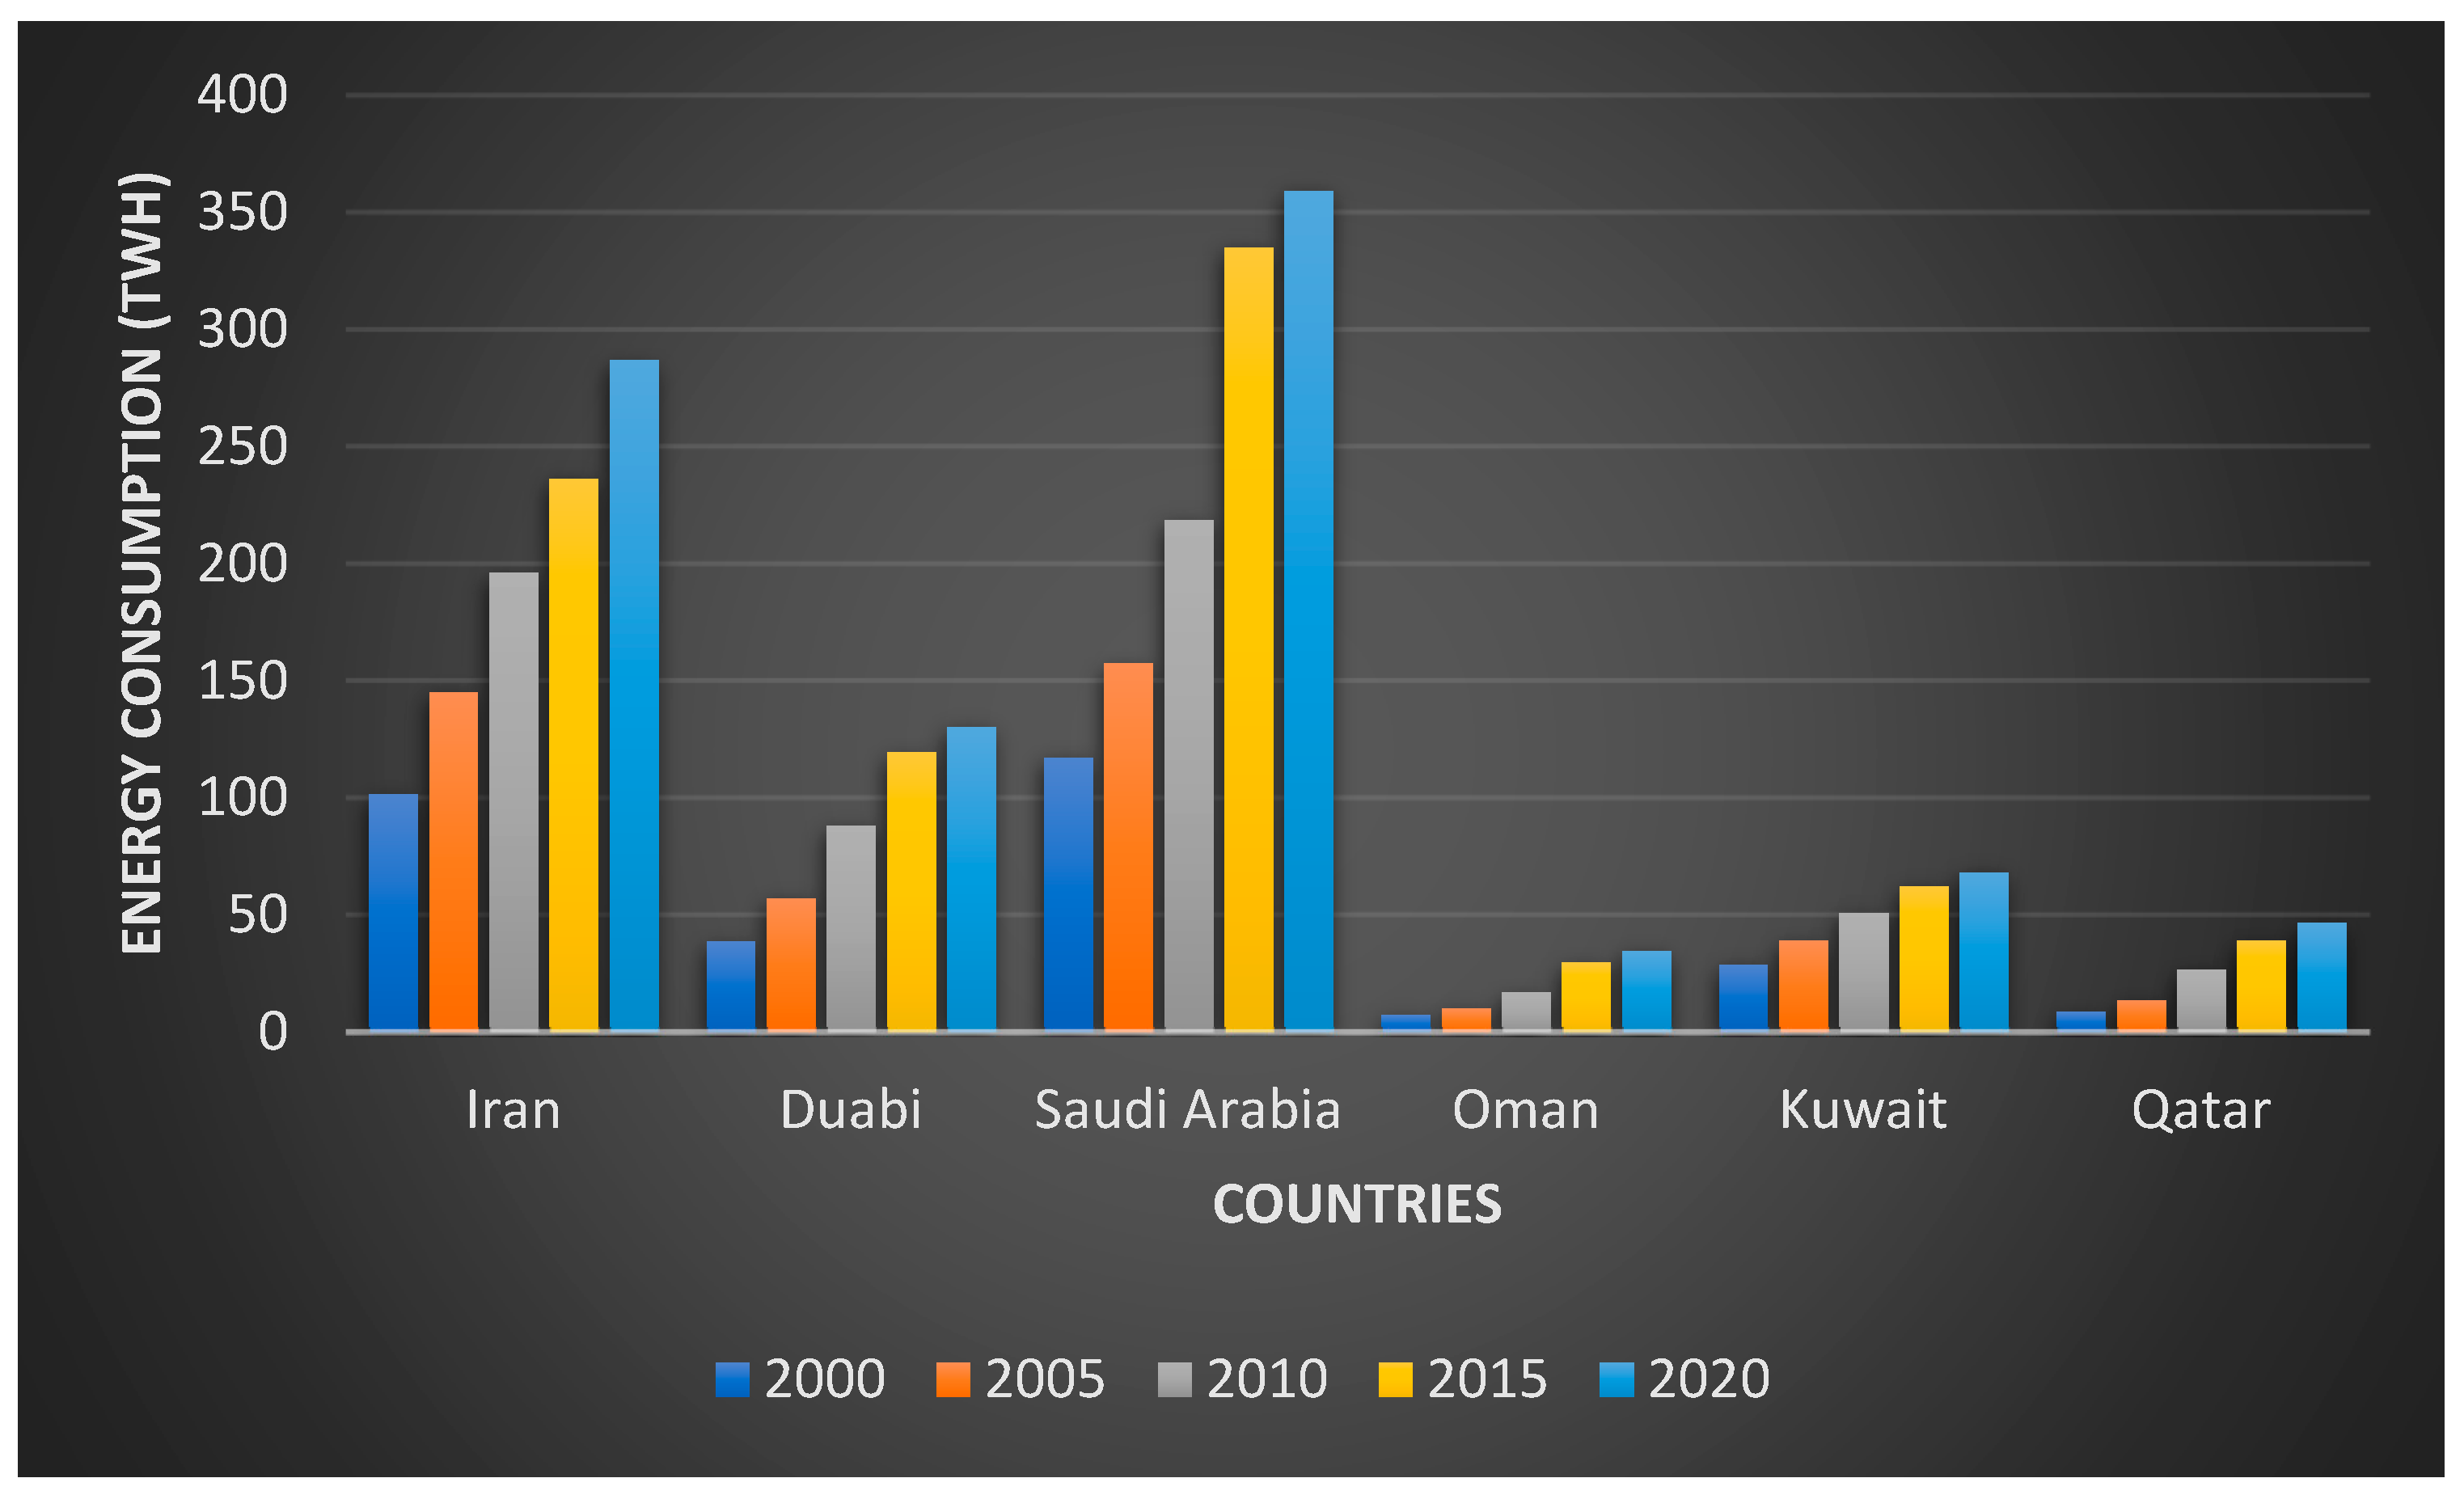
The energy consumption in Iran and Saudi Arabia increased around three times in 2020 compared to 2000. With this sharp increase in demand for energy, city dwellers can experience more UHIE in their cities. (Figure 6). Iran holds the position of being the biggest energy consumer in the Middle East and North Africa region, specifically in the Persian Gulf area [73].

5. Carbon dioxide emission

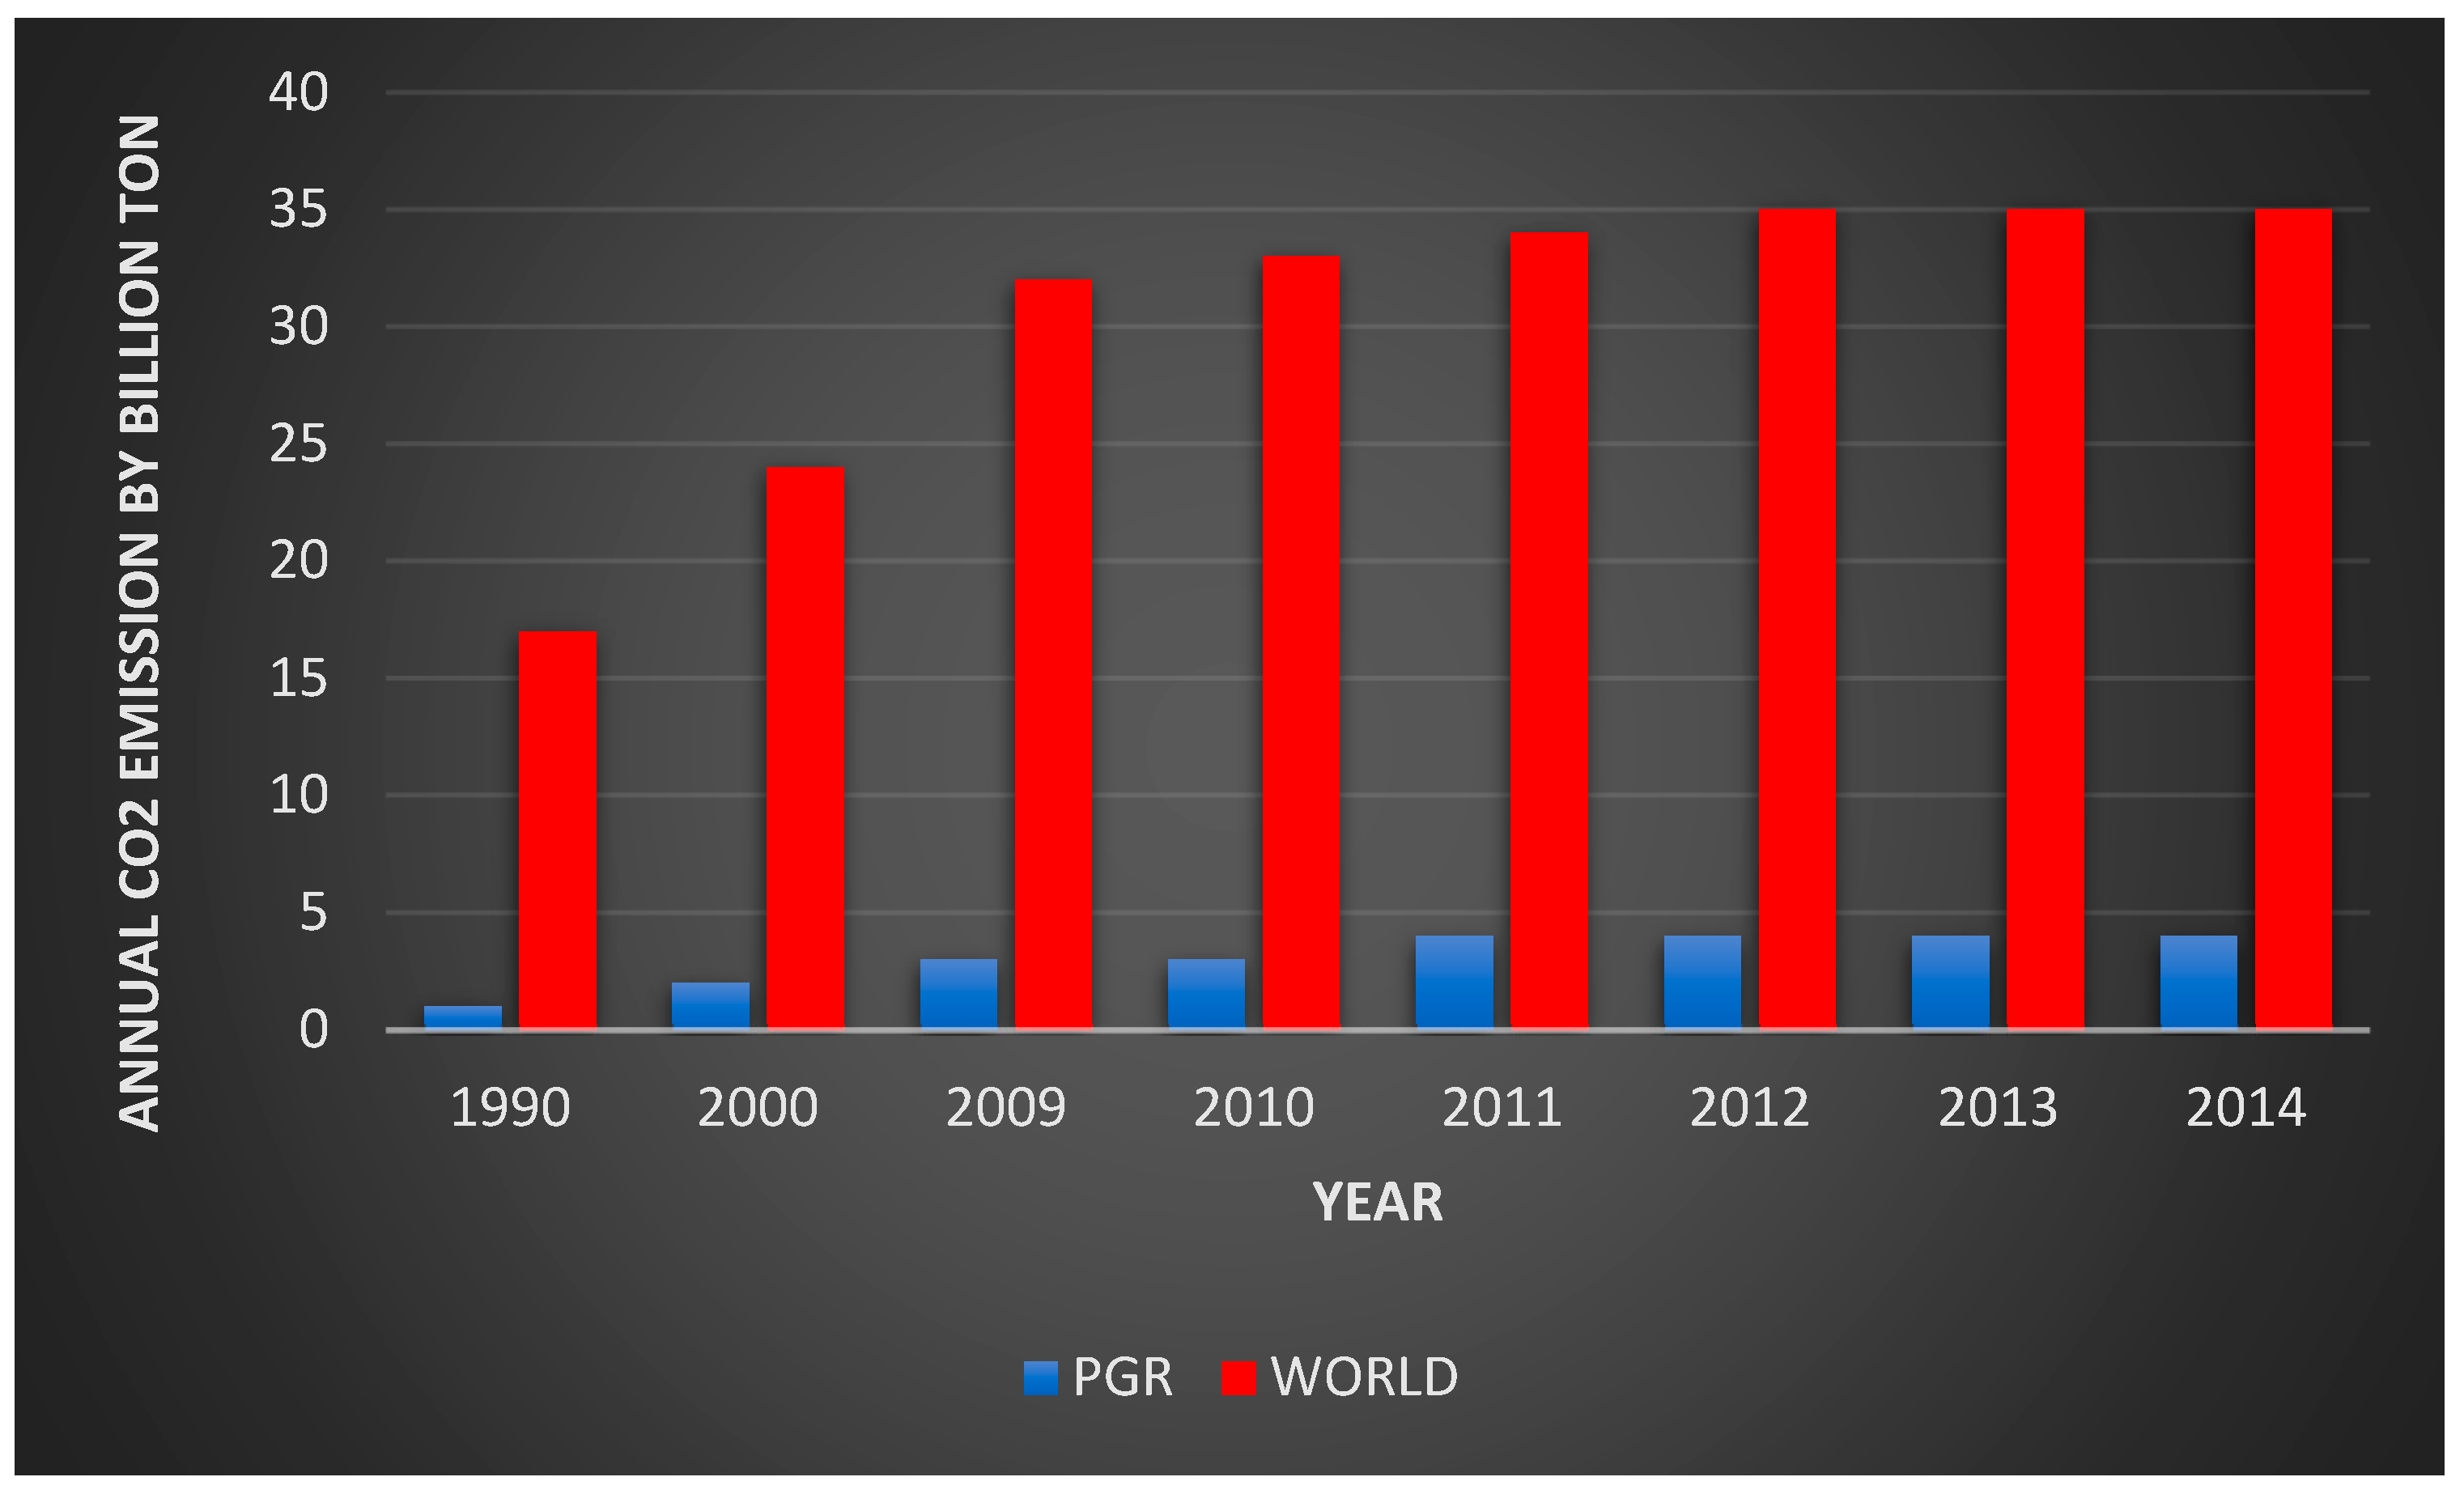
The Persian Gulf Region are the world's largest producers of crude oil, leading to the emission of CO2 into the environment [74]. Approximately, 5.5% of the world's CO2e come from the Persian Gulf Region, a percentage that has increased since the 1980s (Figure 7). Carbon emissions have doubled in this region due to reliance on power sources for air conditioning, seawater desalination, and coal burning power plants [56]. The world's sixth largest consumer of oil and gas is Saudi Arabia followed by Iran, which imports natural gas despite hosting the world's largest natural gas reserve [75].
In 2010, the United Arab Emirates (UAE) had a carbon dioxide emissions rate of 44 metric tons per person, which is ten times higher than the global average (Table 3). Following closely were Kuwait and Saudi Arabia, with carbon dioxide emissions rates of 39 and 21 tons per person, respectively. On the other hand, Iran and Iraq had relatively lower emissions, with rates of 7.6 and 3.9 tons per person, respectively [76].
As highlighted in a recent report [77] carbon dioxide emissions (CO2e) have emerged as the primary source of global greenhouse gas emissions. These emissions have witnessed a 25% rise due to human activities driven by significant increases in world population, urbanization, industrial activities, and energy consumption. The utilization of energy in diverse forms plays a perilous role in influencing both local and global climates.
The global population, urbanization, industrial activities, and energy consumption are interconnected factors. The utilization of energy in diverse forms has a significant and concerning impact on both local and global climates [78].
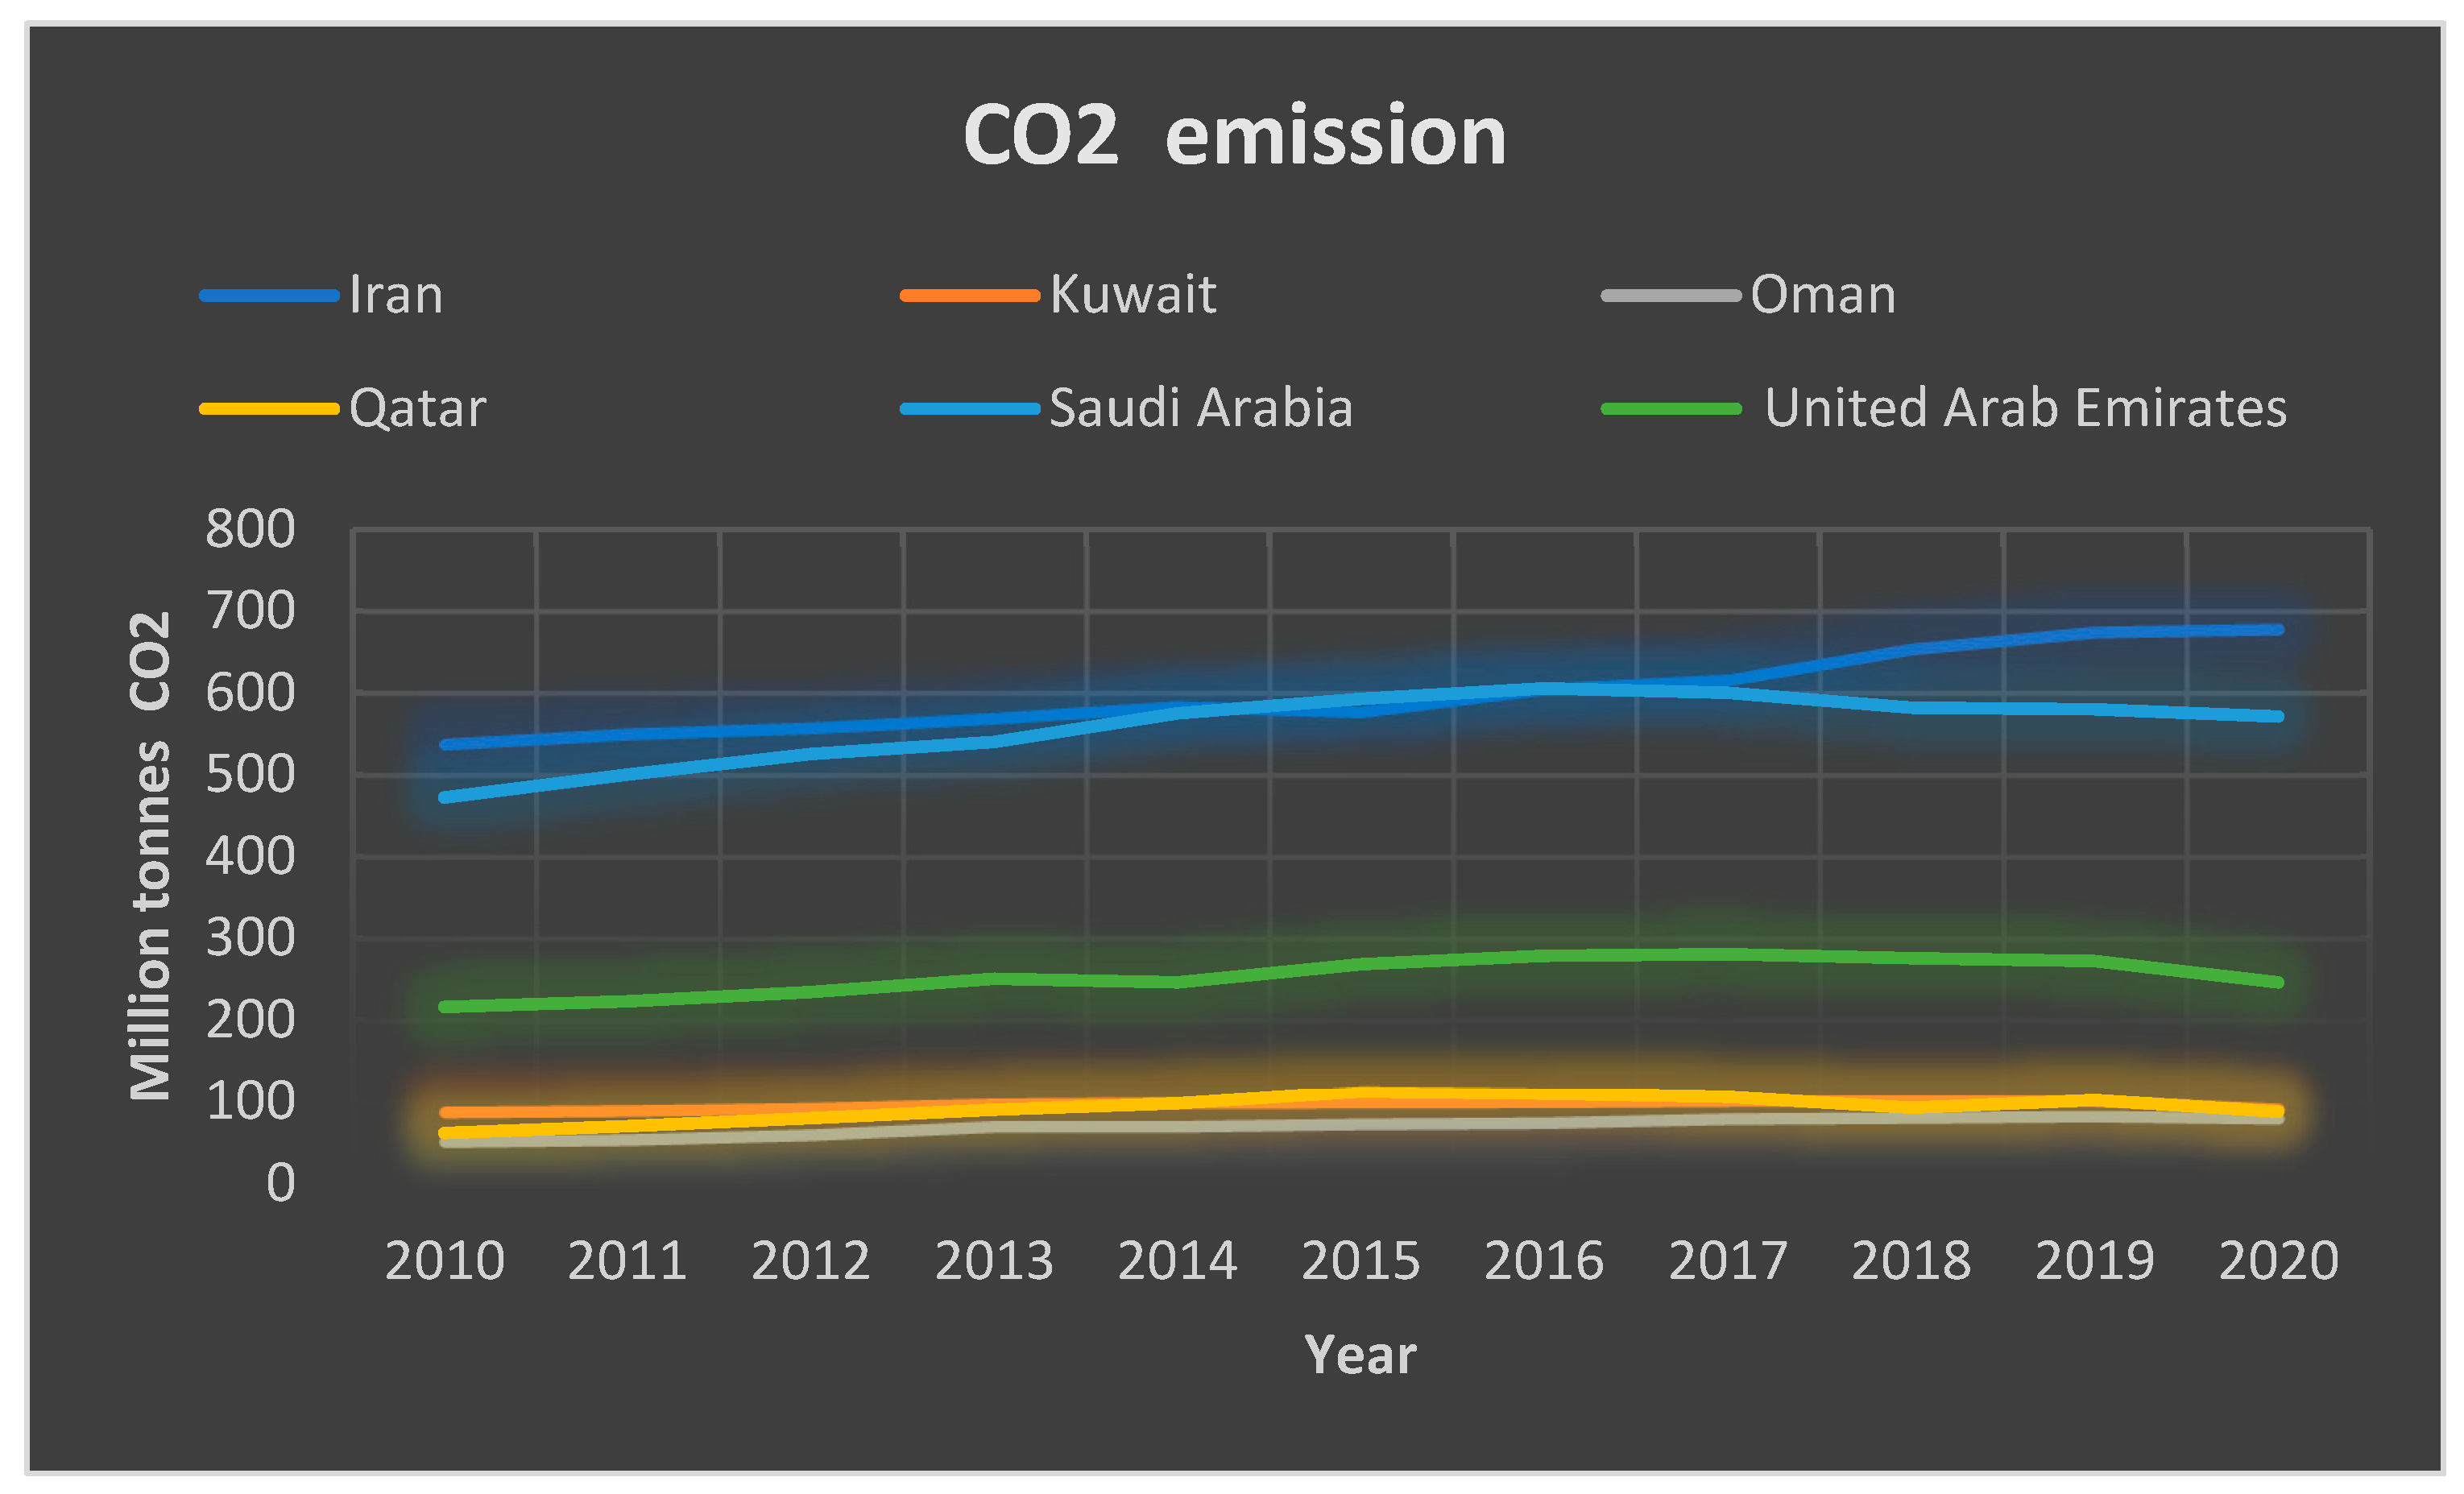
In terms of carbon emissions per capita (PGR) in 2020, as shown in Figure 8, Iran and Saudi Arabia were the largest producers of GHGs. According to IEA Data Services [79] Iran with 678.2 and Saudi Arabia with 570.8 million tons were also responsible for high carbon dioxide emissions, while Qatar and Oman had minimal emissions of 87.7 and 80.4 million tons, respectively.
An analysis conducted by the International Energy Agency (IEA) revealed that the industry, transport, and buildings sectors play a crucial role in generating carbon dioxide equivalent (CO2e) emissions from energy consumption. Specifically, buildings contribute significantly to these emissions, accounting for 17.5% of the total [47]. Within the building sector, residential buildings hold a notable share, contributing 19% to the overall emissions [80] (Table 4).
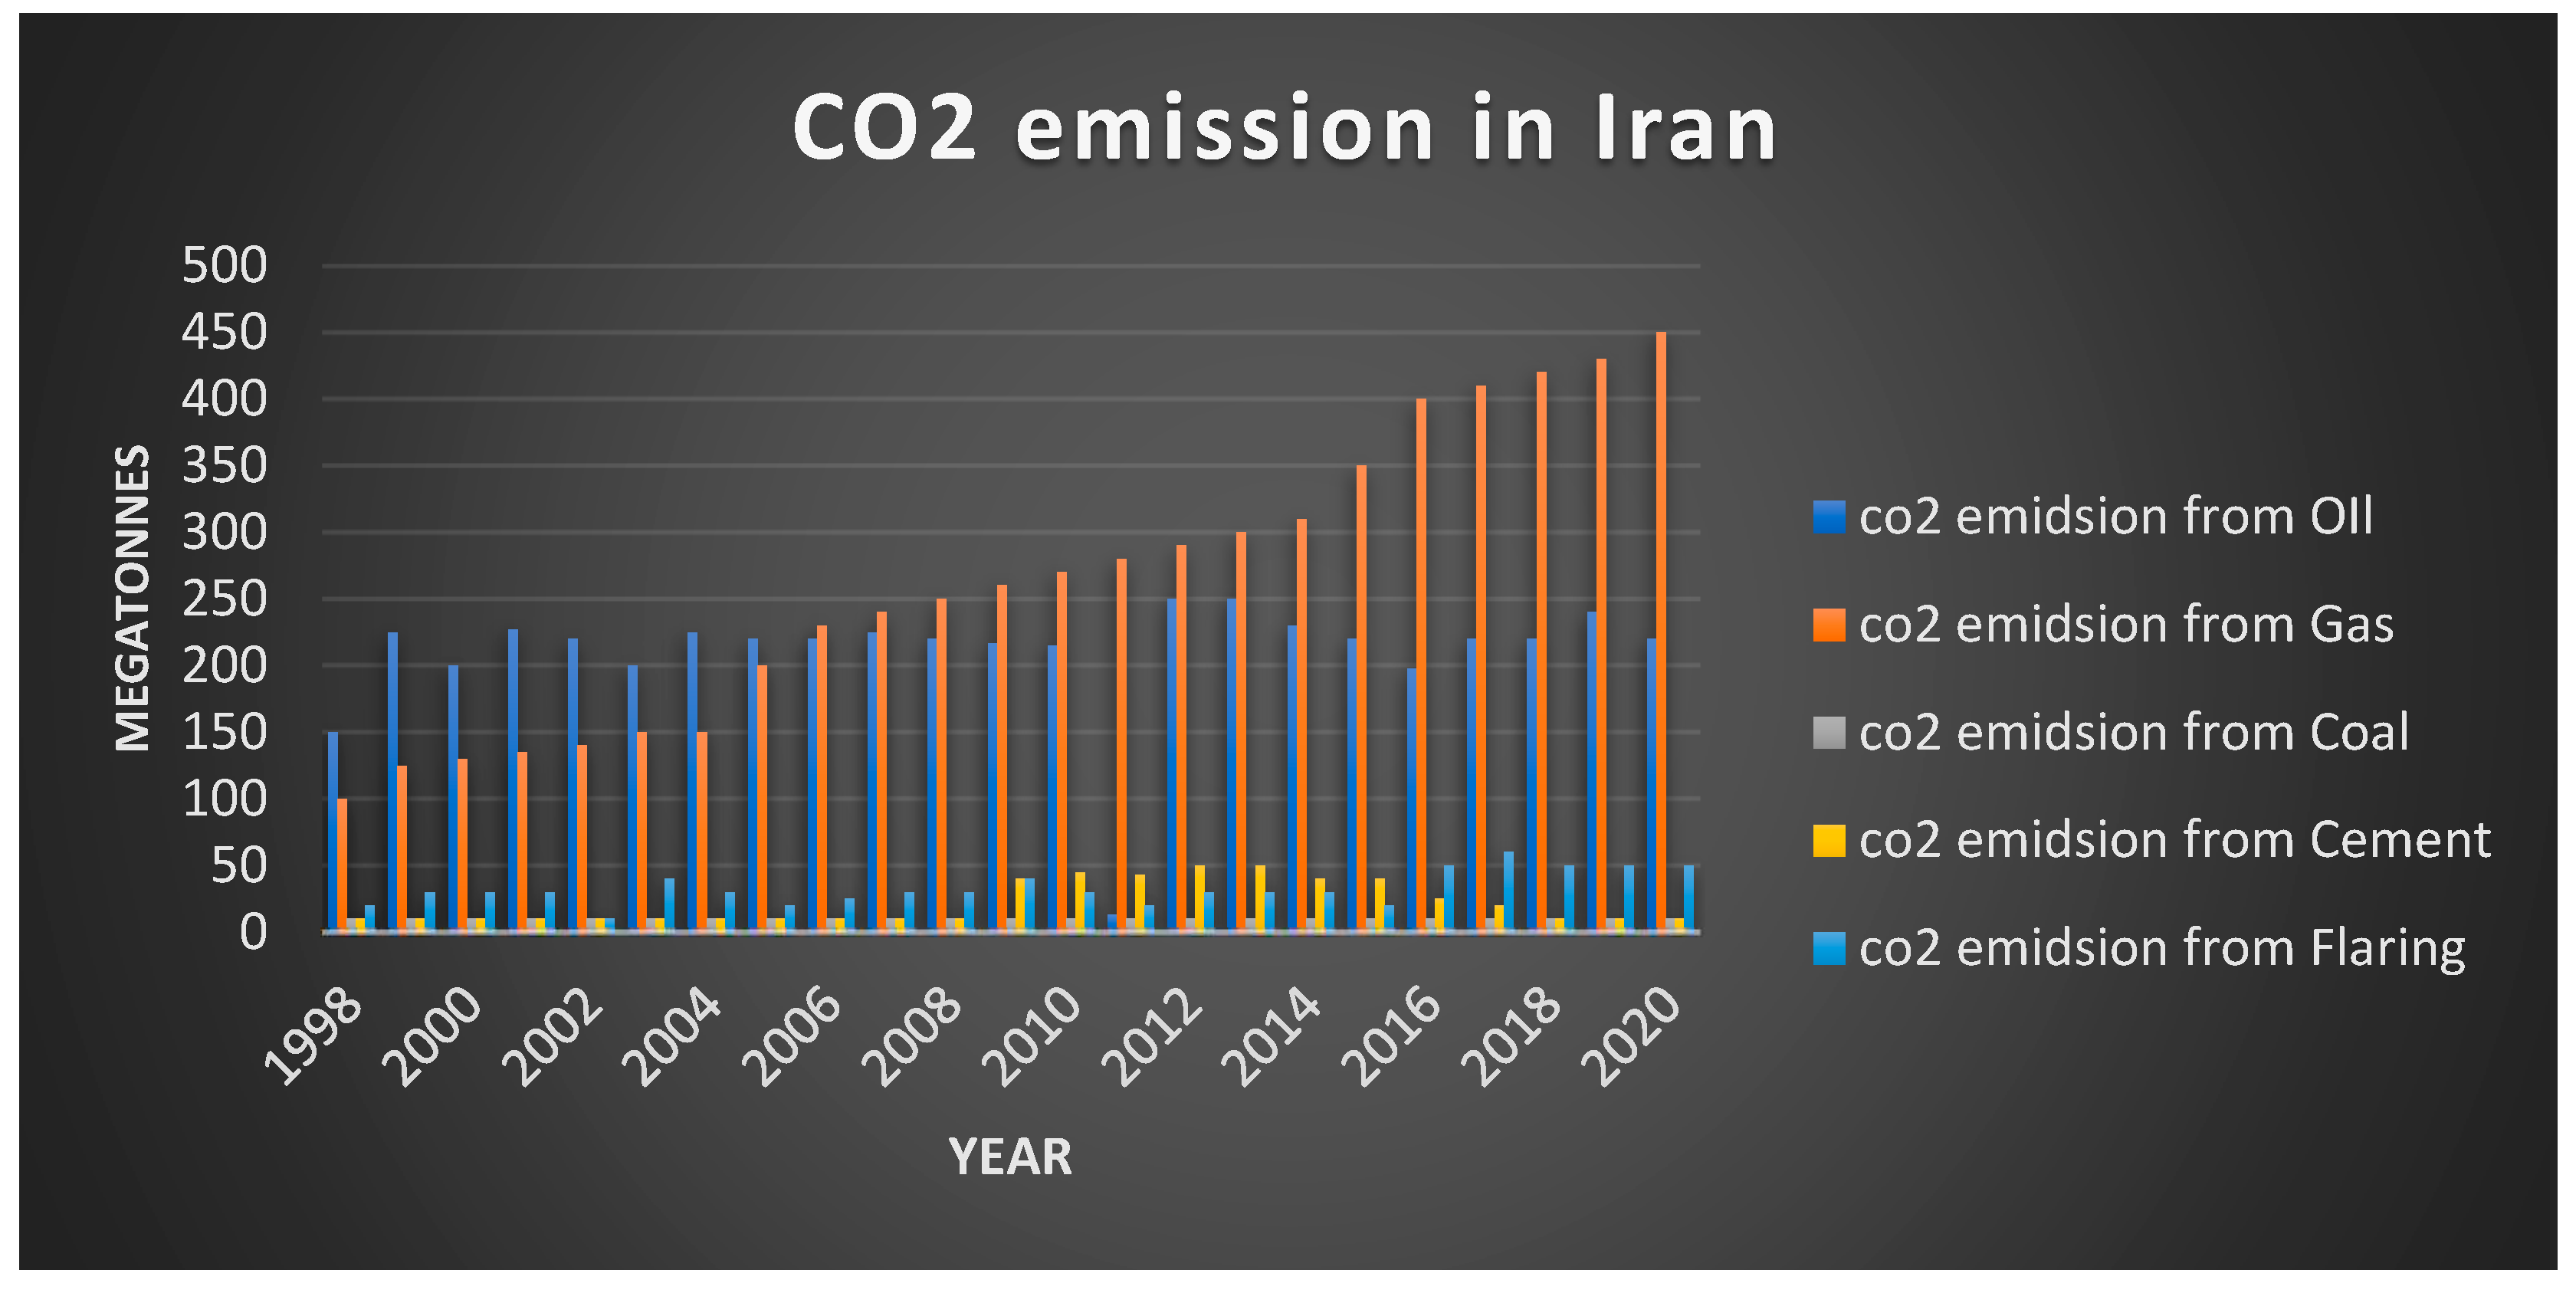
In Iran, a comparison of CO2e reveals a significant increase in emissions from natural gas, surpassing other primary energy sources. This indicates a substantial growth in CO2e emissions associated with the use of natural gas in Iran, in comparison to other energy sources(Figure 9).

6. Examining the subsidy provided to fossil fuels in PGR

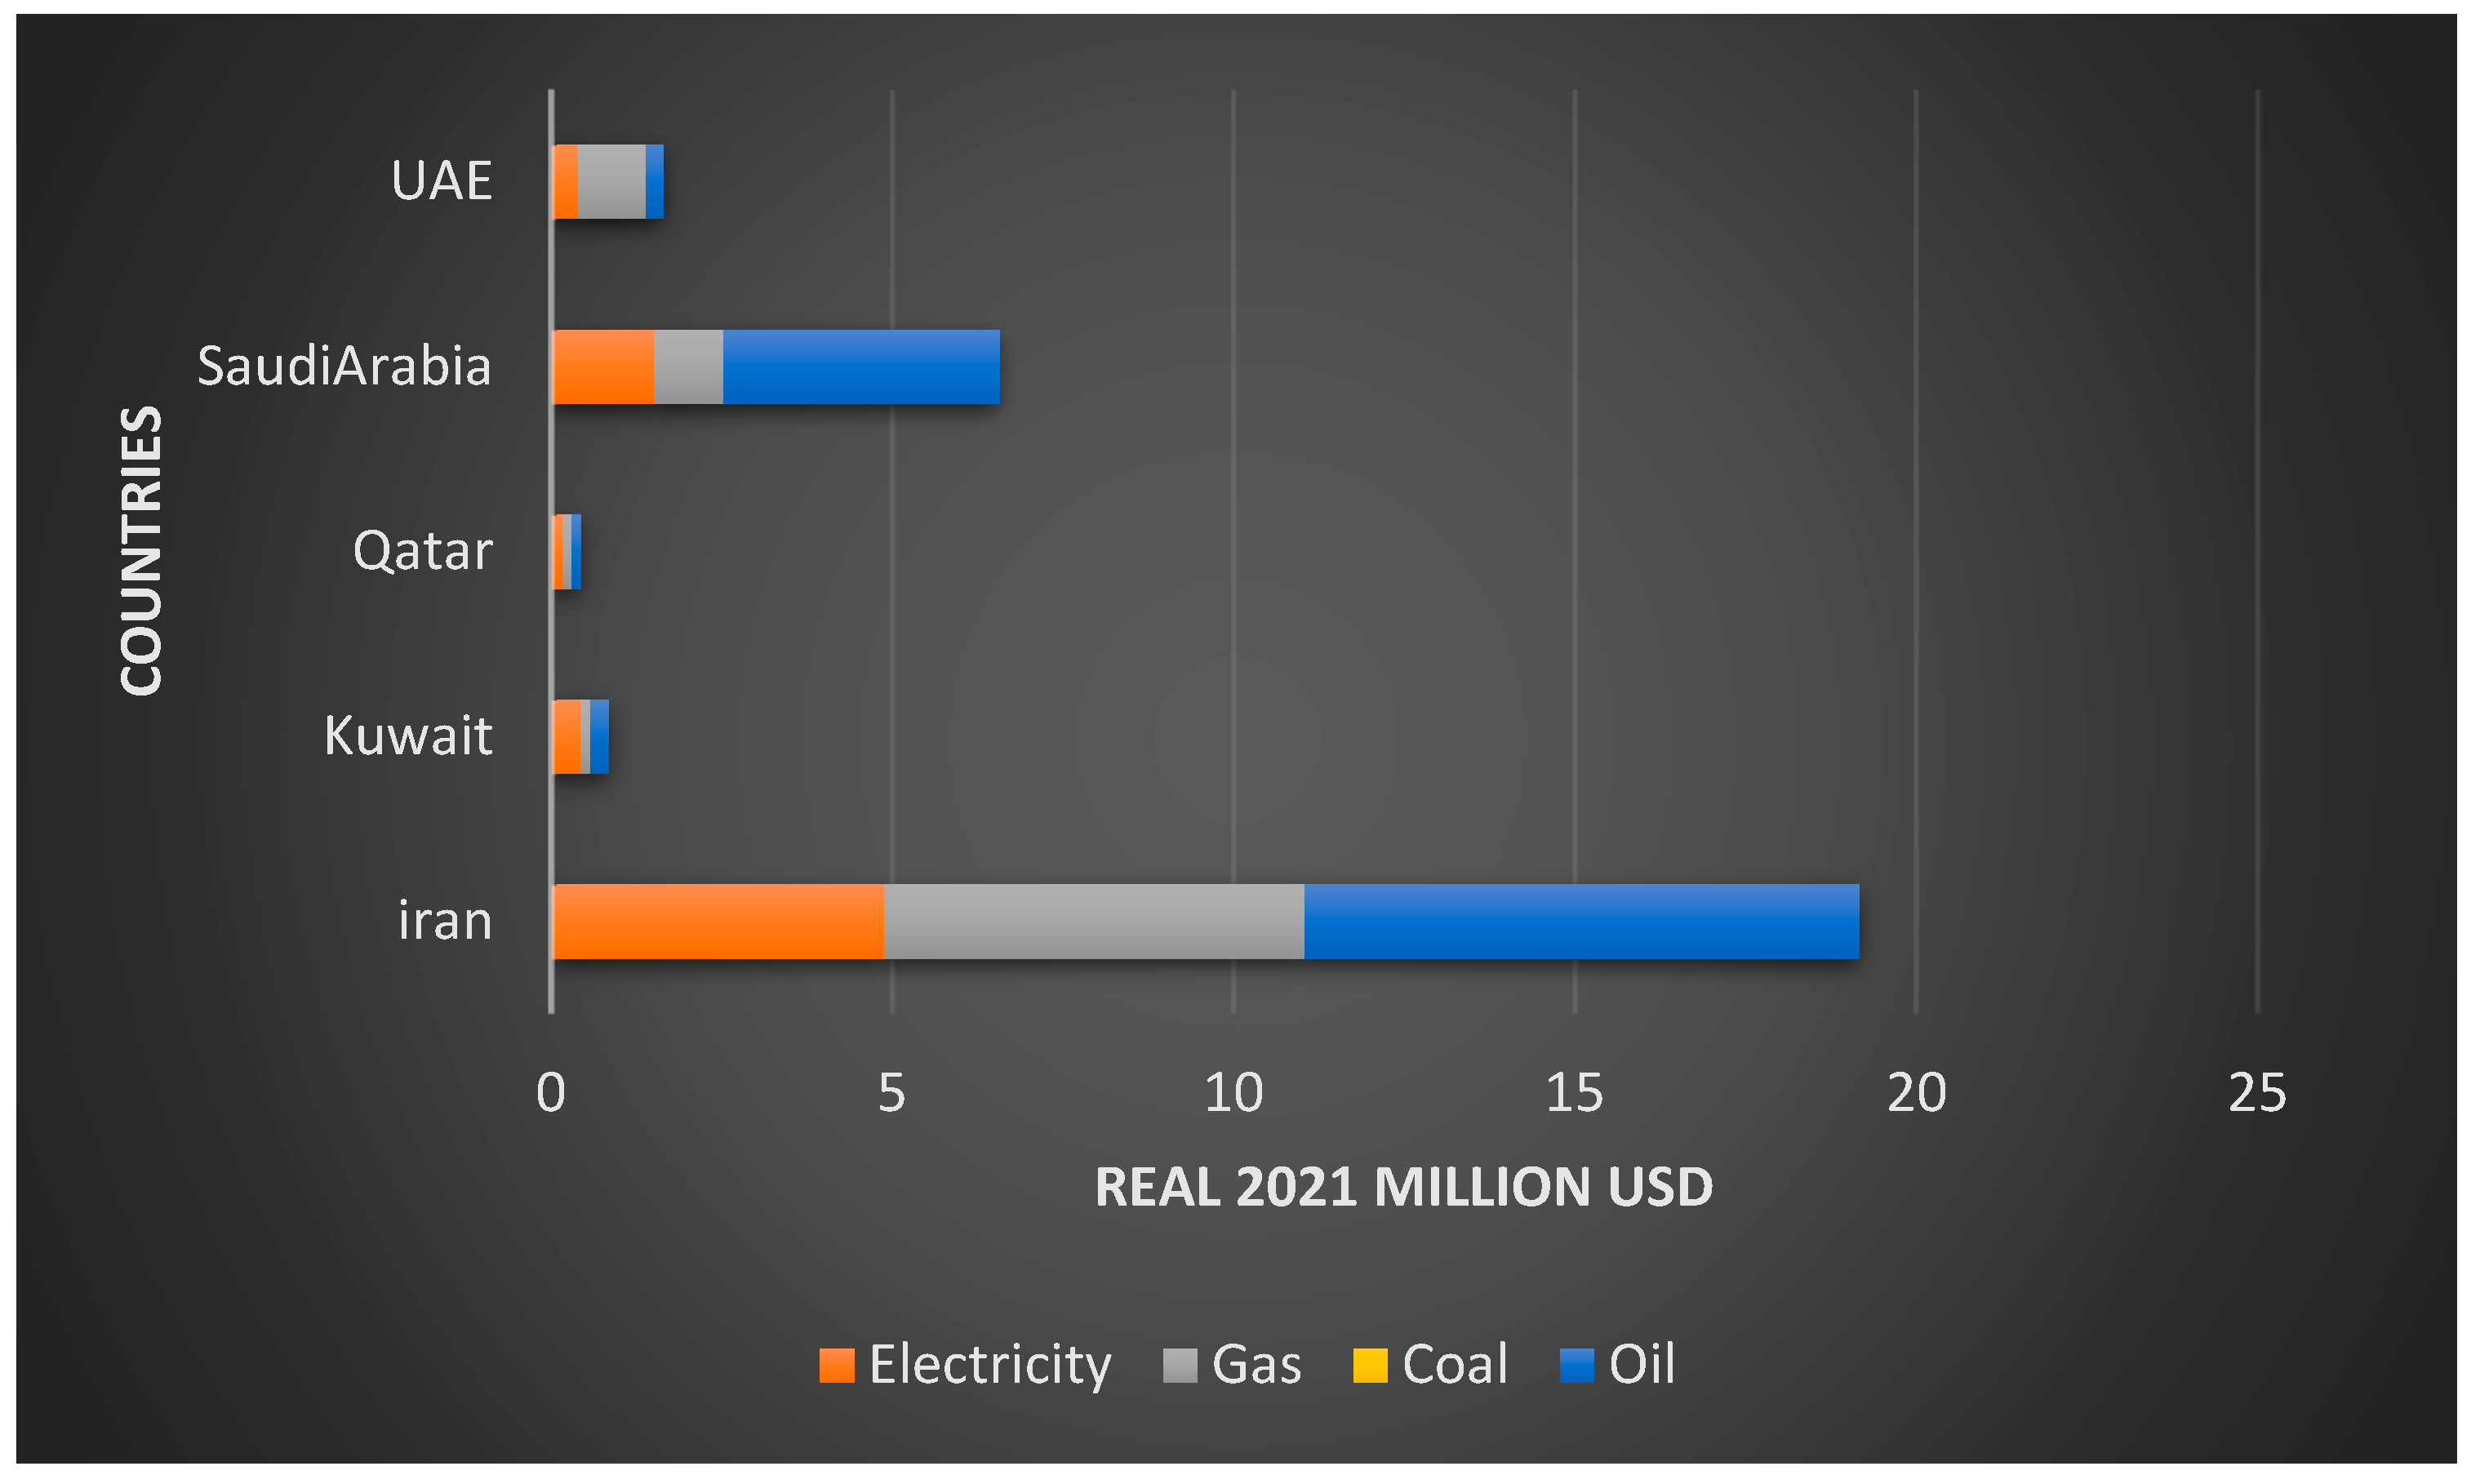
The Persian Gulf Region countries use fossil fuel subsidies to reduce energy costs and improve living standards for their citizens [81]. Nevertheless, a drawback associated with the reduction of energy costs is the excessive reliance on fossil fuels to meet the energy and electricity demands of buildings. The allocation of subsidies to fossil fuels varies among different countries, including oil, electricity, gas, and coal (Figure 10). Notably, the data for Oman is unavailable, resulting in its exclusion from Figure 10. In the case of Iran, the primary energy resources, oil and gas, receive the highest level of subsidies, consequently resulting in low electricity prices within the country.
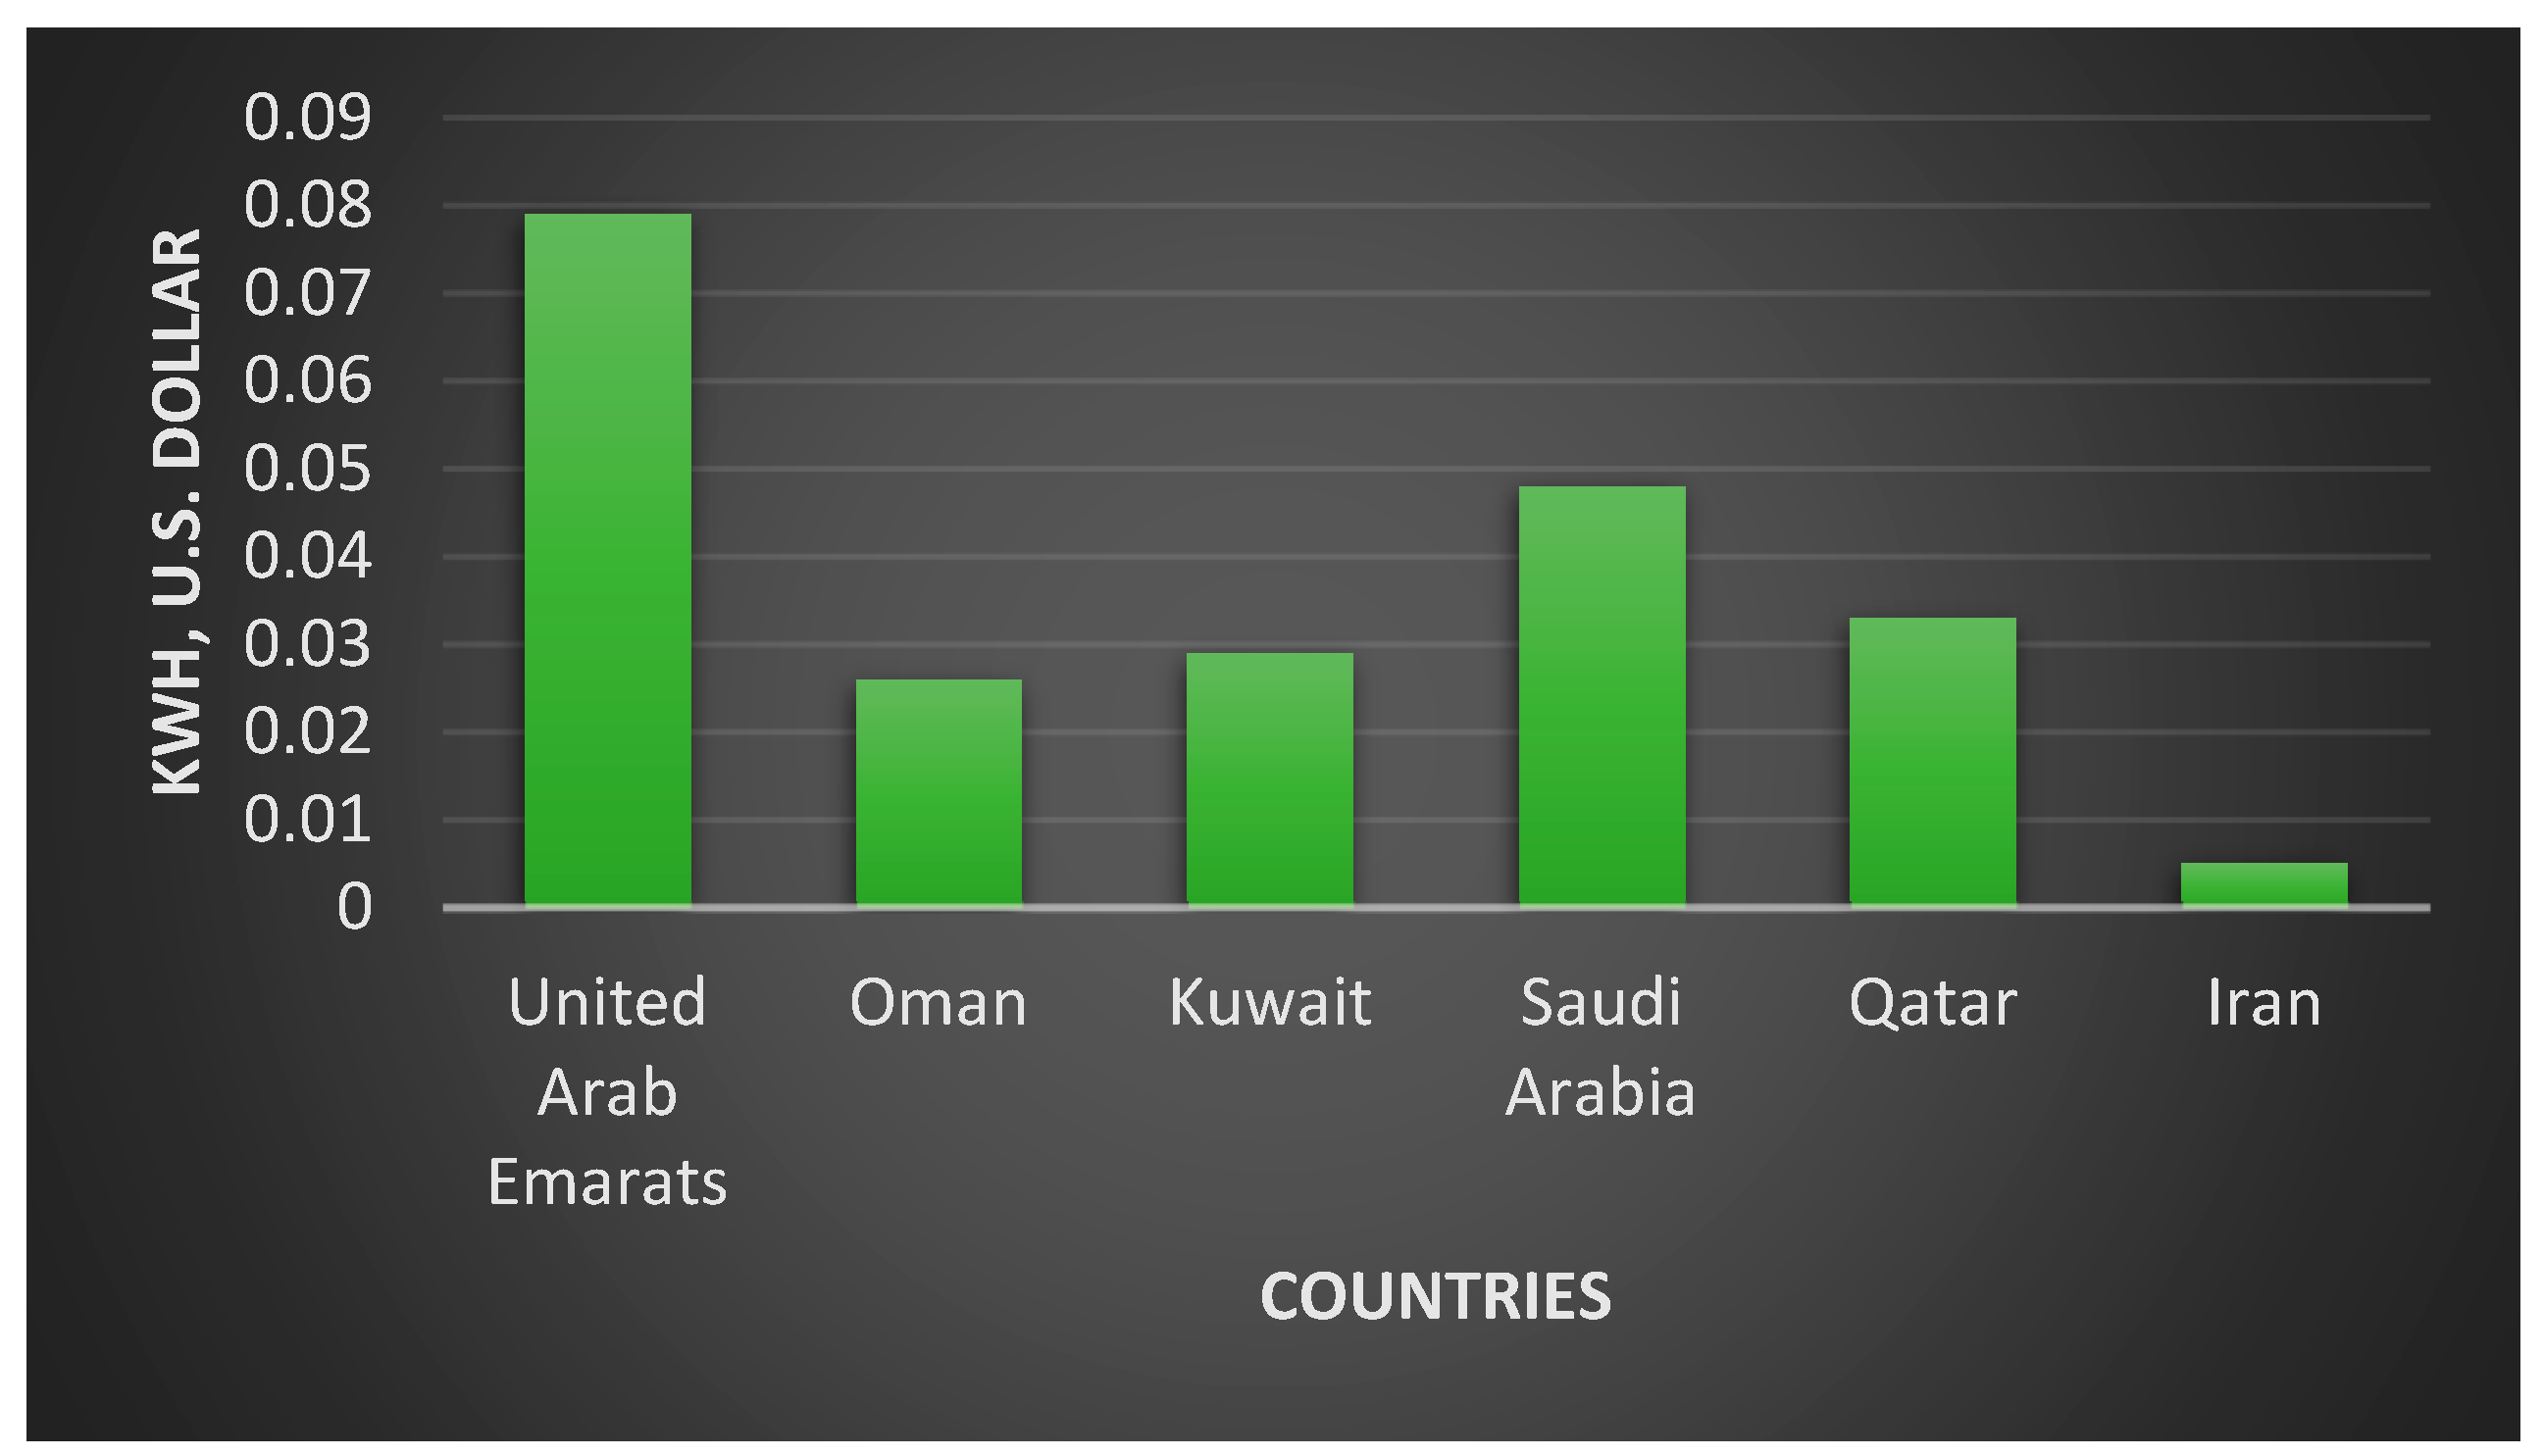
Iran offers substantial electricity subsidies, leading to some of the most affordable electricity prices compared to other countries. (Figure 11). As a result, there has been a substantial increase in the demand for electricity within Iran, as mention [47]. According to Fattouh and El-Katiri [84], state that energy consumption in the Middle East and North Africa has more than quadrupled, with electricity usage growing over sixfold in the past three decades.

4. Discussion and future directions

This study has endeavored to explore the problems of fossil fuel reliance in PGR and its correlation to increasing CO2e trend with a detrimental impact on the UHIE. This revealed that the oil-rich countries’ reliance on fossil fuels has grown over the years and instead of growing their investments in renewable energies, they have subsidized fossil-derived energy. This, in turn, has significantly affected oil-rich countries around PGR, in terms of more inefficient use of fossil fuels, by involving heavily in energy subsidy policies.
To examine the impact of energy subsidies in Iran, the researchers conducted a case study focusing on electricity usage in the country's domestic sector. The analysis revealed that the growing reliance on electricity generation from fossil fuels resulted in increased CO2e emissions and contributed to the Urban Heat Island Effect (UHIE) in the region. The energy subsidies provided in oil-rich countries like Iran incentivized households to consume more electricity, creating additional challenges such as the ineffective reduction of CO2e emissions associated with energy consumption in Iran.
Based on an examination of time series analysis and modeled climate data, it is evident that a warming climate is unavoidable in PGR countries. Climate change mitigation strategies can only partially alleviate the intensity of this warming. Consequently, adapting to climate change has become a prominent priority for PGR nations. Nevertheless, the PGR countries possess significant untapped potential for various forms of renewable energy. For instance, countries like Iran and Oman could harness wind energy [85]. The utilization of tidal energy is feasible for nations located in the northwest and southeast of the Gulf. Solar energy, on the other hand, could be harnessed across the entire region [86], However, the region's solar energy prospects may face challenges due to the rising occurrence of dust storms and high temperatures.
This presents an opportunity for policymakers to revise their policy implementation and decrease their reliance on fossil fuel-based electricity. Conducting future studies to explore alternative approaches suggested by oil-rich nations for reducing their dependence on fossil fuel-powered electricity would be valuable in gaining a deeper understanding of the impact of energy subsidies in these countries.
The findings of this research have underscored the ramifications of energy subsidy policies in oil-rich nations that rely on fossil fuel-based electricity generation. Increasing awareness among energy practitioners, policymakers, and designers about the cascading impacts of heightened subsidies on sustainable energy challenges faced by oil-rich countries, such as Iran, may spur future studies to incorporate investment considerations into energy policies. This, in turn, can pave the way for more practical solutions to curb fossil fuel consumption and reduce CO2e emissions in Iran and other oil-rich countries.

4. Conclusion

In the Persian Gulf region, it is essential to incorporate economic, social, and environmental aspects into sustainable development policies. To assess the region's sustainability, it is crucial to examine the negative effects of current energy production and subsidies.
This research highlights the repercussions of energy subsidy policies in oil-rich countries that rely on fossil fuel-based electricity generation. Increasing awareness among energy practitioners, policymakers, and designers about the cascading effects of heightened subsidies on sustainable energy issues faced by oil-rich nations, including Iran, can spur future studies that consider investment factors in energy policies. This, in turn, can lead to more practical solutions for reducing fossil fuel consumption and mitigating CO2 emissions in Iran and other oil-rich countries.
To address the issue of CO2 emissions in the Persian Gulf region, the following measures should be taken into account:
  • Implement a transition from high-carbon fossil fuels to low-carbon alternatives, coupled with emission reduction strategies such as CO2 sequestration (capturing and storing carbon from fossil fuels or the atmosphere).
  • The existing oil and gas policies pursued by nations in the Persian Gulf predominantly concentrate on augmenting energy production capacity, resulting in consumption-oriented and unsustainable approaches. Evaluating energy consumption patterns in recent years reveals inefficient and ineffectual energy usage. Furthermore, these countries frequently neglect to regard energy prices as indicative of economic expenses. As a result, subsidy reform becomes an essential policy instrument for these nations to encourage energy conservation and foster sustainability.
  • The countries in the Persian Gulf region should strengthen their initiatives to reduce carbon emissions by implementing a carbon taxation system that holds companies accountable for the amount of carbon they emit into the air.

Funding

This research received no external funding.

Institutional Review Board Statement

Not applicable.

Informed Consent Statement

Not applicable.

Conflicts of Interest

The authors declare no conflict of interest.

References

  1. Yu, Z.; Yao, Y.; Yang, G.; Wang, X.; Vejre, H. Spatiotemporal patterns and characteristics of remotely sensed region heat islands during the rapid urbanization (1995–2015) of Southern China. Sci. Total. Environ. 2019, 674, 242–254. [Google Scholar] [CrossRef]
  2. https://www.worldbank.org/en/news/feature/2021/12/16/2021-the-year-in-climate-in-5-numbers. 2021.
  3. Wong, K.V.; Paddon, A.; Jimenez, A. Review of World Urban Heat Islands: Many Linked to Increased Mortality. J. Energy Resour. Technol. 2013, 135, 022101. [Google Scholar] [CrossRef]
  4. Aflaki, A.; Mirnezhad, M.; Ghaffarianhoseini, A.; Ghaffarianhoseini, A.; Omrany, H.; Wang, Z.-H.; Akbari, H. Urban heat island mitigation strategies: A state-of-the-art review on Kuala Lumpur, Singapore and Hong Kong. Cities 2017, 62, 131–145. [Google Scholar] [CrossRef]
  5. Li, G.; Zhang, X.; Mirzaei, P.A.; Zhang, J.; Zhao, Z. Urban heat island effect of a typical valley city in China: Responds to the global warming and rapid urbanization. Sustain. Cities Soc. 2018, 38, 736–745. [Google Scholar] [CrossRef]
  6. Beni, A.N.; Marriner, N.; Sharifi, A.; Azizpour, J.; Kabiri, K.; Djamali, M.; Kirman, A. Climate change: A driver of future conflicts in the Persian Gulf Region? Heliyon 2021, 7, e06288. [Google Scholar] [CrossRef] [PubMed]
  7. Zhang, X.; Aguilar, E.; Sensoy, S.; Melkonyan, H.; Tagiyeva, U.; Ahmed, N.; Kutaladze, N.; Rahimzadeh, F.; Taghipour, A.; Hantosh, T.H.; et al. Trends in Middle East climate extreme indices from 1950 to 2003. J. Geophys. Res. Earth Surf. 2005, 110. [Google Scholar] [CrossRef]
  8. Nasrallah, H.A.; Nieplova, E.; Ramadan, E. Warm season extreme temperature events in Kuwait. J. Arid. Environ. 2004, 56, 357–371. [Google Scholar] [CrossRef]
  9. J. Simmons, P. J. Simmons, P. Berrisford, D. P. Dee, H. Hersbach, S. Hirahara, and J.-N. The ́paut, “A reassessment of temper- ature variations and trends from global reanalyses and monthly surface climatological datasets,” Quarterly Journal of the Royal Meteorological Society, 2017, vol. 143, no. 702, pp. 101–119.
  10. Hansen, J.E.; Ruedy, R.; Sato, M.; Lo, K. Global surface temperature change. Rev. Geophys. 2010, 48, RG4004. [Google Scholar] [CrossRef]
  11. Pal, J.S.; Eltahir, E.A.B. Future temperature in southwest Asia projected to exceed a threshold for human adaptability. Nat. Clim. Chang. 2015, 6, 197–200. [Google Scholar] [CrossRef]
  12. Lazoglou, G.; Anagnostopoulou, C.; Tolika, K.; Kolyva-Machera, F. A review of statistical methods to analyze extreme precipitation and temperature events in the Mediterranean region. Theor. Appl. Clim. 2018, 136, 99–117. [Google Scholar] [CrossRef]
  13. Tavakol, A.; Rahmani, V.; Harrington, J. Evaluation of hot temperature extremes and heat waves in the Mississippi River Basin. Atmospheric Res. 2020, 239, 104907. [Google Scholar] [CrossRef]
  14. M. J. Islam, M. J. M. J. Islam, M. J. Slater, M. Bo ̈gner, S. Zeytin, and A. Kunzmann, “Extreme ambient temperature effects in European seabass, Dicentrarchus labrax: growth performance and hemato-biochemical parameters,” Aquaculture 2020, vol. 522,.
  15. D. Luca, R. D. Luca, R. El ́ıa, M. Bador, and D. Argu ̈eso, “Contribution of mean climate to hot temperature extremes for present and future climates,” Weather and Climate Extremes 2020 vol. 28, Article ID 100255.
  16. Lelieveld, J.; Proestos, Y.; Hadjinicolaou, P.; Tanarhte, M.; Tyrlis, E.; Zittis, G. Strongly increasing heat extremes in the Middle East and North Africa (MENA) in the 21st century. Clim. Chang. 2016, 137, 245–260. [Google Scholar] [CrossRef]
  17. F. Abdulla, “21st century climate change projections of pre- cipitation and temperature in Jordan,” Procedia Manufacturing, 2020 vol. 44, pp. 197–204.
  18. S. Alghamdi and T. W. Moore, “Analysis and comparison of trends in extreme temperature indices in Riyadh city, kingdom of Saudi Arabia, 1985–2010,” Journal of Climatology,2014, Article ID 560985, 10 pages.
  19. Habib, R.R.; El Zein, K.; Ghanawi, J. Climate Change and Health Research in the Eastern Mediterranean Region. EcoHealth 2010, 7, 156–175. [Google Scholar] [CrossRef]
  20. Ahmadalipour, A.; Moradkhani, H. Escalating heat-stress mortality risk due to global warming in the Middle East and North Africa (MENA). Environ. Int. 2018, 117, 215–225. [Google Scholar] [CrossRef]
  21. Constantinidou, K.; Hadjinicolaou, P.; Zittis, G.; Lelieveld, J. Effects of climate change on the yield of winter wheat in the eastern Mediterranean and Middle East. Clim. Res. 2016, 69, 129–141. [Google Scholar] [CrossRef]
  22. Zachariadis, T.; Hadjinicolaou, P. The effect of climate change on electricity needs – A case study from Mediterranean Europe. Energy 2014, 76, 899–910. [Google Scholar] [CrossRef]
  23. Lange, M.A. Impacts of Climate Change on the Eastern Mediterranean and the Middle East and North Africa Region and the Water–Energy Nexus. Atmosphere 2019, 10, 455. [Google Scholar] [CrossRef]
  24. Jiang, L. & O”Neill, B. C. Global urbanization projections for the shared socio- economic. Pathw. Glob. Environ. Chang 2017. 42, 193–199.
  25. Abulibdeh, A. Analysis of urban heat island characteristics and mitigation strategies for eight arid and semi-arid gulf region cities. Environ. Earth Sci. 2021, 80, 1–26. [Google Scholar] [CrossRef]
  26. Ahmadi M, Soofiabadi M, Nikpour M. , …, and Arandian B. Developing a Deep Neural Network with Fuzzy Wavelets and Integrating an Inline PSO to Predict Energy Consumption Patterns in Urban Buildings. Mathematics 2022, 10, 1270.
  27. Ozturk, H.K.; Ceylan, H.; Canyurt, O.E.; Hepbasli, A. Electricity estimation using genetic algorithm approach: a case study of Turkey. Energy 2005, 30, 1003–1012. [Google Scholar] [CrossRef]
  28. Köne, A. .; Büke, T. Forecasting of CO2 emissions from fuel combustion using trend analysis. Renew. Sustain. Energy Rev. 2010, 14, 2906–2915. [Google Scholar] [CrossRef]
  29. Ramanathan, R. An analysis of energy consumption and carbon dioxide emissions in countries of the Middle East and North Africa. Energy 2005. [Google Scholar] [CrossRef]
  30. Qader, M.R. Electricity Consumption and GHG Emissions in GCC Countries. Energies 2009, 2, 1201–1213. [Google Scholar] [CrossRef]
  31. Hdom, H.A.D. Examining carbon dioxide emissions, fossil & renewable electricity generation and economic growth: Evidence from a panel of South American countries. Renew. Energy 2019, 139, 186–197. [Google Scholar] [CrossRef]
  32. Ridhosari, B,. Rahman, A,. Carbon footprint assessment at Uni- versitas Pertamina from the scope of electricity, transportation, and waste generation: toward a green campus and promotion of environmental sustainability. 1: Clean Prod 2020, 246, 2020.
  33. Liddle B, Sadorsky P. How much does increasing non-fossil fuels in electricity generation reduce carbon dioxide emissions Appl.Energy 2017. 2: 197.
  34. Barthel, P.-A. Arab Mega-Projects: Between the Dubai Effect, Global Crisis, Social Mobilization and a Sustainable Shift. Built Environ. 2010, 36, 133–145. [Google Scholar] [CrossRef]
  35. Bartlett, M. S. Coupled carbon and water fluxes in CAM photosynthesis: Modeling quantification of water use efficiency andproductivity,Plant Soil 2014,383(1–2), 111–138.
  36. Mirasgedis, S.; Sarafidis, Y.; Georgopoulou, E.; Lalas, D. The role of renewable energy sources within the framework of the Kyoto Protocol: the case of Greece. Renew. Sustain. Energy Rev. 2002, 6, 247–269. [Google Scholar] [CrossRef]
  37. Asif, M.; Muneer, T. Energy supply, its demand and security issues for developed and emerging economies. Renew. Sustain. Energy Rev. 2007, 11, 1388–1413. [Google Scholar] [CrossRef]
  38. Aryanpur, V.; Ghahremani, M.; Mamipour, S.; Fattahi, M.; Gallachóir, B.Ó.; Bazilian, M.D.; Glynn, J. Ex-post analysis of energy subsidy removal through integrated energy systems modelling. Renew. Sustain. Energy Rev 2022, 158, 112116. [Google Scholar] [CrossRef]
  39. Solaymani, S. Energy subsidy reform evaluation research – reviews in Iran. Greenh. Gases: Sci. Technol. 2021, 11, 520–538. [Google Scholar] [CrossRef]
  40. Solaymani, S. A Review on Energy and Renewable Energy Policies in Iran. Sustainability 2021, 13, 7328. [Google Scholar] [CrossRef]
  41. Ouyang, X.; Lin, B. Impacts of increasing renewable energy subsidies and phasing out fossil fuel subsidies in China. Renew. Sustain. Energy Rev. 2014, 37, 933–942. [Google Scholar] [CrossRef]
  42. IEA. World Energy Outlook 2017 Executive Summary; Energy Policy; IEA: Paris, France, 2017; pp. 90024–4. [Google Scholar]
  43. OECD. Improving the Environment through Reducing Subsidies; Organisation for Economic Cooperation and Development: Paris, France, 1999; Volume 1. [Google Scholar]
  44. OECD. Reforming Energy and Transport Subsidies: Environmental and Economic Implications; Organisation for Economic Cooperation and Development: Paris, France, 1997.44. Hamdi H, Sbia R, Shahbaz M. The nexus between electric- ity consumption and economic growth in Bahrain. Econ Model 2014, 38:227–237. [Google Scholar]
  45. Burniaux, J.-M.; Martin, J.P.; Oliveira-Martins, J. The Effect of Existing Distortions in Energy Markets on the Costs of Policies to Reduce CO2 Emissions: Evidence from GREEN; the Economic Costs of Reducing CO2 Emissions (OECD Economic Studies No 19); Organisation for Economic Cooperation and Development: Paris, France, 1992. [Google Scholar]
  46. Al-Marri, W.; Al-Habaibeh, A.; Watkins, M. An investigation into domestic energy consumption behaviour and public awareness of renewable energy in Qatar. Sustain. Cities Soc. 2018, 41, 639–646. [Google Scholar] [CrossRef]
  47. Fatourehchi, D.; Noguchi, M.; Doloi, H. Iranian Household Electricity Use Compared to Selected Countries. Encyclopedia 2022, 2, 1637–1665. [Google Scholar] [CrossRef]
  48. Verme, P. Subsidy Reforms in the Middle East and North Africa region: A review. In The Quest for Subsidy Reforms in the Middle East and North Africa Region; Springer: Cham, Switzerland, 2017; pp. 3–31. [Google Scholar]
  49. Moerenhout, T.; Irschlinger, T. Exploring the Trade Impacts of Fossil Fuel Subsidies; International Institute for Sustainable Development: Winnipeg, MB, Canada, 2020. [Google Scholar]
  50. Fattouh, B.; El-Katiri, L. Energy subsidies in the Middle East and North Africa. Energy Strat. Rev. 2013, 2, 108–115. [Google Scholar] [CrossRef]
  51. Wang, Q.; Qiu, H.-N.; Kuang, Y. Market-driven energy pricing necessary to ensure China's power supply. Energy Policy 2009, 37, 2498–2504. [Google Scholar] [CrossRef]
  52. Ahmad, M,. Chandio, AA,. Solangi, YA,. Shah, SAA,. Shahzad, F,. Rehman, A,. Jabeen, G. Dynamic interactive links among sustainable energy investment, air pollution, and sustainable development in regional China. 1: Environ Sci Pollut Res 2021, 28(2); 1502–1518.
  53. Burt, J.A.; Bartholomew, A. Towards more sustainable coastal development in the Arabian Gulf: Opportunities for ecological engineering in an urbanized seascape. Mar. Pollut. Bull. 2019, 142, 93–102. [Google Scholar] [CrossRef]
  54. Lelieveld, J. , Hadjinicolaou, P., Kostopoulou, E., Chenoweth, J., El Maayar, M., Giannakopoulos, C., et al. Climate change and impacts in the eastern mediterranean andthe Middle East. Climatic Change 2012, 114 (3-4), 667–687.
  55. Parry, M. , Parry, M.L., Canziani, O., Palutikof, J., Van der Linden, P., Hanson, C. Adaptation and Vulnerability: Working group II Contribution to the Fourth Assessment Report of the IPCC, 4. Cambridge University Press.Climate Change 2007.
  56. World Bank, 2019. Development Data. World Bank https://databank.worldbank.org/home.aspx.
  57. http://www.meteomanz.com.
  58. https://climateknowledgepo rtal.worldbank.org/region/middle-east/climate-data-historical.
  59. Briant, P. , 2006. From Cyrus to Alexander: A History of the Persian Empire. Eisenbrauns. Retrieved from: http://books.google.com/ books?id=lxQ9W6F1oSYC&pg=PA761.
  60. Teng, JZ,. Khan, MK,. Khan, MI,. Chishti, MZ,. Khan, MO,. Effect of foreign direct investment on CO 2 emission with the role of globalization, institutional quality with pooled mean group panel ARDL. Environmental Sci PollutRes 2020. 1–12.
  61. Nezlin, N.P.; Polikarpov, I.G.; Al-Yamani, F.Y.; Rao, D.S.; Ignatov, A.M. Satellite monitoring of climatic factors regulating phytoplankton variability in the Arabian (Persian) Gulf. J. Mar. Syst. 2010, 82, 47–60. [Google Scholar] [CrossRef]
  62. https://worldpopulationreview.com/continents/the-middle-east-population.
  63. Giannakopoulou, E.M.; Toumi, R. The Persian Gulf summertime low-level jet over sloping terrain. Q. J. R. Meteorol. Soc. 2011, 138, 145–157. [Google Scholar] [CrossRef]
  64. Prakash, P.J.; Stenchikov, G.; Kalenderski, S.; Osipov, S.; Bangalath, H. The impact of dust storms on the Arabian Peninsula and the Red Sea. Atmospheric Meas. Tech. 2015, 15, 199–222. [Google Scholar] [CrossRef]
  65. Frenken, K. Irrigation in the Middle East region in figures AQUASTAT Survey- 2008. Water Rep 2009. (34).
  66. Burt, J.A. The environmental costs of coastal urbanization in the Arabian Gulf. City 2014, 18, 760–770. [Google Scholar] [CrossRef]
  67. Sheppard, C.; Al-Husiani, M.; Al-Jamali, F.; Al-Yamani, F.; Baldwin, R.; Bishop, J.; Benzoni, F.; Dutrieux, E.; Dulvy, N.K.; Durvasula, S.R.V.; et al. The Gulf: A young sea in decline. Mar. Pollut. Bull. 2010, 60, 13–38. [Google Scholar] [CrossRef] [PubMed]
  68. Vaughan, G.O. , Al-Mansoori, N., Burt, J. The Arabian Gulf. In: Sheppard, C. (Ed.), World Seas: an Environmental Evaluation, second ed. Elsevier Science, Amsterdam, NL 2019, pp. pp1–23.
  69. International Energy Agency (IEA), Paris, France, 2020. Available online: https://www.iea.org (accessed on 15 July 2021).
  70. Ardemagni, E. Gulf Powers: Maritime Rivalry in the Western Indian Ocean. Baldwin-Edwards, M., 2005. Migration in the Middle East and Mediterranean: A Regional. 2018.
  71. Dawoud, M.A. Environmental Impacts of Seawater Desalination: Arabian Gulf Case Study. Int. J. Environ. Sustain. Dev. 2012, 1, 22–37. [Google Scholar] [CrossRef]
  72. World-Nuclear-Association, 2019. Nuclear Power in Iran. http://www.world-nuclear.org/information-library/country-profiles/countries-g-n/iran.aspx.
  73. Oryani, B.; Kamyab, H.; Moridiаn. ; Azizi, Z.; Rezania, S.; Chelliapan, S. Does structural change boost the energy demand in a fossil fuel-driven economy? New evidence from Iran. Energy 2022, 254. [Google Scholar] [CrossRef]
  74. Quadrelli, R.; Peterson, S. The energy–climate challenge: Recent trends in CO2 emissions from fuel combustion. Energy Policy 2007, 35, 5938–5952. [Google Scholar] [CrossRef]
  75. El-Katiri, L. A Roadmap for Renewable Energy in the Middle East and North Africa. 2014. [Google Scholar] [CrossRef]
  76. World Bank, 2010. Development and climate change. Washington, DC.: World Bank. Retrieved from: https://openknowledge. worldbank.org/handle/10986/4387. 1098.
  77. Air and GHG emissions. 2017. [CrossRef]
  78. Köne, A. .; Büke, T. Forecasting of CO2 emissions from fuel combustion using trend analysis. Renew. Sustain. Energy Rev. 2010, 14, 2906–2915. [Google Scholar] [CrossRef]
  79. https://www.iea.
  80. Bouckaert, S.; Pales, A.F.; McGlade, C.; Remme, U.; Wanner, B.; Varro, L.; D’Ambrosio, D.; Spencer, T. Net Zero by 2050: A Roadmap for the Global Energy Sector; IEA: Paris, France, 2021. [Google Scholar]
  81. Global Carbon Project. Supplemental Data of Global Carbon Project 2021(1.0) [Data Set]; Global Carbon Project: Canberra, Australia, 2021; pp. 1–191. [Google Scholar]
  82. Kaygusuz, K. Energy for sustainable development: A case of developing countries. Renew. Sustain. Energy Rev. 2012, 16, 1116–1126. [Google Scholar] [CrossRef]
  83. IEA. Fossil Fuel Subsidies Database. 2021. Available online: https://www.iea.org/data-and-statistics/data-product/fossil-fuel- subsidies-database (accessed on 10 March 2022).
  84. El-Katiri, L.; Fattouh, B. A Brief Political Economy of Energy Subsidies in the Middle East and North Africa. 7. [CrossRef]
  85. Nematollahi, O.; Hoghooghi, H.; Rasti, M.; Sedaghat, A. Energy demands and renewable energy resources in the Middle East. Renew. Sustain. Energy Rev. 2016, 54, 1172–1181. [Google Scholar] [CrossRef]
  86. Almasoud, A.; Gandayh, H.M. Future of solar energy in Saudi Arabia. J. King Saud Univ. - Eng. Sci. 2015, 27, 153–157. [Google Scholar] [CrossRef]
Figure 1. Persian Gulf Region ( the area of study).
Preprints 83991 g001
Figure 2. The Community Climate System Model (CCSM4) The surface temperature anomalies in Southwest Asia for 1950, 2000, 2050, and 2100, are being compared to those in 1900. (data from [6]).
Preprints 83991 g002
Figure 3. Projected alterations in monthly precipitation for the Middle East region from 2020 to 2099 [58].
Preprints 83991 g003
Figure 4. Prominent ecological areas within the Persian Gulf Region [67,69,70,71,72].
Preprints 83991 g004
Figure 5. The distribution of Iran's primary energy consumption by fuel in the year 2021 (Data source [69]).
Preprints 83991 g005
Figure 6. Energy consumption in PGR from 2000-2020 (IEA, 116).
Preprints 83991 g006
Figure 7. The cumulative yearly CO2 emissions (measured in gigatons) for both the Persian Gulf Region and the global scale [56].
Preprints 83991 g007
Figure 8. Carbon dioxide emission in PGR from 2010-2020 (data from [79]).
Preprints 83991 g008
Figure 9. various resources of CO2 in Iran [78].
Preprints 83991 g009
Figure 10. The energy subsidy of countries around the Persian Gulf Region by fuel type in 2020 [83].
Preprints 83991 g010
Figure 11. Electricity prices for households in countries around PGR, September 2022 (kWh, U.S. Dollar) (data source[57]).
Preprints 83991 g011
Table 1. Temperature data in ºC for the Persian Gulf Region (annual max Ave) [57].
Year
Dubai (UAE) Kuwait (KW) Ahvaz (IR) Khasab (OM) Jaddeh (SA) Doha (QA)
2006 32.4 33.9 33 33.5 35.2 33.5
2007 32.7 33.8 33.6 33.6 35.2 33.5
2008 33.7 34 33.8 33.3 35.5 33.5
2009 34 34 33.4 33.7 35.3 33.7
2010 34.7 36.2 35 35.4 36.3 34.6
2011 34.2 34.1 33.3 34.5 34.5 33.7
2012 34.4 34.4 33.6 34.5 35.1 33.6
2013 33.1 30.8 33 33.8 34.4 32.2
2014 33.8 34.1 33.5 34.3 34.5 33.7
2015 34.6 34.6 34.3 35.5 34 34.2
2016 34.2 34.7 34.2 34.8 34.1 33.8
2017 34.9 35 35.1 34.4 33.6 24.1
2018 34.6 34 34.8 34.5 34.1 32.2
2019 34.6 34.5 34 29.9 33.9 33.8
2020 34.8 34.4 34.2 39 34.3 33.9
2021 35.7 35.6 35.9 32.1 35 34.8
2022 36.1 34.8 35.1 34.2 34.9 33.5
Table 2. Mean annual precipitation by country in the Persian Gulf Region.
Country Mean Annual Prec (mm)
Iran 223.05
Qatar 65.15
KSA 74.03
Kuwait 114.3
UAE 64.84
Table 3. The amount CO2 emissions per capita resulting from energy consumption. (metric tons of CO2).
year Iran Kuwait Qatar Saudi Arabia United Arab Emirates
2010 7.4 33 45 20 44
2011 7.6 39 44 21 44
Table 4. Share of different contributors of energy to CO2 emission (adopted from [45]).
section Share (%)
Transport 16.2
Energy in buildings 17.5
Energy in industry 24.2
Energy in agriculture & fishing 1.7
Unallocated fuel combustion 7.8
Fugitive emissions from energy 5.8
Disclaimer/Publisher’s Note: The statements, opinions and data contained in all publications are solely those of the individual author(s) and contributor(s) and not of MDPI and/or the editor(s). MDPI and/or the editor(s) disclaim responsibility for any injury to people or property resulting from any ideas, methods, instructions or products referred to in the content.
Copyright: This open access article is published under a Creative Commons CC BY 4.0 license, which permit the free download, distribution, and reuse, provided that the author and preprint are cited in any reuse.
Prerpints.org logo

Preprints.org is a free preprint server supported by MDPI in Basel, Switzerland.

Subscribe

© 2024 MDPI (Basel, Switzerland) unless otherwise stated