Submitted:
02 September 2023
Posted:
05 September 2023
You are already at the latest version
Abstract
Keywords:
1. Introduction-Research Question
2. Literature Review

3. The Econometric Model for the Estimation of the Socio-Economic Determinants of Physicians Among Italian Regions
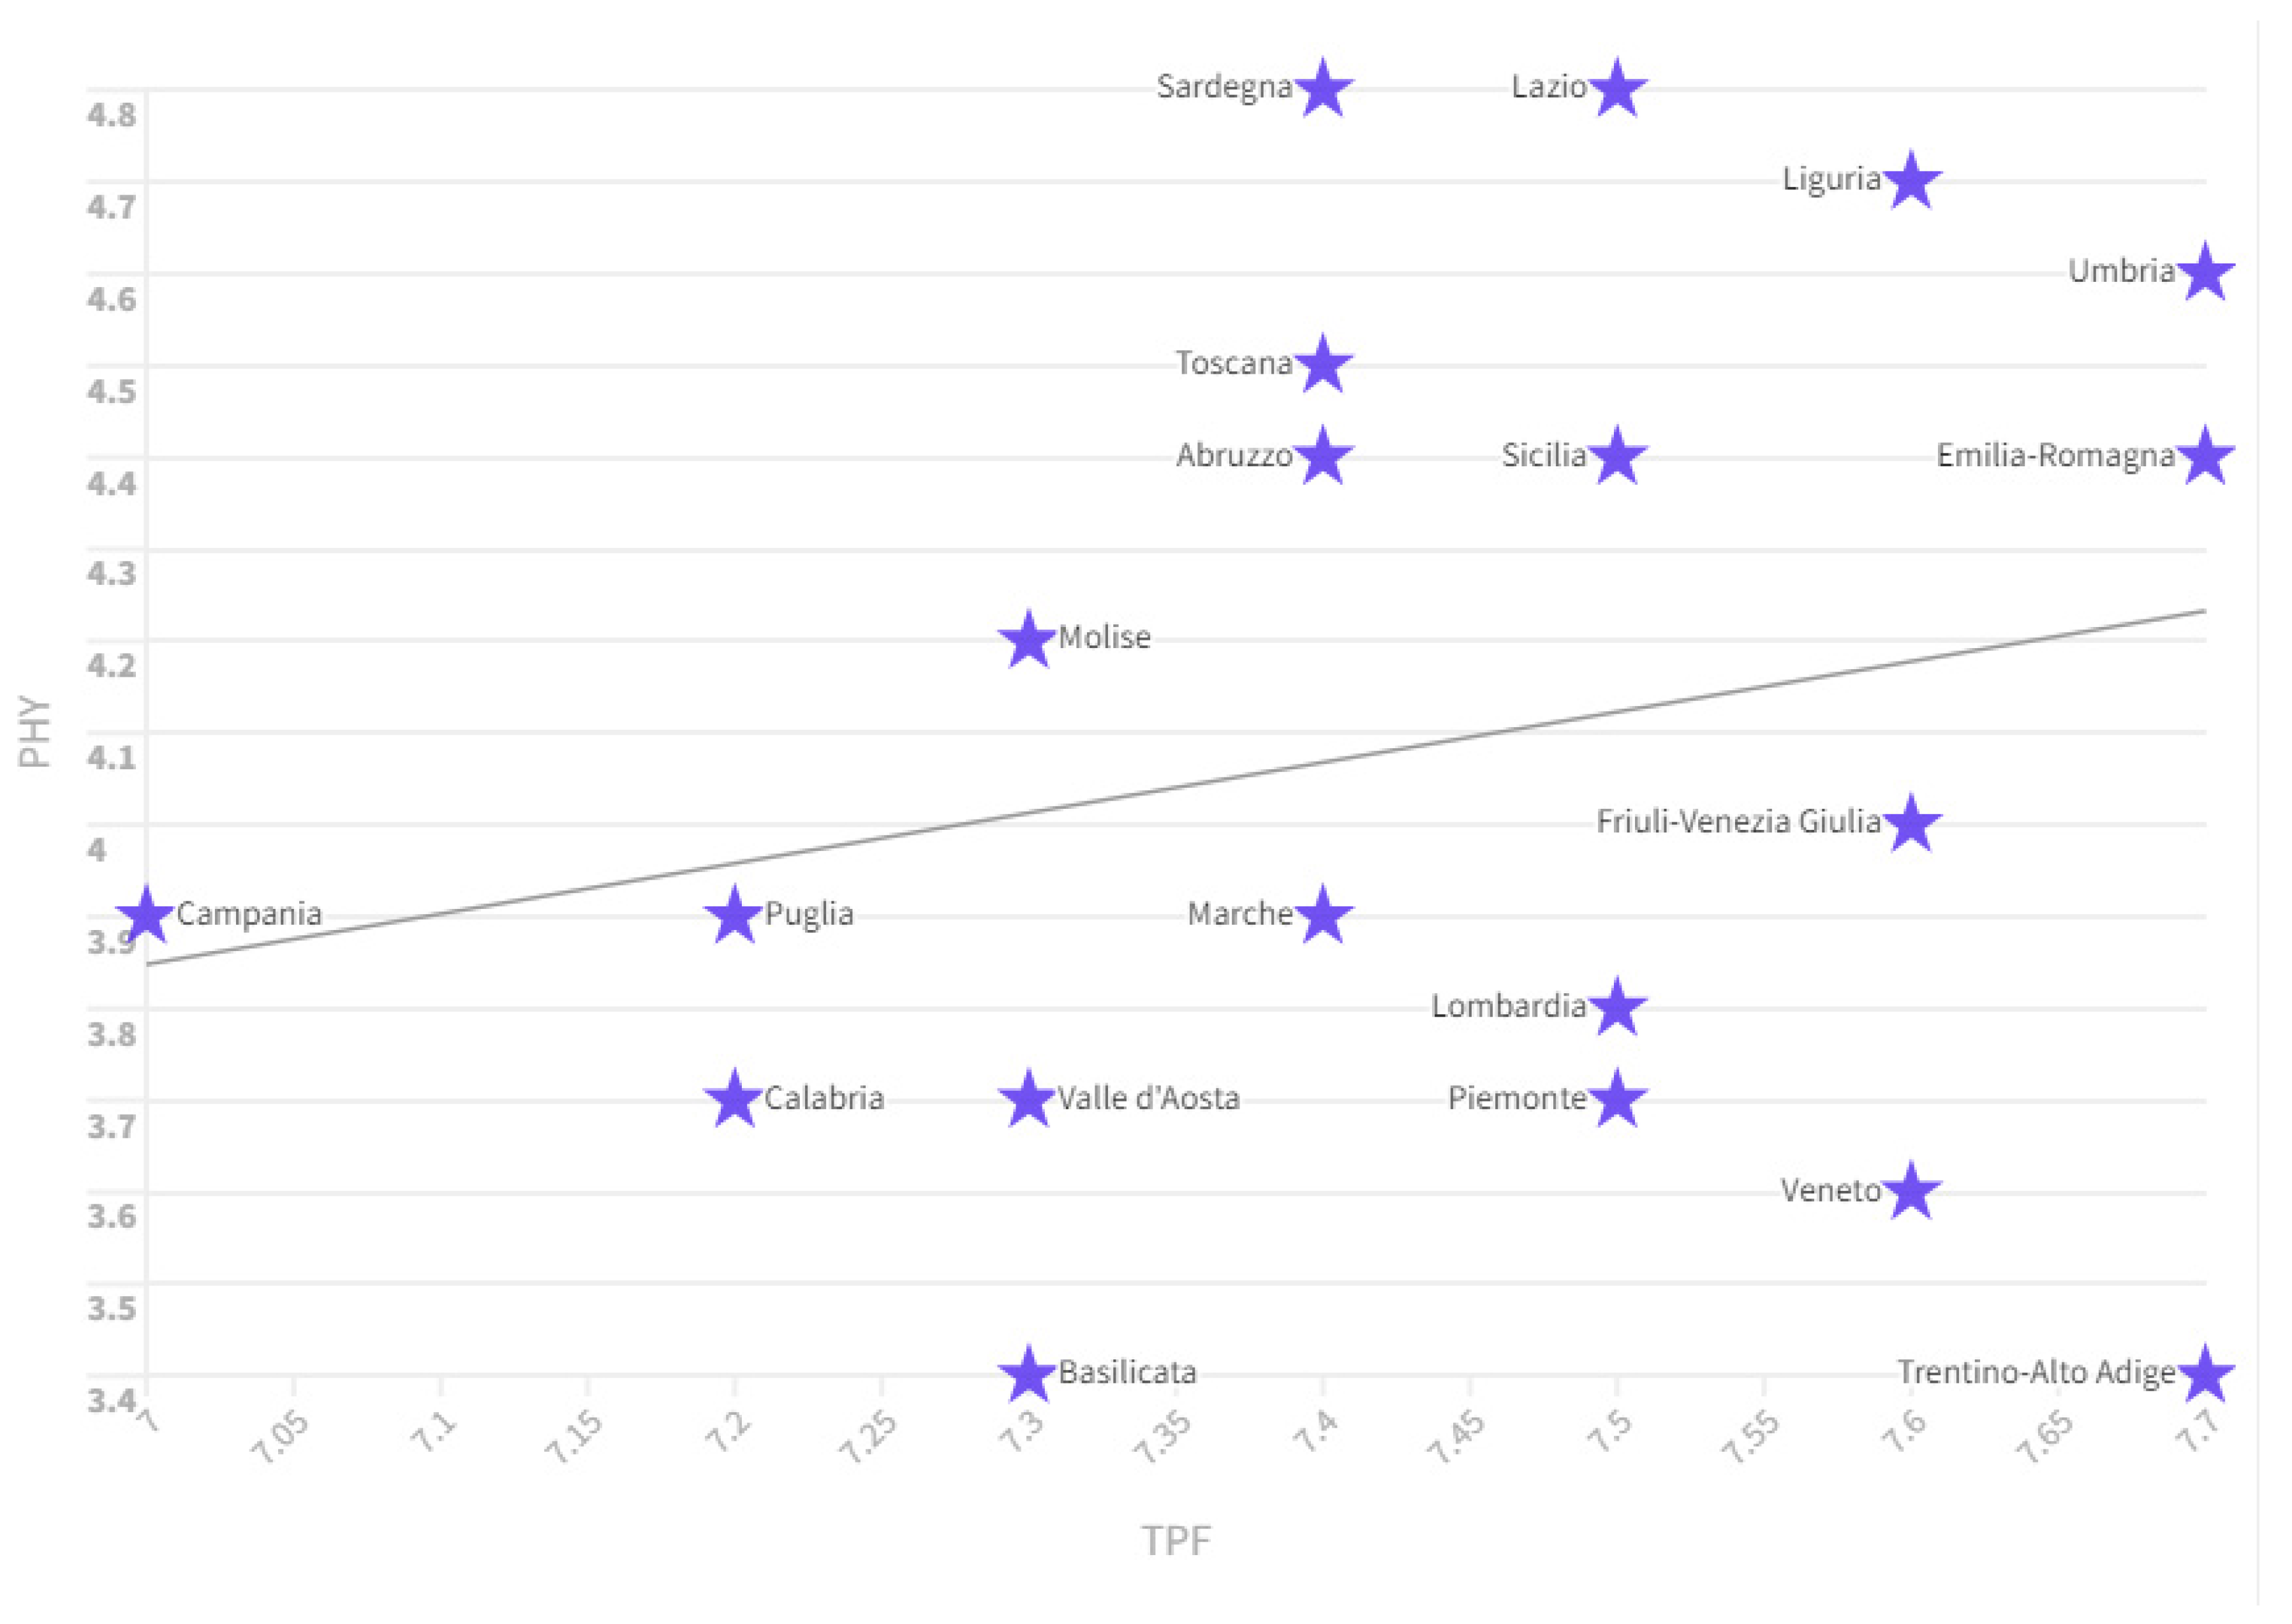
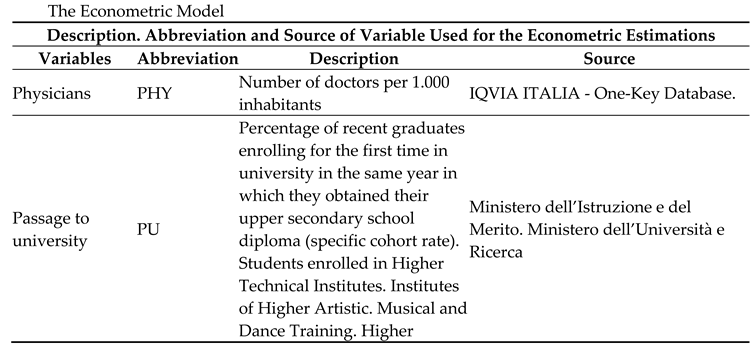
- TPF: it is the average score of confidence in the Police Forces and Fire Brigades (on a scale of 0 to 10) expressed by people aged 14 and over. Data shows that the prevalence of physicians increases as trust in law enforcement and firefighters increases. In fact, if we consider the value of PHY and TPF in 2021 we can see that the countries that are in the first places in terms of TPF value also have high PHY values such as Emilia Romagna which has a TPF value of 7, 7 and PHY equal to 4.4, Umbria with a TPF value equal to 7.7 and PHY equal to 4.4, Liguria with TPF equal to 7.6 and PHY equal to 4.7, Friuli Venezia Giulia with TPF equal to 7.6 and PHY equal to 4. It follows that the countries where the population has greater respect for the forces of order also have a higher number of physicians. In this case, the TPF variable can be understood as the population's ability to comply with the laws or as a manifestation of the Rule of Law. Notoriously, the growth in the value of Rule of Law is also a tool capable of increasing economic development, economic growth with beneficial effects also on human capital and therefore on high-profile professions, such as, for example, in the case of physicians.
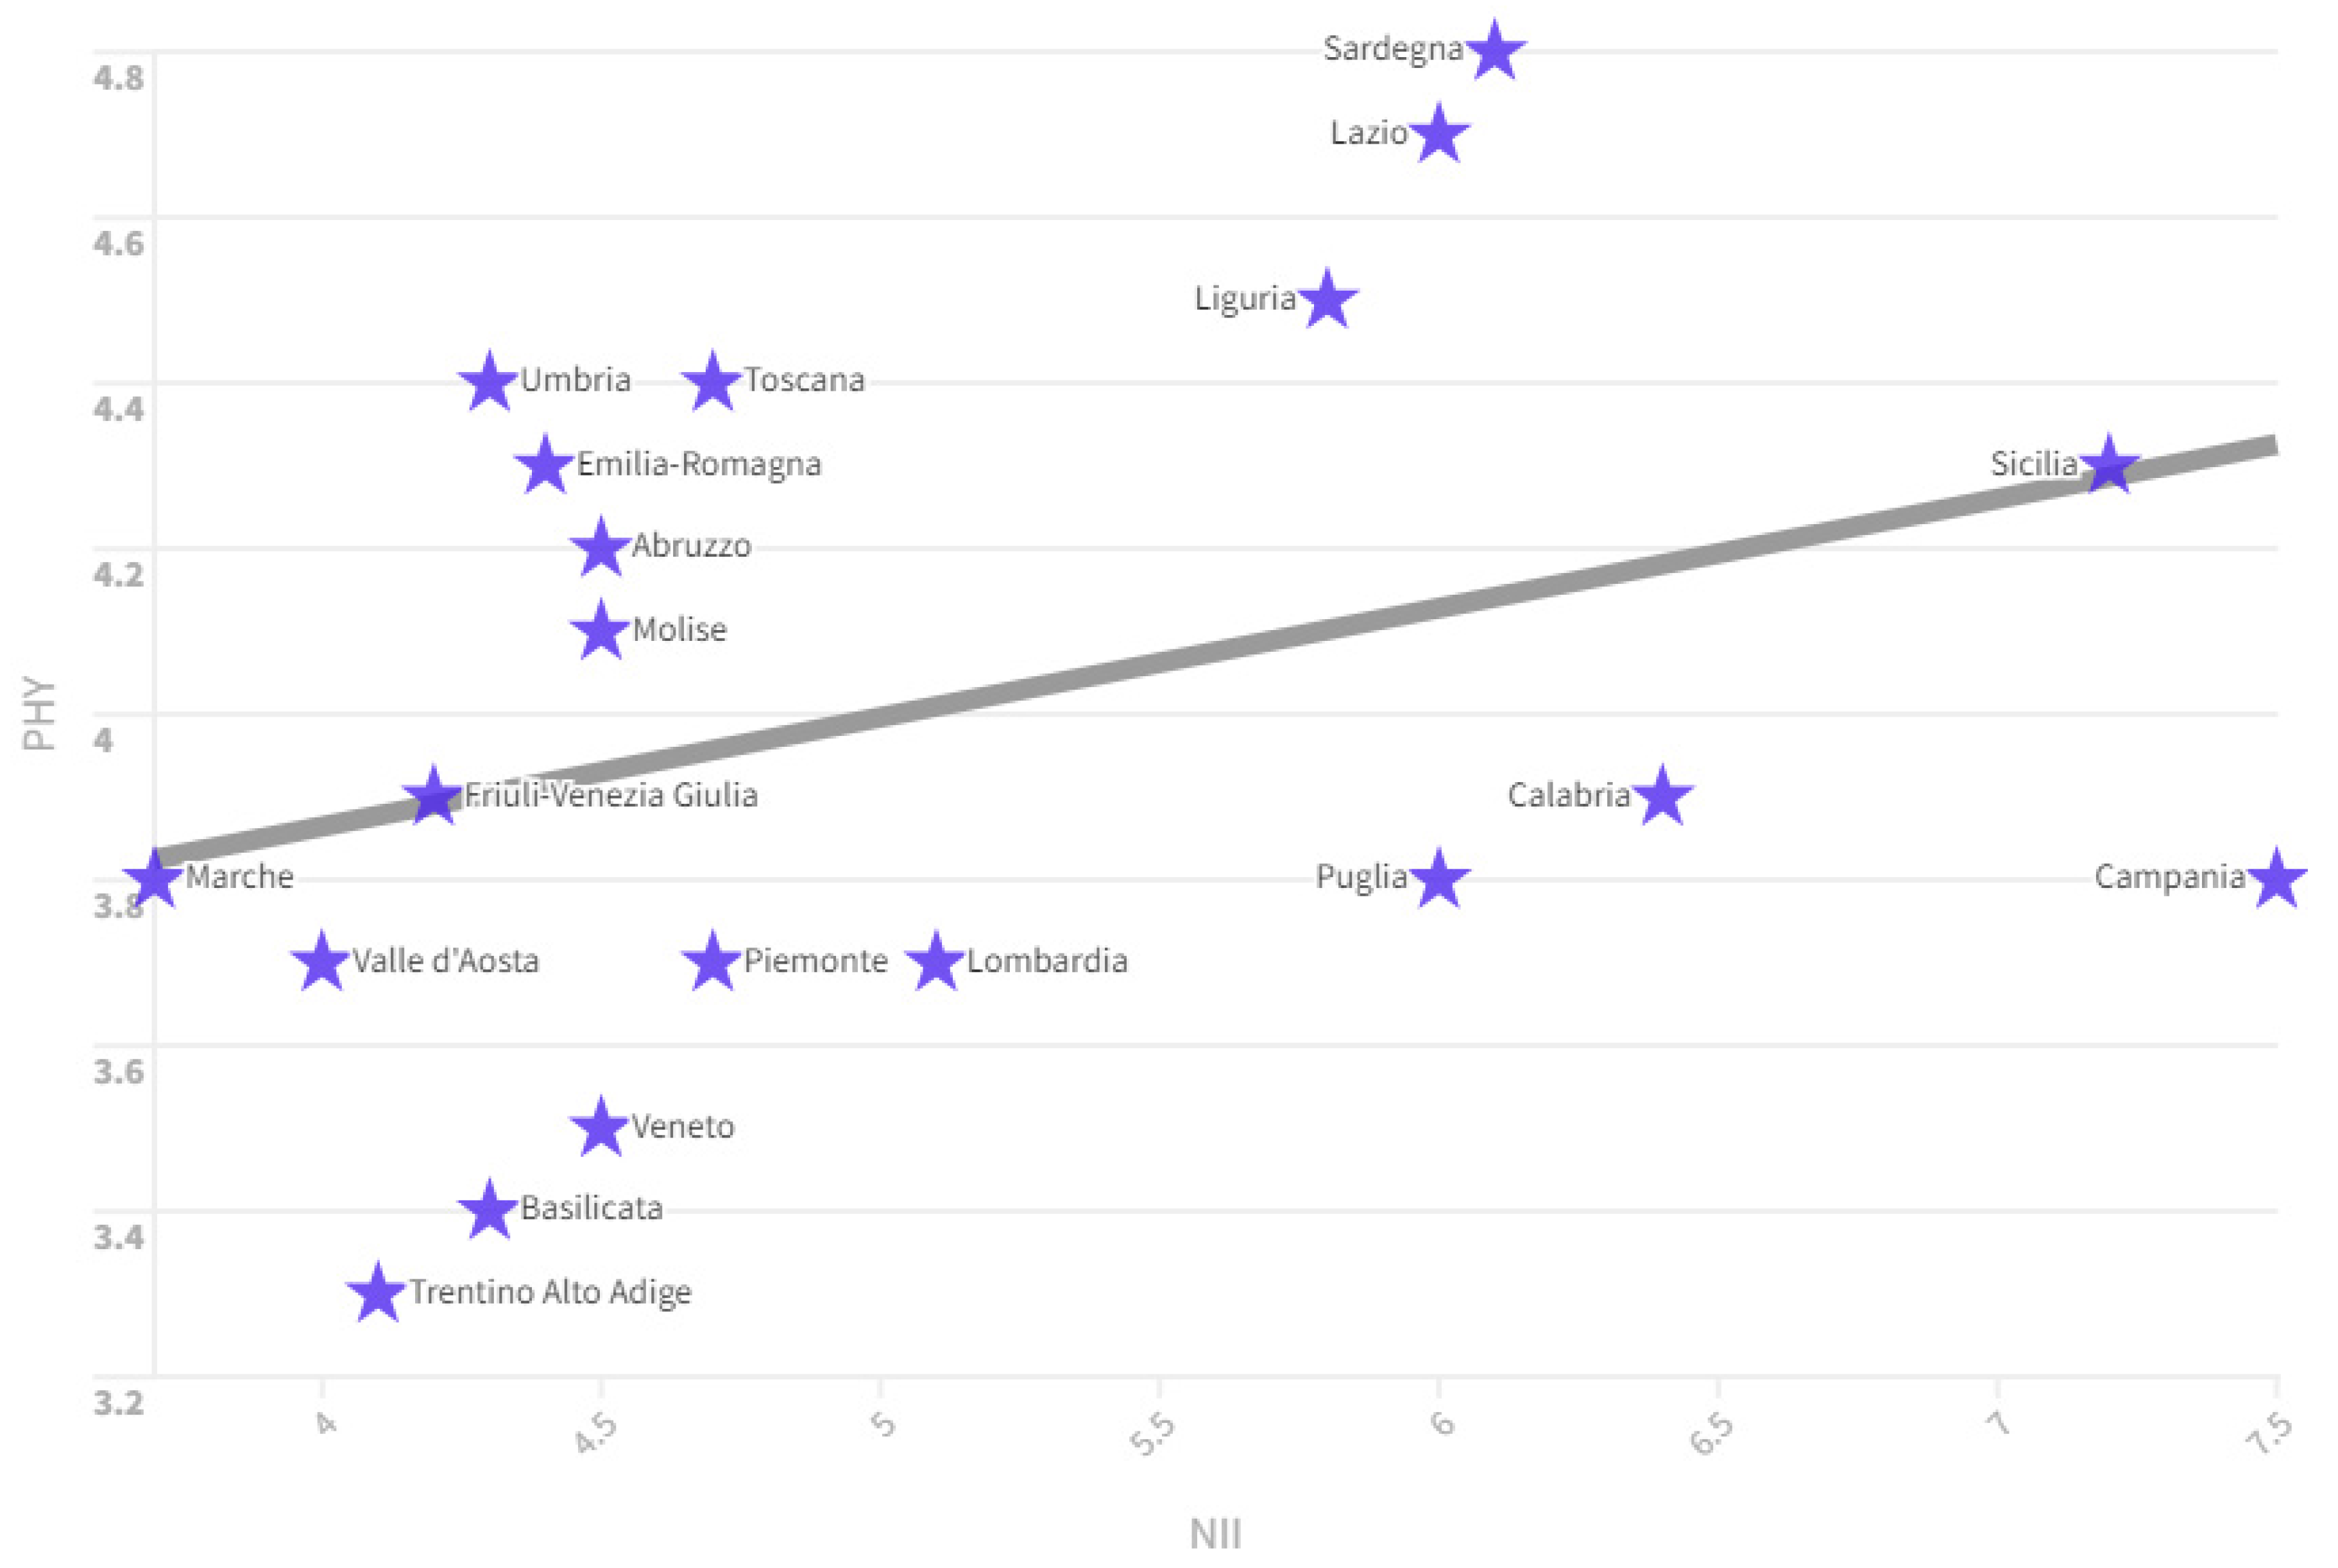
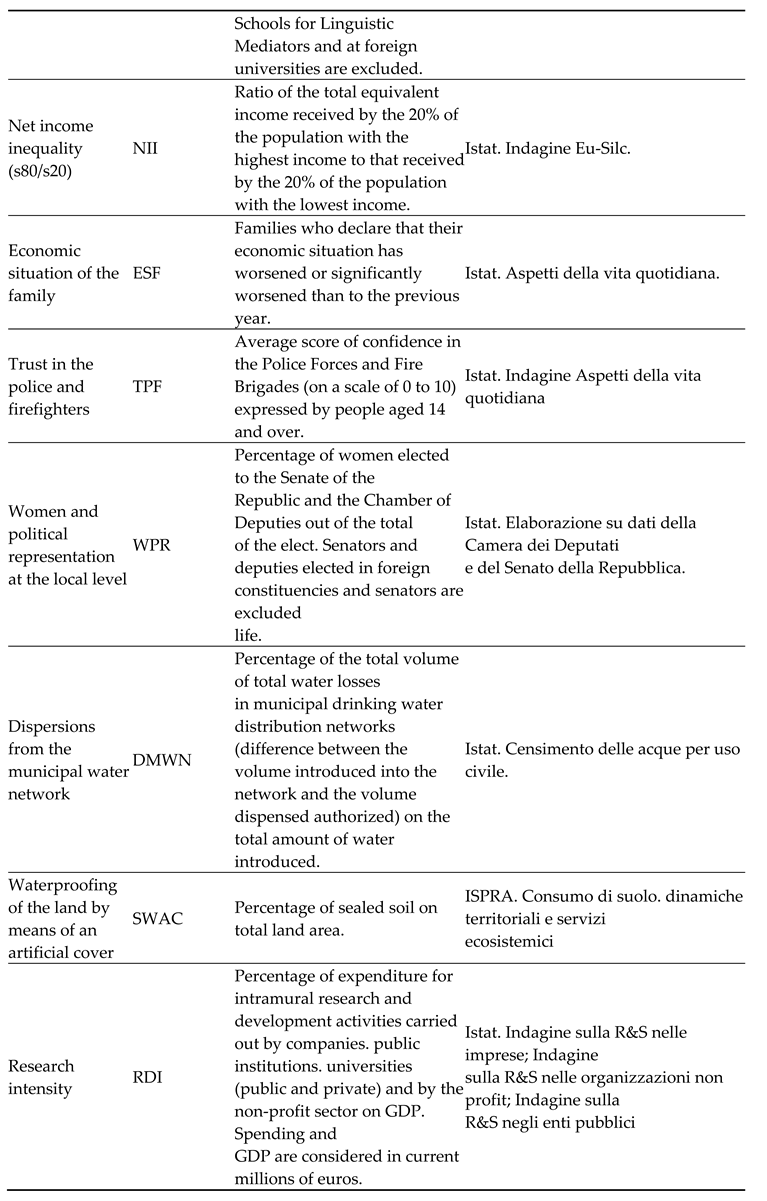
- NII: is the ratio between the total equivalent income received by the 20% of the population with the highest income and that received by the 20% of the population with the lowest income. There is a positive relationship between the NII value and the PHY value. The regions in which there is greater inequality are also those, which have the greatest PHY value. For example, considering the year 2020 we can see that the regions that have high NII levels also have high PHY levels such as Sicily which has a NII value of 7.5 and a PHY value of 4.3 , Sardinia which has a NII value equal to 6.1 and PHY equal to 4.8, Lazio with a PHY value equal to 6 and NII equal to 4.7, Liguria with NII equal to 5.8 and PHY equal to 5.8. Ratio between the total equivalent income received by the 20% of the population with the highest income and that received by the 20% of the population with the lowest income. There is a positive relationship between the NII value and the PHY value. The regions in which there is greater inequality are also those, which have the greatest PHY value. For example, considering the year 2020 we can see that the regions that have high NII levels also have high PHY levels such as Sicily which has a NII value of 7.5 and a PHY value of 4.3, Sardinia which has a NII value equal to 6.1 and PHY equal to 4.8, Lazio with a PHY value equal to 6 and NII equal to 4.7, Liguria with NII equal to 5.8 and PHY equal to 5.8. There are economic reasons that could motivate the fact that the regions where there is less inequality, which are also the regions with higher per capita income, have fewer physicians. In fact, regions where there is less inequality are more dynamic from an economic point of view and it is likely that the population chooses career paths different from those of medical science. In fact, in the most dynamic economies, it is highly probable that there are many professionals, entrepreneurs and managers who can easily exceed the income of physicians. The population residing in regions with lower inequality and higher per capita income therefore has fewer incentives to invest in the arduous course of study necessary to become physicians. Conversely, in regions where there is greater inequality, which are also the poorest regions in terms of per capita income, there is likely to be more incentive to move towards the medical profession, which is considered relevant from an income point of view.
- WPR: it is the percentage of women elected to the Senate of the Republic and the Chamber of Deputies out of the total of the elect. Senators and deputies elected in foreign constituencies and senators are excluded from life. There is a positive relationship between the WPR value and the PHY value in the Italian regions in the period between 2004 and 2022. In fact, if we look at the regions that have the highest level of WPR in 2022, we can see that they also have high levels of PHY, for example Friuli Venezia Giulia with a WPR value equal to 50 and a PHY value equal to 4.2, Emilia Romagna with a WPR value equal to 48.8 and a PHY value equal to 4.6, Sicily with a WPR value of 39.6 and a PHY value of 4.5, Abruzzo with a WPR value of 38.5 and a PHY value of 4.6, Tuscany with a WPR value equal to 36.1 and a PHY value equal to 4.7 and an Umbria with a WPR value equal to 33.33 and a PHY value equal to 4.7.
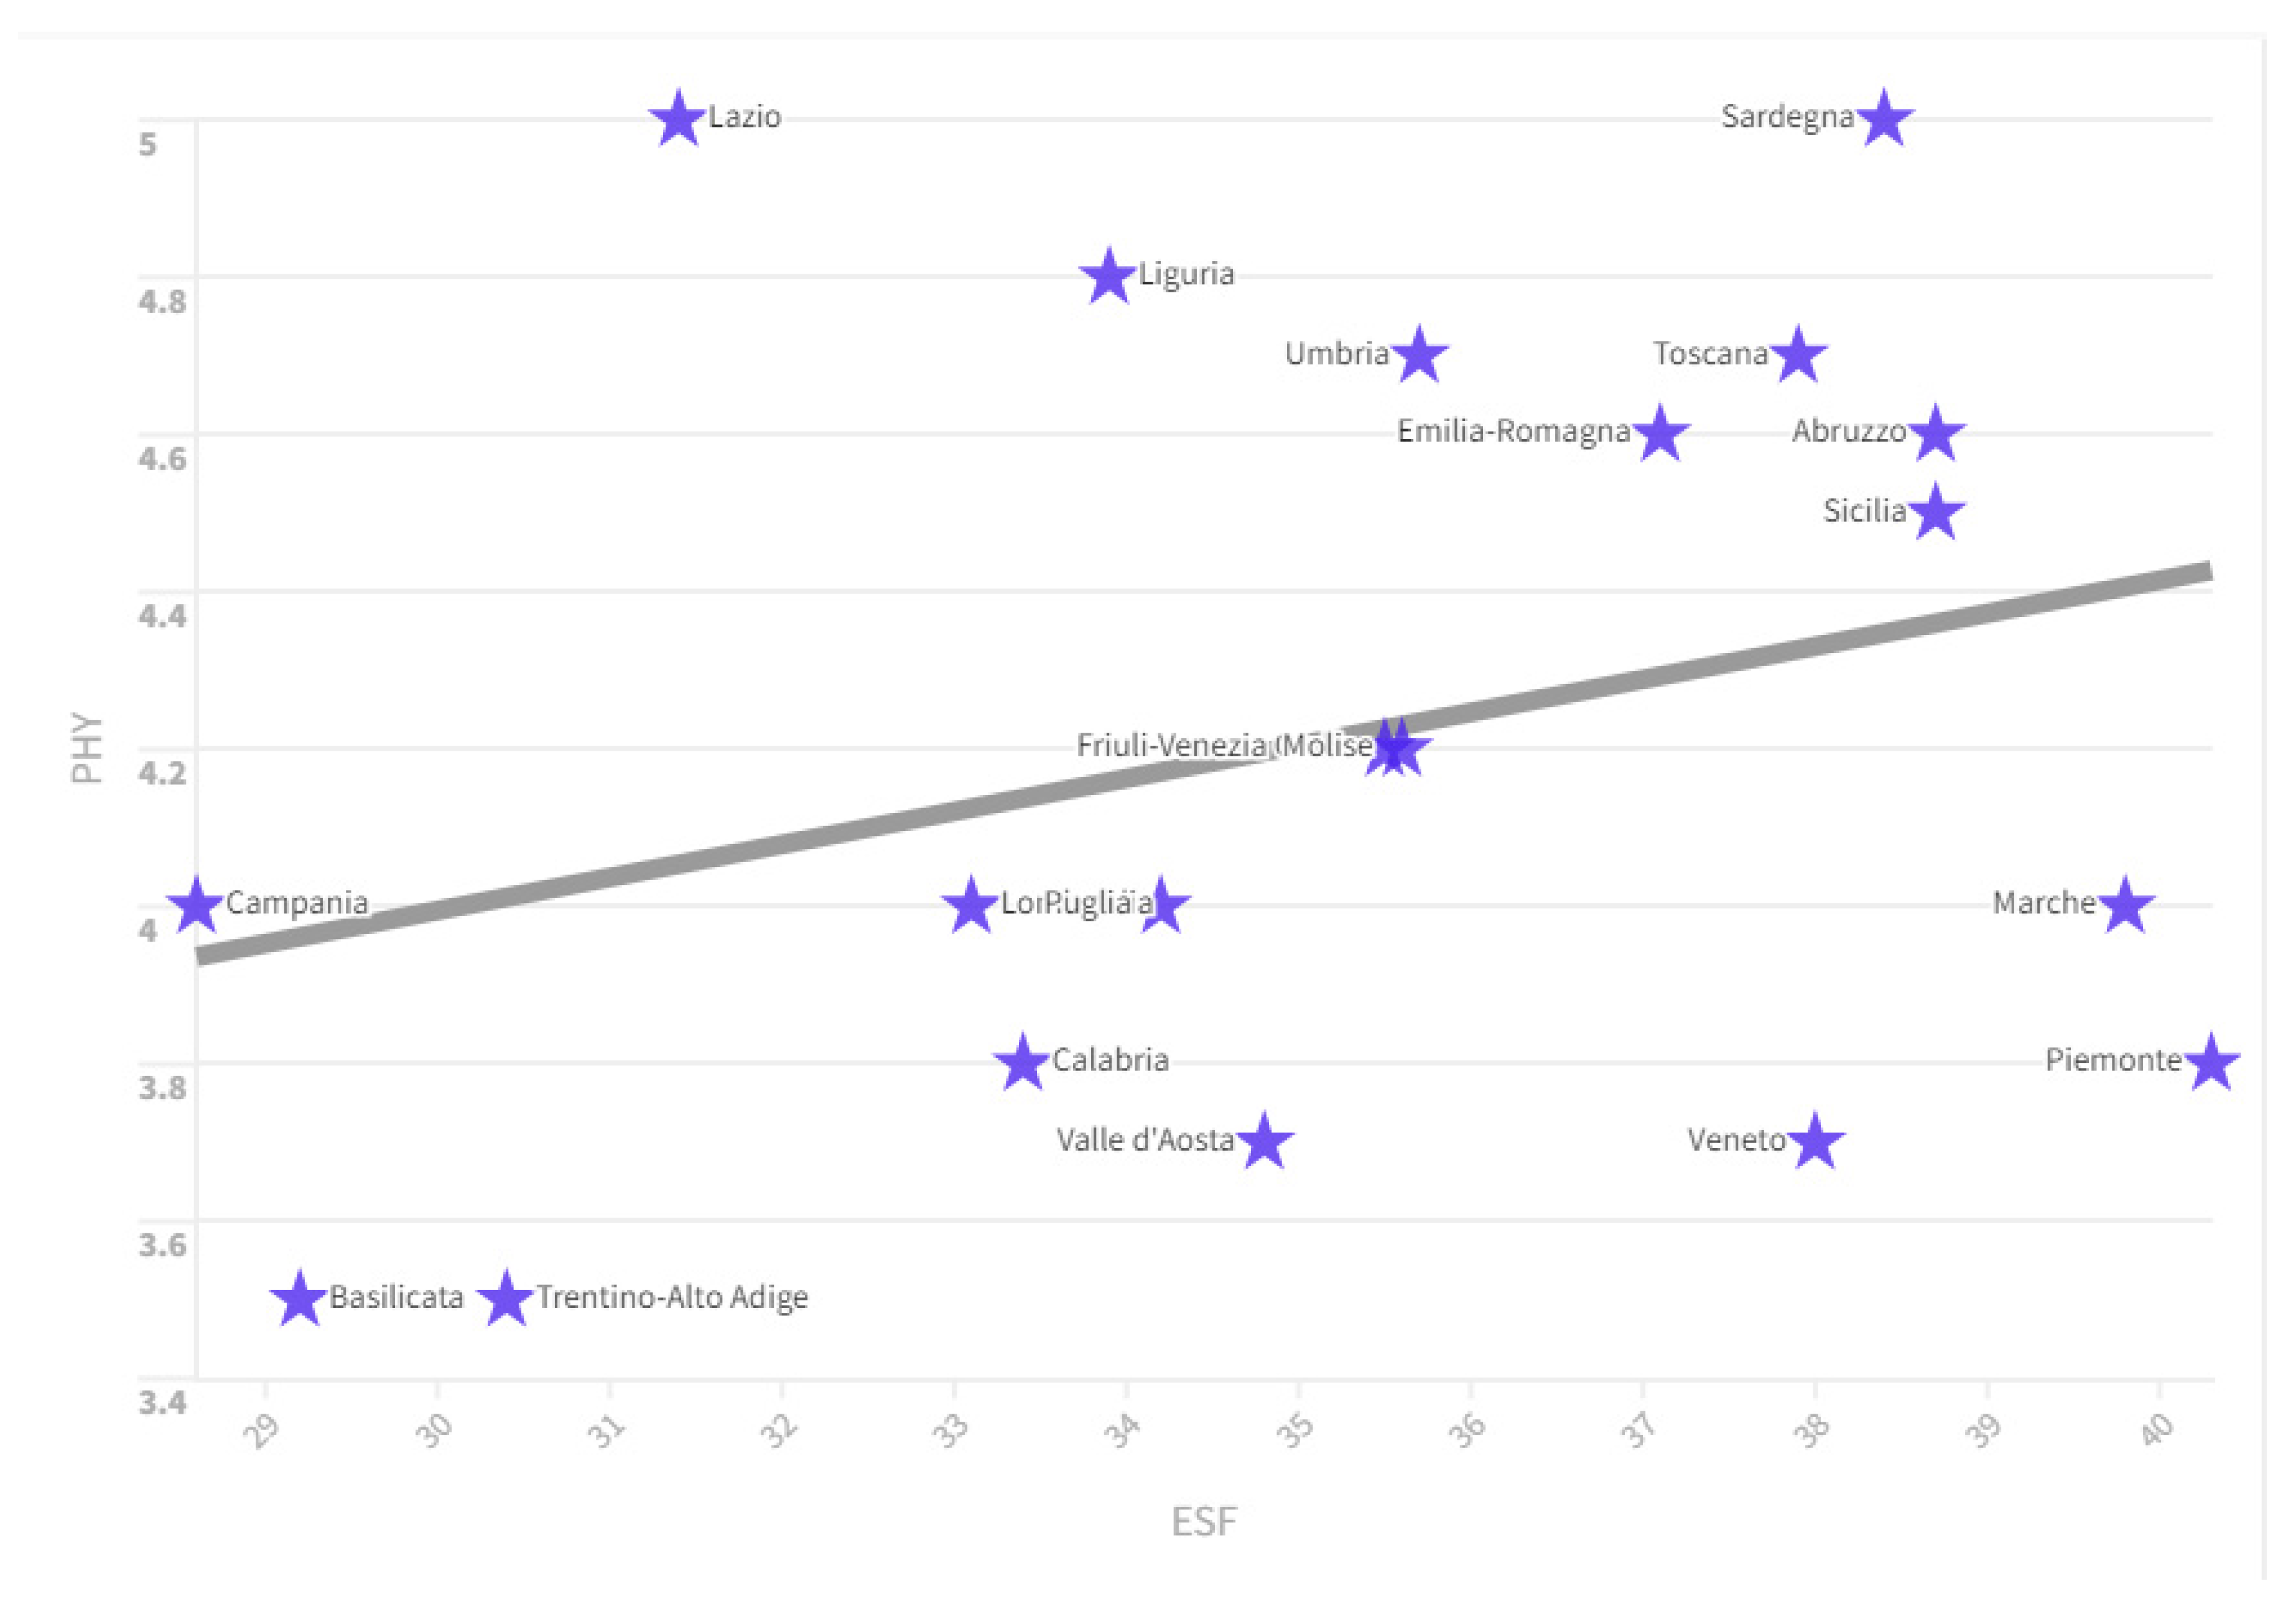
- ESF: represents the families who declare that their economic situation has worsened or significantly worsened than to the previous year. There is a positive relationship between the ESF value and the PHY value. Specifically we see that countries that have high values in terms of ESF also have a high value of PHY. In fact, if we consider the ranking of Italian regions by ESF value, we can see that the regions that have high levels of ESF also have high levels of PHY. For example in 2022, the ESF value in Abruzzo was equal to an amount of 38.7 with a PHY value equal to 4.60, Sicily with an ESF value 38.7 and a PHY value equal to 4, 50, Sardinia with ESF equal to 38.4 and PHY equal to an amount of 5.00, Tuscany with an ESF amount equal to 37.9 and a PHY value equal to an amount of 4.70. The regions of Italy where families suffer the most also have a higher number of physicians per 1,000 inhabitants.
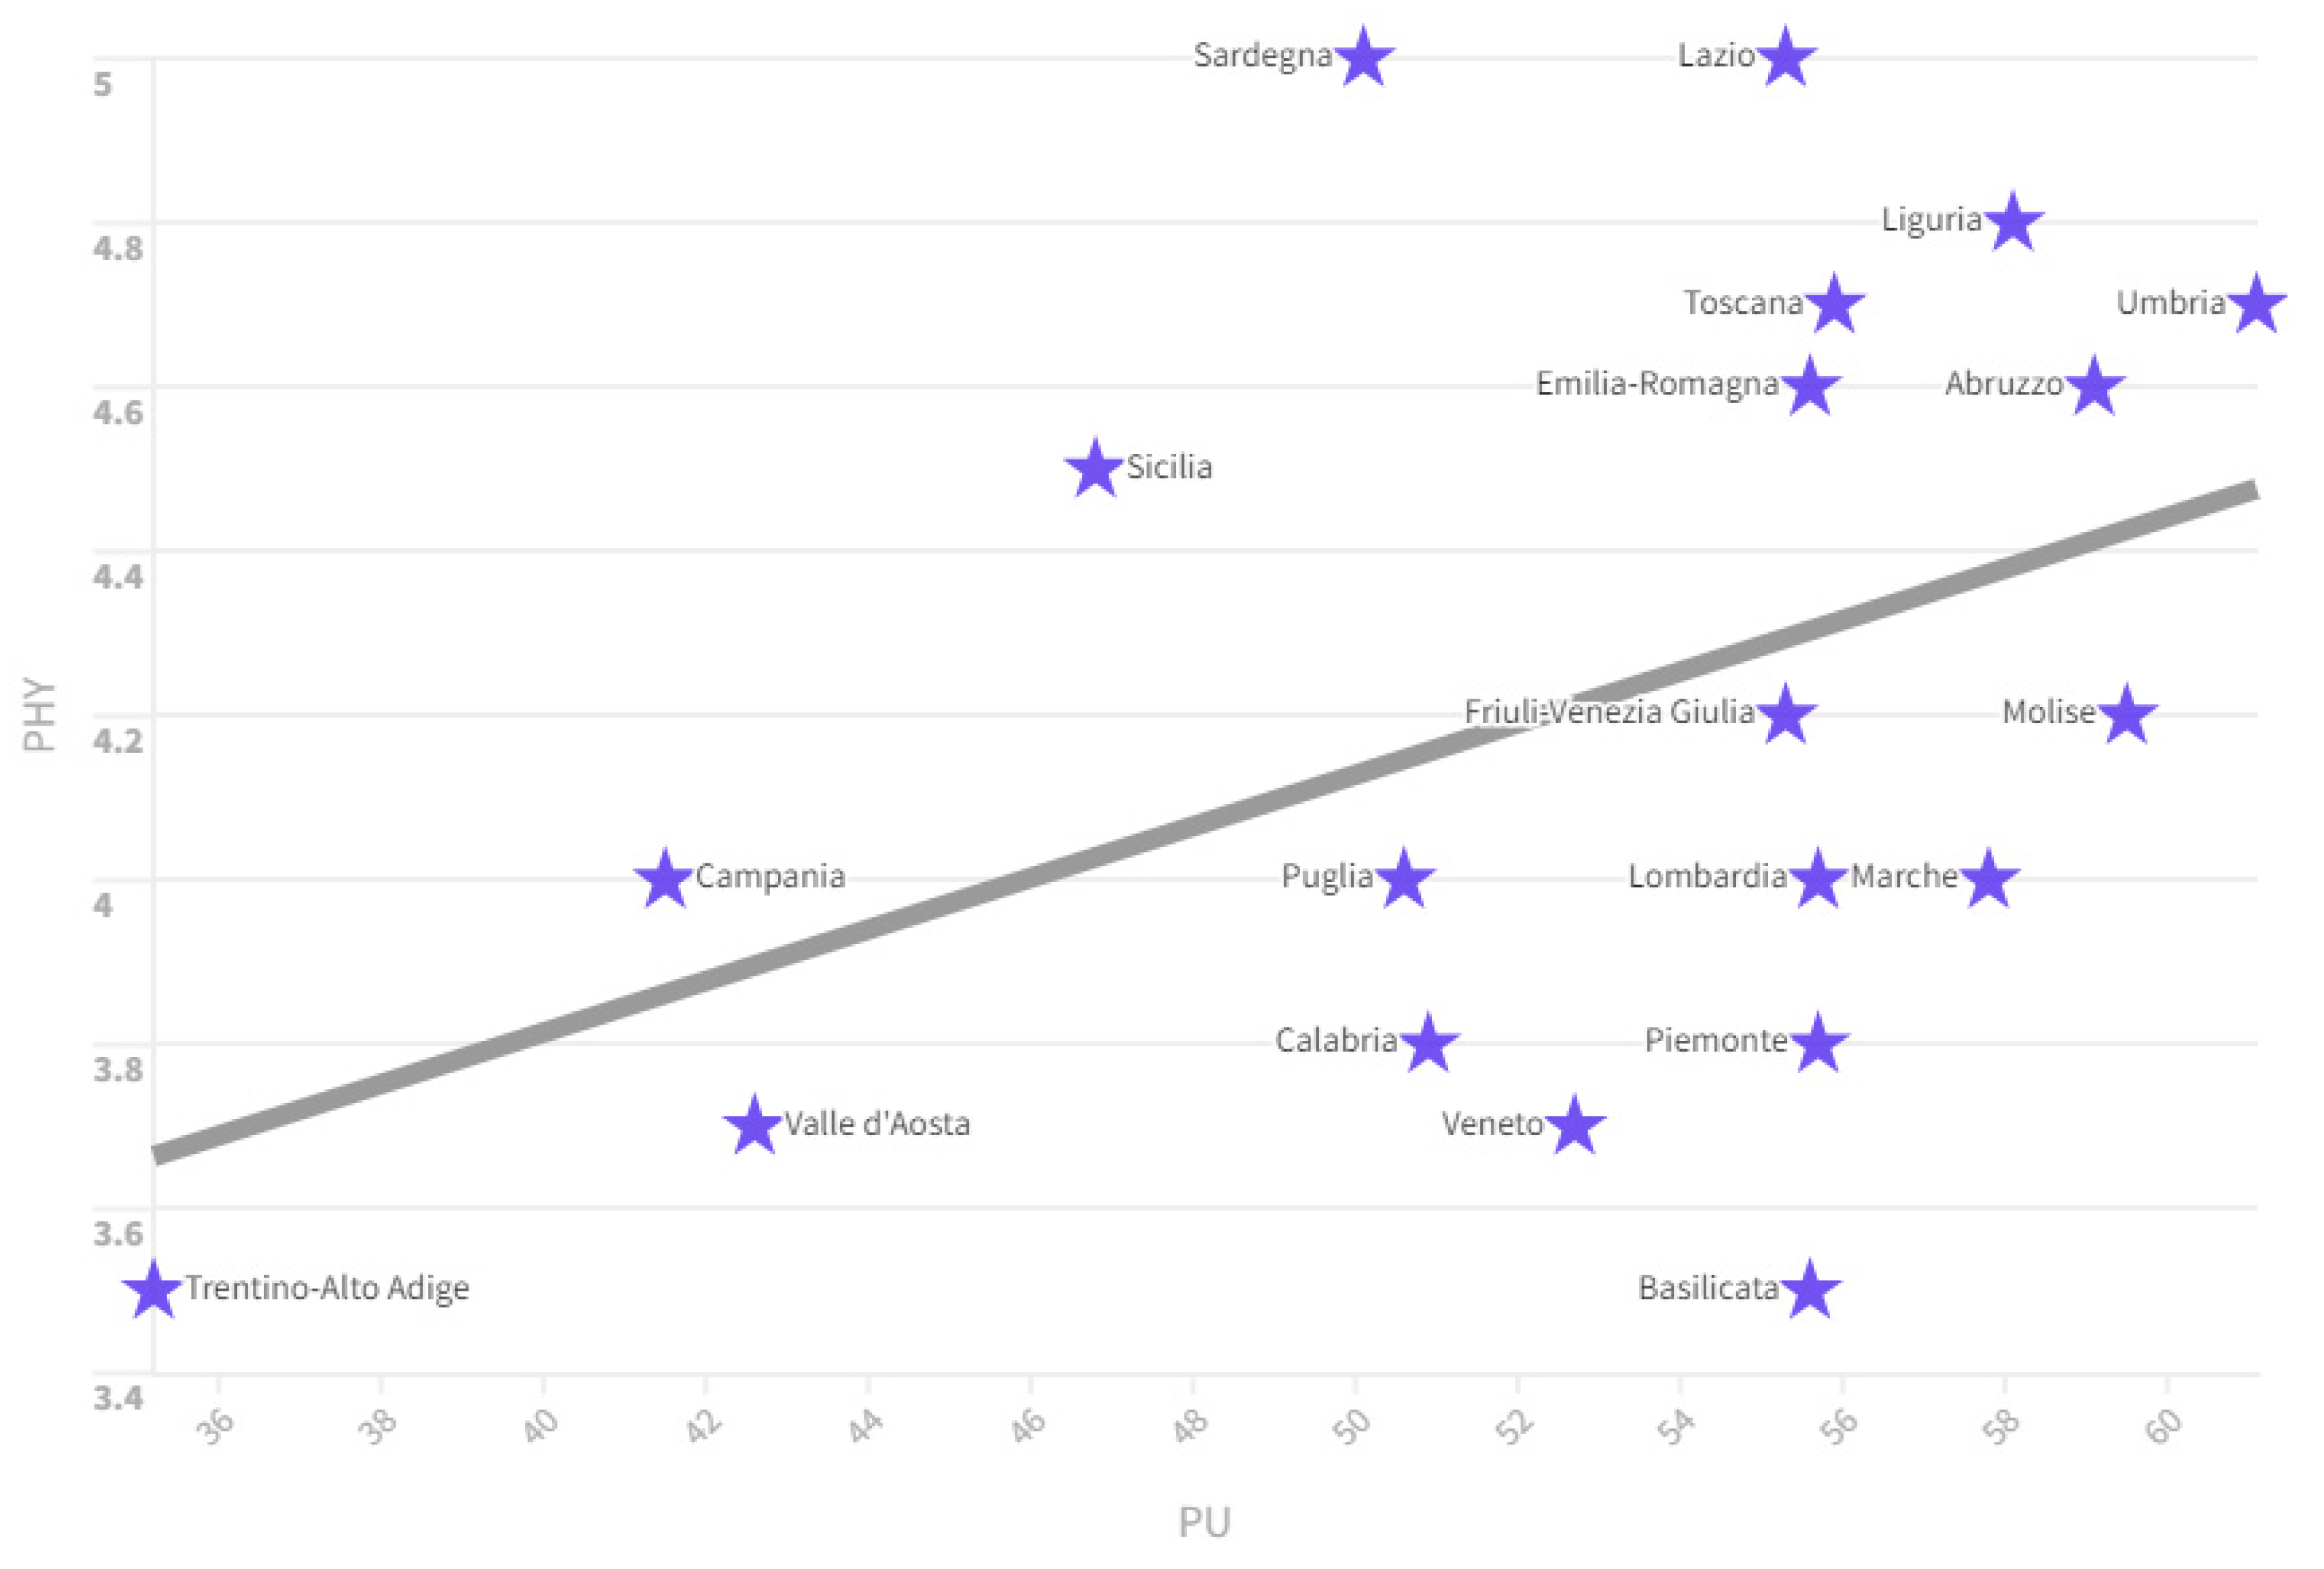
- PU: is the percentage of recent graduates enrolling for the first time in university in the same year in which they obtained their upper secondary school diploma (specific cohort rate). Students enrolled in Higher Technical Institutes, Institutes of Higher Artistic, Musical and Dance Training, Higher Schools for Linguistic Mediators and at foreign universities are excluded. There is a positive relationship between the PU value and the PHY value in the Italian regions between 2004 and 2022. In fact, if we look at the ranking of the regions by PU value, we notice that they also have high PHY values in 2020 For example Umbria has a PU value equal to an amount of 61.1 and a PHY value equal to 4.4, Molise has a PU value equal to 59.5 and a PHY value equal to 4 ,1, Abruzzo has a PU value of 59.1 and a PHY value of 4.2, Liguria has a PU value of 58.1 and a PHY value of 4.5, Tuscany with a PU value of 55.9 and a PHY value of 4.4. We note that the Italian regions with the highest per capita income have low average PU values. For example: Trentino Alto Adige has a PU value equal to an amount of 35.2, Friuli Venezia Giulia 55.3, Veneto 52.7, Piedmont and Lombardy 55.7. It is highly probable that the regions that have higher per capita incomes have a reduced PU value due to the presence of a labor market that offers young people good alternatives to studying. On the contrary, in regions with medium-low per capita incomes, access to university is considered necessary due to the lack of valid alternatives in the labor market for young people. Obviously, this dynamic is also reflected in the number of physicians who tend to decrease with the increase in per capita income and the reduction in the value of PU.
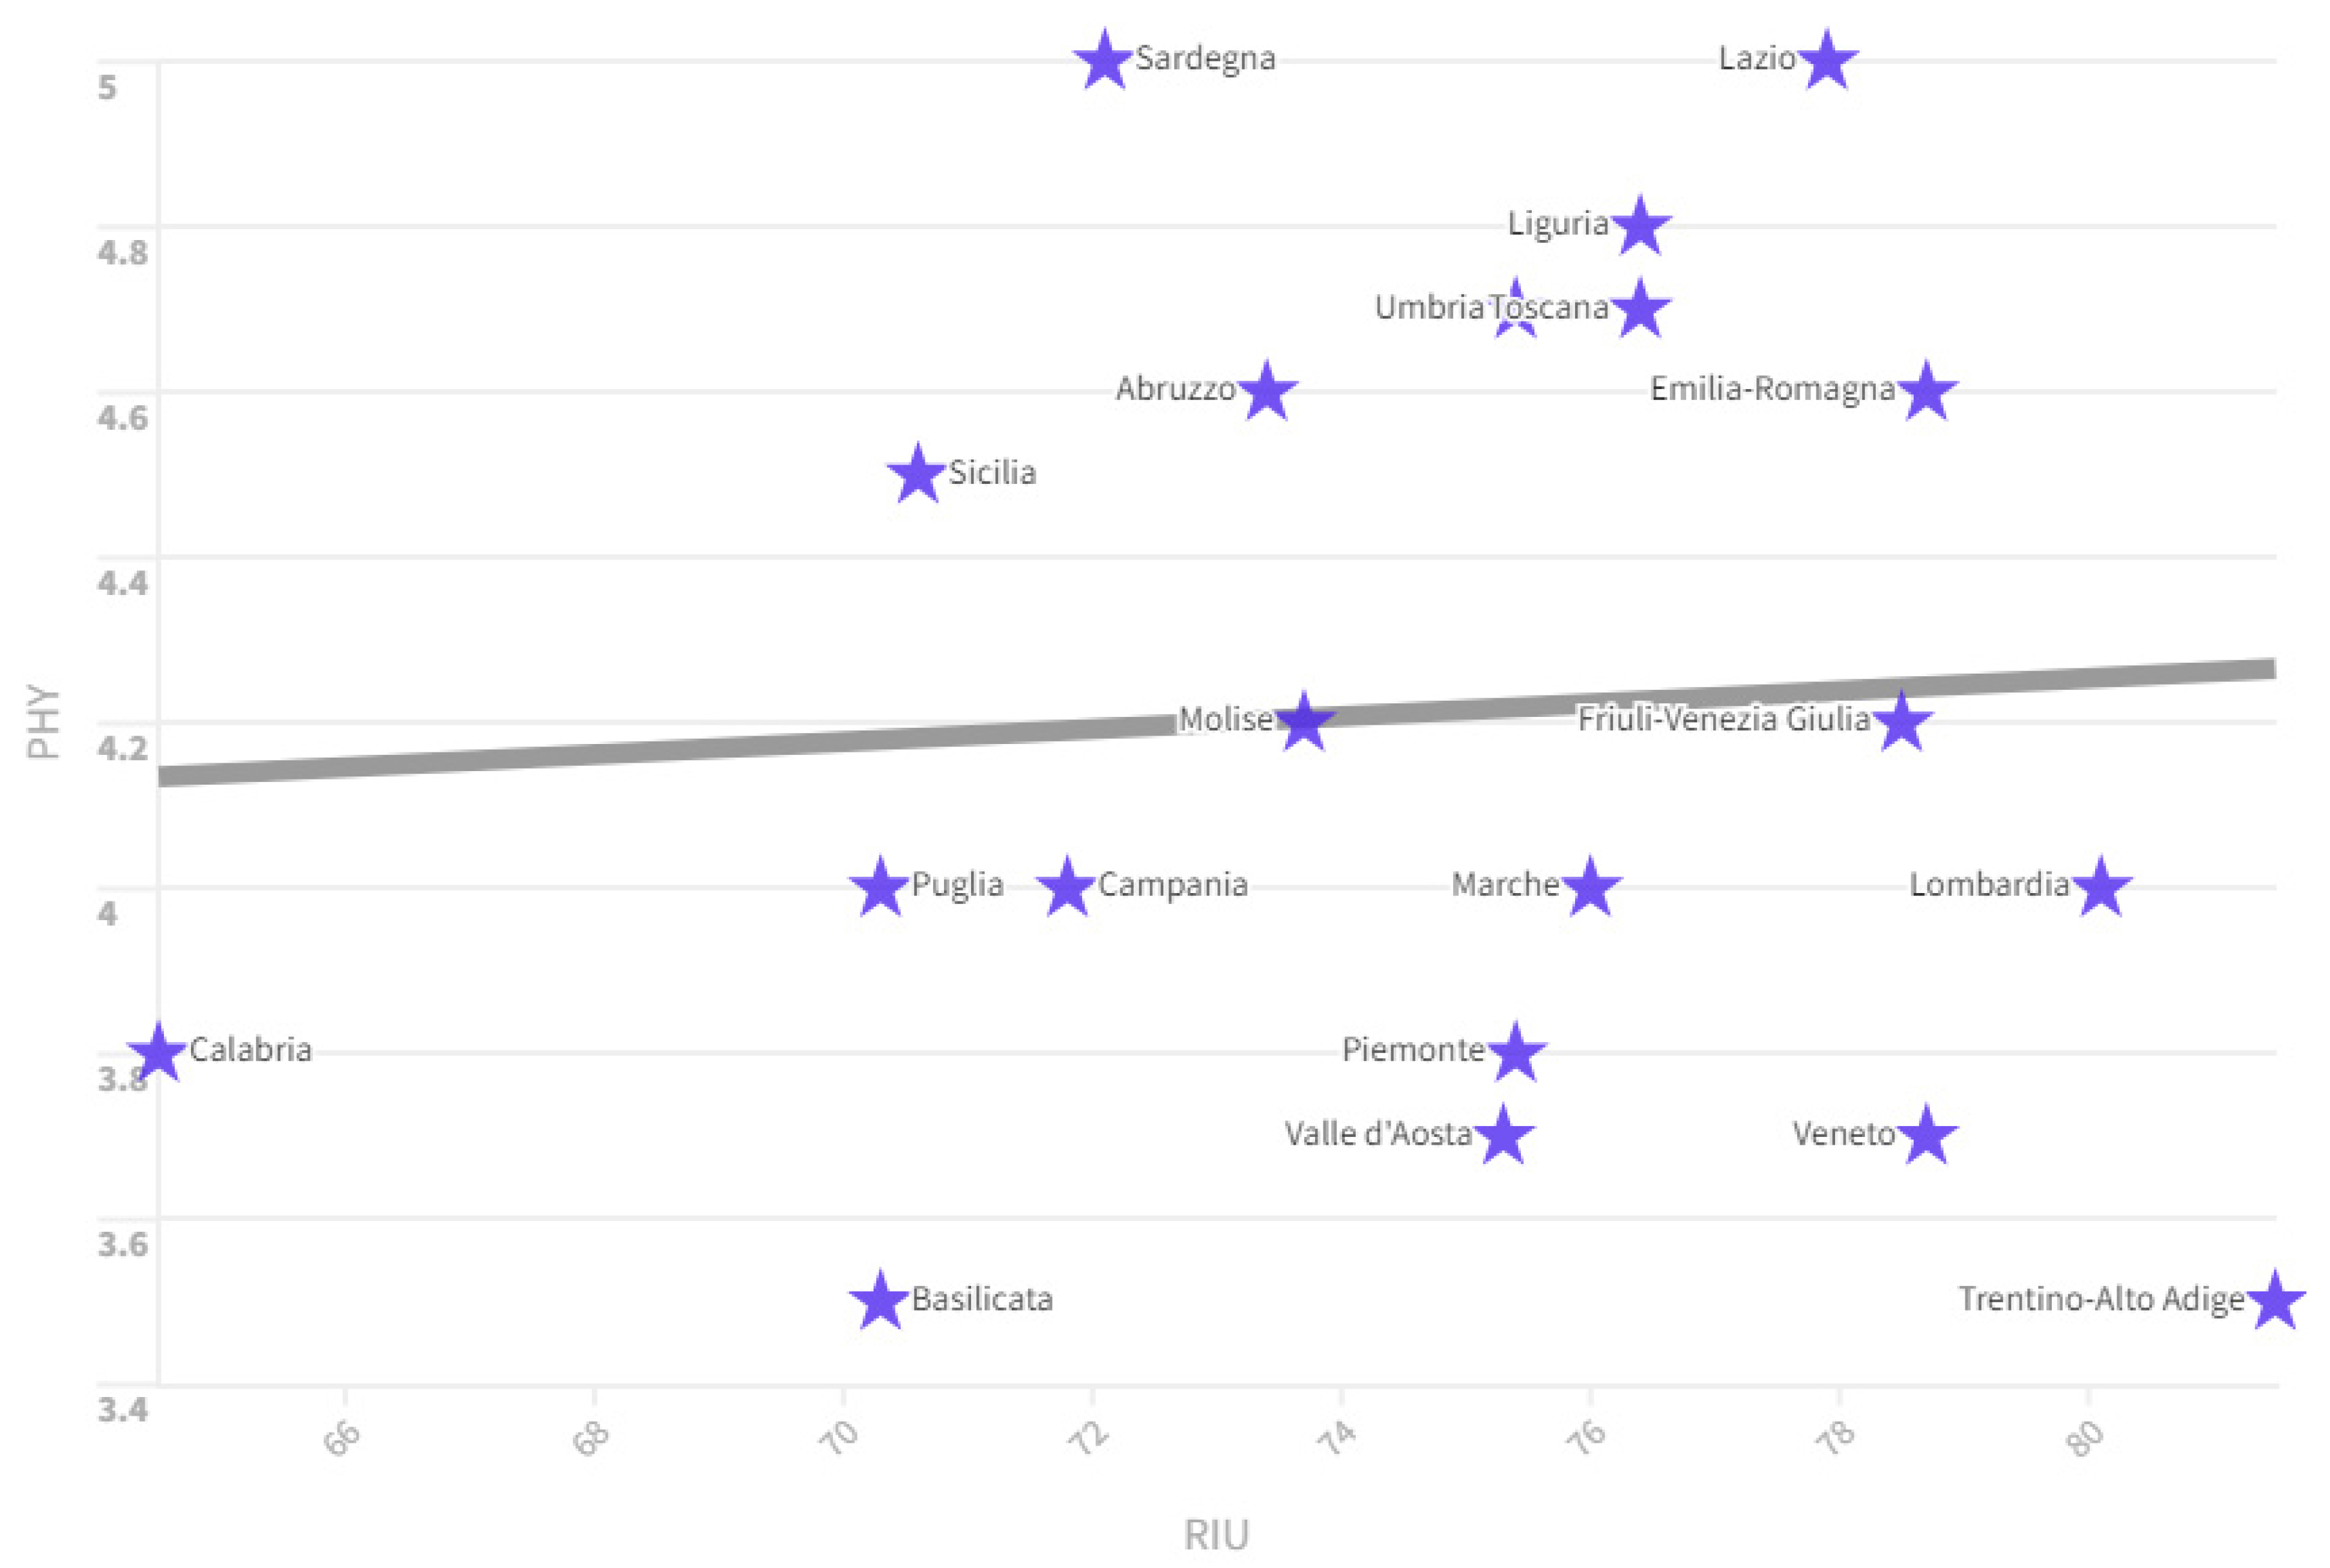
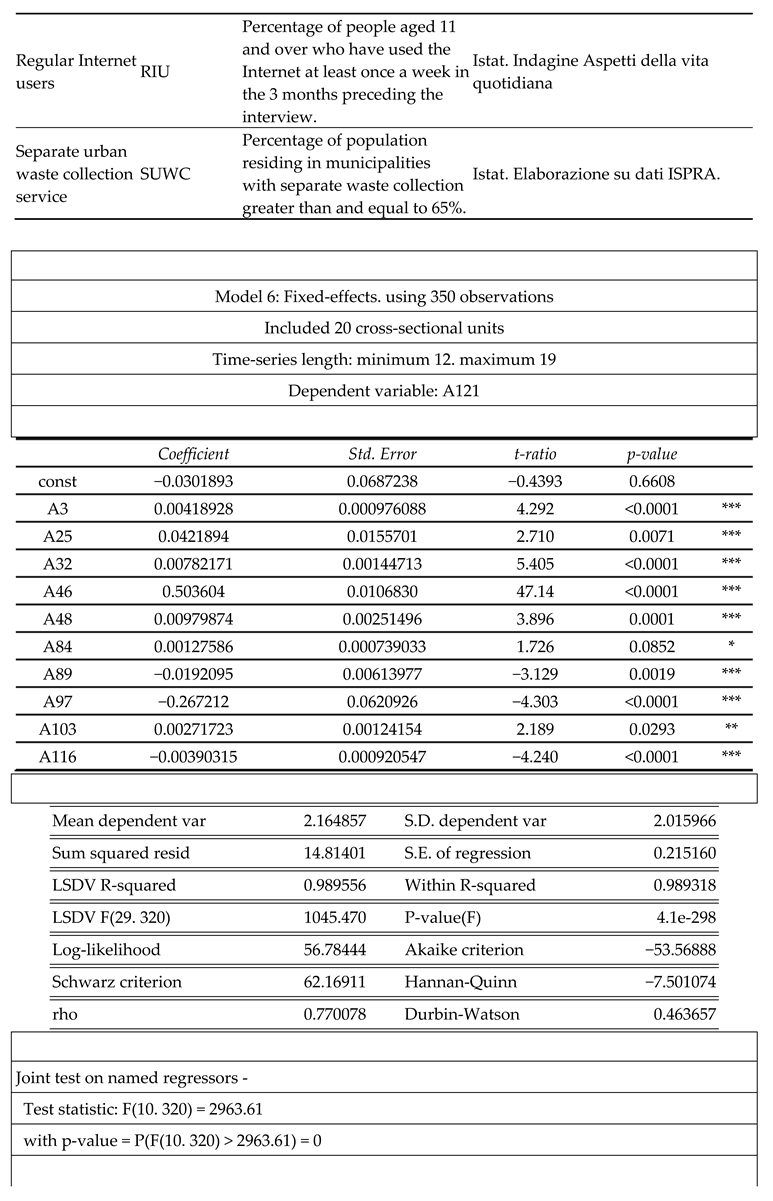
- RIU: is the percentage of people aged 11 and over who have used the Internet at least once a week in the 3 months preceding the interview. There is a positive relationship between the RIU value and the PHY value. In fact, if we look at the ranking of regions by RIU value in 2022, we can see that the regions that have high levels of RIU also have high levels of PHY. For example, Lombardy has an RIU value of 80.1 and a PHY value of 4, Emilia Romagna has an RIU value of 78.7 and a PHY value of 4.6, Friuli Venezia Giulia has an RIU value of 78.5 and a PHY value of 4.2, Liguria has a value of 76.4 and a PHY value of 4.8, and Tuscany with a value of RIU with 76.4 and a PHY value of 4.7.
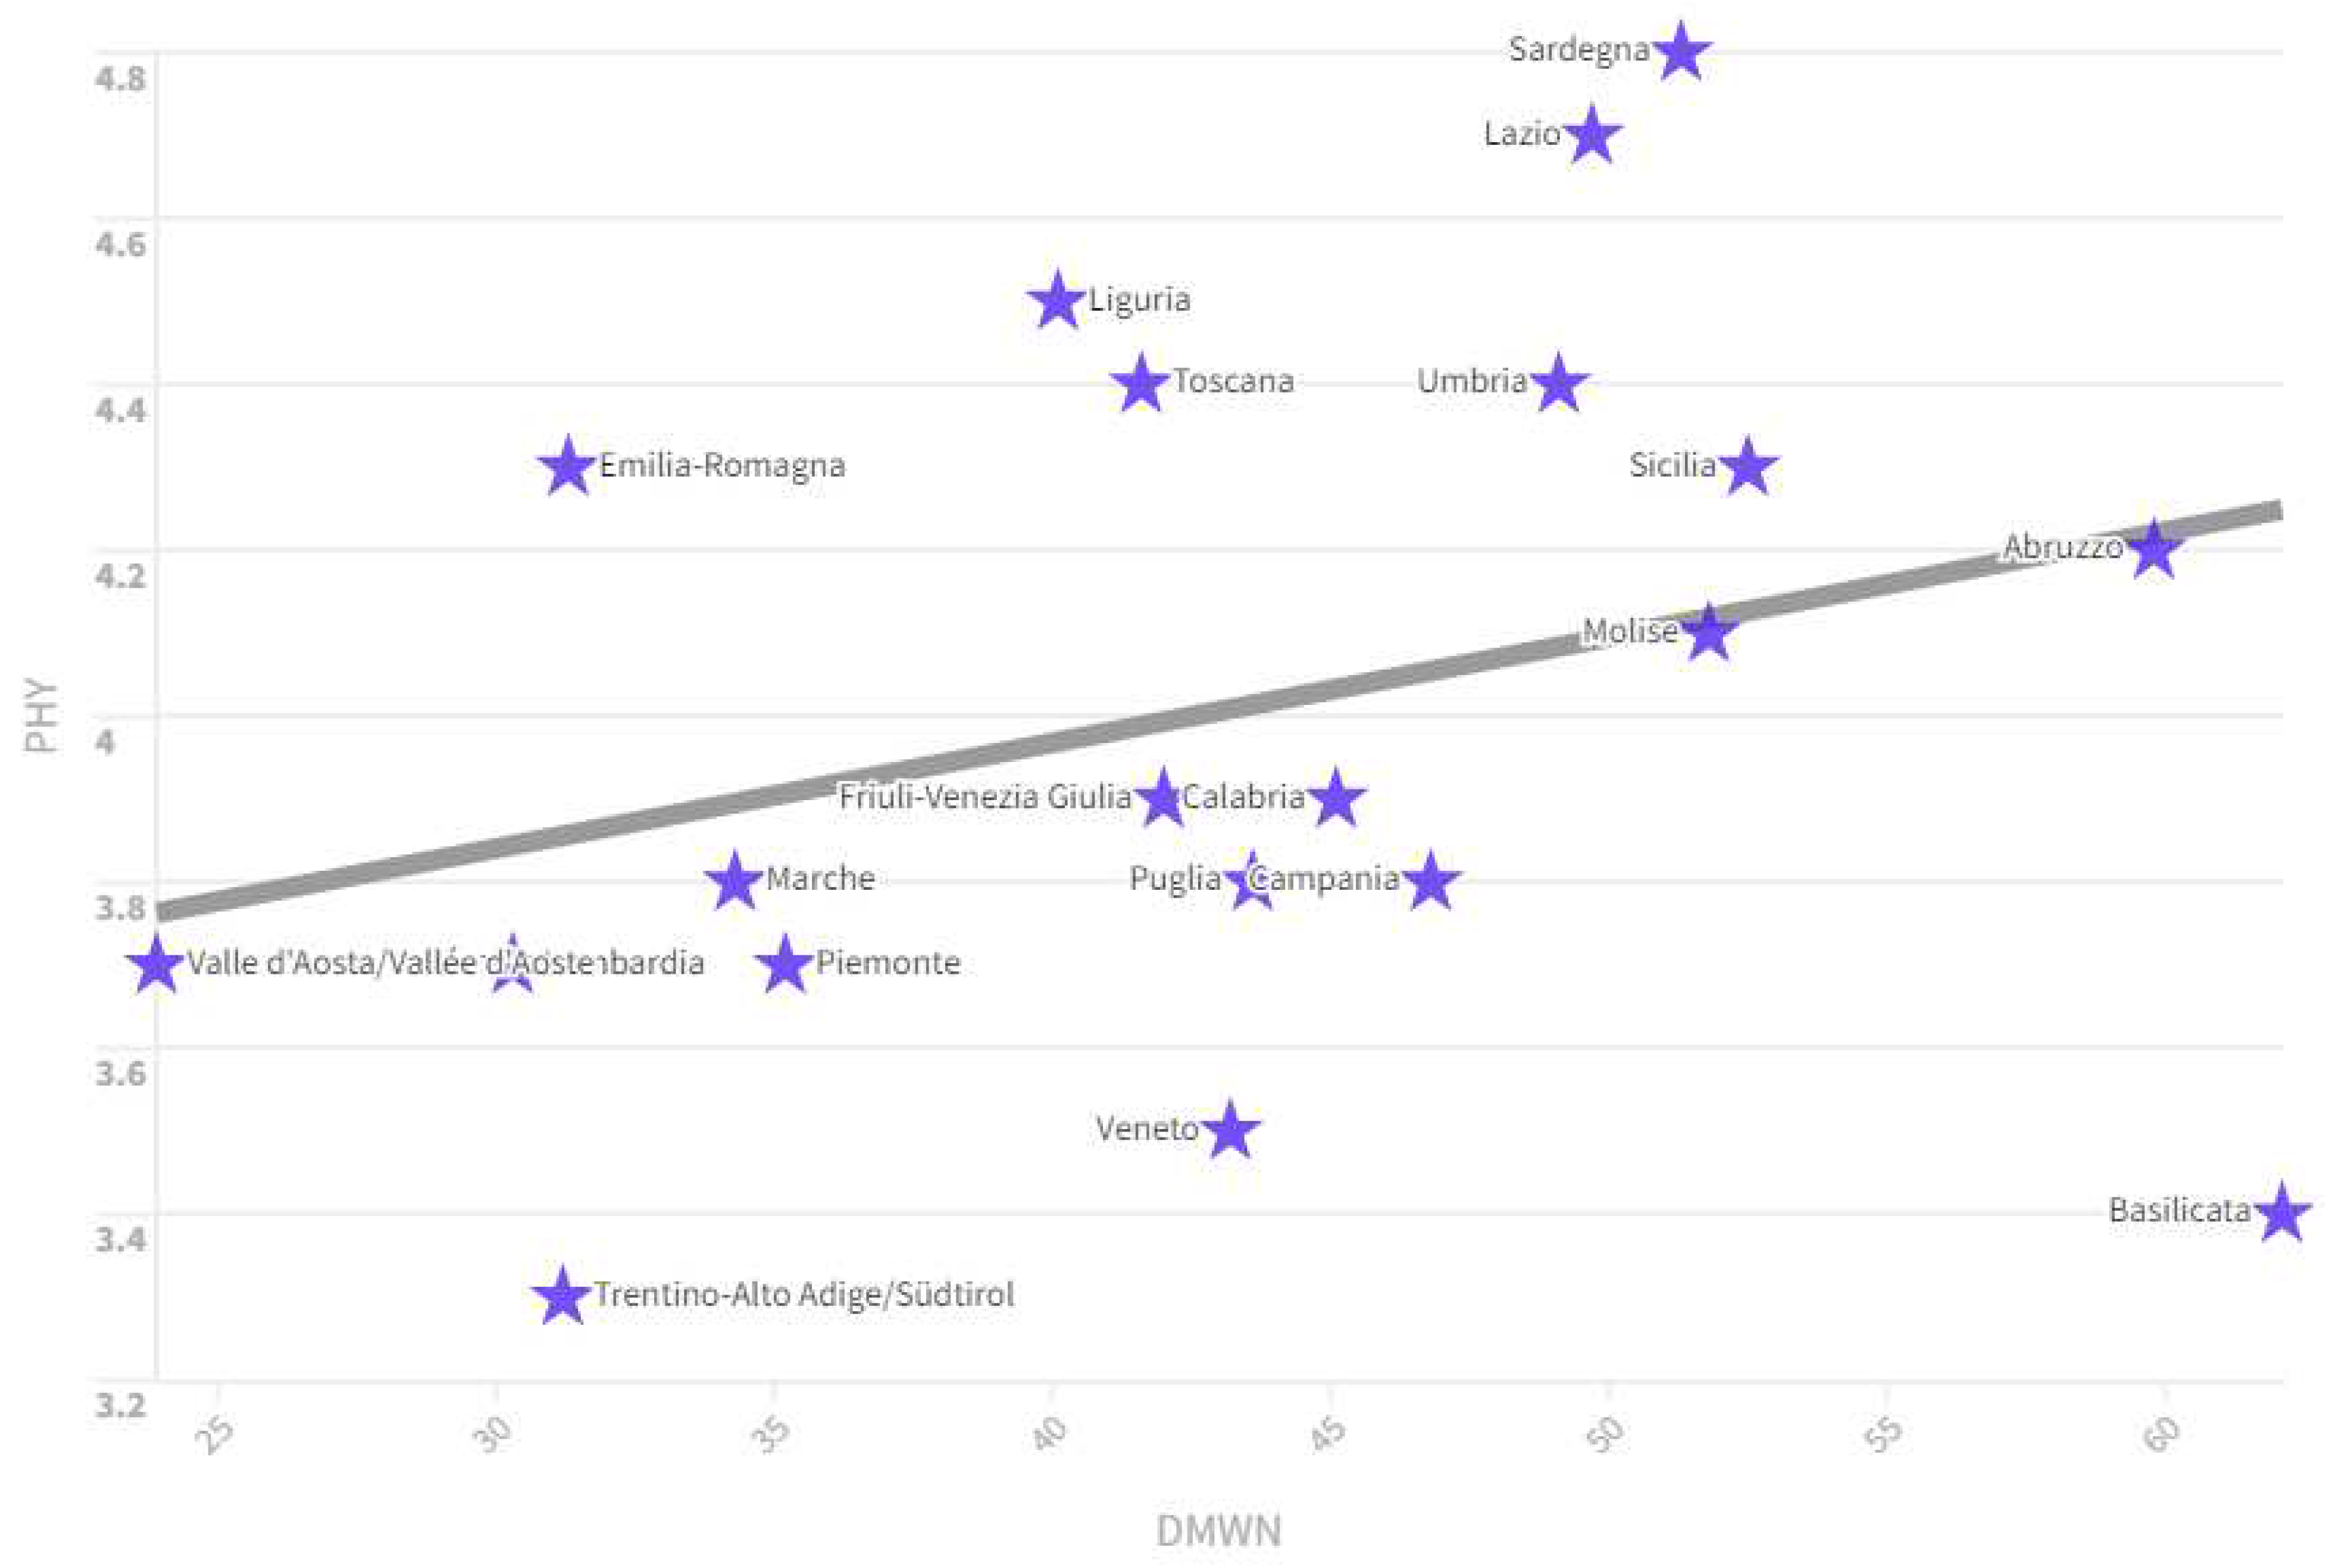
- DMWN: is the percentage of the total volume of total water losses in municipal drinking water distribution networks (difference between the volume introduced into the network and the volume dispensed authorized) on the total amount of water introduced. There is a positive relationship between the DMWN value and the PHY value. This relationship can be understood by considering, for example, the ranking of Italian regions by DMWN value in 2020. Regions that have high levels of DMWN also have high levels of PHY. For example: Abruzzo has a DMWN value of 59.8 and a PHY value of 4.2, Sicily has a DMWN value of 52.5 and a PHY value of 4.3, the Molise has a DMWN value of 51.8 and a PHY value of 4.1, Sardinia has a DMWN value of 51.3 and a PHY value of 4.8, Lazio has a of DMWN equal to 49.7 and a PHY value equal to 4.7, Umbria has a DMWN value equal to 49.1 and a PHY value equal to 4.4. Regions with high DMWN values are regions with low average per capita incomes. Regions that have medium-low per capita incomes also have a declining PHY value. The reason is connected to the low efficiency of the regions that have high values of DMWN and PHY.
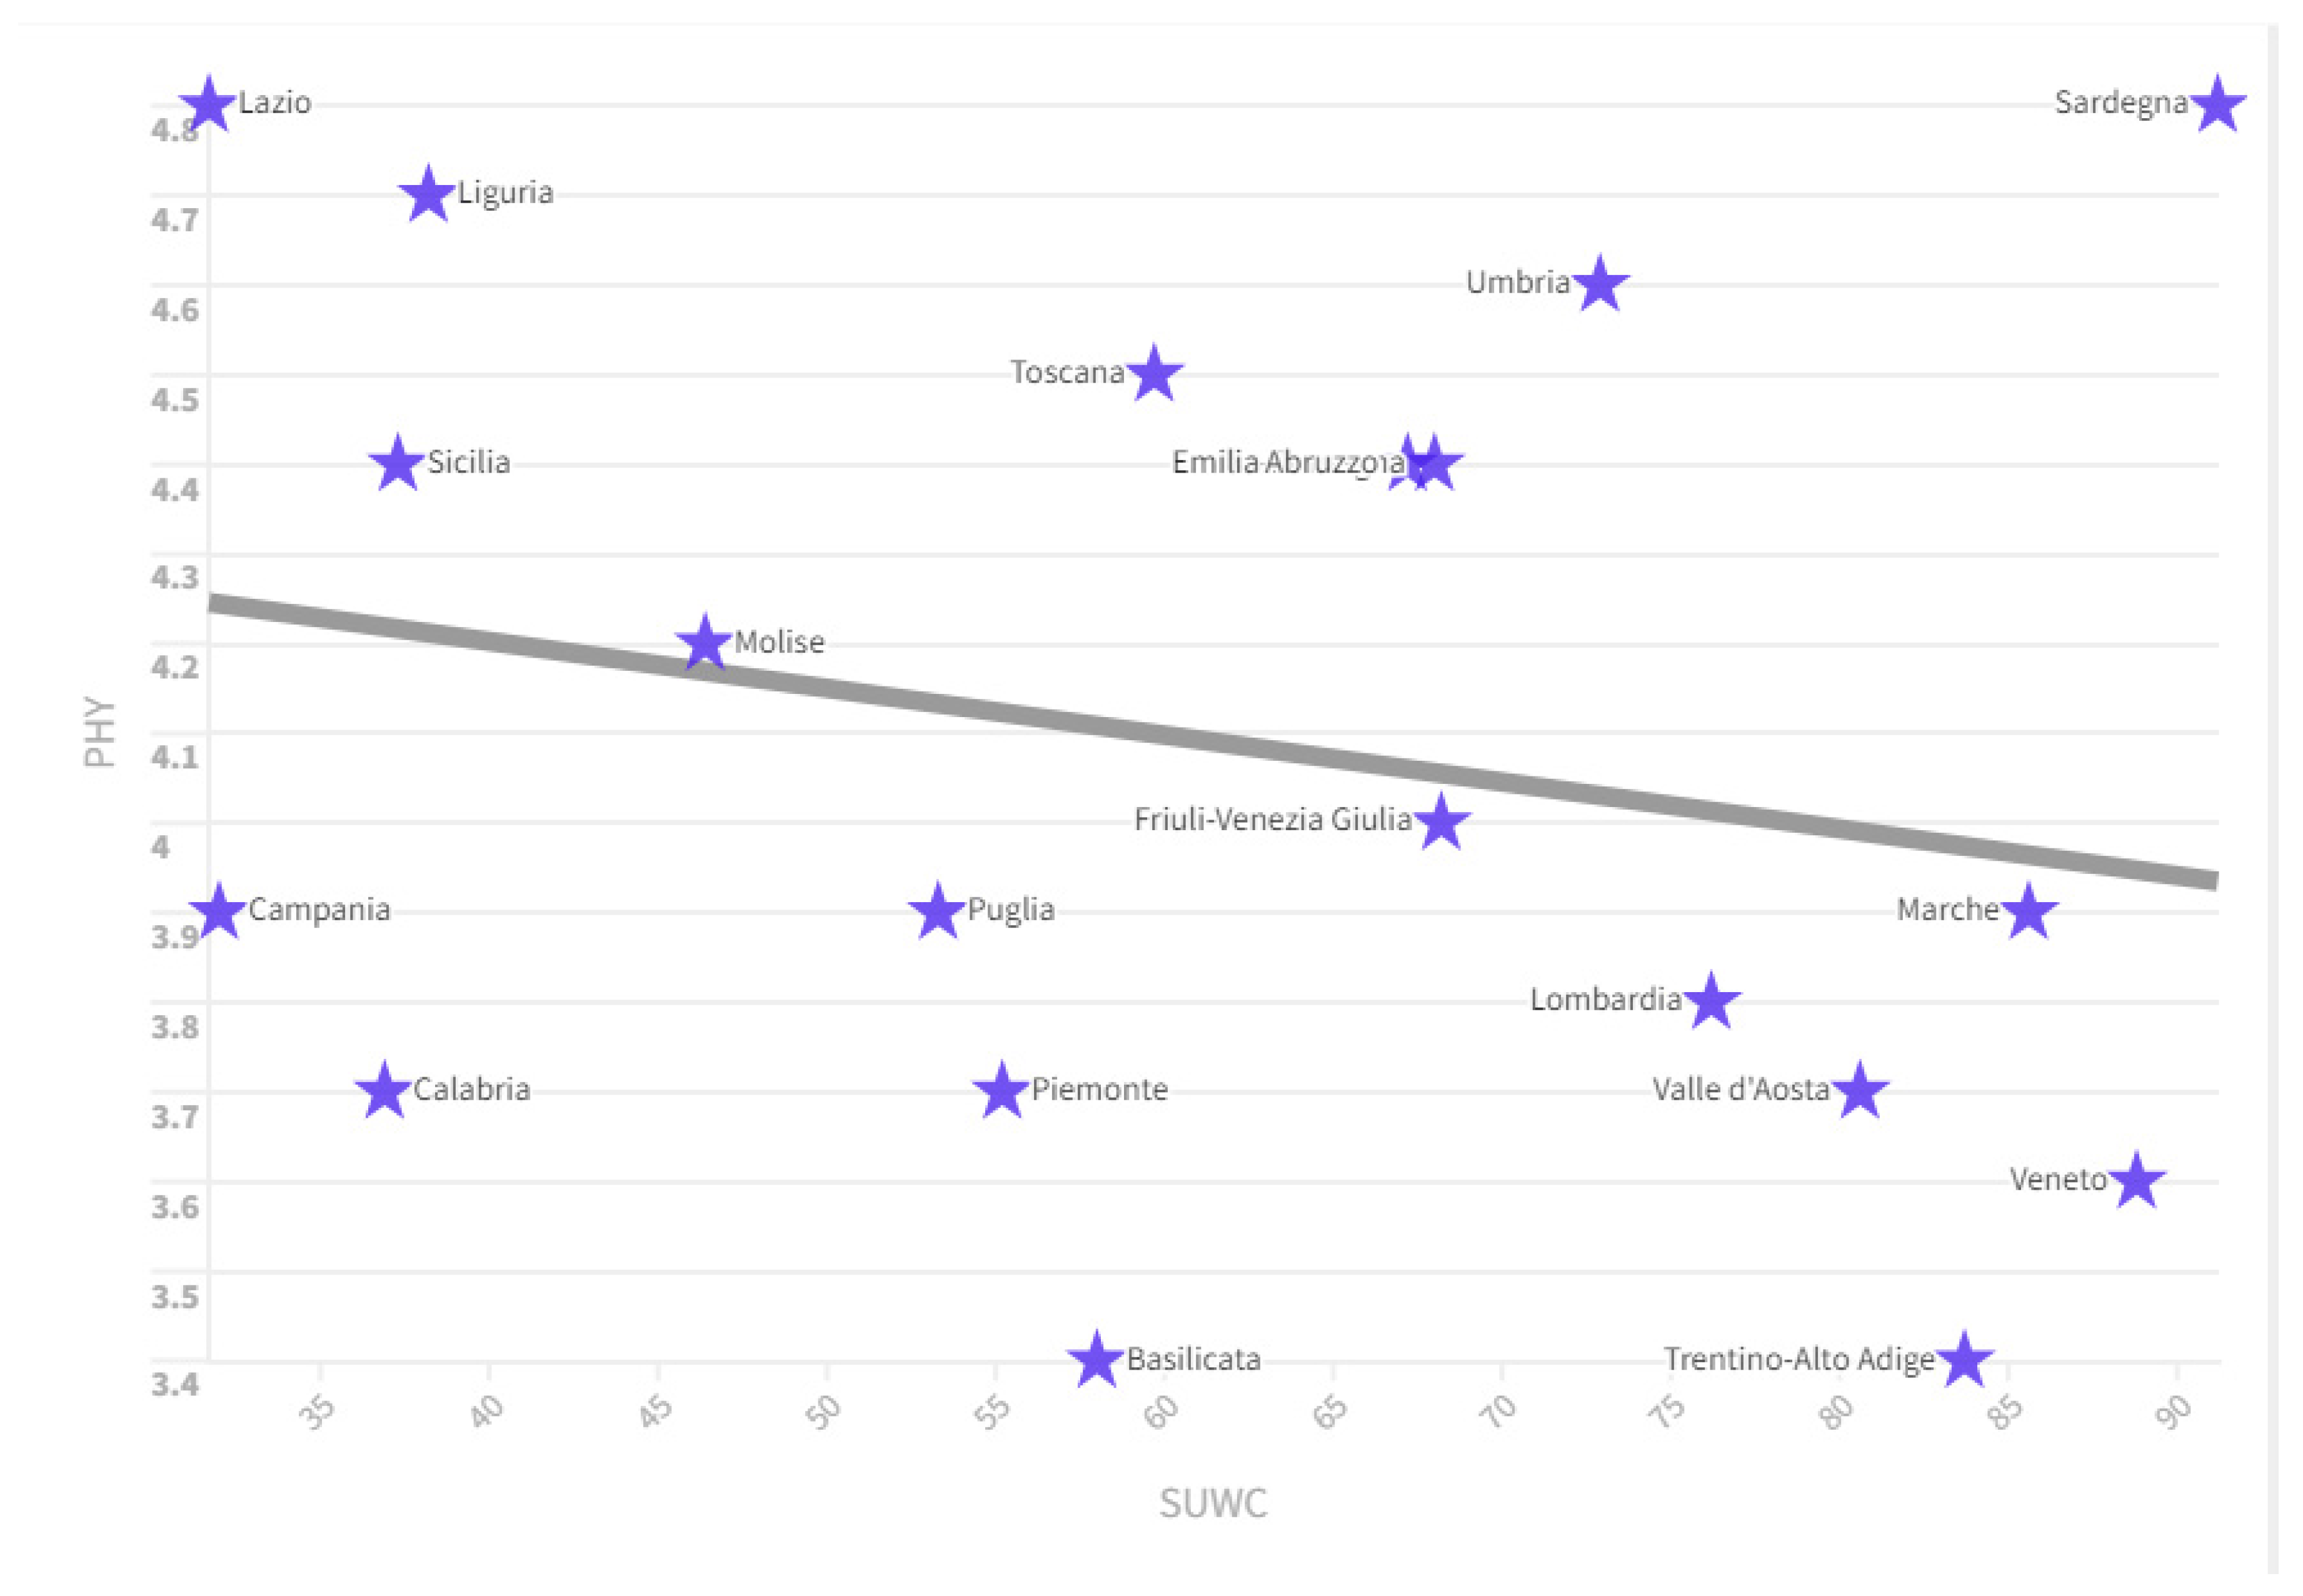
- SUWC: is the percentage of the population residing in the municipalities with separate waste collection greater than and equal to 65%. There is a negative relationship between the SUWC value and the level of PHY. In fact, we can see that in the ranking of regions by SUWC value there are many regions that have low average PHY values. For example, Veneto has a SUWC value equal to an amount of 88.8 and a PHY value equal to 3.6, in the Marches the SUWC value is equal to an amount of 85.6 and a PHY value equal to a value of 3.9, Trentino Alto Adige with a SUWC value equal to an amount of 83.7 and a PHY value equal to 3.4, Valle d'Aosta with a SUWC value equal to 83.7 and a PHY value equal to 3.7, Lombardy with a SUWC value equal to 76.2 and a PHY value equal to 3.8 units. Separate collection tends to be higher within regions that have higher per capita income. These regions with high per capita income also have medium-low values in terms of the presence of physicians. This relationship could be because the Rule of Law is higher in regions with medium-high per capita income. Furthermore, the greater efficiency of the labour market could induce many young people to seek out remunerative professions other than those connected with medical science.
- SWAC: is the percentage of sealed soil on the total area. There is a positive relationship between the PHY value and the SWAC value in 2021. Countries that have a high SWAC level also have a high PHY level such as for example Lombardy with a SWAC value of 12.37 and a PHY value of 3.8, followed by Veneto with a SWAC value of 11.93 and a PHY value of 3.6, Campania with a SWAC value of 20.54 and a PHY value equal to 3.9, Puglia with a SWAC value equal to 8.2 and a PHY value equal to 3.9, Piedmont with a SWAC value equal to 6.98 and a PHY value equal to an amount by 3.7.
- RDI: is the percentage of expenditure on intramural research and development carried out by companies, public institutions, universities (public and private) and by the non-profit sector on GDP. Expenditure and GDP are considered in current millions of euros. There is a negative relationship between the value of SI and the value of PHY. Regions that spend more on R&D have fewer PHY. In fact, we note that there are many regions in which the RDI value is high while the PHY value is low, as an example, in 2020: Piedmont with RDI equal to 2.33 and PHY equal to 3.7, Friuli Venezia Giulia with RDI equal to 1.74 and PHY equal to 3.9, Veneto with RDI equal to 1.38 and PHY equal to 3.5, Lombardy with RDI equal to 1.5 and PHY equal to 3.7, Campania with RDI equal at 1.34 and PHY equal to 3.8, Trentino Alto Adige with an RDI value equal to 1.21 and a PHY value equal to 3.3. The regions that invest more in terms of research and development are the same ones that also have a higher per capita income, a more efficient labor market and a lower number of physicians.
4. Rankings, Variations and k-Means Clusterization of PHY
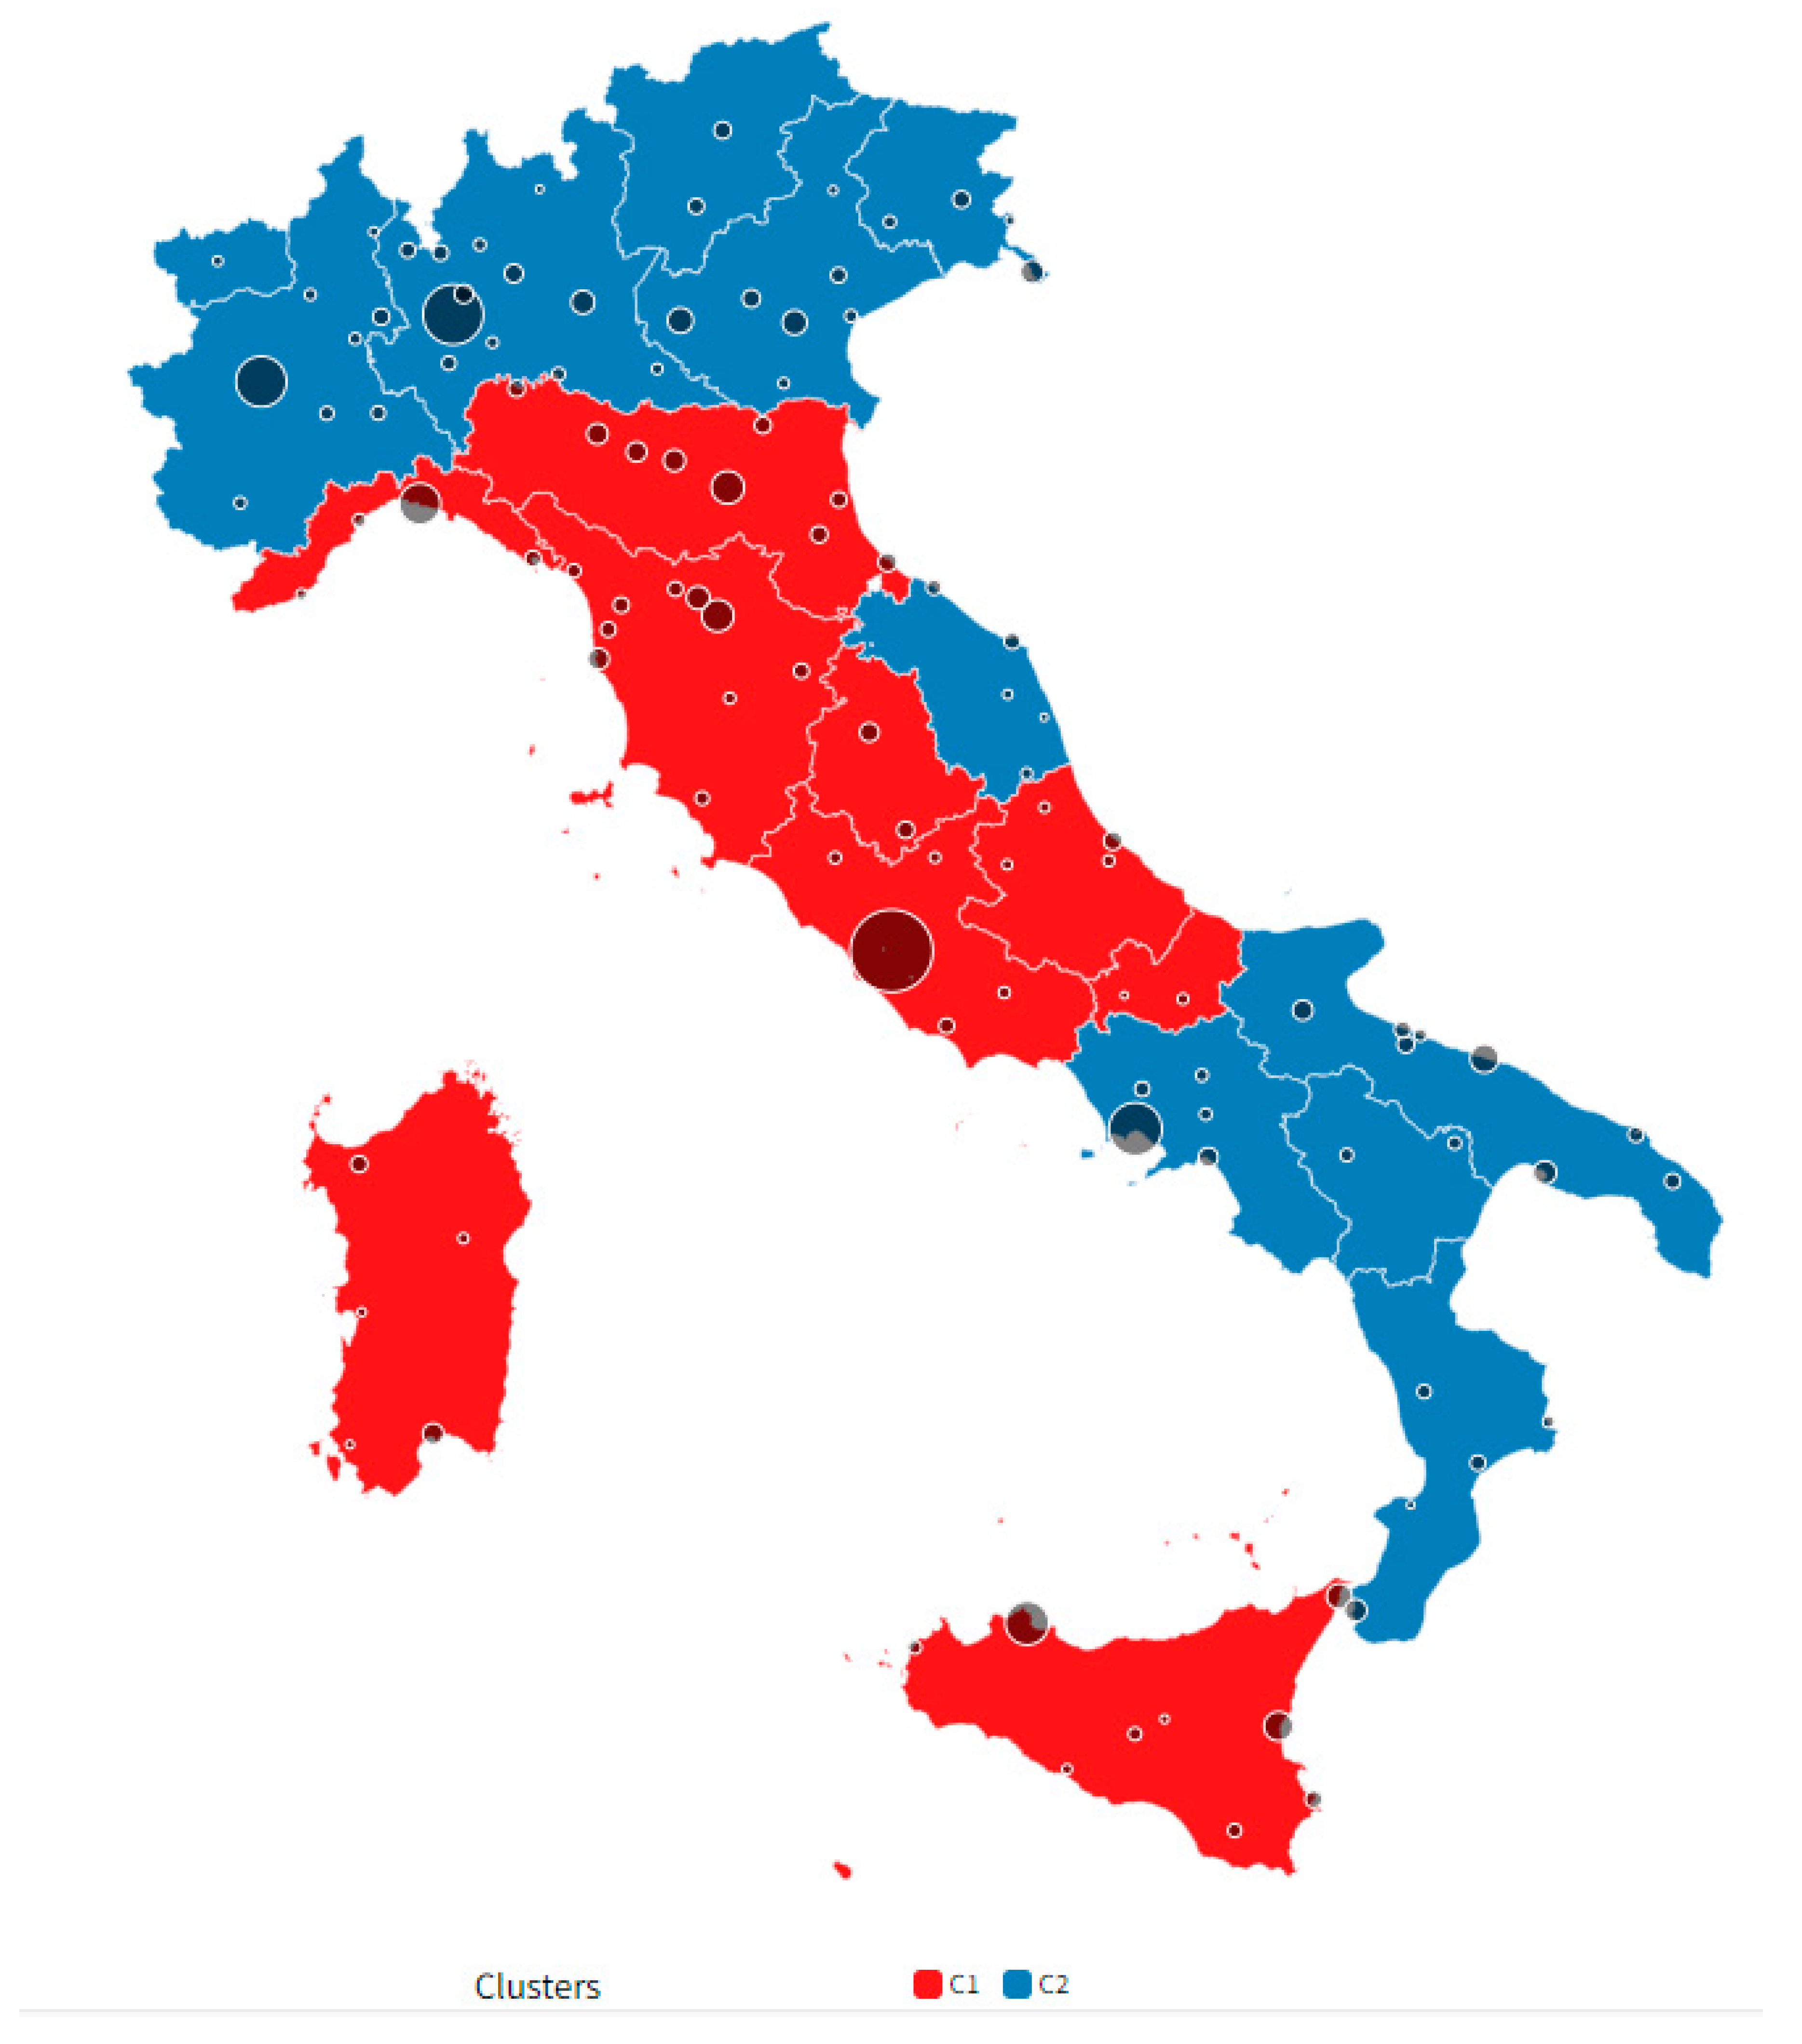
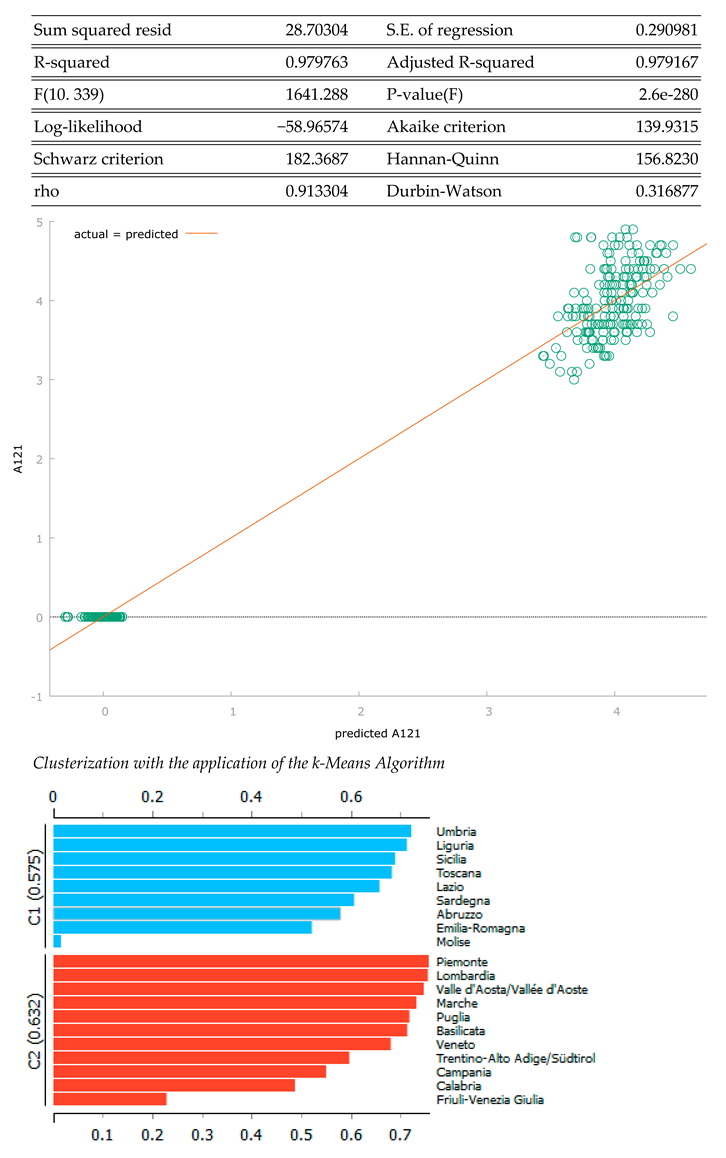
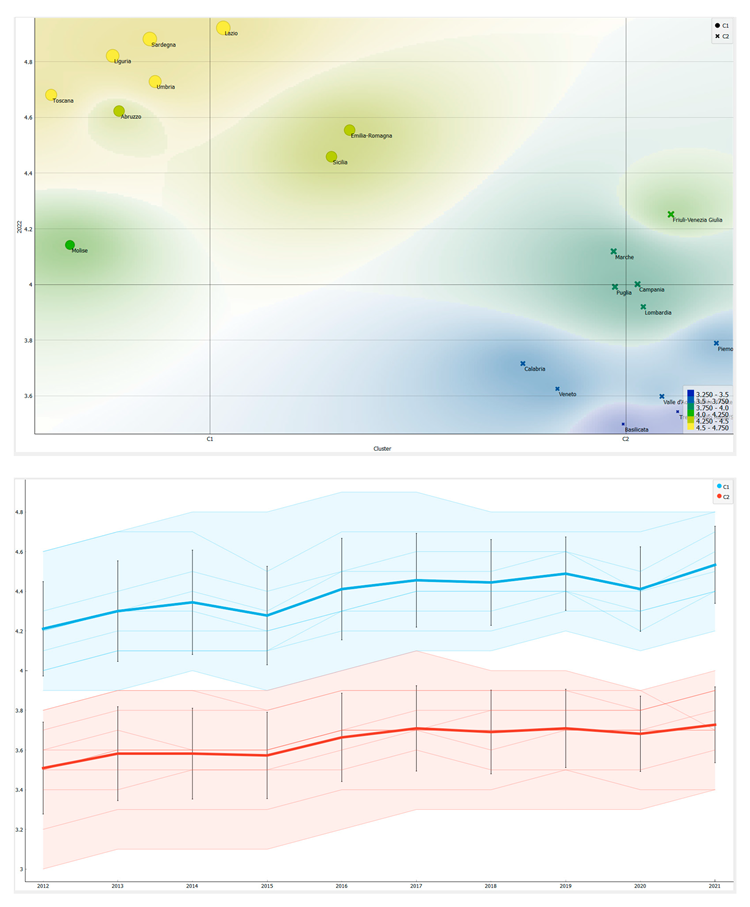
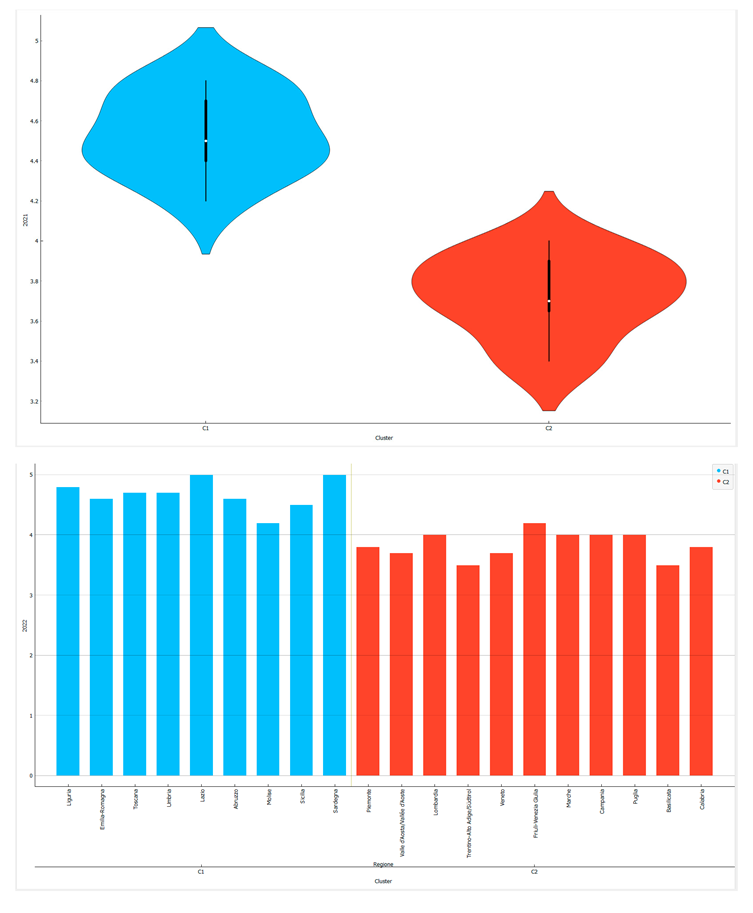
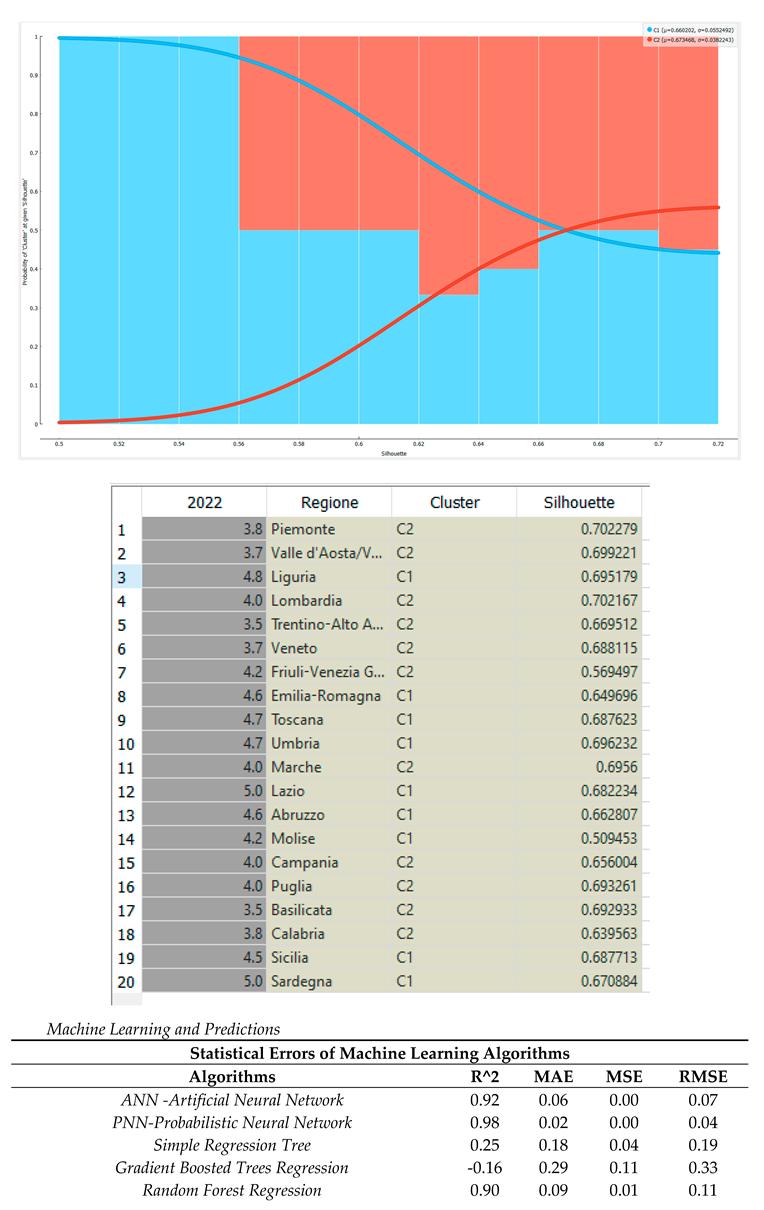
- Cluster 1-C1: Umbria, Liguria, Sicily, Tuscany, Lazio, Sardinia, Abruzzo, Emilia Romagna, Molise;
- Cluster 2-C2: Piedmont, Lombardy, Valle D'Aosta, Marche, Puglia, Basilicata, Veneto, Trentino-Alto Adige, Campania, Calabria, Friuli Venezia Giulia.
5. Machine Learning and Predictions
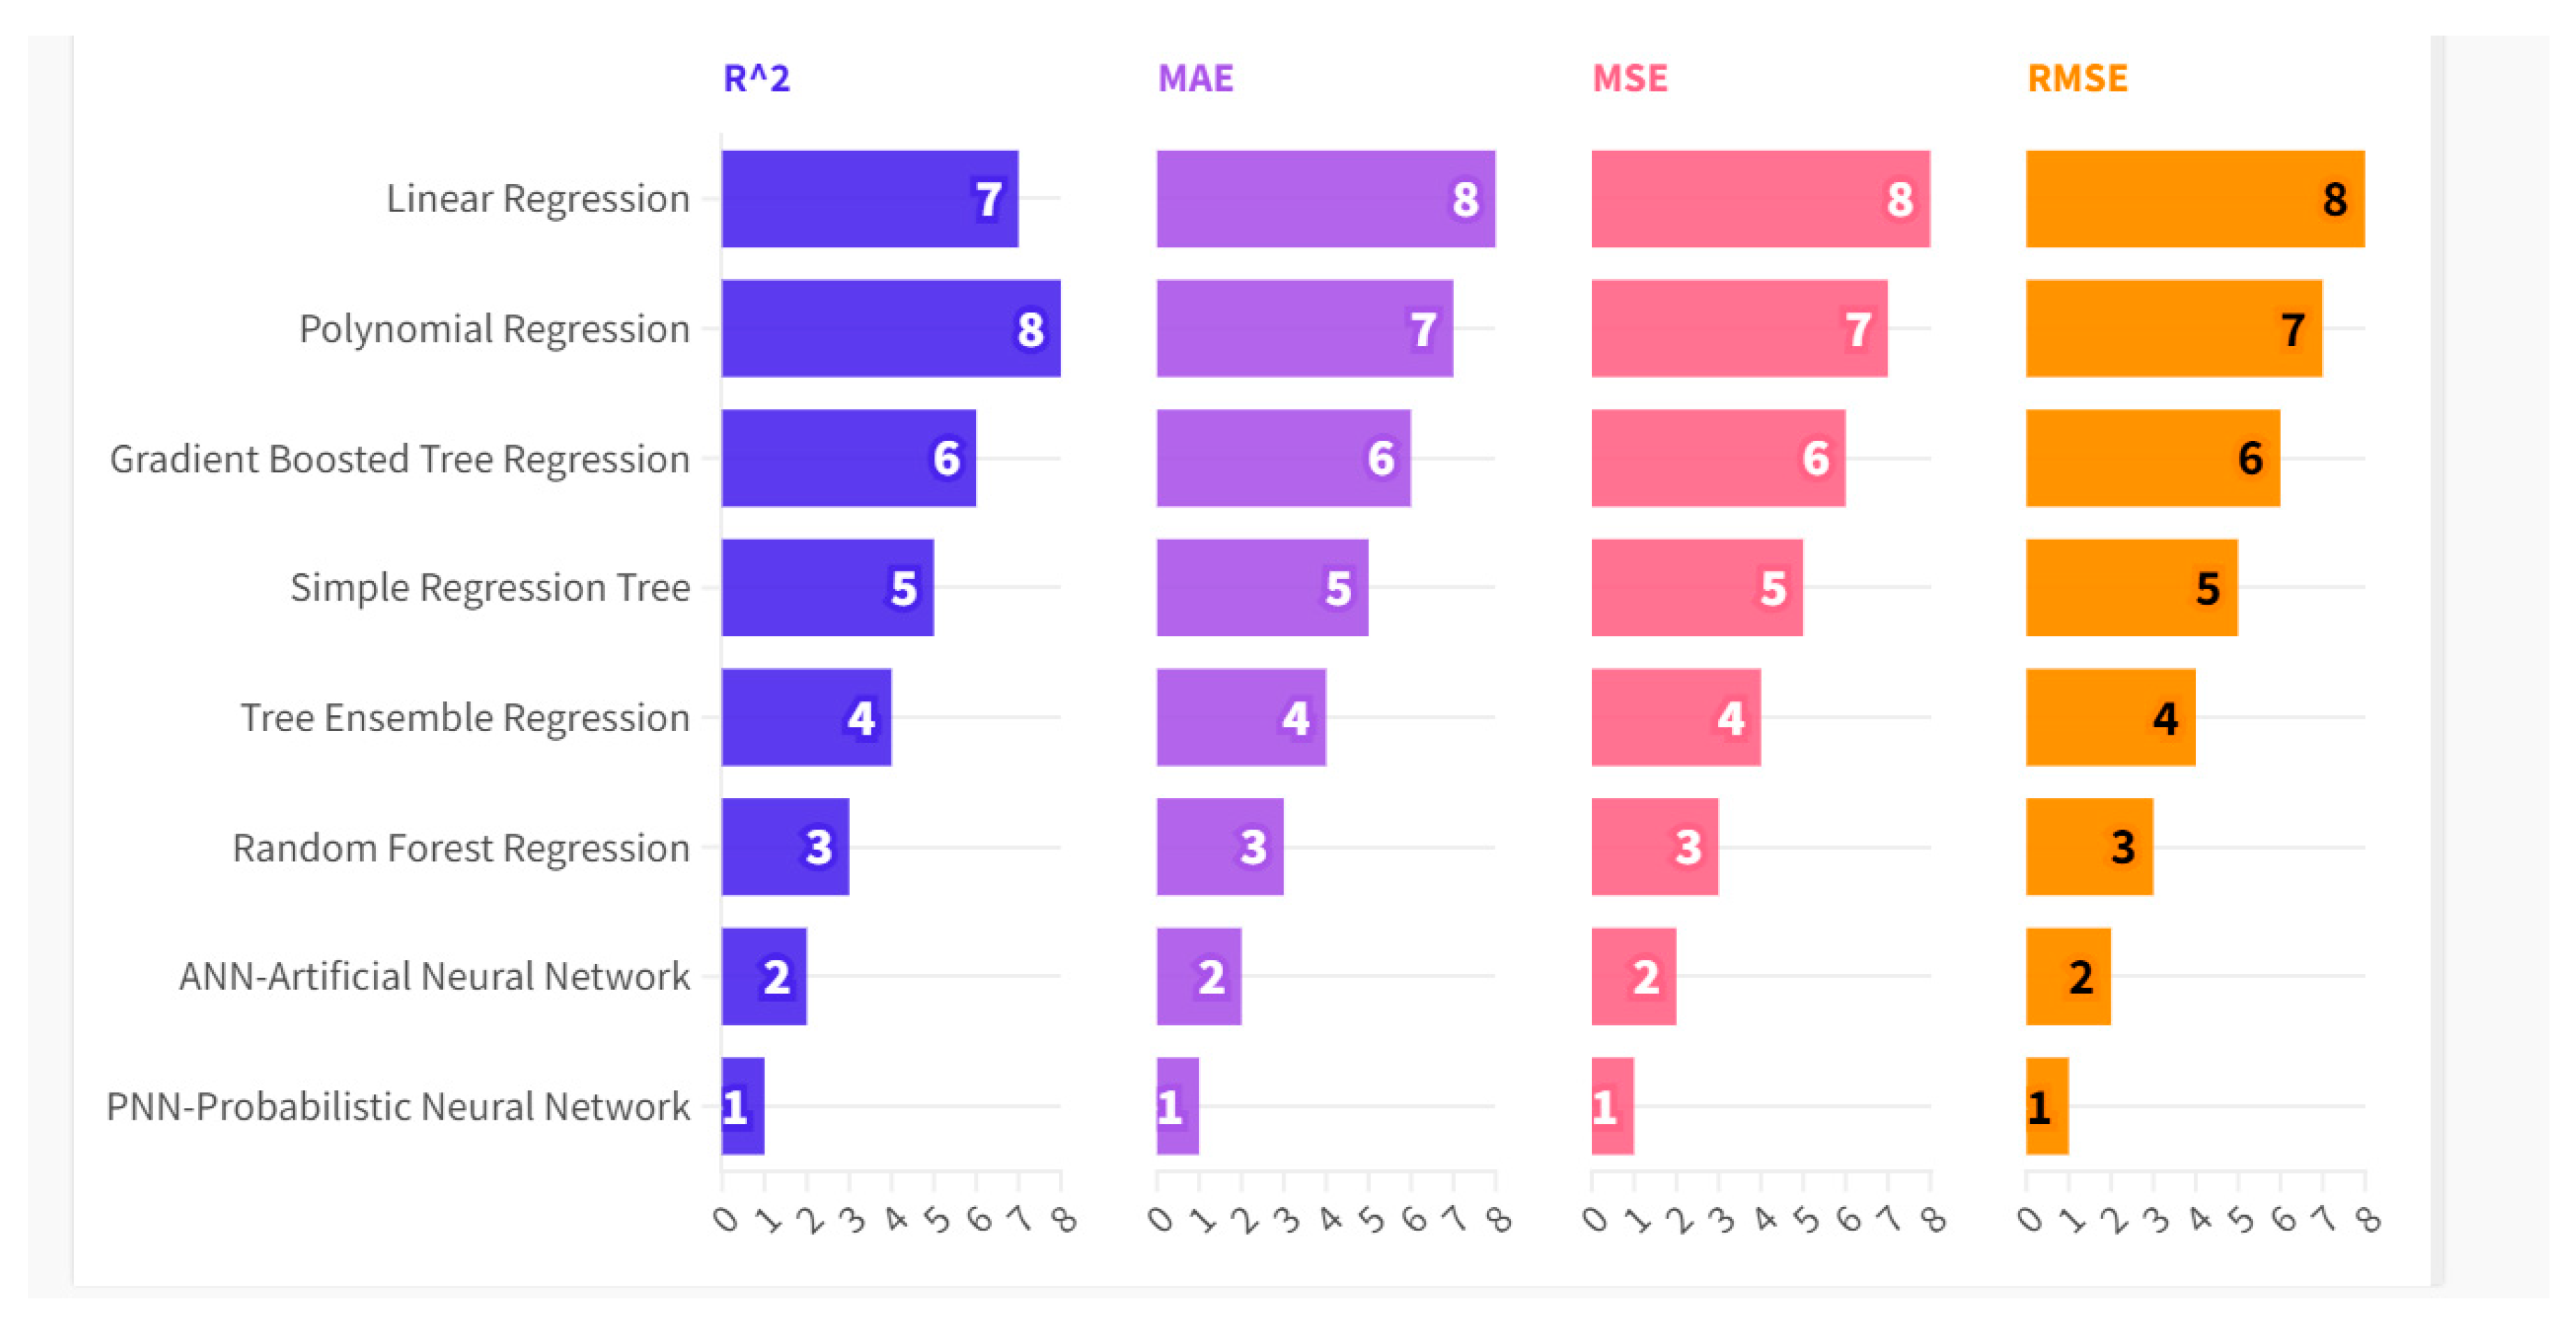
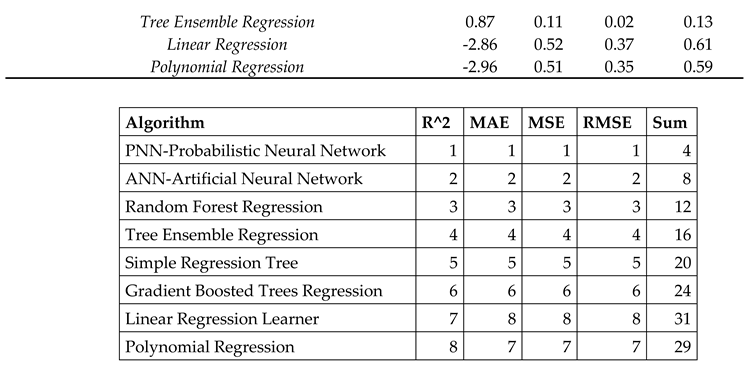
- Probabilistic Neural Network-PNN with a payoff value of 4;
- Artificial Neural Network-ANN with a payoff value of 8;
- Random Forest Regression with a payoff value of 12;
- Tree Ensemble Regression with a payoff value of 16;
- Simple Regression Tree with a payoff value of 20;
- Gradient Boosted Tree Regression with a payoff value of 24;
- Linear Regression with a payoff value equal to 31;
- Polynomial Regression with a payoff value of 29.
- Valle d'Aosta, with a PHY value predicted to grow from an amount of 3.7 up to a value of 4 or a change of +8.1%, equal to 0.3 units;
- Trentino Alto Adige with a change in PHY predicted to grow from an amount of 3.5 units up to an amount of 3.7 units or a change equal to a value of 0.2 units equal to 5.7%;
- Piedmont with a predicted PHY variation growing from an amount of 3.5 units up to a value of 3.7 units or equal to a value of 0.2 units equal to +5.7%;
- Umbria with a change in PHY predicted to grow from an amount of 4.7 units up to a value of 4.8 units or a change equal to 0.1 units equal to 2.1%.
- Basilicata with a diminutive variation from an amount of 3.5 units up to a value of 3.4 units or a variation equal to -0.1 units equal to -2.9%;
- Lazio with a variation from an amount of 5 units up to a value of 4.8 units or a variation equal to -0.2 units equal to -4.00%;
- Sardinia with a variation from 5 units to 4.8 units equal to an amount of -0.2 units equivalent to -4.3%;
- Tuscany with a variation from 4.7 units up to a value of 4.5 units or a variation equal to an amount of -0.2 units equal to -4.3%;
- Campania with a variation from an amount of 4.00 units up to a value of 3.8 units or a variation equal to -0.2 units equal to -5.00%;
- Veneto with a variation from 3.7 units up to an amount of 3.5 units or a variation equal to -0.2 units equal to an amount of -5.4%;
- Sicily with a predictive variation decreasing from 4.5 units to 4.2 units or equal to -0.3 units equivalent to -6.7%;
- Emilia Romagna with a variation from 4.6 units up to 4.2 units or equal to -0.4 units equivalent to -8.7%;
- Liguria with a predicted decrease from an amount of 4.8 units down to a value of 3.7 units or equal to a value of -1.1 units equal to -22.9%.
6. Conclusions
Funding
Data Availability Statement
Acknowledgments
Declaration of Competing Interest
Software
Appendix
References
- Michel, J.-P.; Ecarnot, F. The shortage of skilled workers in Europe: its impact on geriatric medicine. Eur. Geriatr. Med. 2020, 11, 345–347. [Google Scholar] [CrossRef] [PubMed]
- Tur-Sinai, N. Zontag, O. Blondheim, A. Weinreb e D. Chernichovsky, «Physicians in Israel: Trends in Characteristics and Training,» State of the nation report: Society, economy and policy in Israel, 2020. [CrossRef]
- Palaniappan, A.; Dave, U.; Gosine, B. Comparing South Korea and Italy’s healthcare systems and initiatives to combat COVID-19. 2020, 44, e53. [CrossRef]
- J. Craig, E. Kalanxhi e S. Hauck, «National estimates of critical care capacity in 54 African countries,» MedRxiv, 2020. [CrossRef]
- Heo, M.-H.; Kwon, Y.D.; Cheon, J.; Kim, K.-B.; Noh, J.-W. Association between the Human Development Index and Confirmed COVID-19 Cases by Country. Healthcare 2022, 10, 1417. [Google Scholar] [CrossRef] [PubMed]
- H. N. Chalise, «South Asia is more vulnerable to COVID-19 pandemic.,» Arch Psychiatr Ment Health , vol. 4, pp. 46-47, 2020. [CrossRef]
- C. Hepburn, «Green Economic Growth for the Democratic Republic of the Congo,» 2021.
- J. G. G. de Alcaniz, J. J. G. G. de Alcaniz, J. Romero-Lopez, R. P. Martinez, V. Lopez-Rodas Sr e E. Costas Sr, «What variables can better predict the number of infections and deaths worldwide by SARS-CoV-2? Variation through time,» Medrxiv, p. [CrossRef]
- Berland, H.; Hughes, D. Is Rural Kansas Prepared? An Assessment of Resources Related to the COVID-19 Pandemic. Kans. J. Med. 2021, 14, 95–102. [Google Scholar] [CrossRef] [PubMed]
- Wang, X.; Fan, L.; Dai, Z.; Li, L.; Wang, X. Predictive Model for National Minimal CFR during Spontaneous Initial Outbreak of Emerging Infectious Disease: Lessons from COVID-19 Pandemic in 214 Nations and Regions. Int. J. Environ. Res. Public Heal. 2022, 20, 594. [Google Scholar] [CrossRef] [PubMed]
- J. S. Y. &. W. H. Zhang, «Analysis of health resource allocation in 11 cities in Jiangxi based on the rank sum ratio,» International Conference on Statistics, Applied Mathematics, and Computing Science, vol. 12163, pp. 143-146, 2022. [CrossRef]
- Msiska, G. 154:poster Challenges of attaining universal health coverage in the sub Saharan Africa. Abstracts 2022, 7. [Google Scholar] [CrossRef]
- L. Vogel, «Virtual care can't fix physician shortages underlying access woes,» CMAJ: Canadian Medical Association journal= journal de l'Association medicale canadienne, vol. 191, n. 35, pp. E975-E976, 2019. [CrossRef]
- Du, Y.; Chen, C.; Zhang, X.; Yan, D.; Jiang, D.; Liu, X.; Yang, M.; Ding, C.; Lan, L.; Hecht, R.; et al. Global burden and trends of rotavirus infection-associated deaths from 1990 to 2019: an observational trend study. Virol. J. 2022, 19, 1–10. [Google Scholar] [CrossRef] [PubMed]
- Brimmo, F.O.; Babatunde, A.O.; Ezefuna, N.N.; Kanu, M.S.; Biziyaremye, P. The need for more medical schools in medically underserved regions in Africa. Ann. Med. Surg. 2022, 84, 104967. [Google Scholar] [CrossRef] [PubMed]
- N. H. Chowdhury, M. A. Hossain e K. U. Ahamad, «What Has Bangladesh Achieved on Child Mortality after MDG implementation?: An Empirical Analysis,» IOSR Journal Of Humanities And Social Science (IOSR-JHSS) , vol. 25, n. 4, pp. 26-30, 2020.
- Davies, J.I.; Reddiar, S.K.; Hirschhorn, L.R.; Ebert, C.; Marcus, M.-E.; Seiglie, J.A.; Zhumadilov, Z.; Supiyev, A.; Sturua, L.; Silver, B.K.; et al. Association between country preparedness indicators and quality clinical care for cardiovascular disease risk factors in 44 lower- and middle-income countries: A multicountry analysis of survey data. PLOS Med. 2020, 17, e1003268. [Google Scholar] [CrossRef] [PubMed]
- Barker, A.K.; Brown, K.; Ahsan, M.; Sengupta, S.; Safdar, N. What drives inappropriate antibiotic dispensing? A mixed-methods study of pharmacy employee perspectives in Haryana, India. BMJ Open 2017, 7, e013190. [Google Scholar] [CrossRef]
- W. Rajagukguk, J. T. Purba, S. Budiono e G. P. Adirinekso, «Regional Economic Development and Stunting: A Panel Data Analysis 2005 and 2010–2019,» Proceedings of the International Conference on Industrial Engineering and Operations Management, 2021.
- W. Rajagukguk, «Economic impact of Physician,» Balkan Journal of Interdisciplinary Research, vol. 6, n. 11, pp. 22-29, 2020.
Disclaimer/Publisher’s Note: The statements, opinions and data contained in all publications are solely those of the individual author(s) and contributor(s) and not of MDPI and/or the editor(s). MDPI and/or the editor(s) disclaim responsibility for any injury to people or property resulting from any ideas, methods, instructions or products referred to in the content. |
© 2023 by the authors. Licensee MDPI, Basel, Switzerland. This article is an open access article distributed under the terms and conditions of the Creative Commons Attribution (CC BY) license (http://creativecommons.org/licenses/by/4.0/).


